Rights / License: Research Collection In Copyright - Non ...33753/... · Fusarium lycopersici Sacc....
56
Research Collection Doctoral Thesis Investigations on the metabolism of Fusarium lycopersici Sacc. with the aid of radioactive carbon Author(s): Sanwal, Bishnu, D. Publication Date: 1956 Permanent Link: https://doi.org/10.3929/ethz-a-000099025 Rights / License: In Copyright - Non-Commercial Use Permitted This page was generated automatically upon download from the ETH Zurich Research Collection . For more information please consult the Terms of use . ETH Library
-
Upload
truongphuc -
Category
Documents
-
view
218 -
download
0
Transcript of Rights / License: Research Collection In Copyright - Non ...33753/... · Fusarium lycopersici Sacc....

Research Collection
Doctoral Thesis
Investigations on the metabolism of Fusarium lycopersici Sacc.with the aid of radioactive carbon
Author(s): Sanwal, Bishnu, D.
Publication Date: 1956
Permanent Link: https://doi.org/10.3929/ethz-a-000099025
Rights / License: In Copyright - Non-Commercial Use Permitted
This page was generated automatically upon download from the ETH Zurich Research Collection. For moreinformation please consult the Terms of use.
ETH Library

Prom. Nr. 2512
Dtes ETH
Investigations on the metabolism of
Fusarium lycopersici Sacc.
with the aid of radioactive carbon
THESIS
PRESENTED TO
THE
SWISS FEDERAL INSTITUTE OF TECHNOLOGY
ZURICH
FOR THE DEGREE OF
DOCTOR OF NATURAL SCIENCES
BY
BISHNU D. SANWAL
CITIZEN OF INDIA
Ser.
Accepted on the Recommendation of
Prof. Dr. E. Gaumann and Dr. H. Kern
19 5 6
Druck von A. W. Hayn's Erben, Berlin SO 36

Veroffentlicht in »Phytopathologische Zeitschrift«, Band 25, Heft 4 (1956), S. 333 bis 384
Verlag Paul Parey, Berlin und Hamburg

From the Department of special Botany of the Swiss Federal
Institute of Technology in Zurich
Director: Prof. Dr. E. Gdumann
Investigations on the metabolism of
Fusarium lycopersici Sacc.„
with the aid of radioactive carbon
By
Bishnu D. Sanwal
With 18 Figures
Contents: A. Introduction. — B. Materials and Methods: I. Materials. II. Myco-
logical and Pathological Techniques. III. Biochemical Techniques. IV. Isotope Techniques;a) Radioautography and Radiochromatography; b) Preparation of samples for radio¬
active assay. — C. Metabolism of Fusarium lycopersici in vitro: I. Effect of substrate
on toxin production. II. Chemical changes in artificial cultures during fusaric acid
production. — D. Studies on the metabolism of Fusarium lycopersici in vivo: I. The
secretion of radioactive metabolic products into the host. II. The • distribution of radio¬
active metabolic products in the host tissues. III. Chemical substances secreted by the
pathogen in the host. — E. The role and fate of C14-marked fusaric acid in the tomato
plants: I. Decarboxylation of Cl4-marked fusaric acid in plants under different con¬
ditions; a) Effect of pH of C14-marked fusaric acid on C14C*2 evolution; b) Effect of
continuous light and continuous darkness on the breakdown of fusaric acid. II. The
intermediate products of metabolism of fusaric acid. III. Quantitative breakdown of
fusaric acid in plants. — F. Discussion. — Summary. — Zusammenfassung. —
Literature cited.
A. Introduction
Fusarium lycopersici Sacc, causing a wilt disease of tomato plants, is
known to produce three wilting toxins in artificial cultures. These toxins bear
no chemical relationship with one another. Thus, lycomarasmin (empiricalformula C9Hi507Ns) is a dipeptide with a molecular weight of 277.3
(Clauson-Kaas, Plattner and Gaumann, 1944; Plattner and Clauson-
Kaas, 1944, 1945; Plattner, Clauson-Kaas, Boller and Nager, 1948;
Phytopath. Z., Bd. 25, Heft 4 22

334 S A N W A L
Gaumann, Naef-Roth and Miescher, 1950). Fusaric acid, the second toxin,is 5n-butylpyridine-2-carboxylic acid (empirical formula Ci0Hi3O2N) with a
molecular weight of 179. It was first isolated by Yabuta, Kambe and
Hayashi (1934) from the culture filtrates of Fusarium heterosporum Nees.
In contradistinction to lycomarasmin, fusaric acid is produced by manyFusarium species and is not specific to F. lycopersici alone (Gaumann, Naef-
Roth and Kobel, 1952). The third toxin, vasinfuscarin (Gaumann,Stoll and Kern, 1953) has not yet been completely purified and like fusaric
acid is not specific to F. lycopersici, but is also produced by Gibberella
fujikuroi (Saw.) Woll. (Stoll, 1954). Most probably it is a protein of an
enzymatic nature. The pectic enzymes, demonstrated in the cultures of
F. lycopersici by American authors (Davis, 1953; Gothoskar and Scheffer,1953; Gothoskar, Walker and Stahmann, 1953; Winstead and Walker,
1954), may or may not be similar to vasinfuscarin.
When applied to healthy tomato cuttings in particular concentrations,the toxins produce approximately the same symptoms as are present in
infected plants. Thus, vasinfuscarin causes the typical browning of the
vascular bundles, which is a very striking symptom of naturally infected
tomato plants. Lycomarasmin acts specifically on the areas between the mid¬
ribs of the leaves and causes necrosis there, which again is a typical symptomof the wilt disease of tomato (Gaumann, 1951 a). Depending upon the pH,fusaric acid causes either injury to the stems and leaves (at pH 4.3) or to
the leaves alone (at pH 6.0 or above, see Gaumann, Naef-Roth and Kobel,
1952). The symptoms on the stems take the form of depression of the areas
adjoining the vascular bundles and an ultimate collapse of the stem. The
leaf symptoms generally appear as water-soaked spots all over the leaves
(see Linskens, 1955).Various indirect evidences (Gaumann, 1951 a) are available to show
that all the above named toxins are also produced by the pathogen in vivo
during its pathogenic phase of life. However, these toxins have never been
isolated from the naturally infected plants. The reasons are very obvious.
Even if we do not reckon with the technical difficulties in the isolation of
the minute quantities of toxins elaborated by the pathogen in vivo, we have
yet to take into consideration the possibility that these may be metabolised
by the host cells with their consequent transformation into unknown sub¬
stances. We refer here to the general experience of authors who have worked
with wilting toxins. Lycomarasmin, for instance, perhaps chelates the iron
ions in the tomato plants and thereby changes into a lycomarasmin-iron-complex (Gaumann and Naef-Roth, 1954, 1955; Deuel, 1954). Fusaric
acid, according to the experience of the Japanese authors (Tamari and Kaji,1952, 1953 a, b; Deuel, 1954), perhaps forms in the plants water insoluble
chelate complexes with metal ions. Yet another toxin, patulin, when intro¬
duced in the tomato plants, combines with the thiol groups of biologicalimportance in the cells and cannot be recovered back (Miescher, 1950). Wededuce from these observations of a number of authors in this field that it

Investigations on the metabolism of Fusariiim lycopersici Sacc. 335
might not always be possible to isolate the toxins from the diseased plantsin the original state in which they were produced by the pathogen.Before we attempt to isolate the toxins from the diseased plants, therefore,we must know the metabolic fate of the toxins in question, once they have
been secreted by the pathogen. Only after acquiring such knowledge we can
attempt to isolate either the toxins themselves or their degradation products.Success in such isolation would provide a direct evidence for the toxin theoryof the wilt diseases.
Apart from the attempt to isolate the toxins from the diseased plants,it is important to follow the metabolism of the pathogen in vivo and correlatesuch studies with the possible mode of toxin formation in infected plants.
There are, however, many technical difficulties in undertaking investi¬
gations of the above nature. The difficulties have been solved to some extent,in the following studies by using C14 as a tagging material for both myceliaand fusaric acid (Wheeler, 1952, 1953; Hoffmann and Zuckerman, 1954;Kern and Sanwal, 1954).
B. Materials and Methods
I. Materials
The strains of Fusarium lycopersici used in the following investigationsoriginated from the laboratories of Dr. T. Fontaine of U. S. Departmentof Agriculture in Beltsville, Md. (Kern, 1952). Strain R-5-6 built on malt-
agar medium large amounts of aerial mycelia and was very strongly patho¬genic to tomato plants. Strain 257, on the contrary, built very little, if at
all, aerial mycelium and was practically non-pathogenic.Throughout the following investigations Tuckswood variety of
tomato plants were used, unless otherwise stated. They were cultivated in
green houses throughout the year with supplement of fluorescent lights duringthe winter months.
2-C14-glycine was purchased from the Harwell Isotope Center, England.When obtained it had a specific activity of 14.9 fiC per mg.
C14-fusaric acid, marked in the carboxyl group was synthesized in theOrganic Chemistry laboratories of the Swiss Federal Institute of Technologyby Dr. E. Hardegger and Mr. E. Nikxes. The original material was veryactive (14.7 mC/raM) and was diluted by the addition of inactive fusaricacid. To obtain homogeneous material, the mixture of radioactive and non¬
radioactive fusaric acid was crystallized from petroleum ether.
II. Mycological and Pathological techniques
The inoculum for general experiments discussed in Section C (I) was
obtained by growing the fungus on rice cultures (20 gms. rice and 40 ml.water; sterilized in Autoclave) for 5 days. At the end of this period the
22*

336 SANWAL
fungus built large quantities of conidia. For the inoculation of liquid cultures,the rice cultures were gently shaken with 100 ml. sterile distilled water to
obtain a spore suspension. 1 ml. of this spore suspension was used to inoculate
100 ml. of liquid substrate.
For studying the metabolism of fusaric acid in vitro, discussed in
Section II, the inoculum had to be much more uniform. To this end, singleconidial cultures were made on solid malt-agar slants and one of those conidial
cultures served as the mother culture for all subsequent sub-cultures. Whenever
needed, sub-cultures were made on solidified Richard's medium (subsequentlyabbreviated in the following work as Ris medium) in petri dishes. After
5 days growth at 27 ° C in darkness, uniform discs of agar with myceliumwere cut out from the periphery of the petri dishes by means of a flamed
cork-borer and these discs served as the source of inocula for the liquidcultures in Erlenmeyer flasks.
Unless otherwise stated, Erlenmeyer flasks of 500 ml. capacity were
used throughout. Each flask contained 100 ml. of Ri5 medium (modified after
Luz, 1934: 50 gms. glucose, 10 gms. ammonium nitrate, 5 gms. mono-
potassium phosphate, 2.5 gms. magnesium sulphate and 0.02 gms. ferric
chloride, distilled water to make up 1000 ml.). The medium had a pH of
4.0—4.2. It was sterilized in an Autoclave at a pressure of 1 atm. for
20 minutes.
All cultures were incubated in dark at a temperature of 27 ° C.
Dry weight of the mycelium was taken as a standard of the amount of
growth of the mycelium. For dry weight determinations, the contents of
10 Erlenmeyer flasks were filtered through a weighed filter paper. The
mycelium was washed with 50 ml. distilled, luke-warm water 4 times and
was dried along with the filter paper for 12 hours at 60 ° C and further
4 hours at 103 ° C and weighed.The method of inoculation of the tomato plants was the same as pro¬
posed by Wellman (1938). They were inoculated at the four leaf stage byuprooting them from the soil and dipping the washed roots in a mycelial and
conidial suspension and again planting in soil. Controls were treated in a
similar way (Kern, 1952).Tomato wilting tests were the same as proposed by Gaumann, Naef-
Roth and Miescher (1950) and Gaumann, Naef-Roth, Reusser and
Ammann (1952). The tomato plants were cut at the four leaf stage bymeans of a sharp razor and immediately placed in water. They were allowed
to take up the required dose of the toxin by means of transpiration pullunder similar conditions of temperature, humidity and light. After uptakeof the test solutions, the plants were placed in tap water and symptomschecked after 48 hours (Linskens, 1955).
The Ustilago spore germination tests were made according to the method
proposed by Kobel (1951) and Kern (1952) and the results were expressedas Ustilago units per ml. of the test solutions (U/ml.), i. e., the dilution of the
original solution at which only 50 °/o of the control smut spores germinate.

Investigations on the metabolism of Fnsarium lycopersici Sacc. 337
III. Biochemical techniques
a) Glucose determination
Glucose was estimated as reducing sugar by the method of Schaffer and
Hartmann (1920) by iodometric titration. 2 ml. of clear culture filtrate
was added to a mixture of 25 ml. of copper sulphate (CuS04 • 5 H20;69.28 gms. dissolved in 1 liter distilled water) and 25 ml. of Rochelle salt
solution (346 gms. Rochelle salt with 100 gms. of sodium hydroxide dissolvedin 1 liter distilled water) in a flask. Distilled water was added to this solution
to make up the total volume to 100 ml. The flask, with its contents, was
heated quickly to boiling and after allowing it to boil for 2—3 minutes,rapidly cooled under the tap. To this was added 50 ml. of potassiumiodate-iodide solution (5.4 gms. KI03 and 60 gms. KI with a small amount
of alkali, distilled water to make up 1 liter) followed by approximately15 ml. of 5 N H2S04. Immediately afterwards, 20 ml. of a saturatedsolution of potassium oxalate was added to dissolve completely the cuprousiodide formed. This solution was titrated with 0.1 N sodium thiosulphate,using towards the end some drops of a starch solution as an indicator. Ablank also was run side by side in boiling the Fehling's solution, using distilledwater instead of the culture filtrate. The former titration value was sub¬tracted from the latter blank and the milligram copper equivalent was
calculated out (1 ml. 0.1 N Na2S203 corresponds to 6.36 mg. copper). From
this value, the glucose present in the culture filtrate was calculated out byreference to the Munson-Walker tables (Methods of analysis of the Asso¬
ciation of official Agricultural chemists, 1950).
b) Determination of total nitrogen
Total nitrogen in the culture filtrates was determined by the methodof Pepkowitz and Shive (1942). 1 ml. of clear culture filtrate was filledinto a thick-walled boiling tube and evaporated to dryness under vacuum.
Then 1—2 ml. of Ranker's solution (32 gms. salicylic acid dissolvedin 1000 ml. concentrated sulphuric acid) was added and allowed to standin the cold for 20—30 mts. To this were added 3 drops of sodium thio¬
sulphate solution (50 gms. of sodium thiosulphate monohydrate per 100 ml.of distilled water) and 0.5 ml. of selenium oxychloride-sulphuric acid solution
(12 gms. of selenium oxychloride per liter of cone. H2S04). The contents ofthe test-tube were vigorously boiled for 15 minutes and then cooled, first
at room temperature and then under cold tapwater. 2 drops of a 35 %
perchloric acid (made from 70 °/o acid with distilled water) solution were
added right in the middle of the tube by means of a pipette and the tubeheated for 15 minutes in the digestion rack over a low flame so that the
temperature remained below the boiling point. The test tube at the end of
this operation was cooled again, the contents diluted with cold distilled water
to a volume of 30 ml. and nitrogen estimated in 10 ml. lots of this solution
by the method discussed under the determination of ammonia. A blank

338 S A N W A L
check was similarly run (without culture filtrate) to correct for nitrogenwhich might be present in the reagents as impurity.
c) Determination of ammonia
Ammonia was determined by the method proposed by Raynand (1948).To 1 ml. of clear culture filtrate was added approximately 20 ml. of 95 °/o
ethyl alcohol along with a drop of 1 % alcoholic solution of Thymolphtha-lein. The whole solution was neutralized by 0.01 NNaOH till the colour
turned blue, after which a little more alkali was added to get an alkaline
reaction. When the original culture filtrate or solution (as in Kjeldahl
nitrogen determinations) was very strongly acidic, neutralization was begunwith cone. NaOH and ended up with 0.01 N NaOH solution. The alkali-
nised solution was placed in a steam distillation apparatus, the originalcontainer rinsed three times with 3—5 ml. quantities of 95 %> alcohol and
the rinsings combined with the original solution. The receiving flask con¬
tained, before the distillation was started, 2 ml. of 95 % alcohol with 2 dropsof 1 °/o alcoholic sodium alizarine sulphonate. Steam was now turned on and
distillation continued till all the alcohol was collected in the distillate. The
pink coloured distillate was then titrated to neutrality by means of
0.02 N H2S04, delievered from a microburette. Milligrams nitrogen presentin the distillate were calculated in multiplying by 0.28 the number of ml. of
0.02 N H2S04 used.
d) Determination of nitrate nitrogen
Nitrate was determined by a volumetric method described by Treadwell
(1947). 2 ml. of clear filtrate were taken, made acidic by adding a little
2 N H2SO4 and diluted with distilled water to 70—80 ml. This solution was
heated to boiling and to it was added 15 ml. of a solution of Nitron reagent
(10 gms. Nitron dissolved in 5 ml. of acetic acid and 95 ml. distilled water).The container was immediately placed in ice-cold water and left there for
2 hours. During this time the nitrate salt of Nitron crystallizes out of the
solution because of its non-solubility. The crystals were separated by means
of a glass Gooch crucible (Gooch G 3), washed three times with 3—5 ml.
distilled water and allowed to dry in an oven for 2 hours at 110 ° C. From
the weight of the Nitron nitrate, so obtained, the milligrams of nitrate
nitrogen were calculated.
e) Determination of amino-nitrogen
A method proposed by Pope and Stevens (1939) was adopted (seealso, Schroeder, Kay and Mills, 1950). 10 ml. of the clear culture filtrate
were pipetted in a 50 ml. volumetric flask, 2 drops of 1 %> alcoholic Thy-molphthalein solution followed by NNaOH were added till the colour turned
blue. To this solution were added approximately 30 ml. of copper phosphatesuspension (made by mixing 1 vol. of 0.16 M solution of copper chloride
with 2 vols, of borate buffer, made by dissolving 28.6 gms. sodium borate

I
Investigations on the metabolism of Fusarium lycoperski Sacc. 339
with 50 ml. N HC1 in 700 ml. water and 2 vols, of a solution containing64.5 gms. dihydrogen phosphate plus 7.2 gms. sodium hydroxide per liter, the
volume made up to 50 ml. by adding distilled water, mixed well and the whole
solution filtered through a Whatman filter paper no. 5. The copper content
of the filtrate was determined iodometrically. To 10 ml. of the filtrate was
added about 1 gm. of potassium iodide dissolved in water and acidified with
about 0.5 ml. acetic acid. The free iodine was titrated by 0.01 N sodium
thiosulphate, using a microburette for the purpose and adding a starch
solution (Pope and Stevens, 1939) as an indicator towards the end of the
titration. Milligram amino-nitrogen present in 1 ml. culture filtrate was
calculated as follows (see Schaffer und Hartmann, 1920—21):
~— = mg. amino-N in 1 ml. of culture filtrate (where t = the
amount of 0.01N Na2S203 used for titration).
f) Determination of purine nitrogen
The method of Kruger and Schmid (1905) for determination of purinebases was used (see also, Hitchings and Fiske, 1941). 30 ml. of depro-teinized culture filtrate was neutralized to phenolphthalein and heated in a
boiling water bath. The purine bases were precipitated by adding 2 ml. of
a 40 % solution of sodium bisulphite and 2 ml. of a 10 °/o solution of copper
sulphate. The mixture was set to boiling and continued for three minutes.
The precipitate was centrifuged and washed successively with 1 % acetic
acid and 10 ml. portions of hot water. The precipitate was handled in the
same way as in the determination of total Kjeldahl nitrogen discussed
in part b).
g) Fusaric acid nitrogen
This part of the analytical work presented the most difficulties. In
order to determine the nitrogen of fusaric acid we had to obtain it in pure
form. We tried to extract the fusaric acid from the culture filtrates from
model experimental cultures, where a known quantity of fusaric acid was
added to the culture filtrate immediately after sterilization and extracted
with the method used by Plattner, Keller and Boller (1954). The culture
filtrate was mixed with Norit (Norit superactive coal 0.5 %>) twice and
well mixed in a vibrator. By applying suction, the coal with the adsorbed
fusaric acid was separated from the culture fluid in a Buchner funnel. The
fusaric acid was eluated first by methanol and lastly by methanol-ammonia.
All the methanol extracts were combined and reduced to a very small volume
(calculated to contain about 1 mg. fusaric acid/ml.). A known quantity of
this solution was applied as a band, about 3 cms. long on the starting line
of a Whatman paper no. 1 and the chromatogram run with secondarybutanol, formic acid and water mixture (75 : 15 : 10). After drying the
chromatogram the fusaric acid band was cut out, eluated and quantity of
fusaric acid determined by ultra-violet absorption in a Beckmann spectro-

340 S A N W A L
photometer (for further details see Zahner, 1954). Using such a procedure it
was found that absorption on active coal does not remove all the fusaric
acid from the culture filtrates. In very favourable cases a recovery of about55 % is obtained.
In view of the above we were obliged to take recourse to other methods
of extraction. After a good deal of experimentation, the following method
was adopted, which gave an error of round 10 %>:
300 ml. of a clear culture filtrate was adjusted to a pH of 4.0 and
extracted 5 times with 80 ml. of ethyl acetate. All the ethyl acetate was
combined and completely dried under vacuum at room temperature. The
solid material was taken up in 1 ml. of 80 %> ethanol and 0.05 ml. of this
solution was applied as a 5 cms. long band on Whatman no. 1 chromato¬
graphic paper. The chromatogram was run with the elsewhere mentioned
butanol-formic acid and water mixture. After drying, the position of fusaric
acid was located under ultra-violet light. The band was cut and eluated
with about 5 ml. of ethanol in a Wasitzki eluation apparatus (Morton,1938). The eluate was dried in a thick-walled boiling tube and handled in
the same way as described in section b).
h) pH determination
All pH measurements were done with a glass electrode.
IV. Isotope techniques
a) Radioautography and Radiochromatography
In the following work, depending upon requirements, radioautographyhas been used either on a 'macro' or a 'micro' scale. In the 'macro' work,like in the radioautography of developed chromatograms (where only a
rough image is required to locate the radioactive spots on chromatograms),No-Screen X-ray films manufactured by Eastman Kodak Co., U. S. A., have
been used. The chromatograms, after drying, were stamped on the edges with
radioactive ink (Sanwal, 1955) in order to mark its position on the X-rayphotographic emulsion after development. The chromatogram in contact
with the emulsion was covered with black paper and a lead weight of the
same size as the film was put on top of it. This procedure ensured a close
contact of the chromatogram with the emulsion and an uniform distribution
of pressure on the whole film (since it is known that unequal pressure can
give rise to artefacts). The films were exposed in a light-tight box at 0 ° C
for the required number of days. The time required to obtain a satis¬
factory development of the silver grains (in general, an optical density of
D = 0.5 over the controls) depends on the activity of the radioactive spotsand was always found out empirically (generally, one square centimeter
of the emulsion must receive 10° disintegrations to get a satisfactory image,see Kamen, 1951; Sanwal, 1955). After exposure the emulsion was deve¬
loped with Kodak rapid X-ray developer for 8 minutes and fixed in an

Investigations on the metabolism of Fusarium lycopersici Sacc. 341
acidic fixing bath. The position of the radioactive spots was determined byviewing the radioautograph through scattered light.
In the 'micro' work, as for instance, radioautography of thin tissue
sections to locate the distribution of radioactive substances in the cells, two
types of film emulsions were used. The 'stripping emulsion' (Pelc, 1947)was obtained by the courtesy of Prof. Dr. J. Eggert of the Department of
Photography, Federal Institute of Technology, Zurich, to whom the writer
is grateful for general advice on photography. This emulsion was manufac¬
tured by Kodak Co., England and consisted of a glass plate on which the
dried emulsion was spread in a layer 4 fi thick with another supportinggelatine layer at the top.
The microscope slides to be used for mounting the tissue sections,
containing the radioactive material, were 'subbed' before use, i. e., they were
cleaned by soaking overnight in a solution containing the followingconstituents:
Potassium dichromate 100 gms.
Sulphuric acid (cone.) 100 ml.
Distilled water to 1000 ml.
They were next washed in water and dipped in the following solution
atl8°C.
Gelatine 5 gms.
Chromealum 0.5 gm.
Water to 1000 ml.
After this treatment the slides were dried overnight at 30 ° C. This
treatment obviated the use of a sticking substance for holding the paraffinsections of the tissues. The paraffin ribbons were laid on top of the slides so
treated, stretched by heating at 40 ° C, dried and stored till required for
use. For exposure of the 'stripping emulsion', pieces were cut out from the
plate, sufficient to cover the entire area of the paraffin ribbons on the
'subbed' plates plus a margin about 8 mm. all round (Herz, 1951; Pelc,
1947) by means of a sharp knife and floated on the surface of distilled
filtered water, with the emulsion surface facing downwards. The dried emul¬
sion, on coming in contact with water stretched itself. The slide bearing the
specimens was so placed under the emulsion layer that it formed an angleof 30 ° from the horizontal and one side touched the emulsion first. The
whole slide, with the emulsion, was lifted clear of water and dried by means
of a stream of cool air, placed in a light-tight box and exposed for the
required length of time (maximum time of exposure 40 days).The other kind of photographic emulsion used was the NTB (nuclear
track plates) 'slide-coated' emulsion manufactured by Eastman Kodak Co.,U. S. A. These plates carried an emulsion layer 10 fi thick coated directlyon a microscope slide (1 inch X 3 inches). To expose these plates, the paraffinribbons were first stretched at 40 ° C over a hot plate and were immediately

342 S ANWAL
floated on filtered distilled water. The emulsion on the slides was wetted byimmersing it under water for 1 minute and the ribbons laid over the emulsion,dried by means of a stream of cool air and exposed in light-tight boxes at
0 ° C for the required length of time (Evans, 1947).After the desired exposure (found out empirically) the plates were
washed in xylol for about 15 minutes to remove the paraffin in order to
facilitate later the penetration of the processing material through the sections.
They were then dried for about 10 minutes (when it did not smell of xylolany more) and developed with Kodak D-19 b developer for 20 minutes
without agitation. Next, they were rinsed in water and fixed in Kodak F 5
fixing bath about 40 minutes, after wich they were washed thoroughly with
running water (1 hour). Staining of the sections, directly over the emulsion,was done by haematoxylin with 4 % iron-alum serving as a mordant. Stain¬
ing time had to be varied with different tissues and was largely determined
empirically. The developed and stained plates were next dehydrated throughvarious grades of alcohol, cleared in xylol and mounted in Canada balsam
with a cover slip of convenient size on top.
Except staining, all operations were carried out in light from a Wratten
series 1 safelight (red). Whenever radioactivity was present in the tissues, the
silver grains directly over these areas were developed. Thus, by examiningslides prepared in the manner described above under a microscope, one could
determine exactly which tissues had accumulated radioactive substances.
Radiochromatography:
For want of any other suitable name we have called this technique radio¬
chromatography (Lissitzky and Michel, 1952; Roche, Lissitzky and
Michel, 1954; Sanwal, 1955); it has been the most widely applied techniquefor research with radioactive isotopes. The following procedure was adoptedby us:
A drop of mixture, containing radioactive substances to be separatedwas applied on the starting line of Whatman no. 1 chromatographic paper.
The drops were delivered from a micropipette and it was rinsed after use
everytime, first with distilled water, then with alcohol and finally with
acetone and dried. Separation on the chromatogram was achieved by the
desired solvent mixture unidimensionally in an all-glass pyrex chromato¬
graphic container by the descending method. The chromatogram was then
dried and strips, about 3 cm. wide (containing the radioactive spots), were
cut out in a longitudinal direction. This strip of paper was enclosed in a
small aluminium casket which had at one end a rectangular opening of
4 mm, X 20 mm. The opening was placed under a thin end-window Geiger-Miiller counter, the distance between the counter and the paper being 5 mm.
The paper strip was counted 4 mm. by 4 mm., beginning with the startingpoint on the chromatogram to the solvent front by moving the chromatogramafter every measurement 4 mms. This movement was facilitated by a scale
fitted under the aluminium casket. Each portion was counted for 5 minutes.
The counts per minute were plotted against distance on the chromatogram

Investigations on the metabolism of Fiisarnim lycopcrsici Sacc. 343
to obtain a radiochromatogram. The maxima on the radiochromatogramcorresponded to the radioactive spots present on the paper chromatogram.By reference to the distance of such radioactive spots from the starting pointand the solvent front, Rf values could be easily calculated out.
b) Preparation of samples for radioactive assay
All the radioactive samples, unless otherwise stated were counted as
barium carbonate. The combustion apparatus was constructed after Ander¬
son, Delabarri and Bothnerry (1952) and is shown in figure 1. It consisted
of a forked combustion tube at one
end and a receiving flask, on the
other, with arrangements for eva¬
cuating the whole apparatus quickly(see legend to figure 1). All sampleswere oxidized using the wet com¬
bustion technique of Van Slyke
et al (1940, 1951 a and 1951 b)
using the following procedure:In case of liquid samples to
be oxidized, the liquid was placedin one arm of the forked combustion
tube (previously weighed) and eva¬
porated to dryness at room tem¬
perature under vacuum. The dried
sample then was oxidized as written
below. In case of tissue fractions
or solid samples, they first were
dried under vacuum over phos¬phorous pentoxide at room tem¬
perature, weighed and placed into
one arm of the forked combustion
tube. In no case (either of liquidsamples or solid samples) the weightdid exceed 15 milligrams. When
measurements were to be made on
a large amount of tissue, as for
instance, whole plants, the plantswere cut up in small individual parts, dried, weighed and then oxidized.
Oxidation of the samples was done by placing in one arm of the
forked combustion tube, along with the samples, the correspondingamount of Van Slyke-Folch solid reagent (2 parts by weight of KIO.iand 1 part of K2Cr207; Van Slyke, Plazin and Weisiger, 1951). The
Other arm of the combustion tube received a corresponding amount of
liquid reagent (67 ml. of fuming sulphuric acid with a free SO:, content of
20°/o, 33 ml. of H.PO, of sp. gr. 1.70—1.72 and 1 gm. of KIO„ all three
heated together to dissolve the KI03, cooled and stored in a clean Pyrex-
Fig. 1. Combustion apparatus for burningthe radioactive samples by the Van Slyke
wet combustion method, a forked com¬
bustion tube, b C'^Oi absorption flask
(Photo: G. Bazzigher)
344 SANWAL
glass bottle.). The liquid reagent was always freshly made before use. In the
receiving flask, on the other end of the apparatus, was placed 15 ml. 2 N
carbonate free NaOH solution having a blank of about 3—4 mg. BaC03per mole of NaOH.
The whole apparatus was quickly evacuated of air and the contents ofthe arm of the combustion tube containing Van Slyke-Folch reagent were
tilted into the arm containing the solid reagent with the sample to be oxidi¬
zed. The mixture was strongly heated for 5 minutes by an open flame applieddirectly under the tube. After removing the flame, the whole apparatus was
left for 30 minutes with occasional shaking by hand to facilitate completeabsorption of the liberated C1402 in NaOH solution. After all
the C1402 had been absorbed, the receiving flask was removed
and the contents rinsed into a clean dried centrifuge tube followed
by an amount of 2 N ammonium nitrate sulution equivalent to the alkali
used, and immediately stoppered with an ascarite tube to protect the contents
from atmospheric C02. The centrifuge tube was then immersed immediatelyin a boiling water bath and allowed to remain there for about 15 minutes,after which the ascarite tube was removed and 10—15 ml. of a solution of
Ba(OH)2 • BaCl2 (for preparation see Anderson, Delabarre and Both-
nerby, 1952) were added from a burette protected from atmospheric C02 to
precipitate the BaC14Os from the solution. The centrifuge tube was againstoppered and placed in a water bath maintained at 90° C for 30 minutes.
The crystalline BaC03 precipitate was centrifuged out, washed first withhot distilled water, then with alcohol and from this the samples for radio¬
active assay were made as follows:
The BaCOs precipitate was ground under absolute alcohol by means
of a pyrex glass rod and the alcohol-barium carbonate slurry so obtained
was transferred by means of an eye-dropper to small aluminium countingdiscs (area 3.47 sq. cms.). The alcohol was evaporated from the discs bydrying the precipitate under an infra-red lamp and finally in an oven at
115° C for one minute (Yankwich, 1948). Such preparations, if not imme¬
diately counted were stored in a dessicator over dry NaOH pellets till
further use.
It might be mentioned here that the BaC03 precipitate obtained byother procedures than those described above (see also Reid, Weil and Dun¬
ning, 1947; Calvin, Heidelberger, Reid, Tolbert and Yankwich, 1949)is 'growing' and has a tendency to stick on the glass walls of the dropperwhile transferring to counting discs. Besides this, the 'growing' precipitatesnever dry on the discs uniformly and this invariably results in serious coun¬
ting errors due to the ununiform geometry of the sample (Kamen, 1951;Calvin et al, 1949).
Counting of the samples and corrections applied:
Counting was done by means of an end thin window Geiger-Miillercounter. A "1000 Scaler" of Tracerlab, Boston, Mass. and a ELA 2 64-scaler

Investigations on the metabolism of Fusarium lycoperski Sacc. 345
of Landis & Gyr A. G., Zug, Switzerland with a EQB 1 GM-tube having a
window diameter of about 25 mm and thickness of about 2 mg/sq. cm, were
used. The samples were counted always at a fixed distance from the window.
Samples having less than 100 counts per minute were counted for at
least 30 minutes and those having greater activities were counted from 5 to
15 minutes depending upon the activity. Background counts were taken before
and after every measurement for at least 5 minutes and were subtracted
from the total counts of the samples in expressing the data.
The standard deviation of a series of measurements on the radioactive
samples and background was calculated out from the formula (Calvin et al,
1949):
standard deviation =
where n = number of determinations made; V = mean value of the counts;
Vi = individual counts.
Counts on any radioactive sample showing less than 3 times the standard
deviation of background counts were taken as not significant of the pre¬
sence of radioactivity in them.
The self-absorption correction for weak £-rays emitted by C14, when¬
ever needed, was done by reference to a curve obtained by counting different
quantities of BaC03 samples of the same specific activity (Yankwich, Norrisand Juston, 1947). All the BaC03 samples counted were either of 'infinite
thickness' (about 20 mg./sq. cm.) or whenever less, were corrected to this
value by reference to the aforesaid absorption curve. Only in experimentsreported in section E, I (page 366) we took recourse to reducing the counts
obtained to 'zero thickness' (see Yankwich et al, 1947), because the sampleswere very weakly radioactive due to an enormous dilution with non radio¬
active COo given off by the plants. This correction was also done byreference to the absorption curve.
Greatest cleanliness was observed while working with the radioactive
material. All the glassware and discs were cleaned immediately after use with
dilute HCl, boiling distilled water, alcohol and finally with acetone and
checked for any possible radioactive contamination under the GM counter
Defore use.
C. Metabolism of F. lycopersici in vitro
I. Effect of substrate on toxin production
It has been demonstrated by Gaumann, Naef-Roth and Miescher
(1950) that the avirulent strain of F. lycoperski produces more lycomarasminIn artificial cultures than the virulent strain. Kern (1952) confirmed this
observation and further showed that both lycomarasmin and fusaric acid are
produced in greater quantities by the avirulent strain than the virulent one
but the difference was not very significant (Kern, 1952, fig. 5) specially in
l/ZOUn-V,)2

346 SANWAL
wilting tests with tomato cuttings. However, in the face of the facts, the
situation is anomalous specially if we were to assume that the disease syn¬
drom in the host is the result of the action of toxins secreted by the pathogenin vivo. If the latter contention were true, we would expect that the virulent
strain produce more toxin in artificial culture than the avirulent one. This
is also the line of argument taken by Dimond and Waggoner (1953).Gaumann (1951 a) has explained this situation by putting forth the argumentthat "the microorganisms respond in their metabolism and formation of the
toxins with extreme sensitivity to nutritional minutae. Claviceps purpureaforms ergotamine and its other alkaloids in the parasitic phase in the ovaries
of the grasses, but not on the same substrate in saprophytic culture. Peni-
cillium chrysogenum and P. notatum pruduce penicillin only when the
nutrient solution contains Zinc: without zinc they produce notatin. Certain
races of Aspergillus fumigatus form gliotoxin after a short incubation period,and helvolic acid after a longer period ...
The same differential stimulation
or inhibition of toxin formation evidently occurs with the various strains of
F. Icyopersici with other Fusarium species in the interior of the host or,
respectively, in saprophytic culture."
In view of the above reasoning, experiments were conducted to arrive
at an answer to the following questions:1. Does the quantity of toxin produced by the virulent and avirulent
strains vary with a quantitative change in the chemical consti¬
tution of the modified Richard's medium?
2. Are toxins produced when there is a qualitative change in
the constituents of the medium? This part of the experiment was also con¬
ducted to search the possibility of a cheap source of radioactive carbon to be
utilized in later experiments.
1. Influence of the quantitative composition of Richard's medium on
toxin production:Since all the known toxins (cf. Introduction) produced by F. lycopersici
in artificial culture have carbon and nitrogen as chemical constituents, it was
decided to vary the concentration of these two substances in the Richard's
medium arbitrarily. In one set of flasks (500 ml. capacity, each containing100 ml. liquid medium), the strains were grown on Richard's medium having
only half the normal amount of sugar (2.5 °/o, instead of the normal 5 %>)and all the other constituents in normal amounts. In the second set of flasks,
only half of the normal amount of nitrogen (0.5 °/o, instead of normal 1 °/o)with the usual amounts of other constituents were provided. In the third
set of flasks, only half of the usual amount of sugar and half of the usual
amount of nitrogen was provided along with the normal quantities of other
constituents of the Richard's medium. The fourth set of flasks served as con¬
trols and contained the unvaried Richard's medium.
Strains R-5-6 (virulent) and 257 (avirulent) were grown at 27° C in
dark for five week duration. At the end of every week 10 flasks (from each

Investigations on the metabolism of Fusarium lycopersici Sacc. 347
set) were removed, the contents mixed together and filtered. The filtrate was
tested both with wilting (in Vs dilution; gradation of symptoms as in Kern,
1952) as well as with the Ustilago spore germination tests (page 336) after
adjusting the pH to 6.0. pH changes in the medium were followed for the
whole growth and test period to find out whether any correlation exists
between the two factors.
The results of these investigations are summarized in figures 2—4.
normal Ris-MediumhalF 0
1 —
2<~
3° halFN
4' halFCandhalFN
4 Weeks 5 4 Weeks 5
Fig. 2. The effect of a quantitative change in the constitution of Ris medium on thetoxin production by strain R-5-6 and 257 as assessed by wilting tests (concentration V»
dose 0.25 ml per gm test plants)
normal Ris~ Mediumhalf C
halFN
halFCandhalFN
Weeks S
Fig. 3. Ustilago activity of the culture filtrates (in dilution units) of strain R-5-6 and257 grown in Ris medium the constituents of which were varied quantitatively

348 S A N W A L
4 Weeks S
Fig. 4. Change in the pH of cultures of strain R-5-6 and 257 grown on modified
Ris media
The following generalizations can be made from a study of the figures2—4:
a) There is no correlation between pH and the quantity of toxins secreted
by the two strains of F. lycopersici. This is clearly borne out from a study of
the corresponding curves (figs. 2—4). pH of the media employed, originallyat about 4.0, rapidly increases till a seven-day-period and thence afterwards
remains more or less constant (fig. 4). As will be seen later (page 354), this
rise in the pH is correlated with the accumulation of ammonia and active
uptake of nitrates from the medium. On the contrary, the quantity of toxins
produced by both strains reaches a maximum after 14 days and there¬
after gradually falls down.
b) With half the normal amount of glucose (2.5 °/o only) and half of
the normal amount of nitrogen (0.5°/o only) in the Richard's medium, the
virulent strain (R-5-6) produces more toxin than the
avirulent (2 5 7) one (figs. 2—3). This is specially pronounced at the
end of a growth period of two weeks, when toxin production always reaches
a maximum. The curves obtained with the wilting tests (figure 2) and also
with the Ustilago spore germination tests (fig. 3) speak for the above gene¬
ralization. At the end of 2 weeks, the toxin production in both the virulent
and avirulent strains takes a similar course. The above also holds true for
cultures grown with either only half glucose or half nitrogen.c) With a favourable balance of carbon : nitrogen (i. e., 2.5 %> car¬
bon : 0.5 °/o nitrogen), the toxin production is always more than an unfavou¬
rable balance (i. e., 2.5 °/o carbon : 1 °/o nitrogen or 5 °/o carbon : 0.5 %>
nitrogen) in both the strains. The carbon nitrogen balance of the culture
medium is also known to influence the organic acid metabolism of many
moulds (Foster, 1949).d) The toxin production shows a sharp rise during the second week and
a sudden fall during the third week in the case of strain R-5-6; in the case
of strain 257, however, the rise and fall is not sudden (figs. 2 and 3).

Investigations on the metabolism of Fusarium lycopersici Sacc. 349
2. Influence of the qualitative change in the composition of Richard'smedium on toxin production:
It has been demonstrated above that a quantitative change in the consti¬
tution of the substrate causes a corresponding change in the quantity of
toxins produced by F. lycopersici. It yet remained to be seen whether toxins
could be produced by this organism in a substrate having other sources
of carbon than glucose. Gottlieb (1944) had earlier shown that
various amino-acids could be used as the exclusive carbon sources in the
medium for the growth of F. lycopersici. Preliminary experiments showed
that with various amino-acids as the carbon sources (e. g., aspartic acid,glutamic acid etc.) the fungus did not produce significant quantities of toxins,even though growth took place. However, when 2.5 % glycine was used as
the sole carbon source, toxin production was quite comparable to that pro¬duced by glucose. After preliminary experiments it was found that the best
medium for the optimum production of toxins was: 25 gms. glycine, 7 gms.
ammonium nitrate, 5 gms. monopotassium phosphate, 2.5 gms. magnesiumsulphate, 0.02 gms. ferric chloride, distilled water to make up 1000 ml.
Growth in this medium, however, was not comparable to the Richard's
medium, nevertheless toxin production was optimum.Strains R-5-6 and 257 of F. lycopersici were grown in 500 ml. Erlen-
meyer flasks with 100 ml. of glycine medium in dark at a temperature of
27° C for different lenghts of time. At regular intervals of 7 days, 10 flasks
from each series were removed, freed from mycelium and the culture filtrate
tested for the presence of toxins by the wilting tests (in 1/s dilution) and also
by Ustilago spore germination tests. Figures 5 and 6 represent the results
of this investigation. Although not included in these figures, vasinfuscarin
was regularly present in the culture filtrates from the beginning of the 7 th
day to the end of 6 weeks.
The following conclusions can be drawn from a study of figures 5 and 6:
a) Toxins (lycomarasmin, fusaric acid and vasinfuscarin) are producedby the two strains during their growth in the glycine medium.
b) Toxin production, as assessed by the tomato wilting tests, steadilyincreases in the culture filtrates of both the strains till the 4 th. week and
subsequently falls down to a minimum at the end of 6 weeks (fig. 5).c) As assessed by the Ustilago spore germination tests, toxin production
reaches a maximum at the end of a 2 week growth period and subsequentlyfalls down in both the strains.
d) In the glycine medium, strain 257 produces more toxin than the strainR-5-6. The difference, however, is not so significant as in the Richard's
medium.
With the above facts in hand, we can discuss the questions we askedourselves at the beginning of these experiments. It has been demonstratedthat, by varying the chemical environment, a corre¬
sponding variation also occurs in the quantity of
Phytopath. Z., Bd. 25, Heft 4 23

350 SANWAL
toxin production. Thus, under certain conditions, the virulent strain
produces more toxin in vitro than the avirulent strain under precisely the
same conditions. This is not surprising, since the microorganisms are known
to be fastidious in this regard (Gaumann, 1951 a; Turel, 1952; Kern, 1952;
Sauthoff, 1955). This fact, however, may have a bearing on the toxin
production in vivo. The chemical environment in the plants is not the same
as in the laboratory cultures, and as we have shown, by a change in the
chemical environment a corresponding shift also occurs in the toxin pro-
Fig. 5 Kg. 6
Fig. 5. Wilt-index of the culture filtrates (concentration lh, dose 0.25 ml. per gm.
plant material) of strain R-5-6 and 257 of F. lycoperski, grown in glycine medium
Fig. 6. Ustilago activity of the culture filtrates (in dilution units) of strain R-5-6 and
257 of F. lycopersici grown in glycine medium
duction. Thus, the virulent strain may be able to produce more toxin in the
tomato plants with the resulting severity of disease as contrasted with the
less virulent strains. No doubt there are many other factors in operationapart from the toxin factor in the production of the overall disease picturein the tomato plants by the different strains of the pathogen. Resistance of
the host is one such factor. This resistance may manifest itself in two ways.
1. Resistance to the spread of the pathogen and 2. resistance to the toxins
produced by the pathogen (Gaumann, 1951 b; Zahner, 1955). Disease in
the tomato plant results only when both these obstacles have been overcome
by the pathogen. Strain 257, although capable of producing some quantityof toxins cannot do so in the plants, because it cannot overcome even the

Investigations on the metabolism of Fusarium lycoperski Sacc. 351
preliminary resistance of the host to the spread of the pathogen. Thus, it
remains localized at the focus of infection, and since no growth occurs,
toxins too are not produced in significant quantities.The fact that F. lycopersici can produce its toxins from certain amino-
acids (in this case glycine) as the exclusive carbon source is significant. This
would mean that in the absence of optimal quantities of sugars in the host,the pathogen would be able to metabolise other constituents, like amino-
acids, for toxin production in vivo. If we compare figures 3 and 6 we see
that the Ustilago activity of the glycine medium is far greater than Richard's
medium, specially during the first two weeks. Among the known toxins of
F. lycopersici only fusaric acid inhibts germination of Ustilago spores. In
other words, with glycine as the exclusive carbon source, more fusaric acid
is produced by the two strains of F. lycopersici than with glucose as the
carbon source. Although not exactly ascertained, it might be mentioned in the
passing, that the growth of the strains in glycine medium is approximatelyVs less than in glucose medium, and still more fusaric acid is produced in
the former medium. This is in keeping with the observations of other authors
(Kern, 1952).The preferential production of fusaric acid, as assessed by the Ustilago
spore germination tests, in the glycine medium by the strains of F. lycopersiciled us to think that glycine itself might serve as a distant precursor of fusaric
acid. If this were true, we would expect increased fusaric acid productionin Richard's medium containing small quantities of glycine. Accordingly,the following three media were prepared and both the strains of F. lycopersiciwere cultured in them:
a) Richard's medium + 0.3 % glycine,b) Richard's medium + 0.15 % glycine,c) Richard's medium alone as control.
The culture filtrates were assayed as usual with Ustilago spore germi¬nation tests after each 7 days interval. The results are given in figure 7.
The following facts are borne out from the figures:
a) In all media, fusaric acid production by strain R-5-6 is uniformlylower than strain 257.
b) With increasing quantities of glycine in the medium, a correspon¬
ding increase in the production of fusaric acid takes place, especially at the
end of 14 days.We are naturally tempted to interpret these results as evidence for the
fact that glycine, either directly or indirectly serves as a precursor of fusaric
acid. The facts, however, are not so simple. It is equally possible that
glycine causes, by its presence, a more efficient uptake and metabolism of
the immediate precursor of fusaric acid. In keeping with this possibility,we observe that there is no significant difference in fusaric acid productionat the end of a 7 day period in media with or without glycine. Only between
23*

352 SANWAL
the 7th. and the 14th. day does the difference become visible. This mightagain be due to the fact that the enzyme systems, responsible for the meta¬
bolism of fusaric acid, are first produced after some days growth.
0 12 3 4 5 Weeks B 0 1 2 3 4 5 Weeks S
Fig. 7. Ustilago activity of the culture filtrates (in dilution units) of strains R-5-6 and
257 grown in Ris medium with different concentrations of glycine
II. Chemical changes in artificial cultures during fusaric acid production
To come closer to an understanding of toxin production in vitro
it was necessary to investigate the series of events that lead to the pro¬duction and accumulation of the toxins in artificial cultures. Facts gatheredhere could be of use for us in interpreting the toxin production in vivo.
In the experiments that follow, we have restricted ourselves to a studyof the biosynthesis of fusaric acid alone. The reasons are obvious. For
lycomarasmin' and vasinfuscarin, there do not exist any chemical methods
of determination. Only very recently methods have been developed for
the chromatographic determination of lycomarasmin (Kern and Fluck,
unpublished). Fusaric acid, however, lends itself well to experimentationand methods for its determination are known (Zahner, 1954).
Fusaric acid is a 5 n-butylpyridine-2-carboxylic acid and has carbon,
nitrogen, oxygen, and hydrogen in its molecule. In its biosynthesis, therefore,the carbon and nitrogen containing constituents of the medium must have a
central role to play. In our preliminary experiments we found out that
the common organic acids, resulting from the dissimilation of glucose and
accumulating as the same time as fusaric acid in the medium, bear no rela¬
tionship to fusaric acid production. Their study was, therefore, not taken

Investigations on the metabolism of Fusar'mm lycopersici Sacc. 353
up further. The nitrogen containing constituents, however, appeared to have
a much closer relationship to the biosynthesis of fusaric acid. In the following
study, therefore, the metabolism of nitrate, ammonia, amino-acids, purinesand glucose has been studied in relation to fusaric acid production.
Only strain 257 was used and was grown in 500 ml. Erlenmeyer flasks
containing 100 of modified Richard's meding (page 336). Analysis of the
culture filtrates was done every third day till 42 days. To obtain reliable
results and to minimise errors due to natural fluctuations in the metabolism
of individual cultures, contents of 10 flasks each time were taken for ana¬
lysis. In calculating results, corrections incidental to the loss by evaporationwere applied. The following constituents were analysed in the culture
filtrates: 1. Dry weight of the
mycelium 2. Glucose (as reduc¬
ing sugar). 3. Total nitrogen4. Nitrate nitrogenmonia nitrogen 6.
nitrogen 7. Purine
and 8. Fusaric acid
The methods of analysis have
been given earlier (section B,
III). The results of this in-
,J|vestigation are represented in
i,'g figures 8, 9 and 10.
5. Am-
Amino-
nitrogennitrogen.
•i
Fig. 8.
IS Dzijs «
Dry weight of mycelium and glucosecontent of the culture filtrates
ISDays 42
Fig. 9. Amino-N and purine-N in relation Fig. 10. The relationship between total
to fusaric acid nitrogen in the culture nitrogen, ammonium nitrogen and nitrate
filtrates nitrogen in culture filtrates
The following facts can be summarized from a study of figures 8, 9
and 10:
a) The dry weight of the mycelium increases steadily till the 25th.
day of growth and then gradually falls down. At about the time the myce¬
lium has reached the maximum growth limit, very little glucose is presentin the medium. The increase in the weight of the mycelium is proportionalto the quantity of sugar consumed.
354 Sanwal
b) Fusaric acid first appears in the medium after 6 days of growth andthence afterwards steadily increases till the 18th. day, when it reaches itsmaximum peak. At the end of this period, the level of fusaric acid produc¬tion again falls down till the 33rd. day and again rises to a maximum at
the end of 36 days.c) The amino-acids are produced in the medium from the beginning of
growth period, reach a peak at the end of 12 days and except for a decreasein production between 12th. to 21st. day and again between 33 rd. and39th. day, are always present at the peak level. Towards the end of the
growth period of the mycelium, free amino-acids rapidly increase in themedium. This may be due to the hydrolysis of the cell proteins, once lysishas started.
d) Purines increase in the medium till the 12th. day (at about the same
time as the amino acid production reaches its peak), after which the levelof production falls down, corresponding to the amino-acid level, and thenremains more or less constant. The production of purines corresponds to
the amino-acid production in the medium.
e) It will be recalled that Richard's medium contains ammonium
nitrate as the source of nitrogen. Figure 10 shows that the organism utilizesnitrate nitrogen in preference to ammonia nitrogen. In fact, ammonia in¬
creases steadily in the medium till the end of the growth period. On the
contrary, nitrates are rapidly taken up. Some of the excess ammonia mayaccumulate in the medium due to deamination of some of the amino-acids.These findings are in conformity with the earlier work of Luz (1934). The
rise in the pH of the medium (page 348) is perhaps correlated to the accu¬
mulation of ammonia.
The total nitrogen of the culture filtrate decreases with active growth of
the mycelium but this occurs very gradually.The significance of these results is obvious. It can be said with very
great deal of certainty that fusaric acid is not an autolysisproduct. Thus, at the time greatest quantity of
fusaric acid is available in the medium, the myce¬
lium is still in the log phase of growth. This observation
is in contradiction to that observed in Gibberella fujikuroi (Stoll, 1954),causing Bakanae-disease of rice in Japan, where maximum quantity of
fusaric acid is present when a lysis of the mycelium has already set in. The
results with F. lycopersici correspond to earlier investigations with the aid
of biological tests (Kern, 1952).The most interesting point, however, is the relationship between amino-
acids, purines and fusaric acid (figure 9). The production of purines in the
medium parallels amino-acid production. The amino-acids, however, rapidlyincrease till the 12th. day, when fusaric acid production is the lowest. From
12th. to 18th. day, when fusaric acid production rapidly increases, the amino-
acid production decreases. Precisely the same set of events occur between
33rd. and 39th. day. It seems plausible that fusaric acid is produced at the

Investigations on the metabolism of Fusarium lycopersici Sacc. 355
cost of some of the amino-acids and, therefore, when more fusaric acid is
produced, corresponding amounts of amino-acids decrease in the medium.
Recent paper chromatographic studies of amino-acid metabolism of F. lyco¬persici (Fluck and Richle, 1955) lead to the conclusion that in particularA1 a n i n and Citrullin might be involved in the biosynthesis of
fusaric acid.
D. Studies on the metabolism of
F. lycopersici in vivo
It has been shown in the previous section that F. lycopersici producesthe three known toxins (lycomarasmin, fusaric acid and vasinfuscarin) both
on a glucose and glycine medium. It has been assumed by us, in view of the
indirect evidences, that these toxins are also produced by the pathogen in
vivo. The direct demonstration of these toxins and other metabolic productsof the pathogen in vivo is difficult with ordinary chemical techniques. The
only way we could demonstrate the metabolic products of the pathogen in the
host would be by certain differential techniques, where we would be able to
recognize apart the substances secreted by the pathogen from those of the
host. The only possibility that suggested itself was the 'tagging' of the
pathogen with a suitable radioisotope.In phytopathological literature as yet only a few organisms have been
effectively employed for tagging. The earliest work has been that of Warren
(1951) who was able to tag Bacterium stewartii effectively with P32 and
could trace the distribution of the tagged organism in the corn plant bymeans of radioautographs. Fitzgerald et al (1951) working with Yeasts
showed that it could be tagged by Tritium at a concentration of 100 ^aC/ml.At this level of radioactivity, the organism was not damaged as assessed
by the retention of the budding capacity of the tagged cells. Wheeler (1952,
1953) using Cu-labeled glucose was able to tag effectively 5 different
fungi at a concentration of 30 /uC/ml. He observed that at this level of
radioactivity some of the conidia were rendered inviable but the fungi did
not lose their virulence. In a later work, using Helminthosporium victoriae,he demonstrated that about 100 /<C/ml. of C14-labeled glucose could be used
safely, without the organism losing its virulence. At this level of radioacti¬
vity, however, a number of cells became inviable. Hoffmann and Zucker-
man (1954) succeeded in tagging Endoconidiophora fagacearum by incor¬
porating in the growth medium C14-labeled sucrose at a concentration of
25 fiC/ml. At this concentration the fungal cells did not suffer any damage.
For our experiments, radioactive glycine, labeled in the methyl carbon
was used. The specific activity of the glycine was 14.9 microcurie per
milligram.The experimental procedure and details of preliminary work have
already been described (Kern and Sanwal, 1954) and may be refered to
for further information.

356 Sanwal
I. The secretion of radioactive metabolic products into the host
Previous experiments have shown (Kern and Sanwal, 1954) that the
mycelium can be safely tagged with radioactive glycine at a concentration
of 90 fxClml., after a growth period of 7—12 days. In this case, althoughabout 40 % of the cells become non-viable, yet the organism does not lose
its virulence and no difference in the morphology of the fungus can be
discerned. It was safe to assume, therefore, that tagged mycelium introduced
in the host could be used to find out whether tagged products of metabolism
of the pathogen are produced in the plants. This could be investigated both
by the counting techniques as well as radioautography of the tissues showingdisease symptoms.
In the following experiments, the inoculum was obtained by growingstrain R-5-6 in glycine medium having a specific radioactivity of 90 ,uC/ml.,for eight days. The inoculum was washed after this preliminary period of
growth with 5 changes of 2 % sterile, inactive glycine solution and further
few changes of sterile distilled water in a centrifuge. Tomato plants were
inoculated with this mycelium as usual. After every 24 hour period from the
time of inoculation, one plant at a time was cut into convenient pieces,about 2 cms. long. The leaves with their petioles were treated separately.Each two centimeter length of the stem was then surface sterilized by means
of 0.2 °/o HgCl2, washed with sterile distilled water and by means of a
sterilized knife cut into smaller bits. Pieces of each stem part were laid on
poured petri dishes and incubated at 27 ° C for two days. Those stems, in
which the fungus appeared were not counted further. In the case of leaves,only the petiole parts attached to the stem were taken and if this showed the
presence of the mycelium, the whole leaf was rejected. The tested pieces of
each part of the stem were then gathered together, dried and counted.
In the case of strain R-5-6, no radioactivity was detected in plants after
24 hours of infection, but after 48 hours radioactivity was apparent in
stems about 13—15 cms. from the base of the stem. Growth of the myceliumat this moment was restricted to areas adjoining the roots. Subsequentmeasurements at 24 hours interval for a 7 day period showed that radio¬
activity indeed increased in the leaves, but comparatively much more
remained in the stems.
Under our green-house conditions (temp. 24—30 ° C) the vein-clearingsymptoms first described by Foster (1946) appeared on the host leaves on
the 4th or the 5th day. However, all the leaves of the plant did not show
this symptom. If this vein-clearing symptom was the result of some trans-
locable toxins secreted by the pathogen in advance of its growth, it was
logical to assume that radioactivity would increase considerably in the leaves
showing this symptom. This would only be the case, however, if the meta¬
bolic products responsible for the vein-clearing were radioactive. That such
is the probable case is strongly supported by the analysis presented in table 1.
Here, individual leaves showing vein-clearing symptoms on the plantand those showing no symptoms at all were cut off and their radioactivity

Investigations on the metabolism of Fusarium lycopersici Sacc. 357
measured. It will be seen from the table that except in a few cases the leaves
showing vein-clearing show a relatively greater accumulation of radioactivityfrom the leaves showing no other symptom. In both the cases no myceliumwas present in the leaves.
Table 1
The relative accumulation of radioactivity in different leaves
of individual plants (showing vein-clearing or no symptomsat all) after 5 days inoculation with tagged strain R-5-6 of
Fusarium lycopersici
Counts/mt./mg. (dry weight) Counts/mt./mg. (dry weight)of leaves showin ; vein-
mber
clearing of 1 :aves showing no vein-clearing
Plant Leaf nu Leaf number
no.average average
1 2 3 4 counts/
mtVmg.1 2 3 4 counts/
mt./mg.
890 430 426 710 614 136 174 282 102 148
646 846 314 yn 549 89 194 124 267 171
428 542 894 334 550 117 215 97 99 132
371 420 220 227 310 98 115 204 123 135
1650 929 543 385 877 231 72 53 174 133
The difference in the radioactivity of the injured and the healthy laeves
on the same plant, leads us to believe that the pathogen secretes
some substances of toxic nature into the host which
are carried up to the leaves and cause the characteri¬
stic symptoms there. These findings are substantially in agreement
to those of Davis (1954) who reached the same conclusion through different
experimental procedures.In the case of strain 257 (avirulent), the vein-clearing symptoms do not
appear at all, at least under our greenhouse conditions. It was interestingto find out whether, in the absence of immediate symptoms on the host, the
fungus builds up or secretes some substances in the host.
The answer to this question was obtained by growing strain 257 in the
radioactive glycine medium for 8 days and inoculating the plants with the
usual techniques. Analysis of such plants showed that, in contrast to strain
R-5-6 radioactivity accumulates very slowly in the leaves and very little is
present in the stems.
At the first sight the results of these experiments with virulent and
avirulent pathogens seem contradictory. Both appear to secrete certain
chemical substances in the host plant and yet one strain can produce disease
in the plant and the other not. To the author, it appeared, as a
reconciliation between these two apparently contradictory facts, that there
is a qualitative difference in the secretion of chemical substances by these
two kinds of strains inside the host; the avirulent pathogen secreting certain
substances which are not toxic to the plants and the virulent one certain
substances which are toxic along with others which are non-toxic.

358 Sanwal
The verification of this hypothesis is beset, unfortunately, with diffi¬
culties and complications. It would be an exacting task to purify all the
plant constituents separately for radioactive measurement.
II. The distribution of radioactive metabolic products in the host tissue
Until now, in our analysis, we have included all the tissues of the
host, irrespective of the fact that within the same tissue only certain parts show
the symptoms. Thus, in leaves showing vein-clearing symptoms, only the
veins of the leaves show the disease and not the intervenal spaces. In stems,
similarly, the vascular bundles show the browning and the rest of the tissue
seems perfectly healthy. If we carry our argument, that at least some of the
symptoms on the host are due to toxic metabolic products of the pathogenfurther we should be able to demonstrate comparati¬
vely more radioactivity in the strictly diseased
portions than from the surroundinghealthy areas (inour examples, more in the veins than in the intervenal portions or in the
case of stems, more in the vascular bundles than in the ground tissue). Since
mechanical teasing of the tissues apart from one another would introduce
considerable amount of inaccuracy, we took recourse to the radioautographictechniques.
The tomato plants, at the four leaf stage, were inoculated with taggedR-5-6 and 257 strains. After 12 days infection period, the stems of the
plants inoculated with strain R-5-6 showed a typical browning of the vessels
about 8—10 cms. above ground level and vein-clearing on the older leaves.
The plants inoculated with strain 257, at about the same time, showed slight
browning of the vessels only about 0.5—1 cm. above the ground level and no
vein-clearing symptoms on the leaves. For radioautography, we only took
the following parts from the plants:
1. Stem portions showing browning.2. Stem portions showing no browning.
The diseased and healthy leaves were not included here, because the
radioactivity in the leaves was very much less than that required for ob¬
taining a satisfactory image on the emulsion (see Kamen, 1951; Sanwal,
1955). Convenient pieces of each one of the above tissues were prepared for
sectioning in the following ways:
1. The tissues were placed in water and air was removed from them bya water suction pump. The objects were tranferred then to a vessel con¬
taining ethylene glycol cooled to — 20 ° C (see for further details, Tietz,
1952, 1953). After allowing them to remain there for 3 hours, the contents
of the vessel were gradually warmed to room temperature and the tissues
transferred to a 1:1 mixture of ethylene glycol and Aquaffin*) (manu-
*) For kindly lending me a sample of this wax, I thank Dr. H. F. Linskens of
Koln University, Germany, who also was kind enough to call my attention to some of the
published literature on the use of synthetic waxes in histology.
Investigations on the metabolism of huarutm lycopersict Sacc. 359
factured by Bayer Farbenfabriken, Leverkusen) for a short time at 30 • C
and then 2 hours at 50 ° C. Next they were placed in pure Aquaffin for
6 hours and embedded in the same material for sectioning. Sections about
7 f.i thick were cut and stretched on specially prepared microscope slides
(see section B, IV). Before radioautography the wax was removed from the
slides by laying on top of the sections a filter paper soaked in a mixture of
Aquaffin (10 °/o) and water saturated with Thymol and allowing it to dry.
The sections were then
covered with the'stripping'film emulsion and exposedfor 40 days.
'<£&jL
^
WW
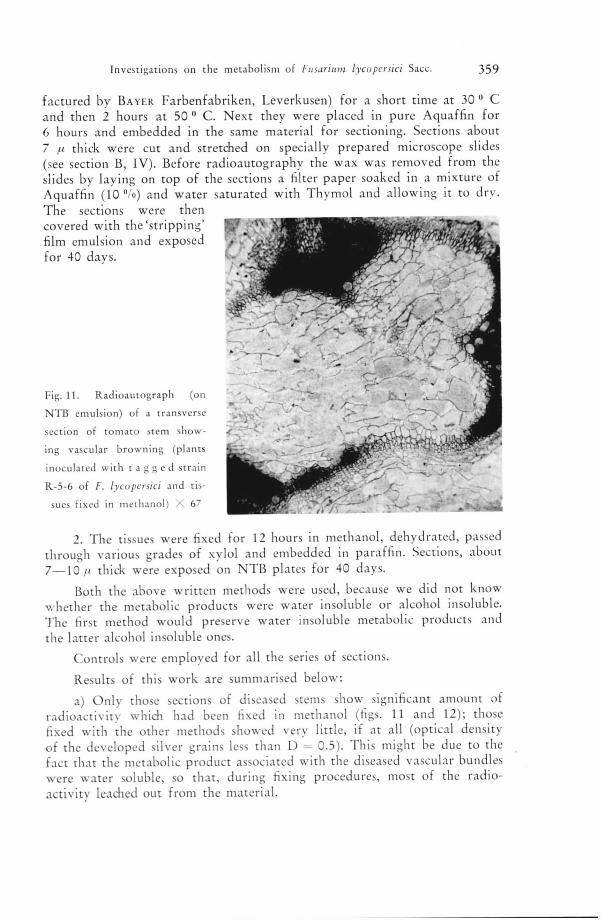
Fig. 11. Radioautograph (on
NTI5 emulsion) of a transverse
section of tomato stem show¬
ing vascular browning (plants
inoculated with tagged strain
R-5-6 of /". lycopersict and tis¬
sues fixed in methanol) X 67
2. The tissues were fixed for 12 hours in methanol, dehydrated, passed
through various grades of xylol and embedded in paraffin. Sections, about
7—10// thick were exposed on NTB plates for 40 days.
Both the above written methods were used, because we did not know
whether the metabolic products were water insoluble or alcohol insoluble.
The first method would preserve water insoluble metabolic products and
the latter alcohol insoluble ones.
Controls were employed for all the series of sections.
Results of this work are summarised below:
a) Only those sections of diseased stems show significant amount of
radioactivity which had been fixed in methanol (figs. 11 and 12); those
fixed with the other methods showed very little, if at all (optical density
of the developed silver grains less than D = 0.5). This might be due to the
fact that the metabolic product associated with the diseased vascular bundles
were water soluble, so that, during fixing procedures, most of the radio¬
activity leached out from the material.

360 S A N W A L
b) Sections of diseased stems (showing vascular browning), obtained
either from the plants infected with strain R-5-6 or 257, show radio¬
activity onlv in the vascular tissue, after having been
fixed in methanol (figs. 11 and 12).
c) Sections of normal stems (showing no vascular browning) show no
detectable radioactivity in any part. This is uniformly so, whether the stems
used are from plantsinfected with either of
the two strains or the
different fixing proce¬
dures.
Fig. 12. Radioautograph same
as figure 11. One of the vas
cular bundles enlarged to
show the de\ eloped silver
grains directly above the xy-
lem cells. Note that no my¬
celium is present in the ves¬
sels and no radioactivity in
the ground parenchyma cells.
X 270
d) In the case of diseased stems, inoculated with marked R-5-6 strain,radioactivity is detectable in the vessels indepen¬dent of the presence of the radioactive m v c e 1 i u in
(hg. 12), when the stems are fixed in methanol.
e) The control preparations, given the same treatment as the others
above, did not affect the emulsion, thereby showing (fig. 13) that the other
exposed pictures were not artefacts.
From all the observations above recorded, some significant facts can
be deduced. Firstly, the pathogen during its growth in the host secretss
certain metabolic substances, some of which at least are toxic to the plants.This is borne out by the fact that radioactivity in the stems
is closely associated only with the diseased por¬
tions. Secondly, this metabolic product seems to be water soluble and
alcohol insoluble (precipitable by methanol) and possibly, therefore, is of a
proteinaceous nature. Vasinfuscarin, produced by F. lycopersici in vitro is
similarly precipitable by methanol (Gaumann, Stoll and Klrn, 1953). It
cannot be said at this stage of work whether the precipitable substance in
vitro and in vivo is one and the same, but there is evidence that such mightbe the case.

Investigations on the metabolism of hisanum lycopcrsici Sacc. 361
Fig. 13. Controls (on NTB emulsion) of
a transverse section of tomato stem
showing vascular browning (plants in¬
oculated with non-radioactive strain
R-5-6 of r. lycopcrsici and tissues fixed
in methanol). X 165
HI. Chemical substances secreted by the pathogen in the host
Elsewhere in this work, it has been demonstrated that when plantsare inoculated with tagged mycelium, radioactivity is discernible in both
stems and leaves of the infected plants after some time. This was irrespectiveof whether the inoculation was done by the virulent or the avirulent strain.
The explanation given was that the metabolic products secreted by both
the strains varied qualitatively from one another, i. e., the avirulent pathogenperhaps secreted certain substances which were non-toxic and the virulent
pathogen substances which were both toxic and non-toxic. As we have shown
with radioautographic techniques, the avirulent pathogen also secretes certain
radioactive, seemingly toxic metabolic products, but they are limited to
the area of infection (at the base of the plants, small portions showingvascular browning).
Incidental to the above hypothesis, the following two questions were
taken up as basis for further experimentation:1. What kinds of metabolic substances are produced by the pathogen
in vivo?
2. Is there any difference, qualitative or quantitative, in the secretions
of the virulent and avirulent pathogens?The answer to these questions was given by extraction and chemical
analysis of the infected plants. It must be emphasized from the very be¬
ginning that only a gross and rough characterization of the radioactive sub¬
stances secreted by the pathogen could be had because of the technical
difficulties involved in the work.
15 tomato plants were inoculated each by marked strains R-5-6 and
257 (tagged with 2-C14-glycine at a concentration of 90 /'C ml.). After
about 15 days growth (when many plants showed wilting symptoms and
necrosis etc.) the plants were cut off from the soil level and divided into

362 S ANWAL
Table 2
The distribution of radioactivity in fractions of stem and leaf
tissue 15 days after inoculation with tagged strain R-5-6 of
Fusarium lycopcrsici
Extract
Stem fraction (dry weight7.9 g.) total activity =
129162 counts per minute
Leaf fraction (dry weight9.8 g.) total activity =
78 075 counts per minute
counts/mt.percentage
of
total activitycounts/mt.
percentageof
total activity
Petroleum ether
extract
1033
1 162
17 308
267
4 918
12141
12 014
0
1034
10 849
42 494
0
904
16 791
0.8
0.9
13.4
0.2
3.8
9.4
9.3
0
0.8
8.4
32.9
0
0.7
13.0
468
390
9 787
2185
4 740
5 233
10 306
lost1952
11399
12 726
78
1405
8 120
0.6
0.5
Ether extract
12.6
2.8
Ethanol extract
6.2
6.7
70'/o ethanol extract
13.2
lost
2.5
14.6
16.3
0.1
Starch and cell wall1.8
10.4
118 905 92.5 68 670 88.3
stems and leaves. The two sets of plants (one set inoculated with R-5-6
and the other by 257) were handled separately. Each of these portions was
dried by a forced draft and weighed. The tissues were then ground mecha¬
nically and aliquots of material counted with a GM counter to obtain the
total radioactivity of the tissues.
The ground up tissues were extracted (see also, Weintraub et al, 1952 a,
1952 b) exhaustively with petroleum ether for 12 hours, after which it was
poured off. The solid tissues were then extracted in turn for 12 hours with
ethyl ether, 12 hours with absolute ethanol and finally 12 hours with 70 %
aqueous ethanol. Each time the liquid was poured off and kept for a sub¬
sequent analysis. The residue was then extracted first with cold water and
then with hot water by turns. In the end the residue consisted of starch and
cell wall material.
The petroleum ether and ethyl ether extracts each were shaken with equalvolume of sodium bicarbonate solution in a separating funnel and the bicar¬
bonate layer separated from ether. It contained the acidic fraction and ether,

Investigations on the metabolism of Fusarium lycopersici Sacc. 363
Table 3
The distribution of radioactivity in fractions of stem and leaf
tissue 15 days after inoculation with tagged strain 257 of
Fusarium lycopersici
Extract
Stem fraction (dry weight12.3 g.) total activity =
85 605 counts per minute
Leaf fraction (dry weight14.1 g.) total activity =
111234 counts per minute
counts/mt.percentage
of
total activity
counts/mt.percentage
of
total activity
Petroleum ether
extract
1969
257
759
7 276
2 824
4 879
13 097
1027
2 654
12 583
7 276
1027
3 938
15 922
2.3
0.3
0.7
8.5
3.3
5.7
15.3
1.2
3.1
14.7
8.5
1.2
4.6
18.6
1223
556
2 002
3 782
2113
1446
11522
1445
4 136
12 903
12 013
2 558
1557
22 469
1.1
1.5
Ether extract
1.8
3.4
Ethanol extract
1.9
1.3
70%> ethanol extract
10.7
1.3
3.7
11.6
10.8
Tannins & gums2.3
Starch and cell wall
1.4
20.2
75 488 88.0 79 725 73.0
the nonacidic fractions. The absolute ethanol extract was evaporated under
vacuum and the residue was taken up in water. The pH of this solution was
brought to 3.5—4.0 and it was then extracted with ethyl ether to remove
the acidic constituents. The water phase, after extraction contained the non-
acidic constituents. From the 70% ethanol extract, ethanol was removed
under vacuum and the water solution was boiled for some minutes to
remove proteins which were separated by centrifugation. The supernatant
was brought to a pH of about 8.0 with alkali and extracted with ether to
remove the basic substances. The extract remaining after ether extraction
was adjusted again to a pH of 4.8—5.2 and treated with neutral lead acetate
to precipitate amino-acids. The precipitated amino-acids were removed by
centrifugation. The supernatant contained sugars etc.
The cold water extract was boiled for 10 minutes and the precipitatedprotein was centrifuged out. The supernatant was adjusted to a pH of
4.8—5.2 and neutral lead acetate was added to it. The precipitate consisted
of tannins and gums and the supernatant of dextrins and pectins.

364 Sanwal
The hot water extract was boiled to remove all traces of proteins. The
solution was then treated with neutral lead acetate to remove gums and
tannins.
Each of the above fractions was counted as usual with a GM counter.
Tables '2 and 3 summarize the results of this investigation.
The results obtained above show that both the virulent and avirulent
strains secrete varied kinds of chemical substances in the hosts. It cannot be
said for certain whether these chemical substances remain in the originalform, as secreted by the pathogens in the host, or are broken down and
modified further by the host enzyme systems. The salient features of the
investigation can be summarized as follows:
a) The pathogen secretes a wide variety of chemical substances in the
host, some of which are undoubtedly non-toxic.
b) The principle substances secreted by the pathogen are certain acidic
substances, amino-acids, sugars and proteins.
c) The main difference in the secretions of virulent and avirulent
pathogens is probably the protein substances; the virulent patho¬gen secretes more substances of protein nature than
the avirulent pathogen.It must be borne in mind that the radioactive chemical substances, shown
to be secreted by the pathogens are not the only ones. Perhaps more impor¬tant are the substances elaborated by the pathogen in the host plant bytransformation of the host nutrients through its
enzymatic system. Thus, many important toxic substances, known
to be produced by the pathogen in vitro probably cannot 'be demonstrated
by our techniques in vivo because they may be elaborated by the break¬
down of the host nutrients.
Apart from the above, our experiments have demonstrated that there
are definitely some substances secreted by the
pathogens which are toxic, like perhaps the metabolic productcausing the vein-clearing symptoms and the browning of the vessels.
E. The role and fate of C14-marked fusaric acid
in tomato plants
By the tagging techniques, described in previous sections, only those
toxic components can be demonstrated in vivo which are elaborated in the
mycelium and secreted to the outside, i. e., the intracellular
toxins. On the contrary, extracellular toxins are elaborated
by the pathogen by transformation of the host nutrients only external to the
mycelium. Fusaric acid is an example of an extracellular toxin and vasin-
fuscarin that of an intracellular one. The terms intracellular and extracellular
are here used in preference to endotoxin and exotoxin respectively, because
by usage with bacterial organisms, the term endotoxins has come to signify

Investigations on the metabolism of Fusarium lycopersici Sacc. 365
those toxic substances which are released after the death of the cells. Exo¬
toxins, on the contrary, are produced by the living bacteria inside the cells
and then secreted to the outside (Burrows, 1951).It is relatively simple to distinguish between intracellular and extra¬
cellular toxins in fungi. When young, actively metabolizing mycelium of
F. lycopersici is suspended in replacement cultures, even for a short time,the intracellular toxin vasinfuscarin is secreted in the culture medium. Alter¬
natively, when the mycelium is disintegrated by mechanical means and
extracted with water, only the presence of vasinfuscarin can be demonstrated.
Using similar techniques, fusaric acid, one of the extracellular toxins,cannot be detected inside the mycelium*); it is only present in the culture
filtrates. This is because of the fact that fusaric acid is only produced external
to the mycelium during the course of growth and metabolism in vitro. There
was no reason to doubt that fusaric acid would similarly be produced in
vivo by the metabolism of the host nutrients through the enzyme systemsof the pathogen. For these reasons, therefore, it was never expected that
fusaric acid would be demonstrated in diseased plants by the taggingtechniques. However, sufficiently sensitive methods are known for the detec¬
tion of fusaric acid (Zahner, 1954). Accordingly, a number of efforts were
made to extract fusaric acid from the diseased plants, but they were in
vain. It was doubted, therefore, that fusaric acid is metabolised by the host
as soon as it is formed by the pathogen. Evidence for this possibility exists
from the work of Japanese authors (Tamari and Kaji, 1952 a, 1952 b). The
following work was undertaken, therefore, to investigate the metabolic
fate of fusaric acid in the host and to clarify certain questionsincidental to the pH effect of fusaric acid (Gaumann, Naef-Roth and
Kobel, 1952). The latter investigations shall be published elsewhere.
While the experiments on the distribution of C14-marked fusaric acid
were in progress, it was noticed that the total radioactivity in the tissues was
very much lower than the radioactivity originally applied, specially after
the cuttings had been placed in water for 48 hours after uptake of radio¬
active fusaric acid. Even after reckoning with the sampling error, the loss
of radioactivity from the tissues could not be explained. In case of nicotinic
acid, a closely related compound, it is known that it is decarboxylated and
metabolized to a number of related compounds in animals (Leifer, Roth,Hogness and Corson, 1951). Accordingly, investigations were untertaken
to study the metabolism of fusaric acid in plants. The Japanese authors
believe (Tamari and Kaji, 1952 a, 1952 b) that fusaric acid is changed to
chelate ring complex in rice plants (see also, Deuel, 1954). The chelate
complexes of fusaric acid are furthermore insoluble in water. The chelate
complex may be one of the products of metabolism of fusaric acid, but
whether any other products are also formed side by side with this are
unknown.
*) For undertaking some of the investigations in this line the writer is gratefulto Mr. D. Klupfel.
Phytopath. Z., Bd. 25, Heft 4 24

366 SANWAL
I. Decarboxylation of C14-marked fusaric acid in plantsunder different conditions
If fusaric acid is decarboxylated and no other change takes place in thefusaric acid molecule, 3 n-butylpyridine is obtained:
/\
HOOC
C4H9
Fusaric acid
+ c»o2
V3 n-butylpyridine
If such a series of events occured in the tomato plants, after applicationof fusaric acid, we would not only get radioactive C02 coming out from
the plants, but also a product which is more toxic than the fusaric acid
itself. The extent of C1402 evolution by the plants after uptake of the
minimal dose of C14-marked fusaric acid had to be known before we started
isolating the hypothetical 3 n-butylpyridine from the tissues.
Tomato cuttings were allowed to take up C14-marked fusaric acid
(approx. 150 mg./kg. fresh weight, at a concentration of 5.0 X 10—3 molar)under a bell jar provided with a C02-free air circulation devise. The C02evolved by the plants was collected in 2 N NaOH. Immediately after the
plants had taken up by transpiration pull the required amount of fusaric
acid, the cuttings were immersed in a 0.01 M NaH2P04 (Weintraub et al,1952 a) solution in order to minimize the retention of carbon-dioxide. CO»
was collected each 24 hour period for 3 days, converted to barium carbonate
as described earlier (cf. section B, IV) and counted under a GM counter. The
obtained counts were calculated to the activity of 'zero thickness' (page 345).
a) Effect of pH
pH?,2pH4,Z
pH 80
o « 4a n o » « 7? Houm d ?« « n
Fig. 14. Decarboxylation of
carboxyl marked fusaric acid
in tomato plants at different
pH values.
Axis: Time in hours.
Ordinate: Percentage of ap¬
plied radioactivity (as fusaric
acid) in 0402 evolved by the
plants
of C14-marked fusaric acid on
C1402 evolution
The tomato cuttings of approximately the
same age and height were allowed to take upfusaric acid at pH 4.3, 6.0 and 7.2 respectively.In each series, six plants were included and
C1402 was collected for 3 days and analysed at
every 24 hours interval. The results are givenin figure 14. It will be seen that the carboxylgroup of fusaric acid is broken down in the
plant cells. At all the three pH values, the C1402evolution is at first slow and increases after
24 hours of application. At the end of 72 hours
of application approximately 10% of the fusaric
acid originally applied is broken down. The
pH of the applied fusaric acid
seems to play a very minor role
in its breakdown by plant cells.

Investigations on the metabolism of Fusarium lycopersici Sacc- 367
' Darkness Ught
Maximum breakdown within a 72 hour period after application is
achieved when the original application was at a pH of 4.3. However, duringthe course of these experiments it was consistently noted that the amount
of decarboxylation of fusaric acid varied very much with individual plants.Even when the plants were of the same age and grown under the same con¬
ditions and handled the same way experimentally, a
variation of 15—20 % in the results was easily obtained.
Fig. 15. Decarboxylation of carboxyl marked fusaric acid in
tomato plants kept under complete darkness and continous
light at pH 4.3.
Axis: Time in hours.
Ordinate: Percentage of applied radioactivity (as fusaric acid)in C14C>2 evolved the plants
0 U 49 72 hours 0 X 48 U
b) Effect of continuous light and continuous
darkness on the breakdown of fusaric acid
As stated earlier, the experiments above reported were conducted under
continuous light. Since light has an important bearing on the C02 exchangein the plants, it might indirectly affect the breakdown of fusaric acid. The
entire experimental set up was the same as above, except that the bell jarcontaining the plants was wrapped up on all sides with black paper. Figure 15
represents the results of this investigation. It will be seen from the histogram,that within the limits of the experimental error, the C1402 evolved
by the plants after uptake of C14-marked fusaricacid at a pH of 4.3 is about the same in light as
well as in darkness. Light or darkness has, therefore, no effect on
the decarboxylation of the fusaric acid molecule.
II. The intermediate products of metabolism of fusaric acid
One of the ways to understand the mechanism of action of a toxin is
to find out how it is catabolized by the plants. In general, a toxin can affectthe plant cells in two ways: 1. As the original molecule, e. g., by permeabilitydistortions, coagulation of the protoplasm and so on and 2. by gettingchanged in tissues to substances which in their turn are more toxic to the
plant cells. It is also possible that both these mechanisms simultaneouslyoperate in causing injury to the plant cells. With reference to plant toxins,e. g., lycomarasmin, much evidence exists that they affect the plant cells
mainly as chelate complexes (Gaumann and Naef-Roth, 1954 a, 1954 b;Deuel, 1954). The fusaric acid molecule also possesses a great chelating power(Tamari and Kaji, 1952 a, 1952 b) and naturally, a possibility exists that itis chelated in the plants with the various metal ions.
Besides the mode of action of toxins on plant cells, it is interesting to
find out how the plant cells defend themselves, chemically speaking, againstthe action of the toxins. We know a good deal about the morphological
24*

368 S A N W A L
defence mechanisms in the plants against the invasion by the parasite and
its toxins (Gaumann, 1951 b), but we have no such knowledge regardingthe chemical defence mechanisms against the penetrating toxins. One wayof defence would be by detoxicating the toxins through conjugation reactions
or through the action of enzymes. In animal cells, for instance, many mecha¬
nisms of detoxication are known (Williams, 1947). To give but one example,the ingested pyridine ring (along with the derivatives of pyridine) undergoesmethylation in animal body and is rendered harmless. Thus nicotinic acid
or nicotinamide, once introduced in the animal body undergoes transforma¬
tion to N'-methylnicotinamide and trigonelline (N'-methylnicotinic acid).Again, in dogs injected pyridine, a highly toxic compound, undergoes similar
methylation and in this way is excreted out of the body in a harmless form.
Although not directly demonstrated, a similar possibility perhaps also exists
for cr-picolinic acid. In certain mussels, like Area noae, homarine (N'-methyl-picolinic acid) is regularly found and this arises perhaps through the methyl¬ation of a-picolinic acid. Such mechanisms have, however, not yet been
demonstrated in plants, but there is no reason why they should not occur
here. The presence of numerous betaines and trigonelline in plants shows
that methylation reactions play an important part here as in animals, and
we should expect to find in plants also certain detoxication reactions.
To investigate the fate of fusaric acid and numerous other questionsraised above, the following procedure was adopted:
4 tomato cuttings (fresh weight, 5.7 gms.), were allowed to take up
with the transpiration stream a required dose of C14-marked fusaric acid at
a pH of 4.3 (approximately 150 mg./kg. fresh weight). The cuttings were
then left in tap water for 48 hours and at the end of this period, ground very
thoroughly in a mortar in order to break the plant cells. The ground up
material was placed in a percolator and extracted for 24 hours with about
800 ml. 85 %> ethanol. The extract was concentrated to about 100 ml. under
reduced pressure at room temperature and the solid particles, pigments etc.,
removed by centrifuging the water extract. Radioactivity was measured in
the solid material by oxidizing the samples as described elsewhere. The
dirty-white extract was alkalinized with N NaOH and extracted in a
Kutscher-Steudel apparatus for 72 hours with ether (refered to further as
extract I). The original water extract was then adjusted to a pH of 4.0 with
N HCl and again extracted with ether in a Kutscher-Steudel apparatus for
72 hours (refered to as extract II). Extract I, II and the original water
extract (extract III) were then evaporated to dryness, oxidized by van Slyke
wet oxidation and the radioactivity measured. The results are given in
table 4.
It will be seen from table 4 that a large fraction of the applied radio¬
activity appears in the ethanol extract (54.5 %>), but a large amount is also
converted into an alcohol-insoluble fraction (28.3 %>) which cannot be, there¬
fore, extracted from the plants. That some fusaric acid remains unconverted
is also indicated from the above figures. We would expect to recover all the

Investigations on the metabolism of Fusarium lycoperski Sacc. 369
Table 4
The radioactivity in various fractions of an alcoholic extract
of tomato plants which had taken up a minimal dose of C14-
marked fusaric acid at a pH of 4.3 (Total radioactivity applied= 73 525 counts/mt. as barium carbonate)
Extract number
Total radioactivitycorrected to infinite
thickness.
Counts/mt.
percentage of
applied radioactivity
Pigments and small solids after removal
Extract I
20 808
312
5 367
24 851
9 852
28.3
0.4
7.3
33.8
13.4
Percentage of total radioactivity recovered 61 190 83.2
unchanged fusaric acid, if any present, in extract II, and as the results show,this fraction shows the greatest activity. The basic and neutral substances
(extract I and III) also contain a small amount of radioactivity. It is thus
clear from the table, that after 48 hours of application, the fusaric acid is
metabolized by the plants and converted into different metabolic products.It will be seen (table 4) that only 82.2 % of the radioactivity origin¬
ally applied is recovered by our methods. A part of the applied radio¬
activity no doubt escapes as C1402 and the rest may be due to sampling and
experimental errors. The results given in the table are roughly quantitativebecause the fractionation procedures involve a certain amount of error.
The next step in the above investigation was naturally to identify the
various products of metabolism. Since the isolation of the metabolic pro¬
ducts of fusaric acid involved highly empirical procedures, we took recourse
to the following method for a rough identification:
Three tomato cuttings weighing 4.2 gms. (fresh weight) were allowed
to take up 0.6 mg. of C14-marked fusaric acid in a concentration of
5.0 X 10—3 molar at a pH of 5.0. The total radioactivity of the appliedfusaric acid was approximately 1.2 X 10⁶ disintegrations per minute. After
48 hours of application, the plants were gathered together and alongwith a little sand were thoroughly ground up in a mortar. The whole
mass was extracted in a percolator as elsewhere described and the
extract divided into basic, acidic and neutral components by alkali partitionand extraction with ether. Each of the extracts was concentrated to a volume
of 0.5—1.0 ml. (depending upon the radioactivity of the extracts) at room
temperature under reduced pressure. Approximately, a total of 0.1 ml. of
each of these concentrates was applied on the starting point of Whatman
no. 1 chromatographic paper by successively applying each time a 0.001 ml.
drop and drying. Components of each one of these three extracts were
separated unidimensionally by allowing the chromatogram to run in a

370 S A N W A L.
Butanol, acetic acid and water solvent (45 : 5 : 50). After separation, the
chromatograms were dried at room temperature for 12 hours and strips of
the chromatogram, containing the separated components, scanned with a
GM counter (see section B, IV). Figures 16, 17 and 18 represent the radio-
chromatograms of the separated components of the plant extracts obtained
after 48 hours of introduction of radioactive fusaric acid in the tomato
cuttings.It will be seen from the figures, that the acidic ether soluble fraction
contains but one radioactive constituent with a R{ of approximately 0.84.
This is most probably the unchanged fusaric acid. The neutral extract con¬
tains two radioactive constituents with Rf of 0.20—0.22 and 0.51—0.54
respectively, and the basic extract contains only one radioactive spot havinga Rj of 0.61—0.63. The small spot with a Rf of 0.21—0.22 on this chroma¬
togram is probably the same as the spot occupying the same position on the
chromatogram of neutral con¬
stituents of the plant extract.
It is very likely that many
more products of fusaric acid
metabolism occur in the plantextract, but they are not demon¬
strable with our techniques. Onlythose metabolic products of
fusaric acid are demonstrable
here which still retain the C14 of
the carboxyl group originallymarked in the fusaric acid mole¬
cule. We yet do not know how
the butyl-chain of the fusaric
acid molecule is metabolized.
A further identification of
these metabolic products of
fusaric acid is difficult. Work in
this direction is still beingcarried on in this Institute and
will be reported elsewhere.
Now we can summarise the
results of our investigation as
follows:
Fusaric acid, after intro¬
duction in the tomato plants, is
metabolized and probably the
following products are formed:
1) Converted into alcohol
insoluble fraction in the plants(chelated with metal ions?).
fl,-asi-05<
Fig. 16. Radiochromatogram of neutral, water
soluble fraction of plant extract
Rr-0,S4laxV C/ml
3000-
2XO -
«X»-
oL£
Fig. 17. Radiochromatogram of ether soluble,acidic fraction of plant extract
ft,-o,si-o,es
Fig. 18. Radiochromatogram of ether soluble,basic fraction of plant extract

Investigations on the metabolism of Fusarium lycopersici Sacc. 371
2) Carboxyl group of the molecule broken down with the productionof CO2 and perhaps 3n-butylpyridine (if we assume that the butyl-chainremains intact after decarboxylation).
3) Converted into water soluble, neutral substances with a Rf of
0.20—0.22 and 0.51—0.54 in butanol"acetic acid-water solvent.
4) Converted into very small amount of basic, ether soluble substance
with a R£ of 0.61—0.63 in butanol-acetic acid-water solvent.
5) A large amount remains unchanged as fusaric acid. This might
represent the excess beyond the quantity of fusaric acid required to cause
damage in the plants.The above is only true for the carboxyl group of the fusaric acid mole¬
cule. We yet do not know how the side chain of the molecule is metabolized
and what products are formed.
III. Quantitative breakdown of fusaric acid in plants
It has been demonstrated above that some fusaric acid remains un¬
changed in the plants after uptake of a minimal dose (approx. 150 mg./kg.fresh weight). If fusaric acid affects the plant cells as such, i. e., unchanged,we should expect to recover a major part of the applied fusaric acid from
the plants which have been allowed to take up this substance. Pertinent here
is also the question that we raised in the introductory part of this problem,viz., if fusaric acid is secreted by the invading pathogen in the host, it may
not always be possible to detect it if it is quickly metabolized by the plantcells. According to the working hypothesis we propose for the injuriouseffect of the fusaric acid is that it is metabolized into some substance which
is much more toxic to the plant cells than the original fusaric acid molecule,and this substance is of major importance as regards the production of
damage; the remaining fusaric acid, after uptake by the plants, either
remains as such or is converted into a number of substances which we have
already demonstrated above, and which might be the products of detoxi-
cation reactions in the host cells. If our concepts were true, we would
recover from the plants only that amount of fusaric acid which representedthe excess beyond that required for causing damage. Thus, if we were to
give the plants lesser and lesser quantities of fusaric acid, we would expect
to recover correspondingly lesser quantities of free fusaric acid till the time
a minimum dose is reached, after which no more free fusaric acid could be
recovered from the plants after application. That in substance, at least, our
hypothesis is valid is shown below.
The quantitative breakdown of fusaric acid in tomato cuttings was
investigated by the help of isotope dilution technique (Calvin et al, 1949).The procedure adopted was as follows:
3 tomato cuttings were allowed to take up C14-marked fusaric acid at
a concentration of 2.5 X 10⁻³ molar in the required dose. After 48 hours
of uptake, the plants were ground up thoroughly with sand in a mortar.

372 SANWAL
The material was extracted in a percolator at room temperature with about
800 ml. of 80 % ethanol for approximately 24 hours. The extract so obtained
was concentrated to about 100 ml. under reduced pressure at room tempe¬
rature. The pigments and other solids were removed by filtration. To the
water extract was added a known quantity of pure inactive fusaric acid as
carrier. The pH of the solution was adjusted to 8.0 and it was extracted
with ether in a Kutscher-Steudel apparatus for 72 hours to remove fattysubstances, pigments and oils etc., which otherwise interfere in the final
crystallization of fusaric acid. The water extract was again adjusted to a
pH of 4.0 and extracted with ether for 72 hours. This ether extract was
evaporated to dryness under reduced pressure at room temperature. The
remaining dry solids were extracted 4 times, each time for two hours with
30 ml. quantities of petroleum ether under a reflux condensor. The petroleumether extract was again evaporated to dryness under reduced pressure. The
remaining solids were then extracted with 40 ml. of boiling Hexan under a
reflux condensor for about 1 hour and the fusaric acid crystallized out
from this solution at 0 ° C. The fusaric acid crystals so obtained were purifiedby repeated crystallizations from boiling Hexan till the time constant radio¬
activity was obtained. This required generally two crystallizations. A further
check on the purity of the isolated fusaric acid was made by determination
of the melting point. The pure isolated fusaric acid was divided in three
lots (each 2—4 mg., depending upon the quantity isolated) and each lot
oxidized by the van Slyke wet combustion method and radioactivity deter¬
mined by counting the barium carbonate samples. A mean of three readingswas taken. The amount of fusaric acid isolated from the plants was calcu¬
lated from the following formula:
b
where a = mg. of C14-marked fusaric acid remaining in the extract (unknown); b =
mg.of inactive fusaric acid added as carrier; Z = ratio of the specific activity of C14-marked
fusaric acid (counts per minute/mg. of radioactive substance) to the specific activity of
the isolated fusaric acid sample (counts per minute/mg. isolated fusaric acid).
Table 5 shows the results of this investigation.
Table S
The quantity of fusaric acid metabolized by the tomato plantsduring 48 hours after uptake of a dose of C14-marked fusaric
acid
No.
Amount of
fusaric acid
given per gm.
plant material
pHof solution
Amount of
inactive
fusaric acid
added (b)
Ratio of
sp. activities
(Z)
mg. unchangedfusaric
acid/gm. plant(a)
percentagemetabolized
in plants
1.
2.
3.
0.2454 mg.0.2432 mg.0.1207 mg.
6.0
4.3
4.3
48.8 mg.
29.7 mg.32.9 mg.
199.2
73.1
671.8
0.0456
0.0557
0.0085
81.4%
77.6 °/o93.1 %

Investigations on the metabolism of Fusarium lycopersici Sacc. 373
Table 5 shows clearly that fusaric acid is quickly metabolized by the
plants and at the end of a 48 hour period, only a very small quantity of
the applied fusaric acid can be extracted out of the plants. Within the limits
of experimental error, the quantity of fusaric acid broken down is the same
even if the pH of the applied fusaric acid is varied. The quantitative break¬
down of fusaric acid by the plant tissues is, therefore, not pH dependent.
Another fact we note from the table is that with decreasingdoses of fusaric acid, correspondingly more is
metabolized by the plant cells. Thus, when 0.24 mg. of
fusaric acid is allowed to be taken up per gram of plant material, then
77.6 % of the applied quantity is metabolized by the plants at the end of
a 48 hour period. When only half of this amount (0.12 mg.) is applied per
gram of plant material, correspondingly more, i. e., 93.1 % of the applied
quantity is metabolized. Thus a stage would be reached, when with still
smaller quantities of fusaric acid, no more would be isolated in the free
state, i. e., all would be metabolized by the plants.
The results obtained with fusaric acid are approximately the same as
with patulin (clavacin), a toxin produced by certain Aspergillus species and
other fungi (Miescher, 1950). Patulin combines in the tomato plants with
the free -SH groups of biological importance and this accounts for its
toxicity. Miescher (1950) has demonstrated that any quantity of patulinbelow 300 mg. per kg. fresh weight, once introduced in the tomato plantscannot be recovered back. Only quantities beyond this range remain un¬
changed in the plants because no more free -SH groups are available in the
cells to combine with patulin in excess of the 300 mg./kg. limit.
In case of fusaric acid, however, such a simple relationship does not
exist. Fusaric acid is metabolized by the plant cells and converted into
numerous related substances. In our opinion some of the metabolic productsare non-toxic but others are perhaps much more toxic than fusaric acid
itself. To find out which of the metabolic products of fusaric acid are
responsible for injury to the plant, we shall have to purify each one of the
metabolic products and then test its activity with tomato plants. Such experi¬ments are in progress and shall be reported on later.
F. Discussion
Dealing with wilt-diseases in plants, the toxin theory of disease has
been emphasized for some years (Gottlieb, 1944 b). According to this
theory, part of the symptoms on the host are directly ascribable to certain
toxic metabolic products secreted by the pathogen in vivo. One of the most
investigated organism in this regard has been Fusarium lycopersici, causingthe wilt of tomato. Most of the symptoms naturally present on the diseased
tomato plants can be reproduced when the cell-free culture filtrates of the
pathogen are applied to the tomato cuttings (see, Introduction).

374 SANWAL
A very strong indirect evidence exists that all the wilting-toxins are
also secreted by the pathogen in vivo (Gaumann, 1951 a). However, theyhave never been isolated from the diseased plants. This is perhaps due to
the fact that toxins, once secreted by the pathogen in the host, are meta¬
bolized by the plant cells or converted into entirely different substances.
For this reason it might not be possible to isolate these toxins from the
diseased tomato plants in their original form. Evidence of other
kind was, therefore, to be had to ascertain whether the metabolic productsof the pathogen in vivo bear any relationship with the symptoms on the
host. This necessitated the need for a clear understanding of the mode of
toxin production in vitro in order to correlate such studies with in vivo
metabolism of the pathogen.We succeeded in demonstrating that the toxin production varies quanti¬
tatively from one strain to another under the same set of environmental
conditions (Gaumann, Naef-Roth and Miescher, 1950; Kern, 1952).
However, when these environmental conditions are changed, the quantityof toxin produced correspondingly changes. Thus, in Richard's medium strain
257 (avirulent) produces much more toxin (fusaric acid and lycomarasmin)than strain R-5-6 (virulent), but when the constituents of the Richard's
medium are varied (specially carbon and nitrogen), the strain producing less
toxin (R-5'6) produces more than the strain 257 (avirulent). When glucoseis replaced by glycine as the exclusive carbon source, toxins are still pro¬
duced. There is no reason why the virulent strains accordingly may not
secrete more toxins in the host, as compared with the avirulent ones, where
the chemical environment is different from the laboratory.
Restricting ourselves to fusaric acid, one of the known toxins produced
by F. lycopersici, evidence is presented to show that it is not a direct productof sugar dissimilation, but is synthesized by the pathogen from some other
secondary dissimilatory products, like amino-acids. Growth, amount of sugar
consumed and pH bear no relationship with fusaric acid production in vitro.
When various nitrogen containing compounds in the cultures are analysed,it is found that fusaric acid production bears a relationship with the amino-
acid formation in culture medium. A strong probability exists that fusaric
acid is produced from some amino-acid precursors. Fluck and Richle (1955)as a result of paper chromatographic studies have suggested that alanin and
citrullin may be involved in the biosynthesis of fusaric acid. Further, fusa¬
ric acid is produced by actively metabolizing,
young mycelium and the greatest amount is pro¬
duced with 12 — 18 days time (compare Kern, 1952). This is
at about the same time that the disease symptoms are visible in the infected
tomato plants.The studies on the metabolism of F. lycopersici in vivo with the help
of 2-C14-glycine demonstrate that certain symptoms on the host, viz., vein-
clearing (Foster, 1946) are directly related to the secretion of metabolic
toxic products of the pathogen. Thus, when tagged mycelium of F. lyco-

Investigations on the metabolism of Fusarium lycopersici Sacc. 375
persici is introduced into tomato plants, it secretes certain marked substances
which reach in the leaves far away from the infec¬
tion centers in the stems. The leaves showing vein-clearingaccumulate more than 4 times the radioactivity present in the healthy leaves
on the same plants. Significant here are also the results obtained by Davis
(1954) who demonstrated by grafting techniques that non-tomato scions
show injury from the toxins of the pathogen present in the tomato stocks,although no mycelium is present in the scions.
By the help of radioautographic techniques, it is demonstrated that a
metabolic product, perhaps similar to vasinfuscarin, is secreted by the
pathogen in vivo. This toxic metabolic product is closely associated with
the vessels showing browning and is precipitated on the walls of the vascular
elements, when tissue sections are fixed in methanol. Since it is not demon¬
strable in healthy vessels of the diseased plants by methanol fixation, it is
assumed that this toxin is not transportable to greater distances in the stems
and is perhaps adsorbed on the walls of the vascular elements just beyondmycelium.
Apart from the toxins, the pathogen secretes a number of substances
which are seemingly non-toxic to the host. A complete chemical analysis of
the plants inoculated with tagged mycelium (both virulent and avirulent
strains) shows that the principle substances secreted are proteins,amino-acids, sugars and various other uncharacterized acidicand basic substances. With our techniques, only the substances formed
from the methylene group of glycine can be demonstrated because only the
carbon of the methylene group was marked. There is no doubt that with
another source of carbon used for tagging the mycelium (like glucose and
sucrose) many other substances would be detected. There is apparently no
qualitative difference in the substances secreted by the different strains
(virulent as well as avirulent) of the pathogen. The main difference, keepingin view the limitations of our technique, is perhaps of a quantitative nature.
Thus the virulent strain secretes more substances of protein nature in vivo
than the avirulent strain. This is perhaps quite an expected fact, since both
strains are capable of producing toxins in vitro but the avirulent strain
cannot do so in vivo because it is kept in check in the vicinity of the focusof infection by the unknown resistance factors of the host (Gaumann, 1951 b;Kern, 1952).
All the facts described so far lend support to the toxin theory of disease
in the case of tomato wilt. According to Scheffer and Walker (1953),who studied the mechanism of wilt production in tomato plants due to
F. lycopersici, the pathogen is present in all parts of the plant showingsymptoms, specially vascular browning, leaf necrosis etc. They concluded
therefrom that translocable toxins are not produced by F. lycopersici and
majority of disease symptoms are caused by an impediment to water move¬
ment in the diseased stems. In contradiction to these authors, experimentsconducted in this Institute by Dr. Stephi Naef-Roth (unpublished) demon-

376 SANWAL
strate that from many tissues of the plants, showing very severe disease
symptoms, the pathogen cannot be isolated out except from the vessels
showing vascular discolouration. However, it is an undeniable fact that
physiological disturbances contribute to the presence of some symptoms on
the plant, but it is also equally undeniable that many other symptoms (likevein-clearing and vessel browning etc.) can be ascribed to the secretion of
certain translocable toxic substances by the pathogen in vivo. Davis (1954)has further demonstrated that the association of the mycelium to the regionsshowing symptoms on the plants does not conflict with the idea of toxins
also bringing about the symptoms in question.
Fusaric acid, after application at a minimal dose of 150 mg. per kg.fresh weight, is metabolized by the plants in various ways. Some of the
applied fusaric acid is decarboxylated, some is bound up by the plant cells,some is converted into closely related substances and some remains unchanged.Approximately, up to 30 % of the fusaric acid is converted in the plantsinto an alcohol-insoluble fraction. Since fusaric acid forms chelate
ring complexes with metal ions (Tamari and Kaji, 1952 a, 1952 b, 1953 a),a possibility exists that this alcohol insoluble fraction represents such com¬
plexes of fusaric acid with metal ions in the cells. About 10 % of the appliedfusaric acid is decarboxylated with the production of C02 and perhaps3 n-butylpyridine, if we assume that the butyl side-chain remains intact in
this process. 3 n-butylpyridine has a very toxic effect on the plant cells
and, if our assumptions are correct, part of the toxicity of fusaric acid
could be attributed to this substance. 20—25 % applied fusaric acid is con¬
verted into certain basic and neutral substances, which have not yet been
completely identified. From the experience of other authors on animal orga¬
nisms (Williams, 1947; Leifer, 1951) it is presumed that some of these
substances arise through N-methylation of the fusaric acid molecule and
may eventually represent the end products of certain detoxicating mecha¬
nisms on the part the plant cells. About 30 % of the initially applied fusaric
acid remains in a free form and may represent the excess beyond that
required for causing injuries to the plant cells.
Perhaps there are a number of other products of metabolism of the
side-chain of fusaric acid, but they could not be demonstrated with our
techniques, because the fusaric acid was labeled only in the carboxyl group.
When fusaric acid is introduced in smaller doses in the tomato cuttings,comparatively much more is metabolized by the plants. Thus, at a concen¬
tration of about 200 mg. per kg. fresh weight, about 77 °/o fusaric acid is
metabolized, while at 100 mg. per kg. fresh weight nearly 95 % is meta¬
bolized. In this way, with still lower doses of fusaric acid, a stage would
be reached when no more free fusaric acid would be present in the plants.This gradual increase in the total quantity of fusaric acid metabolized bythe plants with decreasing quantities of applied fusaric acid is perhapsdue to the fact that with decreasing doses, fusaric acid is converted prefe¬rentially into some substance or substances, which are then responsible for

Investigations on the metabolism of Fusarium lycoperski Sacc. 377
casuing injury. For verification of this hypothesis, the plant material will
have to be fractionated everytime after uptake of diminishing doses of
C14-labeled fusaric acid and demonstration of preferential conversion into
some definite substance. Such studies are in progress. The situation with
fusaric acid would, therefore, be materially similar to patulin (Miescher,1950; Gaumann, 1951 a). Patulin combines with thiol groups of biologicalimportance and when it is applied to the plants, only that amount can be
extracted back which is in excess of the amount required to saturate all the
-SH groups.
The question of in vivo production of toxins can now be discussed in
the light of the above facts. It has been demonstrated with a very great
degree of certainty that Fusarium lycopersici produces toxins in the plants.These toxins are difficult to isolate from the diseased plantsbecause they are partly metabolized and converted into other substances
by the host (formation of chelate complexes of lycomarasmin, decarboxy¬lation of fusaric acid etc.). Dimond and Waggoner (1953), discussing the
role of toxins in disease production, have distinguished between two category
of toxins. 1. Those produced in vitro and 2. those produced in vivo. The
latter have been called 'vivotoxins'. Among the criteria laid down for the
demonstration of vivotoxins, is their extraction from the diseased plants in
a pure form and production of symptoms on healthy plants when this
extracted toxin is applied to them. As an example of a true vivotoxin,Dimond and Waggoner cite the case of the toxin produced by Pseudomonas
tabaci (Braun, 1950) which can be isolated from the diseased plants. The
arguments given by Dimond and Waggoner are substantially correct with
the restriction that some toxins can be isolated only in a metabolized form
and not in their original state. In these cases, of course, direct evidence for
the presence of toxins in diseased plants will be possible only with an exact
knowledge of the mechanisms of action of these toxins.
Summary
1. It has been shown that a quantitative change in the constitution of
Richard's medium causes a corresponding change in the quantity of toxins
produced by the various strains of F. lycopersici Sacc. Thus, the virulent
strain, producing lesser amounts of toxins (used in the widest sense of the
word) in Richard's medium, produces more than the avirulent strain (257)when the quantities of carbon and nitrogen are varied in the medium.
2. With glycine as the exclusive carbon source in the medium, F. lyco¬persici produces all the three known toxins (vasinfuscarin, fusaric acid and
lycomarasmin).3. In the biosynthesis of fusaric acid the amino-acids seem to play a
significant role and it is possible that some of them (like alanine and
citrulline) serve as precursors of fusaric acid.

378 SANWAL
4. F. lycopersici can be tagged after growth for 5—8 days in a medium
containing 90 fiClml. of 2-C14-glycine. At this level of radioactivity about
40 % of the fungal cells become inviable but the fungus does not lose it's
virulence.
5. The tagged mycelium, when inoculated into healthy tomato plants,secretes certain radioactive toxic components responsible for 'vein-clearing'
symptoms on the leaves and vascular browning on the stems.
6. All the metabolic products of the tagged pathogen in vivo are not
of a toxic character; some apparently are non-toxic.
7. The tagged virulent and avirulent pathogens secrete, among other
substances, proteins, amino-acids, sugars and certain un-
characterized acidic and basic substances. The virulent patho¬gen secretes more than 4 times the protein sub¬
stances secreted by the avirulent pathogen in vivo.
8. C14-labeled fusaric acid is metabolized when introduced into the
tomato cuttings in the minimal dose (150 mg./kg. fresh weight). About
10 °/o is decarboxylated with the production of C1402 and perhaps 3 n'butyl-pyridine. About 30 °/o is converted into alcohol insoluble fraction (chelatedwith metal ions?) and about 20 °/o into certain neutral and basic substances.
In paper chromatograms, the neutral substances have a Rf of 0.20—0.22
and 0.51—0.53 in butanol, acetic acid and water solvent and the basic
substances an Rf of 0.62—0.65. Approximately 30 °/o of the applied fusaric
acid remains unchanged. This latter perhaps represents the quantity in excess
of that required for causing injury to the plants.9. A possibility is shown to exist that some of the metabolic products
arise by N-methylation of fusaric acid, representing perhaps the end pro¬
ducts of detoxicating mechanisms possessed by the host cells.
10. With decreasing doses of fusaric acid less and less amount of free
fusaric acid (unmetabolized) remains in the plants. Thus, at about 200 mg./kg.fresh weight, about 77 °/o of the applied fusaric acid is metabolized, while
at 100 mg./kg. about 93 °/o is metabolized by the host cells.
11. Fusaric acid causes injury perhaps by getting converted into some
more toxic substances in the plants.
12. From a careful study of the results obtained in this work arguments
are given for the role of toxic substances secreted by the pathogen in vivo
in the production of an over-all disease picture on the host.
Zusammenfassung
1. Auf Richard-Nahrlosung (S. 336) bildet der in dieser Arbeit verwendete
nicht pathogene Stamm von Fusarium lycopersici Sacc. mehr Toxine (imweitesten Sinne des Wortes) als der pathogene Stamm. Wird jedoch in der
Nahrlosung das Mengenverhaltnis von C und N verandert, so kann die

Investigations on the metabolism of Fusarium lycopersici Sacc. 379
Toxinproduktion des pathogenen Stammes grofier werden als diejenige des
nicht pathogenen Stammes. Die Toxinbildung eines bestimmten
Stammes ist also nicht konstant, sondern von der Ernahrung a b -
h a n g i g.
2. Fusarium lycopersici vermag mit Glykokollals einziger C-Quellealle drei von ihm bis jetzt bekannten Toxine (Vasinfuscarin, Fusarinsaure
und Lycomarasmin) zu bilden.
3. Bei der Biosynthese der Fusarinsaure durch Fusarium lycopersicischeinen Aminosauren als Vorstufen eine bedeutende Rolle zu spielen. Nach
den bisherigen Untersuchungen sind vor allem A1 a n i n und C i t r u 11 i n
an diesen Vorgangen beteiligt.
4. Wachst Fusarium lycopersici wahrend 5 bis 8 Tagen in einem Medium,das radioaktives Glykokoll enthalt (mit C14 markiert; 90 /uC/ml), so wird
das Myzel radioaktiv markiert. Unter diesen Versuchsbedin-
gungen bleiben etwa 60 °/o der Konidien keimfahig, und der Pilz behalt seine
Pathogenitat bei.
5. Werden gesunde Tomatenpflanzen mit markiertem Myzel von Fusa¬
rium lycopersici infiziert, so scheidet der Pilz radioaktive Stoffwechsel-
produkte in die Wirtspflanze aus. Einige von ihnen sind nicht toxisch; andere
sind toxisch und verursachen an Stengeln und Blattern charakteristische
Krankheitssymptome.
6. Bei den in die Wirtspflanze ausgeschiedenen Stoffwechselproduktenhandelt es sich vor allem um Proteine,Aminosauren und Z u c k e r.
Der pathogene und der nicht pathogene Stamm unterscheiden sich vor allem
in der Menge der gebildeten Proteine; diese ist beim pathogenen Stamm
etwa viermal gro&er als beim nicht pathogenen.
7. Die einem Tomatensprofi verabreichte markierte Fusarinsaure wird
zum grofken Teil chemisch verandert. Bei einer Toxindosis von
150 mg je kg Lebendgewicht wurden in der hier verwendeten Versuchsan-
ordnung folgende Ergebnisse erhalten:
a) Rund 10 °/o der verabreichten Fusarinsaure werden decarboxyliert.Die Pflanze gibt C1402 ab; als erstes Spaltprodukt ware 3-n-Butylpyridinzu erwarten.
b) Rund 20 %> der Fusarinsaure werden in neutrale und basische Ver-
bindungen umgewandelt. Im Papierchromatogramm (mit einem Gemisch von
Butanol, Essigsaure und Wasser als Losungsmittel) wurden fiir die neutralen
Substanzen Rf-Werte von 0,20 bis 0,22 und 0,51 bis 0,53, fvir die basischen
Substanzen solche von 0,62 bis 0,65 gefunden.
c) Rund 30 % der verabreichten Fusarinsaure lassen sich mit Alkohol
nicht mehr herauslosen; ihr Schicksal konnte noch nicht untersucht werden.
d) Rund 30 °/o der verabreichten Fusarinsaure konnten in unveranderter
Form zuriickgewonnen werden. Sie sind moglicherweise fur das Zustande-
kommen der Schadigungen nicht von Bedeutung.

380 S A N W A L
8. Wird die Dosis der verabreichten Fusarinsaure herabgesetzt, so sinkt
audi der Prozentsatz der in der Pflanze nicht abgebauten Fusarinsaure. Bei
einer Dosis von 200 mg je kg Lebendgewicht konnten in einem bestimmtenVersuch 22 °/o der eingebrachten Fusarinsaure in unveranderter Form zurikk-
gewonnen werden, bei 100 mg/kg dagegen nur noch 7 °/o.
9. Die chemische Natur und die biologische Bedeutung der verschiedenen
Umwandlungsprodukte der Fusarinsaure konnten im einzelnen noch nicht
untersucht werden. Es kann lediglich vermutet werden, dafi einige der ent-
stehenden Verbindungen fur die Pflanze stark giftig, andere dagegen unwirk-
sam sind.
The above investigations were carried out at the Department of special Botany of the
Swiss Federal Institute of Technology under the guidance of Prof. Dr. E. Gaumann to
whom the writer is grateful for his consistent encouragement, advice and the most
intimate concern he showed in problems, both financial and scientific, arising from this
work. For numerous suggestions, criticisms and a careful study of the manuscript, the
writer is very thankful to Dr. H. Kern.
The investigations were financed by a generous grant by the Trustees of "Fritz
Hoffmann-La RocHE-Stiftung zur Untersttttzung biologischer Arbeitsgemeinschaften in
der Schweiz", to whom our thanks are due. The work was carried out during the
tenure of a fellowship first from the Swiss Coordination Commission for Technical helpand later from the "VoLKART-Stiftung", Winterthur (Switzerland). Grateful thanks are
expressed to the authorities concerned.
Some parts of the work were carried out in the Organic Chemistry Laboratories
of the Swiss Federal Institute of Technology under the direction of Prof. Dr. V. Prelog
and Dr. J. wursch, to whom the writer is grateful. Thanks are also due to PD. Dr.
E. Hardegger and Mr. E. Nikles for synthesizing the radioactive fusaric acid used in
this investigation and many other suggestions. Last, but not the least, the writer is
thankfoul to all his colleagues in the Laboratory, specially Dr. St. Naef-Roth, Miss
E. Bachmann and Miss M. Keckeis for help in many ways.
Literature cited
Anderson, C, Delabarre, Y., and Bothner-by, A. A., 1952: Chemical analysis and
isotopic assay of Organic compounds. Anal. Chem. 24, 1298—1303.
Blank, H., McCarthy, P. L., and DeLamater, E. D., 1951: A non-vacuum freezingdehydrating technique for histology, autoradiography and microbial cytology.Stain Tech. 26, 193—197.
Bogoroch, R., 1951: Detection of radioelements in histological slides by coating with
stripping emulsion. Stain Tech. 26, 43—50.
Braun, J. A., 1950: The mechanism of action of a bacterial toxin on plant cells. Proc.
Nat. Acad. Sci., U. S. 36, 423—437.
Brown, W., 1936: The physiology of host parasite relations. Bot. Rev. 2, 236—287.
Burrows, W., 1951: Endotoxins. Ann. Rev. Microbiol. 5, 181—196.
Calvin, M., Heidelbergeb, C, Reid, J. C, Tolbert, B. M., and Yankwich, P. E., 1949:
Isotopic Carbon. John Wiley & Sons, New York.
Clauson-Kaas, N., Plattner, Pl. A., and Gaumann, E., 1944: Ober ein welkeerzeugen-des Stoffwechselprodukt von Fusarinm lycoperski Sacc. B. Schweiz. Bot. Ges. 54,523—528.

Investigations on the metabolism of Fusarium lycopersici Sacc. 381
Davis, D., 1953: The role of enzymes in the etiology of Fusarium wilt of tomato. Phyto¬pathology 43, 470.
, Waggoner, P. E., and Dimond, A. E., 1953: Conjugated phenols in the Fusarium
wilt syndrom. Nature 172, 959—960.
,1954: The use of intergeneric grafts to demonstrate toxins in the Fusarium wilt
disease of tomato. Amer. J. Bot. 41, 395—398.
Deuel, H., 1954: Ober Storungen des Spurenelementhaushaltes der Pflanzen durch Welke-toxine. Phytopath. Z. 21, 337—348.
Dimond, A. E., and Waggoner, P. E., 1953 a: On the nature and role of vivotoxins in
plant disease. Phytopathology 43, 229—235.
,and
,1953 b: The physiology of lycomarasmin production. Phytopathology
43, 195—199.
,and
,1953 c: The water economy of Fusarium wilted tomato plants. Phy¬
topathology 43, 619—623.
Endicott, K. M., and Yagoda, H., 1947: Microscopic histo-radiographic technique for
location and quantitative estimation of radioactive elements in tissues. Proc. Soc.
Expt. Biol. Med. 64, 170—172.
Evans, T. C, 1947: Radioautographs in which the tissue is mounted directly on the
photographic plate. Proc. Soc. Expt. Biol. Med. 64, 313—315.
Fitzgerald, J. P., Eidinoff, M. L., Knoll, J. E., and Simmel, E. B., 1951: Tritium in
radioautography. Science 114, 494—498.
Fluck, V., and Richle, K. H., 1955: Papierchromatographische Untersuchungen uber den
Aminosauren-Stoffwechsel von Fusarium lycopersici Sacc. Phytopath. Z. 24,
455—461.
Foster, J. W., 1949: Chemical activities of fungi. Academic Press Inc., New York, N. Y.
Foster, R. E., 1946: The first symptom of Fusarium wilt: clearing of the ultimate
veinlets in the leaf. Phytopathology 36, 691—694.
Gaumann, E., 1946: Types of defensive reactions in plants. Phytopathology 36, 624—633.
,1951 a: Problems of pathological wilting in plants. Adv. Enzymology 11,
401—437.
,1951b: Pflanzliche Infektionslehre. 2. Aufl, Basel.
,1951 c: Neuere Erfahrungen mit Welketoxinen. Experientia 7, 441—447.
, Naef-Rotii, St., and Miescher, G., 1950: Untersuchungen uber das Lycomarasmin.Phytopath. Z. 16, 257—288.
, ,et Kobel, H., 1952 a: L'acide fusarique, une seconde toxine de fletrisse-
ment produite par Fusarium lycopersici Sacc. C. r. Ac. Sc. Paris 234, 173—174.
,and
,1952 b: Uber Fusarinsaure, ein zweites Welketoxin des Fusarium
lycopersici Sacc. Phytopath. Z. 20, 1—38.
, ,and Ammann, A., 1952: Uber den Einflufi einiger Welketoxine und Anti-
biotica auf die osmotischen Eigenschaften pflanzlicher Zellen. Phytopath. Z. 19,
160—220.
, Kern, H., and Sauthoff, W., 1952: Untersuchungen iiber Welketoxine. Phytopath.Z. 18, 404—415.
, Stoll, Cii., and Kern, H., 1953: Uber Vasinfuscarin, ein drittes Welketoxin des
Fusarium lycopersici Sacc. Phytopath. Z. 20, 345—347.
,and Naef-Roth, St., 1954: Uber die chelierende Wirkung einiger Welketoxine.
Phytopath. Z. 21, 349—366.
,and
,1955: Uber die chelierende Wirkung einiger Welketoxine. II. Die
Verschiebungen der Toxizitat durch steigende Zusatze von Asche aus jungenTomatensprossen. Phytopath. Z. 23, 147—160.
Gothoskar, S. S., and Scheffer, R. P., 1953: Pectic enzymes in the physiology ofFusarittm wilt of tomato. Phytopathology 43, 472.
, , Walker, J. C, and Stahmann, M. A., 1953: The role of pectic enzymesin Fusarium wilt of tomato. Phytopathology 43, 535—536.
Phytopath. Z., Bd. 25, Heft 4 25

382 SANWAL
Gottlieb, D., 1943: The presence of a toxin in tomato wilt. Phytopathology 33,126—135.
,1944: The mechanism of wilting caused by Fusarium bulbigenum var. lycopersici.Phytopathology 34, 41—59.
Gross, A. V., and Snyder, J. C., 1947: Radioautography with C14. Science 105, 240—241.
Gross, J., Bogoroch, R., Nadler, N. J., and Leblond, C. P., 1951: The theory and
methods of the radioautographic localization of radio-elements in tissues. Amer.
J. Roentgenol. Rad. Therapy 65, 420—458.
Herz, R. H., 1951: Photographic fundamentals of Autoradiography. Nucleonics 9,24—39.
Hitchings, G. H., and Fiske, C. H., 1941: The determination of the purines. J. Biol.
Chem. 140, 491—499.
Hoffmann, P. F., and Zuckerman, B. M., 1954: Oak wilt fungus labeled with C14.
Science 120, 106.
Holley, R. W., Boyle, F. P., and Hand, D. B., 1950: Studies on the fate of radioactive
2,4-dichlorophenoxyacetic acid in bean plants. Arch. Biochem. 27, 143—151.
Kamen, M. D., 1951: Radioactive tracers in Biology, 2nd. Ed. Academic Press Inc.,New York.
Kern, H., 1952: Ober die Beziehungen zwischen dem Alkaloidgehalt verschiedener
Tomatensorten und ihrer Resistenz gegen Fusarium lycopersici. Phytopath. Z. 19,351—382.
,and Sanwal, B. D., 1954: Untersuchungen uber den Stoffwechsel von Fusarium
lycopersici mit Hilfe von radioaktivem Kohlenstoff. Phytopath. Z. 22, 449—453.
Kobel, F., 1951: Untersuchungen iiber toxische Stoffwechselprodukte von Nectria cinna-
barina (Tode) Fr. Phytopath. Z. 18, 157—195.
Leifer, E., Roth, L. J., Hogness, D. S., and Corson, M. H., 1951: The metabolism of
radioactive nicotinic acid and nicotinamide. J. Biol. Chem. 190, 595—602.
Linskens, H. F., 1955: Der Einflufi der toxigenen Welke auf die Blattausscheidungen der
Tomatenpflanze. Phytopath. Z. 23, 89—106.
Lissitzky, S., and Michel, R., 1952: Substances organiques marquees par les radio¬
isotopes. Bull. soc. Chim. France. 1952, 891—903.
Luz, G., 1934: Ober den Stoffwechsel von Fusarium lycopersici und Fusarium lirti.
Phytopath. Z. 7, 585—638.
McKenzdj, H. A., and Wallace, H. S., 1954: The Kjeldahl determination of nitrogen:A critical study of digestion conditions, temperature, catalyst and oxydizing agents.
Australian J. Chem. 7, 55—70.
Meyer-Schutzenmeister, L., 1950: Die physikalisdien Voraussetzungen fiir das Arbeiten
mit kiinstlichen radioaktiven Substanzen. Naturwiss. 35, 501—517.
Miescher, G., 1950: Ober die Wirkungsweise von Patulin auf hohere Pflanzen, ins-
besondere auf Solarium lycopersicum L. Phytopath. Z. 16, 369—397.
Morton, A. A., 1938: Laboratory technic in Organic Chemistry. New York.
Pearson, I. A., Hammer, J. M., Corrigan, K. E., Hayden, H. S., and Mallman, "W. L.,1950: Use of radioactive isotopes in the study of fungi and bacteria. Amer. J.Clin. Path. 20, 282—286.
Pelc, S. R., 1947: Autoradiographic technique. Nature 160, 749.
Pepkowitz, L. P., and Shive, J. W., 1942: Kjeldahl nitrogen determination. Ind. Eng.Chem. 14, 914—916.
Plattner, Pl. A., and Clauson-Kaas, N., 1944: Ober ein Welkeerzeugendes Stoff-
wechselprodukt von Fusarium lycopersici Sacc. Helv. Chim. Acta 28, 188—195.
, Keller, W., and Boller, A., 1954: Konstitution und Synthese der Fusarinsaure.
Helv. Chim. Acta 37, 1379—1392.
Pope, C. G., and Stevens, M. F., 1939: The determination of amino-nitrogen using a
copper method. Biochem. J. 3i, 1070—1077.

Investigations on the metabolism of Fusarium lycopersici Sacc. 383
Raynand, M., 1948: Dosage de l'ammoniaque dans les milieux biologique. Bull. Soc.
Chim. Biol. 30, 713—715.
Reid, A. F., Weil, A. S., and Dunning, J. R., 1947: Properties and measurement of C»«.
Anal. Chem. 19, 824—827.
Roche, J., Lissitzky, S., and Miciiel, R., 1954: Chromatographic analysis of radioactive
iodine compounds from the Thyroid gland and body fluids. In Glick, D., Methods
of Biochemical Analysis 1, 243—264.
Sanwal, B. D., 1955: Isotopentechnik in „Papierchromatographie in der Botanik",Ed. H. F. Linskens, Springer Verlag, Berlin.
Sauthoff, W., 1955: Ober toxische Stoffwechselprodukte in Kulturfiltraten von Botrytiscinerea Pers. Phytopath. Z. 23, 1—36.
Schaffer, P. A., and Hartmann, A. F., 1920: The iodometric determination of Copperand it's use in sugar analysis. II. Methods for the determination of reducing
sugars in blood, urine, milk and other solutions. J. Biol. Chem. 45, 315.
Schroeder, W. A., Kay, L. M., and Mills, R. S., 1950: Quantitative determination of
amino-acids by iodometric titration of their copper salts. Anal. Chem. 22,
760—763.
Scheffer, R. P., and Walker, J. C, 1953: The physiology of Fusarium wilt of tomato.
Phytopathology 43, 116—125.
Stoll, Ch., 1954: TJber Stoffwechsel und biologisch wirksame Stoffe von Gibberella
fujikuroi (Saw.) Woll., dem Erreger der Bakanaekrankheit. Phytopath. Z. 22,
233—274.
Tamari, K., and Kaji, J., 1952, 1953: Studies on the mechanism of injurious action of
fusarinic acid on plant growth. Parts 1—8. J. Agr. Chem. Soc. Japan 26,
223--227, 295—298, 298—303, 345—349, 349—353; 27, 245—249, 249—252,
302—306.
,and
,1953: Studies on the mechanism of injurious action of 2-methyl-
pyridin-4-carboxylic acid on plant growth. Parts 1—3. J. Agr. Chem. Soc. Japan
27, 144—147, 147—150, 159—161.
Tietz, H., 1952: Eine Schnelleinbettungsmethode fur histologische Praparate mit „Syntha-wachs-Gemischen" unter Umgehung der Alkoholstufen, besonders nach Imbibition
von nichtwasser- und lipoidloslichen Stoffen. Z. f. wiss. Mikros. Tech. 61,
129—139.
,1953: Der 32p-markierte Diathylthionophosphorsaureester des /S-Oxathyl-thio-athylathers, seine Aufnahme in die hohere Pflanze und sein Wanderungsvermogen.Diss., Universitat Koln, 60 p.
Treadwell, W. D., 1947: Tabellen und Vorschriften zur qualitativen Analyse. Verlag
Deuticke, Wien.
Turel, F., 1952: Der EinfluG von Aneurin und Zink auf das Wachstum und die Toxin-
produktion von Fusarium solani (Mart.) App. et Wr. Phytopath. Z. 19, 307—342.
VanSlyke, D. D., and Folch, J., 1940: Manometric Carbon determination. J. Biol.
Chem. 136, 509—541.
, Steele, R., and Plazin, J., 1951: Determination of total carbon and it's radio¬
activity. J. Biol. Chem. 192, 769—805.
, Plazin, J., and Weisiger, J. R., 1951: Reagents for the Van Slyke-Folch wet
carbon combustion. J. Biol. Chem. 191, 299—304.
Wade, H. W., 1952: Notes on the Carbowax method of making tissue sections. Stain.
Tech. 27, 71—79.
Waggoner, P. E., and Dimond, A. E., 1954: Reduction in water flow by mycelium in
vessels. Amer. J. Bot. 41, 637—640.
Warren, J. R., 1951: The use of radioisotopes in determining the distribution of
Bacterium stewartii Erw. Smith, within corn plants. Phytopathology 41, 794—800.
25*

384 Sanwal, Investigations on the metabolism of Fusarium lycoperski Sacc.
Weintraub, R. L., Brown, J. W., Fields, M., and Rohan, J., 1952: Metabolism of 2,4-
dichlorophenoxyacetic acid. I. C1402 production by bean plants treated with
labeled 2,4-dichlorophenoxyacetic acid. Plant Physiol. 27, 293—301.
, Yeatman, J. N., Lochrat, J. A., Reinhart, J. H., and Fields, M., 1952: Meta¬
bolism o{ 2,4-dichlorophenoxyacetic acid. II. Metabolism of side-chain by the
bean plants. Arch. Biochem. Biophys. 40, 277—285.
Wellman, F. L., 1939: A technique for studying host resistance and pathogenicity in
tomato Fusarium wilt. Phytopathology 29, 945—956.
,1943: Comparative toxic effects of extracts from mild and virulent isolates of
tomato wilt Fusarium. Phytopathology 33, 1004—1017.
Wheeler, H. E., 1951: The use of C14-labeled sucrose for "tagging" mycelium. Phyto¬pathology 41, 38.
,1952: The use of radiocarbon for tagging fungi. Phytopathology 42, 431—435.
,1953: Detection of microbial toxins by the use of radioisotopes. Phytopathology43, 236—238.
Willams, R. T., 1947: Detoxication mechanisms. London.
Winstead, N. N., and Walker, J. C, 1954: Production of vascular browning by meta¬
bolites from several pathogens. Phytopathology 44, 153—158.
Woodward, C. C, and Rabideau, G. S., 1953: The composition of plant fractions
etracted with 80 Vo alcohol. Plant Physiol. 28, 535—538.
Yabuta, T., Kambe, K., and Hayashi, T., 1934: Biochemistry of the bakanae fungus.I. Fusaric acid, a new product of the bakanae fungus. I. Agr. Chem. Soc. Japan 10,1059..1068 "(cited from Chem. Abs. 29, 1132, 1935).
Yankwich, P. E., 1948: Loss of radioactivity from barium carbonate samples. Science
107, 681—683.
, Norris, T. H., and Huston, J., 1947: Correcting for the absorption of weak
/?-particles in thick samples. Anal. Chem. 19, 439—441.
Zahner, H., 1954: Die Bestimmung der Fusarinsaure mit Hilfe der Papierchromato-graphie. Phytopath. Z. 22, 227—228.
,1955: Ober den EinfluG der Ernahrung auf die Toxinempfindlichkeit von To-
matenpflanzen. Phytopath. Z. 23, 49—88.

Curriculum vitae
Born in Almora, Uttar Pradesh, India, 25 May 1927.
Elementary school and high school in Nainital between
1933—1942. Intermediate Science examination in Naini¬
tal between 1942—4944. Degree of Bachelor of Science
in 1946 after study at the University of Allahabad,
India. Master of Science in Botany in 1949 for work
completed at the University of Allahabad, India. Degree
of Doctor of Philosophy in 1954 for a thesis in Myco¬
logy presented to the University of Delhi, India.
1953—1955: Doctoral research at the Institute of special
Botany, Swiss Federal Institute of Technology under the
guidance of Prof. Dr. E. Gaumann.