Right people, wrong place? - · PDF file4 Right people, wrong place? Contributors Charles...
32
Right people, wrong place? Businesses with a strong match between their market opportunities and their workforce, perform better.
Transcript of Right people, wrong place? - · PDF file4 Right people, wrong place? Contributors Charles...

Right people, wrong place?Businesses with a strong match between their market opportunities and their workforce, perform better.

2 | Right people, wrong place?
The data capture and analysis ..................................................................................... 5
Executive summary ................................................................................................... 6
1. Understanding talent-to-market alignment .......................................................... 8
• There is significant opportunity to improve the match between where companies locate their people versus the market opportunity by country.
• There is notable variation within and between sectors in companies’ talent-to-market alignment.
2. The relationship between talent-to-market alignment and performance ............... 11
• Firms with highest talent-to-market alignment tend to achieve higher performance.
• The productivity payoff from higher talent-to-market alignment varies by sector.
• Relationship between talent-to-market alignment and revenue growth.
• Firms with highest talent-to-market alignment tend to deliver higher profits.
• Companies increasing their talent-to-market alignment over time tend to grow faster.
3. Talent-to-market alignment by country ............................................................ 21
• National economies containing companies with a higher talent-to-market alignment tend to be more productive.
• Significant variation across the globe in how well companies align talent to markets.
• US firms are best-in-class when it comes to matching talent-to-market.
4. Seniority and business function alignment ........................................................ 26
• Digging deeper to understand if firms have the right talent in the right places.
• Firms often have a concentration of senior executives in legacy locations.
• Alignment between senior executives and market is related to performance.
• Key functions are often underrepresented in crucial markets.
• Alignment between sales and marketing talent and market opportunity matters for performance.
5. Keyquestionsforleaderstoconsiderastheyreflectonthisresearch...............30
• Companies• Policy makers• Investors and shareholders
Contents

3Right people, wrong place? |

4 | Right people, wrong place?
Contributors
Charles DavisGlobal Tax Lead Analyst, EY https://www.linkedin.com/in/charlessddavis/ Charles is an economist and delivers research on trends affecting clients ranging from the global economic outlook to the impact of disruption, such as a recent report on the rise of the gig economy and forthcoming research on the future of work. Charles joined EY in 2015 from London-based economics consultancy the Centre for Economics and Business Research, where he was a Director and sought-after economic pundit.
Sabrina FruehaufSr. Global Insights Lead, LinkedIn www.linkedin.com/in/sabrinafruehauf/ Sabrina has been partnering with LinkedIn’s largest and most strategic clients globally, focused on providing solutions that connect an enterprise’s objectives across talent, marketing, sales and employee development. Motivated by LinkedIn’s vision of creating economic opportunity for every member of the global workforce she leverages LinkedIn’s rich global data to deliver the insights that help her clients achieve their goals from LinkedIn’s diverse products.
Dennis LaytonGlobal Deputy Leader, EY’s People Advisory Services www.linkedin.com/in/dennislayton/ Dennis is responsible for EY’s PAS offering development, thought leadership, client impact and convening peer conversations between people leaders around the world. He was formerly the Leader of McKinsey and Companies’ organization practice in the UK & Ireland and a leader of the EMEA Performance Transformation Practice. Dennis has helped leading Technology, Financial Services and Health Care companies achieve measurable improvement in their financial performance and organizational health.

5Right people, wrong place? |
We followed a five step core methodology using unique datasets developed by EY and based on aggregate profile data provided by LinkedIn.
1. First, for each subsector within the sectors selected for analysis, we derive the market size by country of that subsector based on EY’s unique industry knowledge and supporting sources including Euromonitor International; BMI International; LMCA database; Timetric; IIC; SNL; IFS; IMF; World Bank; OECD; individual company filings.
2. Second, for each subsector, we compile a list of the major companies across the globe that compete in the subsector. The size of this sample varies across subsectors, depending on how fragmented each market is.
3. Third, we aggregate profile data provided by LinkedIn to derive what proportion of each company’s headcount is located in each country around the world. Joint ventures and subsidiaries are consolidated into one parent entity.
4. Fourth, for each company, we compute the correlation between the proportion of their global headcount in each country and the relative size of each country in the global subsector market.
5. Fifth, we test the explanatory power of the correlation coefficients to explain differences in company performance using univariate regression analysis.
The above analysis of LinkedIn data is based on the distribution of all company headcount by country, regardless of function or seniority. However, LinkedIn data also allowed for a more granular analysis. Specifically, we were able to analyze the distribution of company headcount by:
A. Seniority — the percentage distribution of company headcount across countries for those only with a director or above title; specifically this comprises those with the job titles director, VP, partner, owner and CXO
B. Function — the distribution of company headcount across countries by four major function groups:
• Sales or business development
• Marketing
• Research, development, engineering, product management
• Other (legal, HR, social services, admin, education, finance, media and communications, military services, health care, arts and design, accounting, operations, finance, IT, entrepreneurship, program/project management, support, purchasing, consulting, real estate)
As in the core methodology, the distribution of company seniority and functions by country was correlated against the size of subsector country markets to derive a correlation coefficient for each company. These respective correlation coefficients were then used as an explanatory variable in a univariate regression with measures of company performance.
The data capture and analysis
By collaborating with LinkedIn, we were provided with aggregate public profile data from its professional community of more than 530 million globally to give us a comprehensive view of the world at work.
It should be recognized that analyzing this data provides us with an indicative view across organizations, industries and markets and therefore the derived coefficient should be considered as an estimate only and not a perfect market to workforce match. Any organization wishing to examine their true workforce to market coefficient should apply the methodology below to their actual workforce data.

6 | Right people, wrong place?
Executive summary
LinkedIn brought its unique insights on where professionals are based, including by business function and seniority
7Right people, wrong place? |
1. There is considerable opportunity for companies to improve alignment between their subsector market opportunity and where they station their workforce. Many companies misalign their talent to legacy mature market locations rather than countries where more revenue and faster growth opportunities lie. The size of the opportunity to improve alignment and payoff from doing so varies by sector. There is significant variation within and between sectors in companies’ talent-to-market alignment — that is: how closely companies allocate their talent to where their subsector market opportunities are. The analysis reveals notable differences in how companies distribute their senior executives, sales, marketing and research talent around the globe. In many cases, senior executives are disproportionately concentrated in home markets.
2. Firms with the closest match between their geographical talent footprint and market opportunity tend to have higher performance (measured by profit (EBITDA) per employee; revenue growth and profit levels). The finding that talent-to-market alignment is related to firm-level productivity is a powerful insight, suggesting that firms can make major performance improvements by having a more strategic approach to where they put the right people. Firms that poorly match their workforce to the global subsector market are potentially leaving hundreds of millions of dollars of opportunity on the table. For example, in the pharmaceutical sector, a median company in our data set increasing their talent-to-market alignment by 10% corresponds to an increase in profit of $77 million. The median company moving to best-in-class alignment would correspond to higher profit of $691 million.
3. National economies where companies tend to have a higher talent-to-market alignment tend to be more productive. This suggests that if policymakers can support companies’ attempts to globalize, it will increase productivity and economic output. There is significant variation by country in how well companies headquartered there tend to align their workforce to the market. Firms headquartered in the US tend to have the closest match between where they place their talent and the market opportunity in their subsector. There is scope for firms headquartered in Europe and Asia to improve the match between their workforce and the markets that will drive future growth in top and bottom line. For example, if UK-based firms had a talent footprint to market alignment similar to US-based firms, it could potentially be worth an additional $900 billion in GDP.
The findings of this research imply that in addition to thinking about their workforces from a cost optimization perspective through offshoring, near-shoring or right-shoring, companies have the opportunity to revisit their revenue and growth optimization to create competitive advantage through “growth-shoring.”
The research suggests that those businesses that focus on growth-shoring to ensure that the right executive, marketing and sales, product development, research and other talent categories better match the global market opportunities will do a better job of capturing share in those markets.
In a low-growth environment, with wage stagflation across many developed markets and an increasing concentration of opportunity and social mobility occurring alongside a rise in protectionist sentiments, this research provides a clear economic imperative for more trade, and mobility of the right people to the right places, rather than less.
This work illustrates the power of combining both granular company data — with aggregate market and industry data. These provide the necessary inputs to both corporate strategy planning and an end-to-end talent strategy and management approach that is at the core and clearly linked to corporate and business unit strategy planning.
In a first-of-its-kind collaboration between EY and LinkedIn, we have brought together two proprietary sets of analysis: EY brought its detailed view of current and projected industry market performance by geography and LinkedIn provided its unique insights on where people are based, including by business function and seniority. This combined analysis of 659 companies across 11 sectors is groundbreaking because for the first time it validates and quantifies the value of maximizing the alignment between workforce location and market opportunity. Key findings from that analysis include:

8 | Right people, wrong place?
1. Understanding talent-to-market alignment

9Right people, wrong place? |
There is significant opportunity to improve the match between where companies locate their people and the market opportunity by country
For each company, the relative subsector market size by country was compared against the unique outside-in view of where companies locate their people from LinkedIn aggregate profile data. In simple terms, this analysis reveals the extent to which firms locate talent in their target market segments. While the analysis was all conducted at the company level, taking a sector-wide view illustrates the differences between the relative market size of each country and the relative share of global headcount that firms in that sector locate there (Exhibit 1). Many firms tend to have a concentration of talent in headquarter country or legacy locations and may not have taken sufficient steps to build an appropriate presence in countries that provide both current and future revenue-creating opportunities.
Exhibit 1. How the distribution of talent by country misaligns with the spread of market opportunity by country
Source: EY Knowledge analysis of LinkedIn member data and various industry sources on sector market size
“ Many firms tend to have a concentration of talent in headquarter country or legacy locations and may not have taken sufficient steps to build an appropriate presence in countries that provide both current and future revenue-creating opportunities.”
0%
5%
10%
15%
20%
25%
30%
35%
40%
45%
United States
China Japan Germany Brazil United Kingdom
France Mexico Italy India Spain Canada Australia South Korea
Market opportunity by country as % share of global consumer products and retail market (CPR); compared with distribution of talent by country; CPR workforce in each country as % of global total; data for 2016
Across the consumer productsand retail (CPR) sector, CPRfirms are overrepresented in the US relative to the market size In markets like China, Japan and
Germany, CPR sector workforces are underweight compared to the relative market opportunity
Total CPR % headcount by country CPR market share by country

10 | Right people, wrong place?
There is notable variation within and between sectors in companies’ talent-to-market alignment
For each of the 659 companies in the sample, a single indicator of talent-to-market alignment was derived by comparing the outside-in view of the distribution of company talent based on LinkedIn aggregate profile data to the size of the market opportunity by country for each subsector the company competes in. The talent-to-market alignment is derived using correlation analysis such that firms perfectly aligning talent-to-market would achieve a correlation score of +1. Those with no relationship between market opportunities and where they locate their talent would score 0. This analysis revealed substantial variations within and between sectors in typical company talent-to-market alignment (Exhibit 2). The median company has a talent-to-market alignment of 0.48 and could be leaving value-creating opportunities untapped as a result. There is a notable variance across subsectors in how well firms tend to align their workforce to the market. Across the sectors analyzed, firms in the medical devices subsector tended to align their workforce closest to the market opportunity, while those in the alcoholic beverages subsector had the lowest talent-to-market alignment.
It should be emphasized that this analysis specifically finds a statistically significant relationship between a company’s talent-to-market alignment and measures of performance when market is defined by absolute market size. We generally did not find statistically significant findings when compared only to market growth.
Exhibit 2. There is significant variation within and between industries in terms of individual companies’ alignment between the workforce and the market
Source: EY Knowledge analysis of aggregate profile data provided by LinkedIn and various sources on sector market size
0.273
0.314
0.409
0.462
0.487
0.489
0.493
0.515
0.542
0.557
0.829
0.0 0.2 0.4 0.6 0.8 1.0
Alcoholic beverages
Banking
Non-alcoholic beverages
Automotive
Insurance
Food
Pharmaceuticals
Home and personal care
Consumer health
Apparel and footwear
Medical devices
Talent-to-market alignment
Average subsector talent to market alignment correlation coefficient (+1 implies perfect alignment) in 2016, n=659

11Right people, wrong place? |
2. The relationship between talent-to-market alignment and performance

12 | Right people, wrong place?
Firms with highest talent-to-market alignment tend to achieve higher performance
Analysis of a sample of 659 companies revealed a statistically significant relationship between talent-to-market alignment and various measures of firm-level performance. Across the sample, the most aligned firms — those in the top quartile of talent-to-market alignment — typically achieved productivity levels more than 50% to approximately 40% higher than those in the bottom quartile — the least-aligned firms (Exhibit 3A). To put this another way, companies in the top highest quartile for talent-to-market alignment were 18 percent more likely to have productivity levels above the median in the sample of firms (Exhibit 3B). This correlation does not prove that the relationship is causal — that greater talent-to-market alignment automatically translates into more profit and productivity. There are clearly multiple factors involved in a firm’s performance results. However, the findings indicate that companies paying careful attention to their global workforce strategy tend to be more successful. Interestingly, there was a performance relationship between talent-to-market alignment and market opportunity in every one of the industry subsets we examined except alcoholic beverages; we believe this is due to the unique heritage, provenance and tax issues associated with this industry.
Exhibit 3A. Talent-to-market alignment explains differences in financial performance
Source: EY Knowledge analysis of aggregate profile data provided by LinkedIn and various sources on sector market size
Average company EBITDA/employee in 2016 by talent-to-market alignment quartile, n=659
$68,690
$72,965
$79,988
$94,743
$60,000
$65,000
$70,000
$75,000
$80,000
$85,000
$90,000
$95,000
$100,000
Bottom quartile 2nd quartile 3rd quartile Top quartile
EBIT
DA p
er e
mpl
oyee
, $
Talent-to-market alignment
1.4x
Exhibit 3B: Firms in the top quartile of talent-to-market alignment more likely to have higher productivity
Percentage likelihood of EBITDA/employee level being above sample median in each talent-to-market alignment quartile
43%
61%
Bottom quartile Top quartile
+18%

13Right people, wrong place? |
The productivity payoff from higher talent-to-market alignment varies by sector
The relationship between alignment and performance varies within and across industries and geographies. Higher alignment is related to increased productivity — captured by profit per employee — in the non-alcoholic beverages; pharmaceuticals; home and personal care; food; and consumer health sectors. In the pharmaceuticals and non-alcoholic beverages sectors, the typical productivity of firms with the highest talent-to-market alignment was more than four times higher than those with the lowest alignment (Exhibits 4 and 5).
Exhibit 4. The difference in productivity between top and bottom of talent-to-market alignment varies by sector — as do payoffs from increasing alignment
Source: EY Knowledge analysis of aggregate profile data provided by LinkedIn and various sources on sector market size
Note: value of median firm increasing alignment computations based on applying relationship to median sector talent-to-market alignment and median sector headcount to derive change in EBITDA.
Productivity (in EBITDA/employee) average of top quartile aligned firms as multiple of average productivity of lowest quartile aligned firms
0 1 2 3 4 5
Home and personal care
Consumer health
Food
Pharmaceuticals
Non-alcoholic beverages
Value of median firm increasing talent to market alignment by 10%
Value of median firm increasing alignment to sector best in class
$62m $1.2bn
$77m $691m
$91m $1.8bn
$64m $195m
$50m $190m

14 | Right people, wrong place?
Exhibit 5. Comparing differences in talent-to-market alignment and productivity across sectors
$30,397
$53,206$65,892
$132,068
$0
$40,000
$80,000
$120,000
$160,000
Bottom quartile 2nd quartile 3rd quartile Top quartile
Alignment between workforce and market
Alignment between workforce and market
4.3x
Non-alcoholic beverages sector: average productivity (EBITDA per employee) level by talent to market alignment quartile; n=62
$45,466
$76,156
$120,868
$184,361
$0
$40,000
$80,000
$120,000
$160,000
$200,000
Bottom quartile 2nd quartile 3rd quartile Top quartile
Alignment between workforce and market
4.1x
Pharmaceuticals sector: average productivity (EBITDA per employee) level by talent to market alignment quartile; n=71
$63,496$71,723
$77,803
$137,397
$0
$40,000
$80,000
$120,000
$160,000
Bottom quartile 2nd quartile 3rd quartile Top quartile
2.2x
Consumer health sector: average productivity (EBIDTA per employee) level by talent to market alignment quartile; n=69
$47,549$59,994
$68,360
$85,626
$0
$40,000
$80,000
$120,000
Bottom quartile 2nd quartile 3rd quartile Top quartile
Alignment between workforce and market
1.8x
Home and personal care sector: average productivity (EBITDA per employee) level by talent to market alignment quartile; n=67
Percentage likelihood of EBITDA/employee level being above sample median in each talent-to-market alignment quartile
27%
69%
Bottom quartile Top quartile
+42%
Percentage likelihood of EBITDA/employee level being above sample median in each talent-to-market alignment quartile
24%
67%
Bottom quartile Top quartile
+43%
Percentage likelihood of EBITDA/employee level being above sample median in each talent-to-market alignment quartile
12%
72%
Bottom quartile Top quartile
+60%
Percentage likelihood of EBITDA/employee level being above sample median in each talent-to-market alignment quartile
25%
65%
Bottom quartile Top quartile
+40%

15Right people, wrong place? |
$30,397
$53,206$65,892
$132,068
$0
$40,000
$80,000
$120,000
$160,000
Bottom quartile 2nd quartile 3rd quartile Top quartile
Alignment between workforce and market
Alignment between workforce and market
4.3x
Non-alcoholic beverages sector: average productivity (EBITDA per employee) level by talent to market alignment quartile; n=62
$45,466
$76,156
$120,868
$184,361
$0
$40,000
$80,000
$120,000
$160,000
$200,000
Bottom quartile 2nd quartile 3rd quartile Top quartile
Alignment between workforce and market
4.1x
Pharmaceuticals sector: average productivity (EBITDA per employee) level by talent to market alignment quartile; n=71
$63,496$71,723
$77,803
$137,397
$0
$40,000
$80,000
$120,000
$160,000
Bottom quartile 2nd quartile 3rd quartile Top quartile
2.2x
Consumer health sector: average productivity (EBIDTA per employee) level by talent to market alignment quartile; n=69
$47,549$59,994
$68,360
$85,626
$0
$40,000
$80,000
$120,000
Bottom quartile 2nd quartile 3rd quartile Top quartile
Alignment between workforce and market
1.8x
Home and personal care sector: average productivity (EBITDA per employee) level by talent to market alignment quartile; n=67
Percentage likelihood of EBITDA/employee level being above sample median in each talent-to-market alignment quartile
27%
69%
Bottom quartile Top quartile
+42%
Percentage likelihood of EBITDA/employee level being above sample median in each talent-to-market alignment quartile
24%
67%
Bottom quartile Top quartile
+43%
Percentage likelihood of EBITDA/employee level being above sample median in each talent-to-market alignment quartile
12%
72%
Bottom quartile Top quartile
+60%
Percentage likelihood of EBITDA/employee level being above sample median in each talent-to-market alignment quartile
25%
65%
Bottom quartile Top quartile
+40%
Source: EY Knowledge analysis of aggregate profile data provided by LinkedIn and various sources on sector market size

16 | Right people, wrong place?
Relationship between talent-to-market alignment and revenue growth
There is a statistically significant relationship between talent-to-market alignment and the pace of recent revenue growth across industries. Again, this finding varies by industry: in the automotive sector, the highest-aligned firms typically achieved revenue growth 14 percentage points higher than firms with the lowest alignment. While in the apparel and footwear sector, growth among the highest aligned firms is 9 percentage points higher than the lowest aligned firms (Exhibit 6). There are smaller but still statistically significant differences in growth performance of the highest-aligned firms for the insurance, food and non-alcoholic beverages sectors (Exhibit 7).
Exhibit 6. Difference in revenue growth between highest aligned and lowest aligned firms varies by sector
Exhibit 7. Firms with higher talent-to-market alignment across these sectors tended to achieve higher revenue growth
0% 2% 4% 6% 8% 10% 12% 14% 16%
Non-alcoholic beverages
Insurance
Food
Apparel and footwear
Automotive
Difference in average revenue growth among highest quartile talent-to-market aligned firms and lowest quartile aligned firms by sector, percentage points
–1.0%–0.4%
5.8%
8.2%
–1%0%1%2%3%4%5%6%7%8%9%
Bottom quartile 2nd quartile 3rd quartile Top quartile
Alignment between workforce and market
–4.3%
9.6%
7.5%
9.8%
–6%
–4%
–2%
0%
2%
4%
6%
8%
10%
Bottom quartile 2nd quartile 3rd quartile Top quartile
Alignment between workforce and market
Apparel and footwear sector: average company revenue growth (2012–16) by talent-to-market alignment quartile; n=67
Automotive sector: average company revenue growth (2012–16) by talent-to-market alignment quartile; n=32
14.1 percentage point difference
9.2 percentage point difference
Source: EY Knowledge analysis of aggregate profile data provided by LinkedIn and various sources on sector market size
Source: EY Knowledge analysis of aggregate profile data provided by LinkedIn and various sources on sector market size

17Right people, wrong place? |
Firms with highest talent-to-market alignment tend to deliver higher profits
There is a statistically significant relationship between talent-to-market alignment and profit (EBITDA) levels, such that firms with the highest talent-to-market alignment tend to deliver higher profits. This relationship varies by sector; in the banking sector, firms in the highest quartile of talent-to-market alignment deliver profit levels that are 3.6 times higher than the lowest quartile aligned firms. In the non-alcoholic beverages sector, the same differential is 14.4 times (see Exhibit 8). The nature of the relationships between talent-to-market alignment and profit varies by sectors, as shown in Exhibit 9.
Exhibit 8. Highest aligned firms deliver higher profits but multiple varies by sector
0 5 10 15 20 25 30
Banking
Food
Home and personal care
Pharmaceuticals
Non-alcoholic beverages
Consumer health
Average company profit (EBITDA) level of firms in highest quartile of talent-to-market alignment compared with lowest aligned firms by sector, 2016
Source: EY Knowledge analysis of aggregate profile data provided by LinkedIn and various sources on sector market size

18 | Right people, wrong place?
“ The nature of the relationships between talent-to-market alignment and profit varies by sectors.”
Exhibit 9. Relationship between higher alignment and profitability varies by sector
Alignment between workforce and market
Alignment between workforce and market Alignment between workforce and market
Alignment between workforce and market
Banking sector: profit (EBITDA in 2016, $M) average level by talent-to-market alignment quartile; n=146
Food sector: profit (EBITDA in 2016, $M) average level by talent-to-market alignment quartile; n=90
Non-alcoholic beverages sector: profit (EBITDA in 2016, $M) average level by talent-to-market alignment quartile; n=62
Consumer health sector: profit (EBITDA in 2016, $M) average level by talent-to-market alignment quartile; n=69
$273
$2,142
$4,681
$6,890
25x
Bottom quartile 2nd quartile 3rd quartile Top quartile$0
$1,000
$2,000
$3,000
$4,000
$5,000
$6,000
$7,000
$8,000
$692
$1,262
$1,983
$4,614
7x
Bottom quartile 2nd quartile 3rd quartile Top quartile$0
$1,000
$2,000
$3,000
$4,000
$5,000
$385
$1,701
$3,050
$5,546
14x
Bottom quartile 2nd quartile 3rd quartile Top quartile$0
$1,000
$2,000
$3,000
$4,000
$5,000
$6,000
$2,254
$4,321$4,762
$8,107
$0
$2,000
$4,000
$6,000
$8,000
$10,000
Bottom quartile 2nd quartile 3rd quartile Top quartile
3.6x
Source: EY Knowledge analysis of aggregate profile data provided by LinkedIn and various sources on sector market size

19Right people, wrong place? |
Companies increasing their talent-to-market alignment over time tend to grow faster
The finding that firms with a higher talent-to-market alignment tend to have higher profits could simply be viewed as showing that the biggest companies are most international and most profitable. However, the data indicates that firms that increase their alignment over time are more likely to increase their profitability (see Exhibit 10). Firms in the top quartile of changes in talent-to-market alignment between 2013 and 2016 achieved profit (EBITDA) growth that was 7.8 percentage points higher than those in the lowest quartile of changes in alignment.
Exhibit 10. Companies that increased their match most achieved higher profit growth
–1.2%
3.8%
4.8%
6.6%
–2%
–1%
0%
1%
2%
3%
4%
5%
6%
Bottom quartile 2nd quartile 3rd quartile Top quartile
Change in talent to market alignment from 2013 to 2016
7%
Average company EBITDA growth (2012–16) viewed by changes in talent-to-market alignment, n=659
Source: EY Knowledge analysis of aggregate profile data provided by LinkedIn and various sources on sector market size

20 | Right people, wrong place?
Exhibit 11. Relationship between changing talent-to-market alignment over time and profit growth by sector
Bottom quartile 2nd quartile 3rd quartile Top quartile
Change in alignment between workforce and market
Change in alignment between workforce and market
Bottom quartile 2nd quartile 3rd quartile Top quartile
Change in alignment between workforce and market
Banking sector: average company EBITDA growth (2012–16) by quartile of change in talent-to-market alignment, n=146
Insurance sector: average company EBITDA growth (2012–16) by quartile of change in talent-to-market alignment, n=70
–5.8%
–0.6%
0.8%
5.6%
–9.1%
10.1%8.8%
19.8%
–6%
–4%
–2%
0%
2%
4%
6%
11.4 percentage point difference
28.9 percentage point difference
–10%
–5%
0%
5%
10%
15%
20%
Bottom quartile 2nd quartile 3rd quartile Top quartile
Pharmaceutical sector: average company EBITDA growth (2012-16) by quartile of change in talent-to-market alignment, n=71
–4.3%
3.7%
9.3% 9.7%14 percentage point difference
–6%
–4%
–2%
0%
2%
4%
6%
8%
10%
12%
There is particular significance for banking, insurance and pharmaceutical firms. In the banking sector, firms with the highest improvement in talent-to-market alignment achieved profit growth on average 11 percentage points higher than those with the lowest improvement (or decline) in talent-to-market alignment. In the insurance sector, those in the top quartile of improved alignment achieved profit growth that was 29 percentage points higher than those with the lowest improvement in alignment (Exhibit 11).
Source: EY Knowledge analysis of aggregate profile data provided by LinkedIn and various sources on sector market size

21Right people, wrong place? |
3. Talent-to-market alignment by country
22 | Right people, wrong place?
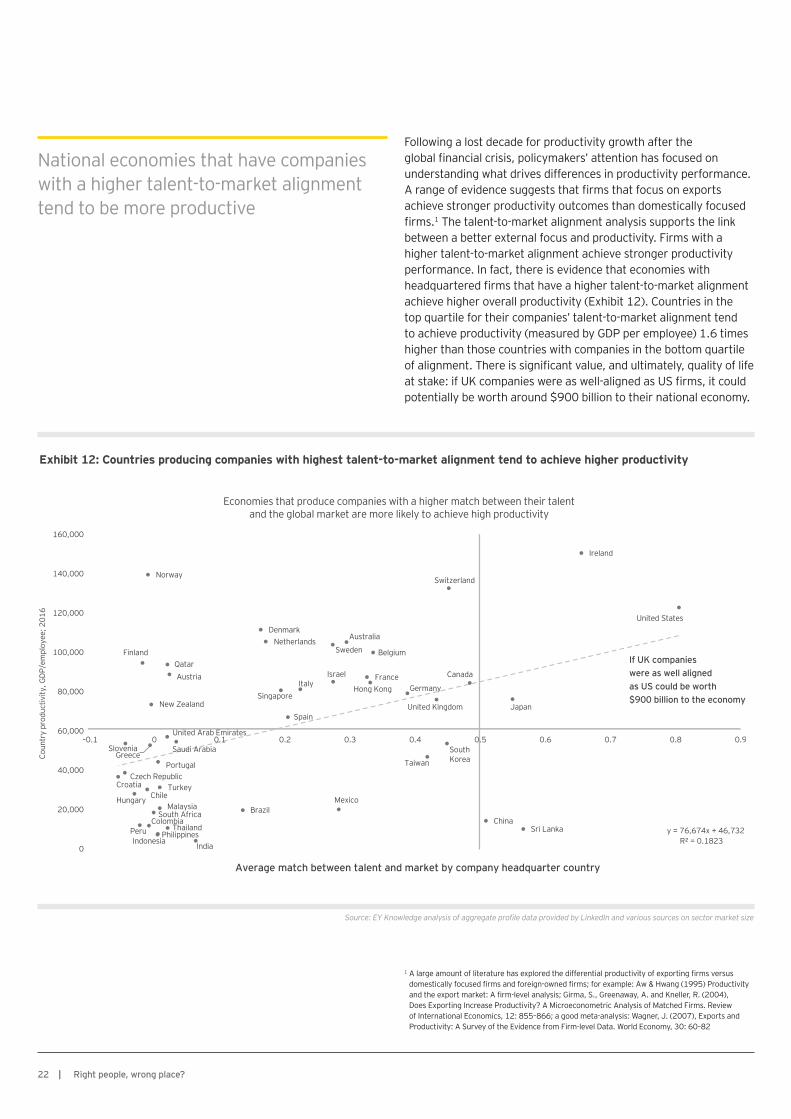
National economies that have companies with a higher talent-to-market alignment tend to be more productive
Following a lost decade for productivity growth after the global financial crisis, policymakers’ attention has focused on understanding what drives differences in productivity performance. A range of evidence suggests that firms that focus on exports achieve stronger productivity outcomes than domestically focused firms.1 The talent-to-market alignment analysis supports the link between a better external focus and productivity. Firms with a higher talent-to-market alignment achieve stronger productivity performance. In fact, there is evidence that economies with headquartered firms that have a higher talent-to-market alignment achieve higher overall productivity (Exhibit 12). Countries in the top quartile for their companies’ talent-to-market alignment tend to achieve productivity (measured by GDP per employee) 1.6 times higher than those countries with companies in the bottom quartile of alignment. There is significant value, and ultimately, quality of life at stake: if UK companies were as well-aligned as US firms, it could potentially be worth around $900 billion to their national economy.
Exhibit 12: Countries producing companies with highest talent-to-market alignment tend to achieve higher productivity
1 A large amount of literature has explored the differential productivity of exporting firms versus domestically focused firms and foreign-owned firms; for example: Aw & Hwang (1995) Productivity and the export market: A firm-level analysis; Girma, S., Greenaway, A. and Kneller, R. (2004), Does Exporting Increase Productivity? A Microeconometric Analysis of Matched Firms. Review of International Economics, 12: 855–866; a good meta-analysis: Wagner, J. (2007), Exports and Productivity: A Survey of the Evidence from Firm-level Data. World Economy, 30: 60–82
Average match between talent and market by company headquarter country
Economies that produce companies with a higher match between their talentand the global market are more likely to achieve high productivity
If UK companies were as well aligned as US could be worth $900 billion to the economy
CroatiaCzech Republic
Slovenia
Hungary
Finland
Chile
ColombiaPeru
Greece
Norway
New Zealand
South Africa
PhilippinesIndonesia
Portugal
Turkey
Malaysia
United Arab Emirates
Qatar
Thailand
Austria
India
Brazil
DenmarkNetherlands
Singapore
Spain
Italy
Sweden
Mexico
Australia
FranceHong Kong
Israel
Belgium
Taiwan
Germany
South Korea
United Kingdom
Canada
Switzerland
China
Japan
Sri Lanka
Ireland
United States
y = 76,674x + 46,732R² = 0.1823
0
20,000
40,000
60,000
80,000
100,000
120,000
140,000
160,000
–0.1 0 0.1 0.2 0.3 0.4 0.5 0.6 0.7 0.8 0.9
Coun
try
prod
uctiv
ity, G
DP/e
mpl
oyee
; 201
6
Saudi Arabia
Source: EY Knowledge analysis of aggregate profile data provided by LinkedIn and various sources on sector market size
23Right people, wrong place? |
There is a significant variation across the globe in how well companies align talent-to-markets
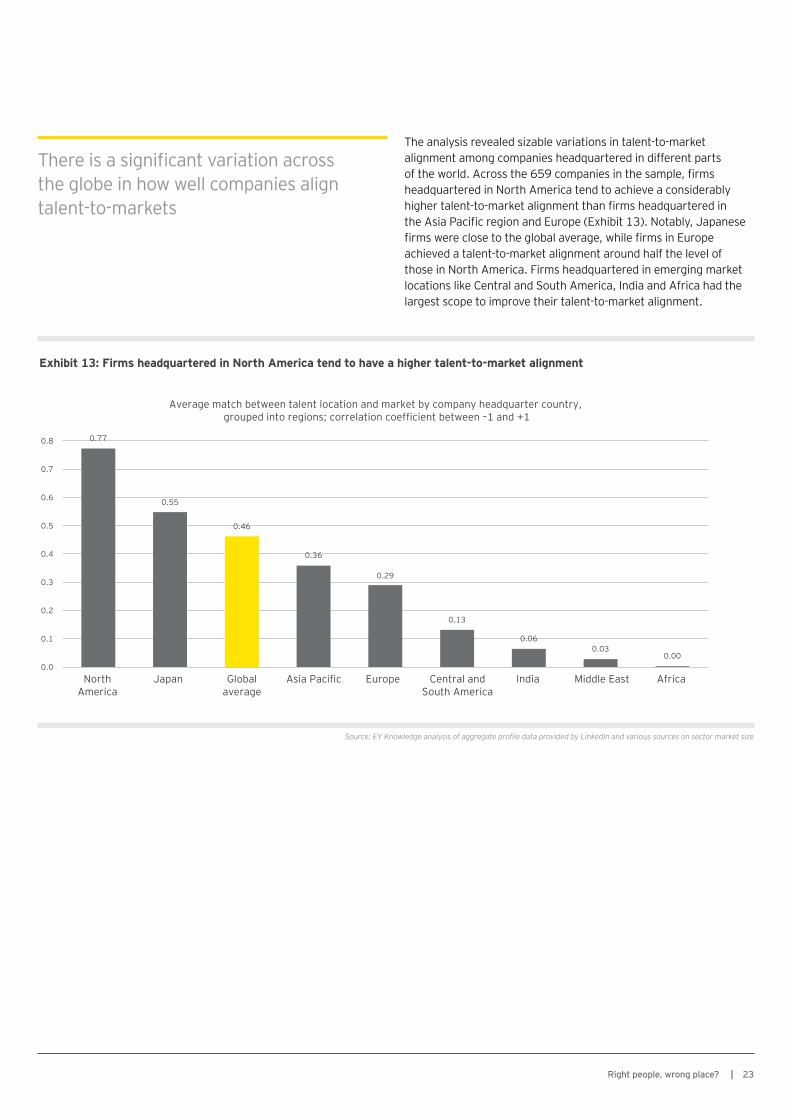
The analysis revealed sizable variations in talent-to-market alignment among companies headquartered in different parts of the world. Across the 659 companies in the sample, firms headquartered in North America tend to achieve a considerably higher talent-to-market alignment than firms headquartered in the Asia Pacific region and Europe (Exhibit 13). Notably, Japanese firms were close to the global average, while firms in Europe achieved a talent-to-market alignment around half the level of those in North America. Firms headquartered in emerging market locations like Central and South America, India and Africa had the largest scope to improve their talent-to-market alignment.
Exhibit 13: Firms headquartered in North America tend to have a higher talent-to-market alignment
0.77
0.55
0.46
0.36
0.29
0.13
0.060.03
0.000.0
0.1
0.2
0.3
0.4
0.5
0.6
0.7
0.8
North America
Japan Global average
Asia Pacific Europe Central and South America
India Middle East Africa
Average match between talent location and market by company headquarter country, grouped into regions; correlation coefficient between –1 and +1
Source: EY Knowledge analysis of aggregate profile data provided by LinkedIn and various sources on sector market size

24 | Right people, wrong place?
US firms are best-in-class when it comes to matching talent-to-market
There is consistent evidence that US firms achieve the closest match between the proportional allocation of talent to a country and that country’s significance in the global subsector market (Exhibit 14). Companies headquartered in Ireland also tend to achieve a high level of match between the country location of their talent and where the market is by country. Notably, companies headquartered in continental Europe and across Asia Pacific tend to achieve a lower match between talent and market opportunity.

25Right people, wrong place? |
Exhibit 14: Companies headquartered in the US tend to achieve a higher match between talent and the market
Average match between talent and market by company headquarter country, n=659
Perfect alignment implies an alignment score of +1 where companies have the largest concentration of talent in the largest markets and vice versa. Companies with a perfectly negative alignment would have the smallest proportion of talent in the largest markets and vice versa.
–0.1 0.0 0.1 0.2 0.3 0.4 0.5 0.6 0.7 0.8 0.9
Finland
Norway
Czech Republic
Greece
South Africa
Indonesia
Turkey
Austria
India
Brazil
Denmark
Netherlands
Singapore
Spain
Italy
Israel
Sweden
Mexico
Australia
France
Hong Kong
Belgium
Germany
Taiwan
United Kingdom
South Korea
Switzerland
Global mean
Canada
China
Japan
Ireland
United States
Source: EY Knowledge analysis of aggregate profile data provided by LinkedIn and various sources on sector market size

26 | Right people, wrong place?
4. Seniority and business function alignment

27Right people, wrong place? |
Digging deeper to understand if firms have the right talent in the right places
Firms often have a concentration of senior executives in legacy locations
The aggregate profile data provided by LinkedIn enabled us to observe if there are material differences in the distribution of senior executives and talent by job functions by company across the globe, compared with the distribution of a total company workforce. Through this research, it was possible to analyze whether companies have the right talent in the right markets, rather than simply provide a high-level view across all functions and seniorities of talent.
Many companies tend to have talent in legacy locations. However, as the global economy evolves and faster growing markets emerge, to maximize growth opportunities, companies need to ensure they have the right talent in locations with increasing revenue-generating opportunities. Data for firms across the consumer products and retail sector show that the proportion of directors and above in the sector are disproportionately positioned in mature markets like the United States, the United Kingdom and France (Exhibit 15).
Exhibit 15: Distribution of senior talent versus relative size of market opportunity by country
Total CPR % headcount by county CPR directors and above % by country CPR market share by country
0%
35%
30%
25%
20%
15%
10%
5%
40%
45%
United States
China Japan Germany Brazil France Mexico Italy India Spain Canada Australia South Korea
United Kingdom
Market opportunity by country; % share of global consumer products and retail market compared withdistribution of talent by country workforce and directors in each country as % of global total; data for 2016
Source: EY Knowledge analysis of aggregate profile data provided by LinkedIn and various sources on sector market size

28 | Right people, wrong place?
Alignment between senior executives and market is related to performance
Analysis of the talent-to-market alignment among executives only — that is, all those that self-reported on public LinkedIn profiles as a director or above — revealed more significant relationships with measures of performance. The strength of alignment of directors and above to market opportunities explained the variations in productivity (captured by profit per employee) in the consumer health; food; non-alcoholic beverages; and pharmaceuticals sectors (Exhibit 16). The analysis does not reveal whether these senior executives are sourced locally or on assignment, but strongly indicates the importance for performance of having the right senior talent in the right markets.
Exhibit 16: Relationship between alignment of senior executives to market opportunity and performance by sector
$29,724
$47,983
$83,492
$128,048
4.3x
$59,688$75,513
$97,196
$120,3862x
$0
$40,000
$80,000
$120,000
$160,000
Bottom quartile 2nd quartile 3rd quartile Top quartile
$0
$40,000
$80,000
$120,000
$160,000
Bottom quartile 2nd quartile 3rd quartile Top quartile
Alignment between workforce and market
Alignment between workforce and market Alignment between workforce and market
Alignment between workforce and market
Consumer health sector: average productivity (EBITDA per employee 2016) level by directors and above talent-to-market alignment quartile n=69
Non-alcoholic beverages sector: average productivity (EBIDTA per employee 2016) level by directors and above talent-to-market alignment quartile; n=60
Pharmaceutical sector: average productivity (EBITDA per employee 2016) level by directors and above talent-to-market alignment quartile; n=68
Food sector: average productivity (EBITDA per employee 2016) level by directors and above talent-to-market alignment quartile; n=88
$35,228 $35,931
$77,863
$106,806
3x
Bottom quartile 2nd quartile 3rd quartile Top quartile$0
$40,000
$80,000
$120,000
$48,741
$81,630
$123,737
$183,072
3.8x
Bottom quartile 2nd quartile 3rd quartile Top quartile$0
$40,000
$80,000
$120,000
$160,000
$200,000
Source: EY Knowledge analysis of aggregate profile data provided by LinkedIn and various sources on sector market size

29Right people, wrong place? |
Key functions are often underrepresented in crucial markets
The LinkedIn aggregate profile data allowed us to analyze for each company, and in aggregate across each subsector, how the workforce in business functions such as sales, marketing and research (including product development) is distributed across the globe. As with the senior executive talent analysis, in many cases, key functions are concentrated in legacy locations or company headquarter markets. This suggests that there is a notable talent-to-market misalignment (Exhibit 17).
Exhibit 17: Business functions are often concentrated in legacy locations
Total CPR % headcount by country CPR sales % headcount by country CPR marketing % headcount by country
CPR research % headcount by country CPR market share by country
United States
China Japan Germany Brazil France Mexico Italy India Spain Canada Australia South Korea
United Kingdom
0%
35%
30%
25%
20%
15%
10%
5%
40%
45% Market opportunity by country; % share of global consumer products and retail market compared with distribution of talent by country; workforce and business functions in each country as % of global total; data for 2016
Across all business functions, CPR firms are overrepresented in the US relative to the market size
Source: EY Knowledge analysis of aggregate profile data provided by LinkedIn and various sources on sector market size
Alignment between sales and marketing talent and market opportunity matters for performance
The impact on performance of the alignment between where functions are located would be expected to vary from sector to sector for intuitive reasons. For example, having local marketing capabilities in each market might be important in a variety of sectors from banking to insurance to non-alcoholic beverages, while having a localized research and product development team might matter more in sectors where tailoring the type of product is particularly important, like in the various subsectors within the fast-moving consumer goods space. The analysis undertaken found that changes in alignment of the marketing workforce to market were related to recent growth performance in the insurance and automotive sectors. Similarly, analyzing talent-to-market alignment for the sales and business development function revealed that changes in alignment were related to productivity performance in the apparel and footwear; food; non-alcoholic; and pharmaceutical sectors.

30 | Right people, wrong place?
5. Key questions for leaders to consider as theyreflectonthisresearch

31Right people, wrong place? |
The findings of this research imply that in addition to thinking about their workforces from a cost optimization perspective through offshoring, near-shoring or right-shoring, companies have the opportunity to revisit their revenue and growth optimization to create competitive advantage through “growth-shoring.”
The research suggests that those businesses that focus on growth-shoring to ensure that the right executive, marketing and sales, product development, research and other talent categories better match the global market opportunities will do a better job of capturing share in those markets.
In a low-growth environment, with wage stagflation across many developed markets and an increasing concentration of opportunity and social mobility occurring alongside a rise in protectionist sentiments, this research provides a clear economic imperative for more trade, and mobility of the right people to the right places, rather than less.
This work illustrates the power of combining both granular company data — such as that provided by LinkedIn — with aggregate market and industry data — such as that brought by EY. These provide the necessary inputs to both corporate strategy planning and an end-to-end talent strategy and management approach that is at the core and clearly linked to corporate and business unit strategy planning.
We would therefore suggest that, as they reflect on this research, different stakeholders ask themselves the following questions:
Companies1. Does your company treat your talent footprint relative to
market opportunity as a source of competitive advantage at the core of the C-suite agenda?
2. Do C-suite executives and business leaders understand the value/opportunity at stake?
3. How often does your company review the shifts in global market opportunity and how is that linked to an end-to-end talent strategy and management approach?
4. Does your company’s end-to-end talent strategy and management approach also include further refinements such as sub-subsector shifts, role types, seniority, automation, offshoring/wage arbitrage opportunities and diversity considerations?
5. Does your company’s end-to-end talent strategy take into account the importance of having international talent rotate through the home office, succession planning, engagement and performance management linkages?
6. Who owns/sponsors the topic of mobile talent in your organization? Is it viewed as strategic or ad hoc? Does it connect to and act in response to a larger end-to-end talent strategy and management approach?
Policymakers1. Does national policy/regulation support the importance of
enabling domestic companies to reach and be successful in other geographies?
2. What barriers exist in terms of further encouraging a better talent footprint/market opportunity alignment?
3. Is there a shared view among policymakers around the importance of the value and opportunity in national companies better participating where the market opportunity is?
Investors and shareholders1. Is there untapped opportunity in having investments make a
better (and earlier) match to global opportunities?
2. Is your investment strategy to reach global market opportunities and economies of scale and scope, focused more through individual companies with a global footprint or a portfolio of market-specific companies?
As part of this joint research, industry, geography and company-specific insights and reports are available.

About EYEY is a global leader in assurance, tax, transaction and advisory services. The insights and quality services we deliver help build trust and confidence in the capital markets and in economies the world over. We develop outstanding leaders who team to deliver on our promises to all of our stakeholders. In so doing, we play a critical role in building a better working world for our people, for our clients and for our communities.
EY refers to the global organization, and may refer to one or more, of the member firms of Ernst & Young Global Limited, each of which is a separate legal entity. Ernst & Young Global Limited, a UK company limited by guarantee, does not provide services to clients. For more information about our organization, please visit ey.com.
About EY’s People Advisory ServicesAs the world continues to be impacted by globalization, demographics, technology, innovation and regulation, organizations are under pressure to adapt quickly and build agile people cultures that respond to these disruptive forces. EY People Advisory Services believes a better working world is helping our clients harness their people agenda — the right people, with the right capabilities, in the right place, for the right cost, doing the right things.
We work globally and collaborate to bring you professional teams to address complex issues relating to organization transformation, end-to-end employee life cycles, effective talent deployment and mobility, gaining value from evolving and virtual workforces, and the changing role of HR in support of business strategy. Our EY professionals ask better questions and work with clients to create holistic, innovative answers that deliver quality results.
© 2017 EYGM Limited. All Rights Reserved.
EYG no. 06149-173GBL
BMC Agency GA 1006101
ED None
This material has been prepared for general informational purposes only and is not intended to be relied upon as accounting, tax or other professional advice. Please refer to your advisors for specific advice.
ey.com/PAS
EY | Assurance | Tax | Transactions | Advisory