Right-of-Way Effects of Controlled Access Type Highway on ... · PDF fileDisposition of Money...
126
RIGHT OF WAY EFFECTS OF CONTROLLED ACCESS TYPE HIGHWAY ON A FARMING AREA IN COLORADO AND FAYETTE COUNTIES, TEXAS By' Hugo G. Meuth Assistant Research Economist , Research Report' 58-6 Research Study Number 2-15-63-58 Right of Way Acquisition Effects on the Remaining Rural Farms and Ranches Sponsored by the Texas Highway Department in Cooperation with the U', S. Department of Transportation F·ederal Highway Administration November, 1970 ;TEXAS TRANSPdRTATION INSTITUTE Texas A&M University College Station, Texas
Transcript of Right-of-Way Effects of Controlled Access Type Highway on ... · PDF fileDisposition of Money...
RIGHT OF WAY EFFECTS OF CONTROLLED ACCESS TYPE HIGHWAY ON A FARMING AREA IN COLORADO
AND FAYETTE COUNTIES, TEXAS
By'
Hugo G. Meuth Assistant Research Economist
, Research Report' 58-6
Research Study Number 2-15-63-58 Right of Way Acquisition Effects on the
Remaining Rural Farms and Ranches
Sponsored by the Texas Highway Department in Cooperation with the
U', S. Department of Transportation F·ederal Highway Administration
November, 1970
;TEXAS TRANSPdRTATION INSTITUTE Texas A&M University
College Station, Texas

ACKNOWLEDGMENT •
LIST OF TABLES •
LIST OF FIGURES •
ABSTRACT ••
SUMMARY & CONCLUSIONS.
IMPLEMENTATION STATEMENT •
INTRODUCTION
Statement of Problem. Objectives. • Methodology • • Personal Interviews •
TABLE OF CONTENTS
. .
COLORADO-FAYETTE COUNTY AREA •
STUDY AND CONTROL AREA • . . .
..
Description of Study and Control Area • .. • • Degree of Operator Participation in the Study • Characteristics of Operators.
RIGHT OF WAY TAKINGS •
Payments Received for Land and-Improvements. Disposition of Money Received for Right of Way. Size of Takings • • •
FARM OPERATIONS. . . Changes in Number, Size and Tenure of Operations.
Right of Way Tracts • • • • All Tracts in Operations.
Changes, in Kind and Intensity of Land Use •
. . . . . .
. .
. . . . .
. . .
. . . .
• • Right of Way Tracts of Study and Control Operators. All Tracts of 18 Study and 19 Control Area Operators. Intensity pf Land Use •
. . • •
Changes in Crop and Livestock Production •• Right of Way Tracts • All Tracts in Operations.
ii
. .
Page
iv
v
viii
ix
xi
xviii
1
1 2 2 4
5
14
14 15 19
21
21 23 26
28 28 33
37 37 40 43
47 47 50
CHANGES IN EXPENSES AND INCOME • . . . . . . . Page 63
Operating Expenses. • • • • • • • 64 Livestock Purchases • • • • • • • • • • • • • 69 Sales of Livestock and Livestock Products and Other Farm
Products • • • • • • • • . . . . . . . . . . . Changes in Income • • • • • . .. , . . . . . . . . . .
CHANGES IN TRAWL REQUIREMENTS • . . . .. Travel to the Nearest Shopping Center • Travel Connected with Operations.
study Area Travel • • • • • • Control Area Trave~ • •
LAND SALES IN THE AREA • •
. . .
APPENDIX .- SUPPLEMENTARY TABLES. • . . .
iii
. . . . . . . . . . . . . . . . . . . . . . . . . . . . . . . . . .
71 77
88
88 93 93 98
100
102
ACKN-OWLEDGMENT
The author wishes to express appreciation to all who helped in_
both formulating and conducting this study. _ Special thanks are due to.
the two sponsoring agencies, the Texas Highway Department and the Federal
~ay Administration, for their conti~ued support and guidance.
Mr. Walton Threadgill of the Texas Highway Department was most helpful
in selecting the study area and supplying information relating to
right of way taking.
Thanks are also extended to the personnel of the Colorado County
Agricultural Stabilization and Conservation Office and to each study
and control area operator who furnished infonnation relative to the
farming operations in study and control areas.
D.r. W. G. Adkins and Dr. c. V. Wootan of the Texas Transportation
Institute gave valuable assistance to the design and imple111entation of
the study. Thanks are also extended to Mrs. Beverly Serpa for her I
efforts in typing and preparing the report for publication.
The opinions, findings and conclusions expressed in this
publication are those of the author and not necessarily those of the
Texas Highway Department or· the Federal Highway Administration.
iv
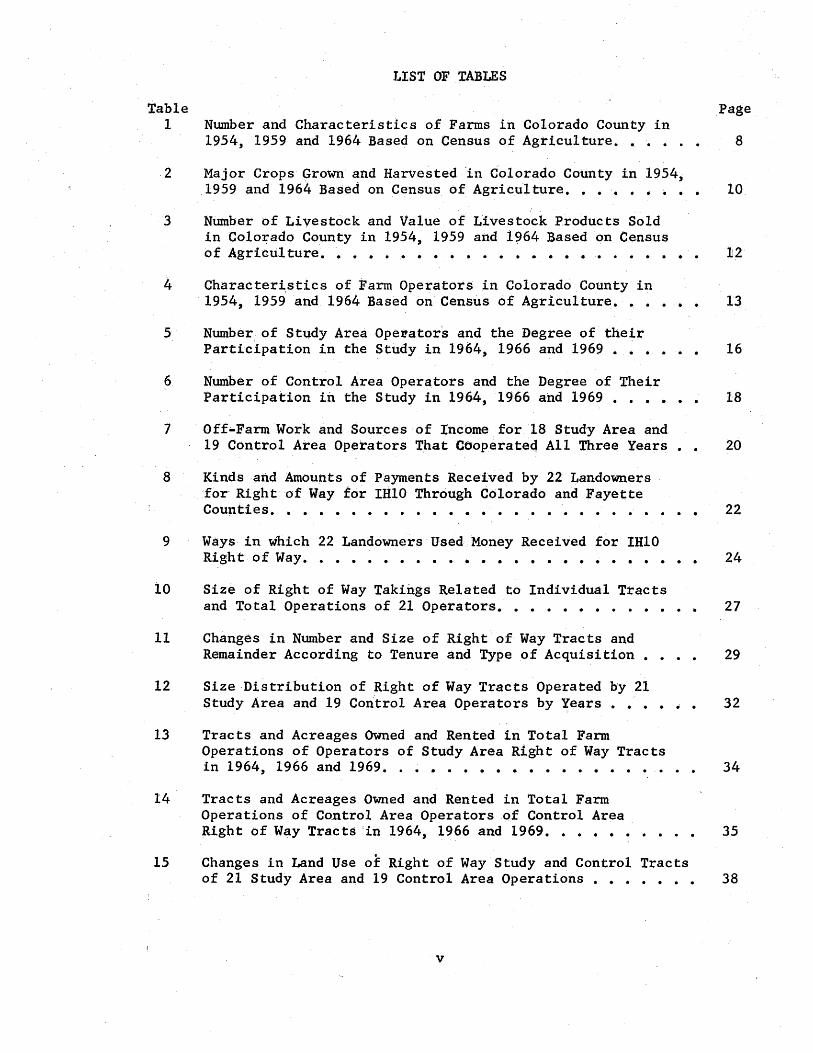
Table 1
2
3
5
6
7
8
9
10
11
12
13
14
15
LIST OF TABLES
Number and Characteristics of Farms in Colorado County in 1954, 1959 and 1964 Based on Census of Agriculture ••
Major Crops Grown and Harvested 'in Colorado County in 1954, 1959 and 1964 Based on Census of Agriculture. • • •
Number of Livestock and Value of Livestock Products Sold in Colorado County in 1954, 1959 and 1964 Based on Census of Agrictilture. • • • • • • • • • • • • • • • • • • • • •
Characteristics of Farm Operators in Colorado County in 1954, 1959 and 1964 Based on Census of Agriculture ••• . . . Number of Study Area Opel'ators and the Degree of their Participation in the Study in 1964, 1966 and 1969 • • • •
Number of Control Area Operators and the Degree of Their Participation in the Study in 1964, 1966 and 1969 • • • •
Off•Farm Work and Sources of Income for 18 Study Area and 19 Control Area Operators That Cooperated All Three Years
Kinds and Amounts of Payments Received by 22 Landowners for- Right of Way for IHlO Through Colorado and Fayette Counties. • • • • • • • • • • • • • • • • • • •
Ways in which 22 Landowners UsedMoney Received for IHlO Right of Way. • • • • • • • • • • • • • • • • •
Size of Right of Way Takings Related to Individual Tracts and Total Operations of 21 Operators. • • • • • •
Changes in Number and Size of Right of Way Tracts and Remainder According to Tenure and Type of Acquisition •
Size ·Distribution of Right of Way Tracts Operated by 21 Study Area and 19 Control Area Operators by Years • • fi •
Tracts and Acreages Owned and Rented in Total Farm Operations of Operators of Study Area Right of Way Tracts in 1964, 1966 and 1969 •.•••••••
Tracts and Acreages Owned and Rented in Total Farm Operations of Control Area Operators of Control Area Right of Way Tracts 'in 1964, 1966 and 1969 ••••••
Changes in Land Use of Right of Way Study and Control Tracts of 21 Study Area and 19 Control Area Operations • • • • • • •
v
Page.
8
10
12
13
16
18
20
22
24
27
29
32
34
35
38
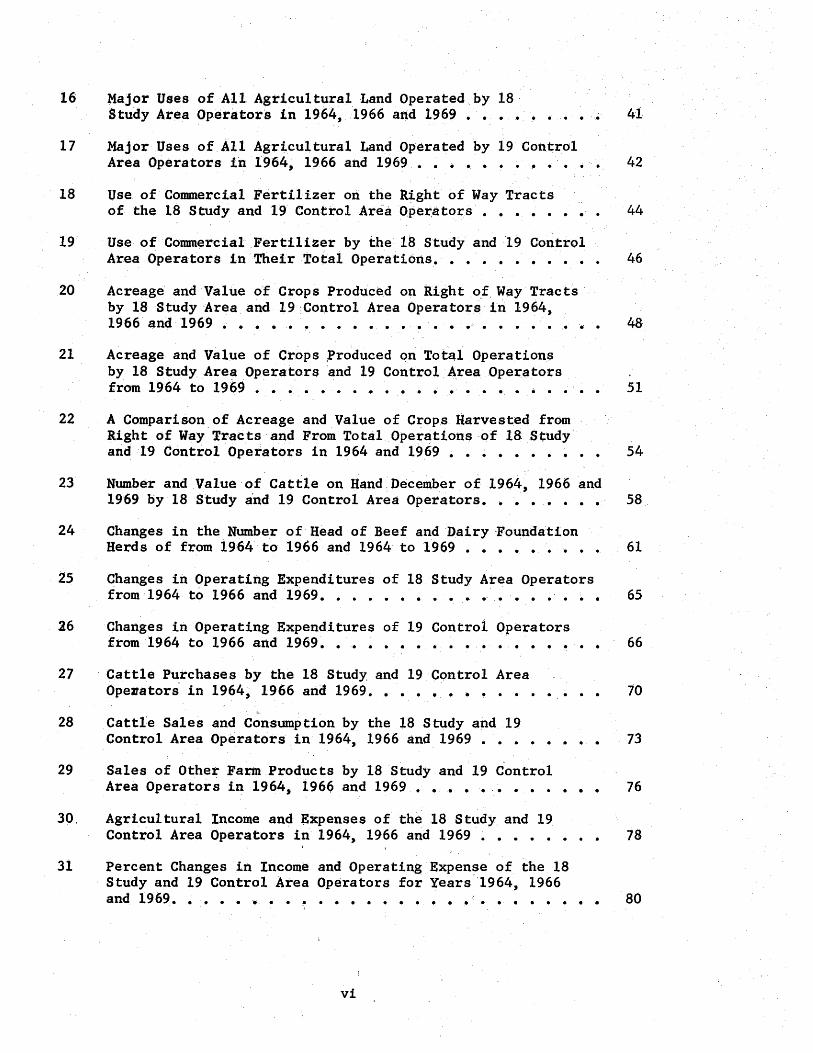
16 Major Uses of All Agricultural. Land Operated_by 18 Study Area Operators in 1964,. 1966 and 1969 • • • • . • • • • .• 41
17 MaJor Uses of All Agricultural Land Operated by 19 Control Area Operators in 1964, 1966 and 1969 • • • • • • • ~ • • • • 42
18 Use of Commercial Fertilizer on the Right of Way Tracts of the 18 Study and 19 Control Area Ope~a tors • • • 44
19 Use of Connnercial Fertilizer by the 18 Study and 19 Control Area Operators in Their Total Operations. • • • • • • • • • • 46
20 Acreage· and Value of Crops Produced on Right of_ Way Tracts by 18 Study Area and 19 :.Control Area Operators in 1964, 1966 and 1969 • • • • • • • • • • • • • • • •. • • • • • • • • 48
21 Acreage and Value of Crops .Produced on Total Operations by 18 Study Area Operators ·and 19 Control Area Operators from 1964 to 1969 • · • • • • • • • • • • • • • • 51
22 A Comparison of Acreage and Value of Crops Harvested from Right of Way Tracts and From Total Operations of 18 Study and 19 Control-Operators in 1964 and 1969. • • • • • • • 54
23 Number and Value of Cattle on Hand.December of 1964, 1966 and 1969 by 18 Study a'nd 19 Control Area Operators. • • • • • 58
24 Changes in the Number of Head of Beef and Dairy ·Foundation Herds of from 1964 to 1966 and 1964 to 1969 • • • • • • • • • 61
25 Changes in Operating Expenditures of 18 Study Area Operators from 1964 to 1966 and 1969. • • • • • • • • • • • • 65
26 Changes in Operating Expenditures of 19 Control Operators from 1964 to 1966 and 1969. . . . . . . . . ... . 66
27 Cattle Purchases by the 18 Study and 19 Control Area Opeuators in 1964, 1966 and 1969. . . . . . . . . . . . . 70
28 Cattle Sales and Consumption by the 18 Study and 19 Control Area Operators in 1964, 1966 and 1969 • 73
29 Sales of Other Farm Products by 18 Study and 19 Control Area Operators in 1964, 196~ and 1969 • • • • • • • • • 76
30. Agricultural Income and Expenses of the 18 Study and 19 Control Area Operators in 1964, 1966 and 1969 • • • • • • 78
31 Percent Changes in Income and Operating Expense of the 18 Study and 19 Control Area Operators for Years ·1964, 1966 and 1969 •••••.•••••••••••••• ( • •. • • • • 80
vi

32
33
34
35
Frequency Distribution of 18 Study and 19 Control Area Operators Based on the Net Cash Operating Income Per Operator for 1964, 1966 and 1969 ••.••••.••••••
Frequency Distribution of the 18 Study and 19 Control Area Operators Based on the Changes in tqe Net Operating Income from Agriculture in 1964, 1966 and 19.69 •••
Income from all Sources for 18 Study and 19 Control Area Operator~ for 1964, 1966 and 1969 • • • • •
Mileage Changes in One-Way Distances to Nearest Shopping Center by Type of Road for Those Farmers Who Had Their Travel Routes to Weimar or Their Nearest Shopping Center Affected by the Construction of Inteistate. • • • . . ..
36 One-Way Mileage by Type of Road from Headquarters of 21 Study Area Operators and 19 Control Area Operators to all
82
84
87
92
Tracts Operated Before and After the Highway. • • • • • • 94
37 .Extra Travel (One-Way Miles) Required Annually for Seven Study Area Operators of Severed Tracts in the After Period. • 96
38 Travel Distances of 16 Control Area Operators That had ~ultiple Tract Operations in 1964 and 1969. • • • • • • 99
39 Size, Land Use and Arrangement of 22 Right of Way Tracts Operated by 21 Operators Before and After the Location of Highway~ • • • • • • • • • • • • • • • • • • • • • • 103
40 Distribution of 22 Right of Way Takings as a Percentage ofAcres in Right of Way Tracts and Total Operations. • • • • 104
41 General Land Use and Tenure on 22 Right of Way Tracts and Takings • • • • • • • • • • • • • • • 105
42 Characteristics Relating to Size, Tenure and Type of Land in the 20 Control Area Right of Way Tracts of 19 Control Area Operators.
43 Changes in Land Use of Right of Way Tracts of the 18 Study Area and 19 Control Area Operators, 1964-69 • • • • • • • 107
vii
LIST OF FIGURErS
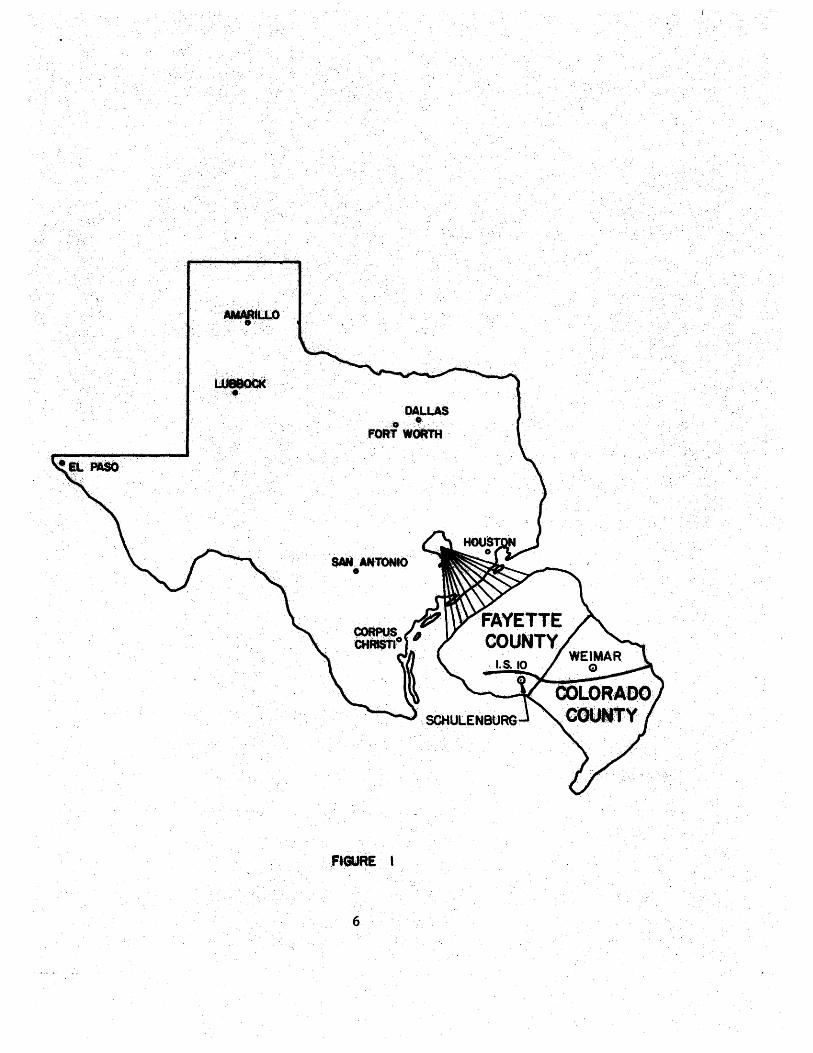
Figure Page 1 General Location of Fayette and Colorado Counties. • • • • 6
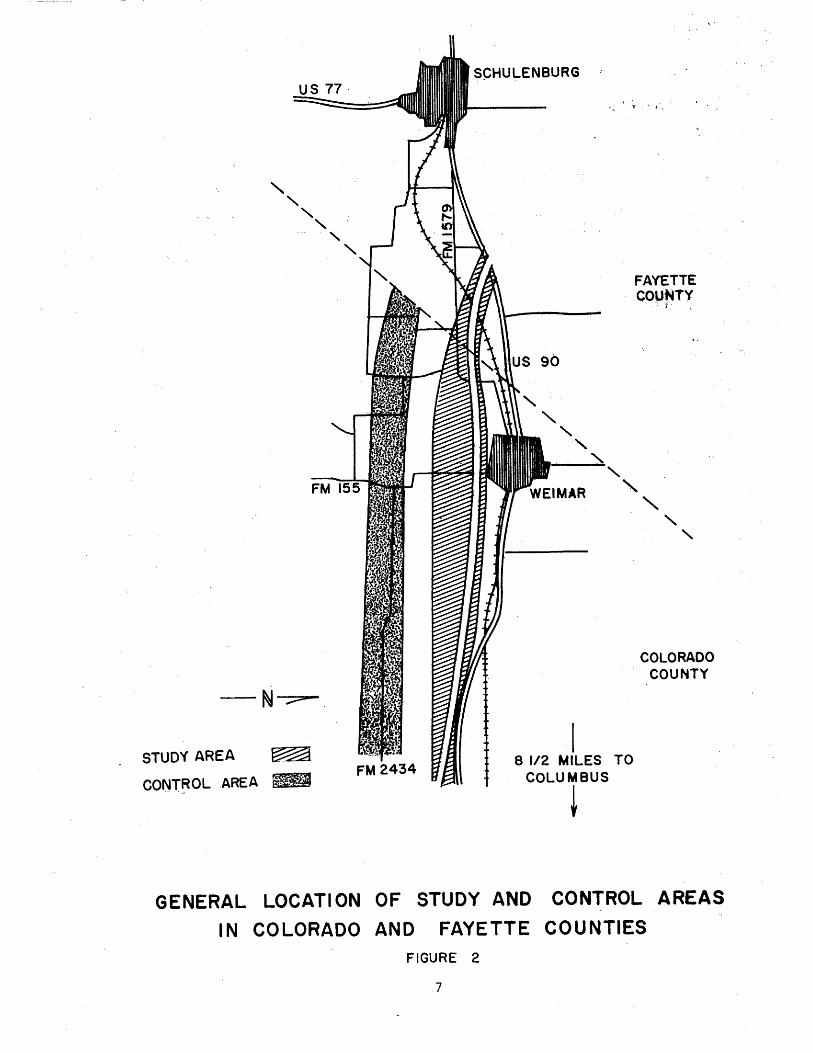
2 Study and Control Areas in Colorado and Fayette Counties • 7
3 Location .of the Headquarters of Study Ar_ea Operators in Colorado County •••••••••••••••••• ~ 89
4 Location of the Headquarters of Control Area Operators in Colorado County • • • • • • • • • • • • • • • • • • 90
viii
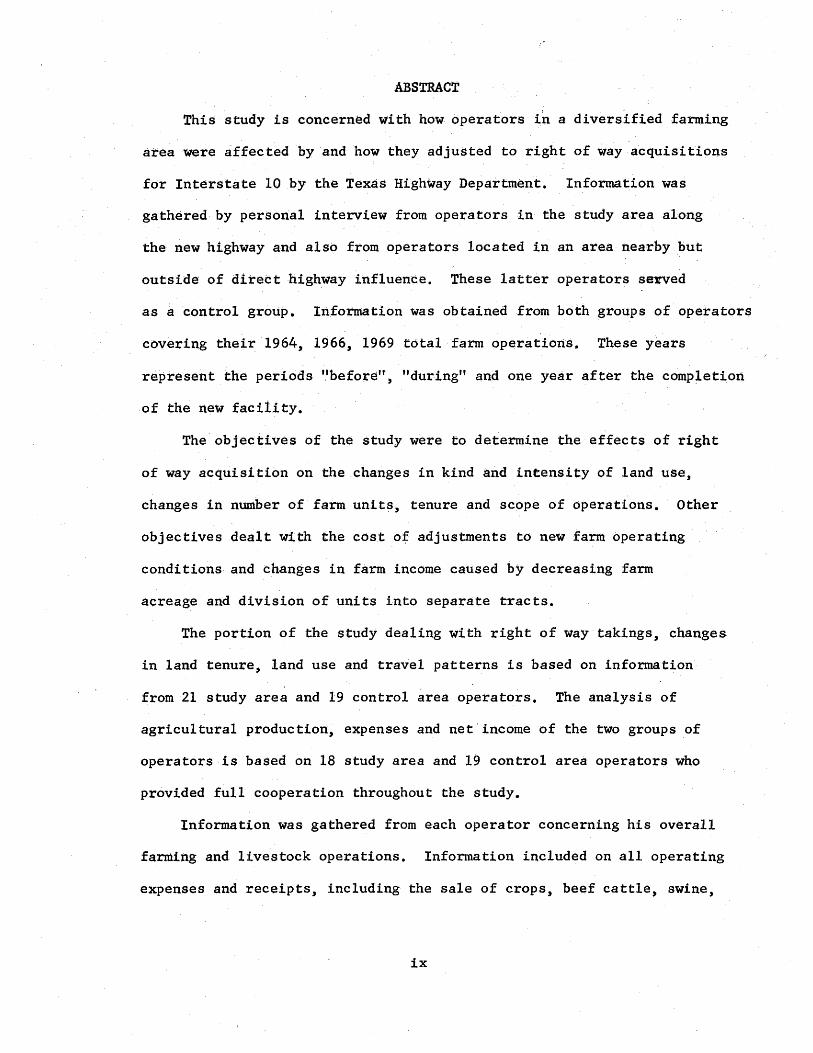
ABSTRACT
This study is concerned with how operators in a diversifiedfarming
area were affected by and how they adjusted to right of way acquisitions
for Interstate 10 by the Texas Highway Department. Information was
gathered by personal interview from operators in the study area along
the new highway and also from operators located in an area nearby but
outside of direct highway influence. These latter operators served
as a control group. Information was obtained from both groups of operators
covering their 1964, 1966, 1969 total farm operations. These years
represent the periods '.'before", "during" and one year after the completion
of the new facility.
The objectives of the study were to determine the effects of right
of way acquisition on the changes in kind and in,tensity of land use,
changes in nwnber of farm units, tenure and scope of operations. Other
objectives dealt with the cost of adjustments to new farm operating
conditions and changes in farm income caused by decreasing farm
acreage and division of units into separate tracts.
The portion of the study dealing with right of way takings, changes
in land tenure, land use and travel patterns is based on information
from 21 study area and 19 control area operators. The analysis of
agricultural production, expenses and net.income of the two groups of
operators is based on 18 study area and 19 control area operators who
provided full cooperation throughout the study.
Information was gathered from each operator concerning his overall
fanning and livestock operations. Information included on all operating
expenses and receipts, including the sale of crops, beef cattle, swine,
ix
dairy and poultry products covering the three periods of study.
It was found that the taking of right of way for Int:erstate
10 had a short term effect on farm operations, but after a few ye.ars
to allow for adjustments, the operators-as a whole made noticeable
·gains in the amount of income from agri,culture. No major changes in land
use or tenure could be attributed to the highway. Also, travel
patterns of the local operators were changed very little by the limited
access type highway.
X
SUMMARY AND CONCLUSIONS
General Sumrilacy
This report sttirnnarizes the effects of Interstate 10 on 21 se.lected farm
operations in Colorado and Fayette Counties. In this area about 12 percent
of the right of way tract acreage was acquired for the highway. Even though
right ·of way acquisition had some minor effects on size and land use of right
of way tracts such effects tend to be obscured by the fact that most study area
operators farmed large acreages of other land. However, small operators with
only a right of way tract and some small renter-operators experienced more
difficulty in adjusting their operations. Farm income of the study area operators
was adversely affected in the period innnediately following right of way acquisition,
but with additional time to make adjustments, they were able to show substantial
increases in net income. Generally, it appears that the benefits derived from
the new .highway such as enhancement of land values and imp~oved travel
conditions in the area more than offset the loss of land or inconvenience
caused by the new highway.
Detail Sunnnary
A summary of the findings relative to changes in land use, lc':llld tenure and
travel patterns of the oper~tors affected by Interstate 10 is presented below:
1. The study is based on data gathered from 21 study area operators,
with 22 tracts containing 3,090 acres affected by right of way ac
quisition, and 19 control area operators. Right of way tracts ranged
from 41 to 480 acres in size and averaged 140 acres. Right of way
takings totaled 375 acres and created 35 remainders averaging 78 acres
and with a range in size from 1 to 304 acres. Following the combinations
xi
of three remainders, sale of two remainders into non-agricultural use
and two remainders being idle, the ntunber of right of way tracts in
agricultural operations had· been reduced to 28 tracts averaging 96
acres in 1969. Through these adjustments 31 acres w-ere removed from
agricultural use.
2. Nine of the right of way takings took land from only one side of
tracts and reduced the average size of• the tracts from 129 acres
to ·118 acres which remained unchanged in number and size through
1969 •· Thirteen takings divided or severe·d right of way tracts
resulting in 26 remainder· parcels with average size of 64 acres.
By· 1969, they had been reduced in number to 19 averaging · 85 ·acres
in size.- Thus the combination of tracts occurred wholly among the
severed tracts as did the net decrease in agricultural land. Several
small remainders from severed tracts became sui table for rural resident
sites.
3. The Texas Highway Department acquired 375 acres from the 22 tracts, or
an average of 17 acres. The 13 owner-:-:operators received $57,392 for
181 acres and the nine landlords received $85,279 fo.r 194 acres. The
p~yments included money ~or land, improvements, easements and damages
to the remaining property. The owner-operators received an average of
$4,415 each~ while the landlords received an average of $9,475 for right
of way. The owner-operators deposited about 41 percent of the money in
savings,accounts. 'l'he next largest expenditure, 19.2 percent by three
operators was used to pay on mortgages. Another 10.3 percent of the
' money was used in making adjustments,' including the constructing of
fencing on right of way tracts, such things as constructing corrals and
ponds for water supply on the severed tracts. Landlor'ds used 9 percent
Xii
of their. payments for fencin.g and provision for water, the use of
the other 91 percent of their right of way money was not determined.
4. Th~se operations, befng somewhat smaller than those, in the Madison or
Ellis County studies, had a larger percentage of their land acquired
for right of way. Acreage acquired represented 7. 4 percent of the
acreage .in total operations and 12.1 percent of acreage in the right
of way tracts. Right of way tracts constituted the total acreage of
eight operators. Operators of these tracts lost an.average of 9.7
percent of their land to right of way with the range of_ takings being
from 1. 6 percent to 26.5 percent • The 13 operators of multiple tracts
lost from a low of 3.6 perc~nt t~ a high of 13.7 of their total acreage
to right of way takings. The largest taking from one operator was 65
acres. from two right of way. tracts. This taking was equal to only 11.6
percent. of the two right of way tracts involved and only B. 6 per.cent of
the operator's total acreage.·. Two operators lost over 40 percent of their
right of way tracts but both of these operated large acreages in other
tracts.
5. ThE! 21 study area operators farmed 22 right of way tracts and 28 n.an~---
right of way tracts in 1964. The 19 control area operators farmed 20
hypothetical right of way tracts and 30 non-right of w_ay tracts. In
1964, the study area operations averaged 242 acres in size and opera
tions in the .control area averaged 334 acres. The average sizes of the
50 tracts which each group operated were 102 ac.res for the study operators
and 127 ~cres for the control operators. Between 1964 and 1966 the study
area operators decreased thei.r acreage by 286 acres with an increase of
xiii
12 traets. However, the control group decreased its acreage by 1, 183_
acres and tracts· by five. Right of way remainders accounted for 10 of
the 12 added tracts .in the study area in 1966. Between 1966 and 1969,
the study area operators reduced their total acreage operated by 60
acres, while the control operators had a small increase in acreage
operated. During this period the study area operators reduced the
number of traets by seven. Four of the decreases in· tracts resulted
from the sales or combinations of remainder tracts.
6. Based on the. combined land use patterns on right of way tracts there
was little difference between farm operations in the study and control
area. However, four study operators with tracts divided by the highway
made changes in land use on remainder tracts tha·t were directly related
to the effects of the highway. These changes usually consisted of small
acreages being shifted from one agricultural use to another. Throughout
the study -period, owner-operators in both areas were devoting more of
their cropland to livestock operations and clearing and improving a
greater percentage of their pastureland. There did not appear to be any
significant changes D1ade by the study area operators that might be related
to the effects of the highway.
7. As was the case with the right of way tracts from 1964 to 1969, land use
patterns of the study and control area total operations remained rather
stable, but the operators in both areas had fewer cropland acres harvested.
Since the highway acquired about 70 acres ·of cropland from the 18 study
area operators some of this loss in acres harvested could be· related to
the effects of the highway. Even though right of way acquisition had
xiv

some minor effects· on the land use of right of way tracts,,- such
effects tend to be obscured by the fact that study area operators
farmed large:· acreages of other land.
B. Eleven of the 18 study area operators cooperating .in the study·
all three years. reported that they. reduced their cattle inventocy'
from one to ten head immediately after right of way acquisition~·
By 1966, howe~r, eight of these operators had made adjustments· or
improvements on the remaining tracts which allowed them to add extra
cattle to their operations. Operators in both areas increased their
breeding herds in both 1966 and 1969. The increases were more pro
nounced for the control operators, who had a 23.3 percent increase
from 1964 to 1969, as compared to 5.5 pe·rcent increase for the study
area·operators. However, between 1964 and 1966, the increases were
more similar as the s1;:udy area operators experienced a 8.1 percent
increase in their found-ation herds compared to ·a 9. 4 percent increase
for .the control operators. However, based. on changes in cattle numbers
by individ~al operators it appears that for most study area operators
the highway had little effect on the foundation herds. The operators
most affected by the highway were the small ones with only a right of
way tract in their operations and from whom takings represented over
15 percent of their acreage.
· 9. Based on total agricultural operations, it appeared that the income
of the study area operators was rtot noticeably affe:cted by the loss
of land to right of .way. Operators in the study area had a greater
increase in net cash farm operating income between 1966-1969 and
between 1964-1969 than did operators in the control group. The
XV

lesser increase in net cash operating income for the study area
operators between 1964 and 1966 was characteristic of the "during
period" income patterns fotm.d in the Ellis and Madison County studies.
As mentianed in the two pr~vious study reports, this difference indi
cates that generally the 'study area operators did experience a setback
in the period immediately following right of way acquisition. But
with additional time to make adjustments and improvements, partie-
ularly to pastures,. they were able to show ~ubstantial increases in
net income by 1969.
10. It was not expected that the highway would have a noticeable effect
on non-farm income of ~he study area operators. However, by comparing
the income from non-farm sources with income from agriculture, one can
determine the relative_. importance of agriculture to the operators and
in tum gain additional perspective regarding right of way takings.
Throughout the study period about 75 percent of each group of operators
had income f~om outside sources. In 1964, income _from agriculture
represented only 25 percent of the study areas operators' total- income
as compared to 39 percent of the total income of the control group.
Between 1964 ~nd 1969, study area op~rators experienced a g~eater
percentage increase in agricultural income· than did the control group,
but the ratio of agricultural income to other income increased at about
the same percentage for both groups of oper~tors.
11. The new highway. facility provided a better rou~e to the nearest shopping ;
center for nine of the operators. Their one-way distances to town were
increased by about 0.2 of a mile each, but the improv,d facility more
xvi
than offset the small amount of extra trav.el. Seven of the 13
operators with severed tracts were still operating such tracts in .. -1969. These seven operators had to travel from 0.1 to 1. 8 extra
miles to reach their severed tracts. Annually they made art average
of 111 trips or approximately 120 extra miles, in operating the
severed tracts.
12. There was limited evidence of increased land values along the route,
as a few isolated remainder tracts sold for a value somewhat greater
than the appraised value of the original tracts.
xvii

IMPLEMENTATION STATEMENT
Since the 'Te~as Highway Department is re·sponsible for appraising
and acquiring right of way, it is in the best interest of the
Department to understand bette~ the probable effects of right of
way acquisition on farm and ranch operations. Increased. knowledge of
values, potential damages and economic consequences should permit more
thoroughappraisals'for right ()f way purposes and should also be of
assistance·in right of·way negotiations and highway location.
The study should.be .. of particular interest to negotiators, as it
provides information regarding agricultural operations on remaining
right. _of way tracts and the adjustments that operators make after
highways cut through their land. This information should enable the
negotiators to act with more assurance when acquiring agricultural land
for right of way.
An effort has been made to analyze and organize the findings.in
a manner to facilitate application in right of way acquisition
problems.
xviii
INTRODUCTION
A study was begun in 1963 on the effects of right of way -acquisition
on the remaining portions of rural farms and ranches in three different
are~s of Texas.
The first area selected for study is located along Interstate 45
in Madisan County and represents an area of small ranches. The study
has been completed and results were published in 1968. The second area
selected for study is loc-ated along Interstate 35E in Ellis County and
represents an intensive farming area. The study also has been completed
and results were published in 1969. The third area is along a 10-mile
section of Interstate 10 in Colorctdo and Fayette Counties; located about
equidistant from Houston and San Antonio and was selected to represent
a diversified farming area.
This report presents findings developed from information obtained
through personal interviews with the study and control area operators.irt
Colorado and Fayette Counties. The study-is concerned with farm operations
along a section of Interstate 10 of which about nine miles are located
in the western part of Colorado County and one mile in the eastern part
of Fayette County. .
Statement of the Problem
The taking of land for right of way purposes may affect farm
operations in a number of ways. Naturally, it reduces the size of the
individual tract affected. The tract might represent an entire operation
or it might represent only a small part of lilulti-tract operation. Also,
1
a right of way taking may divide the.origirtal property in such a manner
that the eff~ctive operating size of a unit is reduced by an amount
greater than the portion taken. It may be necessary for some ope:rators
to exchange rented propc;!rty or to sell or buy other tracts in order to
reconstitute units suitable for their operations.
The extra capital from the sale of land for right of way may. stimulate
an operator to increase production through a more efficient operation.
A new highway in some areas may also cause a cJlange in the highest and
best use of the land, thus changing its overall valu~. In some ca$es
the value of the land may be greatly enhanced by the new highway, without
the land moving up the scale of land use classifications.
Objectives
The major objectives emphasized in this report are to determine the
effects of right of way acquisition upon:
1. Changes in kind an.d intensity of rural land use;.
2. Changes in the number of farm and ranch un~ts, tenure
and intensity of operations;
3. Cost of adjustments to new farm operating conditions; and.
4. Changes in farm income caused by decrea.sed farm acreage
and division of units into separate tracts.
Methodology
The study made use of the "before" and "after" approach along .with
tlae comparative control method in developin~ ~he des;red. information.
Farm management information was gathered from operators covering a full. -;_
year's operation in 1964, before the highway affected their operations in
2.

any way • Similar information was gathered from operators coverin_g their
1966 operations to reflect the period under construction. Follqwing a
full year of operation urider the influence of the completed highway;
data were collected on their 1969 operations to represent conditions of
after construction of the facility.
In order to account for an external or genetal influences not
attributable to the highway during the study periods, similar farm
management data also were collected from operators in a. control area
that was similar to the study area. in the before period.
An attempt was made to interview each study and control area
operator three times, in order to obtain detailed information regarding
each year's farm operation, along with additional data from study area
operators pertaining to changes and adjustments in their operations
caused by the highway. Data sought pertained to an operator's entire
operation, and also to each individual tract in his operation, and
were primarily of a farm management nature.
Selection of Study Areas
Study areas were sought along highways having a design equivalent
to Interstate standards and with sizeable s-egments constructed on new . .
right of way or newly aligned highways of similar widths. Also,
agriculture along these study segments had to be fairly uniform as to
type, size, and qualitr of farms; and segments should be long enough
to permit observations of a fairly large number of farms.
The three areas in Texas were selected with the counsel of staff
membe·rs of the Right of Way Division of the Texas Highway Department.
A number of sites were selected for consideration as potential study areas.
3
These sites were inspected and additional information obtained from the
Highway Department Distric.t offices. When sui table areas were found
and-approved by Highway Department personnel, maps were obtained ·from the
Highway Ueparonent to determine number of parcels, size of area, size
of takings, and other facts pertaining to the right of way acquisition. . .
Information was then obtained froni local Agricultural Stabilization
and Conservation County offices relative to operatorship, type of agriculture
and production practices. With assistance from the ASC officials a
comparable area in the general vicinity of the st~dy.area was selected
in each case to serve as the control area.
The ASC records also were used in determining the nature of a
given farmer's operation. The _records contain information on each farmer
regarding the number of tracts owned or rented, the amount of cropland
and pastureland in each tract and acres planted in crcbps under various
governntent programs. For farmers operating several tracts, the records
provide the location and some information regarding land use on each
tract. With this background information on each tract and operator,
personal contacts with operators were begun.
Personal Interviews
The interviewing normally followed the procedure of contacting each
operator and completing a questionnaire at his convenience. In most
cases, it was found that operators were glad to discuss the highway and
its effects on their operations; however, when questioned regard~ng
purchases or sales, they were more reluctant to respond. After the
4

operators were assured that the information given would be held in
confidence, complete cooperation was usually achi'eved.
COLORADO~FAYETTE COUNTY AREA
The study area selected to represent a diversified farming area
is located in the western part of Colorado County and the eastern part
of the adjoining Fayette County~· 'rhe area is located i'n South Central
Texas, between Houston and San Antonio. Inte·rstate 10 passes through
the counties parallel to U. s. Highway 90, as shown in Figures 1 and 2.
the area consists of rolling coastal plains with grass covered prairies
and has an average annual rainfall of 40 inches ·which provides suitable
moisture for either crop or. lives,tock production. According to the
Census of Agriculture, numbers of farmers in Colorado County, which contains
most of the study area, have been decreasing (Table 1). With a 10.5
percent decrease in operators from 1954 to 1964, the average farm size
increased from 357 acres in 1954 to 403 acres in 1964. This increase
in farm size often resulted from the remaining farmers adding extra
tracts of land to their operations. Such additional tracts are not
always contiguous with hhe original tract but are usually located in
the same general area.
Land values in the county more than doubled during the 1954-to 1964
period. Such a rise in land values has been characteristic throughout
the general area of the state. There has been a great demand for land
by urban residents. This is more evident now that the larger portion
of IHlO has been completed from Houston to San Antonio, providing better ·
5
·~()
DALLAS ·• ~,· .. FORT WoRTH ·
$AN ... ANTONIO . •
,FIGWRE 1
6
' ' '
STUDY AREA ~
CO~TROL .AREA ~
' ., '
S~HULENBURG
'." '
I
' '
FAYETTE COUNTY
'
.. --· -~'
' ' '
COLORADO COUNTY
8 1/2 MILES TO COLUMBUS
+
GENERAL LOCATION OF STUDY AND CONTROL AREAS
IN COLORADO AND FAYETTE COUNTIES
FIGURE 2
7
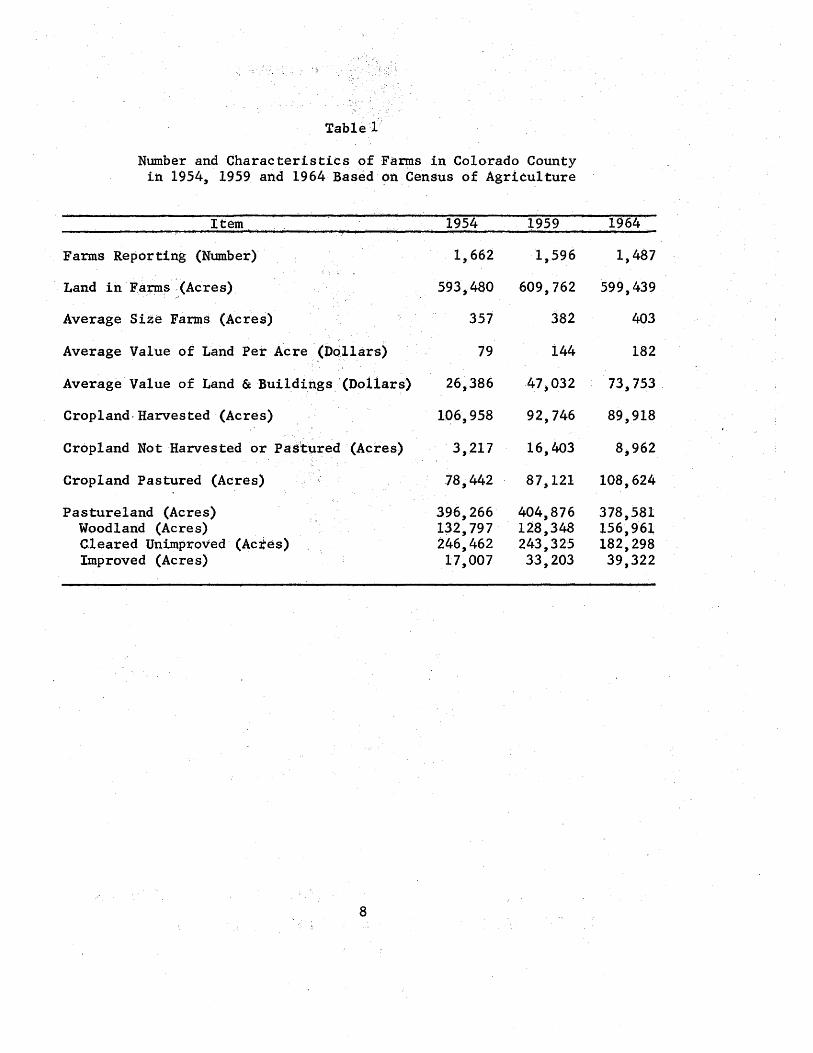
Table 1
Nl.llllber and Characteristics of Farms in Colorado County in 1954, 1959 and 1964 Based on Census of Agriculture
Item
Fanns Reporting (NUiilber)
Land in· Farrn.s :(Acres)
Average Size Farms (Acres)
Average Value of Land Per Acre (Dollars)
Average Value of Land & Buildings (Dollars)
Cropland.Harvested (Acres) --
Cropland Not Harvested or Pastured (Acres)
Cropland Pastured (Acres)
Pastureland (Acres) Woodland (Acres) Cleared Unimproved (Acres) Improved (Acres)
8
1954
1,662
593,480
357
79
26,386
1q6,958
3,217
78,442
396,266 132,797 246,462 17,007
1959
1,596
609,762
382
144
47,032
92,746
16,403
87,121
404,876 128,348 243,325 33,203
1964
1,487
599,439
403
182
73,753
89,918
8,962
108,624
378,581 156,961 182,298 39,322

access from the urban.centers. The abundance of deer is an important
factor in the market for wooded land for recreational purposes.
As shown in Table 1, there has been a sizeable decrease in the amount
of cropland harvested. This is a result of more cropland being pastured
and fewer acres being planted in cash crops. Many operators have cut
back on certain practices d~e to labor proble~s. Operators are de~oting
more of their land to cattle operations which require less hired labor
than some of the cash cropping practices. There also has been an increase
i.n part•time farming which seems to encourage lives~ock enterpri~es.
From 1954 to 1959, there was a decrease of woodland acreage in
Colorado County. This was expected since the clearing of woodland to
increase grazing capability of the land is common in·the area. However,
i:he increase in woodland acres shown in 1964 does not appear to be
logical. This also pertains to the large decrease in the amount of acres
of cleared unimproved land in 1964. It is possible that a new classification
of Lind was used in gathering the 1964 census data. However, the increase
in improved pasture acreage in 1959 and 1964 confirtns the observed
practices of farmers improving and intensifying the use of pastureland.
As shown in Table 2, crop production in Colorado County has been
gradually decreasing. Three of the four crops·showed a decline in the
number of operators producing them, as well as in the acreage harvested.
Hay was the only crop showing an increase in both acreage and amount
produced. There was an increase in the production per acre of both
cotton and corn. This is due primarily to the increased use of
fertilizer and insecticides by the more aggressive operators.
9
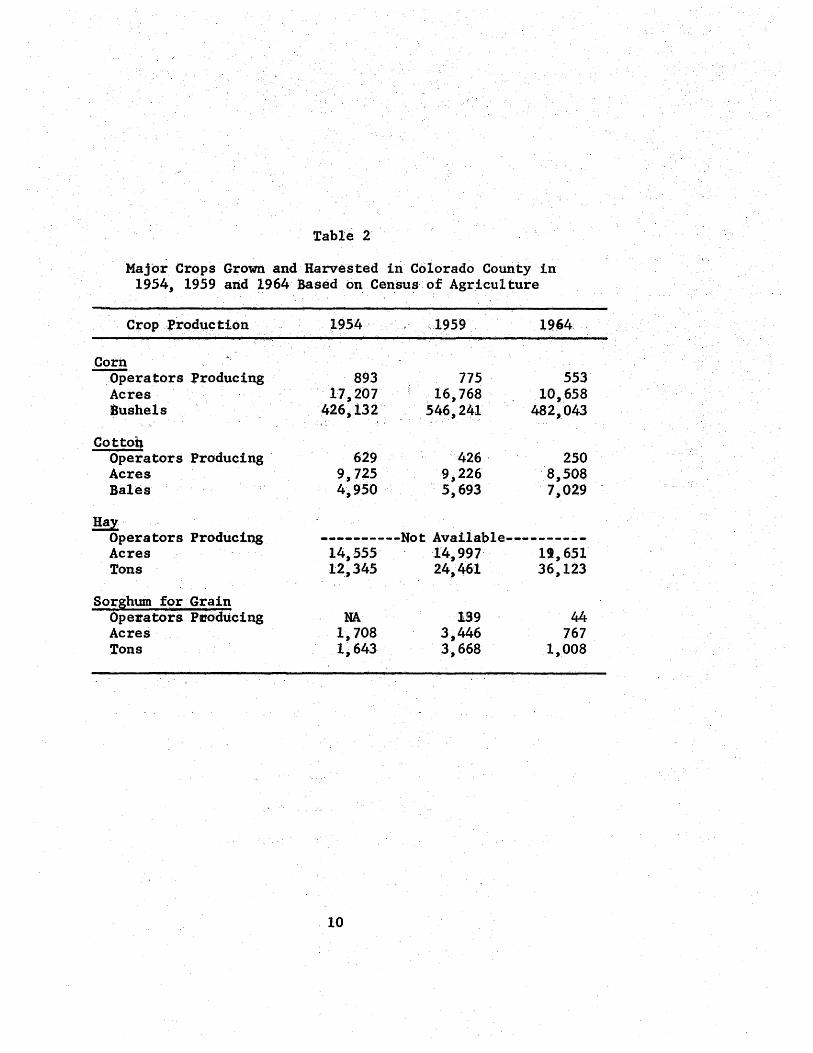
Table 2
Major Crops Grown and Harvested .in Colorado County in 1954, 1959 an.d 19~4 Based on Censu~ of Agriculture
Crop Production
Corn --operators Producing
Acres Bushels
Cottob Operators Producing Acres Bales
Hay Opera tors Producing Acres Tons
Sorghum for Grain OperatorsPcoducing Acres Tons
1954
893 ··. 17,207 426,132.
629 9,725 4,950
:.1959
775 . 16,768 5·46,241
'426. 9,226
. 5, 693
1964
553 10,658
482,_043
250 8,508 7,029
----------Not Avai1ab1e----------14,555' 14,997 19,651 12;345 24,461 36,123
NA 1,708 1, 643 .
. 10
139 3,446 3,668
44 767
1,008
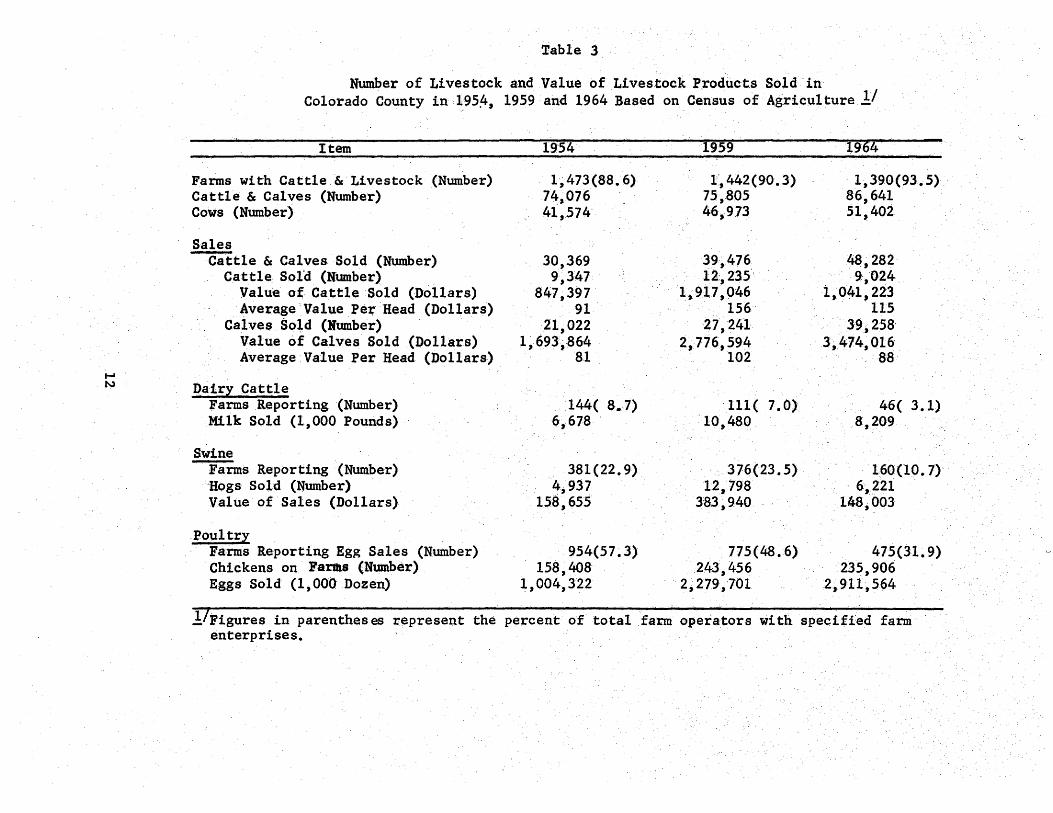
Most of the farmers in the county are involved in some form of
livestock production. Table 3 points out the importance of beef, dairy,
swine and poultry production 'in Colorado County in 1954; 1959 and !964.
over the 10-year period there has been an increase of 12,565 head of
beef cattle on the farms. Almost 10,000 head of this increase was
accounted for by the increase in the· number of mother. cows. In beef
cattle operations the cow-calf enterprise prevails in this part of the
state. The increased numbers of calves sold in 1959 and 1964 indicate
rapidly increasing beef p:r~duction. The decrease in the value per
head of cattle and calves sold in 1964 is due to lower cattle prices
that year.
There was a sizeable decrease in the number of operators reporting
dairy, swine or poultry operations in both 1959 and 1964. However,
the few remaining operators who had these enterprises in 1964 produced
more milk, swine and eggs than did the much larger number of such
operators in 1954.
According to farm operators in the area, the trends that developed
between 1954 and 1964 in crop and livestock production for the county
have continued through 1969.
Some .tenure and off-farm work characteristics of farm operators
in Colorado County are shown in Table 4. There-was an increase in the
number of full-owner and part-owner opeEa1;:or~ ancl a decrease in the
number of tenants from 1954 to 1964. Fl,tll-o'WD.ers own all the land they
·operate, whereas a tenant rents or leases his total acreage. A part-, .
owner owns a part of the land he operat~s and also rents land~
11
1-' N
Table 3
Number of Livestock and Value of Livestock Product.s S.old in Colorado County in 1,95~, 1959 and 1964 Based on Census of Agriculture J:/
Item
Farms with Cattle & Livestock (Number) Cattle & Calves (Number) Cows (Number)
Sales --cattle & Calves Sold (Number)
Cattle Sofd (Number) Value of Cattle Sold (Dollars)
. Average 'Value Pet; Head (Dollars) Calves Sold (Humber)
Value of Calves Sold (Dollars) Average Value Per Head (Dollars)
Dairy Cattle Farms Reporting (Number) Milk Sold (1,000 Pounds)
Swine · · Farms Reporting (Number)
·Hogs Sold (Number) · Value of Sales (Dollars)
Poultry Farms Reporting Egg Sales (Number) Chickens on Fams (Number) Eggs Sold (1,000 Dozen)
1.9'~~- 1959' ~~·~ ~ -· ·~!%!+
1;473(88. 6) 74,076 41,574
30,369 9,347
847,397 91
21,022 1,693,864
·. 81
144( 8 •. 7) 6,678
381 (22. 9) 4,937
158,655
954(57 .3) 158,408
1,004,322
1',442(90.3) 75,805 46,973
39,476 12:, 235''
1,917,046 . 156 . 27,241
2,776,594 102
111( 7 .0) 10,480
376(23.5) 12,'798
383,940
775(48. 6) 243,456
2;279,701
1~390(93.5) 86,641 51,402
48,282 9,024
1 041 223 , ... , . 115 39,258
3,474,016 88
46( 3.1) 8,209
160(10.7) 6,221
148;003
475(31. 9) 235,906
2,911,564
.!/Figures in parentheses r-epresent the percent of tot~! farm- op;tators-;ith--;pecffied farm enterprises.

Charactet;'iStics of Farm Operators in Colorado County in 1954, 1959 and 1964 Based on Census of Agriculture
1954 1959 1964 Item Operators Operators Oeerators
Number Percent Numbe:r Percent. Number.Percent
Total Reporting 1,662 100.~ 1,596 100.0 ~-' 487 100.0
Tenure Full Owners 803 48.3 801 50.2 '761 51.2 Part 437 26.3 499 31.3 •484 32.5 Tenants 410 24.7 291 18.2 230 15.5 Managers 12 0.7 5 0.3 12 0.8
Off the Fat1Il Emelol!!ent Total Working Off Farm 742 44.6 678 42.5 726 48.8 100 Days or More 468 28.2 501 31.4 ·559 37.6
13
More farm opeJ:ators became engaged in outside employment from 1954
to 1964. Almost 50 percent of the operators. in 1964 reported having off ..
the•farm employment with 37.6 percent of the operators working more than
100 days a year on o~f-the.;.fa:t-m· Jobs.,
STUDY AND CONTROL AREAS
Des.crip~ion • of Study. and Control ·Area
The study and control areas are each approJd.mately 10 miles in
length, ·extending east and west through Colorado and Fayette Counties.
Xhe general location of the two areas is show· in Figure 2. The town
of. Weiirul.r, population about 2,500> is located near the center of the
study area. Interstate 10 by-passes Weimar on the south near its city
limits. The new highway is located a·bout orie mile south .of and .parallel
to U. s. Highway 90. Local residents are provided access to the new
highway at three locations, these being at U. s. 90 west of Weimar, at
FM155 just south of Weimar and at :FM2434 about six miles east of Weimar.
Land in the study and control areas varies from dark soil to sandy
loam, both suitable for cash crops or pasture. there are scattered
woodlands but operators are gradually clearing the land and establishing
improved pastures. There is a definite trend away from cash crops, such
as cotton, to hay and grain for the·operators' own use in various livestock
enterprises. Most of the study and control areas are occupied by family
type farmers. There are a fe111 larger type operators, but generally
farm operations are small in both areas. Since the majority of the
operators still have varied agricultural enterprises, the areas may be
classified as diversified farming areas.
14 i
Landowners in the areas are primarily of German and Czech extraction,
and land has been passed down from one generation to an0ther. Therefore,
in many cases, people in this area are quite attached to their land.
The control area, located about- one-mile south of the study area,
appeared to be_ very similar to ehe study area in ~he "before"_ period-.
It consisted of a band of farmers located along a hypothetical line drawn
thro~gh the area parallel to Intersta-te 10. From the first interviews
with loJ?erators, it was found that operations in the-two areas were comparable
in most respects. 'l'he only noticeable difference was the larger amounts
of woodland acreage in the control area.
The two areas vary in width depending on the size and shape o'£ the
tracts of land. Some operators in both areas have multiple tract operations
and operate additional tracts of land outside the delineated study areas.
These additional tracts, classified as non-right of way tracts, are
included in the study to show the relative importance of right of_way
tracts to total operations.
Degree of Operator Participation in the Study
Right of way was acquired from 31 landowners along the lQ-mile
section of Interstate 10. Six of the -ownerships were small non-agricultural
tracts of land. Two of the landowners could not be _contacted and one
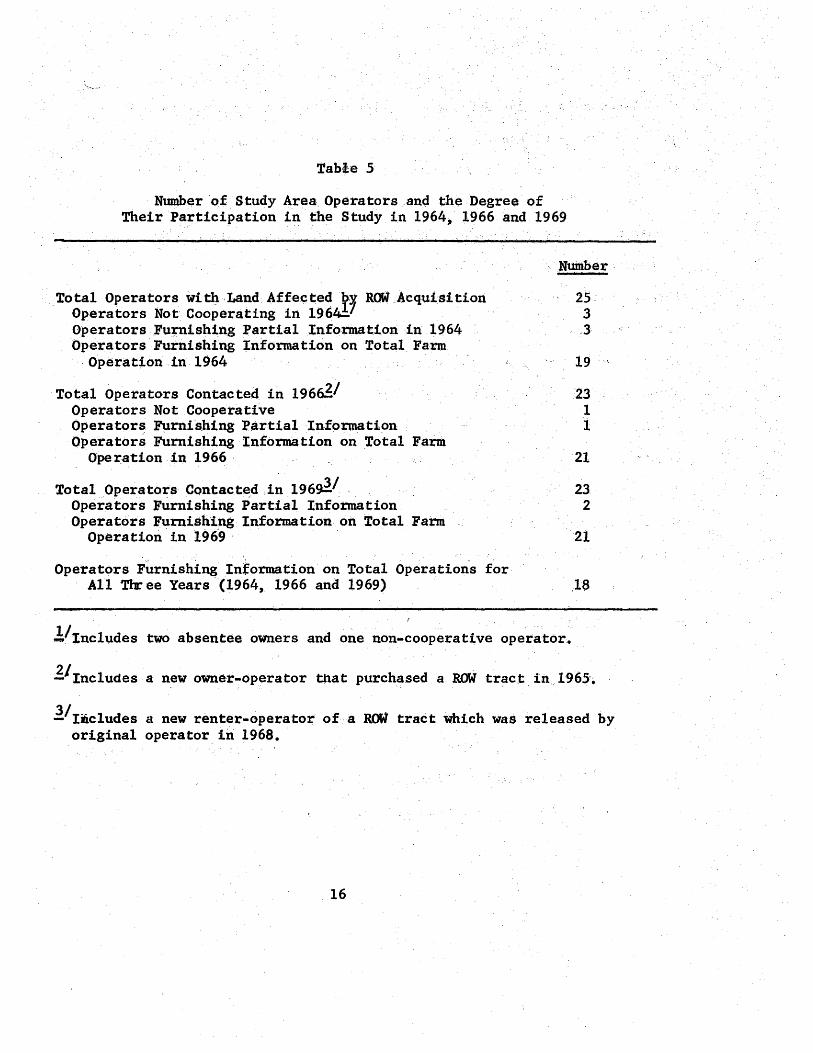
was not cooperative. Operators of the 22 other tracts furnished information
about their 1964 operations (Table 5). However, three operators furnished
limite.d information on tenure and land use only.
15
Tabie 5
Number 'of Study Area Operators .and the Degree of Their Participation in.the Study in 1964, 1966 and 1969
N\111lber
Total Operators witl),LandAffec;ted by ROW Acquisition Operators Not Cooperating in 196t.1:.7 Operators Fu:t:nishing Partial Information in 1964 Operators Furnishing Information on Total Farm
Operation in 1964
Total Operators Contacted in 196~/ Operators Not Cooperative Operators Furnishing Partial Information Operators Furnishing Information on Total Farm
Ope r:ation in 1966 ·
Total. Operators Contac.ted .in 196~/ Operators Furnishing Partial Information Operators Furnishing Information on Total Farm
Operation in 1969 · ·
Operators Furnishing Information on Total Operations for
25 3 .3
19
23 1 1
21
23 2
21
All Tlr ee Years · (1964, 1966 and 1969) ,18
!/Includes two absentee owners and one non-cooperative operator.
]:./Includes a new owner-operator tnat purchased a ROW tract in 1965·•
}_/Includes a new renter-operator of a RQlt1 tract which was released by original operator in 1968.
16
In gathering 1966 data, 23 study area operators were contacted,
with 21 furnishing information on total farm operations. One was a
new operator that p'l_lrchased a right of way tract in 1965._ .One operator
supplying partial information in 1964 refused to cooperate in 1966.
During the last interViews, 23 operators were again contacted.
One was a new operator that had rented a rj_ght of way trCJCt in 1968.
One operator who supplied complete data in ~964 and 1966 died in late
1969; limited information was obtained on his 1969, fann ·operations.
Eighteen study area operators furnished complete information .on_ all
of their farm operations for all three years. Thr.ee addi:tional operators
furnished only land tenure and land use information on their total operations -· •· ' .
for all three years. Information pertaining to land t~.nure and land use
changes on right of way tracts only was obtained frolll two new opera·tors. ·
There were 28 tracts touching the hypothetical·"right of way"
line in the control area. Two of these were not agricultural tracts.
In the firstround of interviews, 22 of the 26 operators furnished
complete operational data (Table 6). Two tract owners were absentee
operators and could not be contacted. One operator preferred not to
·participate any further in the study.
Two operators shown in.Table 6 as non-cooperative in 1966 were not
available for interview. One operator furnished 1966 and 1969 infonnation (
on land tenure and land use changes only. qomplete operational data were
obtained from 19 control area operators for all three years.
17

Table 6
Number of Co11trpl Ar$a Operators and the Degree of Their Participation in the -Study in ·.196A, 19·66 ·and 1969
Total Operators with Land Touched-by the Hypothetical Highway in the Control Area - 1964
Operators Not Con-tacted in 1964 · OperatorsContacted in 1964 Operators· Non-cooperative .· Oper~tors Fu~isb,in.g-Info~t:i.on.ori total Farm.
Operation in 1964 ·
Total Operators Contacted in 1966 Operators Non-cooperative in 1966 Operators Furnishing Parti·al. lnfonnation Operators Furn.ishing Infotlllation on Total Farlll. ·
Operation in 1966 ·
';rotal Operators Contacted in 1969 Opera.tors Furn~shill$ Partial InfoJ:mation OperatorsFurnishinginformation on Total Fann
Operation in 1969
Operators iurnishiil$ Information on Total Operations for All. Three Years 1964; 1966 and 1969
18
Nqmber
26 2
24 2
22
'22 2 1
; 19
20 1
19
19
In sections of the report dealing primarily with lartd tenure and
land use changes, the analyses include data from the 21 study and 19
control area operators. In sections dealing with the effects of right
of way takings on production and net operating income, analyses are
based on the operations of the 18 studyand 19 control area operators
that cooperated fully all three years.
Characteristics of Operators
Information was. gathered from operators pertaining to their age,
outside employment and income from sources other than farming. In 1964,
the ages of the 18 study area operators ranged from 33 to 80 years,
while those of the 19 control operators ranged from 26 to 71 years. The
average age for both groups was .53 years, and the distributions by age
classes were similar.
Table 7 presents off-farm work and proportions of income from
agriculture of the operators .in 1964 and 1969. In 1964, eight study and
eleven control area operators had no off-farm employment. Of these ~
operators, three study and five control operators received retirement
income in 1964. One study area operator with part-time, off•farm
employment in 1964 was devoting full-time to his dairy operation in
1969·. One control operator with no off-farm work in 1964 was working
full-time for about six months a year in a seasonal off-fapn job in 1969.
There was an incre·ase in the number of operators in both areas reporting
full-time, outside employment in 1969.
In 1964, study area operators had an average of 63 percent of their
income from agriculture, as compared to an average of 67 percent for the
control group, according to their estimates. Between 1964 and 1969
19
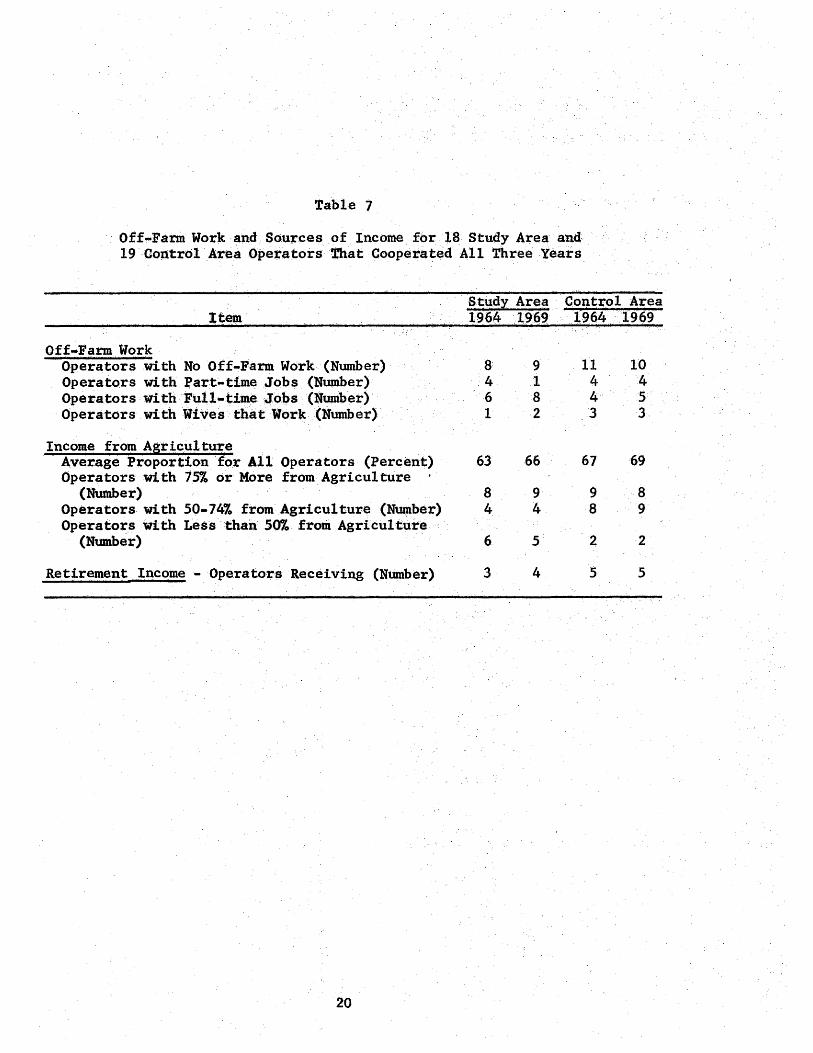
Table 1
Off-Fann Work and- Sources of Income for .·1a Study Area and: 19 Control Area Opetators that Cooperated All Three .years
Studl Area Control Area Item 1964 .. 1.969 .1964 . 19~9
Off-Farm Work Operators with No Off-Farm Work· (Number) Operators with Part~time Jobs (Number) Operators with Full-time Jobs (Number)· Opera·tors with Wives that Work (Number)·
Income from Agriculture Average Proportion for All Operators (Percent) Operators with 15% or More fromAgriculture
(Number) Operators with 50-74% from Agriculture (Number) Operators with Less than 50% from Agriculture
(Number) ·
Retirement Income - Operators Receiving (Number)
20
8 4 6 1
63
8 4
6
3
9 11 10 1 4 4 8 4 5 2 3 3
66 67 '69
9 9 8 4 8 9
5 2 2
4 5 5

there was a slight increase in the average income frotn agriculture for
both groups of operators. A few wives of operators in both areas contributed
extra income from off-the-farm work. None of the shifts in off-farm work
were-attributable to the new-highway.
RIGliT OF WAY TAKINGS
Payments Received !or Land and Improvements
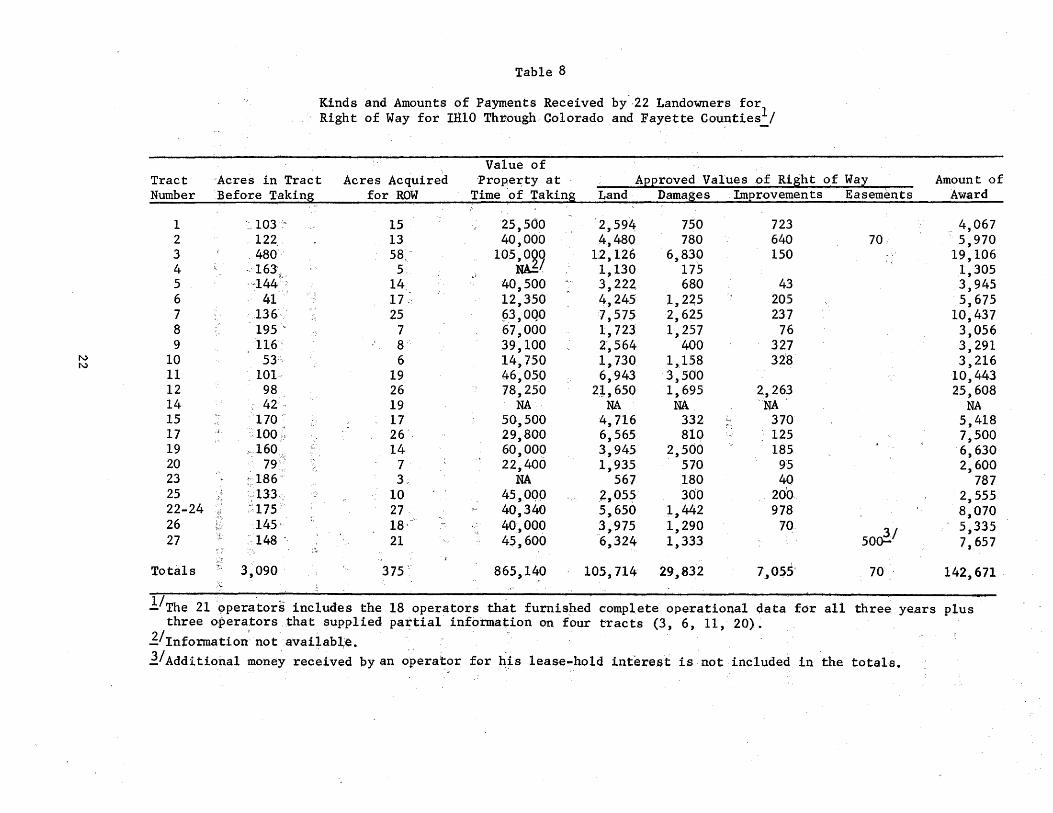
Records of the Texas Highway Department were used to determine
payments to landowners in the study area for property acquired for right
of way. Table 8 lists the 22 right of way tracts, the acreages acquired
and amounts received for land, improvements, d-rainage easements, damages
to remaining -property and, in one case, payment for a lease-hold interest.
Information regarding payments for right of way takings was not
obtained on one of the 22 tracts, so the total represents payments
received by 21 landowners. They received a total of $142,671 in payments.
The amount of land in the 21 takings was 356 acres. The approved values
of the takings varied from $787 for three acres from one side of a
186 acre. tract to $25,608 for 26 acres acquired ·from a 98 acre tract.
The highway severed the latter tract into two·remainders of 30 and 42
acres each. Takings ranged ~n size from three to· 58 acres_with the
average taking being about 17 acres.
The average appraised value of the whole property for the 19 tracts
for which approved values were available was $45,534, or ab.out $321
per acre. The owners received an average of $6,794 each for land, improve
ments, damages and easements. Payments for land purchased accounted for
21
I'.) I'.)
Table 8
Kinds and Amounts of Payments Received by-22 Landowners for Right of Way for IHlO Through Colorado and Fayette Counties_:/
Value of Tract ·Acres in Tract Acres Acquired ·Prope~ty at Approved Values of Right of Way Amount of Number Before T-aking for ROW Time of 'l'aking Land Damages Improvements Easements Award
1 ·. 103 :·· 15 2 122 13 3 '480·' 58.' 4 -.163 .. 5
···144~· ·' 5 14 6 41 17 .: 7 . 136·. 25 8 195 .. 7 9 116' 8;
10 53'' 6 11 101 19 12 98 26 14 42·' 19 15 170 ·' 17 17 100~,: 26 19 ·"_160,,. 14 20 " 79' 7· 23 :·,186" 3. 25 :.:133. 10 22-24 ·175' 27 26 145 18··· -~
27 -~·148 -. 21 ·' .. •·'1'
Totals 3;090 375 ,. '"
25,500 2,594 40,000 4,480
105,009 12, 126 ~ 1,130
40,500 .t.-. 3,222 12,350 4,245 93,0QO 7,575 67,000 1,723 39,100 2', 564 14,750 l, 730 46,050 6, 943 78,250 21 650 .. '
NA NA 50,500 4,716 29;800 6,565 60,000 3,945 22,400 1,935
NA 567 45,000 .2,05? 40,340 5,650 40,000 3,975 45,600 6,324
865,14.<J 105,714
750 780
6,830 175 680
l,2Z5 2,625 1,257
400 1,158 3,500 1,695
NA 332 810
2,500 570 180 30'0
.1, 442 1,290 1,333
29,832
723 640 150
43 205 237
76 327 328
2, 263 NA.
370 ·. 125
185 95 40
200-978
70
7,055''
70
soc);/
70
4,067 5,970
19,106 1,305 3,945 5,675
10,437 3,056 3,291 3,216
10,443 25,608
NA 5,418 7,500 '6, 630 2,600
787 2,555 8,070 5,335 7, 657
142,671 "
.!/The 21 9perators includes the 18 operators that furnished complete operational data for all three years plus three operators .that supplied partial information on four tracts (3, 6, 11, 20).
~/Information, not available. .
1./ Additional money rec~ived by an operator for his lease-hold interest is not included in the totals.
74 percent of the total or about $5,034 per owner. Payments for damages
to remaining proper·tY averaged $1,356 to each owner or approximately 21
percent of the total award. Most of the five percent balance was for
improvements acquired, as only two owners had land affected by drainage
easements. In most cases, payments for improvements were rather small,
as no major improvements were acquired. The payments covered such
items as fences, roads, water-lines; stock ponds and small buildings.
Disposition of Money Received for Right of Wax
A few operators had difficulty tracing the flow of money receive.d
for right of way, but generally a·detailed allocation of the funds was
given. Table 9 shows the reported disposition of the payments received
by the 13 owner-operators and the 9 landlords., The two. groups of owners.
are shown separately since limited information was obtained regarding
the landlords.
The 13 owner-operators received a total of $57,392 for right of way
takings. Eight of these operators placed money in savings, which accounted
for 41 percent of total money they received. In 1969, the operators
reported that very little of this· money had been withdrawn. The next
largest sum of $11,000 was used by three owners as payments on mortg~ges ,,
against their property.
Owner-operators reported spending $4;001 or 6.9 percent of their
total payments on fences along the right of way. The average expenditure
per operation for fencing was about $300. However, this average was
influenced to a large degree-by one operator spending $1,400 for an
23

Table 9
Ways in which 22 Landowners Used Money Received for IHlO Right of Way
Percent of Item Number of Percent of Amount of Money Received
Landowners Landowners Money Used . for' R.OW
Thirteen Owner-Oeerators of ROW Tracts
Improve Land 5 42 5,025 8.8 Construct Corrals on Severed
Tracts 2 17 500 0.8 Fencing ROW 13 100 4,001 6.9 Purchase Equipment 2 17 1,250 . 2. 2 Improve or Construct Home 3 25 5,587 9.7 Water Supply (SeveredT;racts) 4 33 ·1,500 2.6 Paid on Land Note 3 25 11,000 19.2 Improve Cash Position 8 75 23,660 41.2 Purchase Consumer Goods 4 33 1,843 3.2 Miscellaneous 2 17 3,026 5.3
Total 13 .?7,392 100.0
Nine Landlords of Ei~ht Renter-Oeerators of ROWTracts
Fencing ROW Tract 9 100 4,838 6.0 Water Supply (Severed Tract) I 4 44 2,090 3.0 Money Not Used on ROW Tract~ 9 100 78,351 91.0
Total 9 85,279 100.0
_11 According to reports of renters.
2·4
above-the-average fence along his severed tracts. Most operators·
reported fencing costs· of less than $200.
Three owner-operators reported that they used $5,587 for improvements
to their homes, almost equal amounts being spent by each in this manner.
Five operators spent $5,025 or 8.8 percent of the total on the improvement
of agricultural land. Three operators cleared woodland and planted and
fertilized improved varieties of grasses. The other two operators
planted and fertilized improved grasses on cleared, but unimproved,
pastureland.
Five owner-operators reported expenditures directly related to the
effects of the highway on their re_maining right of way tracts. Corrals
were,constructed on several tracts by two operators and four operators
spent $1,500 for the construction of reservoirs for stock water on several
tracts severed by the-highway. ·In contrast to the Madison County and
·Ellis County studies, no operator.s in this area used any of the money
they received to purchas·e additional .land.
The eight renter-operators of the nine right of way tracts could
give estimates for only about nine percent of the $85,i79 of payments
received by landlords. The largest expenditure by the nine landlords
was for the construction of fencing along the highway route. All used
some of their paY-ments for fencing with the amounts spent ranging from
$75 to $750 •. It was reported that ·four landlords spent money for water
supplies on severed tracts. 'XWo landowners improved existing water wells
and two had earthen reservoirs built in order that severed tracts could
be used.for liv~stock operations.
25
Of the $142,671 received by all owners, approximately nine percent
was spent on itetns neceasary to conti.nue the use of the right of 1>1ay
tracts.
Size of Takings
Table 10 lists the 21 study aeea operators and compares the size
of takingS to the acreages in right of way tracts and total .farm operations
prior to right of way acquisition. The 21 operations varied in size from
.98 acres in one tract to 757 acres in five tracts. The 22 right of way
tracts represented 41.5 pet:cent of all tracts operated but contained
60.7 percent o£-the total acreage operated. This suggests that the right
of way tracts were most often "main" tracts- and indeed about two-thirds
of the right of way tracts were headquarters tracts of the 21 o_perator:s.
The ta~ings fromall right of way tracts averaged 17 acres and
375 acres, equal to 12.1 l?ercent of the acreage in right of way tracts
and 7.4 percent of the total acreage operated. Right of way tracts
constituted the total acreage in eight operations. Operators of these
tracts lost an average of 9.7 percent of their land to right of. way,
'With the range of takings being from 1.6 percent to 26.5 percent. The
13 operators of multiple tracts lost from a low of 3.6percent to a·high
of 13.7 of their total acreage to right of way takings.
the largest right of way taki~g from any one operator was 65 acres
from two right of way tracts. This taking was equal to only 11.6 percent
of the two right of way tracts involved and only 8.6 percent of the
operator's total_acreage. Two operators lost over 40 percent of their
26 !

Table 10
Size of Right of Way Takings Related to Individual Tracts and Total Operations of 21 Operators!/
Total Operation Ri~ht of Wa;}!: Tracts At Time of Takin~ Tracts Acres Ri~ht of Wa~ Takinss
Operator Number Number ··percent Percent .Acres Percent of Percent of of Tracts of Acres Number of Total N\!ffiber of Total Ac~b.ired ROW. Acr.es Total Acres
1 1 122 1 100 122 '100.0 13 10.7 10.7 2 1 163 1 l<DO 163,. 100.0 5 3: •. 1 3.~1
·.·· 3 3 183 1 33 136 74.3 25 18.4 13.7 4 2 176 1 50 116 . 65.9 . 8 6.,8 4.5 5 2 98 1 50 53 54.0 6 11.3 6.1
.6 5 432 1' 20 .. 101 23.4 19 18.8 4l4 .7 3 259 1 33 42 16.2 19 45.2 7:3
8 2 215 1 50 170 . 7'1.1 17 10~0 7.9 '9 1 100 1 100 100 100.0 26 26.0 26,0
N .....:J 10 3 252 1 33 1'60 63.5 14 8.8 5.6
11 3 456 1 33 175 .}6.4 ~-··~·
27 15.4 5.9 13 4 377 1 25 144 38.3 14 9.7 3.7 14 1 195 1 100 195 100.0 7 3.6 3.6 15 1 186 1 100 186 100.0 3 1..6 1.6 16 1 133 1 100 133 100.0 10 7.5 7.5 17 2 . 258 1 50 145 56.2 18 12.4 7.0 18 1 148 1 100 148 100.0 21 14.2 14.2 19 3 259 1 33 103 39.8 15 14.6 s.·8 20 5 757 2 40 55:9 73.8 65 11.6 8.6 21 1 98 1 100 98 100.0 26 26 ... 5 26.5 22 3 . 2.20 1 33 41 18.6 17 41.5 . 7.7
Total 50 5,087 22 41.5 3,090 60.7 375 12.1 7.4
.!/Includes the tracts of the 18 operators th~t furnished complete operationa~, data for all three years plus three operators (No. 6, 20, 22) supplying partial information.
right of way tracts but bothof these 6perated large,acreages in other
tracts.
Additional perspective as to the size of right of way takings is
given in the discussion of farm operations in the next section-.
FARM· OPERATIONS
Total fann operations as well as right of way tracts were studied
in order to determine the overall importance of right of way takings tr.o.
study area farm operators. Efforts were directed toY1ard detecting various
changes in the study area ciperatio~s not present in those in the control
area. The changes are discussed.first_with respect to right of way
tracts and then with respect to total operations.
ChanE?es inNumber 1 Size and Tenute of Operations
Right of Way Tracts
At the time of right of Ylay acquisition, the .21 study area farl11
opel!ators farmed 22 right of way tracts containing 3,090 acres. These
tracts ranged from 41 to 480 acres in size and averaged 140 acres (Table 11).
Right of way takings .totalled 375 acres and created 35 remainders averagigg
78 acres and with a range in size from 1 to 304 acres. Following combinations
of remainders and sales into non-agricultural use, the number.of right
of way tracts iri agricultural operations had been reduced to 28 in 1969.
An additional 31 acres were removed from conunercial agricultural use
through these adjustinents.
Renter~operated tracts lost proportionately more area to. right of
way than did owner-operated tracts. Prior to the highway, the 9 rented
tracts averaged 151 acres in size. The 16 remainders from right of way
takings averaged ~nly 73 acres. Owner~operated tracts were increased from
·. 28

N \0
"
Table 11
· Changes in Ntnnber and Size of Right of Way Tracts any Remainder Ac-eordi.ng to Tenure .and Type ·of Acquisition.=./
Before Highway Item Tracts Acr.es Average Size
After RO'(.t mT-aking?f---. -. -.····-i969QPerations.~l Tracts Acres Average Size Tracts Acres AVE!!rage Size
Acres ·Acres Ac.res
All Tracts 22 3,090 140 35 2.]15 78 Owner-Operated 13 1,727 '133 19 1,546 81 Renter-Operated 9 1,363 151 16 1,169 73
Tracts Not Divided 9 1,160 ••129- 9 1,063 ll~ Owner-Op~rated 7 J,028 '147 7 945 13$ Renter-Operated 2 132 66 2 118 59
Tracts Divided. 13 1,930 148 26 1,652 64 Ower-Operat:ed 6 699 116 12 601 50 Renter-opera:ted · 7 ·1, 231 . 176 14 1,051 75
.!'as~d on tracts of 21 operators.
lkefer~ to·: tracts .as they existed innnediately after right Qf way taking.
11one tract previously operated by renter.
2.8 2.684 96 17 1,582 :93 11 1,102. 100
9 1,063 118 ell . -991 124 1 72 . 72
. 19. 1;621 85--· 9 591 66
10 1,030. 103

13 to 19 in number and their average size decreased ·£rc:>tn 133 to 81 acres.
By 1969, renter-operated tracts had decreased to 11 with an average
size of 100 acres. OWner-operated tracts had decreased to 17 in nwnber
with an average size of 93 acres. One of the latter 17 owner-operated
tracts had been a rented tract until 1965. This accounts for the
net gain in 1969 in owner-operated acreage and, similarly, for a part
of the net loss in the acreage of rented tracts.
Nine of the right of way takings, to6Jt: land from orlly on~ side of
tracts and, on balance, these remained unchanged thro'-tgh 1969 in
nuinber, total acreage lind average size. Thirteen takings divided or
·severed right of way tracts resulting in 26 remainder parcels with an
average size of 64 acres. By-1969, these had been reduced in nwnber to
19 averaging 85 acres in size.·
·Thus the combination of tracts occurred wholly:amortg severed tracts
as did the net decrease in agricultural land. Several small remainders
from severed tracts became suitable for rural residential sites.
The major adjustinertts relating to severed tracts involved four
renter operators making arrangements .with .their landlords to: "trade"
operatorships. These arrangements reduced separately O'perated tracts
by four. One owner-operatqr of a severed tract deeded the isolated
remainder to his son~in-law who combined it with adjacent operations.
Two small severed remainders were-sold for non-agricultural use and a
portion of one severed remainder was leas~d to an oil company for a
service station site•
30.
In the control area between 1964 and 1969, there were only two
~inor changes irt land tenure on control right of w,ay tracts and
these were among control area operators. Thus total acreage and tract
size remained the same during the.study period. The 19 contiol area
operators fanned 20 control right of way tracts containin$$'2;188 acres,
or an average of 115 acres per tract.
Table· 12 presents a frequency distribution of study and control
area right of way tracts by size as they existed in the various time
periods. In 1964, 95 percent of the study area and 90 percent of the
original right of way. tracts were between. 41 and 320 acres in size.
However, the tracts of the control area were more evenly distributed,
between the three major categories, while 12, or 55 percent of the study
area tracts were concentrated in the 81-160 acre category.
In 1965, which represents the period immediately aftel." taking but
before any adjustments were made, there is a noticeable difference in
the distribution of study area tracts by size. The study area had no
tracts of less than 40 acres in the before period, but in 1965 there were
13 tracts with· 40 acres or less. However, the operators were mainly ..
concerned about the 9 remainders with less than 20 acres each.· In tracts
of this sJ;ze, adjustments are usually necessary as it is riot always
economical to continue operating such small parcels. This is especially
true in cases where the tract is cut off from thenormal water supply.
Also, none of the small remainders were used as cropland so their use
was limi,ted to grazing. Therefore, operators began selling off remainders,
making trade's of rented land or adjusting their qperations on the smaller
tracts.
31

,, w N
Table· 12
Size Distribution of Right of Way Tracts Operated ]jy 21 Study Area and 19 Control Area Operators b.y Years!/
1964 1965~/ 1966 -1969 Size of Tracts · Number of Tracts Number of Tracts Number of Tracts Nilmber of Tracts
Study . ContrQ}. __ ~1udy Control Study ContrQJ__ ___ ~~~d_y Control·
0 - 5 0 0 3 0 0 0 0 0
6 ;- 10 0 0 3 0 2 0 1 0
11 ... 20 0 0 3 0 3 0 3 0
21 ~ 40 ,() 2 4 2 4 2 2- 2·
~·,
41 - 80 4 7 7 7 5 7 6 t
:81 ·- 160 12 7 13 7 14 7 14 6
161 - 320 5 4 2 4 2 4 2 5·
321 - Over 1 0 0 0 0 0 .. 0 0
Total Tracts 22 20 35 20 30 20 28 20
Number of Operators 21 ~9 21 19 21 19 21 19·
. .
1/Includes the 18 study and 19 control area· operators furnishing c.omplete ope·rationa~ data - all three years plus three study area operators fn:rnishing partial informa·tioj:l. 2/Ref.ers to tracts as they existed after the takfng and before any subsequent adjustments - were made ~ - · ·
By 1966, the number of tracts with 20 acres or less had been reduced
to five as the two tracts in the 0-5 acre group had been sold, and one
had been cotnbi:rted with a larger tract of an operator renting adjoining
land, The other tract in the 6·10 acre group was also combined .by another
renter operating adjoining land.
Further adjustnients of the small remainders were made between 1966
and 1969 to reduce the total in farm.operations to 28 tracts.
All Tracts in 6perations
Right of way takings iri relation to right of way tracts and total
farm tracts of 21 operators have been sho'Wn in Table 10~ these operators
farmed 22 right of way tracts and 28 non-.right of way tracts in 1964.
Right of way takings represented 12.1 percent of right of way tract
acreage and 7.4 percent of the acreage in all 50 tracts operated.
Tables 13 and 14 compare the total operations of farmers of study
area and control area right of way tracts froni the standpoint of numbers
of tracts, total acreage and acres owned and rented in 1964, 1966
and 1969 •. Two Study area operators were added, one in 1966 and one in
1969, as right of way tracts came under their operations. The two
previous operators of these tracts continued as farmers in the general
area and are included in Table 13. In the control area, there was no
change in hypothetical right of way tracts except that one operator
purchased such a tract he had previously rented and combined it with another
tract.
~3

Table 13
Tracts and Acreages Owned and Rented in Total Farm Operations of Operators of Study Area Right of Way Tracts in 1964, 1966 and 1969
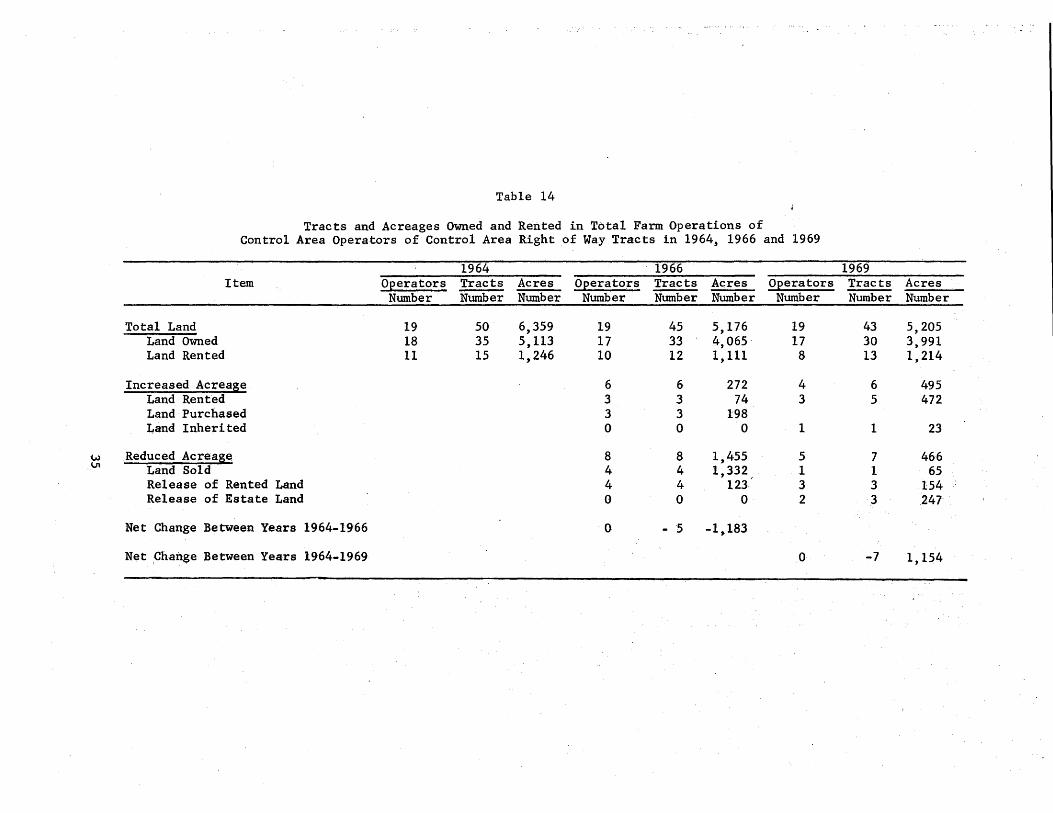
Table 14
Tracts and Acreages Owned and Rented in Total Farm Operations of Control Area Operators of Control Area Right of Way Tracts in 1964, 1966 and 1969
1964 1966 1969 Item oeerators Tracts Acres O£erators Tracts Acres oeerators Tracts Acres
Number Number Number Number Number Number Number Number Number
Total Land 19 50 6,359 19 45 5,176 19 43 5,205 Land Owned 18 35 5,113 17 33 4,065· 17 30 3,991 Land Rented 11 15 1,246 10 12 1,111 8 13 1,214
Increased Acreage 6 6 272 4 6 495 Land Rented 3 3 74 3 5 472 Land Purchased 3 3 198 Land Inherited 0 0 0 1 1 23
-w Reduced Ac:reage 8 8 1,455 5 7 466 IJ1 Land Sold 4 4 1,332, 1 1 65
Release of Rented Land 4 4 123 3 3 154 Release of Estate Land 0 0 0 2 3 247
Net Change Between Years 1964-1966 0 - 5 -1,183
Net Change Between Years 1964-1969 0 -7 1,154
In 1964, study area operations averaged 242 acres in size and
'· operations in the contrpl area averaged 334 acres. Two rath~r large
control area operations (9B9 and 1,4.5,0~ acres) are largely responsible
for the difference in average sizes. The average sizes of the 50 tracts
which each group operated were 102 acres for the study operators and 127
acres for the control operators.
In 1964, study area operators owned about 55 percent of the lartd
that they operated as compared to the 81 percent that control area
operators owned of their total acreage. Much of thLs difference arose
from the fact that two:: of the largest study area operators rented most
of their land they farmed while the two largest control ·area operators
owned a major proportion of their farmland. By 1969, owner-operated
acreage represented 60 percent of the study area operators' farmland
compared to 76 percent of the control area operations. Thus in relation
to total operations, ·right of way acquisition seemed to have no adverse
effects on owner-operatorship of agricultural land.
In 1966, operators in the study area group had 286 fewer acres in
total operations than in 1964. The average size of operations decreased
to 218 acres. However, the control group decreased its acreage by a net
of 1,183 acres. This demonstrates the degree of.fluctuation in agricul~ural
holdings and also the magnitude of adjustments not related to right of way
takings.
By 1969, the total acreage operated by the study area group decreased
by an additional 60 acres even though another operatorship was added.
The control group at.the s~~e ·t~me_had experienced a small increase in
total acreage. The number: 'of ':t~acts ope:fated by the study area operators
·- ..:._
~ ' .
36
decreased with continued adjustments of right of way remainders were
the main cause. The control group decreased slightly 'the rtiullber of
tracts from 45 to 43.
Right of way remainders accounted for 10 of the 12 added tracts
of the study group fr.om 1964 to 1966. Four of the decreases in tracts
from 1966 to 1969 resulted ·from sales or combinations of remainder tracts.
Changes in Kind and Intensity of Lanc1 Use
One of the primary concerns :of the s~udywas the effect the highway
had on land use of the right of way tracts. Land use information is
presented first on right of way tracts and then on total operations.
Right of Way Tracts of Study and Control Operators
Table 15 presents ·the major. land use~ on the right of way tracts
in the study·· and control areas. Iil 1964; land use patterns on the right
of way tracts of the study arid control ar~aswere generally about the
same except that the study area operators classified a somewhat smaller
·percentage of .their land as cropland. From 1964 to 1969 the percent
of acreage in c:ropland and pastureland· remained constant for the study
area operators while the control group reported a small increase in
cropland acreage and the· same decline in pastureland. A portion of the
increase in cropland acreage by the control group was a result of one
operator consolidating two adjoining tracts that he purchased, with a
large percentage of the new acres in cropland, into one unit which made
the ri~ht of way ;tract 'f,;n 1969 larger than th_e original tract and the new
unit contained·a higher percerit.of cropland acreage.
37

w ())
Table 15
Changes in Land Use of Right of Way Study and ·control tracts of _ 21 Study Area and 19 Control Area Operations!/ ·
1964 1-966 1969 Type of Land Percent of Acres Percent of Acres P:ercent of Acres
Study Control _ Study Co:ntrQl Stu<!y Con.tro1
Cropland· . 26.0(18) 38.'2(19) 26.0(18) 39.7(19) 26.9(19) 40.6(19) Harvested 11.0(13) 20.3{18) 7,6(12) ~4.5(14) 5.9(10) 12.6(15) Ha~vested and Grazed 3. 8( 6) 2.3( 4) 4.0( 6) 2.5(' 6) 4.2{ 5) ' '8.3( 6) Grazed 7.7( 8) '14.3(13) 10.0(13) 20. 7(16) 12.0(13) 19.1(14) . Government· Pr~gram 3.5( 5) 1.3( 3) 4.4( .6) 2. 0( 3) 4.8( 5) o. 6( 2)
Pasture land 73.0(21)" 60~ 4(19) 72. 9(21) ' 58. 6(19) 72.0{21) 57 •. 8(19)' Improved 3;.2( 6) 16.5( 6) 8.'6(10) 16.8( 7) 16. 2(16) 29. 9(14) Cleared so. 7(21) 28. 3(15) 45.4{19) 27 .8(16) 38.2(20) 16. 9(1~) Woodland 19 •. 1(14) 15.6(12) 18. 9(18) 14.0(10) 17. 6(15) 11.0(10)
Other Land 1.0(19) 1. 4(17) 1.1(16) 1.7(17) 1.1(16) 1.6(17)
Total Acreage .3,090(21) 2,188 '(19) . 2,697(21) ' 2, 188.(1t) 2,684(21) . 2, 402:(19)
:llincludes -~he 18 study and 19 control area operators cooperating--~l.l~h;~~--years plus the three study area operators furnishing partial information. Figures in parentheses are numbers of operators. '

Both groups of operators harvested successively smaller percentages
of their land for cash crops only in 1966 and 1969. They diverted land
from cash crops to crops that would be grazed and also harvested, such
as small grains or some of the improved grasses that would be cut for
bay and then grazed by livestock. These kinds of combination crops fit
very well into cattle operations. The amount of cropland used for
grazing of livestock also was increased in 1966 and 1969 by both groups
of operators. Land in goverrnnent grain programs represents a small
portion of the cropland, but it ha~ advantages for cattle operators.
The operators cannot harvest any crops from the land, but can graze it
during winter months.
Pastureland was classified into improved pasture, cleared but I!
unimproved pasture, and woodlands. In 1964, six study area operators
had only 3.2 percent of the right of way tract acreage in improved
pastures, while six control operators had 16.5 percent of control area
acreage in improved pastures. About 50 percent of the acreage in the
study area tracts was cleared unimproved pastureland as compared to about
28.0 percent for the control group. Study area operators had a slightly
larger percentage of their right of way land in woodland than did
control operators.
Both groups of operators were striving for increased grazing production
from their pastureland. Both areas showed increases in the acreage in
improved pastures and in the number of operators having such acreages
in 1966 and 1969. Land in woodlands and cleared unimproved pastures
decreased in amount as it was being converted to improved pastureland.
39
Based on the combilned land use patterns on the right of way tracts
there appears to be little difference between farm operations in the
study and control areas. However, four study operators with tracts
divided by the highway made changes in land use on the remainder tracts
tha-t were directly related to the effects of the highway. these
changes usually consisted of small acreages.bei~ shifted from one
agricultural use to another.
All Tracts of 18 Study and 19 Control Area Operators
Tables 16 and 17 present land use patterns on the total operations
of the 18 study and 19 control operators who supplied complete operational
data for all three years. (Information on land us~ in total operf;ltions was
incomplete for three study area opera~ors who were represented in previous
tables~) In 1964; land use patternson the total operations of the study
and control area operators generally followed those on the tight of way
tracts of the study and control area operators presented in Table 15. Row
ever, the control area operators had a higher percentage of pastureland
acreage in their total operations than on the control area right of way
tracts. But by 1966 the ratio of cropland acreage to pastureland acreage
was almost identical for the study and control area operators. This was
caused by three control area opetrators disposing of tracts containing
primarily pastureland.
As was the case for the right of way tracts from 1964 to 1969,
cropland acreage of the study and control area total operations remained
rather stable, but the operators in both areas had fewer acres harvested.
There '\tlere also three fewer operators in each area harvesting crops in
40

/
Tabl~ 16
Major Uses of All Agricu~ tural Land Operated· by 18 Study Area Operators in 1964, 1966 and 1969
1964 ·1966~., 1969 Type of Land 02erators Land 02e:rators Land· oeerators Land
Number Acres Percent Number Acres Percent Number Acres Percent
cr:o2land 17 979 26.6 17 887 26.0 17 853 26.8 Harvested 13 368 10.0 10 207 6.1 10 192 6.0 Ha~vested & Grazed 8 166 4.5 10 184 5.4 8 172 5.4 P.astured 8 349 9.5 12 392 11.5 13 383 12.1 Government Program 4 96 2.6 7 104 3.0 7 106 3.3
Pasture1and 18 2,667 72.5 18 2,_488 73.0 18 2,292. 72.1 Improved 9 257 . 7.0 12 390 11.4 15 602 18.9
~ Unimproved 18 1,)31 47.1 18 1,420 41.7 18 . 1,140 35.9 ~
Woodland 15 679 18.4 16 663 19.5 16 543 17.1 Idle Pastureland 0 0 0 2 15 0.4 1 7 0.2
Other Land 18 32 0.9 17 33 1.0 17 34 1.1
total Land 18 3,678 100.0 18 3,408 100.0 18 3,179 100~0
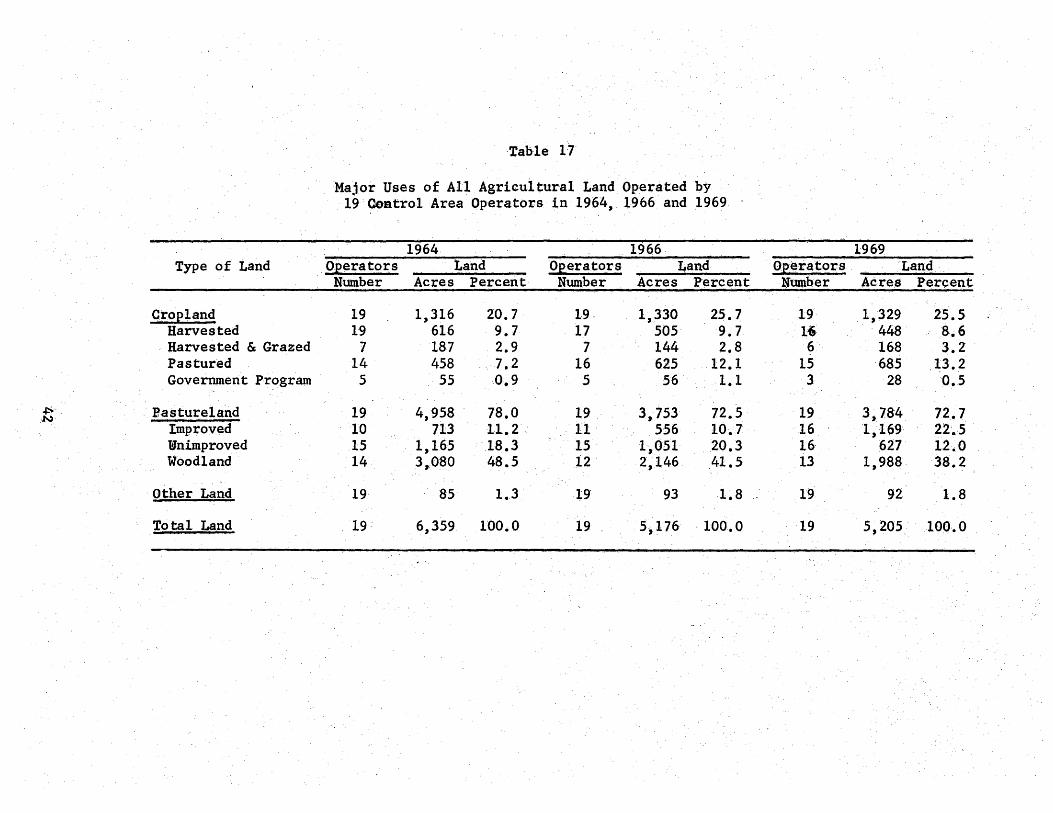
Table 17
MaJor Uses of All Agricultural Land Operated by 19 Control Area Operators i,n 1964, 1966 and 1969 -
1964. 1966 1969 Type of Land 0Eerators Land oeerators Land Of2~rators ·Land
Number Acres Percent Number Acres Percent N1Jmber Acres Percent
Cropland 19 1,316 20.7 19 1~330 25.7 19 . 1,329 25.5 Harvested 19 616 9.7 17 505 9.7 16 448 8.6 Harvested & Grazed 7 187 2.9 7 144 2.8 6 168 3.2 Pastured 14 458 .. 7. 2 16 625 12.1 15 685 .13. 2 Government P·r~gram 5 55 0.9 5 56 1.1 3 28 0 • .5
~ N · Bastureland 19 4,958 78.0 19 3,753 72.5 1.9 3;784 72.7
Improved 10 713 11.2. 11 556 10.7 16 1,169 22 • .5 Wnimproved 15 1,165 18.3 15 1,051 20.3 16 627 12.0 Woodland 14 3,.080 48.5 12 2,146 41.5 13 1,988 38.2
Other Land 19 85 1.3 19 93 1.8 19 92 1.8
Total Land 19 6,359 100.0 19 5,176 100.0 19 . 5,205. 100·.0
1969. The decrease in acreage harvested was about the same for the two
areas, as the study area had 179 less acres harvested as compared to
168 fewer acres harvested by the control operators. However, when
comparing the cropland acreages harvested as a percent of total acreage,
the study area operators had a greater decrease between 1964 and 1969, than
did the control area operators. Since the highway acquired about 70
acres of cropland from the.l8 study area operators some of this loss in
cropland acreage harvested could be related to the effects of the highway.
There were no noticeable diff~rences between the study and control area
operators during the study period on the land use practices of the other
three categories of cropland uses.
Thus while right of way acquisition had some minor effectson
the land use of right of way tracts, such effects tend to be obscured
by the fact that study area operators farmed large acreages of other
land.
Intensity of Land Use
In order to maximize returns from cropland or pastureland, most
operators in the area have found it necessary to use some form of
connnercial fertilizer. Fertilizing cropland, particularly cash crops,
·has been a common practice for some time, but the use of commercial
fertilizer on pastureland is a relatively new practice that is becoming
widespread among the more aggressive operators.
Tables 18 and 19 show the use of fertilizer on the fight of way
tracts and then on the total operations of the 18 study area and 19
control area operators. Table 1~ presents the percentage of the right
of way tract acreage, owned and rented, that was fertilized during each
43
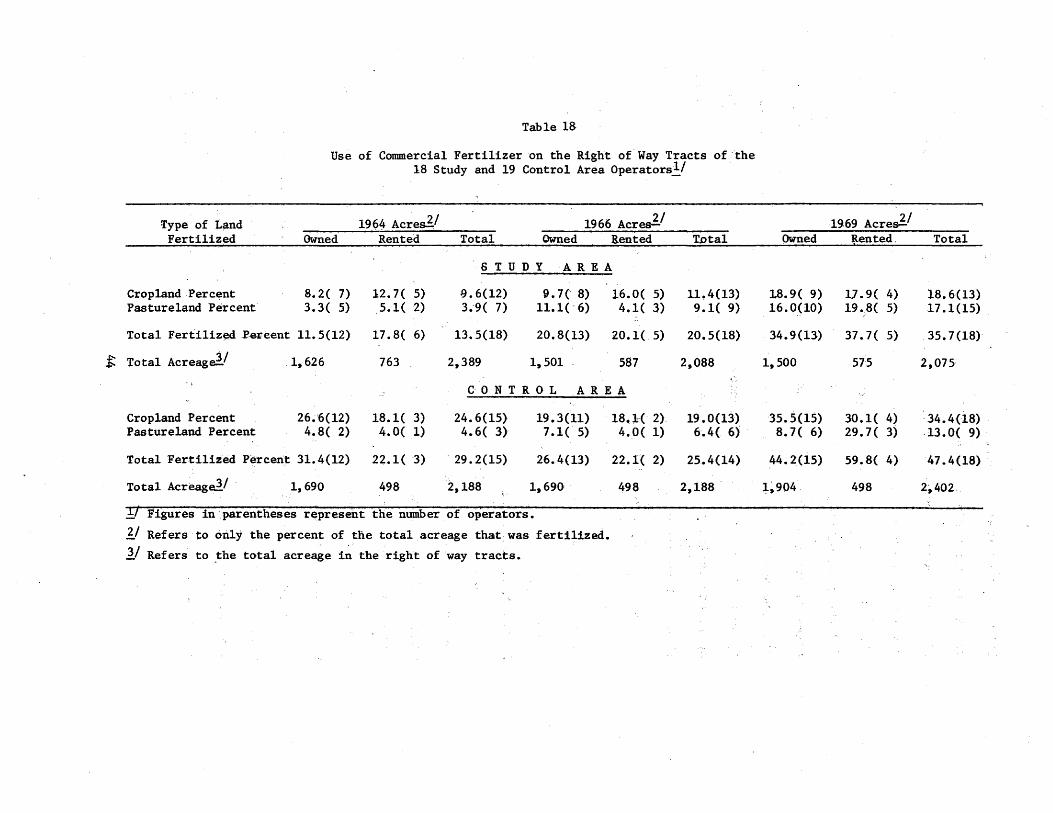
Table lS
Use of Commercial Fertilizer on the Right of Way Tracts of the 18 Study and 19 Control Area Operatorsl/
Type of Land Fertilized
1964 Acresl:/ 1966 Acresl/ Owned Rented Total Owned Rented
Cropland,Percent Pastureland Percent
8.2( 7) 3.3( 5)
Total Fertiliz~d -P@"eent 11.5(12)
t Total Acreagell 1,626
12. 7( 5) 5.1( 2)
17. 8( 6)
763
STUDY AREA
.9.6(12) 9. 7(8) 16.0( 5) 3.-9( 7) 11.1(. 6) 4.1( 3)
13.5(18) 20. 8(13) 20.1( 5)
2,389 1,501 587
CONTROL ARE!
Cropland Percent Pastureland Percent
26~'6(12)
4.8( 2)
Total Fertilized P(!rcerit 31.4(12)
Total Acreage2./ 1, 690
18.1( 3) 4. 0( 1)
22.1( 3)
498
24.6(15) 19.3(11) 4.6( 3) 7 .1( 5)
. 29. 2(15) 26.4(13)
2,188 1,690
p- Figures --=t.n .-par-en-thes-es- rei>res-ent- ih-e number -of -operators.
2:./ Refers to orily the percent of the total acreage that was fertilized.
1/ Refers to _the total acreage in the right of way tracts.
18.1( 2) 4. 0( 1)
22.1( 2)
498
T.otal
11-.4(13) 9.1( 9)
20.5(18)
2,088
19 .0(13) 6.4( 6)
25.4(14)
2,188
19.69 Acres!/ Owned Rented Total
l8.9( 9) 1.7.9( 4) 18.6(13) 16.0.(10) 19 .8( 5) 17.1(15)
34.9(13) 37.7( 5) 35.7 (18)
1,500 575 2,075
35.5(15) 30.1( 4) 34.4(l8) 8.7( 6) 29.7( 3) 13. 0( 9)
44.2(15) 59.8( 4) 47.4(18)
~~904 498 21402
of the three years. As shown in Table 18 the control operators fertilized
a larger percentage of their right of way tract acreage in 1964 than did
the study area operators. Control area operators did not increase the
use of fertilizer on right of way tracts until after 1966, but had an
increase of 22 percentage points from 1966 to 1969. Study area
operators had a seven percentage point increase between 1964 and 1966, <,
and a 15 percentage point increase from 1966 to 1969.
A larger percentage of cropland was being fertil:ized in th.e control
area in 1964, but both areas experienced increases in cropland acreage
fertilized from 1964 to 1969. The study area operators used fertilizer
on a larger percentage of.their right of way tract pastureland than
did the control group. Some of the increase in the number of pasture
land acres fertilized on the right of way tracts by study area operators,
from 3.9 percent in ,1964 to 17.1 percent in 1969; is attributable to
the highway, as three of the operators reported applying additional
fertilizer to remainder .tracts in an effort to help offset the loss of
land.
The acreage in total operations or the 18 study and ~9 control
operators and the percentages of the cropland and pastureland fertilized
are given in Table 19. The pe.rcentage of acteage in 'total opet!ations
which was fertilized generally followed the same pattern as that for ·
right of way tracts.
Study area operators showed percentage increases in acreage fertilized
in 1966 and 1969, while control operators had a decrease in 1966 but a
large increase from1966 to 1969. From 1964 to 1966, $tudy area operators
45
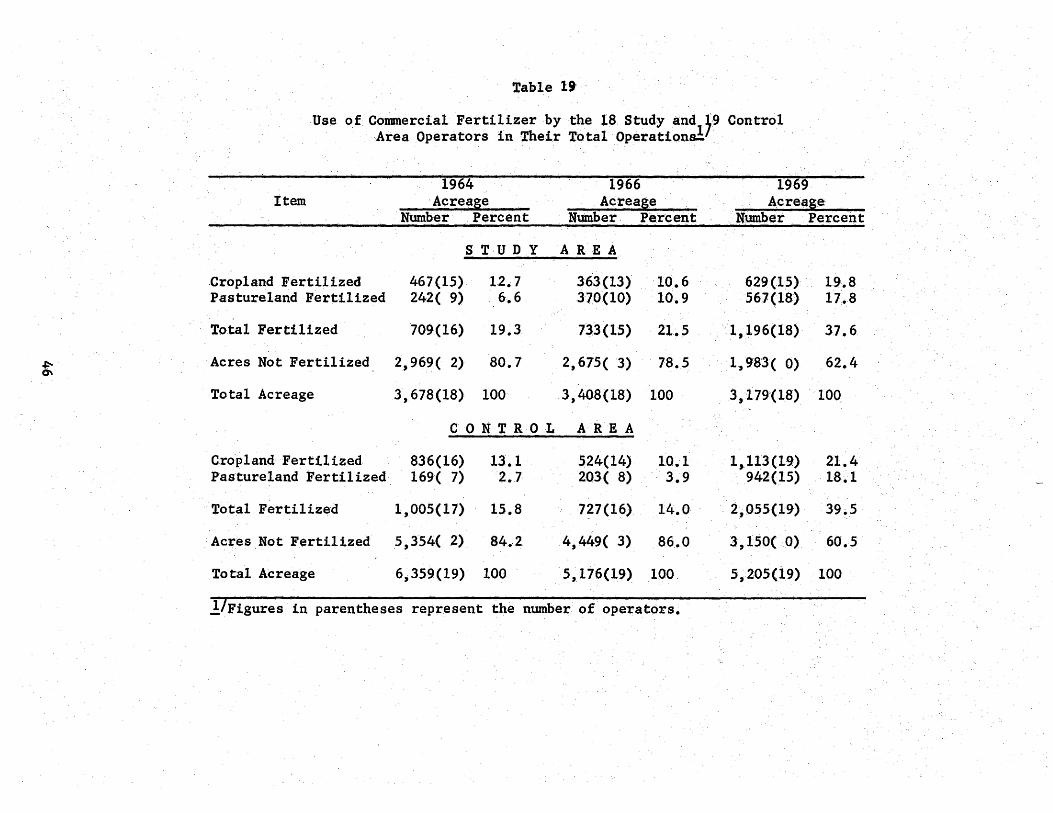
~ 0\
Table 19
Use of Commercial Fertilizer by the 18 Study and }·9 Control Area Operators in Thei.r Total Operations! ·
Item
.Cropland Fertilized Pastureland Fertilized
Total Fertilized
Acres Not Fertilized
To tal Acreage
CroplandFerti1ized Pastureland Fertilized
Total Fertilized
Acres_Not Fertilized
To tal Acreage
1964 ·Acreage
Number Percent
S T·U D Y
467(15) 12.7 242( 9) 6o.6
709(16) 19.3
2, 969( 2) 80.7
3,678(18) 100
CONTROL
836(16) 13.1 169( 7) 2.7
1,005(17) 15.8
5,354( 2) 84 •. 2
6,359(19) 100
1966 Acreage
Number Percent
AREA
363(13) ·10.6 370,(10) 10.9
733(15) 21.5
2,67'5( 3) 78.5
3,408(18) 100
AREA
524(14) iO.l 203( 8) 3.9
727(16) 14.0
4,449( 3) 86.0
5,176(19) 100.
_!!Figures ~in p~renti1e-ies~represent-the~nUmber of operators.
1969 Acreage
Number Percent
629(15) 567(18)
1,196(18)·
1,98'3( O)
3, 179'(18)
1,113(19) 942(15)
2,055(19)
3,150(-0)
5, 2·05(19)
19.8 1~8
37.6
62.4
100 .
21.4 18.1
39.5
60.5
100

·had a 2.2 p~rcent increase compared to a 1.8 percent·decrease for the ·C'
control group. From 1964 to 1969 the study area operators had a 68.7
percent increase in total acreage fertilized as compared to 104.5
percent increase for the control operators. Neverthel,ess, it appears
that the highway had some influence on the use of fertilizer by study
area operators between 1965 and 1966. Comparing 1966 and 1969, there
is no indication that the highway had any effects on their use of
fertilizers. However, it should be noted that operators can apply
fertilizer from one to four times a year on the same acreag~ in ·crops
or pastureland. This will be discussed later in the section of the
report dealing with the various operating expenses for each of the three
yeaJrs.
Changes in Crop and Livestock Production
The amount of crops and livestock produced each year were converted
to dollars in an effort to determine the effect, if any, of the takirig
of right of way on fartn operations. The production of crops on right of
way tracts will be discussed followed by a discussion .of crop production
pertaining to the total operations. Livestock prroduction is evaluated
from the standpoint of total operations only due to the difficulty of
developing such. information on a tract basis. Values of crops and live-
stock are based on market values in the year of production or upon
actual sales ·prices when these were obtained.
Right of Way Tracts
Table 20 presents the changes in crop production on the right of
way tracts of the areas for 1964, 1966 and 1969. The trend in this
47
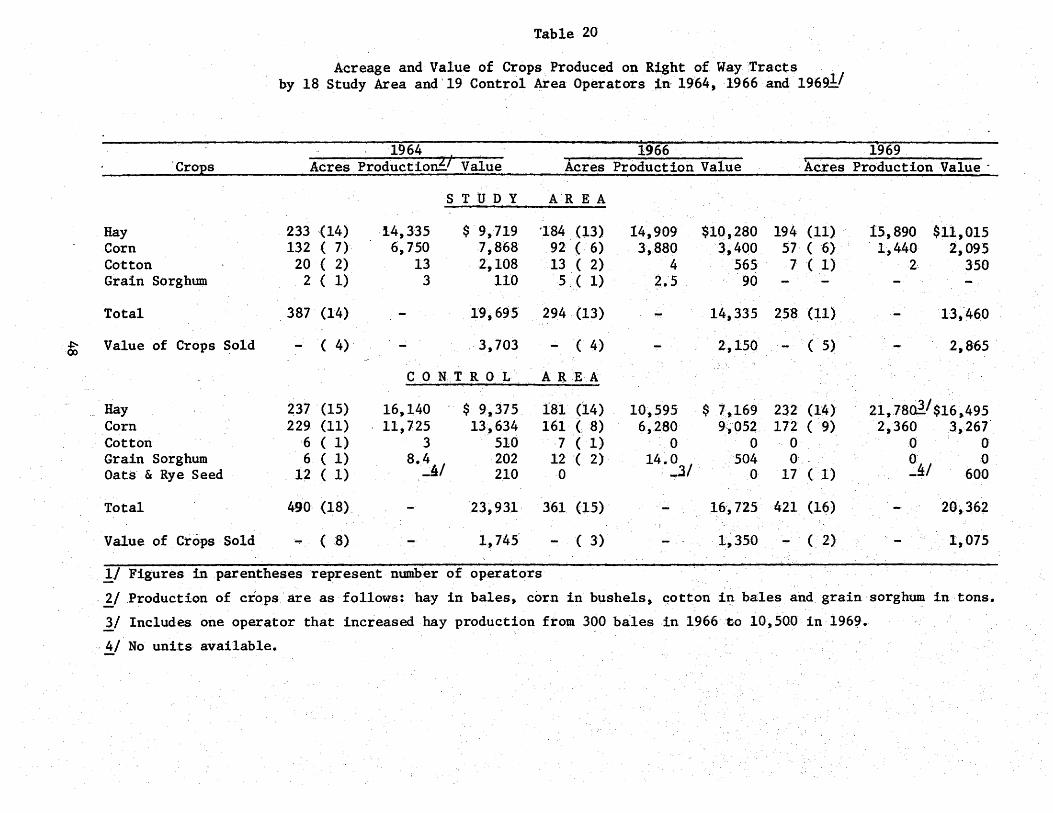
.j::o-00
Table 20
Acreage and Value of Crops Produced on Right of Way·Tracts by 18 Study Area and ··19 Control Area Operators ~n 1964, 1966 and 19691/
1964 1966 1969. ·crops Acres P-roduction~/ Value Acres Production Value Acres Production Value·
Hay Corn Cotton Grain Sorghum
Total
Value of Crops Sold
Hay Corn Cotton Grain Sorghum Oats· & Rye Seed
Total
Value of Crcl.ps Sold
233 (14) 132 ( 7)
20 ( 2) 2 ( 1)
387 (14)
- ( 4)
237 (15) 229 (11)
·6 ( 1) 6 ( 1)
. 12 ( 1)
490 (18).
- ( 8)
S T tJ D Y AREA
-14,335 $ 9,719 '184. (13) 6,750 7,868 92 ( 6)
13 2,108 13 ( 2) 3 110 5 ( 1)
19; 695 294 (13)
3,703 - ( 4)
CONTROL AREA
16,140 $ 9,375 181'· (14) 11,725 13,634 161 ( 8)
3 510 . 7 ( 1) 8.4 I 202 12 ( 2)
_j 210 0
23,931 361 (15)
1, 745' - ( 3.)
. l/ Figures in parentheses represent- number of op.erators
14,909 $10,280 194 (11) 15,890 $11,015 3,880 3,400 57 ( 6) 1,440 2,095
4 565 7 ( 1) 2- 350 2.5 90 - -
14,335 258 (11} - 13*'460
2:,150 - . ( 5) - 2,865
10,595 $ 7,169 232 (14) 21,78o2/ $16-,495 6,280 9:,·o52 172 ( 9) 2,360 3, 267"
0 0 0 0 0 14.0 I 504 0 .. ~!£/ 0
_3 . 0 17 ( 1) 600
16·,7'25 421 (16) - 20,362
. 1,350 - ( 2) - 1,075
-]:./Production of crops·are as follows: hay in bales, corn in bushels, cotton in bales and grain sorghull:l in tons.
11 Includes one operator that increased hay production from 300 bales in 1966 to 10,500 in 1969.
-4/ No units available.
area was toward less acreage being planted in cash crops. Cotton and
corn had been the two major cash crops of the gerieral area for years,
but Table 20 shows that only two study and one control operator planted
cotton in 1964 and only o.ne study area operator had cotton in 1969.
Corn was more widely grown by both groups of oJ?erators but there was ·
a decrease in acreage and operators by 1969. Unfavorable weather conditions~
were responsible for the reduction in corn yields per acre in 1966 and
1969.
Practically all of the operators harvested hay for winter forage
for the cattle. Hay production by the study area operators, on a
smaller acr~age of land, remained rather·stable over the three years,
but there were three fewer operators in 1969 producing hay on the right
of way tracts. Control operators also harvested fewer acres but, with
one operator producing over 10,000 bales in 1969, showed a sizeable
increase over 1966 yields.
The sma.ll amount of crops that were sold each year indicates that
forage and grain crops were being raised primarily for feed in livestock
operations. Operators reported that crop sales would have been somewhat
.larger in 1966 and 1969. but due to poor crops :they had no excess grai~
to sell. However, one control area operator, (a dairyman) with a large
increase in hay production in 1969 had a large impact on total crop
production in 1969.
49

In summarizing crop farming operations on the right of ~ay tracts
of the two groups of operators it was found that the study area
operators reduced their acreage froin 1964' to 1969 by 33 percent and
production (value of crops) by 32 ·Percent• The control group reduced
their acreage by 14 percent and production by 15 percent. However,
between 1964 and 1966 the t-wo groups of operators reduced their acreage
harvested and production by about the same amount on the right of way
tracts. Acres harvested was reduced by 24 percent in the study area
and 26 percent by the control operators. Value of crops produced
decreased in proportion to decrease in acreage, 27 percent in study area'
and 30 percent in the. control area. Based on these comparisons, it
appears that.· the highway had no effects on the changes in crop production
between 1964,and 1966 as both· groups of operators performed similarly.
Also, the 1964-1969 differences~· in operations would have. been more
alike between the areas if the one control area operator had not added
the extra hay production in 1969. Thus t~ere is no indicatio-n that the
loss of land to highway right affected crop production on remainder
tracts.
All Tracts, in. Operations·
Table 21 shows the extent of total crop production on all tracts
in the operations and the value of crops raised and sold by the 18
study and 19 control area farmers. Data pertaining to crop production
yere obtained by tract from each operator and for each of the three
years. Nearly all of the operators harvested some kind of crops during
the three years. In 1964 and 1969 o~ly two study and one control area
operator harvested no crops, while in 1966 only one study and one
control area reported no crop production.
50
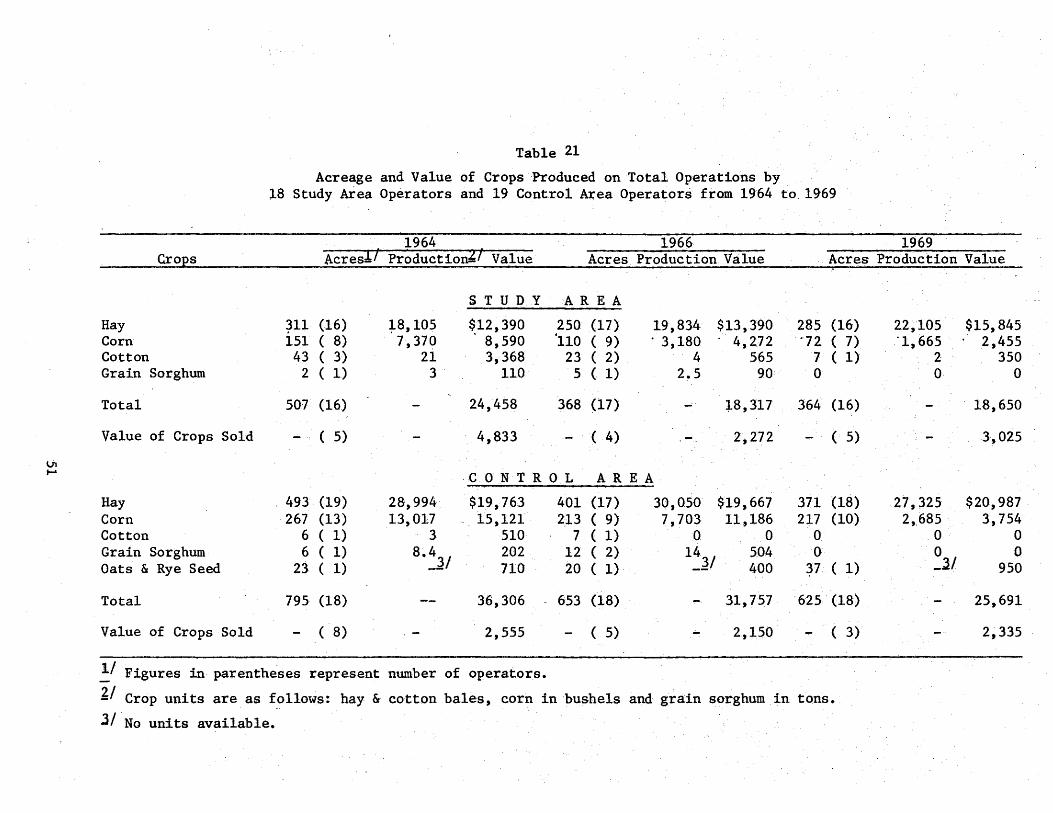
VI .......
Table 21
Acreage and Value of Crops Produced on Total Operations by 18 Study Area Operators and 19 Control Area Operators from 1964 to 1969
1964 1966 1969 C.rops Acresl7- -Pro-du-cffon~! Value Acres Production Value Acres Production Value
STUDY AREA
Hay ~11 (16) ~8,105 ~12,390 250 (17) 19,834 $13,390 285 (16) Corn 151 ( 8) 7,370 8,590 '110 ( 9) . 3,180 4,2.72 ~72 ( 7) Cotton 43 c 3) 21 3,368 23 ( 2) 4 565 7 ( 1) Grain Sorghum 2 ( 1) 3 110 5 ( 1) 2.5 90 0
Total 507 (16) - 24,458 368 (17) - :J-8,317 364 (16)
Value of Crops Sold - . ( 5) - 4,833 - ( 4) - . 2, 272 - ( 5)
-.C.ONTROL AREA
Hay 493 (19) 28,994 $19,763 401 (17) 30,050 $19,667 371 (18) Corn 267 (13) 13,017 15,121 2J3 ( 9) 7,703 11,186 217 (10) Cotton 6 ( 1) 3 510 7 ( 1) 0 0 0 Grain Sorghum 6 ( 1) Oats & Rye Seed 23 ( 1)
8.43/ 202 12 ( 2) l~J/ 5.04 0 710 20 ( 1) 400 37 ( 1)
Total 795 (18) 36,306 - 653 (18) 31,757 625 (18)
Value of Crops Sold - ( 8) 2,555 - ( 5) 2,150 - ( 3)
1/ Figures in parentheses represent number of operators.
2:1 Crop units are as follows: hay & cotton bales, corn in bushels and grain sorghum in tons.
J/ No units available.
22,105 ·1,665
2 0
--
.27,325 2,685
0 0 _J/
$15,845 2,455
350 0
18,650
3,025
$20,987 3,754
0 0
950
25,691
2,335

The control area operators harvested about 36 percent more acres
in 1964 than those in the study area. However, the ratio of acres
harvested to total acreage is about the same between the two areas
in 1964 and changed very little in 1966 and 1969. In 1969 operators in
the study and control area harvested a smaller percentage of their acreage;
but this was expected as operators in both areas were reducing their crop
farming and depending more on their livestock enterprises.
These decreases in acres harvested, particularly acres in cash
crops, follow the general trend of farmers on a county-wide basis which
is shown in Tables 1 and 2 of this report. Cotton, a very important
cash crop to the farmers of this area years ago, was of little
importance to operators by 1966 and 1969. However, in 1964 the amount
of cotton sold by the three St!.tdY area operators represented almost
70 percent of the value of crops sold that year. A few operators planted
small acreages in grain sorghum in l964and 1966, but nqne ~n 1989.
Hay and corn were the two most importan,t crops for the operators
of both areas, however, both groups of operators decreased the acreage
in these crops from 1965 to 1969. In 1966, both groups of operators
harvested approximately 19 percent ·fewer acres of hay than in 1964,
while, the study area operators increased their hay production by 9.5
percent compared to a 3.,6 percent increase ~or the1
control group.
The study area harvested 22 percent more hay in 1969 on 8 percent : i
fewer acres while the control operators .produced 5.7 percent less hay
on 25 percent fewer acres.
52
Corn production declined in both 1966 and 1969. The largest
reduction in corn occurred between 1964 and ,1966 and was due primarily
to poor crops in both areas in 1966. During this period acres har-Vested
decreased 27 percent in the ,study area and 20 percf!nt in the cont·rol
area while production decreased by 57 percent in study and 41 percent
in the control ·area. The somewhat greater decrease experienced by the·
study area operators should not be attributed to the highway as only
four study area operators reported losing cropland to the highway that
was suitable for raising corn. T't\0 of the study area operators reported
in 1966 that due to their teaching retirement age they had decided
to reduce their farming and placed some of their corn-acreages in the
goverrunent grain program in 1966 and 1969.- The two other study area
operators losing corn land reported planting the same total acreage in
corn in ·1966 and 1969 but had poor crops.
Hay production was not affected as mttch as corn by the dry conditions
in 1966 and 1969. However, the. operators reported that hay production
in 1966 and 1969 would have been considerably greater had weather
conditions been comparable to 1964 as the improved varieties of hay
crops, such as coastal Bermuda, yield much more hay per acre.
· Table 22 shows a before and after comparison.' of the value of crop
production on the right .of way tracts as compared to value of crpps
raised on the total operations of the 18 study and 19 control area operators.
In 1964, the study area right of way trac.ts represented about 65 percent
of the acreage in the total operations of the study area operators,
as compared to only 34 percent for the control group. Between 1964
53

·. Table 22
A Comparison of Acreage and Value of Crops Harvested From Right of Way Tracts and From Total Operations of1f8
. Study and 19 Control Operators in 1964 and 196~
Total Acres
1964 1969
Percent Change Between Years
Acres Harvested
1964 1969
Percent Change Between Years
Value of Crops Produced
1964 1969
Percent Change Between Years
Value of Crops Harvested Per Acre
1964 1969
Percent Change
Study Area Right o_f W_ay Total
Tracts 2/_ OpE!rations
2,,389 (18) 2,075 (18) \
-13.1
387 (14) ' 258 (11)
-33.3
$19,695 (14) 13,460 (11)
-31.7
$50.89 s2. :ri
3,!)78 (18) 3,179 (18)
-13.5
507 (16) 364 (16)
$24,458 (16) 18,650 (16)
-23.7
$48.24 51.24
Contro~ Area Right ofWay Total
Tracts Oper-ation$ ·
2,188 (19) 2,402 (19)
+9.8
490 (18) 421 (16)
-14.0
$23,931 (18) 20,362 (16)
-14.9
$48.83 ~8.37
6,~59 (19) 5,205 (19)
-18.1
795 (19) 625 (18)
-21.4
$36,306 (19} 25,691 (18)
-29.2
$45.67 41.10
Between Years +2. 5 +6.,.2 -0.9 -10.0
!/ Value of crops includes all crops raised and harvested by the n\nnber of operators harvesting crops which are in parenthese.s.
1/ Includes right of way tracts of two_new operators in 1969 in order to obtain a comparison of all right of way tracts still in agricultural production~ The numbers of such tracgs were 18 in 1964 and 20 in 1969.
54
and 1969 the study area operators had approximately a 13 percent decrease
in acreag~ in right of way tracts and total operation while the control
group had a 9.8 percent increase in right of way acreage and a 18.1
percent decrease in overall acreage. The increase in right of way tract
acreage result from one control operator combining adjoining land with
his original right of way tract. In their overqll operations in 1964
the two groups of operators harvested a similar percentage of their
total acres. The study area operators harvested 13.7 percent of total
acreages compared to 12.5 percent forcontrol operators. In 1964,
the study area operators harv~sted·l6.1 percent of their right of way
tract acreage compared to 22.4 percent for the control group. Both
groups harvested fewer acres in 1969, but the study area operators had
a larger percentage decrease. A large portion of the 33.3 percent or
129 acre decrease in acreage harvested on study area right of way tracts
resulted from the loss of about 70 acres of cropland, which was acquired
for the highway right of way. This loss of cropland representing about
25 percent of the acreage harvested :tn 1964.
As shown in Table 22 the total value of crops produced from the
study and control area right of way tracts decreased in the same proportion
as the decrease in acreage. Between 1964 and 1969 the· study area operators
experienced a 33.3 percent decrease in acreage harvested and 31.7
percent decrease in value of crops from right of way tracts as compared
to decreases of 14 percent in acres and 14.9 percent in the value of
crops harvested by the control operators.
55
In the total operations, the study area operators also had a larger
decrease in acres harvested than the control operators, but the difference
was not as large as in the right of way tracts. The control area operators,
on the other hand, experienced a greater reduction in the value of crops
produced than did the study area operators. On both the right of way.
tracts and the total operations the study area operators had a smaller
decrease between 1964 and 1969 in the value of crops harvested. This
is also pointed out in.value of crops harvested per acre between the two
g.roups of operators. Between 1964 and 1969 the study area operators
showed an increase in value of crops per acre on both the right of way
tracts and the total operators, while the con~rol operCJ,tors had a
decrease in each case. Some of ~his difference in c.rop yields between
areas resulted from the poor corn yields in 1969 by some of the larger
control operators.
In summarizing Table 22, the study area ope~ators experienced
a greater decrease in acres and value of crops harvested on the right
of way tracts than did the contrcbl group. However, on total operations
the two groups of operators performed more similarly in respect to
reduction in acreage, and stud¥ area operators had a smaller decrease
in crop values. In comparing the valueof crops on the per acre basis,
the study area operators perfollllled much metter than did the control area
operators, indicating that the study m;ea operators increased production
by intensifying the use of their remaining cropland.
Various livestock enterprises provided the study and control area
operators with a major source of income. Beef cattle production was the
most important livestock enterprise, with most operators having cow-calf
56

operations. Four study area and two control area operators had dairy_
operations in 1964. As a general rule, hogs and poultry were of less
importance, b\lt some such operations were cyclical as an operator would
have sizeable sales one year and none the next. . For example, a control
area operator raised turkeys one year on a commission basis, but switched
to hogs the next year with more than $20,000 in sales.
Since the highway displaced some pastureland, one would expect the
operators to reduce their foundation herds. To check this possibility,
a compariso11 VJ'as made of the number and value of beef and dairy cattle
study and contrcbl operators had on hand at the end of 1964, 1966,
artd 1969 (Table 23). In 1964, 16 of the 18 study area operators and
18 of the 19 control area operators had beef cattle. In 1964 there
were four dairymen in the study area and two in the control area.
Two of the dairymen in the study area and one in the control area also
had beef cattle in 1964. One control area dairyman, with only dairy
cattle in 1964, had some beef cattle in 1966, but had sold them before
1969. One study area dairyman with no beef cattle in 1964 and 1966,
disposed of his dairy herd in 1968 and had only beef cattle in 1969.
Such changes did not appear to be related to right of way acquisition.
Most of the beef cattle operatio~s were classified as cow-calf
enterprises which involved a foundation herd of cows to produce calves.
Therefore, it is generally more meaningful to compare changes in the
inventories of foundation herds than total cattle numbeljs. Foundation herds
include cows, bulls and replacement heifers. The calf population can
vary from year to year depending upon breeding practices, range conditions,
57
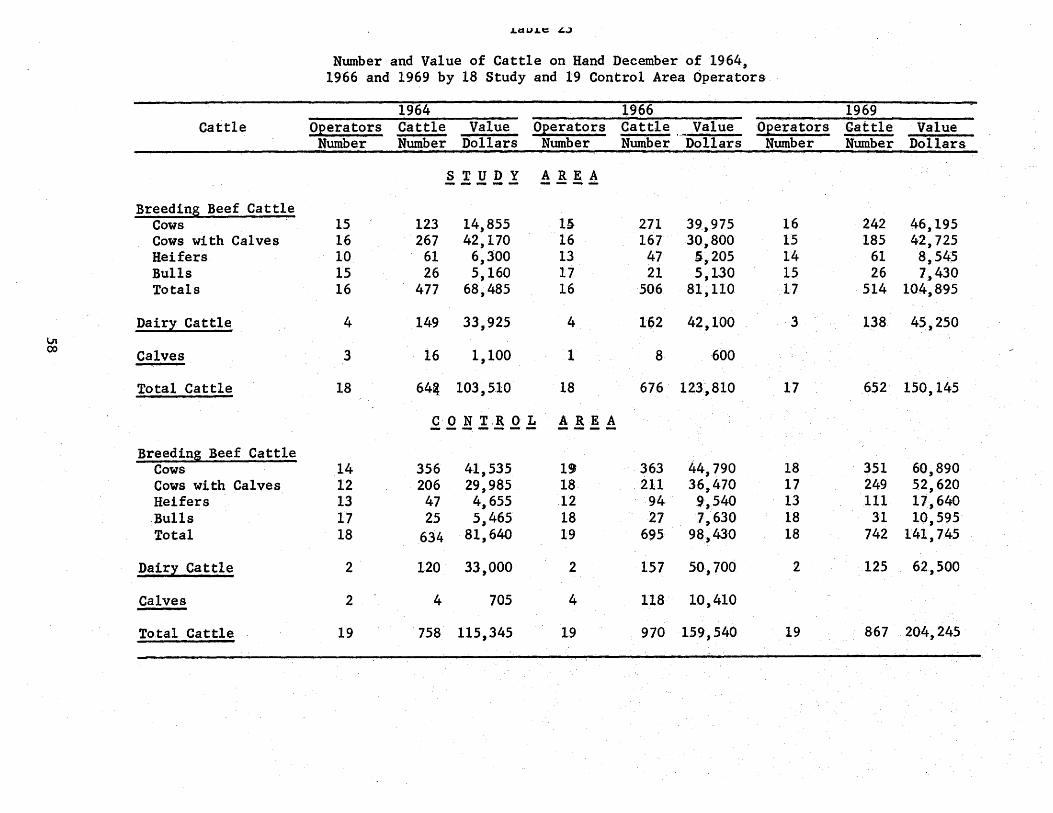
.LCIU.Lt: L.:,)
Number and Value of Cattle on Hand December of 1964, 1966 and 1969 by 18 Study and 19 Control Area Operators
1964 1966 1969 Cattle oeerators Cattle Value oeerators Cattle Value Oeerators Cattle Value
Number Number Dollars Number Number Dollars Number Number Dollars
STUDY AREA _...., ___ -----Breedin~ Beef Cattle
Cows 15 123 14,855 15 271 39,975 16 242 46,195 Cows with Calves 16 267 42,170 16 167 30,800 15 185 42,725 Heifers 10 61 6,300 13 47 9,205 14 61 8,545 Bulls 15 26 5,160 17 21 5,130 15 26 7,430 Totals 16 477 68,485 16 506 81,110 17 514 104,895
Dairy Cattle 4 149 33,925 4 162 42,100 3 138 45,250 V1 00 Calves 3 16 1,100 1 8 600
Total Cattle 18 64~ 103,510 18 676 123',810 17 652 150,145
.£ .Q ! T ._!!; .Q L ~!!!
Breedini Beef Cattle Cows 14 356 41,535 19 363 44,790 18 351 60,890 Cows with Calves 12 206 29,985 18 211 . 36,470 17 2.49 52,620 Heifers 13 47 4,655 12 94 9,540 13 111 17,640 Bulls 17 25 5,465 18 27 7,630 18 31 10,595 Total 18 634 81,640 19 695 98,430 18 742 141,745
Dairy Cattle 2 120 33,000 2 157 50,700 2 125 62,500
Calves 2 4 705 4 118 10,410
Total Cattle 19 758 115,345 19 970 159,540 19 867 204,245
level of income, and market prices. Calves are usually sold at six to
eight months of age, but operators sometimes will deviate from this
practice depending on various conditions.
In 1964 the study area operators had an ave:qage of.29 head of
breeding beef cattle each as compared to 57 head for the control
group. The study area dairymen had an average of 30 cows each compared
to 50 h~ad for the control group. Both areas increased their herds in
1966 and 1969. The increases Vlere more pronounced in the control area,
which had a 23.3 percent increase from 1964 to 1969, as compared to 5.5·
percent increase for the study area operators. However, between 1964
and 1966, the increases were more similar as the study area operators
experienced a 8.1 percent increase in cattle (excluding calves) compared
to a 9.4 percent increase for the control operators. Based on these
differences it appears that the study area operators did not reduce their
breeding herds in 1966 beloVI the 1964 levels,. but the increases experienced
by the study area operators were less than those in the control area.
Due to the increases in price of cattle, the value of cattle
inventories increased substantially in 1966 and 1969. Between 1964
and 1969 the value of beef cattle had increased by about 60 percent in
the study and contr~l areas while the value. of dairy cows increase~ by
only 30 percent.in the study area and more than doubled for the two
control dairymen. The value of livestock on hand at the end of each
year was estimated by each operator. In 1964, the study area operators
estimated the value of their beef breeding stock to be about $10 per
head higher than the control operators while their dairy cows of the
study area operators were valued at about $70 per head less th~n those
of the control ,operat~rs.
59

Table 24 presents a frequency distribution based on the number of
operators increasing or decreasing their cattleherds and the degree of
change. Six study area and nine control area operators had fewer cattle
in 1966 than they had in 1964, while 11 study and seven control operators
increased their herds during this period. One study and three control
area operators had no changes in their herds between 1964 andl966.
It should be considered that the study area operators had tWo full
years (1965 and 1966) to adjust their operations to the new conditions.
When the 1966 operational data were gathered, the· operators were asked
if they had to reduce their herds after right of way taking. Of the 18
study area operators, 11 reported .that they reduced their herds by one
to ten head after the right of way was acquired. In some cases, these
cut backs were for a .very short period of tittle. For example, operators
sold o:ff part of their herd while fencing right of way tracts or until
surface water could be made available on tracts cut off from the original
water supply. By 1966, eight of the 11 operators that repC?rted decreasing
their herds had made adjustments or improvements to remaining tracts
that allowed them to add e~tra cattle to their op~rations. Two of the
eight operators added additional land to their operation enabling them
to incree1se their herds. Of the six operators with fewer cattle in 1966,
three lost a rather large percentage of their right of way·tract acreage
and in 1969 were still operating below their 1964 level. The other three
operators reported that they had culled their herds .and had not replaced
the cull:ed animals• The large number of control operators with fewer
60

Table 24
Changes in the NU1llher of Head of Beef and Dairy Foundation Herds of from 1964 to 1966 and 1964 to 1969
Change in Number of Cattle ·
Increases:· 21 - 40
. 11 20
6 - 10
1 - 5
No Change
Decreases: 1 - 5
6 - 10
11 - 20
21 - 40
_.\
1964 ... 1966 Number of Opera tors
Study ·control
0 0
2 0
1 1
8 6
1 3
6 3
0
0
0 1
61
1964~1969 Number of Operators
Study Control
0 2
2 5
2 1
6 8
2 0
3 2
1 0
1 1
1 0
cattle in 1966 included three opearators who sold acreages in 1965
and some operators who had culled their herds back temporarily.
Most of the herd changes of the two group operators betwe'en 1964
and 1969 were relatively small, usually of 10 head or less-, but a few
operators in each. area had increases-and -decreases in the 21 to 40 head
category. Changes often were a result of management adjusting to the
amount of acr-eage in their operations at a given time. For exampie,
one operator in each area reduced his herd after losing a lease on rented
land. Two control operators increased their herds as they acquired
additional acreage. By increased use of fertilizer and herbicides,
four control area and two study area operators increased their herds
from 11 to 20 head each on the same amount of acreage. The two s~udy
area operators reported that the money received for right of way acreage
provided the extra capital for this more intensive use of their retaaining
acreage.
The large fluctuations in the cattle inventories of the larger
operators tend to overshadow the smaller inventory increases and
decreases of the smaller operators. However, based on changes in cattle
numbers by individual operators it appears that for most study area
operators the highway had little affect on the foundation herds. In
most cases they had made the necessary adjustinents in their operations
by 1966 to offset the loss of the right of way acreage. The operators
most affected by the highway were the small ones with only the right of
way tract in their opezrations, from which takings represented over 15
percent of acreage.
62

A few study and control area operators had other types of livestock
operations, but due to the small inventories of foundation stock they
will be discussed only br_iefly. Study area operators reported that right
of way takings had no effec.ts on their poultry or swine operations.
Only one study area operator had breeding hogs at any of the
specified dates. However, during the study period from 1964 to 1969,
five study area operators raised or purchased hogs which were sold
later. Two control area operators had sizeable hog operations in
1964 and 1966. An additional control operator depended heavily on swine
production for income in 1969.
Six study and four control operators had chickens in 1964. There
were two fewer operators with chickens in each area by 1969. The operators
with chickens in 1969 reported they were reluctant to quit poultry production
although they were not making any money from egg sales. Two control
area operators raised turkeys for two years, but they were purchased
and sold in the same year.
CHANGES IN EXPENSES AND INCOME
One of the major objectives of the study was to determine ·the effects,
if any, of right of way acquisition upon the net income from agricultural
operations. To pursue this ohjective, cash expenses and cash receipts
are compared for the two groups of operators between the years 1964, 1966
and 1969, which represent the before, during and after periods of the
study. The data required for these analyses could not be developed on
a tract basis.
63
Operating Expenses
Tables 25 and 26 present the operating expenses of the 18 study:
and 19 control area operators. The list of expenses includes actual
outlays required to carry on operations, but not major capital
expenditures such as purchases of major farm equipment. Depreciation
and other implicit costs also are not- included.
Feed purchased represented the largest expense item for both groups
of operators throughout th_e study. In 1964, feed purchased accot.inte.d
for 42 percent of study area expenditures and about 35 percent of
control area expenses. Other expense items usually represented less
than 10 percent of the total ~xpenditures. Some expenses of major
significance to the operators were fertilizers, hired labor, machine
hire, repairs and rent expense. Miscellaneous expenditures includes
all other expenses not listed. Most operators had small miscellaneous
expenditures, which included the purchase of stmdry suppli.es and tools,
utilities, freight and dues to milk marketing associations by the
dairyman. Such expenses incurred by dairymen: account for a large portion
of total miscellaneous expenses.
Between 1964 and 1969 the control area operators increased their
expenses approximately 18 percent more than the study area opera tors,
but between 1964 and 1966 the study area operators had a 12.5 percent
increase in expenditures as compared to a 6.1 percent increase for the
control group. These differences in expense patterns between 1964 and
1966 suggest that the study area operators might have spent tDOre money
in 1966 in order to offset the loss of land, but based on the
statistical Students-t test these differences were not significantly
64

0\ V1
Table 25
Changes in Ope rat~~~ Expenditures of 18 Sty?y A~~a Operato.rs from·l964 to 1966 and 196g.!.
Amount of Ex12endit:ures Chan~es in Expenditu]:es Type of Expenditure 1964 1966 1969 1964-1966 1964-1969
Dollars Dollars Dollars Dollars Percent Dollars Percent
Feed 26,757(18) 30,166(18) 27,986(17) 3,409 . 12.7 1,229 4.6 Veterinary 404(15) 332(11) 780(17) - 72 - 17.8 376 93.1 Fertilizer: Pasture 1,691(10) 2, 715(11) 2, 951(15) 1,024 60.6 1,260 74.5
Cropland 2, 020(14) 2, 643(14) 3,837(15) 623 30.8 1,817 90.-0 Herbicides & etc. J:./ 109{ 2) 276( 3) 620(11) 167 153.2 511 468.8 Seed 1,916(14) 1,315(13) 1,923(12) - 601 - 31.4 7 0.4 Gas & Oil 3,283(18) 3, 550(18) 3,903{18) 267 8.1 620 18.9 Repairs 2,645(16) 4,049(14) 5,524(17) 1,404 53.1 2,879 108.8 Machine Hire 4,741(13) 3,813(16) 5, 792(17) - 928 - 19.6 1,051 22.2 Hired Labor 2,267(11) 5,151(15) 4,897(17) 2,884 127.2 2, 630 116.0 Fence Repair 558( 8). 435( 7) 730( 5) - 123 - 22.0 172 30.8 Interest 3~806( 6) 2,639( 7) 3,478( 7) -1,167 - 30.7 - 328 - 8.6 Insurance & Taxes 2, 946(17) 3,598(17) 4,376(17) 652 22.1 1,430 48.5 Rent: Cash 4,334( 9) 4,431( 9) 3, 711( 7) 97 2.2 - 623 - 14.4
Crop 958( 2) 0 0 - 958 -100.0 - 958 -100.0 Miscellaneous 5,271(12) 6,531(12) 5,591(14) 1,260 23.9 320 6.1
Total 63,106(18) 71' 64i4(18) 76,099{18) 7,938 12.5 12,393 19.5
1/Nwnbers in parentheses are the number of operators reporting the particular expense. ~1A1so includes.insecticides expense.

(j'\ (j'\
Type of Expenditure
Feed Veterinary Fertilizer: Pasture
Crop1~7d Herbicides & etc.-Seed Gas & Oil Repairs Machine Hire Hired Labor Fence Repair Interest Insurance & Taxes Rent: Cash
Crop Miscellaneous
Total
Table 26
Changes in Operating Expenditures of 19 C~~trol Operators from 1964 to 1966 and 196g.:.
Amount of Expenditures
Dollars
30,027(19) 1,393(18) 1,805( 8) 6,221(17)
270 ( 8) 3,018(17) 4,539(18) 5,"~31(18) 5,609(19) 7 ,381(18) 1,416(12) 2,055( 6) 5,004(17) 2, 725( 8) 1,631( 4) 6,387(16}
85,412 (19)
Dollars
31,279(19) 784(15)
3,483( 8) 4,729(14)
474 ( 7) 3,838(17) 6,646(19) 4,622(18) 6,429(17)
10,351(18} 2,135 (14)
890( 7) 5,420(17) 2,650( 9)
783 ( 3) 6,134(14)
Dollars
52,124(19) 1,005(15) 4,875(15) 7,254(19} 1,215(13) 2,155(13) 6, 720(19) 5,666(18) 6,595(18)
11,071(18) 860( 9)
1,521( 6) 5,058(18) 3' 900 ( 8)
250( 2) 7,316(17)
90,647(19) 117,585(19)
Changes in Expenditures 1964-1966 1964-1969
Dollars Percent
1,252 609
1,678 -1,492
204 820
2,107 -1,309
820 2,970
719 -1,165
416 75
848 253
5,235
- 4.2 -43.7
93.0 -24.0
75.6 27.2 46.4
-22.1 14.6 40.2 50.8
-56.7 8.3
- 2.7 -52.0 - 4.0
6.1
Dollars Percent
22,097 388
3,070 1,033
945 863
2,181 265 986
3,690 556 534 54
1,175 - 1,:381
929
32,173
73.6 - 27.9
170.1 16.6
350.0 - 28.6
48.1 - 4.5
17.6 50.0
- 39.3 - 26-.0
1.1 43.1
- 84.7 14.5
37..7
.!/Numbers in parentheses are the number of operators reporting the particular expense.
J:./Also includes insecticides expense.

different at the 95 percent level. No detailed infonnation was gathered
concerning 1965 operations but operators-reported that they spent
approximately $8;000 in 1965 directly related to ·right of way taking.
These expenditures consisted primarily of fencing expenses, money spent·on
land improvements to increase grazing capacity and costs of providing
water on the remainder tracts. As was discussed in a previous section,
all or almost all. of these funds were from right of way payments.
A major portion of the 37.7 percent increase in expenditures
for the control group from 1964 to 1969 resul-ted from the large amount
of feed purchased by one operator who began a hog operation in 1968
and purchased _over $10,000 of feed in 1969. Operators in both are~s
had significant increases in herbicides and fertilizers expenditures
indicating a more intense use of their land. Repair expenses increased
noticeably for the study area, but declined in the control area. This
difference in repair expense should not be related to highway effe·cts
as it arose primarily because two control operators had rather large
repair expenses on farm equipment in 1964 and very little in 1969.
Also, two study area dairymen had repair expenses on dairy equipment in
1966 that were considerably greater than their 1964 expenses. Operaoors
; in both areas had .significant decreases i.n rent paid in the form. of
crops as very little cropland was being rented on a crop-share basis
in i969. The trend is to rent :all land on a cas~ basis.
Between 1964and 1966, about two-thirds of both .study and control
operators increased their operating expenses, with the other one~third
of each group reducing such expenses. Between 1964 and 1966, 56 percent
67
·of the study area operators increased their expen$es while 58 percent
of the control openators had larger expenditures. The balance of operators
reduced their expenses. The taking of right o.£ way naturally affected.
the study area operators, but the expenses of individual operators in
1964 and then two years late:r (1966) we:re not expected to be much
different than those of the control group. It was expected that some
operators would show increases and some decreases simply. beeause o£
chllnges in farm practices. Ten of the 18 iltudy area operators increa.sed
expenses from $4.5 to $2;800 from 1964 to 1966 with the average increase
being about $900. ·During this period 12 of the 19 control operators·
had increases in expenditures, that ranged from $300 to $2.,600 or an
average increase of $875. The other eight study and control area
operators decre~sed their expenses by an average of $295 and $490
each respecti~ely.
With three additional years to allow for c~angesin operations,
greater variations among operators are evident when 1964 and 1969
expenses are compared. By 1969, 11 study area operators had increased
their expenses by an average of $1,760 each, compared to an average
~ncrease of $2,824 for 13 control operators. The increases ranged
from $340 to $8,100 in the study area and from $385 to $13,000 in the
control area. As was the case between 1964 and-1966, those control
operators who reduced their expenses, had an average decrease much
smaller than that of study area operators. The average decrease for the
six control operators was about $600. The average decrease in expenses
for those seven study area operators was $1;762.
68

From the data ~vailabl~, it appears that the fluctuations of
operating expenses does not indicate any significant difference
between the two groups of operators, that could be attributable to highway
effects. Most of the changes in expenses resulted from operators in
both areas shifting their operations from·a more diversified type of
farming to livestock production.
Livestock Purchas-es
Table 27 presents purchases by the ~Study and control area
operators of various kinds.of cattle. It is evident that operators
in both areas purchased very few livestock during the years used in
this study. However~ it should be mentioned that between l964and 1969
many operators reported purchases in the three years (1965, 1967 arid
1968) not covered in this report.
Most cattle purchased were for breeding purposes or, in the case
of dairy operators, were replacement cows for their milking herds.
However, most operators reported that they preferred to raise their own
replacement heifers. This was particula;t"ly true for.beef cattle
operators.
In 1964 the operators in both areas purchased about the same number
· of cattle while in 1966 and 1969 the control group purcha.sed considerably
more than did the study area operators. In 1964, only four operators
in each group purchased cattle. The four study area operators purchased
26 head of breeding stock, 20 of which were heifers purchased to stock
a tract of land obtained in i964 and later affected by the right of way.
69
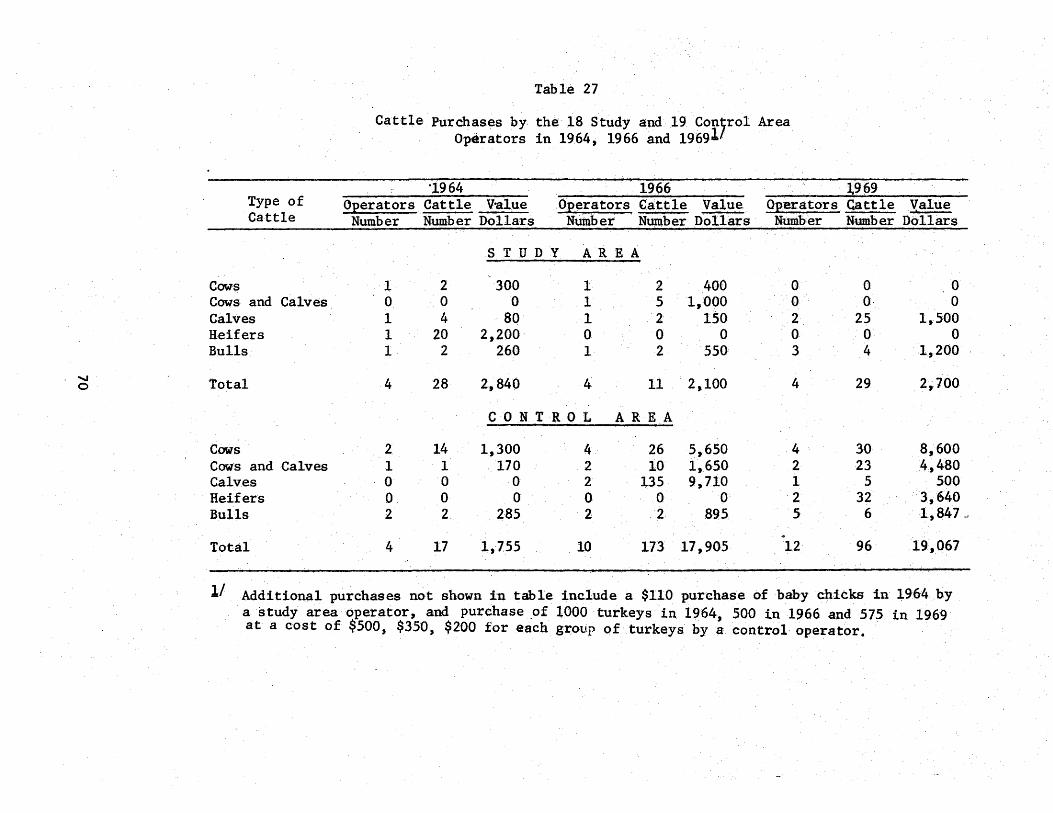
""-J 0
Type of Cattle
COW$ Cows and Calves Calves Heifers Bulls
Total
Cows Cow'S and Calves Calves Heifers Bulls
Total
Table 27
Cattle Purch~ses by the 18 Study and 19 Gon7rol Area Oparators in 1964, 1966 and 19691
•1964 1966 l969 0:2erators Cattle V-alue 0:2erators C~ttle Value O}!erators Cattle vaitie
Number Number Dollars Number Number Dollars Number Number Dollars
STUDY AREA
1 2 300 1 2 400 0 0 0 0 0 0 1 5 1,000 0 0 0 1 4 80 1 2 150 2 25 1,5{)0 1 20 2,200· 0 0 0 0 o· 0 1 2 2.60 1 2 550 3 4 1,200'
4 28 2,840 4 11 ' 2,100 4 29 2,.700
CONTROL AREA
2 14 1,300 4 26 5,650 4 30 8,600 1 1 170 2 10 1,650 2 23 .4,480 0 0 0 2 135 9,710 1 5 500 0. 0 0 0 0 0 2 32 ·J,640 2 2, 285 2 2 895 5 6 1,847 ,-
4 17 1,7.55 10 173 17,905 12 96 19,067
1/ Additional purchases not shown in table include a $110 purchase of baby chicks in 1964 by a study area operator, . and purchase .of 1000 turkeys in 1964, 500 . in 1966 and 575 in 1969 at a cost of $500, $350, $200 for each group of turkeys by a. control operator.

Only 17 head of cattle were purchased in 1964 by the four control
operators. When comparing the purchases by the two groups of operators
in 1964, it should be mentioned tlB t study area operators at that time
had anticipated the highway taking part of their land so they were
probably hesitant to make purchases.
In 1966, four study area operators purchased onlyll head of cattle
as compared to 173 head purchased by 10 control area operators. ·Nine
head in the study area and 38 head in the control area were bought for
breeding stock, the remainder being stocker calves that would be resold
in a few months.
In 1969 the control area operators, again purchased more livestock
than did the study area operators. Only four head of breeding stock
were purchased by three study area operators compared to 91 head
purchased by 11 control operators.
In summary, fewer study a:rea operators purchased cattle in 1966
and 1969 than did control area operators. Study operators also
purchased a smaller number of cattle in the two years. Some of this
difference might be attributable to highway effects, but the evidence
is inconclusive. Cattle purchases obviously fluctuated widely from year
to year. Also operators may have made livestock purchases in 1965, 1967
or 1968 that could differ a great deal from the pattern in Table 27.
Sales of Livestock 2 Livestock Products and Other Farm Products
In analysing the sales of livestock and other farm products by
the two groups of operators, this study was primarily concerned with
whether or not the taking of land for right of way had any noticeable
71
effect on the reduction of sales in years following the taking. Table
28 shows beef cattle sales of the 18 study area and 19 control area
operators. Since all the operators with be.e£ cattle in 1964 had primarily
cow-ca.l£ operations, most of the cattle sold were calves that ranged
from si& to nine months ·of age.
In 1964, cattle sales by the control group were almost double those
o·f the study area. Some of this difference in the 1964 sales is
attributable to highway, as five of the 18 study area operators receiving
payment for right of way in 1964 reported that they held some of their
1964 calf crop and sold them in 1965 to reduce income tax payments.
They estimated that a total of.about 30 head of the 1964 calf.crop was
sold in 1965.
Sixteen of the 18 study area operators and 18 of the 19 control
operators had beef cattle sales in 1964. Three dair:Ymen, two in the study
area and one in the control area reported no sales of beef cattle in·
1964. In each area ·a few operators slaughtered a few calves for their
own use. The 16 study area operators sold 19 percent more cattle
in 1966 than in 1964 for a 51 percent increase in value, while the
control group sold only si~ percent more cattle· with a 37.5 percent
increase in value. However, if the 1964 totals of the study area
operators were adjusted to include the 30 head of calves sold. by the
study area operators in 1965, the differences between 1964 and 1966
would show the study area operators having 6.8 pe:t~ent increase in head
sold for an increase irt value of 44 percent. Taking the factor into
72
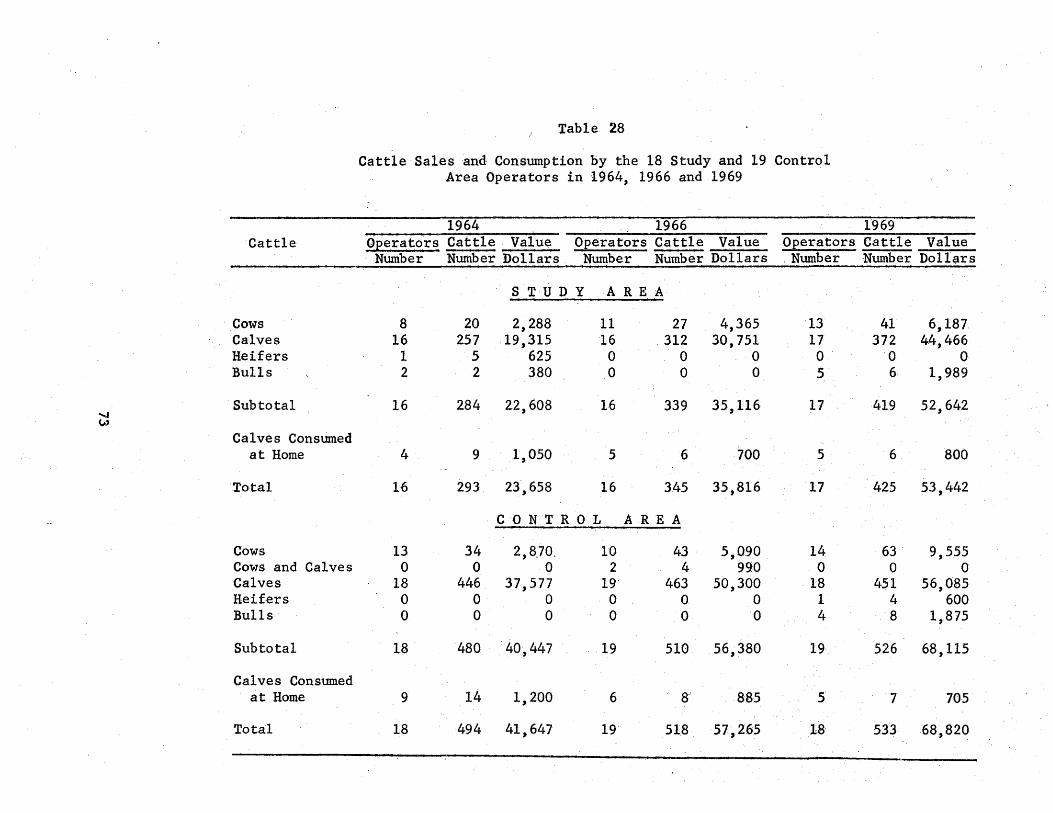
Table 28
Cattle Sales and Consumption by the 18 Study and 19 Control Area Operators in 1964, 1966 and 1969
1964 1966 1969 Cattle 02erators Cattle Value Operators Cattle Value Oeerators Cattle Value
- Number Number Dollars __!umber Number Dollars . Number Number Dollars
STUDY AREA
Cows 8 20 2,288 11 27 4,365 13 41 6,187 Calves 16 2.57 19,315 16 312 30,751 17 372 44,466 Heifers 1 5 625 0 0 0 0 0 0 Bulls 2 2 380 0 0 0 5 6 1' 9'89
Subtotal 16 284 22,608 16 339 35,116 17 419 52,642 ..... w
Calves Conswned at Home 4 9 1,050 5 6 .700 5 6 800
Total 16 293 23,658 16 345 35,816 17 425 53,442
CONTROL ARE A
Cows 13 34 2, 8.70. 10 43 5,090 14 63 9,555 Cows and Calves 0 0 0 2 4 990 0 0 0 Calves 18 446 37,577 19 463 50,300 . 18 451 56,085 Heifers 0 0 0 0 0 0 l 4 600 Bulls· 0 0 0 0 0 0 4 8 1,875
Subtotal 18 480 40,447 19 510 56,380 19 526 68,115
Calves Consumed at Home 9 14 1,200 6 8" 885 5 7 705
Total 18 494 41,647 19 518 57,265 18 533 68,820
account, it appears that the expected decrease in sales of livestock
by the study area operato:rs did not occur after the highway rE!duced
their acreage.
Based on beef cattle sales in 1969 the study area operators continued
to show increases in both numbers of cattle sold· and value received/
It should be noted, however, that the· price of beef cattle inc.reased
considerably from 1964 to 1969. In 1964 the operators reported that .
calves sold for an average of about $75 e.ach; compared to approximately
$120 per head in 1969.
Between 1964 and 1969, the study area operator had a 48 percent
increase in the nwnber of cattle sold compared to 4.6 percent increase
for the control operators. The value of cattle sold more than doubled
in the study area, while the control group had only a 68 percent increase.
Therefore, based on these differences the study area operators with beef
cattle operations performed much better in the after periods than did
the control area indicating that the highway had no adverse effects on ·
beef cattle sales on a longer run basis.
Other livestock and poultry operations contribute a great deal to
the agricul tur_al income of both the s_tudy and control area operators.
However, due to the character of these operations only thedairymen could
expect any noticeable effect from the loss of land.to the highway.
The other types of operations require only limited acreage for
operations, and the highway had no effects on those operat:ions. However,
the receipts from these operators are included in order to obtain the
total income earned from all agricultural enterprises.
74

Table 29 presents sales of the other forms of livestock, ·livestock
products, poultry and pecans, the latter being a rather incidental crop
and actually a pasture product. Income from dairying con~ributes
about 70 percent of the total sales received by these operators in 1964.
The study area haq four dairymen in 1964, wh<> sold an average of $9,400
of milk each, as compared to two d-airymen in the control area with sales
averaging nearly $22,000 each. The dairymen, also sold their dairy calves
and a few cows. each year.
:Based on the egg sales. by the operators it is evident that the
operators in both areas reduced their egg laying operations significantly
in 1966 and 1969. They blamed low egg prices for the cut backs. Hog
operations were of little importance to the study area operators through;..
out the study, but for two control operators hog sales represented the·
greater part of their agricultural income. This was particularly true
in 1969, as these latter operators had increased their 1969 operations
significantly over 1966.
Between 1964 and 1966, the four study area dairymen had a 38.1
percent increase in milk sales while the two control operators had
a 74 percent increase in mil~ sales. A small amount of this difference
may be attributable to the highway, but the greater portion of the
difference is explained by operator characteristics. The two control
operators were young and aggressive and were rapidly expanding their
operations, while the study area operators had fewer resources and for
the most part were less aggressive. Only two of the study area operators
had their dairy operations located on right of way tracts. However,
75

Item
Dairy Milk Cows .Calves
Hogs Poultry
....... Eggs 0\
Hens Pecans
Total
Dairy Milk Cows Calves
Hogs Poultry
Turkeys Eggs
Pecans
Total
Table 29
Sales of Other Farm Products by 18 Study and 19 Control Area Operators in 1964, 1966 and 1969
Operators Number
4 2 4 3
6 2 1
10
2.
2 .2 2
1 4-1
9
1964 Value Operators
Dollars Number
1966 Value Operators
Dollars Number
S T U D Y A R E A (10 Op:era.tors)
37,759 4 44,363 3 279 2 632 2
2,959 3 2,177 2 1,140 5 2,.020 2
7,223 5 2,869 4· 225 1 30 0
1~500 2 .·1,390 2
51,085 10 53,481 9
c· O~N T R 0 L AREA (10 Operators)
43,258 2 59,735 2 2,630 2 4,000 2 1,800 2 4;000 2 4,980 3 9,400 3
3,500 2 3,_400. 1· 3,960 4 3,240 3
70 1 290 1·
60,198 9 84,065 8
1969 Value
Dollars
56,310 1,224 3,500 1',390
790 0
650
63,864
75,441 4,650
·4,900 27,980
2,520 600 150
116,241
in one case, the highway severed the dairy operation and, by doing so,•
reduced the available acreage by -37 percent, as the operator could not
effectively use the 52 acre severed parcel in his dairy operation.
Therefore, he reduced his milking herd by five cows which in turn reduced
his 1966 milk sales. The other two study area dairymen had beef cattle
on the right of way tracts so the taking of right of way from these
tracts had no direct effects on their dairy operations.
In 1969, the study_area had only three dairymen as the one reducing
his operation in 1966, sold his dairy herd and switched to beef cattle.
This operator reported that he made this change primarily because of his
age as he decided to go into semi-retirement, and raising beef cattle
required l_ess work than operating a dairy. In 1969, the three .remaining
study area diarymen more than doubled their 1964 sales, while the two
control area dairymen had a 73_ percent increase in milk sales.
Changes in Income
One objective of this study ~as to dete't'llline the effects, if any,
of dec:reased acreage on the income of operators who lost land to the
highway right of way. To pursue this objective, cash receipts and cash
expenses of .the two groups of operators are comp~red during each of the
years (Table 30). The year 1964 represents the before period, izn which
expenses and receipts were not influenced by the new highway. In 1966,
which represents the period of construction, study area operators had
had one year in which to make adjustments. The year 1969, following
the completion of the facility, represents the after period.
77

..... 00
Agricultural Income and Expenses of the 18 Study aiJ.d 19 Control Area Operators in 1964, 1966 and 1969.!/
Studz Area Control Area Item 1964 1966 1969 . 1964 1966
Dollars Dollars Dollars D·ollars Dollars
Gross Income Crops 4,833( 5) 2,272{ 4) 3, 025( 5) . 2,555( 8) 2,150( 5) Cattle 21 23, 658(16) 35,816(16). 53)442(17) 41,647(18) 57, 265(19) Other Sale~ 51,085(10) 53,481(10) 63,864( 9) 60,198( 9) 84,065( 9) Government Progra~/ 2, 110( 6) 2,772( 7) 2,791( 8) 2, 245( 7) 1,306( 8) Other Farm Incom~ · ·248{ 3) 1,406( 2) 1,750( 3) 400( 2) 300( 2) Custom Work 0 0 0 7,000( 2) 8,000( 2)
Totals 81, 934(18) 95,747(18) 124,872(18) 114,045(19) 153,086(19)
Average Per Operator 4,552 5,319 6~937 6,002 8,057
Cash Expenses. Operating Expenses 63,706(18) 71,644(18) 76,099(18) 85; 4.12(19) 90,647(19) Cat·tle Purchase.s . 2, 540( 3) 1,700( 3) 2,700( 4) 1, 755( 4) 15,955( 8) Other Livestock Purchase~/ 410( 2) 0 400( 2) 500( 1) 2,300( 3)
Total Expenses 66,656(18) 73,344(18) 79,199(18) 87, 667(19) 108,902(19)
Average Per Operator 3,703 4,075 4,400' 4,614 5,732
Net Cash Oeeratin& Income . Total 15,278 22,403 45,·673 26,378 44,184 Average Per Operator 849 1,245 2~537 ·1;388 . 2,325
.!lFigures in parentheses represent number of operators •
.tlrncludes sale of dairycattle, milk, hogs, chickens, turkeys, eggs and pecans •
1969 Dollars
2,335( 3) 68,820(18)
11.6; 241( 8) 960( 4) 300.( 2)
10,000( 2)
198,656(19)
10,456
117,585(19) 12,767(10)
6, 500:( 3)
136,852(19)
7,203
61,804 3,253
. ~/Includes payments for land in .grain and cotton programs and money received fo.r conservation practices. 4/Includes income from rent, hunting leases and other miscellaneous items. 2/Includes purcha·se of dairy cows, turkeys and. chickens.

Table 30 shows the varmous sources of income from agriculture and
the cash operating expenses- for the study- and co-rt~rol areas, while Table
31 shows the percent changes between years. In ,ea'ch o~ the tll.ree years
the study area operators'_ gross incomes from agricultuxe were.smaller
than those- of the control oper~tors. In 1964; the 18' study a:r:ea operators
had an average of $4,552 income each from agricul'tur'e _·compared to
$6,002 average for the 19 control operators. In_ 196_6_, .and 1969 the
average p~r operator had increase~ to $5,,319 and "$6, 937 for the study
area op~rators as compared to $8,057 and $10,456 for the con-trol group.
As shown in Table 31, the control operators had a 34.2 percent
increase in gross income in 1966 compared to 16.9:p_ercent for the
study group. Between 1966 and 1969 the two groups of operators pe-rformed
similarly, but between 1964 and 1969 the control group_ ~xperienced a
greater increase.
In 1964 the combined cash operating expenses averaged $3,703 for
the study area operators and $4,614 for the control group. Total cash
expenses increased in both 1966 and 1969 for both groups of operators,
but the expenses of the control operators increased more sharply than
those of the study area. Between 1964 and 1966, expenses of the study
area group increased abou·t 10 percent, as compared to a 24.2 percent
increase in the control araa. The differences were eve"Q greater between
1964 and 1969, with the study area expenses increasing 18.8 percent,
while expenses of the control opera~ors increased 56.1 percent.
79
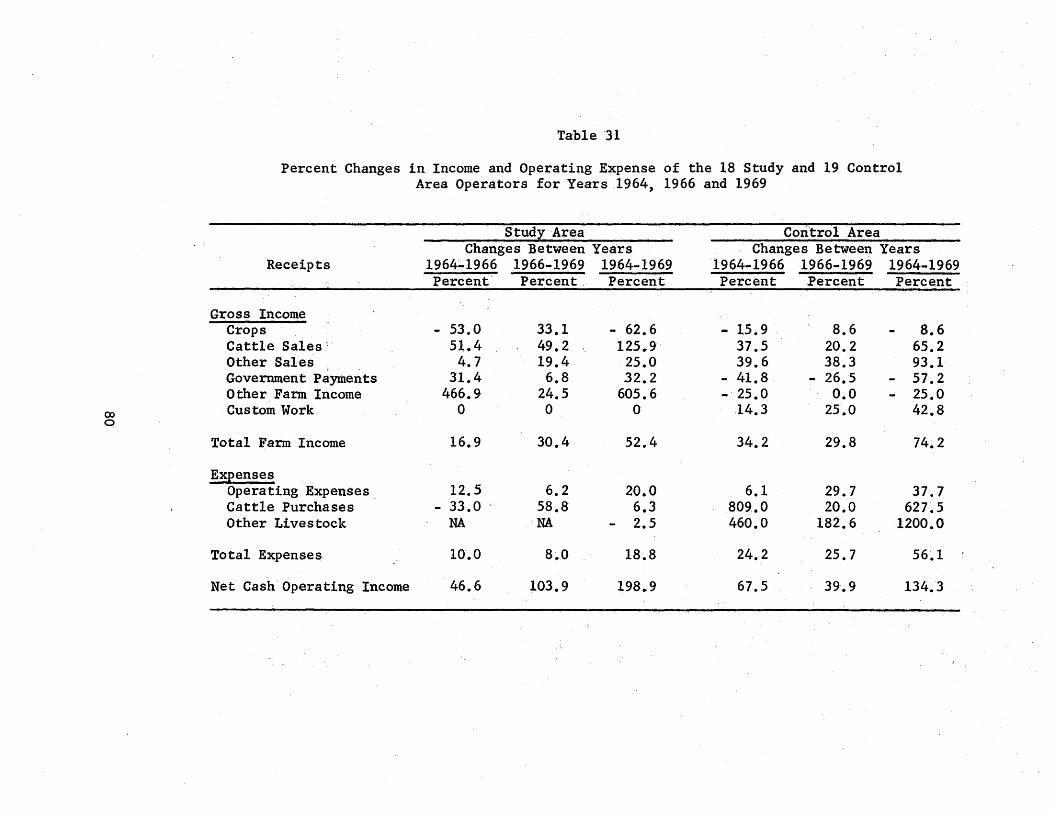
Table 31
Percent Changes in Income and Operating Expense of the 18 Study and 19 Control Area Operators for Years .1964, 1966 and 1969
Stud~ Area Control Area Changes Between Years Changes Between Years
Receipts 1964:..1966 1966-1969 1964-1969 1964-1966 1966-1969 1964-1969 Percent Percent. Percent Percent Percent Percent
Gross Income Crops - 53.0 33.1 - 62.6 - 1.5. 9 . 8.6 - 8.6 Cattle Sales 51.4 49.2 125.9· 37.5 20.2 65.2 Other Sales 4.7 19.4 25.0 39.6 38.3 93.1 Government Payments 31.4 6.8 32.2 - 41.8 - 26.5 - 57.2 Other Farm Income 466.9 24.5 605.6 - 25.0 o.o - 25.0
00 Custom Work 0 0 0 14.3 25.0 42.8 0
Total Farm Income 16.9 30.4 52.4 34.2 29.8 74.2
Expenses Operating Expenses 12.5 6.2 20.0 6.1 29.7 37.7 Cattle Purchases - 33.0 ' 58.8 6.3 809.0 20.0 627.5 Other Livestock NA NA - 2.5 460.0 182.6 1200.0
Total Expenses 10.0 8.0 18.8 24.2 25.7 56.1
Net Cash. Operating Income 46.6 103.9 198 •. 9 67.5 39'. 9 134.3
The "net cash operating income" derived in Table 30 does not take
into account all the expen,ses that are incurred :i;n farm operations.
Such e:xpenses as depreciation on equipme·nt and buildings or changes
in equipment and livestock·inventories could not be developed to a
reliable degree.
After all expenses tvere subtracted from the gross income, it was
found that study area operators had smaller yearly ~et cash operating
incomes irt each of the three years than did control area operators.
However, study area operators had a greater increase in net cash operating
income between 1966-1969 and between 1964-1969 than those in the control
group. The lesser increase in net cash operating income for the study
area operators between 1964 and 1966 was characteristic of the uduring,
period" income patterns found in the Ellis and Madison County studies.
As mentioned in the two previous study reports, this difference indicates
that generally the study area did experience a setback in the period
immediately following right of tvay acquisition •. As shown in Table 30,
net cash operating income of the study area operators increased 46.6
percent between 1964 and 1966 compared to a 67.5 pe.rcent in~rease for
the control group. However, between 1964 and 1969, the net income
of the study area operators increased 198.9 percent~ while those in the
control area had a 134.3 percent increase. These rather large increases
in bot~ areas were directly related to the increases in milk sales, and
the higher prices received for cattle in 1966 and 1969. Cash operating
expenses also increas~d during this period but to a lesser degree.
To give a better understanding of the income patterns of the study
and control araa operators, Table 32 presents a frequency distribution
81
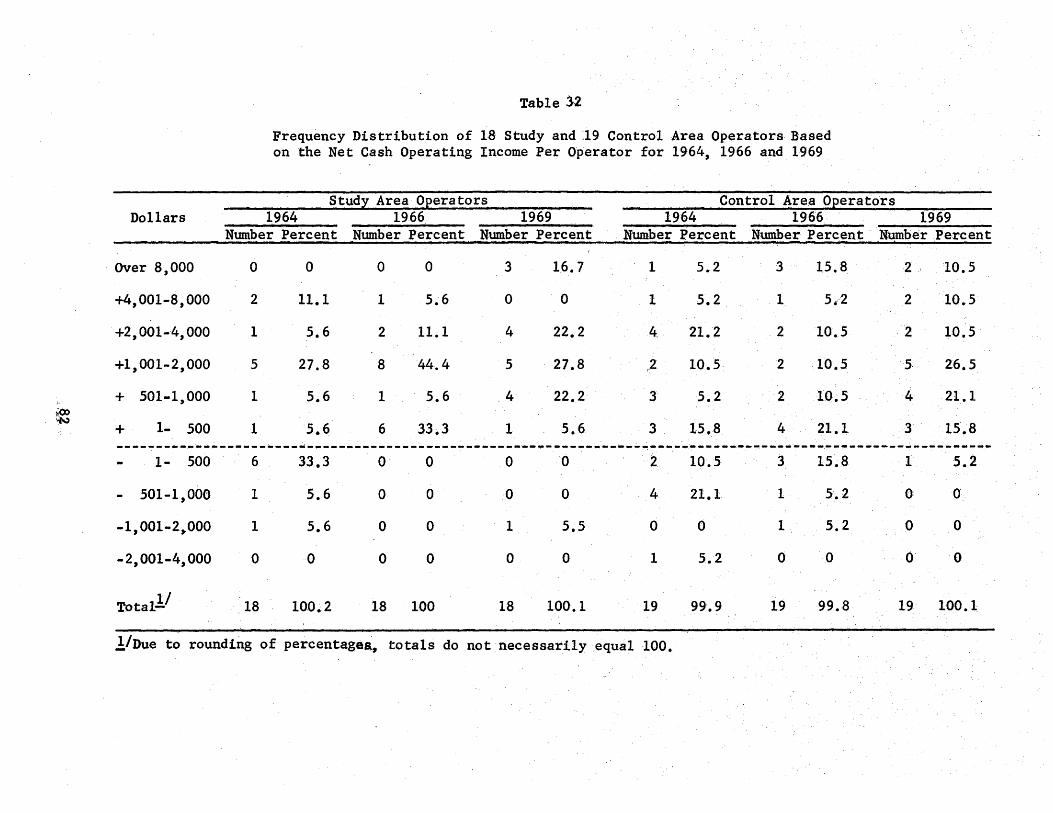
.!--
;(¥) \IN
Table 3,2
Frequency Distribution of 18 Study and 19 Control Area Operators Based on the Net Cash Operating Income Per Operator for 1964, 1966 and 1969
·Stud~ Area 02erators Control Area 02erators Dollars 1964 1966 1969 1964 1966 1969
Number Percent Number Percent Number Percent Number Percent Number Percent Number Percent
Over 8,000 0 0 0 0 3 16.7 1 5 .. 2 3 15.8 2- 10.5
+4,001-8,000 2 11.1 1 5.6 0 0 1 5.2 1 5.2 2 10.5
+2,001-4,000 1 5.6 2 11.1 4 22.2 4. 21.2 2 10.5 -2 10.5
+1,001-2,000 5 27.8 8 44.4 5 27.8 ,2 10.5 2 -10.5 5 26.5
+ 501-1,000 1 5.6 1 5.6 4 22.2 3 5.2 2 10.5 4 21.1
+ 1- 500 1 5.6 6 33;.3 1 5.6 3. 15.8 4 21.1 3 15.8
----------~--------~---~---------------------------~--------------~-------------~---~-------------------------1- 500 6 33.3 0 0 0 0 2 10.5 3 15.8 1 5.2
- 501-1,006 1 5.6 0 0 0 0 4 21.1 l 5.2 0 0
-1,001-2,000 1 5.6 0 0 1 5.5 0 0 1 5.2 0 0
-2,001-4,000 0 0 0 0 0 0 1 5.2 0 0 0 0
To tall/ 18 100.2 18 100 18 100.1 19 99.9 19 99.8 19 100.1
!/Due t~ rounding of percentages.., totals do not necessarily equal 100.
of th~_two groups of operators based, on the net cash operating income
per operator over the three years. In 1964, eight study and seven control
area operators reported losses in their farming operations. On the
other hand, no study area operator showed a loss in 1966 and only one
operator had a loss in 1969, while five control operators. had losses
in 1966 and one in 1969. Of the operators with losses in 1964·; six of
the eight study area and two of the seven control area operators had
off-the-farm employment during the year. The other operators were full
time fanners, but three of the control and one of the study_area operators
were semi-retired and had retirement income.
In 1966, study area operators wsre concent:rated in the two in~ome
categories, $500 to $1,000 and $1,.001 to $2,000. Control area operators
were widely dispersed among the categories, but five control operators
reported losses in farming operations in 1966.
Several operators moved up the·scale to higher income brackets in
1969. Seven or 38.9 percent of the study a:rea operators had incomes of
over $2,000 in 1969, compared to only 16.7 percent in 1964 and 1966.
The control group had the same number of operators with incomes over
$2,000 in each of the -three years but in 1966 and 1969 fewer control
operators·had losses.
Table 33 shows that ten or 56 percent of the study area group
and eight or 42 percent of the control area group experiemced gains in -
their incomes in both 1966 and 1969. Between 1964 and 1966, 13 study
and 14 control area operators experienced income gains. Between 1964
and 1969, a similar ratio existed, with 14 study and 15 control operators
83
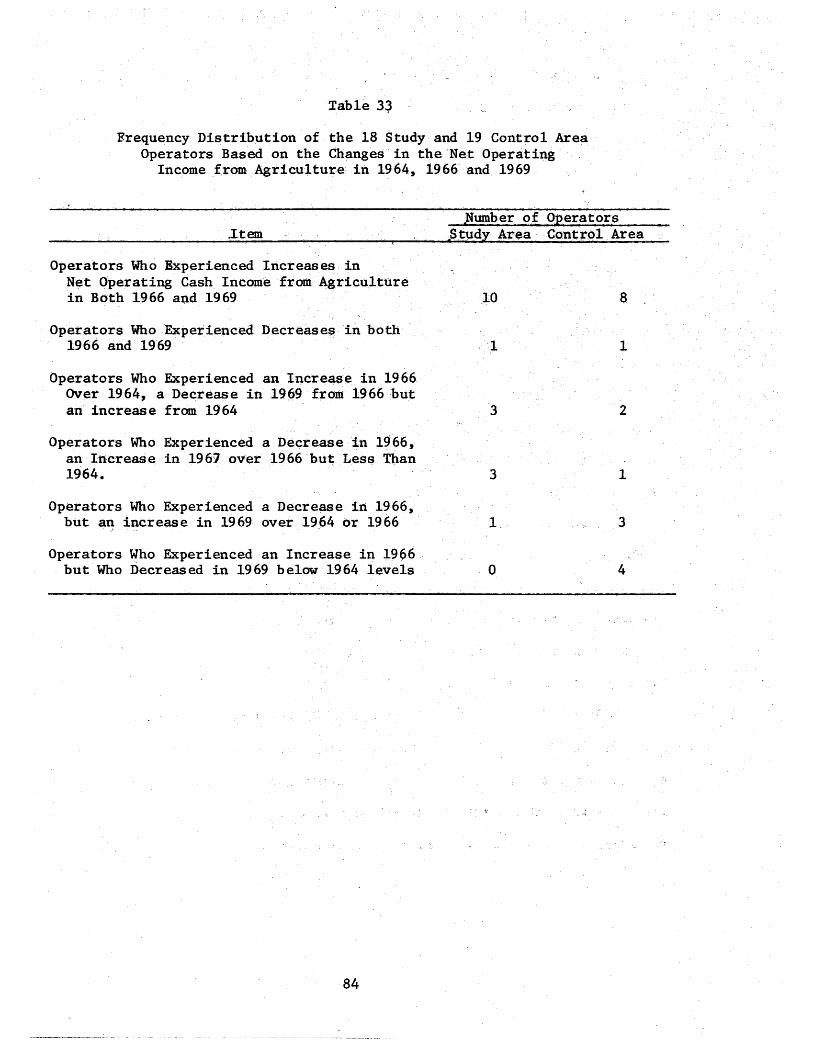
Table 3~
Frequency Distribution of the 18 Study and 19 Control Area Operators Based on the Changes· in the 'Net Operating
Income from Agriculture- in 1964, 1966 and 1969.
pumber of Operators .Item ,St1,1dy Area Cont't()l . Area
Operators Who Experienced Increases in Net Operating Cash Income frotn Agriculture in Both 1966 and 1969
Operators Who Experienced Decreases. in both 1966 and 1969
Operators Who Experienced an Increase. in 19 66 Over 1964, a Decrease in 19(;9 from 1966 but ari increase fram 1964
Operators Who Experienced a Decrease in 1966, an Increase in 1967 over 1966 ·but Les~ Than 1964.
Operators Who Experienced a Decrease in 1966, but a~ increase in 1969 over 1964 or 1966
Operators Who Experienced an Increase in 1996 but Who Decreased in 1969 below 1964 levels
84
10 8
1 1
3 2
3 1
1 3
0 4
having greater incomes in 1969. However, between 1966 and 1969 .f:he ratio
changed somewhat as 14 operators of the .s·tudy area group and 12 control
. operators had increased their incomes.
Statistical tests were used to evaluate the differences between
averag~ incomes of operators in the study and control areas. By
computing Student's t-values and comparing them with the theoretical
values a.t the 95 percent confidence level, it was revealed that there
was no statistically significant difference between the means of the
net cash operating incomes of the study and control group in 1964,
1966 or 1969. However, with the large variations in income.s among
operators the differences between the averages of the groups would have
to be much more pronounced to have statistical significance.
Because of thevariations and size of operations in relation to the
amount of land affected by right of way acquisition, itwas difficult
to isolate o.r determine the effects that the highway had on the annual
income from agricultural operations of the s~udy area operators. However,
based on the comparisons of the study and control area activities it
appeared that the study area operators as a whole did not fare as well
in 1966 as did the control group, indicating the possibility that they
had not fully recovered in the short period since the loss of'acreage
in 1964. But with additional time to make adjustments and improvements,
particularly to pastures, they were able to show substantial increases
in net income by 1969.
85
As mentioned previously, -a large number of operators in both areas
had income from off-farm employment and other sources. It was not
expected that the highway would have noticeable effects on the non•-
farnt income of the study area operators. Rowever, by comparing the income
from non-farm sources with income from agriculture·, one can determine
the relative importance of agriculture to the operators and, in turn,
gain additional perspective regarding right of way takings. The incomes
of operators from all sources are given in Table 34 for the years
1964, 1966 and 1969.
In 1964, 13 of the 18 study operators and. 14 of the 19 control
operators had income from outside sources and these proportions were
almost unchanged during the overall study period. ·The 1964 income from
agriculture represented only 25 percent of the study areas operators'
total income as compared to 39 percent for the control group. However,
in both 1966 and 1969 income from agriculture showed substantial ·gains
in relation to the gains in non-farm income. By 1969, income from
agriculture represented 45 percent of the total income for the study
area operators, as compared to 57 percent for the control group.
Between 1964 and 1969, the study area operators experie·nced a greater
percentage increase in agricultural ·income than did ·the control group,
but the ratio of agricultural income to other income increased at about
the same percentage for both group of operators. However, the increases
in income.from 1964 to 1969 were influenced greatly by the substantial
gains in agricultural income from increased sales of milk and livestock
by operators who had most of their income from agriculture.
86

00 ""-J
Table 34
Income from All Sources for 18 Study and 19 Control Area Operators for 1964, 1966 and 1969
Income
Net Income from Agriculture
Other Income Off-Farm Retirement
Total Non-Farm Average Per Operator
Total All Income Average Per Operator
1964 ·noriars
15, 278(18)
43, 700(10). 2,600( 3)
46,300(13) 2,572
61,578(18) 3,421
Net Income from Agriculture 26,378(19)
Other Income Off-Farm 32, 950{ 9) Retirement 7,550( 5)
Total Non-Farm 40, 500(14). Average Per Operator 2,132
Total All Income 66,878(19) Average Per Operator 3,520
1966 Dollars
1969 Dollars
S T .u D Y · A R E A
22,403(18)
44,582(10) 3,500( 4)
48,082{14 2,671
45,673(18)
52,900( 9) 3,665( 4)
56,565(13) 3,143
70,485(18) 10i,238(18) 3,916 5~680
CONTROL AREA
44, 184(19)
34, 900( 9) 7,850( 5)
42, 750(14) 2,250
86, 934(19) 4,575
61,804(19)
38,800( 9) 8,255( 5)
47,055(14) 2', 477
108 ,859( 19) 5,729
19~64.;.1966 1966-1969 1964-1969 Percent Percent Percent Change ·_ Ch<i!!&e _Change
46.6 103.9 198.9
2.0 18.7 21.1 34.6 4.7 41.0
3.8 17.6 22.2
14.5 45.0 66.0
67.5 40.0 134.3
5.9 11.2 17.8 4.0 5.2 9.3
5.6 10.1 16.2
30~0 25.2 62.8

CHANGES IN TRAVEL REQUIREMENTS
One of the main concerns of an operator regarding right of way
acquisition for a limited access type highway is the extent that his
travel in the local area will be affected. Of particular interest
to operators was the travel required to reach shopping facilities and
to service his severed tracts. '!'he study developed information on these
types of travel before and after the construction of the new highway.
Travel to the Nearest Shopping Center
Distances were calculated fro111 each operator's home tq the neares·t
shopping center he most frequently visited on the before and after
routes. Each operator li'as asked what route he used on trips to ·tuwn,
before and after the highway was completed.
The town of Weimar is centrally located with respect to the study
area operators. Of the 21 study area operators, six lived less than
two miles from Weimar. Eight other ope~ators lived. from two to four
miles from the town. The remaining seven operators lived more than four
but less than seven miles from Weimar. However, one of these operators
reported that Schulenberg which was 11.6 miles from his headquarters,
was ·his preferred shopping ·location.
An analysis of each operator's distance and route to Weimar revealed
that nine study area operators experienced some changes in their travel
patterns. The other operators were not affected, as they either lived
in town or on tracts from which the best routes to town we_re not changed
by the highway.· Five operators reported that they preferred to use
old u.s. 90 on trips to Weimar as it had very little traffic after the
opening of Interstate 10. The general locations of the study and control
area operators are shown in Figures 3 and 4.
88
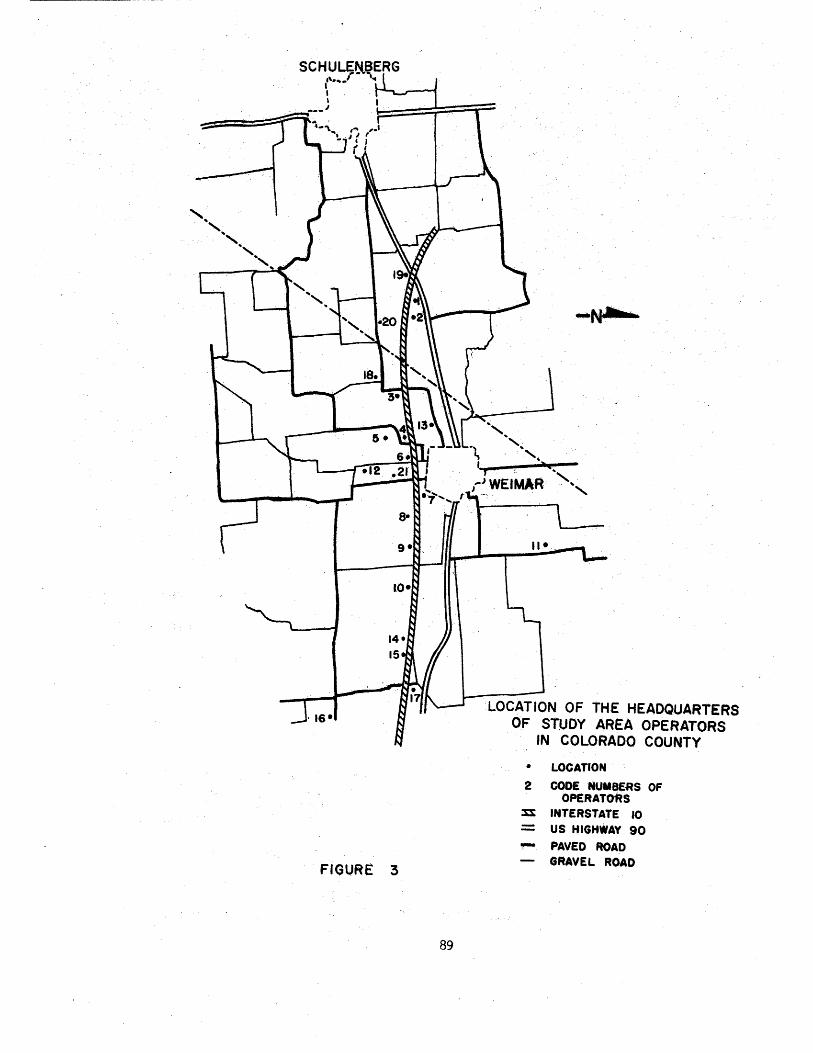
FIGURE 3
89
LOCATION OF THE HEADQUARTERS OF ST.UDY AREA OPERATORS
IN COLORADO COUNTY
• LOCATION
2 OODE NUMBE-RS OF OPERA TOftS
XS: INTERSTATE 10
- US HIGHWAY 90
~ PAVED ROAD GftAVEL ROAD
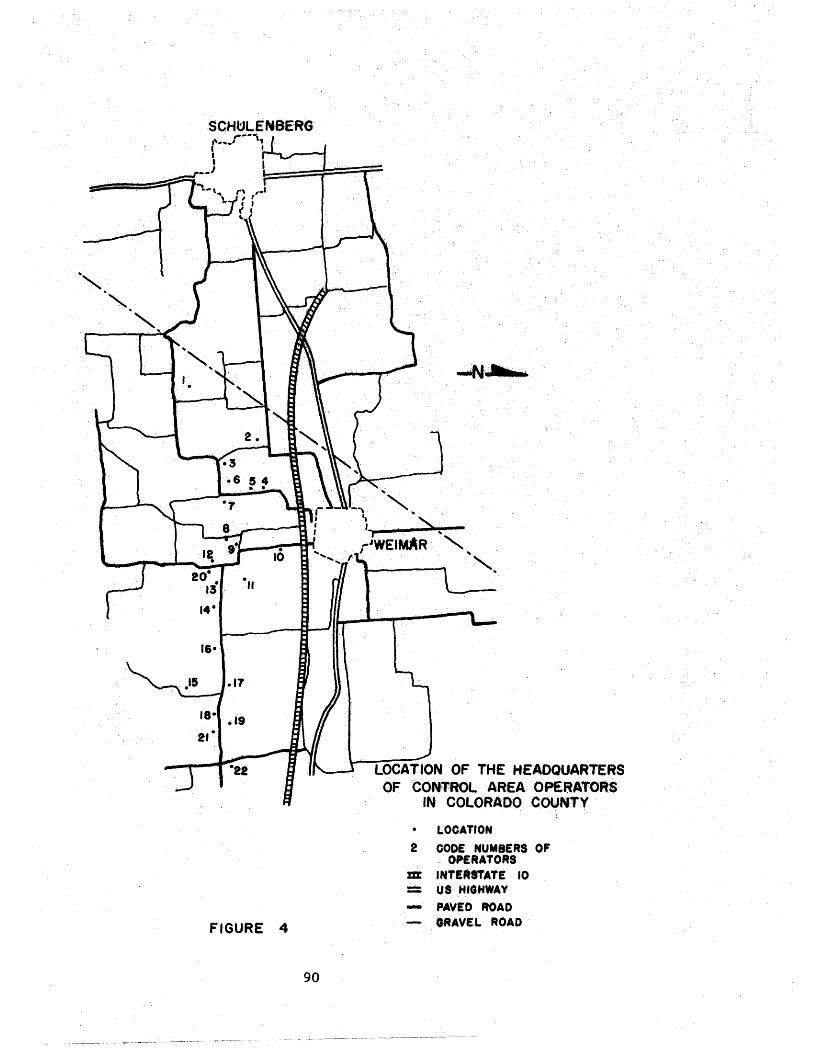
FIGURE 4
90
- - --- --~-------------,.·- ---..- - .. ------··- -----------·- ------ - - ·::-·--·-- --
- -"\
'; ' F . . " .-JWEIPMR "-, . '
'~
LOCATION OF THE HEADQUARTERS OF' CONTROL AREA O·PERATORS
IN COLORADO COUN'TY
LOCATION
2 CODE NUMBERS OF . OPERATORS
m INTERSTATE 10 = US HIGHWAY PAVED ROAD GRAVEl ROAD
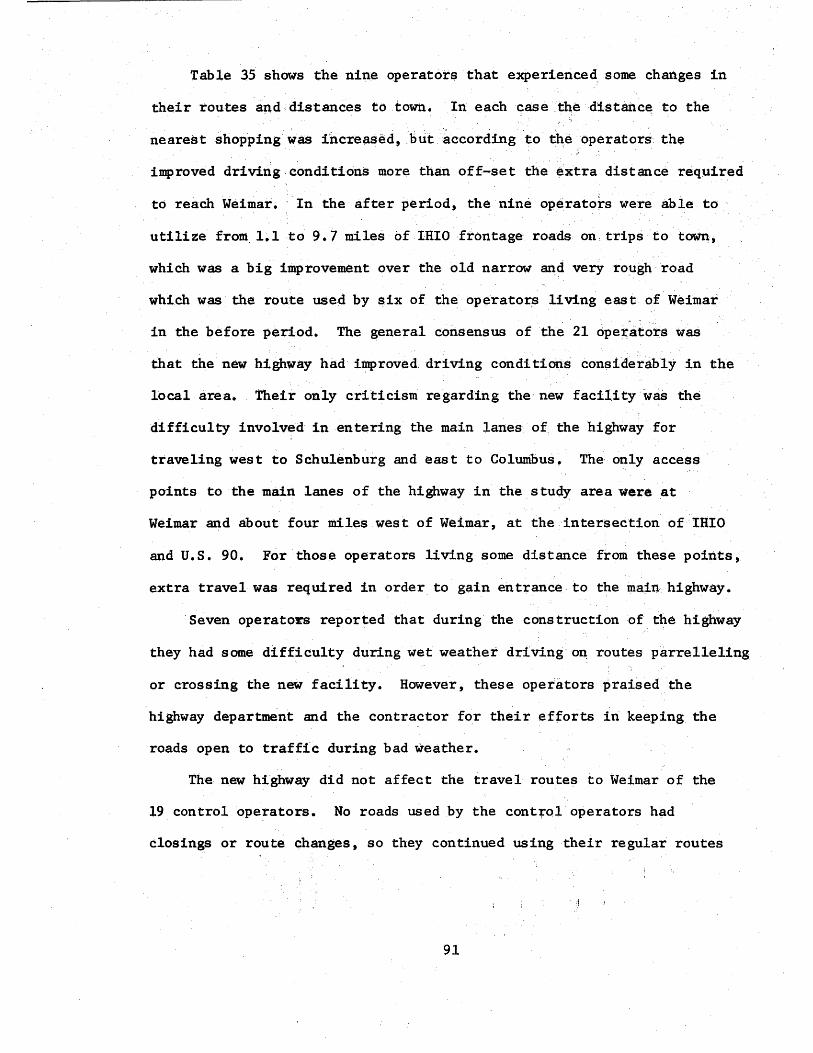
Table 35 shows the nine operators that experienced some changes in
their routes an,d distances to town. In each case ·the dista.nc~ to the
nearest shopping was ihcreased, btit. according to the operators the
improved driving conditions more than off-set the extra distance required
to reach Weimar. ·In the after period, the nine operators were able to
utilize from 1.1 to 9. 7 miles of IHIO frontage roads on. trips to te>Wn,
which was a big improvement over the old narrow ~d very rough· road
which was the route used by six of the operator:s living east of Weimar
in the before period. The general consensus of the 21 6pe:b1tors was
that the new highway had· improved driving conditions considerably in the
local area. Their only criticism regarding the new facility was the
difficulty involved in entering the main lanes of the highway for
traveling west to Schulenburg and east to Columbus. The~ only access
points to the main lanes of the highway in the study area w-ere at
Weimar and about four miles west of Weimar, at the intersection of IHIO
and U.S. 90. For those operators living some distance from these points,
extra travel was required in order to gain en trance to the main highway.
·Seven operators reported that during the construction of. the highway
they had some difficulty during wet weather driving on routes parrelleling
or crossing the new facility. However, these operators praised the
highway department and the contractor for their efforts in keeping the
roads open to traffic during bad weather.
The new highway did not affect the travel routes to Weimar of the
19 control operators. No roads used by the control operators had
closings or route changes, so they continued using their regular routes
91
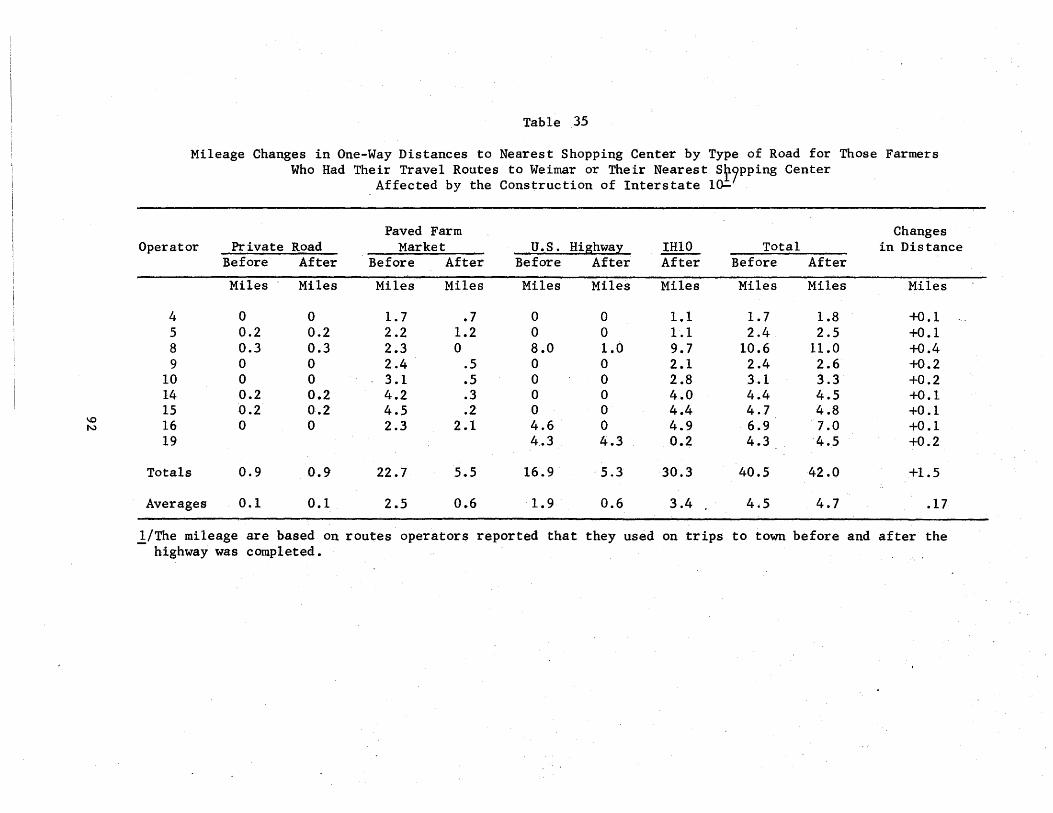
\0 N
Table 35
Mileage Changes in One-Way Distances to Nearest Shopping Center by Type of Road for Those Farmers Who Had Their Travel Routes to Weimar or Their Nearest Sp?pping Center
Affected by the Construction of Interstate 1~
Operator Private Road
4 5 8 9
10 14 15 16 19
Totals
Averages
Before After
Miles
0 0.2 0.3 0 0 0.2 0.2 0
0.9
0.1
Miles
0 0.2 0.3 0 0 0.2 0.2 0
0.9
0.1
Paved Farm Market
Before After
Miles
1.7 2.2 2.3 2.4 3.1 4.2 4.5 2.3
22.7
2.5
Miles
.7 1.2 0
.5
.5
.3
.2 2.1
5.5
0.6
U.S. Highway Before After
Miles
0 0 8.0 0 0 0 0 4.6 4.3
16.9
1.9
Miles
0 0 1.0 0 0 0 0 0 4.3
5.3
0.6
IHlO After
Miles
1.1 1.1 9.7 2.1 2.8 4.0 4.4 4.9 0.2
30.3
3.4
Total Before After
Miles
1.7 2.4
10.6 2.4 3.1 4.4 4.7 6.9 4.3
40.5
4.5
Miles
1.8 2.5
11.0 2.6 3.3 4.5 4.8 7.0 4.5
42.0
4.7
Changes in Distance
Miles
+0.1 +0.1 +0.4 +0.2 +0.2 +0.1 +0.1 +0.1 +0.2
+1.5
.17
1/The mileage are based on routes operators reported that they used on trips to town before and after the - highway was completed.

to town. Generally, the control area operators lived a 'tittle farther
from Weimar than the study area group but most control operators had
access to paved highways for trips to town.
Travel Connected with Qperat'ions
Since most operators travel fr~quently to the var.ious tracts i.n
their operations, it was considered desirable to-establish whether travel
between tracts was affected by Interstate 10. Table36presents one-way
trip distances travelled to the various tracts in the total operations
of study and control operators, both before and after construction of the
highway. Distances were computed from each operator's home or headqua~ters
tract to all other tracts in his operation.
Study Area Travel. As shown in Table 36 there were 13 study and
15 control area operators in 1964 who had extra travel to the multiple
tracts in their operations. Eight study and four control operators had
only one tract in 1964, The 13 study area operators traveled 129.9
one-way miles to reach their various tracts from their headquarters,
as compared to the 83.1 miles traveled by the 15 control operators to
reach their extra tracts. The changes in total distances between the
before and after were very small.. The study·area operators experienced
an overall increase of 5. 5 miles compa:red to a decrease of 4. ·4 miles
for the control group. Three control operators with multiple tracts
in 1964 had only one each in 1969, which accounted for a decrease of
21.4 miles. However, four other operators added tracts which increased
the total distance by 17 miles.
93

:HlO
!able 36
One-Way Mileage by Type of Road.FromHeadquarters of 21 Study Area Operators and 19 Control Area
Operators to All Tracts Operated Before and After the HighWay
Study.Area Operatorsl/ Control Area Operato-rs.2/ Before Aft.er Before After
0 6.2 ( 8) 0 0
r. s . Highways 11.5 ( 2) 5.0 ( 1) 0 0
69.6 (12) 74.2 (11) 60.5 (14) 56.9
lther 48.8 (11) 50.0 (12) 22.6 (11) 21.8
(12)
(10)
otal Mileage 129.9 (13) 135.4 (13) 83.1 (15) 78.1 (13)
hange Between Period +5.5 -4.4
I No mileage recorded for eight study area operators in the before period as they had extra miles in the after period. The number of operators is in parentheses.
I No mileage was recorded for four control operators in the before period and six in the after period who had only one tract.
94

95
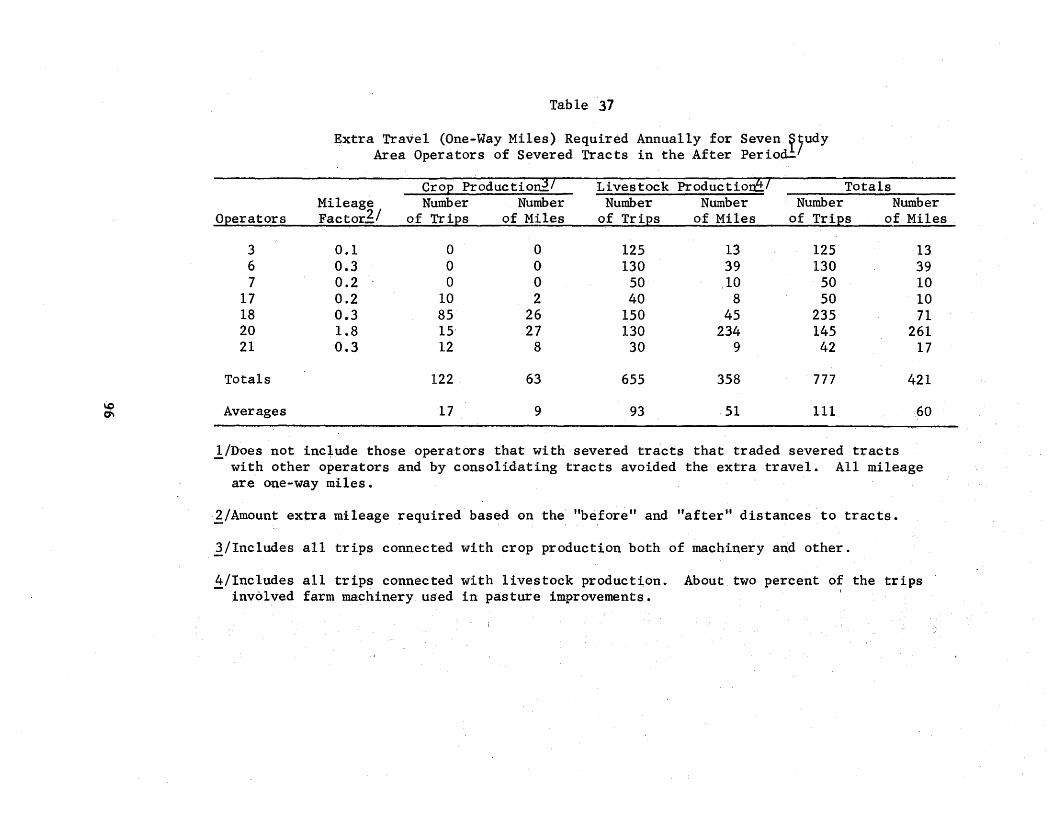
1.0
"'
Table 37
Extra Travel (One-Way Miles) Required Annually for Seven ~Judy Area Operators of Severed Tracts in the After Period!.
crop Produc tio~,--- -1Ives tock Procruc-tio1tU Totals Mileage Number Number Number Number Number
Operators Factor~/ of Trips of Miles of Trips of Miles of _':['rips
3 0.1 0 0 125 13 125 6 0.3 0 0 130 39 130 7 0.2 0 0 50 .10 50
17 0.2 10 2 40 8 50 18 0.3 85 26 150 45 235 20 1.8 15· 27 130 234 145 21 0.3 12 8 30 9 42
Totals 122 63 655 358 777
Averages 17 9 93 51 111
Number of Miles
13 39 10 10 71
261 17
421
60
_!/Does not include those operators that with severed tracts that traded severed tracts with other operators and by consolidating tracts avoided the extra travel. All mileage are one-way miles.
~/Amount extra mileage required based on the ''before" and "aftern distances to tracts.
1_/Includes all trips connected with crop production both of machinery and other.
4/Includes all trips connected with livestock production. About two percent of the trips - involved farm machinery used in pasture improvements.
Formost operators, crop production on the severed tracts was limited
to hay crops, which require a limited amount of machinery trips. However,
one operator, having the major part of his operation on the severed
tract, reported 85 trips a year connected with crop production, most of
the trips being with fat'II1 machinery. This was originally a single tract
operation. The original ·tract of 148 acres was severed by the highway
leaving the headquarters and 19 acres on one side and 107 acres acrosS
IHlO. However, the tract was located adjacent to a cross-over providing
good access to the large remainder, as the distance to the severed
tract in the after period increased by only 0.3 of a mile. In fact,
the tracts operated by six of the seven operators shown in Table 37
were located adjacent to a cross-over road. The other operator's tract
was located about two miles from the headquarters tract. The distance
was one mile to cross-over and another mile down a frontage roadto the
tract.
For the livestock operators, major portions of the trips to the
severed tracts were for the purpose of feeding and inspecting cattle.
However, operators reported that from five to ten trips a year were
made by farm machinery which was used in fertilizing, mowing and
spraying pastures.
The seven operators made a total of 655 trips or 358 one-way miles,
in managing their cattle operations in the severed tracts. The combined
totals were 421 one-way, or 842 round trip, m:Lles driven by the seven
operators in·maintaining operations on the severed tracts. This is an
average of approximately 120 miles of extra travel per year required
97
by the openators. However, about one-half of the total mileage was
accounted for by an operator who had to drive 1.8 extra one-way miles
to reach the severed portion of his tract.
Control Area Travel. Travel patterns of the 16 control area operators
having multiple tract operations are shpwn in Table 38. All but one
of the operators lived on headquarters tracts. Operator 17 lived in
Weimar and the mileage was recottded .from his home to his headquarters
tract and then to his extra tract.
Changes in travel distances were caused mainly by operators releasing
or adding tracts to their operations. Three operators with more than
one tract in 1964 had only one tract in !969. Another opeltator combined
tracts adjoining his headquarters into one unit. In 1969, the remaining
13 operators, including one that had no travel in 1964, had distances
ranging from 0.1 mile involving one tract to 25.9 miles required for an
operation with two extra tracts.
Control operators reported that they made from 5 to 30 trips a
year with farm machinery to a tract, depending on the degree of crop
production and pasture improvements on the tract. Generally, livestock
operations generate more trips, especially during the winter months
when trips are required to feed the cattle.
Based on the before and after travel patterns of Fhe study and
control area operators, it appears that on trips to the nearest shopping
centers the highway had no adverse effects on study area operators. In
fact, most operators reported they were pleased with the new highway.
98

Operator. Number
1 2 4 5 6 9
10 11 12 13 14 15!/ 16 17 18 19
Totals
Table 38
TJ:avel Dist~nces of 16 Control Area Operatbrs That Had Multiple Tract Operations in 1964 and 1969
Befo1;e Highway TJ:acts Travel is Required to Reach
·Number·
1 1 3 1 1 0 1 3 3 2 4 2 5 1 3 2
33
Distances ·.Traveled
·Miles
15.0 0.3 3.0 1.1 0.1 0 6.0 1.0
21.8 9.3 5.1 5.1 7.8 4.2 0.5 2 .• 8
83.1
Tracts Travel is Required to Reach
Number
0 1 4 2 1 2· 1 0 2 2 3 2 5 0 2 2.8
27
Distances· Traveled
Miles
0 .0.3 3.1 1.3_·
o~.l
11.5 6.0 0
25.9 9.3 5.1 5.1 7.8 0 0.4 2.8
78.7
·changes in
M,il~ag~s Miles .
-15.0 0
+ 0.1 + 0.2
0 +1i.S
0 - 1.0 + 4.1
0 0 0 o.
- 4.2 - 0.1
0
- 4.4
!/Operator lives in town. and five miles of his travel is from home tp headquarters tract.
99
Travel connected with agricultural operations was obviously chang~_d
some by the new highway. However, only seven of the 21 study area pperators
were required to travel extra distances, in operating their severed tracts,
and only one of those had any appreciabls increase in mileage. At the
same time, travel distances of control operators were subject to changes
in the number and location of tracts in their operations.
LAND SALES IN THE AREA
Land sales in the study area were scarce as were t::he facts about
the sales. In this area, unlike the Madison and Ellis County Study
Areas, no operators received benefits from the sales of fill dirt or
grass sod for use in construction of the highway.
There were three sales of right of way remainder tracts between
1964 and 1969. Two of the sales were tracts of about four acres each
and both were remainders that had been severed from larger parcels.
The other tract which sold was a 46 acre unitp.proved tract which was being
rented in 1964 but was owner-operated in 1966 and 1969. Access to the
tract is from a farm road, as there is no frontage road at its location.
The tract so~d in 1965 for $400 per.acre. The approved, appraised value
of the whole property at the time of taking was about $278 per acre. A
six-acre strip of land was acquired from the south side of the original
tract. However, the part taken had a permanent water supply from springs
which were destroyed by the highway.
The two small tracts, selling in 1965 and 1966, were located at the
intersection of IHIO and U.S. Highway 90. A nationally knOW!), traffic
100
serving resta\Jran~ with gasoline and sundries purchased one site loeated
dlt"ectly at the intersection and hSving access to bqth facilities. . . . -
Details of the transaction were not available. The other four acre
tract that sold was located one property from the intersection of
u.s. 90 and IHlO. The tract sold for about $450 per acre in 196.5,
about $123 lti.Ore pe~ acre than the $327 per acre approved value ofthe
whole p11operty in 1964. The property had been purchased as a rural
residential site but had been improved by the end of 1969.
In the 'control area, one 150 acre right: of way tract sold in 1967
for $450 per acre. About one ... half of the acreage was in improved grasses
· making it more desirable for livestock operation and adding to its value.
The operator bad purchased· the tract in 1957 for $220 per acre. During. ·
the 10 years of 6wnership the operator had cleared about 50 acres of
woodland. During. the first three years of the study, other tracts
in the control area sold. These tracts ranged in size from 100 to 500
acres and sold for an average of $175 to $250 per·acre.
Although it is believed that the new highway enhanced some locations
in the study area, the small number of land sales in the study and-control
areas and their lack of comparability do not allow inferences as to
overall ·land value effects.
101

APPENDIX
· . Suppl.:atnentary tables
102

Table 39
Size, Land Use and Arrangement of 22 Right of Way Tracts Oper,ted by 21 Operators Before and After -"the Location of Highway.!.
Operator Acres in ROW Tra7t Acres in Remainin~ Tracts
Number Before Takin~ Acres Acguired for ROW North of IH South of IH
Total Cro2land Pastureland Total Cro2land Pastureland Cro2land Pastureland Cro2land Pastureland
1 122 32 98 13 6 7 23 81 3 1
~I 163 62 99 5 0 5 62 94 0 0 136 17 118 25 7 18 10 45 0 108
4 116 45 66 8 0 8 0 0 45 58 5 53 17 35 6 0 6 17 29 0 0 6 101 0 100 19 0 19 0 28 0 53 7 42 0 41 19 0 19 0 9 0 12 8 170 41 127 17 "\ 0 17 0 0 41 110 9 100 27 71 26 12 14 0 0 15 57
10 160 49 109 14 5 9 0 0 44 100 11 175 40 135 27 0 27 40 100 0 s 13 144 60 84 14 3 11 57 61 0 10
...... 14 195 70 122 7 0 7 70 63 0 0 0 15 186 58 127 3 0 3 0 0 58 124 w
16 133 15 117 10 0 10 0 0 40 82 17 145 20 124 18 3 15 0 10 14 102 18 148 46 100 21 17 4 5 13 24 83 19 103 16 87 15 0 15 0 4 16 67 20A 79 45 34 7 7 0 0 0 38 34 20B 480 110 367 58 20 38 17 98 73 231 21 98 32 65 26 19 7 3 27 10 32 22 41 0 41 17 0 17 0 1 0 22
Totals 3,090 802 2,258 375 99 276 304 663 421 1,294
.!./Includes 18 operators furnishing complete operational data.all three years plus three operators (Nos. 6, 20 and 22) that furnished partial information.
!:/The small discrepancy in total ·is caused by land in buildings, roads, etc. }./operator was deeded an additional 52 acres on south side of highway by Operator 14.
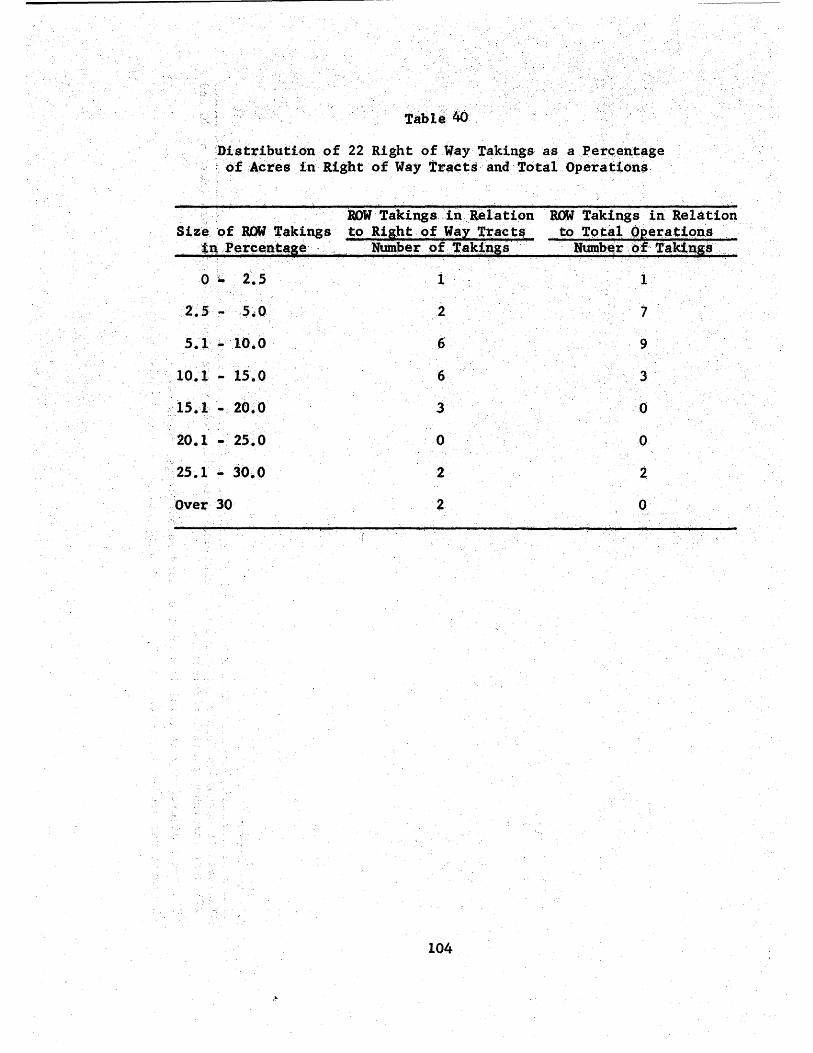
:.Distribution. of .. 22 Right of W:ay Takings as a Percentage of Acres in Right of Way tractsand.Total Operations
Size ·of ROW· Takings . t~ .P~r~~ntaae
0 - 2.5
2~5 .. 5.0
5.1 - 10.0
10.1 .. 15.0
15.1· - 20~0
'20.1 - 25.0
25.1 - 30.0
.Over 30
...
ROW.Takings.ill Relation ROW Takings ·in Relation to Risht.of Way Tract~ to .. Total ()eerations
N~ber of. 'laktl\g.s . . NtWtb~r: :of T$kl1lj$
1 1
2 7
6 9
6 3
3 0
0 0
2 2
2 0
104
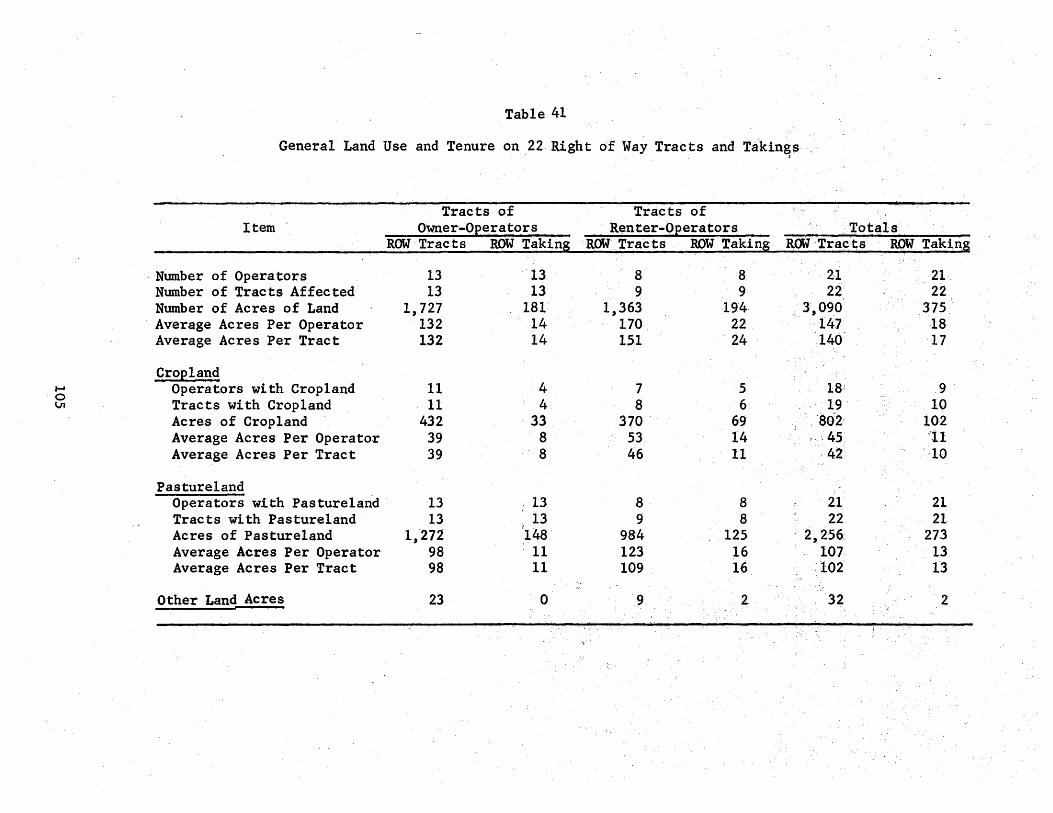
Table 41
General Land Use and Tenure on 22 Right of Way Tracts and Takin~s
Tracts of Tracts of Item Owner--Oeerators Renter-Oeerators .. Totals
ROW Tracts ROW Taking ROW Tracts ROW Takin~ ROW Tracts ROW TakinS
Number of Operators 13 13 8 8 21 .21 Number of Tracts Affected 13 13 9 9 22 22 Number of Acres of Land 1,727 181 1,363 194 3,090 375 Average Acres Per Operator 132 14 170 22 • 147 18 .Average Acres Per Tract 132 14 151 24 140' 17
Cropland 1-' Operators with Cropland 11 4 7 5 18~· .9 0 Tracts with Cropland 11 4 8 6 19. 10 VI
Acres of Cropland 432 33 370 69 '892· 102 Average Acres Per Operator 39 8 53 14 45 ll Average Acres Per Tract 39 8 46 11 '42 ···10
Pasture1and Operators with Pasture1and 13 13 8 8 21 21 Tracts with Pasture1and 13 13 9 8 22 21 Acres of Pasture1and 1,272
1
148 984 125 . 2, 256: 273 Average Acres Per Operator 98 11 123 16 107 13 Average Acres Per Tract 98 11 109 16 102 13
Other Land Acres 23 0 9 . 2. ' 32 2
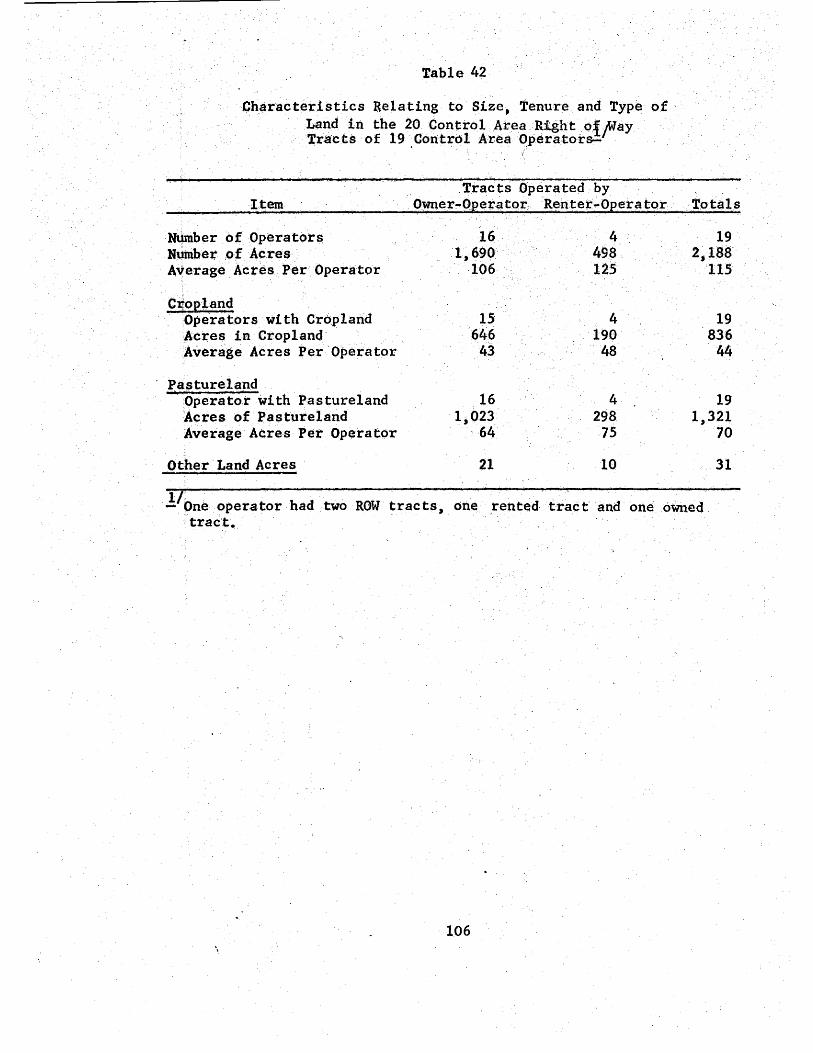
Table 42
Ch~racteristics Relating to Size, Tenure and Type of Land _in the 20 C()ntrol_ .l\:t'ea l{ight of.fiay ',:rracts of 19 _Control Area9perator&;.;;.
Tracts Operated by I.tem Owner-Opet'-~tor: R~nter-Opera tor ·_ __-1'otals
Ntimber of Operator~Numbet; .of Acres Average Acres PerOperator
C~opland Opera tors with Cro.plarid Acres in Cropland· Average Acres Per Operator
Pastureland · _Operato.r with Pastureland Acres of Pastureland Average AcresPer Operate>r
Other Land Acres
16 .1,690
106
15 646
43
16 1,023
64
21
4 19 498 2,188 125 '115
4 19 190 836
48 44
4 19' 298 1,321
75 70
10 31
l/One operator had two ROW tracts, one _rented tract" and one owned tract.
106

Table 43
Changes in Land Use of Right of Way Tracts of the · 18 Study Area and 19 Control Area Operators, 1964-69.!/
Studz Area Control Area Type of Land Acrea~e Percent Acrea~e Percent
1964 1969 Chanae 1964 1969. Cha~e
Cropland 647(18) 594(18) - 8.2 836(19) 975{19) + 16.6 Harvested 269{12) 159(10) - 40;.9 444(18) 303(15) - 31.8 Harvested and Grazed 118( 6). 112( 5) - 5.1 51( 4) 200( 6) +282. 0 Grazed 206( 6) 259{12) + 25.7 313(13) 457{14) + 46.0 Government Program 54( 3) 64( 4) + 18.5 .28( 3) 15( 2) - 46.'0
Pasture1and 1,715(18) 1,456(18) - 15~1 1,321(19) 1,389(19) + 5.1 ..... Improved 98{ 6) 436(15) +345.0 360( 6) 717(14) + 9·9.2 0
...... Cleared 1,255(18) 750(17) - 40~2 619(15) 407(12) - 34.2 Woodland 362(14) 270(12) - 25.4 342(12) 265{10) - 22.5
Other Land 27(16) '25(16) - 7.4 .31(17) 38(17) + 22.6
Total 2,389(18) 2,075(18)' - 13.1. 2,188(19) 2,402(19) + 9.8
1/ : - Number of operators in parentheses.