Ridership Trends 2016 Annual Report - metrarail.com › ... › board_meetings › 201702 ›...
19
Metra Board of Directors February 15, 2017 Presented by Lynnette H. Ciavarella Senior Division Director, Strategic Capital Planning Ridership Trends 2016 Annual Report
Transcript of Ridership Trends 2016 Annual Report - metrarail.com › ... › board_meetings › 201702 ›...
Metra Board of DirectorsFebruary 15, 2017
Presented by Lynnette H. CiavarellaSenior Division Director, Strategic Capital Planning
Ridership Trends 2016 Annual Report

Historic Ridership
2
86.883.4 81.6
80.4
4045505560657075808590
1983
1984
1985
1986
1987
1988
1989
1990
1991
1992
1993
1994
1995
1996
1997
1998
1999
2000
2001
2002
2003
2004
2005
2006
2007
2008
2009
2010
2011
2012
2013
2014
2015
2016
Pass
enge
r Trip
s (M
illio
ns)
Passenger Trips (1983-2016)

Ridership by Quarter
3
18
19
20
21
22
23
1st Q 2nd Q 3rd Q 4th Q
Pass
enge
r Trip
s (M
illio
ns)
Passenger Trips (Millions)
2013 2014 2015 2016

Ridership by Month
4
5.05.56.06.57.07.58.0
Jan Feb Mar Apr May Jun Jul Aug Sep Oct Nov Dec
Pass
enge
r Trip
s (M
illio
ns)
Passenger Trips by Month (2013-2016)
2013 2014 2015 2016

Ridership by Line
Line 2015 2016 Change
BNSF 16.40 16.33 -0.5%
MED 9.05 8.64 -4.6%
HC 0.72 0.72 -0.8%
MD-N 7.09 6.93 -2.3%
MD-W 6.77 6.62 -2.2%
NCS 1.76 1.73 -1.6%
RID 8.31 8.11 -2.3%
SWS 2.60 2.54 -2.5%
UP-N 9.25 9.22 -0.3%
UP-NW 11.30 11.18 -1.0%
UP-W 8.37 8.38 0.1%
Total 81.63 80.40 -1.5%
Passenger Trips (millions)
16.33
8.38
6.62
0.72
2.548.11 8.64
11.18
6.93
1.73 9.22
5 Note: Totals may not equal when added due to rounding.

Ridership by Line
6
02468
1012141618
Pass
enge
r Trip
s (M
illio
ns)
2012 2013 2014 2015 2016

Average Weekly Peak & Off-Peak2006, 2015, 2016
(Thousands)
Average Weekly Off-Peak
2006, 2015, 2016(Thousands)
7
Passenger Loads by Period
1,17
2
448
1,11
3
466
1,11
3
449
0
500
1,000
1,500
Peak Period/Peak Dir. Off-Peak2006 2015 2016
86 180
97 71 43105
162
90 67 42100
159
85 65 41
0
50
100
150
200
Reverse Midday Evening Saturday Sunday
2006 2015 2016

Ridership Influences - Cubs Victory Parade and Rally
8
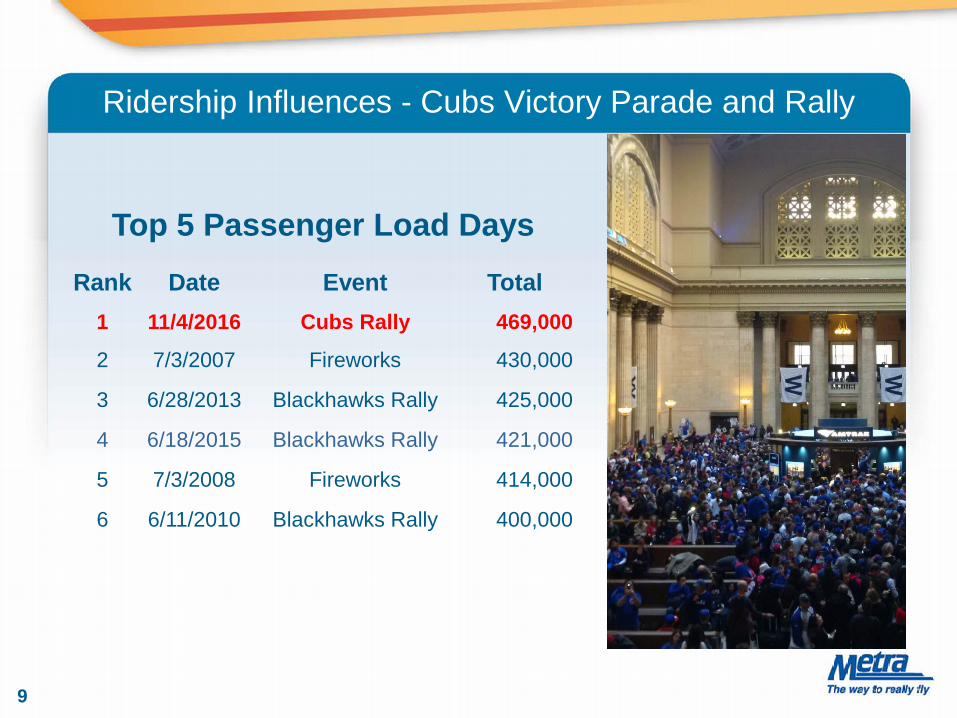
Ridership Influences - Cubs Victory Parade and Rally
9
Rank Date Event Total1 11/4/2016 Cubs Rally 469,000
2 7/3/2007 Fireworks 430,000
3 6/28/2013 Blackhawks Rally 425,000
4 6/18/2015 Blackhawks Rally 421,000
5 7/3/2008 Fireworks 414,000
6 6/11/2010 Blackhawks Rally 400,000
Top 5 Passenger Load Days

Ridership Influences – Regional Employment
10
3.03.23.43.63.84.04.24.4
Jan Feb Mar Apr May Jun Jul Aug Sep Oct Nov Dec
Pers
ons
Empl
oyed
(Mill
ions
)
Regional Employment by Month (2013-2016)
2013 2014 2015 2016

Ridership Influences - Gas Prices
Metra Average Fare 2016: $4.34
Metra Average Trip Length 2016: 22.37 miles
11
$0.00$0.50$1.00$1.50$2.00$2.50$3.00$3.50$4.00$4.50
Jan Feb Mar Apr May Jun Jul Aug Sep Oct Nov Dec
Average Price of Gas (2013-2016)
2013 2014 2015 2016
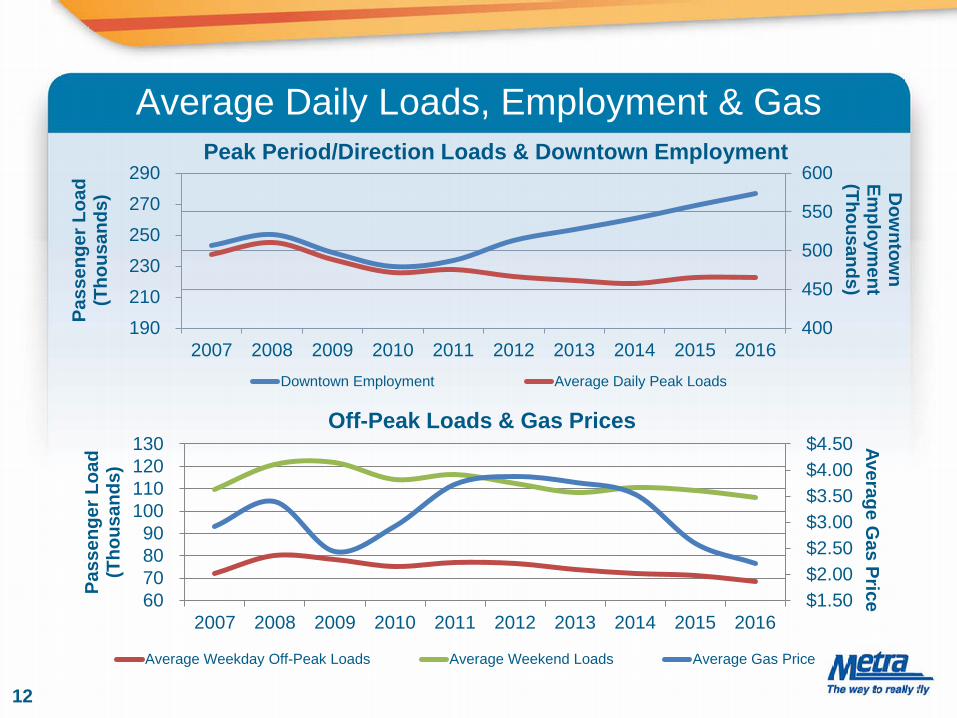
Average Daily Loads, Employment & Gas
1.1%
12
190 210 230 250 270 290
2007 2008 2009 2010 2011 2012 2013 2014 2015 2016400
450
500
550
600
Dow
ntown
Employm
ent (Thousands)
Pass
enge
r Loa
d (T
hous
ands
)
Peak Period/Direction Loads & Downtown Employment
Downtown Employment Average Daily Peak Loads
$1.50 $2.00 $2.50 $3.00 $3.50 $4.00 $4.50
60 70 80 90
100 110 120 130
2007 2008 2009 2010 2011 2012 2013 2014 2015 2016
Average Gas PricePa
ssen
ger L
oad
(Tho
usan
ds)
Off-Peak Loads & Gas Prices
Average Weekday Off-Peak Loads Average Weekend Loads Average Gas Price

Ridership Influences - Weather
13
0
5
10
15
20
25
30
35
40
45
50
January February November December
Tem
pera
ture
(Fah
renh
eit)
Snow
fall
(Inch
es)
2016 Winter Weather Compared to 45-year Average
Average Temperature (2016)45-year Average TemperatureSnowfall (2016)45-year Average Snowfall

Tickets Sold (Millions)Annual Ticket Sales – Types of Tickets
14
2014 2015 2016 14 vs. 15 15 vs. 16Monthly 1.24 1.18 1.13 -5.1% -3.9%Ten-ride 1.44 1.66 1.75 14.7% 5.8%One-way 10.87 9.71 9.46 -10.7% -2.6%Conductor 4.35 3.93 2.89 -9.6% -26.6%Station 6.51 5.68 4.40 -12.7% -22.5%Mobile 0.0 0.09 2.17 n/a 2,311.1%Weekend & Special Event 1.47 1.48 1.50 0.9% 0.8%Total 15.02 14.03 13.84 -6.6% -1.3%
0.5
1.0
1.5
2.0
2011 2012 2013 2014 2015 2016
Tick
et S
ales
(M
illio
ns)
Monthly and Ten-Ride Ticket Sales (2011-2016)
MonthlyTen-Ride
Note: Due to rounding values may not add up to total.

Ventra Mobile App - Adoption
15
Monthly
One-Way
Ten-Ride
Weekend
All Tickets
0%
5%
10%
15%
20%
25%
30%
35%
40%
45%
Nov2015
Dec2015
Jan2016
Feb2016
Mar2016
Apr2016
May2016
Jun2016
Jul2016
Aug2016
Sep2016
Oct2016
Nov2016
Dec2016
Percent of Total Tickets Sold on the Mobile App

Ventra Mobile App - Ticket Sales
16
0
10
20
30
40
50
60
70
Tota
l Tic
kets
Sol
d (T
hous
ands
)
Total Mobile Tickets Sold by Month (Nov 2015-Dec 2016)
Ventra Mobile App Milestones
17
• 3,500 new users per day in Fourth Quarter 2016• 80,400 average workday users in December 2016,
with a peak of 94,900 daily users on December 1
• The app has been downloaded 1,280,000 times as of December 31
• Mobile Ticketing• Gas Prices• Pace Park and Ride and Bus on Shoulder Programs• Parking Apps, Telecommuting, Car-Sharing• Regional Population & Demographic Changes• Regional and Downtown Employment
Influences to Watch During 2017
18