Tea cup amusement park rides for sale Sinorides amusement rides manufacturer
Upload
trinhkhuongCategory
view
213download
0
Coaster Quest THE PHYSICS AND MATH OF AMUSEMENT PARK RIDES
Algebra
Any opinions, findings, and conclusions or recommendations expressed in this material are those of the author(s) and do not necessarily reflect the views of the National Science Foundation.
© Copyrighted by Dr. Joseph S. Elias. This material is based upon work supported by the National Science Foundation under Grant No. 9986753.
KUTZTOWN UNIVERSITY OF PENNSYLVANIA

Dorney Park/Kutztown University Coaster Quest - Algebra
Introduction
Welcome to Coaster Quest!
This set of mathematics activities focuses on Algebra. We believe there is something for everyone as the collection represents a breadth of adventures. There are activities that address algebra topics for beginning students (Survival of the Fittest), for mid-level students (Dominator), and for more advanced students (Thunderhawk). Some activities require straightforward data collection and calculations (Waveswinger), while others require collaboration (White Water Landing - The Bridge) or interdisciplinary considerations (Create a Park). Several of the activities can be easily adapted for special needs students, some can be adapted for use as follow-up activities, and still others are appropriate for schools with intensive scheduling programs.
Each activity is preceded by an "Information Sheet" to help guide teachers in selecting appropriate activities for their particular group(s) of students. In addition to identifying objectives based on state and national mathematics standards, these pages provide a list of equipment needs and suggestions that may lead to the activity's successful completion. Teachers should feel welcome to adapt activities to the specific needs of their students. Teachers may request a “solution manual.” Contact Dr. Joseph S. Elias at [email protected]
Join us in May and challenge your students to experience algebra in action! Dr. Kathleen Dolgos Dr. Deborah Frantz Professor Emeritus Professor Emeritus Mathematics Department of Secondary Education Department of Mathematics/CIS College of Education College of Liberal Arts and Sciences Kutztown University Kutztown University
KUTZTOWN UNIVERSITY OF PENNSYLVANIA
Coaster Quest
Table of Contents
Acknowledgments Page i
Tips for Mathematics Teachers Page ii
Things to Bring/Dorney Park Information Page iii
Algebra Activities
Specific Rides:
The Antique Carrousel Page 1
The Dominator Page 7
The Enterprise Page 13
The Sea Dragon Page 17
Thunderhawk Page 23
The Waveswinger Page 26
White Water Landing – The Bridge Page 29
White Water Landing – The Ride Page 33 Whole Park:
Create a Park! Page 37
Entertainment Values Page 39
A Group of Friends at Dorney Page 55 Geometry Activities (Separate manual)
KUTZTOWN UNIVERSITY OF PENNSYLVANIA
Coaster Quest
Dorney Park/Kutztown University
Acknowledgments
During the winter of 1997, area teachers of physics and mathematics, professionals from Dorney Park, and faculty from Kutztown University gave birth to Coaster Quest: The Physics and Mathematics of Thrill Rides. In May 1999, the Coaster Quest - Physics Planning Committee presented physics activities in the form of (Coaster Quest) Coaster Quest
The Coaster Quest - Mathematics Planning Committee was established in the fall
of 1999. The Committee began by creating algebra activities that would help teachers achieve goals set forth by the state and national “Mathematics Standards.” As a result, the mathematics component of Coaster Quest consisted of algebra activities that were introduced in May 2001. Geometry activities have been developed and have been a part of the mathematics component since May 2002.
Coaster Quest is the culmination of effort and time of many people. Its existence would not have been possible without the collaborative efforts of: the professional staff at Dorney Park and Wildwater Kingdom; the administrators and academic faculty at Kutztown University; teachers who had taken students to the Park and provided feedback; and (most importantly) members of the planning committees. Each planning committee consists primarily of area high school teachers of physics or mathematics. The leadership and creativity of these teachers resulted in impressive sets of activities. Members of all planning committees have worn out shoes in the Park, endured days of inclement weather, fretted over success (or failure) of their students to complete preliminary versions of activities while in the "piloting" stages, spent many hours in meetings, and countless hours designing and editing the activities. In short, we admire and appreciate the efforts of all who have contributed to the success of the Coaster Quest project.
Algebra Planning Committee Mr. Ray Cianni Upper Perkiomen High School Dr. Kathleen Dolgos Kutztown University Dr. Joseph Elias Kutztown University Mr. Gerry Farnsworth Parkland High School Dr. Deborah Frantz Kutztown University Mr. Keith Koepke Dorney Park and Wildwater Kingdom Ms. Laura Leiby Emmaus High School Mrs. Kim Reiter Emmaus High School Mrs. Brenda Snyder Kutztown University Mrs. Beth Stoudt Emmaus High School Mrs. Michelle Wiley Dieruff High School Ms. Maggie Woodward Upper Perkiomen High School
KUTZTOWN UNIVERSITY OF PENNSYLVANIA i

Coaster Quest
Tips for Mathematics Teachers Think of this as an adventure! To help make a "stress-free" day at the Park, we have created this list of suggestions to guide you through your planning stage of Coaster Quest • Above and beyond all else, bring your sense of humor. Experienced teachers know that there will
be mistakes. Allow students to have fun as well as complete your selection of activities. • While mathematics is an "exact" discipline, applications of mathematics are much "less exact."
ALL measurements and collected data will have inherent errors. Accept it. • Please do not forget copies of activity sheets, equipment and supplies. You might also consider
bringing a camcorder to record aspects of the rides for use in the classroom after Coaster Quest, or to use as introductory preparation for next year.
• If your comfort level is low with orchestrating lab-type activities, consider consulting a science
teacher for assistance with logistics. • Carefully peruse the complete list of activities and select those that will best fit the needs and
abilities of your students. (That is, do not expect your students to complete all of these activities!) The difficulty levels are quite varied among the activities. Consider doing parts (but not all) of some activities. You may modify them, or assign groups of students to them.
• Some activities take longer than others to complete. Keep in mind that it may be necessary to
observe, ride, or take measurements several times in order to obtain good data. • As much as is feasible, introduce the students to the concepts to be studied during the weeks
leading up to the event. Consider planning time in class for calculations and analysis during the days following the experience.
• In our opinion, students who may be fearful of some rides should not be forced to ride. • Kutztown University students will serve as general assistants for you. They will be stationed at
designated Coaster Quest rides from approximately 10:00 A.M. to 2:00 P.M. Inform your students that they may ask the university students questions related to the activities. University students will help students discover the "answers," but will not give them answers. Instruct your students NOT to ask Dorney Park employees to give answers.
• Teachers are welcome to utilize a designated grove at Dorney Park to chat with other teachers
and members of the planning committees, or to use as a place for your students to work. Please do not leave equipment and other valuables unattended at the grove.
KUTZTOWN UNIVERSITY OF PENNSYLVANIA ii

Coaster Quest
Things to Bring
We present this list for your convenience and hope that it helps make your day at the Park enjoyable as well as productive. You may wish to bring some or all of these items with you to Coaster Quest.
• tickets for you, your students and your chaperones • copies of your selection of activities, enough for your group • pencils and paper • stopwatches • calculators (depends on activities: basic, basic with tangent key, or graphing) • camcorder • clipboards • inclinometers or protractors with a plumb bob • appropriate clothing and perhaps a change of clothing • sunscreen, hats, raincoats • money for food, drinks, phone • measuring tape or string • masking tape • backpacks or plastic bags to keep papers and equipment dry and together • maps of the Park (can be picked up at the entrance to the Park) • a good reserve of energy and enthusiasm for exploration
Dorney Park Information
General Information: (800) 551-5656 or (610) 395-3724 Group Sales Information: (610) 395-2000 For specific questions about ticket sales for Coaster Quest, call Matt Stoltzfus at (610) 391-7607 or e-mail him at [email protected] Visit our websites: Dorney Park Coaster Quest
KUTZTOWN UNIVERSITY OF PENNSYLVANIA iii

Coaster Quest Algebra
KUTZTOWN UNIVERSITY OF PENNSYLVANIA

Antique Carrousel
Information Sheet topics: radius and circumference of a circle
average distance average velocity
use of formulas ( C = 2πr, , etc.)
use conversion formulas ( meters to feet, meters per second to miles per hour ) objectives: to use formulas to calculate the average linear velocities of different rows of the carrousel equipment : activity sheets pencil basic calculator stopwatch notes for the teacher: Activities that are marked "optional" are not "harder" than those not so
designated. These are optional because of the amount of time that students would need to complete the entire set of activities for this ride.
The Antique Carrousel takes about 1 revolution to get to full speed, which is
relatively constant. It begins slowing by the end of the fourth revolution. Timing of 3 revolutions should take place between the first and fourth revolutions.
v =dt
KUTZTOWN UNIVERSITY OF PENNSYLVANIA
1

Antique Carrousel
Notice that there are two carousels at Dorney Park. The Chance Carousel has 3 rows of "seats" and the Antique Carrousel has 4 rows. Be sure that you are working with the Antique Carrousel. PART 1: The Antique Carrousel is a "circular" ride at Dorney Park. Because of its historical significance, it is a most treasured ride as well. Here are several algebra connections to the Antique Carrousel. There are four rows of "seats" that comprise the Antique Carrousel, each of which revolve around a fixed point (its center, C). While it revolves, the seats on three of the rows also make a vertical movement, while the seats on the row on the outside remain vertically stationary. In order to reach our goals of this activity, we will ignore the vertical movement of the seats.
1. To find the distance that you travel (in meters) in one revolution on a given row, use the formula for the circumference of a circle, C = 2πr. (Use π = 3.14.) The radius of Row 1 is R1 = 5.8 meters. The radius of Row 3 is R3 = 7.3 meters. d1 = distance traveled on one revolution in Row 1 = m. d3 = distance traveled on one revolution in Row 3 = m. 2. (Remember that this activity is ignoring vertical motion.) In your opinion, does Row 1 or Row 3 have the higher speed? Why? Ride the Antique Carrousel at least twice. One time, sit on the inside row of horses (Row
1) and the other time that you ride, sit on a seat in Row 3. As you ride, try to feel the difference in speeds between the two rows. Why can't you feel the difference in speeds as you ride?
R4, stationary row
R1
R2
R3 Antique Carrousel
C
KUTZTOWN UNIVERSITY OF PENNSYLVANIA
2

Antique Carrousel
The average linear velocity (the measure that tells you about how fast you are moving) can be computed by dividing the distance that you travel by the time it takes to travel that distance. In
formula form, this is: , where v is the linear velocity, d is the distance traveled, and t is the
time that it takes to travel that distance. In practice, it is sometimes difficult to measure time accurately. Since
one "reasonable way" to estimate the linear velocity is to find .
3. Find 3d: three times the distance traveled will be 3 times the circumference of the specified row. Use the results from #1 (d=2πr) and compute the distances traveled for 3 revolutions. Record your work in the table below. 4. Find 3t: use a stopwatch and measure the time (in seconds, rounded to the nearest
hundredth of a second) it takes for 3 revolutions of one seat (in each of the specified rows). (Do this at least twice and obtain an average time for the three revolutions.) Record your average times for the three revolutions in the table below.
You should begin timing AFTER the carousel has made one revolution and continue to
time for three consecutive revolutions.
3d meters 3t sec. m/sec.
Row 1
Row 3
Complete the table by computing the velocities. 5. Compare your "feelings" from #2 with the results in the last column in the table above.
Do your results make sense? (That is, comment on the difference in speeds that you calculated with the difference in speeds you felt in #2.)
v =dt
dt
= 1 ×dt
=33
×dt
=3d3t
v =3d3t
3t3dv =
KUTZTOWN UNIVERSITY OF PENNSYLVANIA
3

Antique Carrousel
6. On the axes provided, plot the ordered pair (3t, 3d) for Row 1 and label it. Draw a line through it and the origin. Label the line, R1. Repeat these steps for Row 3 on the same set of axes and label this line R3. 7. (optional) Using your graphs, find the slopes of the lines. slope of the line R1 = slope of the line R3 = 8. (optional) Describe the relationship between the slope of the line for R1 and the average velocity for Row 1. What is the relationship between the slope of the line for R3 and the average velocity for Row 3? 9. (optional) a. Based on your results for the computed values of average velocity and on your
graphs, guess the average velocity of a person seated in Row 2.
b. Compute for a person who rides in Row 2.
(The radius of Row 2 is 6.6 meters. Why do you NOT need to measure 3t again?) c. Is your answer in #9b reasonable? Support your claim.
v =3d3t
KUTZTOWN UNIVERSITY OF PENNSYLVANIA
4

Antique Carrousel
PART 2: 1. Suppose that x represents the number of meters and y represents the number of feet. Then x = .3048y. Solve this equation for y. 2. The radii of Rows 1 and 3 are given in the table below (in meters).
Radii of two rows on Antique Carrousel radius (in meters) radius (in feet) Row 1 5.8 meters
Row 3 7.3 meters
Use your calculator and the conversion formula y = 3.281x to complete the table for the measure of each radii in feet . Record your answers on the table. 3. If you have not already done so, complete PART 1, #4 of this activity. (Compute the average velocities for riders in Row 1 and Row 3, where the unit measure is meters per second.) Use the conversion formula 1 m/sec. = 2.237 mph. to convert your answers so that the
unit measure for these velocities are in miles per hour. Record your answers in the table.
velocity (in m/sec.) velocity (in mph.) (see PART 1, #4)
Row 1
Row 3
4. Are the speeds on the carrousel similar to the speed of a person walking, a person
running, a person bike riding, or a person driving a car in town?
KUTZTOWN UNIVERSITY OF PENNSYLVANIA
5

Antique Carrousel
5. (optional) Recall that 1 mile = 5, 280 feet and that a rider travels a linear distance of 2πr on one revolution of the ride. a. How many revolutions must you ride in Row 1 to have ridden one mile? b. How many revolutions must you ride in Row 3 to have ridden one mile? c. What is the least number of revolutions that one must ride in Row 1 in order
to exceed the distance traveled by someone who rides in Row 3 for one revolution?
d. How long would the ride need to be in continuous operation for you to be able
to ride on Row 3 and travel one mile?
KUTZTOWN UNIVERSITY OF PENNSYLVANIA
6

Dominator
Information Sheet
topics: estimation speed functions conversions – Dimensional Analysis objectives: to estimate the height being “space shot” to estimate the height being “turbo dropped” to calculate average speed to calculate the initial thrust of being "space shot" equipment: activity sheets calculator pencil stopwatch notes for the teacher: Observe this ride a few times to get a sense of when the rider will be thrust
upward or dropped.
KUTZTOWN UNIVERSITY OF PENNSYLVANIA
7
Dominator
PART 1: Going Down!
Stand at a location that allows you to completely see the GREEN side of Dominator. 1. Using the given measurements for the supports, estimate the height from which the
riders’ seat is dropped. Also, estimate the height at which the end of free-fall occurs. Estimated drop height = feet
Estimated end of free-fall height = feet Total distance traveled by rider = drop height minus end of free fall height = _____ feet.
2. Measure the amount of time that it takes the rider to travel from the start of the initial
drop until the end of the free-fall. You must be careful to start the stopwatch as soon as you see the riders dropping (watch for movement in the legs). Take three measurements and average the three measurements. Record your findings here.
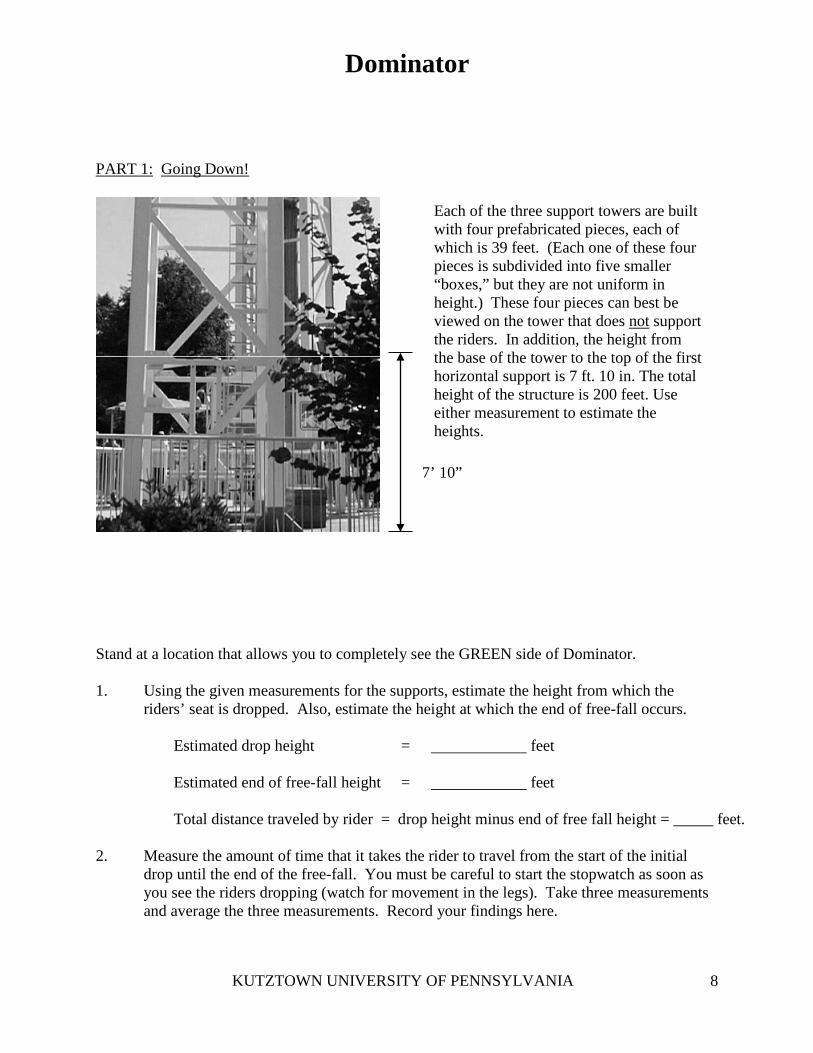
Each of the three support towers are built with four prefabricated pieces, each of which is 39 feet. (Each one of these four pieces is subdivided into five smaller “boxes,” but they are not uniform in height.) These four pieces can best be viewed on the tower that does not support the riders. In addition, the height from the base of the tower to the top of the first horizontal support is 7 ft. 10 in. The total height of the structure is 200 feet. Use either measurement to estimate the heights.
7’ 10”
KUTZTOWN UNIVERSITY OF PENNSYLVANIA
8

Dominator
Measured Time #1 = sec.
Measured Time #2 = sec. Measured Time #3 = sec.
Total of the three timed measurements = sec. Divide the total by 3 to get the average time that it takes to reach the end of free-fall. Average time = (total of 3 timed measurements) / 3 = sec. Use the formula (distance) = (average speed)(average time) and the information that you
found above to solve for the average speed. Average speed = feet/sec. 3. Use the fact that there are 5,280 feet in one mile and 3,600 seconds in one hour to convert
your average speed to miles per hour (mph). ft. × mi. × sec. sec. ft. hr. Average speed = mph. 4. What do you think accounts for the different times of the initial drop? 5. Describe the process that you used to estimate the drop height. What would you do to
make the measuring process easier?
KUTZTOWN UNIVERSITY OF PENNSYLVANIA
9
Dominator
PART 2: Going Up! Stand at a location that allows you to completely see the RED side of Dominator. 1. Using the given measurements for the supports (from PART 1), estimate the height above
the ground from which the riders’ seat is thrust upward. Also, estimate the height at which the maximum height occurs.
Estimated starting height = feet Estimated maximum height = feet
Total distance traveled by rider = maximum height minus starting height = _____ feet. 2. Measure the amount of time that it takes the rider to travel to the maximum height. You
must be careful to start the stopwatch as soon as you see the riders being launched upward. Take three measurements and average the three measurements. Record your findings here.
Measured Time #1 = sec. Measured Time #2 = sec. Measured Time #3 = sec. Total of the three timed measurements = sec. Divide the total by 3 to get the average time that it takes to reach the end of free-fall. Average time = (total of 3 timed measurements) / 3 = sec. 3. One mathematical model for the motion of the rider on Dominator is modeled by the
equation:
where s(t) is the height of the rider at t seconds, a is the force of acceleration due to gravity, v0 is the initial velocity (the initial "thrust" upward), and s0 is the height before being thrust upward. Our goal is to find v0 (the initial “thrust”) by substituting values for s(t), a, t, and s0.
20 0
1( )2
s t at v t s= + +
KUTZTOWN UNIVERSITY OF PENNSYLVANIA
10

Dominator
From PART 2, #1 the height of the rider, just before the rider is launched upward is s0 = _____ ft. The force of acceleration due to gravity is a = -32 ft/sec2 In PART 2, #2 you estimated the time that it takes to reach the maximum height. Use the time from #2 as your t and use the estimated maximum height from #1 as your s(t). t = sec. s(t) = feet
4. Substitute the values from #3 into the mathematical model
5. Solve the equation in #4 for v0.
The initial “thrust” or speed is the absolute value of v0. Initial speed = v0 = ___________ feet/sec. 6. Use the fact that there are 5,280 feet in one mile and 3,600 seconds in one hour to convert
your average speed to miles per hour (mph). ft × mi × sec sec ft hr Initial speed = mph.
20 0
1( )2
s t at v t s= + +
KUTZTOWN UNIVERSITY OF PENNSYLVANIA
11
Dominator
7. How does your answer compare to the advertised upward blast of nearly 50 mph? 8. If your answer seems too high or too low, where could some sources of error lie? 9. (optional) Use information from PART 2, #3 and #5 to write a function formula for the
height of the rider at any time. (That is, substitute a, v0 and s0 into the mathematical model given in #3.)
KUTZTOWN UNIVERSITY OF PENNSYLVANIA
12

Enterprise
Information Sheet topics: circumference speed objectives: to determine the distance that an Enterprise car travels in one revolution to determine the Enterprise's average speed equipment: activity sheets pencil and calculator stopwatch notes for the teacher: While at rest, the dot placed on the bottom of one car is not visible.
KUTZTOWN UNIVERSITY OF PENNSYLVANIA
13

Enterprise
PART 1: When objects are traveling in straight lines, their speeds can be measured by simply dividing the time it takes them to travel a certain distance. However, this ride does not travel a linear path; it travels in a circle. The linear speed of this ride can be measured by timing each revolution, but the distance around the circle, the circumference, must be determined. 1. Using a stopwatch, find the time for the Enterprise to make two complete
revolutions. One of the cars of the Enterprise has a Coaster Quest “dot” on it. Watch for the dot to pass you two times to be sure that two revolutions have occurred. Take this measurement three times, and use the average of the three trials.
Trial 1: Time for two revolutions = _______ sec. Trial 2: Time for two revolutions = _______ sec. Trial 3: Time for two revolutions = _______ sec. Average time for two revolutions = _______ sec. 2. Divide the average time by two, resulting in the average time for one revolution:
Average time for one revolution = _______ sec. 3. The radius of this ride is 9 meters. What is the length of the circumference of the circle through which this ride
travels? Circumference = _______ m.
twons revolutiome for twoAverage tin = revolutiome for oneAverage ti
Circumference = 2πr
KUTZTOWN UNIVERSITY OF PENNSYLVANIA
14

Enterprise
4. In order to determine the average speed of this ride, the distance must be divided by the time for one revolution.
Average time for one revolution = _______ sec.
Average speed = _______ m/sec. 5. (Extension) What is the average speed if measured in miles per hour? Recall that 1 mile = 5,280 feet and 1 hour = 3,600 seconds.
Average speed =circumference
time
KUTZTOWN UNIVERSITY OF PENNSYLVANIA
15

Enterprise
PART 2 In the first part of this activity, the linear speed of this ride was determined. Here, the average angular speed will be computed. 1. In PART 1, #2, the average time for one revolution was determined. The average angular
speed can be determined by dividing sixty seconds by the average time for one revolution, resulting in the number of revolutions per minute.
Average time for 1 revolution = _______ sec.
Average angular speed = _______ rev/min.
Average angular speed = sixty seconds
Average time for one revolution
KUTZTOWN UNIVERSITY OF PENNSYLVANIA
16

The Sea Dragon
Information Sheet
topics: circumference speed objectives: to determine the fraction of a circle through which the Sea Dragon swings to determine the Sea Dragon's average speed to plot the Sea Dragon's motion using distance, speed, and time equipment: activity sheets pencil and calculator stopwatch notes for the teacher:
The number of riders impacts the “fullness” of the ride’s swing.
Please note that the “swing” that is timed in this activity for the answer key is when the Sea Dragon passenger compartment supports align with the stationary support bars (as shown below). However, the students are asked to explain how they timed the swing for their trials.
support support support support
passenger compartment
KUTZTOWN UNIVERSITY OF PENNSYLVANIA
17

The Sea Dragon
PART 1: The Sea Dragon's motion resembles that of a pendulum (like a Grandfather clock). It swings a certain distance each time, sweeping out a portion of a circle. If we time several swings, we can determine the average time for the Sea Dragon to complete one swing. Stand by the exit side of the ride so that the Sea Dragon’s motion resembles a portion of a circle. 1. Using a stopwatch, time two complete swings of the ride (when the ride has
reached its highest swing). The time for each swing should include the “to-and-fro” movement of the ride. Take this measurement three times, and use the average of the three trials.
Explain how you will time each “swing” of this ride. Trial 1: Time for two swings = _______ sec. Number of riders = _______ Trial 2: Time for two swings = _______ sec. Number of riders = _______ Trial 3: Time for two swings = _______ sec. Number of riders = _______ Average time = _______ sec. 2. Divide the average time by two, resulting in the measured average time for one swing:
Measured average time for one swing = _______ sec.
Measured average time for one swing = Average time for two swings
two
KUTZTOWN UNIVERSITY OF PENNSYLVANIA
18

The Sea Dragon
3. The formula for computing the theoretical time for one pendulum swing is shown below. In the equation, "l" is the pendulum length (10.7 meters) and g is the acceleration due to gravity (9.8 m/s2). Find the theoretical time for one swing.
Theoretical time for one swing = _______ sec. 4. Compare the times found using your results from #2 (measured average time for
one swing) and #3 (theoretical average time for one swing). What is the percent difference?
% difference = _______ % Why is there a difference between the measured and theoretical values?
T = 2πlg
% difference = #3 result - #2 result
#3 result
% difference =
KUTZTOWN UNIVERSITY OF PENNSYLVANIA
19

The Sea Dragon
5. Estimate the angle (in degrees) through which the Sea Dragon swings. We can
now determine the fraction of a circle through which the Sea Dragon moves.
Fraction of a circle = _______
6. If the Sea Dragon actually traveled a full circle, we would compute the distance
traveled using the circumference formula. Compute the distance as if it traveled the entire circle. The circle’s radius from the top of the pendulum to the bottom of the Sea Dragon passenger compartment is 10.7 meters.
Circumference = _______ m. 7. Now we can determine the arc length (in meters) through which the Sea Dragon
travels. We must multiply the fraction of a circle through which the ride travels (that we computed in #5) with the circumference (that we found in #6).
Arc length = (Circumference)(Fraction of a circle) Arc length = _______ m.
Fraction of a circle = arc length (in degrees)
360o
Circumference = 2πr
KUTZTOWN UNIVERSITY OF PENNSYLVANIA
20

The Sea Dragon
8. In #7, we calculated the distance that the Sea Dragon travels during each swing
(arc length). We also computed the time for one swing in #1. Using these numbers, we can compute the average linear speed.
Average speed = _______ m/sec. 9. (Extension) What is the average linear speed of the Sea Dragon if measured in
miles per hour? Recall that 1 mile = 5,280 feet and 1 hour = 3,600 seconds. 10. (Extension) What would happen to the period of the pendulum if the length from
the top of the ride to the bottom of the passenger compartment were increased?
Average speed = arc length
time
KUTZTOWN UNIVERSITY OF PENNSYLVANIA
21

The Sea Dragon
PART 2 This part of the activity focuses on analyzing the motion at different points during the ride. It uses the time that was computed in PART 1, #2. 1. When you observe the ride, it travels along a path that resembles part of a circle.
Sketch the shape of the Sea Dragon's motion in the space below: 2. On the sketch in #1, mark where the riders are moving fastest by writing "fastest"
at that point(s). Mark where the riders are moving slowest by writing "slowest" at that point(s).
3. Using your sketch and the information from #2, sketch a graph of speed (on the y-
axis) and time (on the x-axis) below. Do not try to match the exact speeds with the exact times; focus on the fastest and slowest motion. The shape of the graph is the important part of this exercise.
Only plot one swing from left to right. (Remember to stand by the exit side of the
ride so that the Sea Dragon’s motion resembles a portion of a circle.) Begin your graph at one of the two highest points. (Hint: Use the following questions to guide your graph: At the highest point of the swing, the Sea Dragon stops for an instant before changing direction to begin another swing. What happens as the Sea Dragon approaches the center? What happens as the Sea Dragon rises to the maximum height on the other side?)
Speed (m/sec.) What shape is the graph?
Time (sec.)
KUTZTOWN UNIVERSITY OF PENNSYLVANIA
22

Thunderhawk
Information Sheet
topics: coordinate system plotting points and graphing in the coordinate plane linear equations line of best fit quadratic and cubic regression objectives: to develop a coordinate system for plotting points to compare linear, quadratic, and cubic equations to estimate the height of the peak of the first hill to estimate the cost for building the first hill ride: Thunderhawk equipment : activity sheets pencil graphing calculator (TI-83 or similar) notes for the teacher: Creating a scatter plot and line of best fit on the calculator could be done in
the classroom after visiting the Park. Comparisons with actual dimensions could also be done in the classroom. The teacher can find the current costs of lumber from local lumberyards or home improvement stores prior to the activity.
KUTZTOWN UNIVERSITY OF PENNSYLVANIA
23

Thunderhawk
Thunderhawk is the original wooden roller coaster for Dorney Park. Built in 1923 by the Philadelphia Toboggan Company, it has provided years of thrills to park goers. Suppose you are visiting Dorney Park as an interested investor for a new theme park to be developed. You want to have a "Thunderhawk" type coaster built in your new park. For design input, you need a sketch of the roller coaster. PART 1: 1. Create a coordinate system based on the structural supports of the coaster as shown on the photo
below. One unit can be determined from evenly spaced supports nearer the ground. Use estimations as the spacing of supports vary closer to the track. (Look for the large red dot on the support post to indicate the origin.)
2. Determine the coordinates of five site points between B and C on the track of the first hill. Write
your ordered pairs here. (Note: Coordinates may not be whole numbers.) 3. Enter your data into a graphing calculator and create a scatter plot. 4. Using the line of best fit, write a linear equation for the incline of the first hill.
B
C
Red Dot
A
KUTZTOWN UNIVERSITY OF PENNSYLVANIA
24

Thunderhawk
PART 2: (Use the coordinate system that you created in PART 1, #1.) 1. Determine the coordinates of five site points between A and C on the track of the first hill.
Write your ordered pairs here. 2. Enter your data into a graphing calculator and create a scatter plot. 3. Find quadratic regression and cubic regression equations for the first hill. quadratic regression equation: cubic regression equation: 4. Which of the models is the "best?" Why? 5. Is there an x-value that will yield a y-value greater than 70 feet in your quadratic model? in your cubic model? PART 3: (Follow-up questions) 1. Based on your coordinate system that was created in PART 1, estimate the height (above the
ground) of the peak of the first hill. 2. Given the actual dimensions from your teacher, how close was your estimation of the height of
the peak? Justify why there might be a difference. 3. Given current lumber costs, what would the cost be to replace the first hill (and its support
structure) that is made of pressure-treated southern pine?
KUTZTOWN UNIVERSITY OF PENNSYLVANIA
25

Waveswinger
Information Sheet
topics: circumference speed objectives: to determine the circumference of the circle through which the Waveswinger
revolves to determine the Waveswinger's average speed equipment: activity sheets pencil and calculator stopwatch notes for the teacher:
When choosing a person to sight in timing the revolutions, a person on the outer ring of swings can be more easily observed.
KUTZTOWN UNIVERSITY OF PENNSYLVANIA
26

Waveswinger
When objects are traveling in straight lines, their speeds can be measured by simply dividing distance by time. However, this ride does not travel a linear path; it travels in a circle. The linear speed of this ride can be measured by timing each revolution, but the distance around the circle, the circumference, must be determined. 1. Using a stopwatch, measure the time for the Waveswinger to make three complete
revolutions when the ride has reached its maximum speed. If you listen to the motor that turns this ride, you should notice that the sound becomes constant when the ride has reached this speed. Measure the time for three complete revolutions three separate times.
Trial 1: Time for three revolutions = _______ sec. Trial 2: Time for three revolutions = _______ sec. Trial 3: Time for three revolutions = _______ sec. Average time for three revolutions = _______ sec. 2. Divide the average time by three, resulting in the average time for one revolution:
Average time for one revolution = _______ sec. 3. The radius of this ride is 9 meters. What is the length of the circumference of the circle through which this ride travels? Circumference = _______ m.
threeutionshree revolTime for tn = revolutiome for oneAverage ti
Circumference = 2πr
KUTZTOWN UNIVERSITY OF PENNSYLVANIA
27

Waveswinger
4. In order to determine the average linear speed of this ride, the distance must be divided by the time for one revolution.
Time for one revolution = _______ sec.
Average speed = _______ m/sec. 5. (Extension) What is the average speed if measured in miles per hour? Recall that 1 mile = 5,280 feet and 1 hour = 3,600 seconds.
Average speed =circumference
time
KUTZTOWN UNIVERSITY OF PENNSYLVANIA
28

White Water Landing – The Bridge
Information Sheet
topics: similar triangles right triangles ratios estimation using paces objectives: estimate the length of the center section of the bridge at White Water Landing appreciate the application of similar triangles equipment : activity sheets pencil basic calculator (optional) notes for the teacher: Students may need guidance on how to measure a pace. Please be reminded that all measurements will be approximations.
You may want to assign #6 and #7 as optional for the students, since access to the bridge is only permitted after riding this ride.
KUTZTOWN UNIVERSITY OF PENNSYLVANIA
29

White Water Landing – The Bridge
The goal of this activity is to estimate the length of the center section of the bridge at White Water Landing by using a special relationship between two triangles. The length of the center section of the bridge is the distance between Points A and C as depicted in the diagram below:
1. In this diagram, the measures of angle B and angle E are 90˚. (Each is a right angle.) a. Angle BXC and angle EXD are equal in measure since they are angles. (We write m BXC = m EXD.) b. Explain why XDE and XCB are equal in measure. c. Since their corresponding angles are equal, triangle BXC and triangle EXD are called triangles. (We write ∆BXC ~ ∆EXD.) For this activity, you will use the fact that the corresponding sides of these triangles are
proportional. That is, the proportion, holds true.
In particular, HALF of the length of the center section of the bridge
In the end, to estimate the length of the center section of the bridge, we will need to double BC.
D
Center Section of Bridge
(lamppost along fence)
C
X
BA(sign)
E
∠ ∠
∠ ∠
BCDE
=BXXE
DE.XEBXBC and BC ×=≈
KUTZTOWN UNIVERSITY OF PENNSYLVANIA
30

White Water Landing – The Bridge
Please read this and be sure you understand it before you start. You will need to work in teams of at least three people. None of the points A, B, C, D, E or X are marked for you! 2. Using a normal walking stride, one person in your group will need to measure, using paces, each of the lengths XE and DE. (This is #3 below.) Before you go any further, estimate (to the nearest half of a foot) the length of one pace. 1 pace feet. Be sure to "agree" as to how one pace is being measured:
tip-of-toe to tip-of-toe? tip-of-toe to heal-of-foot? arch to arch? Establishing the triangles: The points A and C are hypothetically located at the endpoints of the center section of the bridge. Agree among yourselves, in advance, just where these points are located. Point X is a point along the fence, nearest to the lamppost. (This point aligns with the center of the sign on the bridge and the slide of the ride.) From point X and facing away from the lamppost, locate the manhole covers that are on the ground. Walk on the perpendicular away from the bridge and towards the center of the third manhole cover. Position one member of the team at Point E, at least 10 paces from Point X. From point E, walk perpendicularly from the line of walk, , so that the bridge is on your right. (You should be walking parallel to the line on which the center section of the bridge is located.) To find the location of point D, walk until you have a clear line of site that passes through point X and point C. Position one member of the team at point D. You should now have a person "marking" each of points E and D.
≈
XE
KUTZTOWN UNIVERSITY OF PENNSYLVANIA
31

White Water Landing – The Bridge
D
( Sign)
Center Section of Bridge
(lamppost along fence)
C
X
A B find BC
BX is given
XE is measured in paces
E i d i
KUTZTOWN UNIVERSITY OF PENNSYLVANIA
32

White Water Landing – The Bridge
Another member of the team will need to do the "measuring." 3. Using a normal walking stride, find the number of paces (rounded to the nearest half of a pace) that it takes to travel the distances XE, and DE. Record the information below. Length of = 104.87 feet. Length of = paces. Length of = paces.
4. HALF of the length of the center section of the bridge .
BC = x paces feet.
5. The total length of the center section of the bridge is twice as long (assuming symmetry): Length of the center section of the bridge 2 x BC feet. Just how reasonable is your estimate? Here's another way to estimate the length of the center section of the bridge: Get wet !!! You must ride White Water Landing in order to access the bridge. 6. Walk (run?) across the bridge and count the number of paces used to estimate the
total length of the center section of the bridge. (Measure the distance between points A and C.)
Length of bridge paces x = feet.
7. Compare your result from #5 with the result obtained in #6. Describe possible reasons for any differences in the answers.
BX
XE
DE
DEXEBXBC and BC ×=≈
feetpace
≈
≈ ≈
≈ feetpace
KUTZTOWN UNIVERSITY OF PENNSYLVANIA
33

White Water Landing – The Ride
Information Sheet topics: distance
revolutions speed using literal formulas quadratic function
objectives: to estimate the speed of a boat as it ascends the incline to write an equation for a parabola that models the top of the drop to graph the parabola that models the top of the drop equipment : activity sheets pencil stopwatch basic calculator graphing calculator (optional) notes for the teacher: Taking the time measure as the boat descends may be difficult due to the rapid
descent.
KUTZTOWN UNIVERSITY OF PENNSYLVANIA
34

White Water Landing – The Ride
PART 1: The goal of this activity is to estimate the speed of a boat as it ascends the lift. A boat is pulled to the top of the ride by a chain, and the chain is designed as a pulley. You can see the actual "generating gear" (the circular gear) that moves the pulley -- it is located behind the sign for White Water Landing. The circumference of the "generating gear" will help you estimate the length of the incline. 1. Find a location to stand so that you can see the "generating gear". The radius, r, of
the gear is 11 inches or 0.917 feet. Find the circumference of the gear. C = feet. 2. Find the number of revolutions, N, that the "generating gear" has revolved for the boat to be lifted to the top of the hill. (Use the marker on the gear for guidance.) 3. d = N x C. That is, (the distance traveled by the boat during one revolution of the
gear) can be computed by taking the product of (the number of revolutions made by the gear) and (the circumference of the gear). Compute d using results of #1 and #2.
4. Use a stopwatch and measure the time that it takes for the boat to travel up the entire incline. You should do this at least twice, and use an average time for t. Record your timed data and then compute the average time here. 5. One can think of speed, s, as the ratio of the distance traveled, d, to the amount of time
used to travel that distance, t. In formula form, this says that .
Use your results from #3 and #4 to estimate the speed of the boat up the incline.
s =dt
KUTZTOWN UNIVERSITY OF PENNSYLVANIA
35

White Water Landing – The Ride
PART 2: 1. One mathematical model for the height of a boat (on the top part of the drop) on White
Water Landing the equation:
, where s is the height of the boat above ground level at time t seconds, a is the force of acceleration due to gravity, vo is the initial velocity (the initial "push" at the top of the drop), and so is the height at the top of the drop. The height of the slide, just before the boat begins to fall, is so = 80 feet. The force of acceleration due to gravity is a = -32 ft/sec2. The initial velocity, vo, is approximately your result from #5 in PART 1. Why? 2. Use the information given to you in #1 to write a function formula that models the
height of the boat (relative to time) on the top part of the drop. (The function's name is s(t).)
3. Measure the time that it takes for a boat to descend about midway. (To a point that looks
as though its path was a parabola.) Name your measured time t1. 4. Using the measured time (from #3) and your formula (from #2), estimate the height of the boat above the ground at this time by calculating s(t1). 5. Use your results from #2, #3, and #4 to sketch the graph of y = s(t), the path of motion on the top part of the slide.
s(t) = 12 a t 2 + vo t + so
KUTZTOWN UNIVERSITY OF PENNSYLVANIA
36

White Water Landing – The Ride
PART 3: (Optional) 1. Use a graphing calculator to graph the equation y = s(t) in order to verify that your sketch in PART 2, #5 is reasonable. Draw your graph below and describe any discrepancies. 2. When you view the top of the slide on White Water Landing, you can see a parabolic shape. Explain why this is NOT the same parabola that you graphed in this activity.
80
(0,0) t-axis (seconds)
s-axis(feet)
t1
KUTZTOWN UNIVERSITY OF PENNSYLVANIA
37

White Water Landing – The Ride
KUTZTOWN UNIVERSITY OF PENNSYLVANIA
38

Create a Park!
Information Sheet
topics: estimation analysis of park factors objectives: to create a park based on analysis of Dorney Park rides and services to evaluate the needs of customers and park employees to write a report to draw a map equipment : paper and pencil notes for the teacher:
This activity is to encourage the students to think about the total operation of an amusement park. Have students study the map of Dorney Park and consider the placement of rides, why certain rides are strategically placed near the entrance, on a hill, on a curved path, etc. Have the students think about the amount of land necessary for rides like Steel Force that wind around or past other rides versus rides like the Ferris Wheel which take up little land space. Consider legal or zoning requirements regarding land use, noise or lighting restrictions. What does an amusement park need to do to become a good neighbor? What factors such as weather, time of day and date would contribute to the operation of the park for the staff as well as the number of customers? In the classroom, students could make a map of their park given a standardized plot of land. Students should indicate placement of rides, parking, picnic areas, etc. and any natural elements (ponds, trees, fountains, etc.).
KUTZTOWN UNIVERSITY OF PENNSYLVANIA
39
Create a Park!
As you walk around Dorney Park, observe the many facets to the park, not only the rides, but also the food stands, gift shops, restrooms, picnic areas, etc. There is more to an amusement park than just rides! Dorney Park and Wildwater Kingdom is built on 200 acres with a hundred rides. Look at the map for Dorney Park. What do you notice about the layout of the park? Estimate or "pace" the dimensions of certain elements. How much land is required for the Ferris Wheel, White Water Landing, or Meteor? PART 1: Suppose you have inherited 25 acres in north central Pennsylvania. Having studied Dorney Park, you decide to develop this land into an amusement park. Design your park with the following questions in mind. 1. How many rides will fit on the land? Consider the space requirements of individual
rides, their "footprints." 2. What criteria are used in selecting a ride? Will you have rides for both adults and
children, children only, or adults only? Which ride will be your big attraction? Think about the thrill factor of different rides and the number of people per hour that a ride can accommodate.
3. Consider other demands for space in your park to meet the needs of your guests, employees and staff. (For example, parking.) 4. What is the capacity of your park? What factors affect attendance? 5. Do you think you will have a profitable operation? PART 2: Write a report for the county commissioners that describes your park and the decisions that went into developing this land so that you will receive the necessary permits to build our dream amusement park. Draw a map to indicate land usage.
KUTZTOWN UNIVERSITY OF PENNSYLVANIA
40

Entertainment Values
Information Sheet
topics: number sense
probability expected value
objectives: to quantify, meaningfully, one's degree of enjoyment on various rides to demonstrate critical thinking skills to analyze and refine hypotheses in order to gain more meaningful results rides: any two to five rides in the Park (you may want to limit these to official TU rides) equipment: activity sheets pencil and calculator stopwatch notes for the teacher: PARTS 1 and 2 are designed to be discussed in class, BEFORE the trip to Coaster Quest. PARTS 2 and 3 are designed to be completed AT Coaster Quest PART 4 is designed for follow-up in class, AFTER the trip to Coaster Quest This activity may be useful for teachers and students at schools with block
scheduling. This activity may also be beneficial in situations where students are grouped
and have different ability levels represented in each group.
KUTZTOWN UNIVERSITY OF PENNSYLVANIA
41

Entertainment Values
PART 1: Background and Set up: The goal of this activity is to obtain quantifiable results that reflect one's so-called "satisfaction" or "entertainment" value of the rides at Dorney Park. There are many variations within the process that is described here. You are urged to read and discuss PART 1 prior to attending Coaster Quest, since it will walk you through the process of quantifying your experiences; this activity only addresses the roller coasters in the park. You are encouraged to try this with ANY group of rides. The table here gives the "official" lengths of time that it takes each coaster to complete one ride cycle. The "official" timing begins when the train is released from its start position (you might be able to hear the "official" start), and ends when the train is completely stopped and ready to exit. Coaster: "official" time to complete one cycle (minutes)
Hydra
2 min 35 sec.= 2.58 min
Steel Force 3 min.
Thunderhawk
1 min. 18 sec.= 1.3 min.
Wild Mouse
1 min. 40 sec.= 1.67 min.
If the length of time ON the ride is the only factor in measuring one's satisfaction, then the ride that lasts the longest should be the "best" ride that you experience. That is, 100% of the satisfaction value depends only on the length of the ride. The chart above would indicate that, among all of Dorney Park's roller coasters, Steel Force is the "best" one. This is misleading for some of you!! There are many factors that may enhance or detract from your satisfaction of any given ride. Here is a brief list of factors that may effect your satisfaction:
o the length of time you spend in a waiting line or queue o the "thrill factor" of the ride ...how you REALLY feel during the ride o the weather o your companions on the ride o comfort of the seats and the restraining devices o personal wellness o screaming children
1. Can you think of other factors that may effect your positive or negative enjoyment of a ride?
KUTZTOWN UNIVERSITY OF PENNSYLVANIA
42

Entertainment Values
For purposes of this example, this activity will consider three factors: ride duration = the "official" length of the ride, measured in minutes wait time = the length of time you spend in a waiting line or queue, measured in minutes thrill factor = how you REALLY feel during the ride, on an integer scale of 0 through 10 (10 is best) RULES: The rules (for determining measurements and assigning relative weights to the factors) were designed so that data collection is relatively easy. Your group may wish to modify them, but the rules need to be put forth BEFORE you do this on your own. A. Determining measurements: (Rounded to the nearest tenth of a minute)
Ride duration - Use "official" ride times (in minutes) given by Dorney Park. - Assign a positive ( + ) value to each ride duration time (Why?).
Note: If you use rides that are not listed here, you can find a good estimate of the ride's time to complete one cycle by taking three measurements with a stopwatch and averaging them.
Wait time - Use a stopwatch to measure wait times (in minutes). Begin timing when you are physically waiting for something to happen.
(This may happen in a waiting queue; if no queue, it begins as soon as you are waiting in your seat before the ride "officially" starts its cycle.) Stop timing the wait time as soon as the ride "officially" starts its cycle.
- Assign a negative ( - ) value to each ride wait time (Why?). Thrill factor - Assign an integer value to the ride after you have ridden it. Use a score of 10 for the best thrill possible, 0 for absolutely no thrill, and
any integer in between. You may assign the same number to different rides. - Assign a positive ( + ) value to each ride duration time (Why?). B. Assign relative weights to each factor: In order to quantify 100 % of any experience, the sum of the percentages of its parts must total 100 %. Since we are using three factors, we must decide IN ADVANCE, what percentage of the whole experience is contributed by each of the factors. For this example, let's use these: Ride duration = 20 % of the whole experience Wait time = 10 % of the whole experience Thrill factor = 70 % of the whole experience
KUTZTOWN UNIVERSITY OF PENNSYLVANIA
43

Entertainment Values
Of course, when we use these percentages, they will need to be converted to their decimal equivalents (.2, .1, and .7 respectively).
KUTZTOWN UNIVERSITY OF PENNSYLVANIA
44

Entertainment Values
The tables below reflect everything that we need to this point. They were hypothetically completed by taking the necessary measurements and by performing the necessary calculations. For the first three tables, products were computed using a calculator. Ride Duration (+) preassigned relative Coaster: Ride duration (min.) weight product 1
Hydra
2 min 35 sec.= 2.58 min
.2
.234
Steel Force
3 min.
.2
.6
Thunderhawk
1 min. 18 sec.= 1.3 min.
.2
.26
Wild Mouse
1 min. 40 sec.= 1.67 min.
.2
.334
Wait Time (-) preassigned relative Coaster: Wait time (min.) * weight product 2
Hydra
- 20 min.
.1
- 2.
Steel Force
- 20 min.
.1
- 2.
Thunderhawk
1 min. 30 sec.= - 1.5 min.
.1
- 0.15
Wild Mouse
- 15 min.
.1
- 1.5
* Hypothetical for this example; to be measured at Coaster Quest. Thrill Factor (+) preassigned relative Coaster: Thrill factor weight product 3
Hydra
9
.7
6.3
Steel Force
9
.7
6.3
Thunderhawk
8
.7
5.6
Wild Mouse
9
.7
6.3
* Hypothetical for this example; to be measured at Coaster Quest.
KUTZTOWN UNIVERSITY OF PENNSYLVANIA
45

Entertainment Values
The table below includes the products obtained from the last three tables, and shows the sums of the products.......the numbers in the last column reflect a quantifying number that reflects your satisfaction with each ride. Coaster: product 1 product 2 product 3 Sum of products
Hydra
.234
- 2.
6.3
4.534
Steel Force
.6
- 2.
6.3
4.9
Thunderhawk
.26
- 0.15
5.6
5.71
Wild Mouse
.334
- 1.5
6.3
5.134
From the last column, you can see that Thunderhawk gave you the most satisfaction or enjoyment! PART 2: Here's your chance to mimic PART 1. The outline of the process is provided below, and remember to do your preparation for this activity BEFORE you go to Coaster Quest. (PART 3 provides workspace for your choice of up to ANY five of rides, with at most four factors for each.) The table here gives the "official" lengths of time that it takes each coaster to complete one ride cycle. The "official" timing begins when the train is released from its start position (you might be able to hear the "official" start), and ends when the train is completely stopped and ready to exit. Coaster: "official" time to complete one cycle (minutes)
Hydra
2 min 35 sec.= 2.58 min
Steel Force
3 min.
Thunderhawk
1 min. 18 sec.= 1.3 min.
Wild Mouse
1 min. 40 sec.= 1.67 min.
If the length of time ON the ride is the only factor in measuring one's satisfaction, then the ride that lasts the longest should be the "best" ride that you experience. That is, 100% of the satisfaction value depends only on the length of the ride. The chart above would indicate that, among all of Dorney Park's roller coasters, then Steel Force is the "best" one.
KUTZTOWN UNIVERSITY OF PENNSYLVANIA
46

Entertainment Values
This is a LIE, of course, for some of you!! There are many factors that may enhance or detract from your satisfaction of any given ride. Here is a brief list of factors that may effect your satisfaction: the length of time you spend in a waiting line or queue the "thrill factor" of the ride ...how you REALLY feel during the ride the weather your companions on the ride comfort of the seats and the restraining devices personal wellness screaming children 1. Can you think of other factors that may effect your positive or negative enjoyment of a ride? For purposes of this exercise, consider only the three factors: ride duration = the official length of the ride, measured in minutes wait time = the length of time you spend in a waiting line or queue, measured in minutes thrill factor = how you REALLY feel during the ride, on an integer scale of 0 through 10 (10 is best) RULES: The rules (for determining measurements and assigning relative weights to the factors) were designed so that data collection is relatively easy. Your group may wish to modify them, but the rules need to be put forth BEFORE you do this on your own. A. Determining measurements: (Rounded to the nearest tenth of a minute) Ride duration - Use "official" ride times (in minutes) given by Dorney Park. - Assign a positive ( + ) value to each ride duration time (Why?).
Note: If you use rides that are not listed here, you can find a good estimate of the ride's time to complete one cycle by taking three measurements with a stopwatch and averaging them.
Wait time Use a stopwatch to measure wait times (in minutes). Begin timing when you are physically waiting for something to happen.
(This may happen in a waiting queue; if no queue, it begins as soon as you are waiting in your seat before the ride "officially" starts its cycle.)
Stop timing the wait time as soon as the ride "officially" starts its cycle.
- Assign a negative ( - ) value to each ride wait time (Why?). Thrill factor - Assign an integer value to the ride after you have ridden it. Use a score of 10 for the best thrill possible, 0 for absolutely no thrill, and
any integer in between. You may assign the same number to different rides. - Assign a positive ( + ) value to each ride duration time (Why?).
KUTZTOWN UNIVERSITY OF PENNSYLVANIA
47

Entertainment Values
B. Assign relative weights to each factor: In order to quantify 100 % of any experience, the sum of the percentages of its parts must total 100 %. Since we are using up to four factors, we must decide IN ADVANCE, what percentage of the whole experience is contributed by each of the factors. For this example, use these: 2. Ride duration = % of the whole experience Wait time = % of the whole experience Thrill factor = % of the whole experience *****Of course, when you use these percentages, you will need to convert them to their
decimal equivalents. Use the tables here to organize your data. 3. Fill in the first three tables below and compute the products with a calculator. Also
record the results in the fourth table. Ride Duration (+) preassigned relative Coaster: Ride duration (min.) weight product 1
Hydra
2 min 35 sec.= 2.58 min
Steel Force
3 min.
Thunderhawk
1 min. 18 sec.= 1.3 min.
Wild Mouse
1 min. 40 sec.= 1.67 min.
Wait Time (-) preassigned relative Coaster: Wait time (min.) * weight product 2
Hydra
Steel Force
Thunderhawk
Wild Mouse
* You should determine this from riding the coasters at Coaster Quest
KUTZTOWN UNIVERSITY OF PENNSYLVANIA
48

Entertainment Values
Thrill Factor (+) preassigned relative Coaster: Thrill factor weight product 3
Hydra
Steel Force
Thunderhawk
Wild Mouse
* You should determine this from riding the coasters at Coaster Quest. 4. In the table below, record the products obtained from the last three tables, and compute
the sums of the products. Remember that the numbers in the last column reflect a quantifying number that should reflect your satisfaction with each ride.
Coaster: product 1 product 2 product 3 Sum of products
Hydra
Steel Force
Thunderhawk
Wild Mouse
5. From the last column, which coaster gave YOU the most satisfaction or entertainment?
KUTZTOWN UNIVERSITY OF PENNSYLVANIA
49
Entertainment Values
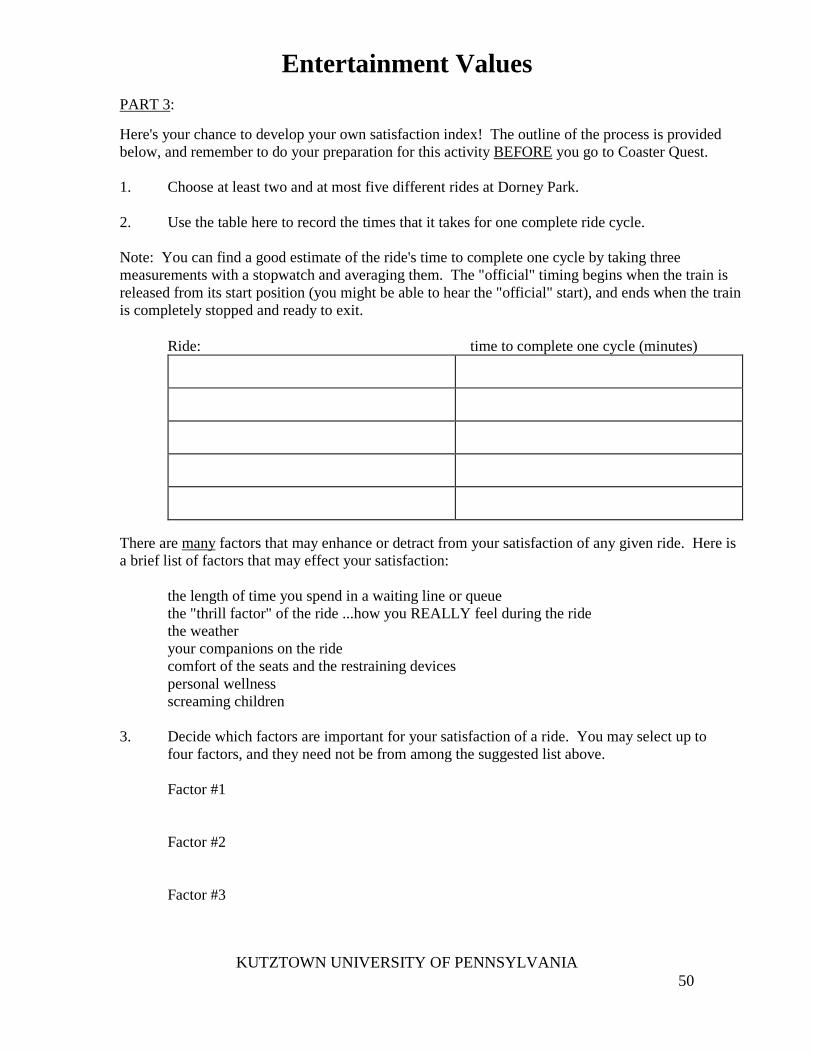
PART 3: Here's your chance to develop your own satisfaction index! The outline of the process is provided below, and remember to do your preparation for this activity BEFORE you go to Coaster Quest. 1. Choose at least two and at most five different rides at Dorney Park. 2. Use the table here to record the times that it takes for one complete ride cycle. Note: You can find a good estimate of the ride's time to complete one cycle by taking three measurements with a stopwatch and averaging them. The "official" timing begins when the train is released from its start position (you might be able to hear the "official" start), and ends when the train is completely stopped and ready to exit. Ride: time to complete one cycle (minutes)
There are many factors that may enhance or detract from your satisfaction of any given ride. Here is a brief list of factors that may effect your satisfaction: the length of time you spend in a waiting line or queue the "thrill factor" of the ride ...how you REALLY feel during the ride the weather your companions on the ride comfort of the seats and the restraining devices personal wellness screaming children 3. Decide which factors are important for your satisfaction of a ride. You may select up to four factors, and they need not be from among the suggested list above. Factor #1 Factor #2 Factor #3
KUTZTOWN UNIVERSITY OF PENNSYLVANIA
50

Entertainment Values
Factor #4
KUTZTOWN UNIVERSITY OF PENNSYLVANIA
51
Entertainment Values
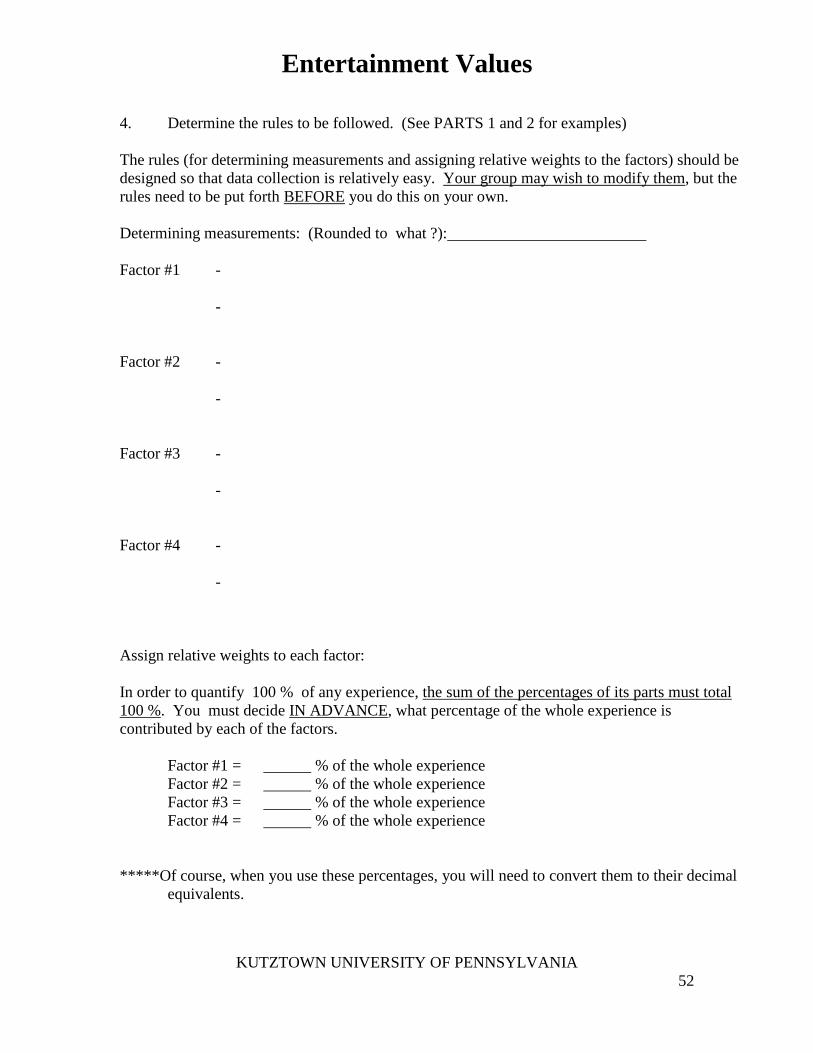
4. Determine the rules to be followed. (See PARTS 1 and 2 for examples) The rules (for determining measurements and assigning relative weights to the factors) should be designed so that data collection is relatively easy. Your group may wish to modify them, but the rules need to be put forth BEFORE you do this on your own. Determining measurements: (Rounded to what ?): Factor #1 - - Factor #2 - - Factor #3 - - Factor #4 - - Assign relative weights to each factor: In order to quantify 100 % of any experience, the sum of the percentages of its parts must total 100 %. You must decide IN ADVANCE, what percentage of the whole experience is contributed by each of the factors. Factor #1 = % of the whole experience Factor #2 = % of the whole experience Factor #3 = % of the whole experience Factor #4 = % of the whole experience *****Of course, when you use these percentages, you will need to convert them to their decimal equivalents.
KUTZTOWN UNIVERSITY OF PENNSYLVANIA
52

Entertainment Values
5. Fill in these tables (one for each factor) and compute the products with a calculator. Also record the resulting products in the table in #6. ( ) - sign? preassigned relative Ride: Factor #1: weight product 1
( ) - sign? preassigned relative Ride: Factor #2: weight product 2
( ) - sign? preassigned relative Ride: Factor #3: weight product 3
KUTZTOWN UNIVERSITY OF PENNSYLVANIA
53

Entertainment Values
( ) - sign? preassigned relative Ride: Factor #4: weight product 4
6. In the table below, record the products obtained from the tables in #5, and compute the sums of the products. Remember that the numbers in the last column are quantifying numbers that should reflect your satisfaction with each ride. Ride: product 1 product 2 product 3 product 4 Sum of products
7. Based on the data in the last column, which ride gave you the most satisfaction or entertainment?
KUTZTOWN UNIVERSITY OF PENNSYLVANIA
54

Entertainment Values
PART 4: Follow up questions (PARTS 1, 2, and 3) The numbers in the last column of the final tables (sums of the products) can be referred to as "entertainment values." 1. Based on your computations, which ride gave you the most "entertainment value?" 2. Do you FEEL that the "entertainment value" numbers are accurate? Describe why or why not. 3. Use the factors and relative weights given in PART 1. Assuming that no wait time is
longer than 3 minutes and that ride times vary from 1.5 to 3 minutes, find:
a. the largest possible “entertainment value.”
b. the smallest possible “entertainment value.”
4. Which conditions (number of factors, choice of factors, measurement techniques,
weights) may increase the resulting numbers in the “entertainment value?” Why?
5. Which conditions (number of factors, choice of factors, measurement techniques,
weights) may decrease the resulting numbers in the "entertainment value?" Why? 6. Which conditions may yield negative numbers for an “entertainment value?” Briefly
explain how this might occur.
KUTZTOWN UNIVERSITY OF PENNSYLVANIA
55

Entertainment Values
7. Try to write a mathematical formula that can be used to compute "entertainment values."
KUTZTOWN UNIVERSITY OF PENNSYLVANIA
56

A Group of Friends at Dorney
Information Sheet Topics: probability investigate the number of possible arrangements in situations using permutations and combinations Objectives: to find the seating capacities of “cars” on certain rides to find the possible number of groupings on certain rides Equipment: activity sheets pencil calculator (scientific or better) Note to teachers:
Because math books differ in their use of notations for permutations [P(n, r) or nPr] and combinations [C(n, r) or nCr], both notations are given on the first page of the activity sheet.
Also, because math books differ in the formulas they present in their books, both formulas are given. (In Pennsylvania, the formulas using factorials are used on the PSSA formula sheets.)
KUTZTOWN UNIVERSITY OF PENNSYLVANIA
Special thanks to Sara Bechtel, Ken Eicheldinger and Angela Xander 57

A Group of Friends at Dorney
A group of fifteen friends go to Dorney Park for a day on the rides. However because of the different seating arrangements on the rides, not all of you will be able to ride together in a group in the same “car” at the same time. The mathematical concepts of permutations [written as either P(n, r) or nPr] and combinations [written as either C(n, r) or nCr] will help to determine how many different ways the fifteen friends can ride together. For these math concepts, use either the permutations and combinations keys in your calculator (scientific or better calculator) or one of the following formulas: P(n, r) = nPr = n (n – 1) (n – 2) … r factors or nPr = n!___
(n – r)! C(n, r) = nCr = n (n – 1) (n – 2) … r factors or nCr = n!___ r (r – 1) (r – 2) … r! (n – r)! Part 1:
• As you go around the Park to each of the following rides, find the maximum number of people that each “car” on the ride can hold (check the entrance signs at each ride for the correct answer). Record your answers in the second column of the table below. • Then calculate and record your answers in the third column as to how many different ways fifteen friends can enjoy a ride in one car at the same time. • The math concept that you will use to find the number of different ways is called a ________________________ (fill-in the blank) because the order of the groups does matter / does not matter (cross out the incorrect answer).
KUTZTOWN UNIVERSITY OF PENNSYLVANIA
Special thanks to Sara Bechtel, Ken Eicheldinger and Angela Xander 58

A Group of Friends at Dorney
NAME OF RIDE maximum # of people a car holds
the number of ways 15 friends can sit together
Wild Mouse
Ferris Wheel
Enterprise
Monster per arm
Dominator per tower
Tilt-a-Whirl
Musik Express
Apollo
Part 2:
• As your day at the Park goes by, some of your friends decide that they HAVE TO sit aside of specific friends on each ride. This now means that it makes a difference in the order in which you get on the rides. • In the second column below, copy your data in column two from the table in Part I. • Now calculate and record your answers in the third column as to how many different ways fifteen friends with specific seating arrangements can enjoy a ride in one car at the same time. • The math concept that you will use to find the number of different ways is called a ________________________ (fill-in the blank) because the order of the groups does matter / does not matter (cross out the incorrect answer).
KUTZTOWN UNIVERSITY OF PENNSYLVANIA
Special thanks to Sara Bechtel, Ken Eicheldinger and Angela Xander 59

A Group of Friends at Dorney
NAME OF RIDE maximum # of people a
car holds (from Part I)
the number of ways 15 friends can sit with
certain friends
Wild Mouse
Ferris Wheel
Enterprise
Monster per arm
Dominator per tower
Tilt-a-Whirl
Musik Express
Apollo
KUTZTOWN UNIVERSITY OF PENNSYLVANIA
Special thanks to Sara Bechtel, Ken Eicheldinger and Angela Xander 60