Rickreall Watershed Assessment - Oregon Department … stores/data libraries/files... · Rickreall...
173
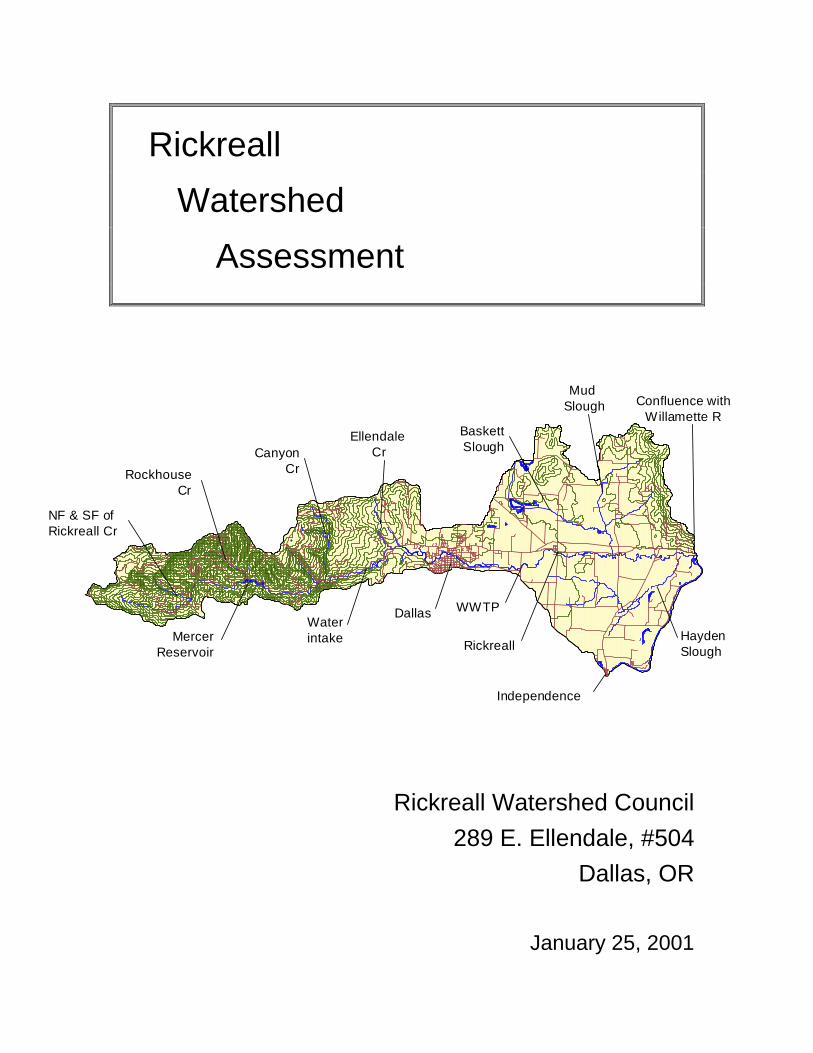
Rickreall Watershed Assessment Rickreall Watershed Council 289 E. Ellendale, #504 Dallas, OR January 25, 2001 # NF & SF of Rickreall Cr # Ellendale Cr # Mercer Reservoir # Water intake # Canyon Cr # Rockhouse Cr # Dallas # WWTP # Rickreall # Baskett Slough # Hayden Slough # Independence # Mud Slough # Confluence with Willamette R
Transcript of Rickreall Watershed Assessment - Oregon Department … stores/data libraries/files... · Rickreall...
Rickreall
Watershed
Assessment
Rickreall Watershed Council
289 E. Ellendale, #504
Dallas, OR
January 25, 2001
#
NF & SF of Rickreall Cr
#
Ellendale Cr
#
MercerReservoir
#
Waterintake
#
CanyonCr
#
RockhouseCr
#
Dallas
#
WWTP
#
Rickreall
#
BaskettSlough
#
HaydenSlough
#
Independence
#
Mud Slough
#
Confluence withWillamette R

i
Rickreall Watershed Assessment
Prepared for
The Rickreall Watershed CouncilJanuary 25, 2001
By
Ecosystems Northwest
Mt. Shasta, CA
Contributing Authors:
Kim Mattson Watershed Characterization,([email protected]) History, Water Quantity, Aquatic
Resources, Economics
Andy Gallagher Water Quality and Quantity,([email protected]) Soil Quality and Land Health
Acknowledgments
The following is a partial list of those who offered assistance in many ways:
Randy Stinson, Jackie Hastings, Charles Hazel, Ken Hale, Kenn Carter, Greg,Nelson, Gene Clemens, Dan Rosenbaum, Arlie Holt, Robert Marsh, ClaudeWhite, Gene Stevens, Dean Anderson, Glen Scatterday, Stephanie Preuitt,Roger Jordan, June Olson, Sharon Clarke, Ryan Dalton, Becky Johnson, BarbRosenbaum, Steve Mamoyac, David Teel, Jane Keppinger, Todd Wollman,David Anderson, Greg White, Brett Bruhn, Jock Dalton, Louie Kazemier, MarkKnaupp, Tom Thompson, Cliff Alton.
ii
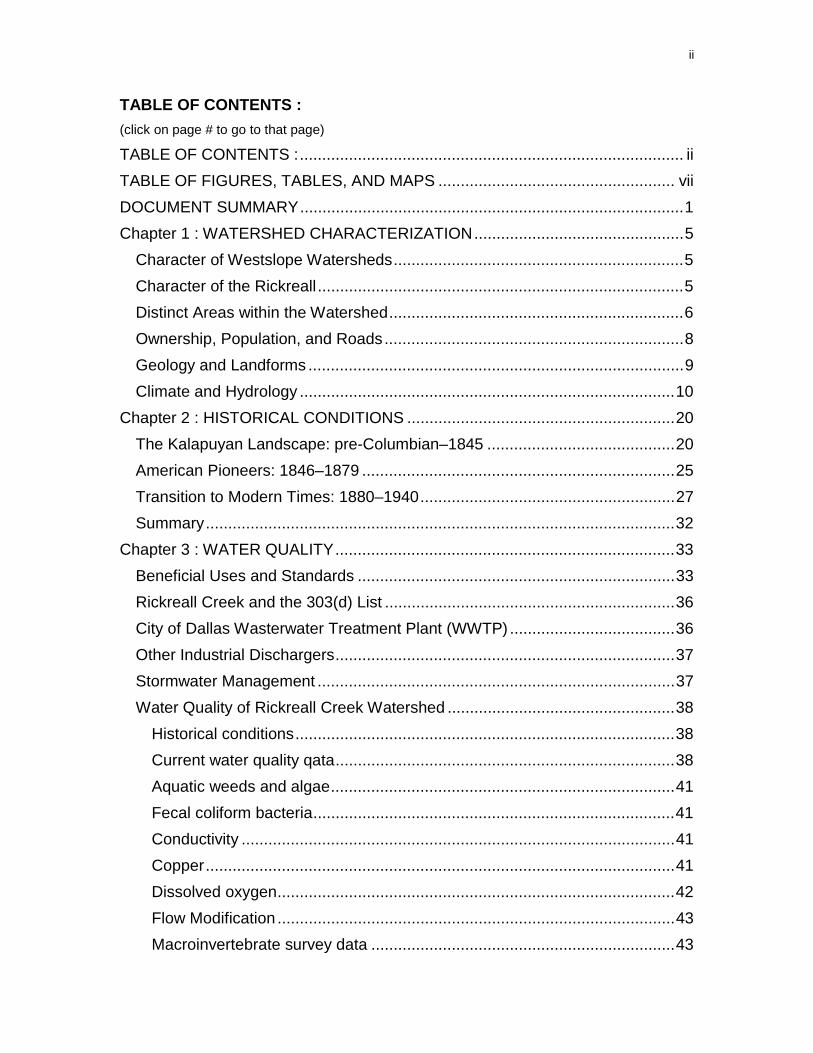
TABLE OF CONTENTS :
(click on page # to go to that page)
TABLE OF CONTENTS :...................................................................................... ii
TABLE OF FIGURES, TABLES, AND MAPS ..................................................... vii
DOCUMENT SUMMARY......................................................................................1
Chapter 1 : WATERSHED CHARACTERIZATION...............................................5
Character of Westslope Watersheds.................................................................5
Character of the Rickreall ..................................................................................5
Distinct Areas within the Watershed..................................................................6
Ownership, Population, and Roads...................................................................8
Geology and Landforms ....................................................................................9
Climate and Hydrology ....................................................................................10
Chapter 2 : HISTORICAL CONDITIONS ............................................................20
The Kalapuyan Landscape: pre-Columbian–1845 ..........................................20
American Pioneers: 1846–1879 ......................................................................25
Transition to Modern Times: 1880–1940.........................................................27
Summary.........................................................................................................32
Chapter 3 : WATER QUALITY............................................................................33
Beneficial Uses and Standards .......................................................................33
Rickreall Creek and the 303(d) List .................................................................36
City of Dallas Wasterwater Treatment Plant (WWTP) .....................................36
Other Industrial Dischargers............................................................................37
Stormwater Management ................................................................................37
Water Quality of Rickreall Creek Watershed ...................................................38
Historical conditions.....................................................................................38
Current water quality qata............................................................................38
Aquatic weeds and algae.............................................................................41
Fecal coliform bacteria.................................................................................41
Conductivity .................................................................................................41
Copper.........................................................................................................41
Dissolved oxygen.........................................................................................42
Flow Modification .........................................................................................43
Macroinvertebrate survey data ....................................................................43

iii
Ammonia .....................................................................................................43
Nitrate ..........................................................................................................43
Phosphorus (total P) ....................................................................................43
pH ................................................................................................................44
Sediment .....................................................................................................44
Temperature ................................................................................................44
Total dissolved solids...................................................................................44
Toxics ..........................................................................................................45
Turbidity.......................................................................................................45
Groundwater Quality .......................................................................................45
Contamination of Groundwater........................................................................47
Water Quantity and its Relationship to Water Quality......................................48
Rickreall Creek Water Quality Summary .........................................................48
Chapter 4 : WATER QUANTITY .........................................................................51
Hydrologic Data...............................................................................................51
Patterns of Low and High Flow Discharges for Rickreall Creek ......................55
Surface Water Withdrawals.............................................................................57
Mercer Reservoir and other Reservoirs...........................................................59
Lakes...............................................................................................................61
Wetlands .........................................................................................................62
Chapter 5 : AQUATIC AND TERRESTRIAL RESOURCES ...............................65
Fish Diversity and Sensitive Species...............................................................65
Winter Steelhead.............................................................................................66
Cutthroat Trout ................................................................................................68
Chinook Salmon..............................................................................................71
Coho Salmon ..................................................................................................71
Oregon chub ...................................................................................................71
Pacific lamprey................................................................................................72
Sand rollers .....................................................................................................72
ODFW Survey Data Sets for Rickreall Watershed ..........................................72
Survey of Lower Rickreall Creek by CH2MHill ................................................78
Channel Habitat Types....................................................................................79
Culverts and Fish Barriers...............................................................................81

iv
Riparian Zones and Wetlands .........................................................................83
Sensitive Species other than Fish ...................................................................87
Biodiversity ......................................................................................................88
Chapter 6 : SOIL QUALITY AND LAND HEALTH ..............................................89
Soil Groups .....................................................................................................89
Soil Erosion and Delivery to Streams..............................................................89
Forest Uplands................................................................................................90
Forest Practices Impacts on the Forested Uplands of the Watershed .........90
Soil Compaction and Displacement in the Forested Uplands ......................90
Mass Erosion in the Forested Uplands............................................................91
Reference Conditions ..................................................................................91
Mass Erosion: Historical and Current Conditions.........................................91
Fire and Flood in the Watershed .....................................................................92
Rockhouse Creek Fire 1987 ........................................................................93
Debris Flows in February Storms 1996........................................................93
Reports of1996-Storm Effects on Slides......................................................94
Forest Roads...................................................................................................94
Agricultural Areas ............................................................................................96
Soil Erosion and Runoff ...............................................................................96
Factors Influencing Soil Erosion and Sediment Delivery .............................97
Streambank Erosion ....................................................................................98
Fertilizers and Pesticides ................................................................................99
Historical and Current Conditions ................................................................99
Fertilizer .....................................................................................................100
Pesticides ..................................................................................................100
Livestock and Watersheds ............................................................................101
Rickreall Dairy............................................................................................101
Water Quality for Livestock Watering.........................................................102
SB1010 Agricultural Water Quality Management Area Plan .........................103
Rural Roads ..................................................................................................104
Failing On-Site Sewage Systems..................................................................104
Rock Quarries and Gravel Mining .................................................................105
Zoning Districts by Natural Subdivisions of the Watershed ...........................105

v
Conversion of Land to Urban and Residential Development.........................107
Wetland, Riparian and Watershed Restoration .............................................107
Summary.......................................................................................................108
Chapter 7 : ECONOMICS AND DEMOGRAPHICS ..........................................111
Economic Characteristics of Polk County......................................................111
Population Projections...................................................................................118
Recreational Resources and Use in the Rickreall Watershed .......................119
Summary and Conclusions ...........................................................................119
BIBLIOGRAPHY ...............................................................................................122
APPENDIX 3-1: Clean Water Act and Other Regulations.................................132
Clean Water Act Background ........................................................................132
Regulatory Management Tools .....................................................................133
Major Legislation Relating to Groundwater Protection ..................................133
Federal ..........................................................................................................133
State..............................................................................................................134
APPENDIX 3-2: Water Quality Measurements .................................................135
APPENDIX 3-3: Section 303(d) of the Federal Clean Water Act ......................136
APPENDIX 3-4: TMDLs, Storm Water ..............................................................137
Total Maximum Daily Loads (TMDL’s) ..........................................................137
TMDL Planning and Management in the Rickreall Creek Watershed............137
Storm Water Program ...................................................................................137
APPENDIX 3-5: Description of Water Quality Standards..................................139
Bacteria (Esherichia coli) or Water Contact Recreation (Fecal Coliform) ......139
Conductivity...................................................................................................139
Copper ..........................................................................................................140
Dissolved Oxygen .........................................................................................140
Flow Modification...........................................................................................141
Macroinvertebrate Life (Biological Criteria) ...................................................141
Nutrients........................................................................................................142
Ammonia .......................................................................................................143
Total Nitrogen................................................................................................143
Nitrate............................................................................................................143
Total Phosphorus ..........................................................................................143

vi
pH..................................................................................................................143
Sedimentation ...............................................................................................144
Temperature..................................................................................................144
Total Dissolved Solids (TDS) ........................................................................145
Toxics............................................................................................................145
Turbidity ........................................................................................................146
APPENDIX 3-6: Bioassessment of Aquatic Macroinvertebrates......................147
APPENDIX 5: Sensitive species (other than fish) in the Willamette Valley. .....151
Special Plants and Fungi...............................................................................155
APPENDIX 6: Soil Groups for Rickreall Watershed..........................................156
Agricultural and Mixed Land Use Soils of the Main Valley Floor and Foothills......................................................................................................................156
Forested and Mixed Land Use Soils of the Coast Range and Foothills.........158
INDEX...............................................................................................................160
GLOSSARY ......................................................................................................162

vii
TABLE OF FIGURES, TABLES, AND MAPS
(click on the page # to go to that page)
Figure 1-1 Precipitation patterns in Rickreall watershed .....................................10
Figure 1-2: Mean maximum daily and mean minimum daily temperatures .........11
Figure 1-3: Rickreall stream discharge at USGS gaging stations .......................13
Figure 2-1: Sketch of a Kalapuya man................................................................21
Figure 2-2: Historic population growth of Polk County and Dallas. .....................26
Figure 2-3: General Land Office Survey map .....................................................28
Figure 2-4 a-c Aerial photos of Rickreall watershed............................................30
Figure 4-1: Stream discharge for Rickreall Creek (annual average). ..................51
Figure 4-2: Annual hydrographs averaged by months on Rickreall Creek ..........52
Figure 4-3: Water budget of Rickreall Creek at August low flow. ........................54
Figure 4-4: Daily discharge data for Rickreall Creek (log scale). ........................56
Figure 4-5: Water availability report for Rickreall Creek......................................59
Figure 4-6: Former wetland area called Boyle Lakes..........................................62
Figure 5-1: ODFW survey reach summaries versus reach gradient ...................77
Figure 5-2: Channel habitat typing summary of streams.....................................79
Figure 5-3: Remnant riparian forests along the Willamette River........................86
Figure 7-1: Timber harvests in Polk County......................................................112
Figure 7-2: Polk County agriculture sales and harvested acres over time. .......113
Figure 7-3: Polk County crop sales over time by crop type...............................114
Figure 7-4: Polk County acres in crops over time. ............................................115
Figure 7-5: Population projection for Polk County and Dallas...........................118
Table 3-1: Oregon designated beneficial uses for Rickreall Creek .....................33
Table 3-2: Water quality summary for Rickreall Creek........................................34
Table 3-3: Nine years of low flow water quality data (Highway 51 Bridge).........39
Table 3-4: Seven years of low flow water quality data (Highway 99W)...............39
Table 3-5: Four years of low flow water quality data (Levens Street, in Dallas)..39
Table 3-6: Water quality for Rickreall Creek 1973, 1989 and 1992.....................40
Table 3-7: Modeled water quality data ................................................................40
Table 4-1: Water rights1 for Rickreall Watershed ................................................59

viii
Table 4-2: Reservoirs in Rickreall watershed......................................................60
Table 4-3: Lakes in the Rickreall watershed. ......................................................61
Table 5-1: Fish species thought to occur in the Rickreall Creek .........................65
Table 5-2: Fish species with some level of sensitive status. ...............................66
Table 5-3: Gill netting data from Mercer Reservoir. ............................................69
Table 5-4: General considerations for cutthroat trout habitat requirements. .......70
Table 5-5: ODFW Stream Reach Summaries for Rickreall Watershed...............75
Table 6-1: Road Status in Rickreall Creek ..........................................................95
Table 6-2: Road Densities for the Willamette Basin............................................95
Table 6-3: Soil loss for soils of the Willamette Valley..........................................97
Table 7-1 Top five agricultural commodities in Polk Co in 1999 and 1976........114
Table 7-2: Total agriculture report for Polk County 1999. .................................115
Map 1-1: Location of the Rickreall watershed in Polk County. ............................14
Map 1-2: 1994 orthophoto of the watershed showing landuse patterns..............15
Map 1-3: Land ownership and main roads in Rickreall watershed......................16
Map 1-4: Population of the Rickreall watershed..................................................17
Map 1-5: Stream profile of Rickreall Creek .........................................................18
Map 1-6 Geology. ...............................................................................................19
Map 4-1: Water use in Rickreall watershed. .......................................................63
Map 4-2: Water bodies in Rickreall watershed....................................................64
Map 5-1: Channel habitat types. .........................................................................80
Map 5-2: Stream crossings by roads ..................................................................82
Map 5-3: Vegetation types in 1851. ....................................................................84
Map 5-4: Current vegetation in the lower watershed...........................................85
Map 6-1: Soil groups of the Rickreall watershed...............................................110
Map 7-1: Polk County comprehensive plan zoning...........................................121

Rickreall Watershed Assessment: Summary 1
DOCUMENT SUMMARY
This document is the product of an assessment of watershed condition for theRickreall Creek watershed. The assessment used available information todescribe current conditions and to project trends over time. This assessmentwas requested by the Rickreall Creek Watershed Council for their use as theydevelop strategies for protection and restoration of the watershed and as theyconsider further assessments to better understand their watershed.
The assessment examined a wide range of issues including land use history,water quality, water quantity, aquatic and terrestrial habitats, soil conditions, andsocial and economic conditions. The assessment followed the guidanceprovided by the Oregon Watershed Assessment Manual (WatershedProfessionals Network 1999) or built upon the procedures described in themanual. In other instances, procedures were based on discussions and directionfrom the technical steering committee of the Rickreall Watershed Council. Thepurpose of the assessment was not to collect new data, but rather synthesizeexisting data sets and studies pertaining to the Rickreall Creek watershed toprovide a picture of the watershed at this point in time.
Information and data was gathered from a variety of sources. These sourcesincluded libraries at Oregon State University and the City of Dallas, Polk CountyHistorical Society, government files, aerial photos, GIS layers, unpublishedreports and data sets from the City of Dallas and Polk County, publishedliterature, theses and dissertations, and from consultations with technicalspecialists, and residents with background knowledge of the basin. The Internetproved to be a good source of electronic data from government sites. Twoanalysts visited the watershed on four trips. Visited areas included both theupper and lower watershed areas. In the upper watershed, visits were made tothe reservoir, the 1987-burn area, Rickreall Creek at major tributary junctions, theSouth Fork of Rickreall, and the ridgetops above Rockhouse Creek. In the lowerwatershed, trips included driving over a majority of the roads, a canoe float on atwo-mile section of the Rickreall below the community of Rickreall and visits tothe water treatment and wastewater treatment plants. These gathered data sets,reports, visits, and discussions were the basis to construct a synthesis of thecurrent picture of watershed health through an assembly of figures, GIS maps,photographs, and tables that comprise this document.
In the remainder of this document, the Rickreall Creek Watershed is described interms of chapters on: 1) watershed characterization, 2) history of human use, 3)water quality, 4) water quantity, 5) aquatic and terrestrial resources, 6) soils, and7) social and economic considerations.
The following is a statement of general findings and watershed condition. Eachstatement is followed by a recommendation for consideration or action. This listshould not be considered as a final statement but rather a start of a discussionthat the readers of this document may carry on—particularly those that live in thewatershed. They need to decide about what they think is important about thiswatershed.

Rickreall Watershed Assessment: Summary 2
Highly diverse physical character of the watershed creates manyobservable patterns. This relatively small watershed, due to its shape andlocation, has a wide diversity in almost all elements of watershed structure. Forexample lower portion of the watershed has an elevation gain of 200 feet fromthe Willamette River to the city of Dallas, but rises over 3,000 feet west of Dallasto the top of the watershed. This contrast in geomorphology creates differentclimate, soils, vegetation and land use patterns. The highly diverse physicalnature of the watershed creates much of the land use patterns also.RECOMMENDATION: Recognize the sources of diversity and patterns in theRickreall. This will clue one into subtle workings of the watershed and help toidentify areas that are critical to the “good things” and “important functions” of thewatershed. It will help to identify good things to protect and bad things to fix.
The watershed provides many important services to its residents. Theseservices include a flow of waters used for drinking, agricultural irrigation,commercial uses, and recreational uses. The watershed is more than thestream. Its services include the productive soils that provide harvests foragriculture and timber, functioning waste disposal, and natural habitat for wildlife.Rickreall Creek may not be fully recognized by many citizens for its manypositive contributions. Such an attitude can be a greater limitation for streamrecovery than the physical and functional constraints to the stream. The badnews is that the positive elements of the watershed could shift toward a worsecondition if a community overlooks the intangibles of stream and watershedcondition. RECOMMENDATION: Consider developing education and informationoutreach to the public about important services and unique aspects of RickreallCreek. Help to develop a sense of pride in the creek and watershed. Alsoattempt to describe a vision statement for the desired future condition of thewatershed. Be as specific as possible.
Rickreall Creek falls to very low flows during the summer and isoverallocated for stream withdrawals. Projections for Dallas indicate that awater shortage may be expected by 2010. The relatively low amount ofsnowpack in the Coast Range combined with the lack of rain during the summermonths accounts for the low flows in Rickreall Creek. Indeed, it was the lowerflowing streams on the west side of the Willamette Valley that appears to haveencouraged the development of historic travel routes on that side of theWillamette River. The travel routes, or more specifically the fords, were likelyimportant in Dallas being sited at some distance from the Willamette River. Thislocation created the subsequent need for more water than the Rickreall couldnaturally supply during summer low flows. Mercer Reservoir has solved theproblem by augmenting the summer flow of Rickreall Creek. However as a resultof sediment filling into the reservoir and growth of the city, a new source ofsummer water will need to be secured in the future. The City has a number ofalternatives currently under study. The most favorable from an economicstandpoint is construction of a second dam and reservoir in Rickreall Creek. Thisyear the Rickreall was designated along with the Upper Willamette River ascritical habitat for endangered winter steelhead. The full ramifications of such aslisting remain to be seen. RECOMMENDATION: The Council should consider

Rickreall Watershed Assessment: Summary 3
ways to become proactive in the decision-process of securing water supply forcity of Dallas and users downstream. Help to prioritize issues of importance suchas cost in dollars, safety to community, intangible costs to the environment, andbenefits to the entire community. Consideration of alternatives and their risksshould be explicitly discussed.
Measures of stream condition of the stream suggests that there have beensome negative affects the lower portion; but the stream is in relatively goodcondition higher up in the watershed. Measures of good function include areturning steelhead run, apparently healthy cutthroat population in the upperportion, and no known disappearance of fish species. The steelhead aredifferent genetically from other native steelhead in the Santiam system.However, there is not good reason to believe that native steelhead did not useRickreall Creek, though probably at lower numbers than rivers on the east side ofthe Willamette River. The naturally reproducing steelhead now in the stream arelikely the result of mixing of introduced and native steelhead. Conditions forfluvial and resident cutthroat trout appear favorable in some sections of the lowerRickreall below Dallas. However, high summer temperatures, low flow, lack oflarge woody debris, the naturally entrenched channel are likely limitations. As aresult, this section may deserve some attention for restoration. The streamcondition downstream of the reservoir also shows several differences whencompared to sections above the reservoir. In the reach below the reservoir,there are lower amounts of gravel and sand, area of pools is lower, and thestream is wider. This is the section with the most sensitive fish populations—larger resident cutthroat trout and juvenile steelhead occur here.RECOMMENDATION: Perform stream habitat and fish surveys (electroshockingor snorkel surveys) to determine abundance, distributions, and use of habitat.High priority areas for focus restoration work would be Rickreall Creek in thelower portion and the section between the reservoir and Dallas. Tributaries suchas lower part of Baskett Slough, Ellendale Creek, and Forester Creek might beexamined during high flows to see how they function as important refuges andspawning areas. Purpose of surveys would be to assess stream use bycutthroat and steelhead as well as rare non-game species (Oregon Chub,sandroller stickleback, and lamprey). An assessment of fish in the stream willallow citizens a way to appraise their stream and begin to develop a sense of itscondition and will help to develop the sense of pride.
The conditions of the upper watershed appears to be relatively good asmeasured by the response to the 1987 fire, current road condition, slopefailures, and stream condition. However, there are few older aged stands thatmay provide refuge for old-growth associated species. Large areas near thereservoir are in 20-year old stands as a result of the fire and riparian forests areof younger ages and have fewer streamside conifers. Rickreall Creek appears tohave somewhat lower summer flows and higher winter flows than the nearbyLittle Luckiamute River. The summer flows are enhanced by reservoir released.High winter flows may be related to the large areas of young stands in the rain-on-snow zone. There appears to be a high density of roads, but for the mostpart, they appeared to be in good condition. Some culverts on tributaries below

Rickreall Watershed Assessment: Summary 4
the reservoir appeared to be fish barriers at low flows and may also be barriers athigh flow. RECOMMENDATIONS: Engage landowners in the upper watershedto discuss with the council their management plans and specific issues that theyface. Begin discussions regarding the positive and negative consequences ofopening the watershed to greater public access.
Alteration of historic habitat conditions is pervasive with development andoccurs in the Rickreall as throughout the Willamette Valley. As many aseight vertebrate species have locally disappeared from the Willamette Valley inthe last 200 years (grizzly bear, lynx, wolf, white-tailed deer, California condor,black-crowned night heron and yellow-billed cuckcoo, and spotted frog). Whilethere probably hasn’t been an area anywhere where species have notdisappeared following rapid changes in settlement or development, the situationin the Willamette Valley should be viewed more as the “tip of the iceberg.”Christmas bird counts indicate declines in several species including the Oregonstate bird, the meadowlark. Several other additional species in the watershedwill face mounting pressures from landuse changes. Conservation andmanagement of habitat is the best way to help stop species loss. The historiclandscape vegetation patterns of the Willamette Valley had been established byperiodic burning by indigenous people that had occupied the area for at leastseveral thousand years. This disturbance pattern was likely important for the“baseline” or historic condition of a number of watershed elements such asvegetation communities and the abundance and distribution of animals.Cessation of burning and introduction of agriculture resulted in decline of severalvegetation types such as prairies, oak savannas, and wetlands. These habitatsare being replaced with other habitats such as croplands, pastures, second-growth conifer forest, roadsides, rural homesites, and urban communities. Thesechanges in habitat are a non-intentional result of a need to develop and respondto a regional economy beyond the boundaries of the Rickreall watershed. Thehabitat in the Willamette Valley may be still considered relatively intact.Development in many instances can proceed along with habitat preservation.RECOMMENDATION: Become aware of critical habitat. Attempt to assess lossof habitat. Assess species changes. Consider low budget monitoring programssuch as a Christmas bird count or road surveys. Engage ODFW non-gamespecialists to talk to the Council. Encourage County and agriculture orientedagencies and groups to consider adopting policies and practices that help toprevent loss of habitat in rural areas. Wetland, prairie, and oak savannarestoration projects may be attempted. Work with City of Dallas regarding plansto acquire and develop a greenway along Rickreall Creek. Consider working withstreamside landowner regarding easements for a greenway. High priority areaswould be where people have easy access to the creek such as the area betweenDallas and Rickreall.

Rickreall Watershed Assessment: Characterization 5
Chapter 1 : WATERSHED CHARACTERIZATION
Character of Westslope WatershedsThe Rickreall is one of a group of five major watersheds that drain the west sideof the Willamette River basin. These “west-side” watersheds are quite differentfrom the “east-side” watersheds of the Willamette Basin with respect to geology,climate, valley forms, and even in settlement history and current land use. Thewest-side watersheds are underlain by large amounts of older geologicalformations of a sedimentary origin, whereas east-side watersheds havesignificant amounts of volcanic formations. Accordingly, west-side stream valleystend to be mature, with more downcutting and larger amounts of fine sedimentthan east-side valleys. West-side streams have greater variation in seasonalflow volumes as a result of little to no snow pack development. High winterstreamflows alternate with very low flows during dry summer months. Summerstream temperatures are higher in west-side streams. Compared to the moreevenly sloped east-side streams, the west-side streams tend to be very steep inthe headwaters and are very flat in the lower portions. With softer bedrock, fish-barrier falls are less frequent on west-side streams and the upper extent of fishuse is typically limited by increasing gradient. As significant areas of west-sidewatersheds lie within the floor of the Willamette Valley, the lower valleys tend tobe wide, of low gradient, and the stream channels tend to entrench into theirfloodplains. These difference in stream character leads to differences in fishassemblages. Spring chinook are not thought to have spawned in these streamsand steelhead use was much lower than that of eastside streams. Even humansettlement patterns were influenced by the more accessible, flatter ground of thewestern slopes, which were preferred travel routes by early settlers into thevalley. Compared to east-side watersheds, west-side watersheds have greateramounts of private land ownership, higher population density, and greaterportions of land are in agricultural use.
Character of the RickreallAs a watershed, the Rickreall at 98 square miles is relatively small compared tomajor drainages to the Willamette River, but it is as diverse as many largerwatersheds. This high diversity in a relatively small area is due to the narrow andlong shape of the watershed that stretches from the Willamette River up to thecrest of the Coast Range, a distance of over 25 miles with an elevation change of3,500-feet (Map 1-1 shows the watershed location within Polk County).
The City of Dallas is located nearly in the center of the watershed and marks thetransition between the “upper” portion and “lower” portion of the watershed.Dallas is located at what is referred to as River Mile 16 (River Miles represent thedistance along the stream starting at the mouth of Rickreall, which is River Mile0). Above Dallas, the north-south width of the watershed is no more than fourmiles and as narrow as two miles. The elevation ranges from 300 feet above sealevel in Dallas to nearly 3,600 feet at the top of Laurel Mountain, the highest pointin the watershed. As a result of this relatively rapid change in elevation,

Rickreall Watershed Assessment: Characterization 6
headwater tributaries are steep in somewhat narrow valleys, and have cool waterflowing over cobbles and boulders that support native trout and other cool-wateraquatic species.
At about the center of the upper watershed, at River Mile 26, Rickreall Creek isimpounded by an earthen dam. This dam creates Mercer Reservoir, a 60-acremunicipal water supply for the city of Dallas. Downstream of Mercer Reservoir,summer flow in Rickreall Creek increase as a result of release water from thereservoir and additional flow from several large tributaries. Approximately half ofthe increased summer flow released from Mercer Reservoir is diverted from thenatural channel at River Mile 20 and travels through the municipal water systemof the City of Dallas. The remaining water in the creek continues on and alsoflows through Dallas and on into the eastern or lower portion of the watershed.
The eastern or lower portion of the watershed is much flatter and the watershedwidens to ten miles as it spreads out onto the broad Willamette Valley floor.Rickreall Creek regains some of its diverted flow at River Mile 9 where themunicipal wastewater treatment plant has its outfall. Below here to theconfluence with the Willamette River, Rickreall Creek receives little additionalsummer contributions from tributaries. The stream decreases in energy due tothe reduced gradient and it begins to meander, flow more slowly, and warms intemperature. The channel is relatively entrenched or constrained between highbanks or terraces where it has cut down into floodplain deposits. Cold-water fishgive way to warm water species and forests give way to open landscapes now inagriculture. This variation across the landscape from west to east is evidentnearly in every aspect of the watershed—such as the geology and soils, climate,vegetation, landscape morphology, human settlement patterns, and land use.
Distinct Areas within the WatershedFrom a land-use perspective, the Rickreall Creek Watershed may be consideredas having three distinct areas: an upland forest area in the west, an urban area inthe middle, and a valley agriculture area in the east. These contrasting land usesare readily evident in Map 1-2, a composite aerial photo of the watershed. Eacharea has its own set of conservation issues and demands that are being made onthem by the landowners and the public.
The upland forest was originally mature conifer forests intermixed with youngerforests created by natural disturbances such as fire and windstorms. The hillslopes are relatively steep, even for the Coast Range, due to the larger amountsof basalt geology, which resists weathering, compared to the sandstonesedimentary common to other areas of the Coast Range. The upland forest areais now largely in private industrial forest ownerships with lesser amounts infederal. There are relatively few private holdings. The vegetation today is a mixof second growth forests with scattered recently harvested units and almost noold-growth stands. Several areas of natural grass balds occur on the south-facing slopes near the ridge tops as shown in Photo 1-1.

Rickreall Watershed Assessment: Characterization 7
Photo 1-1: The upper watershed is a mix of recently harvested stands and second growthforests. Some grassy balds exist on south facing slopes as in this foreground. This view istowards the southwest from the mouth of Rockhouse Cave, above Rockhouse Creek. MercerReservoir lies off to the left of the photo; the farthest horizon is Fanno Ridge beyond thesouthern boundary of Rickreall watershed.
Photo 1-2: Lower Rickreall Creek at Villwoks Dam, a concrete ford over the stream at River Mile7.5. The lower section of the Rickreall is characterized by a channel of low gradient that issomewhat entrenched. The riparian zones are narrow but well developed with maturehardwoods. Land-use along this section is agriculture beyond the riparian zone.
Rickreall Watershed Assessment: Characterization 8
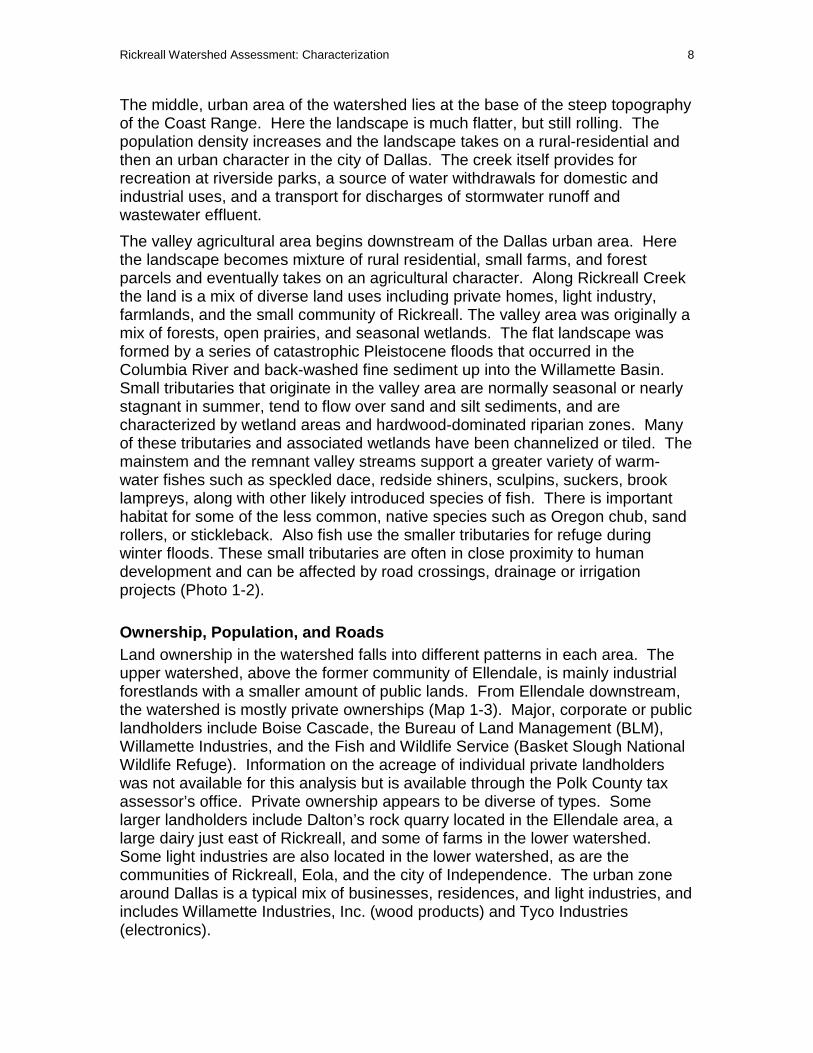
The middle, urban area of the watershed lies at the base of the steep topographyof the Coast Range. Here the landscape is much flatter, but still rolling. Thepopulation density increases and the landscape takes on a rural-residential andthen an urban character in the city of Dallas. The creek itself provides forrecreation at riverside parks, a source of water withdrawals for domestic andindustrial uses, and a transport for discharges of stormwater runoff andwastewater effluent.
The valley agricultural area begins downstream of the Dallas urban area. Herethe landscape becomes mixture of rural residential, small farms, and forestparcels and eventually takes on an agricultural character. Along Rickreall Creekthe land is a mix of diverse land uses including private homes, light industry,farmlands, and the small community of Rickreall. The valley area was originally amix of forests, open prairies, and seasonal wetlands. The flat landscape wasformed by a series of catastrophic Pleistocene floods that occurred in theColumbia River and back-washed fine sediment up into the Willamette Basin.Small tributaries that originate in the valley area are normally seasonal or nearlystagnant in summer, tend to flow over sand and silt sediments, and arecharacterized by wetland areas and hardwood-dominated riparian zones. Manyof these tributaries and associated wetlands have been channelized or tiled. Themainstem and the remnant valley streams support a greater variety of warm-water fishes such as speckled dace, redside shiners, sculpins, suckers, brooklampreys, along with other likely introduced species of fish. There is importanthabitat for some of the less common, native species such as Oregon chub, sandrollers, or stickleback. Also fish use the smaller tributaries for refuge duringwinter floods. These small tributaries are often in close proximity to humandevelopment and can be affected by road crossings, drainage or irrigationprojects (Photo 1-2).
Ownership, Population, and RoadsLand ownership in the watershed falls into different patterns in each area. Theupper watershed, above the former community of Ellendale, is mainly industrialforestlands with a smaller amount of public lands. From Ellendale downstream,the watershed is mostly private ownerships (Map 1-3). Major, corporate or publiclandholders include Boise Cascade, the Bureau of Land Management (BLM),Willamette Industries, and the Fish and Wildlife Service (Basket Slough NationalWildlife Refuge). Information on the acreage of individual private landholderswas not available for this analysis but is available through the Polk County taxassessor’s office. Private ownership appears to be diverse of types. Somelarger landholders include Dalton’s rock quarry located in the Ellendale area, alarge dairy just east of Rickreall, and some of farms in the lower watershed.Some light industries are also located in the lower watershed, as are thecommunities of Rickreall, Eola, and the city of Independence. The urban zonearound Dallas is a typical mix of businesses, residences, and light industries, andincludes Willamette Industries, Inc. (wood products) and Tyco Industries(electronics).
Rickreall Watershed Assessment: Characterization 9
The population density of the watershed shows development has beenconcentrated in the Dallas urban area and also downstream along RickreallCreek (Map 1-4). The pattern likely reflects a shift from rural and farm-associated holdings to non-farm residences and developments as more peopleseek rural settings for homesites. This shift has been slowed by state land-uselaws that are effective at controlling growth into lands zoned for agriculture andforestry and also by local Dallas City ordinances that allow only 129 buildingpermits for new residences to be issued annually.
Roads are shown in Map 1-3. Dallas shows a network of streets. The lowerwatershed shows the main highways, smaller paved roads and a series of gravelroads. The upper watershed shows a network of gravel roads that largely servethe management of the timberlands. Not all of the road system is shown for thewatershed. Other maps of the upper watershed indicate that Map 1-3 showsapproximately half the existing roads. Roads not shown are smaller spur roads.
Geology and LandformsThe highest peaks on the western divide are mafic igneous intrusive rocks ofgabbro and diorite that cut through the sedimentary rocks of the YamhillFormation. However, most of the upper watershed are steeply sloping SiletzRiver volcanics (Map 6-1). Moving downstream toward the foothills, the creekscut through sedimentary rocks of the Yamhill Formation, which also rim thesouthern divide between the Rickreall and the Little Luckiamute. Beginning justabove Dallas the creek enters the old alluvial and lacustrine terraces of theWillamette Valley floor mixed with Rickreall deposits from upstream. Thedrainage divide that separates Rickreall from Ash Creek to the south is barelyperceptible on the nearly level terraces. In the east part of the watershed, theterrace escarpment above the Willamette bottomlands is closely followed byHighway 51 which passes north out of Independence. Rickreall Creek enters themodern floodplain of the Willamette River just to the east of the Highway 51bridge. In the far northeast, the watershed divide is formed by the Eola Hills,which are sedimentary layers capped by Grande Rhonde basalt and ColumbiaRiver basalt.
The rocks of the northern Coast Range, which includes the upland areas of theRickreall watershed, have at their core the Eocene Siletz River basalts, which arethick pillow basalts extruded from the sea floor. These volcanic rocks were partof an ancient island chain that collided with the North American Continent. Abasin formed between these seamounts and the continent and it filled withsediments. The silts, sands, muds and volcanic debris of the Yamhill Formationwere deposited over the Siletz River Basalts in the shallow Eocene sea. Thesedeposits were in turn covered over with the sedimentary deposits of the Nestuccaand Spencer Formations. This sea floor was then uplifted as the Coast Range.
The lacustrine and alluvial deposits of the Willamette Valley terraces andfloodplains are Quaternary-aged, and include old valley alluvium, sediments fromrepeated Missoula Flood events during the late Pleistocene, and recentfloodplain deposits. Floodplains and terraces rise stepwise from the Willamette
Rickreall Watershed Assessment: Characterization 10
River and its tributaries towards the foothills. These stepwise deposits correlatewith geomorphic surfaces with distinctive morphologies and soils (Baldwin 1976).
The relief of the watershed and the longitudinal profile of Rickreall Creek upthrough the South Fork are shown in Map 1-5. Most of the eastern portion isgenerally of low elevation (120 to 250 feet) and flat to rolling. The Eola Hillsfringe the northeast edges of the watershed and rise to 1000-feet elevations.The watershed slowly and gradually rises in elevation towards the west until justpast Dallas. Above Dallas, the streams have cut steeper valleys into the CoastRange. The ridges rise to 3600 feet at Laurel Mountain, Riley Peak and severalother unnamed prominences along the ridges. Rickreall Creek channel climbsslowly and continuously and then increases in its rate of climb into theheadwaters of the South Fork. Had the profile been performed on theheadwaters of Rickreall Creek proper in the northwest portion of the watershed, itmay have shown a steep rise to Silver Falls then a flattening above.
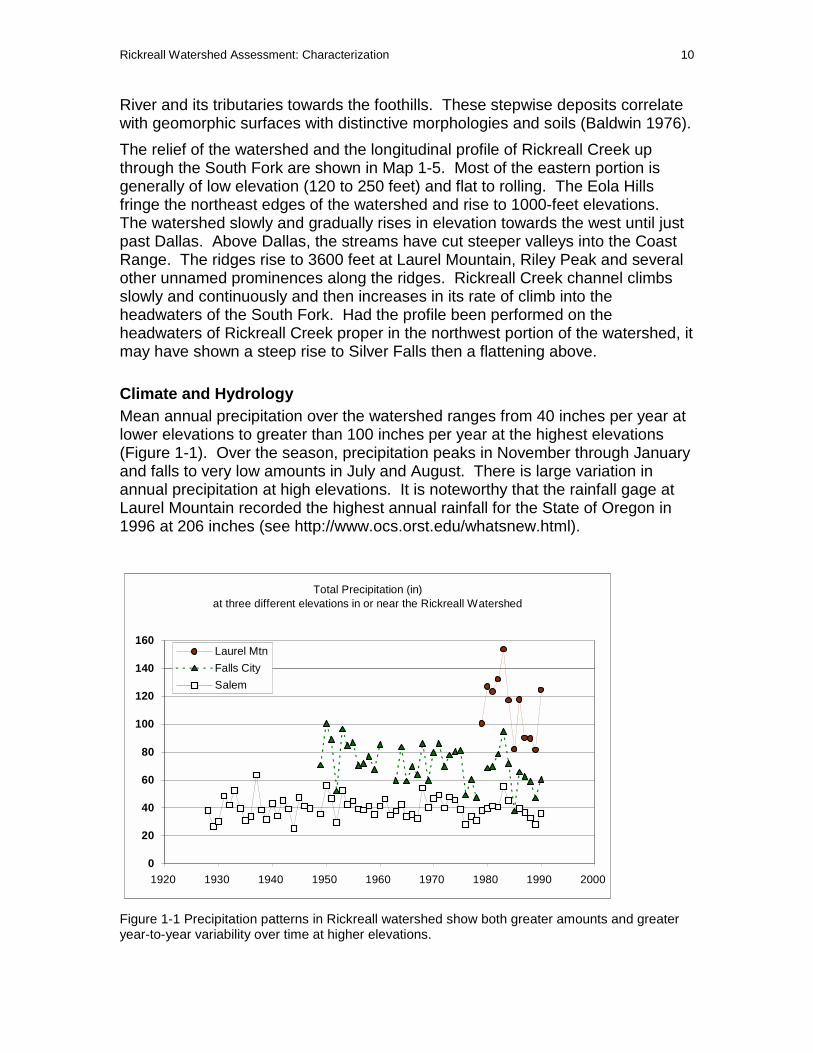
Climate and HydrologyMean annual precipitation over the watershed ranges from 40 inches per year atlower elevations to greater than 100 inches per year at the highest elevations(Figure 1-1). Over the season, precipitation peaks in November through Januaryand falls to very low amounts in July and August. There is large variation inannual precipitation at high elevations. It is noteworthy that the rainfall gage atLaurel Mountain recorded the highest annual rainfall for the State of Oregon in1996 at 206 inches (see http://www.ocs.orst.edu/whatsnew.html).
Total Precipitation (in) at three different elevations in or near the Rickreall Watershed
0
20
40
60
80
100
120
140
160
1920 1930 1940 1950 1960 1970 1980 1990 2000
Laurel Mtn
Falls City
Salem
Figure 1-1 Precipitation patterns in Rickreall watershed show both greater amounts and greateryear-to-year variability over time at higher elevations.

Rickreall Watershed Assessment: Characterization 11
Average of maximum daily temp (F) during month of Julythree different elevations in or near the Rickreall Watershed
55
60
65
70
75
80
85
90
95
1920 1930 1940 1950 1960 1970 1980 1990 2000
Salem
Falls City
Laurel Mtn
Average of minimum daily temp (F) during month of January three different elevations in or near the Rickreall W atershed
15
20
25
30
35
40
45
1920 1930 1940 1950 1960 1970 1980 1990 2000
Salem
Falls City
Laurel Mtn
Figure 1-2: Mean maximum daily air temperatures during the month of July (top) and meanminimum daily temperatures during January (bottom) in the Rickreall watershed. There is astrong elevational effect for mean July maximum temperatures but not for mean January
Summer daily high temperature data also show a trend with elevation for thesesame sites. Maximum daily temperatures in July average 85 F in Salem andaverage 65 F at Laurel Mountain. Minimum daily temperatures in January

Rickreall Watershed Assessment: Characterization 12
average just above freezing in Salem and average slightly below freezing atLaurel Mountain. These winter daily minimum temperatures show little variationwith elevation (Figure 1-2). More pronounced is the year-to-year variation inJanuary minimum temperatures. For example in Salem, the means of dailyminimum temperatures during January have varied from a low of 19 F (1930) to ahigh of 41 F (1953).
Stream discharge records are available for five stations in the Rickreall Creekwatershed, however only two have records of over one year. These data areavailable via the Internet from the USGS webpage(http://waterdata.usgs.gov/nwis-w/OR/).
Data from these two stations provide a description of the stream flow from twopoints in the watershed (Figure 1-3). The Rickreall Creek discharge suggests adrainage area that is relatively large and steep, with high peak flows in the winterand an extended period of baseflow into the spring. Analysis of the dischargeaveraged by month over the period of record shows discharge peaking inJanuary, while precipitation peaks in December (c.f. annual hydrograph, Figure4-2 in Chapter 4). This lag between precipitation and discharge peaks resultsfrom a combination of saturated soils during the winter season and contributionfrom snowmelt. These factors delay the runoff peak and extend high flows intoFebruary. The period of low flow, primarily from July through October, reflectlack of precipitation and baseflow is largely groundwater discharge. This low flowdischarge is important for its effects on water quality, agricultural use, and fishpopulations.

Rickreall Watershed Assessment: Characterization 13
Rickreall gage data at Dallas (RM 20)
0
1000
2000
3000
4000
5000
6000
10/1
/57
10/1
/58
10/1
/59
10/1
/60
10/1
/61
10/1
/62
10/1
/63
10/1
/64
10/1
/65
10/1
/66
10/1
/67
10/1
/68
10/1
/69
10/1
/70
10/1
/71
10/1
/72
10/1
/73
10/1
/74
10/1
/75
10/1
/76
10/1
/77
10/1
/78
Dis
char
ge
cfs
Rickreall gage data at Rickreall (RM 9)
0
1000
2000
3000
4000
5000
6000
10/1
/64
10/1
/65
10/1
/66
10/1
/67
10/1
/68
10/1
/69
10/1
/70
10/1
/71
10/1
/72
10/1
/73
10/1
/74
10/1
/75
10/1
/76
10/1
/77
10/1
/78
10/1
/79
10/1
/80
10/1
/81
10/1
/82
10/1
/83
10/1
/84
Dis
char
ge
cfs
Figure 1-3: Rickreall stream discharge at USGS Dallas gaging station located just below themunicipal water intake (top) and at USGS Rickreall gaging station located just above the Highway99 bridge in Rickreall (bottom). The Rickreall station did not record the flood flow of 1964.

Rickreall Watershed Assessment: Characterization 14
Map 1-1: Location of the Rickreall watershed in Polk County.

Rickreall Watershed Assessment: Watershed Characterization 15
Map 1-2: 1994 orthophoto of the watershed showing landuse patterns.
0 1 mi le
2 0 2 4 6 8 10 12 14 Miles
N
EW
S
1994 Orthophotos of Mid and Lower Rickreall Watershed
#
Dallas
#
Rickreall
#
Monmouth /Independence
#
Mercer Reservoir
#
Rockhouse Creekand 1987 burn area
#
Eola Hills
#
Baskett Slough NWR

Rickreall Watershed Assessment: Watershed Characterization 16
Map 1-3: Land ownership and main roads in Rickreall watershed. Shown are public lands and industrialforest ownership; private ownership in the lower watershed is not broken out by owner here. Roads shownare main roads; additional spur roads exist in upper and lower watersheds. Not all streets in Dallas areshown.
Rickreall Watershed Assessment: Watershed Characterization 17
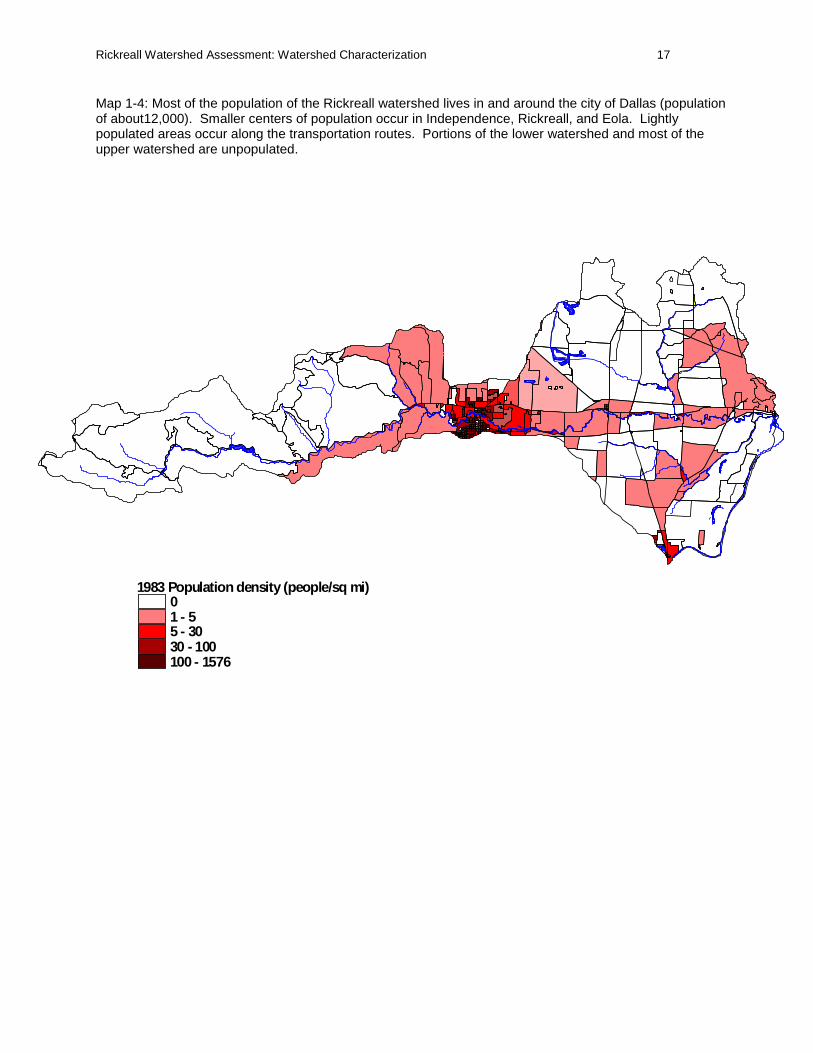
Map 1-4: Most of the population of the Rickreall watershed lives in and around the city of Dallas (populationof about12,000). Smaller centers of population occur in Independence, Rickreall, and Eola. Lightlypopulated areas occur along the transportation routes. Portions of the lower watershed and most of theupper watershed are unpopulated.
1983 Population density (people/sq mi)01 - 55 - 3030 - 100100 - 1576

Rickreall Watershed Assessment: Watershed Characterization 18
Map 1-5: Stream profile of Rickreall Creek. Shown are River Mile locations and locations of features in thewatershed. The graph shows elevations of Rickreall Creek as a function of River Mile measured along thecreek length upstream from the mouth.
#####
####
#
#####
##
##
##
##
###
##
##
#
3500
3000
2500
2000
1500
1000
500
035 33 31 29 27 25 23 21 19 17 15 13 11 9 7 5 3 1
500 ft contour100 ft contourStreams
# River mile
350 0300 0250 0200 0150 0100 050003533312927252321191715131197531
Profile of the Rickreall Creek
#
BaskettSlough
#
Dallas
#
Rickreall
#
Water intake
#
Top of the ridge
#
MercerReservoir
#
Mouth

Rickreall Watershed Assessment: Watershed Characterization 19
Map 1-6 Geology.
5 0 5 MilesN
EW
S
Dallas
Independence
Rickreall#
Ptype Acres % Area
Tsr 18092 28
Qs 16061 25
Qt 8856 14
Ty 6208 10
Qal 6151 10
Tsd 4230 7
Tcg 2201 3
Ti 1145 2
OW 825 1
Qls 299 0
Tc 103 0
Tsm 20 0
GeologyTsr Siletz River volcanicsQs Sedimentary depositsQt Terrace and fan depositsTy Yamhill FormationQal Alluvial depositsTsd Sedimentary Tcg Grande Rhonde basaltTi Mafic intrusionsOWQls Landslide depositsTc Columbia River basaltTsm Sedimentary marine
Ric_faults
Geology 1:500K from Salem BLM Willamette North Coast PIEC

Rickreall Watershed Assessment: Historical Conditions 20
Chapter 2 : HISTORICAL CONDIT IONS
The historical record is summarized here to provide insights into what the arealooked like at the time of Euro-American exploration and settlement and to gainan understanding of how human uses have modified the watershed through time.
For the purpose of this analysis, the history of the Rickreall Creek watershed isdivided into three periods: the Kalapuyan landscape, the American pioneers, andthe transition to modern times (Table 2-1). Watershed conditions during each ofthese historical periods are described based on evidence from written and verbalfirst-hand accounts of explorers and watershed residents, resource inventories,maps, drawings, and photographs.
pre-Columbian–1845 Kalapuyan landscape
1846–1879 American pioneers
1880–1940 Transition to modern times
These historical periods set the context for the current conditions in the Rickreallwatershed. By World War II, many of the land use activities and other trendswere established.
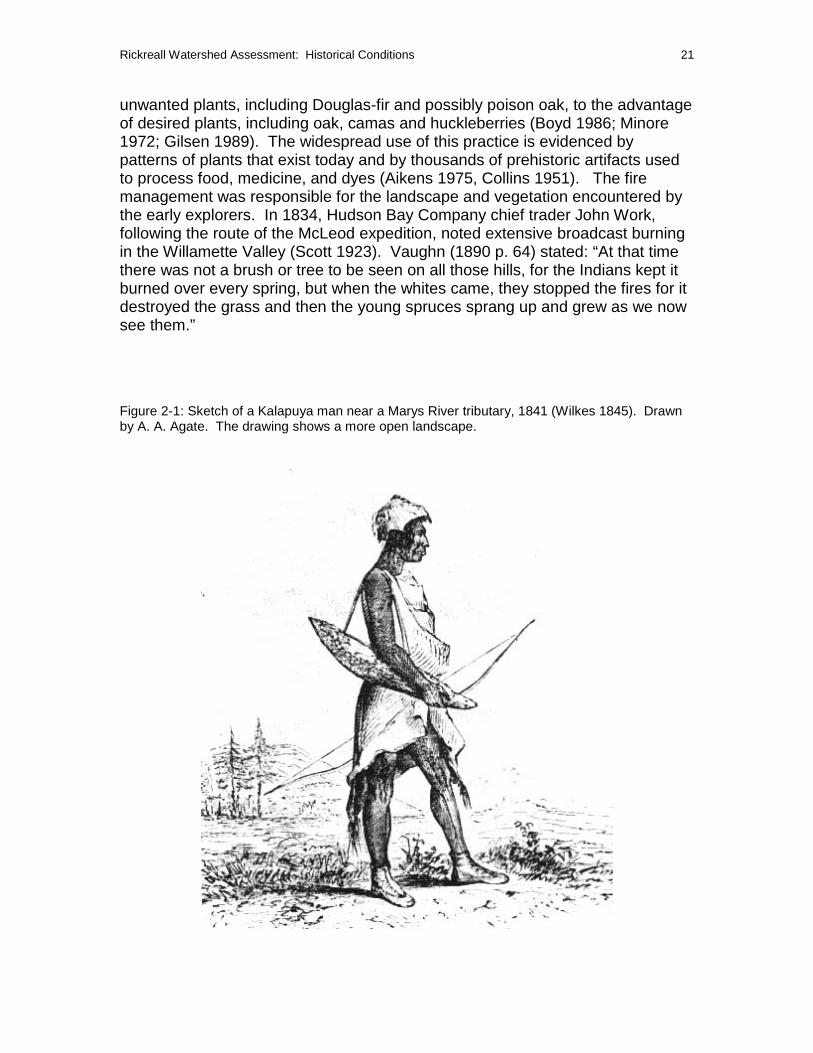
The Kalapuyan Landscape: pre-Columbian–1845The indigenous people in the Rickreall Creek watershed and surrounding area atthe time of Euro-American contact called themselves the Kalapuya. It is thoughtthat the Kalapuya lived in the Willamette Valley prior to Euro-American contactfor several thousand years. Technologies such as roasting of filberts and camasused by these people are thought to be at least 9000 years old (Minor andToepel 1991, Reckendorf and Parsons 1966). At the time of the Lewis and Clarkexpedition in 1805-1806, at least six nations of Native Americans, estimated at10,000-12,000 individuals total, lived in the valley (Boyd 1986). By 1841, only400 or so Kalapuya survived in the Willamette Valley, with much of thepopulation before this period decimated by waves of small pox in 1782 andmalaria in 1830. The first recorded history of the Kalapuya was on October 4,1826. In the approximate area of Berry Creek, in southern Polk County, theMcLeod expedition noted a group of Kalapuya digging roots (Davies 1961). Oneof the few known sketches of a Kalapuyan and the landscape at the time of Euro-American arrival is shown in Figure 2-1.
Evidence shows that the Kalapuya practiced active resource managementthrough the periodic setting of fires (Boyd 1986). The use of fire for vegetationmanagement has been termed "pyroculture" (Gilsen 1989). This processinvolved periodic broadcast burning over large areas of the landscape to control
Table 2-1: Periods of social and institutional changes in the Rickreall Creek watershed.
Rickreall Watershed Assessment: Historical Conditions 21
unwanted plants, including Douglas-fir and possibly poison oak, to the advantageof desired plants, including oak, camas and huckleberries (Boyd 1986; Minore1972; Gilsen 1989). The widespread use of this practice is evidenced bypatterns of plants that exist today and by thousands of prehistoric artifacts usedto process food, medicine, and dyes (Aikens 1975, Collins 1951). The firemanagement was responsible for the landscape and vegetation encountered bythe early explorers. In 1834, Hudson Bay Company chief trader John Work,following the route of the McLeod expedition, noted extensive broadcast burningin the Willamette Valley (Scott 1923). Vaughn (1890 p. 64) stated: “At that timethere was not a brush or tree to be seen on all those hills, for the Indians kept itburned over every spring, but when the whites came, they stopped the fires for itdestroyed the grass and then the young spruces sprang up and grew as we nowsee them.”
Figure 2-1: Sketch of a Kalapuya man near a Marys River tributary, 1841 (Wilkes 1845). Drawnby A. A. Agate. The drawing shows a more open landscape.

Rickreall Watershed Assessment: Historical Conditions 22
The arrival of Euro-Americans proved to be a disaster for the Native Americaninhabitants of the Willamette Valley. Decimated by disease, their resource basebeing co-opted, and in cultural conflict with their new neighbors, the Kalapuya,Umpqua, and Takelma were removed by the United States government to theGrand Ronde Reservation near the present town of Willamina in 1855.Anthropological information on these people was gathered late and waspiecemeal (see Zenk 1976, cited in Boyd 1986). A project is currently underwayto collect databases of literature, documents, and data describing the NativeAmerican cultures of the Grand Ronde Tribes. As many as 9,000 documents,many unpublished have been collected. A database is to be available on laserfiche (June Olson, pers. comm. Cultural Resources, Grand Ronde Tribes 503-879-2249).
There exists numerous written accounts from early explorers and settlers thatprovide a glimpse of what the Willamette Valley and in specific instances, whatthe lower Rickreall Creek landscape looked like. These comments refer to openoak savannas, rich grassland prairies, wetlands, and trees along meanderingstreams. The upper watershed area was composed of coniferous forests whichwere yet unexploited.
The following are a series of narratives from the journals of James Clyman, anearly frontiersman who came to the Willamette Valley about 1845 and eventuallylead a group of pioneers south to California. Spelling and punctuation areuncorrected.
On the geography of the Yamhill Valley area:
...This vally is here not short of Fifty miles wide and perhaps one Hundred and Fiftyin length numerous Brooks and rivulets meander their way in various directionsthrough the vally from the neighbouring mountains on either side of the Willhametand when necessary can easily be converted into the means of driveing all kinds ofmchineery that can be found useful for a greate manufactureing communety.
On the local Government and land claims:
The Laws of Iowa have been adopted and a number of acts or Laws passed by theprovisional Legislature of oregon The claim Laws allow every man 640 acres theclaiman must build a cabbin on his claim within two months after his haveing takenpossession and must be a resident by himself or by Tenant his claim must besquare or oblong the [lines] running North and South and East and West if thenature of the country permit
On the animals of Oregon and Willamette Valley:
The seal is common on the coasts and in the bays and Rivers greate Quantitiesand greate verieties of water fowl is found in all parts of the The open country duringthe rainy season such as the Swan the crane goose Brant and innumerableQuantities of Ducks with the wood cock and Snipe...
The animals are Panthers several kins of wolves The Black the yallow grey andspotted all large and traublesome killing hogs cattle and even in some instanceshorses and mules The small Prarie wolf is likewise numerous I saw no foxes TheWild [cat?] is not numerous plenty of Elk are found in the mountains and deer in all

Rickreall Watershed Assessment: Historical Conditions 23
the Thickets waterfowl is plenty Beyond all conception in the rainy season all theLowlands being litterly covered the[y] all move to the north and east during themonths of April and May The Land Fowl are the Firr gous the Pheasant and Quailas likewise the medow lark which are found in greate abundanc on the open lands ...the Red brast wood pickers a sparrow are also seen The condor The Buzzard theRaven and crow with several speces of Hawks most of which are Plenty the Hawksfeed mostly on mice and moles both of which are numerous
several Kinds of squirrels are seen all of which Burrow in the earth and lie torpid inthe rainy season some lay up seed to lie on the other come out verry lean beingnothing but skin and bone
The quantity [of water] that pours from these mountains on either side in to theWilhamet vally is truly astonishing every 8 or 10 miles Brings you to a river andbrooks innumerable...
Comments Clyman made while passing through the Rickreall watershed, likelynear the future location of Dallas, in 1845:
May 25: It rained all night and the morning looked dark and Disagreeable five ofus packed up and started for the california rendavous about noon in commencedraining and rained all afternoon made 15 miles and encamped on the Applegatesettlement on the South branches of the yam hill I could not admire the Applegateselection although the soil is good But a portion of the country is a completemudhole and the settlement is inconveniently situated The hills as usual as beautifuland picturesque and in many places covered Belly deep to our horses in clover
May 26: A disagreeable rainy night left our encampment passed over a beautifulundulating country near the Killamook mountains [Coast Range] make about fourmiles and encamped on La Creole [Rickreall Creek] a handsome clear runningstream with fine rich prarie intervales on either side some settlements havecommenced to be made on this creek during the last winter and a mill is now inbuilding a few miles above our camp This La Creole or Rockreole is finely adaptedfor Hydraulic purposes as well as for agricultureal timber is however in manyplaces rather scarce
The following are some selected narratives of other early visitors regarding theWillamette Valley landscape:
1841 (Late Summer): The country in the southern part of the Willamette Valley,stretches out into wild prairie-ground, gradually rising in the distance into lowundulating hills, which are destitute of trees, except scattered oaks; these look morelike orchards of fruit trees, planted by the hand of man, than groves of naturalgrowth, and serve to relieve the eye from the yellow and scorched hue of the plains.The meandering of the streams may be readily followed by the growth of trees ontheir banks as far as the eye can see. (Wilkes, 1845).
Between the Lucky-mate [Luckiamute] and Mouse [Marys] River there is a range ofhills, as between other streams; but at one place a spur of the Coast Rangeapproaches within ten miles of the Willamette; from this issue many small streamswhich run down it, and through the fine plains to the Lucky-mate [Luckiamute] uponthe one side, and into Mouse [Marys] River on the other. This is a beautiful region;from the bottom can be seen, at different points, seven snow-covered peaks of theCascade Range. The Cascade is within view for a great distance, to the north andsouth; which, together with the beautiful scenery in the valley, renders it apicturesque place. Thrifty groves of fir and oak are to be seen in every direction; the

Rickreall Watershed Assessment: Historical Conditions 24
earth is carpeted with a covering of luxuriant grass, and fertilized by streams of clearrunning rivulets, some of which sink down and others pursue their course aboveground to the river. Between the forks of Mouse River approaches a part of theCascade [Coast range], but it leaves a valley up each branch about one mile inwidth, the soil of which is rich and good prairie for several miles above the junction.The mountain sides are covered heavily with timber. Thus these beautiful valleysoffer great inducements to those who wish to have claims of good land, with finegrounds for pasturage and timber close at hand. There are no claims made as yetabove the forks, These streams furnish good mill sites for each of the first six miles,and are well filled with trout. (Palmer 1845).
George Emmon’s journal speaks of a view in 1841 from what is probably theEola Hills looking south into the Rickreall watershed:
8/7/41...the Yamhills [Eola Hills]...are a little singular being the only hills of anymagnitude that rise from the great Walamat Valley—in an extent of Prairie from 60to [1]00 miles either way...from the top of these at an alt. of about 1000 feet—had agrand panorama view. ...prairie to the south as far as the view extends—the streamsbeing easily traced by a border of trees that grew up on either bank...white oakscattered about in all directions. (Boyd 1986).
It appears that at the time of early Euro-American settlement, most of the lowelevation Willamette Valley area was open grasslands with scatteredconcentrations of oaks in hilly areas, an environment which might be best termed“oak savanna” (Habeck 1961, cited in Boyd 1986).
The vegetation has been described by Boyd (1986) as a series ofmicroenvironments that included
1) Native grasslands with oak (Quercus garryanna) dispersed in concentrationsfree of underbrush—originally called “oak openings” by the early landsurveyors. Their occurrence and makeup depended on the availability ofwater. These have been the severely altered by introduced exotics and thecessation of burning.
2) Marshy areas or wetlands that occurred in low lying areas such as aroundshallow lakes (that were later drained) or in small drainages to rivers called“swells.” These were important areas for the camas (Comas quash), wapiti(Sagittarius latifolia), a wild onion (Allium spp.)—important food sources toKalapuya.
3) Deciduous forests composed chiefly of ash (Fraxinus latifolia) and alder(Alnus rubra) formed in the narrow corridors along the waterways. The wintervillages of the Kalapuya are thought to have been located in this zone.
4) Dense conifer forests dominated by Douglas-fir (Pseudotsuga menziesii)were found at higher elevations of the surrounding mountains.
At the time of Euro-American settlement, grizzly bears, white-tailed deer,California condors, lamprey eels, Willamette chub, wolverines, cougar, wolves,elk are thought to have inhabited the watersheds on the west side of theWillamette River (Storm 1941). David Douglas performed the first technicaldescriptions of plant species in the Pacific Northwest. His journal includesdescriptions of his travels with the McLeod expedition through the Willamette

Rickreall Watershed Assessment: Historical Conditions 25
Valley during September 1826 (Douglas 1959). There (pp. 213-200), hedescribes the landscape as undulating with scattered oaks and pines, that largeportions of the grass had been burned, that small streams were common and attimes were located in deep ravines that were difficult to cross, and that deer wereeasily shot daily for meals. He notes herds of elk, and several encounters withgrizzly bears and describes an incident where one member of the party wasattacked by a grizzly and escaped by climbing a tree. This attack probablyoccurred somewhere near the lower Rickreall watershed.
American Pioneers: 1846–1879An important element that determined the relatively early settlement of PolkCounty was that the west side tributaries to the Willamette River were easier toford and therefore provided the best travel routes south into the valley. Earlysettlers came into the Willamette Valley from Fort Vancouver (near present dayPortland) along the California Trail or Hudson’s Bay trapper trail. The historictrail is thought to be along or near present day Perrydale Road to the cemeterythen along the Kings Valley highway (from video recording of presentation byArlie Holt to the Rickreall Watershed Council, November 17, 1997). The fordsover the rivers were apparently carefully located to provide safe crossing and notrandomly situated. The ford over the Rickreall may have been one of thereasons that the present city of Dallas is located fifteen miles from the WillametteRiver. Location along the Willamette River would have been the obviousstrategic transportation location. However, Dallas has also benefited from itscentral location in the county—being on the edge of both agriculture and timberareas. Being so far up into the watershed, the continued existence of Dallas islinked to the flows of Rickreall Creek and arguably, also, to nearby Ash Creek.
The southern Willamette Valley, with its open prairies, good soil and abundantwater, was an attractive area for settlement. Settlement appears to haveoccurred rapidly beginning as early as 1844 in the Dallas area. Polk County wascreated from Yamhill District in 1845 and in 1850, Dallas (originally calledCynthian) was established as the county seat. Various small industries soonsprang up. The first mill to be established in Polk County was a gristmill atEllendale Creek in the late 1840s. It is notable that, as there were no other gristmills south of here, wheat was packed by mules to the mill from as far away asSutter’s Mill in California. Other mills were soon established nearby. AtEllendale, a sawmill was established in1854, a woolen mill in 1865, and this wasfollowed by a whisky distillery. A second gristmill was moved to the communityof Rickreall from Falls City in 1865. A diversion dam was built near the upperend of Dallas’ city park in 1857 and was used to supply a millrace until 1930.Mills and industry were established in Dallas and included a second woolen millin 1896, additional sawmills in the 1890’s, and a flourmill that operated until the1920’s. It is notable that the Muir and McDonald Tannery which was establishedin Dallas on Rickreall Creek in 1863 is still in operation today. Many of thesemills had small dams in the creek and also contributed to the growth of the Dallasand to the settlement of the county. Population growth since 1910 is shown in
Rickreall Watershed Assessment: Historical Conditions 26
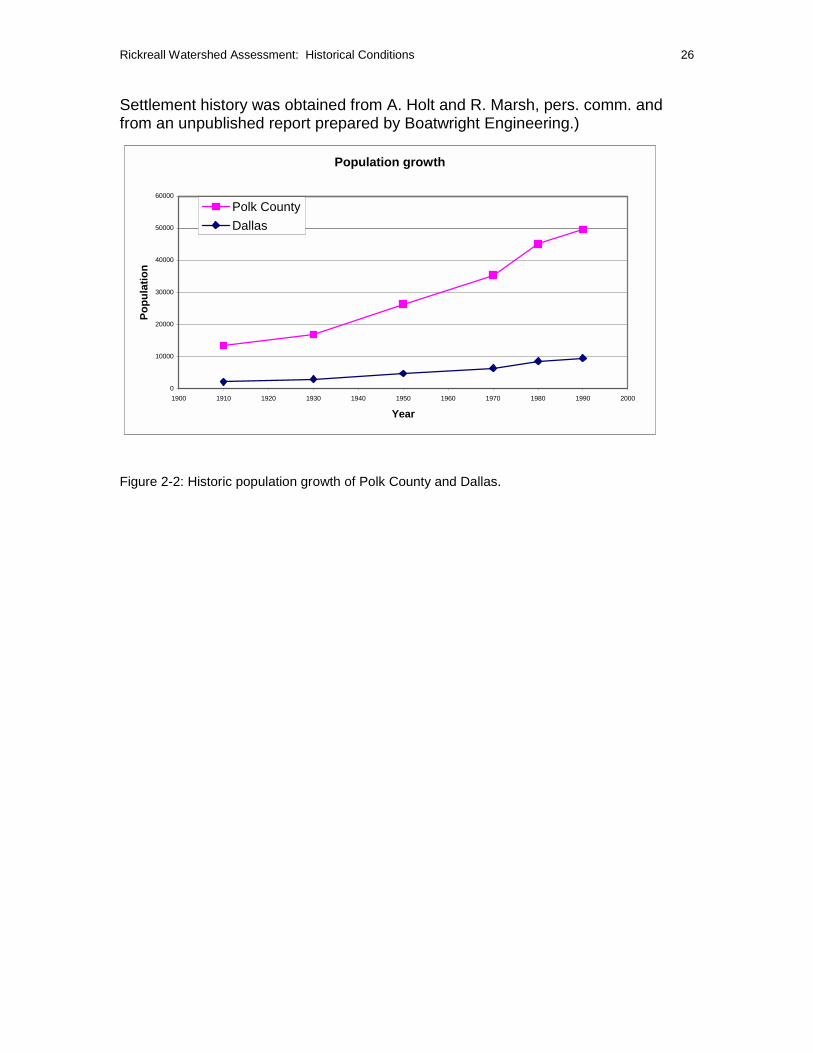
Settlement history was obtained from A. Holt and R. Marsh, pers. comm. andfrom an unpublished report prepared by Boatwright Engineering.)
Population growth
0
10000
20000
30000
40000
50000
60000
1900 1910 1920 1930 1940 1950 1960 1970 1980 1990 2000
Year
Po
pu
lati
on
Polk County
Dallas
Figure 2-2: Historic population growth of Polk County and Dallas.

Rickreall Watershed Assessment: Historical Conditions 27
The General Land Office of the United States surveyed the landbase of much ofthe western United States during the 1850’s (typically available at the CountyOffices or at the BLM offices in Salem and Eugene). These surveys provide anexcellent historical record of the landscape at the time of settlement. Thesurveyors’ notes contain information about a number of historical features, whichcan be used to reconstruct roads and homesteads, vegetation patterns, streamchannels and other features. A copy of the 1853 GLO survey for a portion of thelower Rickreall Creek watershed including Dallas, Township 7 South, Range 5West, is shown in Figure 2-3. This map shows the Polk County courthouse onthe north side of Rickreall Creek, the main road from Marysville (now Corvallis) toPortland, and a scattering of land claims with names of claimants. The site of theMarysville-Portland road corresponds nearly to what is mapped as a ford on theUSGS 7.5 minute Dallas map. This ford is located about one mile upstream ofthe current bridges in Dallas and may be the original ford of the California Trail.Also visible on the 1853 GLO map are hills, drainages, prairies, wetlands, andshallow lakes. The historic vegetation thought to exist in 1851 is portrayed in aGIS layer created the by the Oregon Natural Heritage Program (ONHP) and theOregon Department of Fish and Wildlife (ODFW) and is shown Chapter 5 (Map5-3).
Transition to Modern Times: 1880–1940Logging activities were moving into the upper watershed following the settlementperiod of the county and began to increase by the turn of the century. By 1890,logging occurred at least up to River Mile 26 (present day Mercer Reservoir). Thecreek was used to float logs to mills first in Ellendale then in Dallas and as aresult, was classed as “navigable waters” (Farnell 1979). The first sawmill wasbuilt near present day Ellendale about the mid-1850’s later mills were built inDallas near the turn of the century. Smaller logs were floated downstream to theEllendale mill using water of winter freshets for a period of at least 45 years. Atleast three splashdams were built along Rickreall Creek above River Mile 26 toaid the log drives of larger logs to the Dallas mills. (Dallas resident, GaryJohnson 623-2105 reportedly has copies of photographs taken of thesplashdams in 1896. Copies are also reproduced in Farnell 1979.) Logs weredriven down from the headwaters of Rickreall Creek and from Laurel Creek for atleast a decade. A local journal, the Pacific Coast Wood and Iron, reported thatas many as 5 million board feet of logs were in the river in February of 1901. InJanuary of 1906, one company had reportedly drove 6 million board feet oftimber in the Rickreall. By this time, railroads were beginning to be used totransport logs through Falls City to mills in Dallas and the practice of usingsplashdams was ended in Oregon soon afterwards by lawsuit.
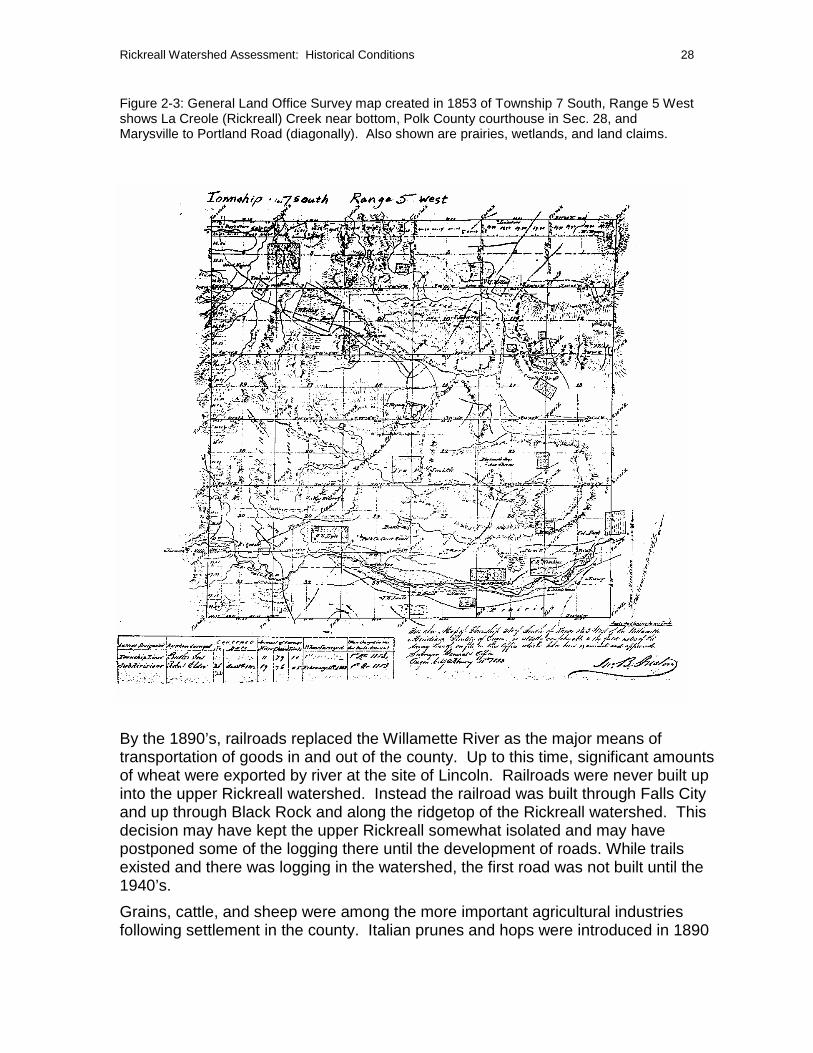
Rickreall Watershed Assessment: Historical Conditions 28
Figure 2-3: General Land Office Survey map created in 1853 of Township 7 South, Range 5 Westshows La Creole (Rickreall) Creek near bottom, Polk County courthouse in Sec. 28, andMarysville to Portland Road (diagonally). Also shown are prairies, wetlands, and land claims.
By the 1890’s, railroads replaced the Willamette River as the major means oftransportation of goods in and out of the county. Up to this time, significant amountsof wheat were exported by river at the site of Lincoln. Railroads were never built upinto the upper Rickreall watershed. Instead the railroad was built through Falls Cityand up through Black Rock and along the ridgetop of the Rickreall watershed. Thisdecision may have kept the upper Rickreall somewhat isolated and may havepostponed some of the logging there until the development of roads. While trailsexisted and there was logging in the watershed, the first road was not built until the1940’s.
Grains, cattle, and sheep were among the more important agricultural industriesfollowing settlement in the county. Italian prunes and hops were introduced in 1890

Rickreall Watershed Assessment: Historical Conditions 29
and were widely planted. Prunes declined after World War I when European orchardsincreased their supply to the European market. Hops declined after World War II.Since then, agriculture shifted first toward grains and then more recently to grass seedwith greater diversification into specialty crops such as nursery products andChristmas trees. Though figures are not available, large areas of the lower watershedare thought to have been tiled and drained. More recently there has been a shift backtowards re-establishing wetland areas.
The Rickreall Creek watershed has been an important source of water to Dallas sincesettlement. A combined private and municipal water supply organization wasestablished in 1903 and was purchased by the city in 1931. The first water systemwas an 8” diameter pipe with gravity flow over a distance of 7 miles (R. Marsh, pers.comm.). Water was obtained from Rockhouse Creek and then other sources wereestablished in Canyon Creek and Applegate Creek. The water fed a reservoirdownstream. In 1940 the city built a pumping station and in 1959 Mercer Reservoirwas constructed. In 1972 the reservoir capacity was doubled by adding a lift to thereservoir.
Water pollution was recognized as an issue in the Willamette Basin by the 1930’s, withmost of the sources listed as domestic sewage and discharge of domestic wastes.Public opinion and policy, however, were not focused on water quality issues:“Because the rivers of the Valley are not largely used for municipal water supply andbecause evidence of befoulment are not widely forced upon the senses, the public istolerant toward stream pollution.” (Willamette Valley Project 1936, p. 109).Wastewater treatment facilities were first constructed for Dallas in 1969 and upgradedin 1998.
By the late 1930’s the pattern of land uses in the Rickreall Creek watershed wasbecoming similar to the present situation. Dallas was a growing urban center with alarge sawmill and other industries. Large and small farms occupied most of PolkCounty, primarily the lower portion of Rickreall watershed. Aerial photographs providea useful way to view vegetation patterns and land use activities over time. A series offour aerial photographs spanning the period from 1936 to 1994 (Figures 2-4 a throughd) show Rickreall Creek at the community of Rickreall. The photos show subtle, butgradual, changes. Over the 60 years, there is a shift away from row crops to grassseed, development of additional roads, and the establishment of the dairy. There is asmall area of loss of riparian area to agriculture, channelization of a small stream, andsome evidence of recent bedload movement in the stream in 1970.

Rickreall Watershed Assessment: Historical Conditions 30
Figure 2-4 a-c Aerial photos of Rickreall watershed at community of Rickreall. Figure 2-4a top in1936 and 2-4b bottom in 1955. Most of the land appears to have been brought under cultivationby 1936. Agriculture was shifting away from hops and prunes by 1936 and towards grains by1955. A small stream near the lower right of 1936 photo is no longer visible by 1955 and mayhave been tiled. Other stream channels and riparian zones appear largely unchanged.

Rickreall Watershed Assessment: Historical Conditions 31
Figure 2-4c top and 2-4d bottom: Aerial photos of Rickreall watershed at community ofRickreall, 1970 and 1994. By 1970, the riparian zone west of Rickreall (left) shows someloss to agriculture and the streambed shows recent bedload deposits (white areas). By1994, there is a greater shift toward grass seed crops, development of the dairy on far rightand additional roads in upper left. The gravel bars visible in the 1970 photo are vegetated by1994.

Rickreall Watershed Assessment: Historical Conditions 32
SummaryBy the 1940’s, the landscape features of the Rickreall Creek watershed had changedsignificantly. Lands that were historically grass prairies, oak savannas, wetlands, andriparian forests had been developed into farmlands, and, to a lesser extent, other landuses. The end of the Kalapuyan practice of using fire to control vegetation resulted innatural succession of areas that were once grasslands and open oak woodlands intoconifer forests. Shifts in animal populations and distributions occurred. Humanpopulation within the watershed had increased, with people concentrated in Dallas,Rickreall, and along the creek. Riparian stream habitat and wetlands were likelyreduced by encroachment by agriculture.

Rickreall Watershed : Water Quality 33
Chapter 3 : WATER QUALITY
Beneficial Uses and StandardsThe Clean Water Act of 1972 guides much of the activities of monitoring andcontrolling water quality of surface water and groundwater (see Appendix 3-1 forbackground on the Act). As part of the protection process of waters, the Actrequires that the various states designate “beneficial uses” for their water bodies.Based on these designated beneficial uses, standards and criteria for protectionare then derived. States use different systems to designate beneficial uses. InOregon, beneficial uses are broadly designated for large watershed areas(Oregon Administrative Rules 340.41). Designated beneficial uses that apply toRickreall Creek are listed below (Table 3-1). It should be noted that broaddesignations sometimes do not adequately describe all portions of a water body.For example, Rickreall was originally designated as “salmonid spawning,” but thisdesignation on the lower portion was changed to “anadromous fish passage” in1995. This change was a critical step that helped to facilitate the dischargepermit process for the City of Dallas waste-water treatment plant as the spawningdesignation required that more stringent water quality standards be met.
Table 3-1: Oregon designated beneficial uses for Rickreall Creek(Oregon Administrative Rules 340.41).
Aesthetic QualityAnadromous Fish PassageBoatingFishingIndustrial Water SupplyIrrigationLivestock WateringPrivate Domestic Water SupplyPublic Domestic Water SupplyResident Fish and Aquatic LifeSalmonid Fish RearingSalmonid Fish SpawningWater Contact RecreationWildlife and Hunting
Water quality standards are numerical values typically expressed as theconcentration of a constituent that protects the most sensitive designatedbeneficial uses. Criteria describe how a standard is to be applied (e.g., that 10 %of samples cannot exceed the standard value). Common water qualitystandards, criteria, and data from Rickreall Creek are summarized in Table 3-2.As an aid to readers, an explanation of water quality parameters and units ofmeasurement are presented in Table 1 of Appendix 3-2.

Rickreall Watershed : Water Quality 34
Table 3-2: Water quality summary for Rickreall Creek.
WaterQuality
Parameter
BeneficialUses
Affected
State Water QualityStandard Water Quality Limited Criteria Issue of Concern for
Rickreall Creek?
Flowmodification
Resident fishand aquatic lifeSalmonidspawning andrearing
Creation of conditions thatcause detrimental changes inthe resident biologicalcommunity
Data that shows the aquaticcommunity to be 60% or less ofthe expected referencecommunity (score data).Documented flow conditions thatimpair other beneficial uses
Permitted withdrawals mayexceed natural streamflowduring summer. See Chapter4
Dissolvedoxygen
Resident fishand aquatic lifeSalmonidspawning andrearing
Cold water aquatic resource:8.0 mg/L
Cool water aquatic resource:6.5 mg/L
Warm water aquatic resource5.5 mg/L minimum
Greater than 10 % of thesamples exceed the standardand a minimum of at least 2exceedences of the standard fora season
Low DO levels (< 6 mg/L)commonly measured at RiverMile 2.2 prior to 1972.Moderate DO levels (5.7 to6.6 mg/L) measured at RiverMile 8.2 in 1989 and 1992.See Table 3-3.
Temperature
Resident fishand aquatic lifeSalmonidspawning andrearing
64ºF (18ºC) 7 day movingaverage of daily maximumunless;55ºF (13ºC) during times inwaters that supportanadromous fish spawning
7 day moving average exceedsstandard
Temperatures occasionallyexceed 64 F during summerat River Miles 2.2, 8.2 and16.7. See Tables 3-3 through3-5..
Turbidity
Resident fishand aquatic lifeWater supplyAesthetics
No more than 10% increaseover background
Systematic or persistentincrease of > 10% in turbidity
No data reviewed.
pH
Resident fishand aquatic lifeWater contactrecreation
6.5 to 8.5
> 10 % samples exceedstandard and at least 2exceedences for season ofinterest
pH measures range from 6.7to 7.8 (all within range) foryears 1957 through 1992 atRiver Miles 2.2, 8.2 and 16.7.See Table 3-4.
Bacteria Water contactrecreation
126 E. coli /100mL, 30 d. logmean, minimum of 5 samples406 E. coli/100mL, singlesample
200 Fecal coliform/100 ml,geometric mean400 Fecal coliform/100 ml in >10 % samples and at least 2exceedences for season ofinterest
Fecal coliform commonlyexceeds standard at RiverMiles 2.2 and 8.2. Less than50 MPN/100 ml at River Mile16.7. See Table 3-4.
Sedimentation
Resident fishand aquatic life Salmonidspawning andrearing
Formation of bottom or sludgedeposits deleterious to fish,aquatic life, public health,recreation, or industry.
Documentation thatsedimentation is significantlimitation to fish or other aquaticlife
Some evidence of cobbleembeddedness in lowersection. See Chapter 5.
Totaldissolved gas
*Resident fishand aquatic life
*Concentration of totaldissolved gas not to exceed110% of saturation*liberation of dissolved gasnot to cause objectionableodors or be deleterious touses of such waters
> 10 % samples exceedstandard and at least 2exceedences for season ofinterest or survey that identifiesimpairment of beneficial use
No data reviewed.

Rickreall Watershed : Water Quality 35
Table 3-2 Cont.
WaterQualityParameter
BeneficialUses Affected
Water Quality Standard orCriteria Water Quality Limited Criteria Issue of Concern for
Rickreall Creek?
Chlorophyll a
Water contactrecreationAestheticsFishingWater supplyLivestockwatering
Natural lakes which thermallystratify
10 ug/LNatural lakes which do notthermally stratify, reservoirs,rivers and estuaries
15 ug/L
3 month average exceedsstandard
Concentrations at Highway 51(River Mile 1) ranged from 1to 6 ug/L.. Upstream ofWWTP range from 1 to 3ug/L. Maximum expectedconcentration is 20 ug/L. SeeTables 3-3 and 3-4.
Aquaticweeds oralgae
Water contactrecreationAestheticsFishing
Development of fungi or othergrowths having deleteriouseffect on stream bottoms,fish, other aquatic life, health,recreation or industry
Macrophytes documented asabundant, invasive non-nativesPeriphyton (attached algae) orphytoplankton (floating algae)documented as causing otherexceedence of other standardsor impairing beneficial use
Some evidence of abundantperiphyton at River Mile 6(above Morrow Rd) observedby analysts during a canoesurvey of River Miles 8 to 5during June, 2000.
Biologicalcriteria
Resident fishand aquatic life
Waters shall be of sufficientquality to support aquaticspecies without detrimentalchanges in resident biologicalcommunities
Data on aquatic communitystatus shows impaired condition
Some evidence of shifts ofmacroinvertebratecommunities in lower section.See chapter 5.
Habitatmodification
Resident fishand aquatic lifeSalmonidspawning andrearing
Creation of conditions that aredeleterious to fish or otheraquatic life are not allowed
Documentation that habitatconditions are a significantlimitation to fish or other aquaticlife
Mercer reservoir has no fishpassage and is trappingsediment. However existingdata does not document aneffect on fish. See Chapter 5.
Toxics Resident fishand aquatic life
Full criteria listed in OregonAdministrative Rules 340-41-445(2)(p)(B) Table 20.Copper 18 up/L acute; 12ug/L chronic.
Exceeds standard 10% of thetime and for at least two valuesFound in sediments or tissue inconcentrations that exceedstandards or screening values
High copper concentrations(200 to 300 ug/L) occur inRickreall Creek fromdischarges from DallasWWTP. Copperconcentrations are to bebrought to standards byPhase III of plant upgrade (by2008).
Totaldissolvedsolids
All beneficialuses
Guide concentrationWillamette River andtributaries 100.0 mg/L
Not to exceed guideconcentration
Elevated concentrations ofdissolved solids (200 to 300ug/L) occur downstream ofDallas WWTP. Phase III isnot expected to achievestandards. However nosignificant impairment tobeneficial uses is anticipated.
Rickreall Watershed : Water Quality 36
Rickreall Creek and the 303(d) ListSection 303(d) of the Clean Water Act requires each state to develop a list ofwaters that do not meet state standards for water quality (see Appendix 3-3about the 303(d) list). Rickreall Creek was originally placed on the list for: 1) flowmodification and 2) temperature (summer) from the mouth of the river to MercerReservoir and 3) dissolved oxygen. In 1994 the Department of EnvironmentalQuality 1994 Water Quality Assessment Report indicated that the beneficial usesof Rickreall Creek were not entirely supported by instream water quality. Thereport stated that low dissolved oxygen, chlorine toxicity, and high temperatureaffected aquatic life. The determination was made based on the ambient waterquality standards in effect at the time and the salmonid spawning, incubation andrearing designation by Oregon Department of Fish and Wildlife. As a result of thechange in designated beneficial use and the design of a Total Maximum DailyLoad (TMDL, see Appendix 3-4 for explanation) for dissolved oxygen, RickreallCreek was removed from the 303(d) list for dissolved oxygen. The most recent(1998) 303(d) list includes Rickreall Creek for flow modification and temperature.The beneficial uses that are affected by these parameters are resident fish andaquatic life, and salmonid spawning and rearing. Appendix 3-5 provides greaterdetails about the listing criteria for these two parameters of concern.
City of Dallas Wasterwater Treatment Plant (WWTP)The City of Dallas has a municipal wastewater treatment plant at River Mile 9.2that discharges to surface water. Operation of a new facility began in June 1999and the facility was fully operational after this major upgrade in September 1999.The prior wastewater treatment plant had been operating at that same site since1969. Before that, another plant or treatment facility is reported to have beenoperating since 1950 at River Mile 14 (K. Carter, City of Dallas). The currentwastewater treatment facility discharges treated effluent to Rickreall Creek undera National Pollution Discharge Elimination System (NPDES) permit issued by theDepartment of Environmental Quality (DEQ).
The WWTP is in the process of being upgraded in three phases. The plant isallowed to operate under interim limits, which are based on what the treatmentplant and collection system is actually capable of achieving with good operation.Based on the approved Facility Plan and variances, an NPDES permit wasissued by DEQ in January of 1998. This permit outlines the phasedimplementation of facility improvements recommended, and defines effluentlimits for each phase. The permit also required that a temperature managementplan be submitted to DEQ and specified temperature-monitoring requirements aspart of the permit. The three phases are described briefly here and can be foundin detail in CH2M Hill (1996).
Phase I is the new WWTP, completed in 1999. Phase I provides significantreductions in oxygen demanding pollutants, elimination of chlorine, and includesan expansion of treatment capacity so that the risk of raw sewage overflows isgreatly diminished. This will significantly improve the effluent quality, however,

Rickreall Watershed : Water Quality 37
water quality based limits such as those for certain heavy metals that are notexpected to be met will be addressed in later Phases Il and III.
In Phase II, to be operational in 2005, some industrial discharges will besegregated from the domestic wastewater system and transported to a dedicatedindustrial treatment facility, covered by a separate permit. This will result insignificant reductions in copper and ammonia loading on the WWTP.
In Phase III, to be complete and operational by 2008, effluent filters will beinstalled to bring the discharge into compliance with all permit limits, and shouldresult in compliance with all water quality based standards with the possibleexception of copper.
Other Industrial DischargersMajor industries in the watershed are Willamette Industries and Tyco PrintedCircuit Group (formerly Praegitzer Industries). Willamette Industries processestimber; Tyco manufactures printed-circuit boards. Currently, neither industryforesees significant increases in their flows to the wastewater collection system.Indeed, Willamette Industries closed its plywood portion of the mill this year.Because of the large volume of industrial flow from the two major industries,which adds little biological oxygen demand and total suspended solids,wastewater entering the sewage treatment plant is dilute. (DEQ, 1993—RickreallCreek Water Quality Report, Total Maximum Daily Load Program)
DEQ staff stated that they have concerns about the metals, particularly copper,passing through the WWTP from Tyco. There is a pilot effort underway (part ofPhase II WWTP facility upgrade) which will segregate industrial wastewater frommunicipal wastewater. This pilot involves discharge water from Tyco being putinto a lagoon and land applied to a poplar tree plantation. DEQ has approved theCity’s industrial pretreatment program. A permit has been issued for this activityby the City to Tyco. The plantation is tile drained which creates another concern;which is the flushing of higher than desirable levels of total dissolved solids. It isnot know if this will become a water quality concern. See (CH2MHill, 1998) for amore detailed review of the industrial effluent poplar tree reuse system.
Copper, while it is not highly leachable from soils, may be an issue for runoff fromthe pilot poplar site. Safeguards to reduce site runoff and soil erosion in the pilotstudy and the operational site will be critical to the project success. Currently allof the industrial wastewater is still being discharged to the WWTP. Thesedischarges might be in violation of the copper criteria in Rickreall Creek. (DEQ,2000, personal communication)
Stormwater ManagementStormwater is runoff that accumulates in and flows through natural and/orhuman-made storage and conveyance systems during and immediately followinga storm event. This water can carry pollutants to creeks, lakes, wetlands, coastalwaters, and groundwater, and can impair water quality. Proper management ofstormwater can help prevent impaired water bodies, degraded animal habitats,

Rickreall Watershed : Water Quality 38
polluted drinking water, increased flooding, and hydrologic changes to streams,lakes, wetlands and rivers. (American Public Works Association, 1999)
The Environmental Protection Agency (EPA) began a program to addresspollution from storm water in 1990. Storm water dischargers from municipal,industrial, and construction sites are being brought into a permitting program byphases that are being introduced over a fifteen-year period.
The City of Dallas has already implemented much of what is typically in a stormwater program but not in a formalized manner (K. Carter, City of Dallas).
Water Quality of Rickreall Creek WatershedHistorical conditionsThe Bureau of Land Management, in preparing a watershed analysis of theirlands in the vicinity of Rickreall Creek (BLM 1998), attempted to describe historicwater quality conditions. Their description is summarized in the following twoparagraphs.
The lowlands along the Rickreall, Luckiamute and Mill Creek main stems had anoverall tendency (due to the low gradients and unconfined settings) toward lowerstream velocities, greater sediment storage, and a high amount of wetlandhabitats. Relatively high water tables all year round and the long-termmaintenance of a shaded stream canopy likely maintained stable streamtemperatures with little annual and diurnal variation.
Upstream, in higher gradient, higher energy streams, water quality was lessbuffered from variations in response to disturbance events, and annual anddiurnal climatic influences. Stream temperatures may have been in the high 60’sF in small channels whose riparian shade had been removed by fire. Pulses ofsediment and leachable nutrients (phosphorus, nitrate, etc) entered the channelduring winter storms and when fires increased their availability. During stableperiods, nutrient concentrations were likely low and often were a major limitingfactor in the abundance of aquatic plant and animal life. Higher stream velocitiesand channel roughness generally kept the waters well oxygenated, and theinfluence of vegetation and aquatic animals on water chemistry was probablysmall when compared to the lowlands.
Current water quality qataWater quality data reviewed for Rickreall Creek were taken from a compilation of60 pages of data reproduced in a CH2M Hill, Technical Memorandum datedDecember 1995 (provided by K. Carter, City of Dallas). Most of the dataoriginated from DEQ from the STORET database; some is modeled valuesproduced by CH2MHill. Data spans the years 1957 to 1995 and weresummarized by months, though data has not been collected in a regular manner.Water quality data are available for 12 locations from Rickreall Creek river-mile0.1 to river-mile 23. In most cases, the data appear to be grab samples, but inmore recent years, (1989) there was some continuous monitoring. The mostrecent data available for this assessment were from 1995.
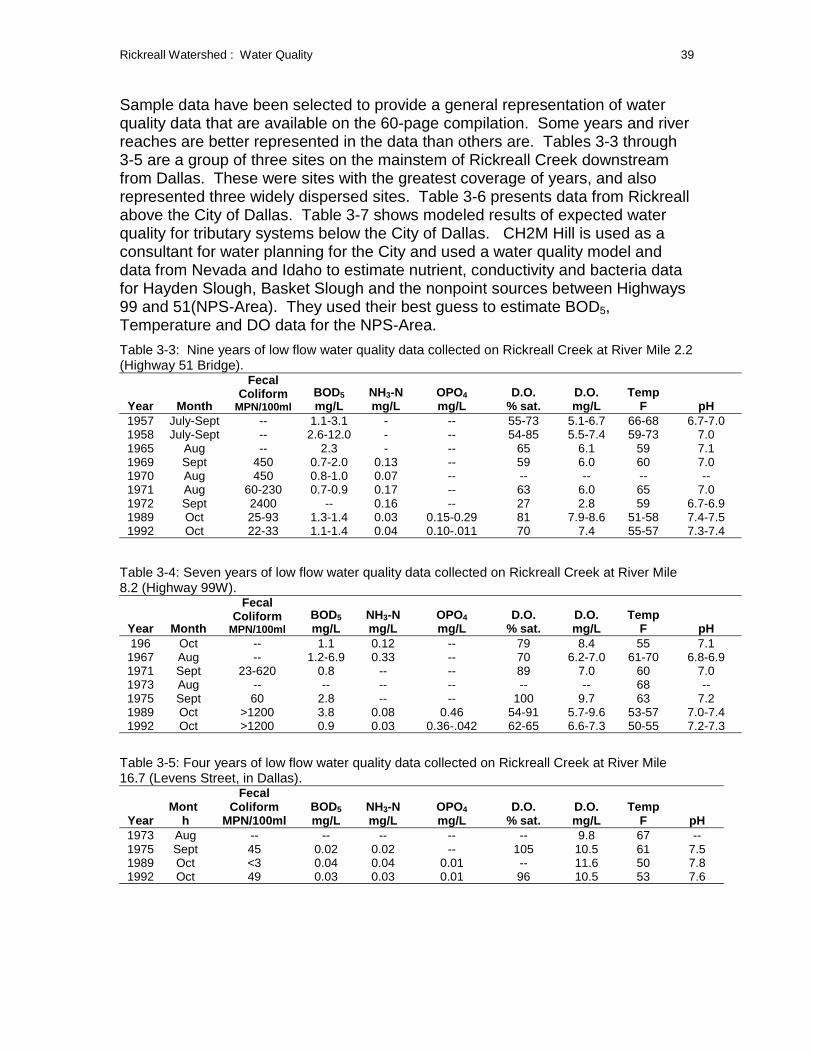
Rickreall Watershed : Water Quality 39
Sample data have been selected to provide a general representation of waterquality data that are available on the 60-page compilation. Some years and riverreaches are better represented in the data than others are. Tables 3-3 through3-5 are a group of three sites on the mainstem of Rickreall Creek downstreamfrom Dallas. These were sites with the greatest coverage of years, and alsorepresented three widely dispersed sites. Table 3-6 presents data from Rickreallabove the City of Dallas. Table 3-7 shows modeled results of expected waterquality for tributary systems below the City of Dallas. CH2M Hill is used as aconsultant for water planning for the City and used a water quality model anddata from Nevada and Idaho to estimate nutrient, conductivity and bacteria datafor Hayden Slough, Basket Slough and the nonpoint sources between Highways99 and 51(NPS-Area). They used their best guess to estimate BOD5,Temperature and DO data for the NPS-Area.
Table 3-3: Nine years of low flow water quality data collected on Rickreall Creek at River Mile 2.2(Highway 51 Bridge).
Year Month
FecalColiform
MPN/100mlBOD5
mg/LNH3-Nmg/L
OPO4
mg/LD.O.
% sat.D.O.mg/L
TempF pH
1957 July-Sept -- 1.1-3.1 - -- 55-73 5.1-6.7 66-68 6.7-7.01958 July-Sept -- 2.6-12.0 - -- 54-85 5.5-7.4 59-73 7.01965 Aug -- 2.3 - -- 65 6.1 59 7.11969 Sept 450 0.7-2.0 0.13 -- 59 6.0 60 7.01970 Aug 450 0.8-1.0 0.07 -- -- -- -- --1971 Aug 60-230 0.7-0.9 0.17 -- 63 6.0 65 7.01972 Sept 2400 -- 0.16 -- 27 2.8 59 6.7-6.91989 Oct 25-93 1.3-1.4 0.03 0.15-0.29 81 7.9-8.6 51-58 7.4-7.51992 Oct 22-33 1.1-1.4 0.04 0.10-.011 70 7.4 55-57 7.3-7.4
Table 3-4: Seven years of low flow water quality data collected on Rickreall Creek at River Mile8.2 (Highway 99W).
Year Month
FecalColiform
MPN/100mlBOD5
mg/LNH3-Nmg/L
OPO4
mg/LD.O.
% sat.D.O.mg/L
TempF pH
196 Oct -- 1.1 0.12 -- 79 8.4 55 7.11967 Aug -- 1.2-6.9 0.33 -- 70 6.2-7.0 61-70 6.8-6.91971 Sept 23-620 0.8 -- -- 89 7.0 60 7.01973 Aug -- -- -- -- -- -- 68 --1975 Sept 60 2.8 -- -- 100 9.7 63 7.21989 Oct >1200 3.8 0.08 0.46 54-91 5.7-9.6 53-57 7.0-7.41992 Oct >1200 0.9 0.03 0.36-.042 62-65 6.6-7.3 50-55 7.2-7.3
Table 3-5: Four years of low flow water quality data collected on Rickreall Creek at River Mile16.7 (Levens Street, in Dallas).
YearMont
h
FecalColiform
MPN/100mlBOD5
mg/LNH3-Nmg/L
OPO4
mg/LD.O.
% sat.D.O.mg/L
TempF pH
1973 Aug -- -- -- -- -- 9.8 67 --1975 Sept 45 0.02 0.02 -- 105 10.5 61 7.51989 Oct <3 0.04 0.04 0.01 -- 11.6 50 7.81992 Oct 49 0.03 0.03 0.01 96 10.5 53 7.6

Rickreall Watershed : Water Quality 40
Table 3-6: Water quality for Rickreall Creek at various River Miles during three years from 1973,1989 and 1992.
Data by River MileRiver Mile: 23.3 16.7 15.0 11.7 10.3 8.2 6.5 5 2.2 0.8
1973 (Aug 13)
D.O. (mg/L) 9.7 9.8 9.9 9.3 -- 6.7 -- 6.6 -- 6.5Temp (F) 71 67 66 71.6 -- 68 -- 66 -- 66pH -- -- -- -- -- -- -- -- -- --Ec(umhos/cm)
-- -- -- -- -- -- -- -- -- --
1989 (Oct 18)
D.O. (mg/L) -- 11.6 9.9 9.1-10.6
-- 6.8-9.0 9.1 -- 7.9 --
Temp (F) -- 50 52.7 51-53 -- 53-58 54 -- 52 --pH -- 7.8 7.4 7.2-7.5 -- 7.1-7.3 7.5 -- 7.4 --Ec(umhos/cm)
-- 117 214 201-222
152-163*
228 257 229 213-259
--
1992 (Oct. 5)
D.O. (mg/L) -- 10.5 -- -- 10.3 6.6 -- 8.8 7.3 --Temp (F) -- 53 -- -- 53 55 -- 57 57 --pH -- 7.6 -- -- 7.5 7.2 -- 7.4 7.4 --Ec(umhos/cm)
-- 214 -- -- 235-236
329-350
-- 357 357-361
--
Diurnal range of data values obtained by sampling at 15- minute intervals over 24-hour period.
Table 3-7: Modeled water quality data for upper Rickreall Creek mainstem, two lower sectiontributaries, and the NPS area.
Seasonflowcfs
TempF
DOmg/
LBODmg/L
NH4-N
mg/L
NO2+NO3-Nmg/L
Org-N
mg/LOPO4mg/L
chlorophyll-
amg/L
TDSmg/L
fecalcoliform
#/100mL
TurbidityNTU
Rickreall mainstem upstream of DallasSpring 81 54 10.7 1 0.04 0.04 0.18 0.01 1 102 20 4Summer 6 64 9.5 1 0.05 0.04 0.17 0.01 1 102 20 1Fall 15 54 10.8 1 0.03 0.03 0.20 0.01 1 102 20 1Winter 485 45 12.0 1 0.03 0.03 0.20 0.01 1 65 20 4
Baskett Slough and Hayden Creek (modeled results were the same)Spring 4.0 56 8.3 1.2 0.06 0.2 1.0 0.15 5.0 150 2,000 6.2Summer 0.3 63 5.0 7.0 0.12 0.2 1.9 0.05 10.0 300 2,000 3.1Fall 0.8 56 8.3 1.2 0.06 1.0 1.0 0.15 15.0 300 2,000 3.1Winter 24.0 50 9.0 1.2 0.06 0.2 1.0 0.15 1.0 300 2,000 6.2
Non-point source area to Rickreall Creek between Highways 99 and 51Spring 2.0 58 5.0 7.9 2.0 2.2 1.0 0.3 1.0 300 5,000 6.2Summer 0.2 63 5.0 7.9 2.0 2.2 1.0 0.3 5.0 300 5,000 3.1Fall 0.6 57 5.0 7.9 2.0 1.0 1.0 0.3 1.0 300 5,000 3.1Winter 19 50 9.0 7.9 2.0 2.2 1.0 0.3 1.0 300 5,000 6.2

Rickreall Watershed : Water Quality 41
Following are discussions of the key water quality parameters.
Aquatic weeds and algaeNo historical aquatic weeds or algae data found for Rickreall Creek Watershed.Attached and floating filamentous green algae were observed in June 2000 atRiver Mile 6 (just upstream of the Morrow Road crossing) by the watershedanalysts. Algae production is somewhat high in the lower watershed due to thephysical characteristics of the stream (K.Carter, City of Dallas). There were nosuch widespread alga growths upstream from the WWTP on the same days.
Fecal coliform bacteriaThe single sample standard was regularly exceeded from River Mile 8.2(Highway 99 bridge) and points downstream from 1969 to 1992 sample dates.This standard was not exceeded at river mile 16.7 (Levens Street) in the threeyears of available data for that location. A CH2MHill report attributed theincreases in fecal coliform to local NPS-Area and agricultural drains (CH2M Hill,1995). High bacteria concentrations were the most commonly exceededstandard in small streams in the Willamette Valley and most high values occurredduring high stream flows (Anderson et al. 1997). Past sewage overflows fromthe WWTP, failing septic systems, and urban runoff could also have contributedto these high fecal coliform numbers in Rickreall. But as a result of systemupgrades, there has not been a sanitary sewer overflow since 1999 (K. Carter,City of Dallas).
ConductivityHistorical data show significant increases in conductivity downstream of RiverMile 8.2 (Highway 99W). Conductivity data for the low flow selected low flowperiods in October of years 1989 and 1992 show increasing conductivity fromupstream to downstream sample sites. The lowest values (117 umhos/cm in1989 and 214 umhos/cm in 1992) in both years were from the farthest upstreamsample location (river mile 16.7) and the values increase at River Mile 8.2 anddown stream (220 to 360 umhos/cm). Increases in conductivity indicate greaterconcentrations of dissolved ions and possible sources to the stream.
CopperExisting background copper concentrations in Rickreall Creek have beenmeasured at concentrations ranging from 4u/L to 8 u/L. These “background”concentrations already approach the standard of 12 mg/L (City of Dallas, July1996)
Although chronic and acute concentrations of copper have been established byDEQ (Table 3-2), it has been demonstrated that site specific conditions maymodify copper toxicity to the extent that less stringent standards could be appliedbased on site specific modifiers (DOB’s et al 1994). The City of Dallas (1996)report documents evidence of aquatic life that has been collected near the mixingzone within 200 feet of the WWTP outfall, where copper concentrations rangefrom 200u/L to 300u/L. The report proposes that these findings of aquatic lifeshow that initial concentrations of copper are being diluted or environmental

Rickreall Watershed : Water Quality 42
conditions are mitigating copper toxicity to some extent. Bioassay resultssuggest that copper is largely unavailable, because copper is adsorbing ontoorganic matter in the effluent. However it is reasonable to assume that somecopper will partition back to the dissolved phase upon interaction with thereceiving water and may then become available to fish and aquatic organisms.(CH2MHill, 1996)
It is likely that Rickreall Creek regularly violates the instream standards forcopper downstream from the Dallas discharge during periods of low dilution.However, copper concentrations are expected to decrease substantially whenPhase II of the WWTP upgrade is completed when industrial effluent will beseparated and used for poplar tree irrigation, thereby reducing copperconcentrations in the WWTP effluent to approximately 20-50 u/L during 7Q10flow(City of Dallas, 1996). These concentrations are expected to decrease evenmore in Phase III when some industrial contributions are removed after Phase IIof the Dallas sewage treatment plant improvements but may also not comply withthe standard until after completion of Phase III. (DEQ, 1997)
Dissolved oxygenWater quality data for dissolved oxygen for Rickreall Creek show high levels forthe entire creek during high flow periods (Tables 3-3 through 3-5). Data, by rivermile, also show Rickreall Creek typically maintains DO levels of 9 mg/L andabove in sections upstream of approximately river mile 11.7, even during low flowperiods (Table 3-6).
Lower levels of dissolved oxygen tend to occur in the lower river during thesummer low-flow period of July and August. The data for river mile 2.2 and rivermile 8.2 show several periods when at low flow DO levels were reported belowthe 6.0 mg/L. This is less than the cool water standard listed in Table 3-2 (seeAppendix 3-5 for greater detail on the standards). Diurnal fluctuations in DO canbe seen in the range of data in Table 3-4 from October, 1989 when DO levelsfluctuated from 5.7 to 9.6 mg/l over the course of a 24 hours (15-minute sampleintervals).
A TMDL (see Appendix 3-4 for background) was established for biologicaloxygen demand (BOD) in 1995 and therefore Rickreall Creek is no longer on303(d) list for Dissolved Oxygen. The way the Clean Water Act is written,Rickreall Creek will maintain its status as "water quality limited" for dissolvedoxygen as long as it does not meet the State standard. Instream concentrationsperiodically drop below the 6.5 mg/L standard during the summer. However, thewaste load allocations assigned to Dallas in the December 1993 TMDL are notapplicable due to new instream dissolved oxygen standards and the change insalmonid classification. Dissolved oxygen levels are improved since the Phase Iimprovements to the Dallas sewage treatment plant but will not consistentlycomply with the instream standard until after Phase III is complete andoperational (DEQ, 1997).
Rickreall Watershed : Water Quality 43
Flow ModificationRickreall Creek is on the 303(d) list for flow modification from the mouth toMercer Reservoir. See Water Quantity Chapter 4 for water quantity issues.
Macroinvertebrate survey dataMacroinvertebrate bioassessments were performed at three sites on RickreallCreek in 1995 (data provided by K. Carter, City of Dallas). Site 1 was 150 mupstream of the WWTP. Sites 2 and 3 were downstream, Site 2 was 2000 mdownstream of the WWTP and Site 3 was at Greenwood Road, 5 milesdownstream of the WWTP. The macroinvertebrate communities were different ateach site sampled. Taxa and relative abundance for the three sites are given inAppendix 3-6. Site 2, downstream of the WWTP, had "reduced fauna that washeavily dominated by Chironomids." This indicated poor water quality. SeeAppendix 3-6 for complete bioassessment data, which compares twodownstream sites to the upstream site (Tables 1-4). The results indicate that thetwo downstream sites were moderately impaired. The increase inEphemeroptera-Plecoptera -Trichoptera at the Greenwood Road Site 3 indicatessome recovery of water quality from the Site 2, located 2000 m downstream fromthe WWTP. Similar habitat scores at the three sites indicate that the differencesin abundance and in pollution-tolerant taxa are related to differences in waterquality at the three sites (DEQ, 1989).
AmmoniaWater quality criteria for ammonia are dependent on water temperature and pH.Historical data for Rickreall Creek do not show any levels above the standards(standards for ammonia presented in Appendix 3-5). The new City of DallasWastewater Treatment Plant is designed to meet both acute and chronic waterquality criteria. Chemical and organic waste spills are potential sources of acuteconcentrations of ammonia. Safeguards against spills and emergency spill plansare critical elements to prevent fish kills from toxic ammonia levels.
NitrateThe historical data do not show any instances where Rickreall Creek waterexceeded the 10-mg/L “evaluation indicator” (benchmark used when there is noestablished standard). The WWTP exceeded this amount in several of theeffluent samples in the historical data set, however the concentrations were onlyas high as 15 and 18 mg/L and would have been diluted in the outfall mixingzone to less than 10 mg/L.
Phosphorus (total P)Historical data for Rickreall Creek shows this indicator value is frequentlyexceeded below River Mile 8.2. From River Mile 8.2 to the mouth totalphosphorus (TP) concentrations exceeded the evaluation indicator concentrationin about 75 % percent of the samples, while none of the samples exceeded thisindicator value from River Mile 11.7 (Fir Villa Road) and upstream. WWTPeffluent data from 1989 showed TP values from 0.1 to 6.9 mg/l. There was aletter from DEQ on these high TP levels in December 1993 and it was suggestedthat the values in the data were being expressed as phosphate rather than as
Rickreall Watershed : Water Quality 44
elemental-P. This caused the results for TP to look about three times higher thanthey were. Using this correction, the WWTP effluent data for years 1988, 1989,1992 and 1993 are consistently in the range of 1 to 2 mg/l TP.
pHWater quality data indicate that pH values are within the standards, see Tables 3-3 to 3.5.
SedimentUpper watershed has high sediment delivery events. See Chapter 6 fordiscussion.
TemperatureThe temperature standard is violated in Rickreall Creek most summers (Maythrough October) from the mouth to Mercer Reservoir. Because of the waterquality limited status, the WWTP discharge is not allowed to cause a measurableincrease (0.25 degrees F) in the stream temperature outside of the mixing zonebecause of the low levels of dilution available (DEQ, 1997).
Temperature continues to increase downstream and generally exceeds theproposed DEQ standard of 64 degrees F for several weeks throughout thesummer. Measured temperatures in the stream system during the 1995 July-August period averaged nearly 66 degrees F just upstream of the WWTP andmore than 68 degrees F at Highway 51 (CH2MHill, 1995) It is not clear to whatextent temperature has changed compared to reference conditions of the creek.
Total dissolved solidsRickreall Creek routinely exceeds the total dissolved solids (TDS) guideline bothupstream and downstream of the WWTP outfall. While the guideline is 100 mg/lTDS, the creek ranges from 70 mg/l to 130 mg/L TDS upstream from thedischarge (DEQ, 1997).
According to the City of Dallas, (1996) TDS modeling results indicate that afterimplementation of Phase III of the WWTP upgrade, in-stream concentrations areexpected to exceed the 100 mg/L guideline at times. Based on stream waterquality sampling, upstream levels of TDS typically exceed the TDS guideline.Because the TDS criteria are a guideline and not a standard, stream specificconditions typically dictate the acceptable TDC concentration to be used. Afterimplementation of Phase III-WWTP upgrade, TDS concentrations of 130 to 250mg/L are not expected to cause a significant impact to downstream aquaticresources. This argument is made because current background concentrationstypically exceed the established guideline, and they concluded that acceptablelevels of TDS could be higher for Rickreall Creek. In addition, although TDSlevels are expected to range from 230mg/L to 360 mg/L during Phases I and II ofthe WWTP upgrade, no short-term significant impacts at these current levels andno apparent significant impacts have been identified in Rickreall Creek. (City ofDallas, 1996 and CH2MHill (1996a).
CH2MHill (1996a) reports that the WWTP effluent contribution to the TDS andthe exceedance of the TDS guideline would not adversely impact beneficial

Rickreall Watershed : Water Quality 45
aquatic resources in Rickreall Creek. They reach this conclusion becausecurrent and anticipated TDS concentrations are two orders of magnitude lowerthan levels reported to cause adverse effects for most aquatic species, 10,000mg/L (citing EPA, 1987). Furthermore, current and anticipated TDS levels inRickreall Creek will remain lower than the EPA drinking water standard of 500mg/L.
ToxicsPoly-aromatic hydrocarbons (PAHs) Semi- and Volatile-Organics (Sediment)Data were cited from the USGS, Willamette Basin. DEQ cites the WillametteRiver Basin Water Quality Study Phase I and II (DEQ 1998-303(d) List Rationale)as a basis for consideration of listing Rickreall Creek for several toxicsubstances. These included Anthracene, Bis(2Ethylhexl)phthalate, Floranthene,Phenol and Pyrene, which were found in sediments, but at values belowguidelines and guidance values. No beneficial use impairment evaluations areavailable that show a toxicity problem. Other toxic substances were found thathad no well established guidelines available for evaluating risks nor forevaluating whether beneficial uses are impaired (Azobenzene,Butylbenzylpthalate, Di-n-butylphthalate, P-cresol, and Phenanthrene are in thislatter group). The 1998 listing status for these chemicals is OK.
PesticidesAccording to DEQ rationale pesticides detected in water include Atrazine,Cycloate, Desethylatrzine, Hexizone, Metolachlor, Prometon and Simizine.These were found in the course of the Willamette Basin Study Phase I and II.These pesticides either do not have established standards or were inconcentrations below standards, criteria or guidance levels. No pesticides weredetected in the sediment in that study.
Metals (Sediment)Copper, Antimony Chromium, Manganese, Nickel, and Zinc were found inelevated levels in sediments when compared to various guidelines or guidancevalues, however sediment toxicity does not correlate well with sedimentcontaminant concentration and is dependent on local conditions. No data onbeneficial impairment (bioassays) is available. Therefore there is no justificationfor a listing of metals in sediment.
TurbidityNo data found for Rickreall Creek Watershed but see the modeled values inTable 3-7. Standards allow not more than a ten- percent cumulative increases inbackground turbidity as a result of any activity (see Appendix 3-5).
Groundwater QualityStudies done by the United States Geological Survey show that the quality of thegroundwater in the area of the watershed varies widely. Water from shallowdepths in the consolidated rocks generally is of good quality. However, water inthe consolidated rocks contains increasing concentrations of dissolved mineralsolids with increasing depth in the rocks and commonly is too mineralized for
Rickreall Watershed : Water Quality 46
most uses. Unconsolidated deposits generally contain water suitable for mostuses, but in localized areas the water may contain high concentrations of iron ormanganese or dissolved solids and may require treatment for some uses.
A report by Gonthier (1983) found that the major groundwater related problems inthe area were low well yield and poor-quality groundwater. These problemscommonly occur together in individual wells and they occur most frequently inwells drilled into consolidated rocks. The consolidated rocks consist chiefly oflow-permeability formations that generally contain water with increasingconcentrations of dissolved materials with depth below the land surface.Commonly, several wells are drilled into the consolidated rocks before anadequate domestic water supply is obtained. (Gonthier 1983)
Sodium contamination (salt water) is common in many wells in Polk County. Thesodium is from marine deposits and generally occurs in deeper wells. Gonthier(1983) noted that salt water is more likely in valleys near streams than in uplandsites. Bernert (1994) reported that nitrate is an important parameter ingroundwater contamination in Polk County. High nitrate values typically areobserved in lowland valleys and tend to be associated with intensive agriculturallanduse. Areas with elevated nitrate might also be likely to expect elevatedconcentrations of the more mobile pesticides. (Bernert 1994)
Evidence gathered in a 1993-1995 study conducted in Willamette Basin indicatesthat there is concern of nitrate contamination of shallow wells developed inalluvium agricultural areas (Hinkle 1997). The domestic wells sampled in thatstudy were all less than 80 feet deep and were developed in alluvium. Nitrateconcentrations ranged from less than 0.05 to 26.0 mg N L-1. Nine percent ofwells sampled exceeded the 10-mg N L-1 standard. (Hinkle 1997).
Thirteen different pesticides were detected in the 1993-1995 study of shallowgroundwater, but concentrations were low with only 1 detection exceedingUSEPA standards (Hinkle 1997). Atriazine was the most frequently detectedpesticide.
Bonn and Hinkle (1995). did an analysis of water quality data for groundwater ofthe Willamette Basin, Oregon, (1980-90). The data set consisted of informationfrom DEQ (123 wells in agricultural areas) and the Oregon Department of HumanResources Health Division (ODH, 312 public water supply wells). They foundthat elevated NO3-N concentrations generally were associated with shallowwells; NO3-N concentrations exhibited a weak inverse relation with depth. Thegreatest NO3-N concentrations occurred in wells sampled by DEQ in a study thattargeted shallow wells in agricultural areas. The MCL (standard) for NO3-N wasexceeded at 26 of 123 DEQ wells. The DEQ data, however, were notsignificantly different from a comparable subset of the ODH data (shallow wellscompleted in basin-fill and alluvial aquifer and identified as agricultural land use)(Bonn and Hinkle 1995).
While these data are not specific to the Rickreall Creek Watershed the trendsshown for the Willamette Basin provide important information as to the status ofgroundwater quality in the region.

Rickreall Watershed : Water Quality 47
Contamination of Groundwater
Groundwater contamination does not appear to be a major or widespreadproblem in the watershed, but local occurrences have been reported. Pollution ofgroundwater will occur if facilities for the disposal of wastes or for application ofother degrading substances are poorly designed, operated and maintained forthe type of soil conditions existing at a disposal site or if the potential pollutantsare handled carelessly. Gonthier, (1983) found that the risk of pollution is higherin the sand and gravel and the younger alluvium because of their high porosityand permeability and shallow depth. Locally, groundwater from sand and gravelaquifers contains concentrations of iron and manganese that may be excessivefor some types of uses (Gonthier 1983).
The Rickreall Community Water Association routinely monitors for constituents indrinking water supplies. The water source is from four wells located alongHighway 51 north of Independence, Oregon. The monitoring results in their 1999Annual Drinking Water Quality Report show no detections of 75 contaminants.The only contaminant present was Nitrate (as nitrogen), which was present at alevel of 12.6mg/l in one of the wells, which is 2.6mg/l above the maximumcontaminant level, the highest level of a contaminant that is allowed in drinkingwater. (Rickreall Community Water Association, 1999)
Potential groundwater problems from nonpoint sources of pollution are discussedin Chapter 6. Some potential sources include:
• Solid and hazardous waste
• Superfund sites
• Underground storage site tanks
• Reported spill sites
• Land application of municipal and industrial wastes
• Land application of septage/sludge
• Failing septic systems
Well construction, wellhead protection and groundwater testing are proactivemanagement tools that can be used to help protect groundwater quality.Improperly constructed drinking water wells—those wells not constructed to statestandards or with poor seals— can act as a conduit for contaminants to enteraquifers from both point and nonpoint sources. Properly constructed andmaintained wells can help prevent the introduction of contaminants into aquifers.
Potable groundwater is viewed as a critical priority for Oregon’s continuedeconomic viability. It may be useful to the Watershed Council to evaluate thepotential benefits of creating a local wellhead protection program, which would beadministered with assistance from DEQ, but implemented locally. By workingtogether, local and state governments can implement custom designed localWellhead Protection Programs to protect local groundwater resources. See DEQ(1992) for more details.

Rickreall Watershed : Water Quality 48
The Rickreall Creek Watershed Council could conduct a groundwater educationand outreach program, including providing rural watershed residents andlandowners with well water testing. Offering free or subsidized water testing forparameters such as nitrates and bacteria can be good way to start a dialoguewith landowners about the watershed.
Water Quantity and its Relationship to Water QualityFor a detailed discussion of water quantity/flow issues in the watershed seeChapter 4. It is important to view water quality and water quantity in anintegrated way in both the assessment as well as in management practices thatmay stem from this assessment. Estimates of water quantity are necessary forevaluation of water quality impacts as well as estimating critical flow processessuch as flood and drought frequency.
Water quantity is of critical concern in Polk County because of the variable, butgenerally low, groundwater availability and low stream flow during the summerperiod. Lack of water in some cases has limited the industrial and residentialgrowth in the county. Low stream discharge also poses a problem regardingdischarge of sewage effluent. Streamflow can be such that a significant portionof stream discharge in late summer can be comprised of sewage effluent.
Rickreall Creek Water Quality SummaryKey water quality issues of ongoing concern in Rickreall Creek include twoparameters for which it has been placed on the 303(d) list; temperature and flowmodification. Two other parameters, that are not included in the listing, but whichwarrant continued attention, include metals, particularly copper and dissolvedoxygen. Copper should be largely addressed in Phase II and III of the DallasWastewater Treatment Plant upgrade, but Phase III will not be operational until2008. Also there has been some opposition to the on land application systemfrom private citizens. Dissolved oxygen is being managed under an approvedTMDL .
The water quality data for lower Rickreall Creek indicate a trend towards moreeutrophic stream conditions (i.e., enriched with nutrients that enhance algae andaquatic plant growth). These conditions can create some moderate impairmentof beneficial uses. A lack of early historical stream data makes it difficult to saywhat were the reference stream conditions, how much change has taken placeand how long conditions have been impaired. The lower reach likely has beenaffected in the past by the combined effects of runoff from agricultural areas,effluent from the WWTP, failing private onsite sewage systems, stormwater fromurban areas, and even log drives and natural stream bank erosion. Evidence ofimpairment includes total phosphorus levels that were greater than indicatorconcentration, fecal coliform bacteria that consistently exceeded standards overthe period of water quality data and excessive growths of filamentous algae.Limited bioassessment data further support this characterization; availablemacroinvertebrate sampling data show some evidence of impaired water qualitydownstream of the WWTP with recovery further downstream near Greenwood.
Rickreall Watershed : Water Quality 49
Total dissolved solids concentrations are elevated in the lower creek but also inreaches above the WWTP.
The recent construction of a new WWTP and the full implementation of the finalphases of the wastewater treatment facility should help improve water quality inthe lower Rickreall. The new plant has eliminated chlorine additions, providessignificant reductions in oxygen demanding pollutants and greatly reduced therisk of raw sewage overflows. The City of Dallas is also involved in improving thequality of urban runoff with programs such as street sweeping. Dallas will playan even larger role by developing a stormwater management plan by 2005. Theagricultural community and other rural landowners are currently in the planningstages for the Senate Bill 1010, Agricultural Water Quality Management Plan,and will have a large responsibility in improving water quality in the lowerRickreall and especially in the agricultural tributaries.
The middle reach of the creek between the WWTP and the Mercer Damgenerally has good water quality. Exceptions include temperature and TDS,which sometimes exceed standards in this reach. The City of Dallas is activelyacquiring easements and ownership of riparian lands immediately adjacent toRickreall Creek within the City limits and is using riparian revegetation to helpmitigate temperatures as part of a larger temperature management plan.
There was no water quality data found for the upper extents of Rickreall Creekabove Mercer Reservoir. The City of Dallas began collecting temperature datafor several tributary streams this year. Those data should prove useful in futurewatershed assessments. There have been recent instances of severesedimentation reported in the upper watershed following the Rockhouse Creekfire and the February 1996 storms, these are discussed in Chapter 6. Thehealth of the upper watershed depends on following the best managementpractices of the Forest Practices Act, largely aimed at controlling sediment andstream temperatures. There are a number of potential nonpoint sources in bothrural and urban areas that have not adequately been evaluated for their impactson water quality, including urban stormwater, agricultural drainage systems,private onsite wastewater systems, highway runoff, and forest roads.
Potable groundwater is a priority for healthy watersheds and continued economicviability in the area. While the City of Dallas currently gets its water fromRickreall Creek, many rural residents and communities like Rickreall andIndependence depend on groundwater. The major groundwater issues in thearea are low yielding wells, and a number of wells yield poor-quality groundwater.Sodium contamination (salt water) occurs in some wells that draw from CoastRange rock aquifers. There is nitrate contamination of some wells developed invalley alluvium aquifers. These aquifers occur under high intensity irrigatedagricultural lands and this highlights the importance of protecting groundwaterfrom agricultural chemicals. Proper well construction, wellhead protection andgroundwater testing are proactive measures to help protect groundwater quality.The watershed council can work cooperatively with landowners and residentsand with local and state governments to promote and implement a wellhead

Rickreall Watershed : Water Quality 50
protection program and conduct groundwater education and outreach activitiesthat include voluntary well-water testing programs.
The Rickreall Creek Watershed could benefit from a systematic, long-termmonitoring program to evaluate of water quality trends over time. An importantconsideration for future assessment efforts will be development of a monitoringprogram for water quality and quantity throughout the watershed. Because ofnatural variation in flow and water quality characteristics, these efforts will bemost valuable if they can be maintained for periods spanning more than a singlewater year. In the future, the Watershed Council could advocate for gatheringwater quality data where there are current gaps. Future efforts could addressnatural versus anthropogenic effects on water quality in the watershed. Otherprojects could be designed around particular smaller drainages and couldattempt to quantify nonpoint impacts in subwatersheds such as Basket andHayden Slough. The Watershed Council could work cooperatively with the Cityof Dallas, large forest landowners and BLM and USFS to monitor streams in theheadwaters.

Rickreall Watershed : Water Quantity 51
Chapter 4 : WATER QUANTITY
Hydrologic DataRickreall Creek has multiple years of stream flow data at two gage locations—Dallas and Rickreall. Collectively the two stations have data for the years 1958to 1985. The station at Dallas is actually upstream of the city of Dallas and belowthe original water intake of Dallas at River Mile 20. The station at Rickreall is justabove the Highway 99 bridge and about a mile below the wastewater outfall(refer to Map 1-6 for relative locations). Both stations are below the MercerReservoir, which was built in 1959.
Average annual discharge (measured rate of streamflow) is shown in Figure 4-1.The data are in cubic feet per second (cfs). I cfs translates into about 7.5 gallonsper second, 450 gallons per minute (gpm) or 0.65 million gallons per day (MGD).These data averaged by “water years” that begin in October of the year indicatedand end in September of the next year (at the start of the rainy season inOregon). Finally these data are annual average discharges (total cubic feet offlow past that point in a water year divided by total seconds in a year). Thereforethey are more representative of the winter high flows when most of the waterflows in streams in Oregon and do not reflect annual drought years very well.
Average annual discharge was uniform for the years 1958 through 1972 and thenbecame more variable for 1973 to 1985. Low discharges occurred in 1973,followed by a year of high discharge in 1974. Both stations track each other well;Rickreall seems to respond in greater magnitude to high water years. Rickreallhas consistently higher discharge not because of the Dallas water system, butrather that the Rickreall Creek drains about a 50 % larger watershed area (43square miles) at the Rickreall gage than at the Dallas gage (28 square miles).Ellendale Creek and several unnamed streams contribute flow to Rickreallbetween the two gages. Additional sources of increased flow would be fromgroundwater, small-unmapped seeps and streams, and even some amounts ofstorm water runoff from the urbanized area of Dallas.
Figure 4-1: Stream discharge for Rickreall Creek at two gaging stations.
Annual discharge
0
50
100
150
200
250
300
350
58 60 62 64 66 68 70 72 74 76 78 80 82 84
Year
Dis
har
ge
cfs
Rickreall
Dallas

Rickreall Watershed : Water Quantity 52
Average monthly flow for these same gages is shown in Figure 4-2. Alsosuperimposed on the long-term mean are three individual years with high year toyear variation (e.g., years 1973-1975). All these hydrographs show thecharacteristic pattern of stream flow with flow increasing in October, reaching apeak in January and declining slowly to their lowest flows in August andSeptember. Winter mean flows for January can be 100-fold higher than meanflows in August-September. Therefore these discharge data are graphed on alog scale. This means that the vertical dimension of the graph was “compressed”progressively more at higher flows so that both the low flow high flow patternsare still discernable. This is a common graphing procedure used when data spanranges over several orders of magnitude. Note also that the difference betweenyears in Figure 4-1 is evident in the variation in the winter flows and also thesummer flows. That is, 1973 was a “dry” year throughout, suggesting that lowwinter rains result in low summer flows.
Figure 4-2: Annual hydrographs averaged by months for two gaging stations on Rickreall Creek
Annual hydrograph at Rickreall '65-'84
1
10
100
1000
1 2 3 4 5 6 7 8 9 10 11 12
Water year by month (starting in Oct)
Dis
char
ge
in c
fs Mean
1973
1974
1975
Annual hydrograph at Dallas '58-'78
1
10
100
1000
0 2 4 6 8 10 12
Months of a hydrologic year (starting at Oct)
Dis
char
ge
cfs
Mean
1973
1974
1975
Rickreall Watershed : Water Quantity 53
The City of Dallas collects flow data from various points about the watershed.The City also records the amount withdrawn from Rickreall and the amountsdischarged to Rickreall. This data together with the USGS stream flow data canbe used to construct a typical water budget during a low flow August day (Figure4-3).
The flow volumes used in Figure 4-3 were those measured by the City of Dallasfor low flow conditions in 1998 and 1999 at the following locations: above thereservoir, just below the reservoir, in Applegate and Canyon Creeks, withdrawalsat the municipal intake (raw data provided by K. Carter, City of Dallas), andreleases at the wastewater treatment plant (WWTP) (data from the City of Dallas1996). The Dallas and Rickreall gage data are shown in Figure 4-4 and show thetypical low flow volumes over the period of record. Ellendale Creek wasestimated based on it having a 30 % larger drainage area than Canyon Creek.Using these numbers the remaining flows were constructed to balance thebudget.
One unusual result was that the Dallas intake averages 5.9 cfs during the monthsof July through September for 1998 through 2000, but the WWTP outfall isconsiderably less at about 2.6 cfs (Table 1 in Dallas 1996 reported 2.5 cfsWWTP outfall in 1995 and projected 2.6 cfs for 2000). Therefore 3.4 cfs had tobe accounted for. It was assumed that losses from the City’s water stream maybe explained by leakage from pipes, evaporation from the treatment ponds, lawnwatering, and outdoor water use that diverts water into the storm drain systemand back to the creek. Therefore 1.7 cfs was assumed to be lost to evaporationand 1.7 cfs was assumed to be diverted back to the creek.
Two other assumptions that were made to balance the budget were 1.5 cfs of“other withdrawals” occurs between the City’s intake and its outfall; andwithdrawals from Rickreall Creek between the outfall and the Rickreall gage arebalanced by additions back to the creek.
Withdrawals of 1.5 cfs are surprisingly large and may likely be an overestimate.However, the 1.5-cfs estimate is being driven by the 1.7-cfs diversion from theCity’s system back to the creek. If one assumes a greater proportion of the City’sloss is evaporated (or enters into soil storage and possibly diverted to AshCreek), then the withdrawals would be proportionately reduced. Perhaps theother withdrawals may be more on the order of 0.5 cfs. As Map 4-1 indicatesthat there is close to 100 permitted diversions between the City’s intake and theWWTP outfall and withdrawals of 0.5 cfs may be reasonable. This would beequivalent to 20 withdrawals at a rate of 11.3 gallons per minute operatingcontinuously.
The data in Figure 4-3 must be considered as approximations and are based onthe assumption that the low flow data for the instream gages measured during1958 through 1985 are still representative of the flows in 1998 and 1999. It maybe of interest for the Council to investigate these numbers more closely andperhaps examine some of the City’s data. For example, it may be of interest tolook at the metered data for their various classes of users and determine use by

Rickreall Watershed : Water Quantity 54
domestic, commercial, and industrial. The budget could be refined to includeCity water that goes to the Ellendale area and is not returned to the City’s wastestream.
Mercer Reservoir storage =
47.9 million cubic feet
Rickreall headw aters 2 cfs
Rockhouse Creek 0 cfs
10 c
fs
cont
rolle
d re
leas
e Applegate 0.1 cfs
Canyon 0.3 cfs
Tota
l 10.
4 cf
s M
unic
ipal
with
draw
als
5.9
cfs
Loss: evaporation or measurement error 1.7 cfs?
Use by city
Waste stream WWTP
Intake
Ellendale Cr 0.5 cfs
Direct dscharge to stream 1.7 cfs?
Oth
er n
atur
al re
char
ge is
offs
et b
y with
draw
als
and
loss
?
Dallas gage
4 cfs
Wastewater
outfall 2.6 cfs
Co
mbi
ned
f low
to
Ric
krea
ll ga
ge 7
cfs
Rickreall gage 7 cfs
With
draw
als
by o
ther
user
s 1.
5 cf
s?
Figure 4-3: Water budget of Rickreall Creek at August low flow showing alterations to flow by cityof Dallas. Red arrows and question marks indicate assumptions used to balance the budget.

Rickreall Watershed : Water Quantity 55
Patterns of Low and High Flow Discharges for Rickreall CreekDaily discharge data for the Dallas and Rickreall gages are shown in Figure 4-4.Annual low flows at Dallas typically dropped to 3 cfs or less. In 8 of the 21 years,flow declined to less than 1 cfs; in 1972 no flow was recorded for a short period.Annual low flows at Rickreall were slightly higher and typically were 5 cfs. Therewere two years, 1969 and 1972, at Rickreall with low flows of 1 cfs or less. (Onecubic foot per second is equal to about 7.5 gallons per second or would be astream 3 feet across, four inches deep and flowing at 1 foot per second.) Theseflows appear to be relatively low for a drainage area of similar size and clearlymust reflect the significant withdrawals of water from the stream. For example,the Little Luckiamute River near Falls City with a smaller drainage area than thatabove Dallas, rarely fell below 8 cfs during its record of low flows for the period1965 through 1971.
Peak flows are evident on Figure 4-4 but may be more easily viewed in Figure 1-3 (Chapter 1) where data are plotted on a linear scale as opposed to a log scale.Peak flows for the Dallas gage typically exceed 1000 cfs each year andcommonly reach 2000 cfs. (A stage-rating table is not available for RickreallCreek, but by eye, the 1000-cfs level likely represents an approximate bankfulldischarge when the flow rises above the lowest floodplain.) The highest flowsexceeded 5600 cfs in 1964. Peak flows at the Rickreall gage are approximately50 % higher than peak flows at the Dallas gage.
Comparisons of peak flows may also be made to the Little Luckiamute River atFalls City. As peak flows have been suggested to increase as a function of thesquare root of basin area (Viessman et al. 1972), the 20 % smaller LittleLuckiamute might be expected to have only about 10 % smaller peak flows thatthose at Dallas for the same period of record. Little Luckiamute peak flow in1964 was 3570 cfs and during the years 1965 to 1971 peak flows ranged from1200 to 2100 cfs. These data are about 25 to 60 % lower than the gage atDallas. These data suggest that, at least compared to the Little Luckiamute, thatthe peak flows in the Rickreall are somewhat high. Even the 310 square mileMarys River watershed had 1964 peak flows of 11,000 cfs and a range between3000 and 7000 cfs for the period between 1965 and 1971; these are in line withthe Little Luckiamute data.
The reservoir is not managed to affect peak flows. Given the volume of peakflows, withdrawals by the City and other users should not significantly decreasepeak flows. The reservoir fills in a matter of days once fall rains start andwithdrawals are less than 5 cfs and would not show up in peak flow volumes. Amore likely explanation for higher peak flows would examine shape of the basinand other factors to see if water is routed more quickly to the channel. Channelprecipitation will cause higher peak flows. The surface area of the reservoir willact to route rainfall immediately downstream where vegetation and soil would actto retain rainfall. However, one inch of rain falling in 24 hours onto the 60 acresof the reservoir would produce only 3 additional cfs.

Rickreall Watershed : Water Quantity 56
Figure 4-4: Daily discharge data for Rickreall Creek at two USGS gage stations. Dallas is at RiverMile 20 and drains approximately 29 square miles; Rickreall is at River Mile 9 and drainsapproximately 43 square miles. Data are log scale to show low flow discharges over time.
Rickreall gage data Dallas
0.001
0.01
0.1
1
10
100
1000
1000010
/1/5
7
10/1
/58
10/1
/59
10/1
/60
10/1
/61
10/1
/62
10/1
/63
10/1
/64
10/1
/65
10/1
/66
10/1
/67
10/1
/68
10/1
/69
10/1
/70
10/1
/71
10/1
/72
10/1
/73
10/1
/74
10/1
/75
10/1
/76
10/1
/77
10/1
/78
Dis
char
ge
cfs
Rickreall gage data at Rickreall
0.01
0.1
1
10
100
1000
10000
09/1
5/65
09/1
5/66
09/1
5/67
09/1
4/68
09/1
4/69
09/1
4/70
09/1
4/71
09/1
3/72
09/1
3/73
09/1
3/74
09/1
3/75
09/1
2/76
09/1
2/77
09/1
2/78
09/1
2/79
09/1
1/80
09/1
1/81Dis
char
ge
in c
fs

Rickreall Watershed : Water Quantity 57
High peak flows may simply be a function of the natural character of stormevents and rainfall patterns in the basin. The upper watershed is bounded byhigh ridges and Laurel Mountain holds the state record for the highest rainfall in a24-hr period.
One must also consider forestry activities in the basin as a possible factor forhigh peak flows in the Rickreall. High densities of roads can route water morequickly to stream channels (Jones and Grant 1996). Road density appears to behigh in the upper basin. Also if relatively high proportions of the basin (e.g., >25%) are in younger stands (i.e., not yet closed canopy, younger than 20 years)high peak flows can result. This is particularly true if there are rain-on-snowevents. Rain-on-snow events may occur anywhere snow accumulates before awarmer rainstorm causes the snow to melt. This zone is approximately between1500 feet to 4000 feet in Oregon. Referring to the minimum temperature data inJanuary in Figure 1-2 (Chapter 1), one can see that average minimumtemperatures in January in the upper basin are right near the freezing point,indicating that the rain-on-snow events could occur as high as Laurel Mountain.Aerial photos and a visit to the watershed suggest that a significant portion of theupper watershed is composed of young stands as a result of both forest harvestsand the fire of 1987. Therefore, high peak flows may be expected until thecanopy begins to reach hydrologic maturity (e.g., closed canopies in at abouttwenty years of age).
While the fire cannot be the explanation for high peak flows prior to 1987, it couldvery well be contributing to any increases in peak flows after 1987. This fire wasquite hot; 40 % of the watershed area above the reservoir was burned with 27 %of the area sustained a complete burn to mineral soil (Hale 1988). Fires canincrease runoff by removing the vegetation and creating rills in slopes. Very hotfires can also cause soils to become hydrophobic and decrease the rate ofinfiltration and thereby greatly increase runoff volumes. Unfortunately there is nogage data after 1981 by which to examine trends of increased flows following thefire.
Surface Water WithdrawalsThe number of permitted users of surface and groundwater in the watershednumber in the hundreds. Point of diversion and point of use data from the WRDare shown in Map 4-1. It has been estimated that 1700 acres of land areirrigated in the lower watershed (White 1998). The point of use in Map 4-1indicates that over 7000 acres are included in point of use permits. The earliestpermits of water use in the watershed go back to the mid 1800’s. Rickreall Creekis currently over-appropriated during the summer and no new water withdrawalpermits are being issued for summer use.

Rickreall Watershed : Water Quantity 58
According to OAR 690-400-11, the definition of over-appropriated is as follows:
1) the quantity of surface water available during a specified period (portion of theyear) is not sufficient to meet the expected demands from all water rights atleast 80 % of the time during that period: or
2) the appropriation of ground water resources by all water rights exceeds theaverage annual recharge to a ground water source over the period of record orresults in the depletion of already over-appropriated surface waters.
Based on this definition, and an analysis of water availability at 80 % exceedanceprobability, the Oregon Water Resources Commission (WRC) made a policydecision to restrict the issuance of new water use permits for Rickreall Creek andits tributaries so as not to contribute further to the condition of over-appropriationpresent in the basin. In 1992, the WRC in essence closed the basin to furtherappropriation of surface water between May 1 and October 31 of each year. Thiswas done to protect senior water rights from being affected by the water use ofjunior appropriators and reduce the likelihood for increased regulation of usersduring the low-flow period (cf. OAR 690-502-100(3) and the Willamette BasinReport).
A water availability report was run according to the guidelines of the OregonWatershed Assessment Manual (Watershed Professionals Network 1999).These reports are the process in which a stream is determined to be over-allocated with respect to permitted water withdrawals diversions or uses. Thereports were run through a web site of the Water Resources Department(http://www.wrd.state.or.us).
Figure 4-5 shows expected flows at the mouth of Rickreall Creek assuming 50 %or 80 % of natural flows might exceed this amount. Also shown are thecombined permitted withdrawals for all uses. The permitted withdrawals exceedthe predicted flow of the stream during the low flow period of July throughSeptember. Because not all water rights are exercised to their maximum all thetime, the amount actually being withdrawn for use is less than that shown in thegraph. On the other hand, many streams in Oregon, including Rickreall havenon-permitted withdrawals. These are not quantified here. These results deservefurther attention as these and the hydrography discussion above suggest that thestream flows may go low in summer and impact aquatic resources. Certainly theadditional releases from Mercer Reservoir (i.e., the draw down of the reservoir)ameliorate the natural low flows. However any uncontrolled withdrawalsexacerbate the problem. The watershed council might want to inventorydiversions and permitted uses to help define a better low flow budget for thestream. This data combined with actual stream discharge measures would helpto assess potential impacts to aquatic resources.

Rickreall Watershed : Water Quantity 59
Figure 4-5: Water availability report for Rickreall Creek showing the projected stream flows bymonth and that allocated to water users. There were no instream rights for Rickreall Creek at themouth. Where the combined allocation exceeds instream flow during the summer months, thestream is over-allocated. (Data from Water Resources Department).
Table 4-1 shows the permitted uses of surface water in the watershed. The Cityof Dallas’ water treatment plant withdraws nearly 4 million gallons per day duringJuly and August. There are no instream water rights established for RickreallCreek at the mouth, but there is a 5 cfs year-round instream water right at RiverMile 19.1. The date of the right is 6/22/64. Rickreall Creek is not listed in Table11 of Weavers et al. (1992) as having a high priority for obtaining additionalinstream water rights.
Table 4-1: Water rights1 for Rickreall Watershed in cubic feet per second (Water ResourcesDepartment 1992)Agriculture Industry Municipal Domestic Recreation Miscellaneous Total rights of record
42.8 0.2 15.3 1.5 0.1 0.8 60.7 1A water right is the amount of water legally allotted to users, not necessarily theamount actually used.
Mercer Reservoir and other ReservoirsThe Rickreall watershed has six reservoirs that are licensed and monitored bythe Water Resources Department. There are smaller reservoirs and ponds thatalso exist and are visible on the USGS 7.5 minute map and on the 1994orthophotos. Basic data on the six reservoirs are given in Table 4-2 and thereservoir locations are show on Map 4-2.
Water availability report Rickreall Creek at mouth50 % and 80 % exceedance
1
10
100
1000
1 2 3 4 5 6 7 8 9 10 11 12Month of year starting in January
Wat
er c
fs
Natural predictedflow 50 %exceedance
Natural predictedflow 80 %exceedance
Allocated to users

Rickreall Watershed : Water Quantity 60
Table 4-2: Reservoirs in Rickreall watershed monitored by Water Resources Department(Shulters 1974; Willamette / North Coast PIEC 2000).
# onMap 4-2 Name Year
built Use Areaacres
Drainagearea mi2
Max.depth ft Owner
1 MercerReservoir 1958 storage /
diversion 60 18 60 City of Dallas
2 EdigerReservoir
1957 private rec./ irrigation
10 0.9 15 private
3 MorganBros. Res. 1968 irrigation /
storage 35 0.6 10 Baskett SloughNWR
4 Marx Res. 2 n.d. private rec./ irrigation 6 0.4 15 private
5 Marx Res. 1 1964 maintainreservoir 2
8 0.2 n.d. private
6 Stevens n.d. n.d. 3 0.7 n.d. private
Mercer Reservoir is created by an earthen dam. It is 460 feet long by 79 feethigh with a concrete spillway. The dam was built in 1958 then elevated in 1973 toincrease the water storage capacity from 1200 acre-feet to 1550 acre-feet. (Oneacre-foot is the volume of water that covers an acre to a depth of one foot.) Thedam is owned and operated by the City of Dallas, but the land at and above thereservoir is owned by Boise Cascade, Willamette Industries and BLM. There isno fish passage and Rickreall Creek above Dallas is considered to be steelheadhabitat by ODFW and entire Rickreall is included as part of the Upper Willamettecritical habitat designation of the National Marine Fisheries Service (FederalRegister 2000). Dam is considered to be in non-compliance for fish passage (S.Mamoyac, pers. comm.).
The operating procedure by the City is to fill the reservoir in the fall. Excesswater passes the spillway until July. At that time, the City begins drawing downthe reservoir to maintain stream flows of 10 cfs to allow for sufficient flow at themunicipal water intake downstream and for additional water to continue past theintake. Releases are based on weather forecasts. City has instituted elementsof conservation such as education and an increasing block rate pay rate structurewhere greater use pays higher rates (Shea 1998).
Access into the upper watershed was open to the public until 1986 when thedecision was made to limit public access. Vandalism and erosion were cited asthe reasons for gating the road to the upper watershed near Ellendale. Non-motorized use is still allowed and the gate is opened for the public vehiclesduring deer hunting season.
Increased water demand with growth of the city and decreased storage volume inthe reservoir from sediment filling is a problem the City is must solve. In the fallof 1987 a forest fire burned 5,000 acres of the watershed with 3,300 acresburned of all vegetation. It was estimated that as much as 100 acre-feet ofsediment would fill the reservoir that winter (Miles 1989). The burn area wasquickly seeded with annual grass and sediment retention barriers were installed.Ten acre-feet of sediment eventually entered the reservoir as a result of the fire.It has been estimated that between 10 and 25 acre-feet is also the annualstorage loss to sediment (D. Shea 1998, CH2MHill 1999). The 1996 floods
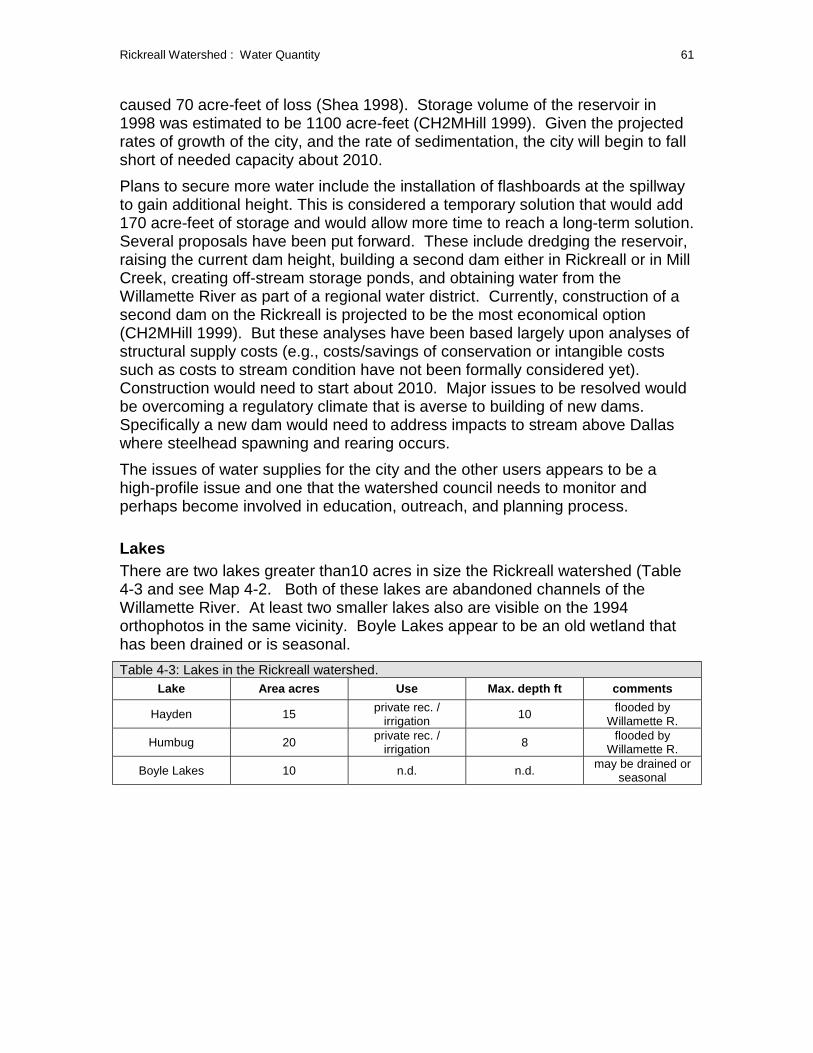
Rickreall Watershed : Water Quantity 61
caused 70 acre-feet of loss (Shea 1998). Storage volume of the reservoir in1998 was estimated to be 1100 acre-feet (CH2MHill 1999). Given the projectedrates of growth of the city, and the rate of sedimentation, the city will begin to fallshort of needed capacity about 2010.
Plans to secure more water include the installation of flashboards at the spillwayto gain additional height. This is considered a temporary solution that would add170 acre-feet of storage and would allow more time to reach a long-term solution.Several proposals have been put forward. These include dredging the reservoir,raising the current dam height, building a second dam either in Rickreall or in MillCreek, creating off-stream storage ponds, and obtaining water from theWillamette River as part of a regional water district. Currently, construction of asecond dam on the Rickreall is projected to be the most economical option(CH2MHill 1999). But these analyses have been based largely upon analyses ofstructural supply costs (e.g., costs/savings of conservation or intangible costssuch as costs to stream condition have not been formally considered yet).Construction would need to start about 2010. Major issues to be resolved wouldbe overcoming a regulatory climate that is averse to building of new dams.Specifically a new dam would need to address impacts to stream above Dallaswhere steelhead spawning and rearing occurs.
The issues of water supplies for the city and the other users appears to be ahigh-profile issue and one that the watershed council needs to monitor andperhaps become involved in education, outreach, and planning process.
LakesThere are two lakes greater than10 acres in size the Rickreall watershed (Table4-3 and see Map 4-2. Both of these lakes are abandoned channels of theWillamette River. At least two smaller lakes also are visible on the 1994orthophotos in the same vicinity. Boyle Lakes appear to be an old wetland thathas been drained or is seasonal.
Table 4-3: Lakes in the Rickreall watershed.Lake Area acres Use Max. depth ft comments
Hayden 15 private rec. /irrigation
10 flooded byWillamette R.
Humbug 20 private rec. /irrigation 8 flooded by
Willamette R.
Boyle Lakes 10 n.d. n.d. may be drained orseasonal

Rickreall Watershed : Water Quantity 62
WetlandsWetlands occur in several locations in the Rickreall watershed. The OregonNatural Heritage Program mapped natural wetlands in the Willamette Valley(Map 4-2). These wetlands lie in areas along the Willamette River on the lowestterrace and along the floodplain of the Rickreall Creek downstream of Dallas.Additional wetlands have been created in the northeast portion of the watershedon lands owned by Mark Knaupp and in the Baskett Slough National WildlifeRefuge. The USGS 7.5 minute map shows additional wetlands in an unnameddrainage just east of Ellendale Creek. The Boyle Lakes area may be considereda wetlands as the 1851 GLO map indicates that a wetland occurred in thatvicinity (Map 5-3). According to the 1994 orthophotos, this wetland appears tobe seasonal at best or has been drained.
Figure 4-6: Former wetland area called Boyle Lakes on 7.5 minute USGS map appears to bedrained on 1994 orthophotos. This area appears to be a wetland on the 1851 vegetation map(Map 5-3 in Chapter 5).

Rickreall Watershed : Water Quantity 63
Map 4-1: Water use in Rickreall watershed as permitted by the Oregon Water ResourcesDepartment. Points of diversion are locations were water is taken per the permit. Points of useare the areas where water is used.
##
#
SS
S SS SS SS SSSSS S
S SSS SSSS SSS
S SSSSSSSS
SSS S SSSS
SSS SS SSS
SS SSS SS
S SSSS SS SSSSS S SS SSS S S S S
SS S SSSS S SSS S SS S SSS SSSSSSSS SSS SSS SS S SS SS SSS S SS S SS SS S SS SSS SS SS SS SSS SS SSSS SSSS SSSS S SS SS SS SS S SSS SSS SS SSSS SS SSSS S SS SSS SSS SSS S S SSS SS SSS S SSSS SS SS SS SS SS SS SS S SSSSS S SSSS S SS S SS SS S SSSSSSS SS SS SS SS SSSS S
SSS SS SS SSSS SSS SSS SSS SS S
SS SSS S
SS S SS
S S SSSS SSSS SS
EOLADALLAS
RICKREALL
5 0 5 Miles
N
EW
S
Independence
StreamsPoint of use
S Point of diversions
Source: Salem BLM Willamette / North Coast PIEC W RD
Water use rights

Rickreall Watershed : Water Quantity 64
Map 4-2: Water bodies in Rickreall watershed. Numbered circles refer to reservoirs that havedams that are monitored by Oregon Water Resources Department. Numbers refer to data inTable 4-2. Wetlands are those mapped by Oregon Natural Heritage Program (in yellow) plusother added wetlands (from USGS 7.5-minute map, 1994 orthophotos, or from field visits).
##
#
##
##
#
#
EOLADALLASRICKREALL
5 0 5 Miles
N
EW
S
Independence
Streams# Reservoirs with dams monitored by WRD
RoadsNatural wetlands mapped by ONHP
Salem BLM W illamette / North Coast PIEC
3
45
6
#
1
#
2 #
Baskett Slough NW Rwetlands
#
wetland#
NRCS constructed wetland
Waterbodies: reservoirs, lakes, wetlands
#
Boyle Lakes#
Hayden Lake #
Humbug Lake

Rickreall Watershed Assessment: Aquatic and Terrestrial 65
Chapter 5 : AQUATIC AND TERRESTRIAL RESOURCES
Fish Diversity and Sensitive SpeciesThe Rickreall Creek watershed is home to 13 native and at least 12 introduced fishspecies (Table 5-1).
Table 5-1: Fish species thought to occur in the Rickreall Creek and its tributaries
Native species: Introduced species:
Common name Scientific name Common name Scientific namecutthroat trout Oncorhynchus clarki Coho salmon 1 Oncorhynchus kisutch
Steelhead O. mykiss Brown trout 1 Salmo truttaChinook salmon 1 O. tshawytscha Warmouth sunfish 1 Lepomis gulosusPacific lamprey 1 Lampetra tridentata Bluegill sunfish 1 L. macrochirus
western brook lamprey L. richardsoni Pumpkinseed 1 L. gibbosusspeckled dace Rhinichthys osculus Brown bullhead 1 Ameiurus nebullosus
northern pike minnow Ptychocheilus oregonensis Mosquitofish 1 Gambusia affinislargescale sucker Catostomus macrocheilus Yellow perch 1 Perca flavescens
redside shiner Richardsonius balteatus Smallmouth bass Micropterus dolomieureticulate sculpin Cottus perplexus Largemouth bass M. salmoides
torrent sculpin C. rhotheus White crappie 1 Pomoxis annularissandroller 1 Percopsis transmontana Black crappie 1 P. nigromaculatus
Oregon chub 1 Oregonichthys crameri1 Thought to occur infrequently.Data from Table 4 of Altman et. al. 1997 with additions from various sources. Pacific lamprey and northern pikeminnow reported by C. Hazel, pers. com.; brook lamprey electroshocked by author during site visit; Oregon chublisted as occurring in Baskett Slough NWR according to BLM GIS layer.
It should be pointed out that fish surveys in the Rickreall watershed have beenconducted only on a limited basis and surveys were typically designed to find cutthroatand steelhead. Surveys that have been conducted include several ODFW electrofishingsurveys in the mainstem and tributaries conducted since 1980. Gill netting of MercerReservoir during 1970s, Oregon Department of Forestry (ODF) upper extent fish usesurveys in several of the tributaries, downstream migrant trapping at ViIlwok’s Dam(concrete ford at River Mile 8). These data are available from ODFW (S. Mamoyac,Corvallis Office) and all summaries or field data sets (except for Villwok’s Dam data) areon file at the Rickreall Watershed Council Office.
Seven fish species are discussed below because they are considered “sensitive” in thateither they face some known level of challenge to their continued population levels orthe existing information on the condition of their population is limited and there is reasonfor concern for health of the species (Table 5-2).
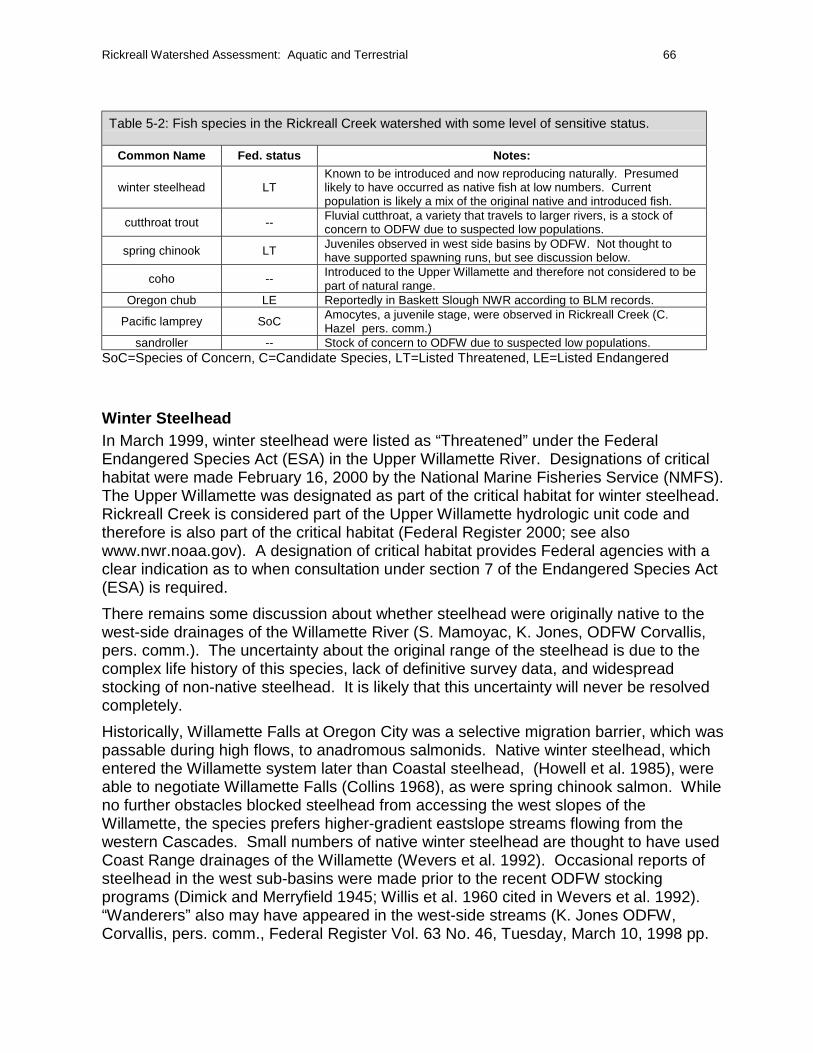
Rickreall Watershed Assessment: Aquatic and Terrestrial 66
Table 5-2: Fish species in the Rickreall Creek watershed with some level of sensitive status.
Common Name Fed. status Notes:
winter steelhead LTKnown to be introduced and now reproducing naturally. Presumedlikely to have occurred as native fish at low numbers. Currentpopulation is likely a mix of the original native and introduced fish.
cutthroat trout -- Fluvial cutthroat, a variety that travels to larger rivers, is a stock ofconcern to ODFW due to suspected low populations.
spring chinook LT Juveniles observed in west side basins by ODFW. Not thought tohave supported spawning runs, but see discussion below.
coho -- Introduced to the Upper Willamette and therefore not considered to bepart of natural range.
Oregon chub LE Reportedly in Baskett Slough NWR according to BLM records.
Pacific lamprey SoC Amocytes, a juvenile stage, were observed in Rickreall Creek (C.Hazel pers. comm.)
sandroller -- Stock of concern to ODFW due to suspected low populations.SoC=Species of Concern, C=Candidate Species, LT=Listed Threatened, LE=Listed Endangered
Winter SteelheadIn March 1999, winter steelhead were listed as “Threatened” under the FederalEndangered Species Act (ESA) in the Upper Willamette River. Designations of criticalhabitat were made February 16, 2000 by the National Marine Fisheries Service (NMFS).The Upper Willamette was designated as part of the critical habitat for winter steelhead.Rickreall Creek is considered part of the Upper Willamette hydrologic unit code andtherefore is also part of the critical habitat (Federal Register 2000; see alsowww.nwr.noaa.gov). A designation of critical habitat provides Federal agencies with aclear indication as to when consultation under section 7 of the Endangered Species Act(ESA) is required.
There remains some discussion about whether steelhead were originally native to thewest-side drainages of the Willamette River (S. Mamoyac, K. Jones, ODFW Corvallis,pers. comm.). The uncertainty about the original range of the steelhead is due to thecomplex life history of this species, lack of definitive survey data, and widespreadstocking of non-native steelhead. It is likely that this uncertainty will never be resolvedcompletely.
Historically, Willamette Falls at Oregon City was a selective migration barrier, which waspassable during high flows, to anadromous salmonids. Native winter steelhead, whichentered the Willamette system later than Coastal steelhead, (Howell et al. 1985), wereable to negotiate Willamette Falls (Collins 1968), as were spring chinook salmon. Whileno further obstacles blocked steelhead from accessing the west slopes of theWillamette, the species prefers higher-gradient eastslope streams flowing from thewestern Cascades. Small numbers of native winter steelhead are thought to have usedCoast Range drainages of the Willamette (Wevers et al. 1992). Occasional reports ofsteelhead in the west sub-basins were made prior to the recent ODFW stockingprograms (Dimick and Merryfield 1945; Willis et al. 1960 cited in Wevers et al. 1992).“Wanderers” also may have appeared in the west-side streams (K. Jones ODFW,Corvallis, pers. comm., Federal Register Vol. 63 No. 46, Tuesday, March 10, 1998 pp.

Rickreall Watershed Assessment: Aquatic and Terrestrial 67
800). Fish ladders were added at Willamette Falls as early as 1885 to facilitate thepassage of fish species, with major improvements to these ladders in 1971 (Bennett1987; PGE 1994; Cited from Fed. Reg. Vol. 63, No. 46. Tuesday, March 10, 1998 pp.1800). Fish ladders allowed the successful introduction to the Willamette Basin ofSkamania stock summer steelhead and early migrating Big Creek stock wintersteelhead, as well as coho salmon.
Steelhead were stocked throughout the Willamette Basin, including the Rickreall Creek.ODFW released adult winter steelhead to the Rickreall Creek basin in 1969 and again in1971. These releases consisted of approximately 200 adult fish per year of Big Creekhatchery stock. In 1982, 24,600 steelhead fry from Eagle Creek stock were released toCanyon, Skid, and Applegate Creeks. From 1984 through 1990, fry from Big Creekstock were released to Rickreall, Canyon, Applegate and Skid Creeks (Wevers et al.1992).
Naturally reproducing steelhead have been documented in the Rickreall watershed. Adownstream weir trap, operated at the concrete ford at River Mile 8 (also referred to asVillwoks Dam), caught juvenile steelhead thought to be smolts over a two-year periodduring the mid-1970’s (S. Mamoyac, pers. comm., data on file at ODFW offices inCorvallis). In electrofishing surveys in Rickreall Creek below Dallas performed onseveral occasions from February of 1988 to June 1990 both adult cutthroat and adultunclipped steelhead were shocked as were O. mykiss juveniles (thought to besteelhead and not resident rainbow trout), (S. Mamoyac, pers. comm.). The term“unclipped” refers to the lack of a clip to the adipose fin. Such a clip is often used tomark hatchery juvenile fish before they are released into streams. Therefore anunclipped fish is good indication that it is a wild or naturally spawned fish. As recentlyas 1999, steelhead juveniles have been electroshocked in the mainstem (River Mile 19and River Mile 23) and in Canyon Creek (raw data forms provided by S. MamoyacODFW fisheries biologist, Corvallis).
Allozyme analysis was performed on 34 juvenile steelhead taken from Canyon Creekduring September, 1997. Sampling was part of a larger project to determine geneticorigins of steelhead. The data were requested by the National Marine FisheriesService’s (NMFS) biological review team during their determinations of critical habitatfor winter steelhead. These analyses showed clustering of allozymes from steelhead inthe Santiam watershed which were thought to typify historic native steelhead to theWillamette basin. The allozymes from the west slope streams (Rickreall and Yamhill)did not cluster with the Santiam group but appeared to be more similar to stocks outsidethe basin such as lower Columbia stocks (D. Teel, NMFS, Manchester WA, pers.comm.).
Teel cautions that genetic testing on populations is not an unequivocal process; thatthere is some variation within populations, and one doesn’t know what a native fishshould cluster like. Also that a fish has become naturally reproducing is important. Theissue of native versus stocked origins is more important for ESA considerations. TheODFW still appears to value the steelhead in Rickreall Creek as it lists Rickreall Creekas providing spawning and rearing habitat for steelhead on its website.

Rickreall Watershed Assessment: Aquatic and Terrestrial 68
Resident rainbow trout—non-anadromous rainbows--are not thought to be native to thewestslope drainages of the Willamette River. Releases of Roaring River hatcheryrainbow trout have been made in these drainages since the 1920’s to provide a sportfishery. While there is no evidence of natural production of rainbow trout from hatcheryreleases (Wevers et al. 1992), stocked rainbow possibly may have resulted in a smallnumber of returning steelhead (C. Bond, pers. comm.). For O. mykiss to be consideredresident rainbow in the Rickreall, they would need to be found isolated above thereservoir and there are no documented captures of rainbow trout above the reservoir.
Cutthroat TroutWhile four life-history types occur in the coastal cutthroat trout (resident, fluvial,adfluvial, and anadromous), only two of these types occur naturally in the west slopestreams of the Willamette River. Resident cutthroat are those that live the entire year ina single pool or set of pools, are widespread, and are the dominant trout in theheadwater streams of western Oregon (Hooton 1997). Indeed, abundant cutthroat troutwere observed in several tributaries (Rockhouse Creek, Canyon Creek, and SkidCreek) by the watershed analysts during field visits this summer. Larger, fluvialcutthroat complete in-river migrations between small spawning tributaries and main riversections such as the Willamette. Populations of fluvial cutthroat in the Rickreall Creekmay have been larger in the recent past, as this is the case with other west side rivers,such as the Marys River. Adfluvial cutthroat trout are those that migrate betweenstream and lakes. These likely occur now in the Rickreall since the construction ofMercer Reservoir.
Several surveys have documented cutthroat trout throughout the watershed. TheODFW performed gill net surveys every odd year for a 10-year period in MercerReservoir. The nets were set for 16 to 24 hours at a point just opposite the mouth ofRockhouse Creek or just west of the mouth. The data shows relatively abundantcutthroat trout in Mercer Reservoir (Table 5-3). The average length varied between 8and 10 inches, the largest trout caught was 13 inches. Two large mouth bass were alsocaught during the surveys.

Rickreall Watershed Assessment: Aquatic and Terrestrial 69
Table 5-3: Gill netting data from Mercer Reservoir.
date # nets # cutthroat caught mean length in.
4/9/81 2 89 8.1
4/19/83 1 27 8.5
4/9/85 1 38 9.6
4/15/87 1 18 9.6
4/19/89 1 40 10.4
4/10/91 1 41 9.6
As part of the Oregon Department of Forestry (ODF) stream protection rules, fish usemust be determined in streams before forestry operations near the stream can beallowed. The far upper reaches of about seven tributaries have also been surveyed. Innearly five cases of these upper extent surveys in the Rickreall basin, the surveys wereperformed on planned forestry operation that were located above the upper extent offish use and therefore no fish were found. In the two surveys that found fish, thesurveys established that fish use ends at least a 1/4 mile downstream of Silver Falls onthe North Fork of Rickreall, and that fish use ends at a 5-10’ waterfall in the west portionof section 7 on the South Fork of Rickreall Creek. Also these surveys established thatno fish occur above Silver Falls. The remaining surveyed streams that held no fishwere very small and located in steep headwaters.
It was not surprising that no fish were found in such habitat. Generally, most streamsthat are not separated from downstream reaches by an impassible barrier can beexpected to support cutthroat, at least in the spring of the year, in reaches withgradients up to 15 % and in water with depths of 1 foot. In some cases, fish will evenbe found upstream of impassable barriers if the habitat is adequate. In nearly all cases,cutthroat trout will be the fish found highest in the basin.
Only small portions of the headwater stream have been covered in these surveys.Indeed the distribution of cutthroat in the Coast range is poorly documented by surveysto date. But the ODF program of stream protection and fish surveys will continue toslowly map these streams for fish use. Because cutthroat are the dominant residentfish in headwater streams in the Coast Range, they are a good indicator of streamhealth and watershed condition. A better understanding of the status of cutthroat troutin the upper Rickreall watershed above the reservoir would provide a useful gauge ofthe watershed, both at the time of the surveys and through time with continuing surveys.Upper extent presence-absence surveys are fairly easy to perform and cost about $150per stream to perform. The role of the reservoir and the effect of the 1987 fires wouldbe of interest in influencing fish use of streams.
Cutthroat trout appear to be secure in the mainstem Rickreall below the reservoir.ODFW electroshocking surveys for steelhead found abundant cutthroat numbers.During a field visit by the assessment team, many adult cutthroat were spotted in thevicinity of Applegate and Skid Creeks. Some of the larger fish were nearly 12 inches in

Rickreall Watershed Assessment: Aquatic and Terrestrial 70
length. Smaller cutthroat were observed in the tributaries. The habitat lookedreasonably good according to the criteria in Table 5-2; however large woody debrisappeared to be quite low (Photo 5-1).
The status of cutthroat trout in the lower Rickreall below Dallas is unclear. The habitatlooks reasonably good to support cutthroat (see Photo 1-2, Chapter 1). Electrofishingsurveys by the ODFW produced cutthroat in some instances but not in others. Thissuggests that cutthroat use the stream seasonally, exist in selected areas, or exist atlow densities.
Table 5-4: General considerations for cutthroat trout habitat requirements.
Oriented towards pools versus riffles, and use cover such as woody debris (jams and logs) andoverhanging banks.
Adults prefer intermediate stream velocities (1 ft/sec or slower) and deeper water.
Fry use slower water and are often associated with complex lateral habitats.
Juveniles may be outcompeted by juvenile steelhead or coho in areas that lack sufficient cover.
An optimum temperature for juveniles is 60°F; the ability to swim is lost at 82°F.
Juveniles have been known to remain in a single pool for several years or to make significantmigrations within a basin.
Frequently attain large size in beaver ponds, larger pools or reservoirs.
http://www.orst.edu/Dept/ODFW/conference/cuthab.html. March 1999.
Photo 5-1: Rickreall Creek at Applegate Creek has low wood but cutthroatnumbers appeared to be relative abundant.

Rickreall Watershed Assessment: Aquatic and Terrestrial 71
Chinook SalmonSpring chinook historically were able to negotiate Willamette Falls during high flows(Collins 1968) and are a native anadromous fish to the upper Willamette River. SpringChinook in the upper Willamette were listed as “Threatened” under the ESA in March1999. A decline in the abundance of these fish is attributed to reduced habitat coverageand quality, and suspected over-harvesting of native fish for a large hatchery program.
Carl Bond, retired fisheries professor from Oregon State University reports that hismajor professor, Roland Dimick, lived in the area in the 1920’s and would have known ifthere were salmon in the Rickreall Creek. According to Bond, it was Dimick’s opinionthat chinook had never used the Rickreall Creek or other westslope drainages. Chinook,juveniles have been observed in the lower mainstem of the Mary River (S. Mamoyac,Corvallis ODFW, and M. Wade, Springfield ODFW, pers. comm.). It is possible that theRickreall Creek provides over-wintering and rearing habitat for juvenile chinookspawned in the mainstem of the Willamette or other tributaries. The ODFW considersthe lower Rickreall to about the community of Rickreall as providing rearing andmigration habitat on its website. Winter surveys may be of interest to the Rickreallwatershed council to determine whether juvenile chinook use the lower Rickreall orpossibly Baskett Slough.
Coho SalmonCoho salmon are not native to the Willamette River above Willamette Falls. However,they have been in the basin for almost 80 years as a result of introductions that startedin the1920’s (Wevers et al. 1992). In 1958, ODFW began a larger stocking program,introducing Toutle, Cowlitz or other hatchery-origin coho into several Rickreall Creektributaries over a 30-year period. The stocking program failed to establish a majorfishery in the Rickreall or elsewhere in the Upper Willamette. But the ODFW still listsRickreall and Canyon Creeks as providing potential spawning and rearing habitat.Indeed there are anecdotal reports of coho. One report relates a fisherman who caughta coho in the last five years. A second report is of an experience angler that sightedcoho adults over spawning redds in the mainstem near Pioneer Road (G. Nelson, pers.comm.).
Oregon chubOregon chub are listed as occurring in Baskett Slough NWR on BLM GIS data layers.Oregon chub was listed as endangered under the ESA by the US Fish and WildlifeService in 1993. The Oregon chub occurs only in the Willamette and Umpqua basins,and the Umpqua Oregon chub is taxonomically distinct from Willamette populations(Markle et al. 1991). The preferred habitat of the Oregon chub is quiet water such assloughs and overflow ponds at low elevations in the Willamette Valley (Dimick andMerryfield 1945). Much of the historic range of these fishes has disappeared in theWillamette River and its tributaries as a result of the construction of flood control dams,channelization of the river and channel cleaning for the purpose of navigation (Sheerer1998). In addition to the loss of habitat, introduced species may inhibit theestablishment of new populations of chub, which colonize during high-flow events. Non-
Rickreall Watershed Assessment: Aquatic and Terrestrial 72
native fish are present at approximately half of the known population sites of Oregonchub.
Currently twenty-four populations are known to exist, with four of these being newlyestablished from transplants performed by ODFW. One of the oldest knownpopulations exists in Gray Creek, a tributary of Muddy Creek in the Finley NationalWildlife Refuge in the Marys River watershed. This population is considered stable, at450-600 individuals. ODFW has an ongoing investigation into Oregon chub abundanceand distribution (Sheerer, pers. comm.). The US Fish and Wildlife Service hasproduced a Recovery Plan for the Oregon Chub that outlines the goals and objective formanagement for the recovery of this unique species. The Rickreall Watershed Councilmay wish to look for other potential areas where the chub may exist.
Pacific lampreyLamprey are listed throughout the Columbia River system as a candidate species byNMFS (BLM 1997). Habitat loss from hydropower projects and declines in populationsof salmonids are thought to contribute to their decline. These fish, which areanadromous, parasitize salmonids in their ocean phase and are unable to negotiate fishladders and other obstacles. Between 1943 and 1949, the Willamette River supporteda commercial fishery on these fish with an average annual harvest of 233,179 pounds(Wydoski et al. 1979). There is additional information on this species and otheranadromous fish on the StreamNet website:(http://www.streamnet.org/ff/lifehistory/anad_table.html). (The space following “anad” isactually an underline symbol “_”. )
Sand rollersSand rollers (also known as trout perch) have been listed as a “stock of concern” byODFW due to suspected low populations. They are native only to the lower ColumbiaRiver and its tributaries, including the Willamette River. Little is known about thisspecies, though they are thought to hide in daylight hours among large submergedobjects and feed at night over sandy substrates. Sand rollers were been documentedas occurring at River Mile 8.5 of the Rickreall back in 1954 by OSU personnel (Weverset al. 1992). Because of their secretive nature, sand roller populations may beunderestimated. Sand rollers and Oregon chub are considered the two most endemicfish species of the western Cascades/ Willamette River basin region, with little to nooccurrence in other regions (Hughes et al. 1987). Most of the introduced warm waterspecies listed in Table 5-1 would occur in the lower mainstem of the Rickreall Creek andmay prey upon and compete with sandrollers. Much of the historic habitat of sandrollershas been lost to the draining of wetlands and channelization (Dunette 1997).
ODFW Survey Data Sets for Rickreall WatershedThe ODFW has been performing stream habitat surveys over the state of Oregon since1990. These surveys have also been supported financially by the Oregon ForestryIndustry Council. This information is collected during the summer months by ODFWstream survey crews. The methods have been most recently described by Moore et al.

Rickreall Watershed Assessment: Aquatic and Terrestrial 73
(1997). The field data focuses on channel and valley morphology (stream and reachdata), riparian characteristics and condition (reach data), and instream habitat (habitatunit data).
The survey data is compiled into a comprehensive database that is used in fishmanagement and planning activities. The data is available in ArcInfo on the Internet.The “reach” data set for Rickreall watershed generalizes the habitat units that weresurveyed by ODFW. The reach data gives an overview of the conditions within thereach or section of stream. Another data set maintained by ODFW and available to thepublic is the “habitat” data set. The habitat data set includes all of the unit data for theentire survey. The reach data set shown here is a summarization of the habitat data set.Approximately 1/3 of the reach data set is shown here. The most pertinent data wasselected for the summary table.
The ODFW surveys concentrated on the upper portions of Rickreall Creek and includedRockhouse Creek and two smaller tributaries. The surveys were generally aboveRickreall River Mile 20, although a 435-m section was included at the mouth and is alsoreferred to as Reach 1. Note also that the mainstem of Rickreall Creek according tothe ODFW surveys (and the USGS map) is different from what the GIS layers from PolkCounty and therefore the most of the maps in this document. The ODFW and USGSconsider the main stem to be what some maps refer to as the North Fork, while the PolkCounty GIS layers indicate the mainstem as the South Fork. Where confusion mayexist, we will refer to forks as North or South, respectively.
Table 5-5 summarizes the ODFW surveys. Some general patterns are evident in thedata with respect to the reservoir. However, it should be noted that the reaches belowthe reservoir are generally of lower gradient than those above the reservoir. Gradient isa strong controlling element of channel condition. Some of the differences amongreaches are a result of differences in gradient. These must be kept in mind whencomparing these data.
1. Significant lengths of the channel of Rickreall are constrained by terraces or valleyside slopes (c.f. valley types or channel types). Less constraint in valley types wererecorded in reaches 2, 5 and 6. These observations agree with the channel habitattyping of this assessment, where most of the channel was classed as confinedexcept those below and above the reservoir.
2. The stream and channel is at least twice as wide below the reservoir (c.f., wetwidths, active channel widths, or terrace widths). Active channel widths are muchgreater below the reservoir
3. Land use and riparian conditions indicates that greater amounts of forest harvestingactivity was occurring above the reservoir. The reaches above the reservoir hadeither young trees, second growth trees, or in timber harvest conditions. Also, theseupper reaches had greater proportion of the riparian vegetation in smaller trees andgreater amounts in pure hardwood stands. There were also fewer numbers of largeconifers (e.g., conifers > 20 “ dbh).
4. Pool area was generally high (e.g., > 30 %) in most reaches. Low pool area tendedto occur in reaches of highest gradient or smallest tributaries. Figure 5-1 shows thestrong trend of gradient in the pattern of pool area among reaches. The three

Rickreall Watershed Assessment: Aquatic and Terrestrial 74
reaches above the reservoir in the mainstem of Rickreall have a tendency towardgreater pool area than the three reaches below the reservoir, despite being ofslightly higher gradient.
5. The most significant pattern is one of higher fine substrate sizes in the sediment ofreaches above the reservoir compared to reaches below the reservoir (e.g., sand orgravel in total habitats and in riffles). Reservoirs tend to trap sediment that wouldnormally be processed downstream. Reservoirs also modify flows downstream byreducing both high and low flow extremes. Flood flows are the way in which streamsintroduce gravels and distribute them downstream. It is unlikely that MercerReservoir affects gravel content by modified high flows as high flows are allowed topass over the dam. More likely, the reservoir is acting to trap gravels that wouldnormally move downstream from headwater areas. Measurements to 1990 indicatethat the reservoir has trapped 350+ acre-ft of sediment since it was constructed in1960 (CH2M Hill, 1995). One acre foot of sediment, if spread over the activechannel for eight miles below the reservoir, would be 1-foot deep.
6. Woody debris is quite low in lower Rickreall Creek. Volumes increase above theSummary of Survey of Lower Rickreall by CH2M Hill reservoir as gradients increase.This is an expected trend. However, it is likely the reservoir is trapping pieces ofwoody debris.

Rickreall Watershed Assessment: Aquatic and Terrestrial 75
Table 5-5: ODFW Stream Reach Summaries for Rickreall Watershed: grouped by location with respect to Mercer Reservoir. Reaches belowthe reservoir are shown in gray; those above the reservoir are shown in white.
Stream Reach Surv_date
Gradient Length land land Rip Rip Pool Valley Valley Channel Wet Act ch
area widthindx
type type width width
m/d/y % m use1 use2 veg1 veg2 % m mRICKREALLmouth
1 Aug-93 1 435 YT M30 S 37 8.6 CT CA 6.7 13.8
RICKREALL 1 Aug-93 1 17452 YT M30 S 37 8.6 CT CA 6.7 13.8
RICKREALL 2 Aug-93 0.9 1618 ST LT M30 46.7 1 MV CH 7 11
RICKREALL 3 Sep-93 0.9 7097 LT YT M30 S 29.9 5.3 CT CA 8 15.3
RICKREALL 4 Sep-93 1.4 8085 LT YT M30 S 24.3 1 OV CH 10.3 17.2
RICKREALL 5 6648
Mean 1.0 6889 35.0 4.9 7.7 14.2
RICKREALL 6 Aug-93 1.9 15944 YT D15 D3 49.8 1.4 OV CH 7.3 9.2
RICKREALL 7 Aug-93 11.1 15543 TH LT D15 D3 34.2 1.3 MV CH 3.9 6.4
RICKREALL 8 Aug-93 2.3 3470 ST ST M15 M3 58.2 10.5 CT TC 3.3 3.2
RICKREALLTRIB
1 Aug-93 20.7 1468 ST C15 C3 19.3 1.5 SV CH 2 2.1
ROCKHOUSE 1 Jul-93 3.3 10211 YT D15 47.6 19.5 CT TC 3.1 4.2
ROCKHOUSE 2 Aug-93 8.2 1528 YT ST M15 12.6 3 MT US 1.8 1.9
ROCKHOUSE 3 Aug-93 22.8 754 TH ST D3 1.2 1 MV CH 1.5 1.7
ROCKHOUSETRIB
1 Aug-93 6.7 2707 ST TH D30 18.1 20 CT TC 2.4 5.7
ROCKHOUSETRIB
2 Aug-93 8.4 1173 ST D30 4.4 6 MT US 1.2 1.5
Mean 9.5 5866 27.3 7.1 2.9 4.0

Rickreall Watershed Assessment: Aquatic and Terrestrial 76
Tablecontinued
Reach Terrace Act ch Terrace Sand Gravel Sand Gravel Bedrock Shade Bank LWD Max Conifer
width ht ht total total riffles riffles erosion vol temp > 20"
m m m % % % % % % % m3/100m
C #/1000m
RICKREALLmouth
1 21 0.8 2.6 7 15 7 16 0 71 0 7.6 20 84.5
RICKREALL 1 21 0.8 2.6 7 15 7 16 0 71 0 7.6 20 84.5
RICKREALL 2 0 0.8 0 0 14 0 10 0 75 0 0.8 17 0
RICKREALL 3 21 0.7 1.6 3 16 0 14 0 81 0 5.4 13 60.3
RICKREALL 4 0 0.6 0 3 11 0 10 0 83 0 6 17 30.2
RICKREALL 5
Mean 12.6 0.7 1.4 4.0 14.2 2.8 13.2 0.0 76.2 0.0 5.5 17.4 51.9
RICKREALL 6 18 0.6 6.5 14 21 8 25 0 63 0.1 10.3 19.4 12
RICKREALL 7 10.5 0.3 2.1 13 15 11 21 0 82 0.3 26.5 12.8 42.2
RICKREALL 8 5.9 0.3 0.7 48 37 36 40 0 63 1 24 9.4 0
RICKREALLTRIB
1 4.8 0.2 0.8 15 22 15 29 0 81 0 53.6 11.7 0
ROCKHOUSE 1 5.9 0.3 0.6 22 35 18 39 0 72 4 13.9 13.3 18.1
ROCKHOUSE 2 2.4 0.2 0.6 16 37 12 36 0 88 4.7 17.2 16.7 0
ROCKHOUSE 3 3 0.3 0.6 22 39 10 35 0 98 0 32.3 14.4 0
ROCKHOUSETRIB
1 6 0.3 0.8 20 33 20 31 0 83 0 24.9 17.8 0
ROCKHOUSETRIB
2 2 0.2 0.7 15 32 19 32 0 78 0 61.1 13.3 0
Mean 6.5 0.3 1.5 20.6 30.1 16.6 32.0 0.0 78.7 1.1 29.3 14.3 8.0

Rickreall Watershed Assessment: Aquatic and Terrestrial 77
Pool area vs gradient
0
10
20
30
40
50
60
70
0 5 10 15 20 25
Reach gradient (%)
Po
ol a
rea
(%) Rickreall below res
Rickreall above res
Rickreall mouth
Tribs
Rockhouse
Riffle gravel vs gradient
0
10
20
30
40
50
0 5 10 15 20 25
Reach gradient (%)
% g
rave
l in
rif
fles Rickreall below res
Rickreall above res
Rickreall mouth
Tribs
Rockhouse
LWD vs gradient
0
10
20
30
40
50
60
70
0 5 10 15 20 25
Reach gradient (%)
Lar
ge
wo
od
y d
ebri
s vo
lum
e (m
3/10
0m s
trea
m)
Rickreall below res
Rickreall above res
Rickreall mouth
Tribs
Rockhouse
Figure 5-1: ODFW survey reach summaries versus reach gradient in Rickreall Creek.

Rickreall Watershed Assessment: Aquatic and Terrestrial 78
Survey of Lower Rickreall Creek by CH2MHillIn October 1995, CH2MHill performed a foot survey of stream morphologicalcharacteristics of the Rickreall Creek from the mouth upstream to the wastewatertreatment plant at River Mile 10 (CH2MHill 1996). The survey was performed by anexperienced fisheries biologist. The surveyor summarized the stream condition asfollows:
1. Lack of adequate spawning gravels was judged to be one of the two most limitingfactors for effecting the fisheries resource in the lower Rickreall. Substratescontained high percentages of silt and organics due mostly to the low channelgradient. Spawning gravels were present but embedded up to 60 % in areas.Embeddedness decreased to 10 % in riffles located near the top of the survey.Spawning habitat appeared to be more suited for cutthroat than anadromous fish.
2. The other limiting factor to fish in the lower Rickreall is lacking off-channel habitatthat provides refuge from high flows. Much of the channel was entrenched into thefloodplain with high banks and few side channels. Pool habitat was abundantthroughout with many pools being in excess of 3 feet deep and some up to 10 feetdeep. The habitat was characterized as providing good summer rearing for juvenilesalmonids and good passage for adult salmonids. Riffle habitat was very limited andprimarily found above River Mile 8.
3. Low basal flows were listed as a third important limiting factor to fish in the lowerRickreall by concentrating pollutants and decreasing dissolved oxygen and raisingtemperatures. Water quality was reported to be degraded due to agricultural non-point pollution. Degraded quality included low dissolved oxygen, increasednutrients, chemical contamination, and increased water temperatures. [Note thatthese observations are likely the result of the surveyor’s literature review and notmeasurements he made.]
4. Riparian zones were characterized as adequate for providing shade, litter, and bankstability. Recruitment potential for large woody debris was characterized as limiteddue to lack of large streamside conifers.
5. Surveyor thought the stream showed signs of “flashy” flow events and described anepisode of a rapid streamflow rise to an estimated 65 cfs following a 0.5 inch rainfall.Discharge at the mouth at the start of the survey was estimated to be 34 cfs.
6. The lower 2.1-mile section of stream from the mouth to the bridge at IndependenceHighway was characterized as high having a degree of channel entrenchment withhigh banks. This area was judged to provide poor spawning but good summerrearing habitat. Few off channel refuge areas limit winter habitat and overheadcover was lacking.
7. The next, 2.6-mile, section from Independence Highway to the Greenwood Roadwas similar to the first section being characterized as highly entrenched with up to40-foot banks supporting deciduous riparian vegetation. Fish habitat was similar tothe prior section.
8. The third section was 3.5-miles from Greenwood Road to Highway 99 in Rickreall.Here several changes in stream condition were noted. Gravel was noted asbeginning to increasing in diameter to egg sized, gravel embeddedness decreased,
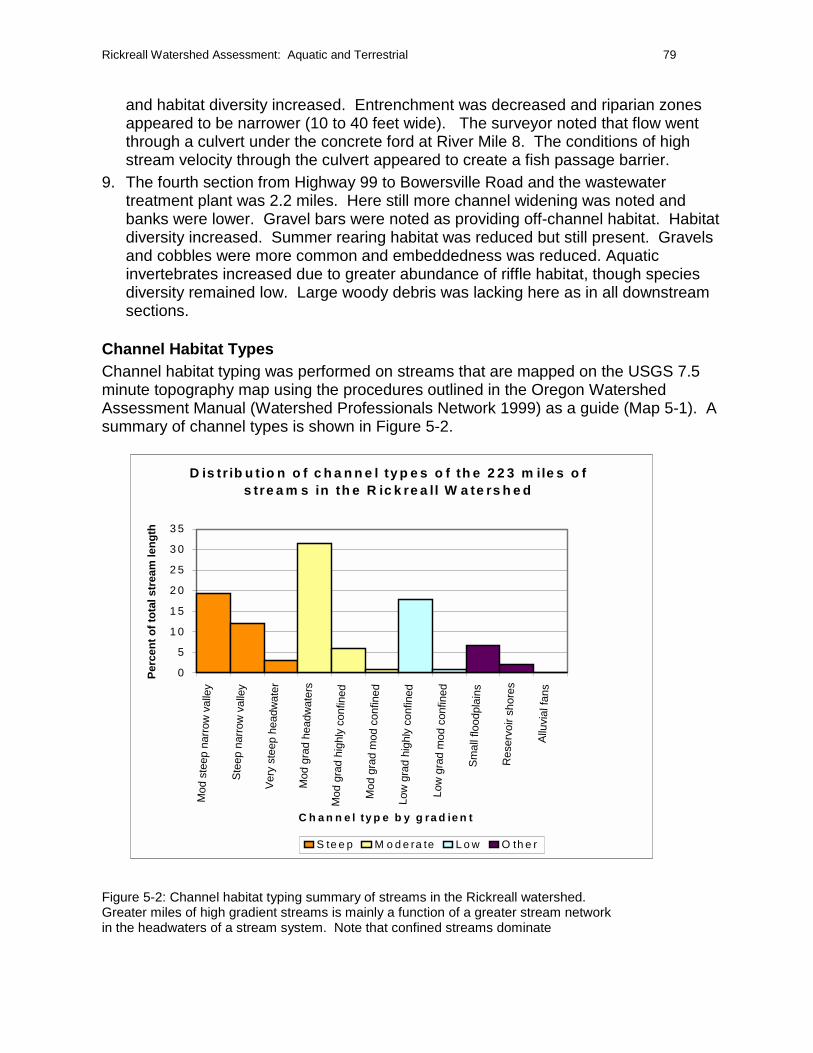
Rickreall Watershed Assessment: Aquatic and Terrestrial 79
and habitat diversity increased. Entrenchment was decreased and riparian zonesappeared to be narrower (10 to 40 feet wide). The surveyor noted that flow wentthrough a culvert under the concrete ford at River Mile 8. The conditions of highstream velocity through the culvert appeared to create a fish passage barrier.
9. The fourth section from Highway 99 to Bowersville Road and the wastewatertreatment plant was 2.2 miles. Here still more channel widening was noted andbanks were lower. Gravel bars were noted as providing off-channel habitat. Habitatdiversity increased. Summer rearing habitat was reduced but still present. Gravelsand cobbles were more common and embeddedness was reduced. Aquaticinvertebrates increased due to greater abundance of riffle habitat, though speciesdiversity remained low. Large woody debris was lacking here as in all downstreamsections.
Channel Habitat TypesChannel habitat typing was performed on streams that are mapped on the USGS 7.5minute topography map using the procedures outlined in the Oregon WatershedAssessment Manual (Watershed Professionals Network 1999) as a guide (Map 5-1). Asummary of channel types is shown in Figure 5-2.
Figure 5-2: Channel habitat typing summary of streams in the Rickreall watershed.Greater miles of high gradient streams is mainly a function of a greater stream networkin the headwaters of a stream system. Note that confined streams dominate
D is tr ib u t io n o f c h a n n e l ty p e s o f th e 2 2 3 m ile s o f s tre a m s in th e R ic k re a ll W a te rs h e d
0
5
1 0
1 5
2 0
2 5
3 0
3 5
Mod
ste
ep n
arro
w v
alle
y
Ste
ep n
arro
w v
alle
y
Ver
y st
eep
head
wat
er
Mod
gra
d he
adw
ater
s
Mod
gra
d hi
ghly
con
fined
Mod
gra
d m
od c
onfin
ed
Low
gra
d hi
ghly
con
fined
Low
gra
d m
od c
onfin
ed
Sm
all f
lood
plai
ns
Res
ervo
ir sh
ores
Allu
vial
fans
C h a n n e l ty p e b y g ra d ie n t
Per
cen
t o
f to
tal s
trea
m le
ng
th
S te e p M o d e ra te L o w O th e r

Rickreall Watershed Assessment: Aquatic and Terrestrial 80
5-1: Channel habitat types. See also Figure 5-2.

Rickreall Watershed Assessment: Aquatic and Terrestrial 81
Culverts and Fish BarriersRoad crossings of stream are shown in Map 5-2. Crossings of larger streams areaccomplished by bridges, but most crossings use culverts. Culverts can pose problemsfor stream systems in two ways. First, they can block fish movement and effectivelyisolate populations or prevent access to upstream areas during migrations by fish.Secondly, culverts can initiate road failures if they are undersized or become blockedduring high stream flows. Most of the problem culverts are those that were installedyears ago without regard to stream and fish needs.
Today these problem culverts are relatively easy to identify and sometimes the fixes areinexpensive. As a result, a number of culvert surveys have been initiated. Most of thework to date has been on public lands and roads.
Two state agencies, ODF and ODFW, are surveying culverts for fish passage problems. In1998 ODF surveyed all roads on state lands in Polk County for culverts. Some adjacentprivate lands were also included in the surveys. The survey was part of a three-countysurvey that covered some 300 miles of road. The purposes of the surveys were to identify allstructures, map their location, and describe their conditions. Standard data were collectedaccording to guidelines set by the Forest Practices Section of ODF. Typical data includediameter, drop of outfall, pool below, gradient, road condition, and ditch conditions. Amongthe early findings was a realization that a large number of culverts exist on the landscape,with many of these blocking upstream habitat. ODFW’s inventories of state and countypublic roads (except urban areas) include an examination of culverts for fish passage. Thesesurveys also uncovered problems, which will be prioritized for repairs and restoration (G.Galovich, ODFW, Corvallis, pers. comm.).
Developing a program to survey culverts on remaining private lands may be a projectfor the watershed council. However many of the culverts providing access to headwaterstreams are likely on the industrial forest lands. Both Willamette Industries and BoiseCascade have public commitments to road and culvert programs, largely through theirendorsement of the Sustainable Forestry Initiative (seehttp://www.afandpa.org/forestry/forestry.html). The Sustainable Forestry Initiativeprogram is a standard of environmental principles and performance measures thatintegrates the forestry activities with the protection of wildlife, plants, soil and waterquality and a wide range of other conservation goals. Both companies have contractedPricewaterhouse Coopers to perform third-party certification assuring that they arebeing managed sustainably. (For more information see these companies websites:www.wii.com and www.boisecascade.com.
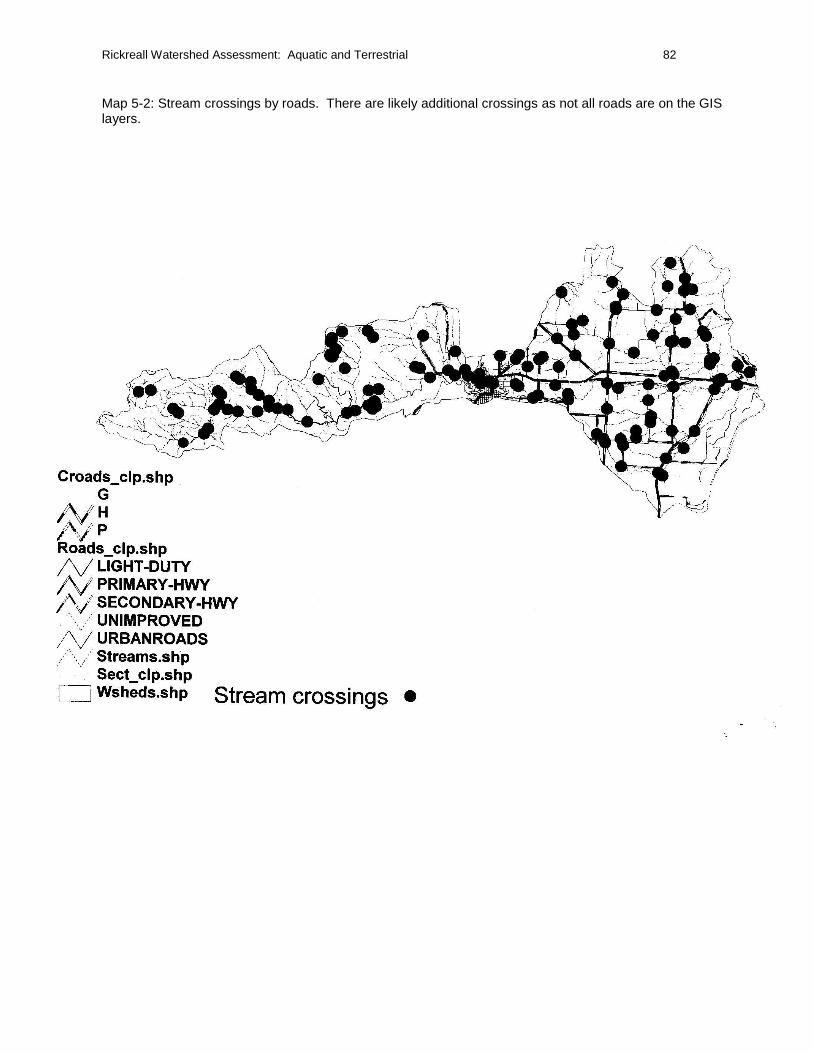
Rickreall Watershed Assessment: Aquatic and Terrestrial 82
Map 5-2: Stream crossings by roads. There are likely additional crossings as not all roads are on the GISlayers.

Rickreall Watershed Assessment: Aquatic and Terrestrial 83
Other Fish Passage Obstructions
The Mercer Reservoir is non-fish passable. ODFW estimates that there are 11 miles ofinaccessible steelhead habitat above the reservoir. The reservoir also prohibitscutthroat trout from migrating longer distances along the Rickreall. The reservoirisolates the population above from those below.
The concrete ford at River Mile 7.5 (Villwok’s dam, see Photo 1-2 in Chapter 1) maycreate some fish passage problems. The CH2MHill survey of 1995 noted that theconcrete ford was not fish passable as the water was passing beneath through anundersized culvert. This year, during a visit by the analysts, the ford was passing waterover the top and fish passage appeared to be possible.
Several of the culverts over tributaries downstream of the reservoir did not lookpassable during low flow; however the test is passability during high flows or when fishare more likely to be moving up or down stream.
Riparian Zones and WetlandsHistorical records such as journal entries of explorers and settlers indicate that much ofthe riparian forests and wetlands that originally existed along valley bottoms of largerrivers were cleared for homesteads beginning about 1840 (Storm 1941, see alsoChapter 2). Development of the valley bottom appears to have occurred rapidlybetween 1840 and 1880. Some sense of change in riparian vegetation along the lowerRickreall can be gained by comparing the 1851 historic vegetation map (Map 5-3) withthe current 1997 vegetation map (Map 5-4). The 1851 map suggests that the originalriparian zones were wider than those of today, but were still narrow. The riparian forestsalong the lower Rickreall are typically less than 100 feet wide, while those on the 1851vegetation map appear to be several hundred feet wide. Greater change in riparianvegetation appears to have occurred in the floodplain area along the Willamette River.Most of the lower floodplain appears to have been closed forests covering severalsquare miles. Today, these areas are mostly in croplands and orchards. It is of notethat the area just south of the mouth of the Rickreall appears to still be in riparian forestsand may represent an important remnant of the original riparian forests (Figure 5-4).
Channelization of headwater, tributary streams likely occurred before the 1930’s in thelower Rickreall watershed. In addition, much of the loss of riparian zones likely hadoccurred by this time. An examination of aerial photos taken in 1936 reveals that muchof the Rickreall Creek drainage had been developed for agricultural use. Comparison ofthe 1936 photos to those taken in 1955, 1970, and 1994 show that small (probably lessthan 5%) amount of riparian habitat was lost (Photos 2-4a through 2-4d).
A more comprehensive map of current riparian vegetation may be available through theCoastal Landscape Analysis and Modeling Study (CLAMS). CLAMS uses satelliteimagery and modeling to develop vegetation layers (Map has been requested). TheCLAMS project promises to be a useful source of information and possibly analysistools for watershed groups in the Coast Range. More information is available on theCLAMS website (http:/www.fsl.orst.edu/clams).

Rickreall Watershed Assessment: Aquatic and Terrestrial 84
Map 5-3: Vegetation types in 1851. Reconstructed from the GLO land surveys. Most of the prairie, theclosed riparian forest, and the wetlands have been converted to crop lands (see next map).
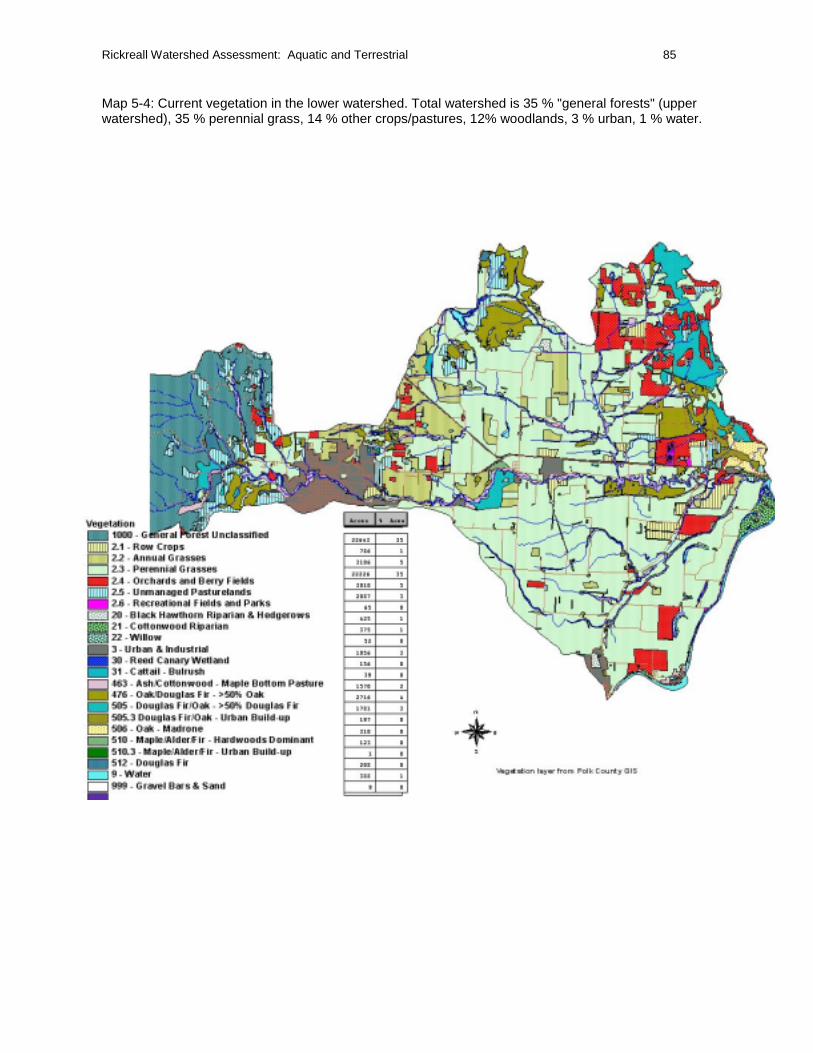
Rickreall Watershed Assessment: Aquatic and Terrestrial 85
Map 5-4: Current vegetation in the lower watershed. Total watershed is 35 % "general forests" (upperwatershed), 35 % perennial grass, 14 % other crops/pastures, 12% woodlands, 3 % urban, 1 % water.

Rickreall Watershed Assessment: Aquatic and Terrestrial 86
Current wetlands are shown in Map (4-2). Again, comparison of the 1851 vegetationmap with the current maps and orthophotos can provide an insight into the currentstatus of wetlands. The 1851 map indicates that wetlands existed between Dallas andRickreall (Map 5-3). These wetlands correspond to the area labeled Boyle Lakes onMap 4-2 and Figure 4-6 (see Chapter 4). Map 5-3 and the orthophotos indicate thatmost of these wetland have been drained or converted to agriculture. The 7.5 minuteUSGS map indicated that some element of wetlands occurred there.
Figure 5-3: Remnant riparian forests along the Willamette River appear in the 1994 orthophoto. Theforest can be seen along the inside of the sweeping bend in the river. This area likely was not convertedto agriculture because of its wet soils and frequency of flooding.
Rickreall Watershed Assessment: Aquatic and Terrestrial 87
The Oregon Natural Heritage Program performed a wetlands inventory in the WillametteValley. Their report is available at www.sscgis.state.or.us/data/ sources.html. Theirfindings include the following summaries:
“Most [wetland] sites inventoried in the Willamette Valley are dominated bynon-native species. The most common invasive species in bottomland andwetland habitats are reed canary grass (Phalaris arundinacea), roughstalkbluegrass (Poa trivialis), Himalayan blackberry (Rubus discolor), nipplewort(Lapsana communis), English ivy (Hedera helix) and bittersweet nightshade(Solanum dulcamara). These species are very difficult to keep out of nativeareas and extremely difficult to control once they have invaded an area.”
“Throughout the Willamette Valley, riparian zones and wetlands are activelybeing developed [i.e., filled or drained]. This was observed numerous timesduring the course of this project. Section 404 (wetland fill permit) violationsappear to be commonplace. Privately owned wetlands and riparian areasthroughout the Valley deserve increased protection from degradation anddevelopment.”
“Wetlands found on sites with high quality remnants have been included in aconservation priority list. The most important sites on private land are theCalapooia River, Muddy Creek, North Santiam River, Luckiamute River,Kingston Prairie, the Mission Bottoms area, and the Bull Run Creek fragment.Private lands along many other rivers and creeks are also worthy of protection.Public lands in the Willamette Valley need to be protected from degradation.Restoration activities could be attempted at non-native dominated areas onpublic lands, although protecting native habitat should clearly take precedenceover restoration. Small emergent wetland sites are scattered throughout theWillamette Valley, both in and between the priority wetlands. These sitesshould be a focus of protection along with the forested riparian zones.Hydrological threats to these areas also need to be addressed. Large nativeemergent wetlands were not found outside of public lands.”
Sensitive Species other than FishA complete species list of all animals thought to occur at the time of Euro-Americanarrival has been compiled by Hulse et al. (1997) for the in the Muddy Creek sub-basin ofthe nearby Marys River watershed. This list included 234 total amphibian, reptile,mammal and bird species. This list is probably representative for the Rickreall CreekWatershed, because the Muddy Creek drainage has both a valley floor and uplandhabitats similar to the Rickreall watershed. Eight vertebrate species are listed asextirpated from the Muddy Creek sub-basin: grizzly bear, California condor, lynx, graywolf, white-tailed deer, yellow-billed cuckoo, black-crowned night heron, and spottedfrog (Hulse et al. 1997).
The Oregon Natural Heritage Program (ONHP) has assembled a list of sensitivespecies in Polk County (http//:www.hertitage.tnc.org). Approximately 90 of thesespecies of plants and animals are thought to occur or at least have potential habitat in

Rickreall Watershed Assessment: Aquatic and Terrestrial 88
the Rickreall Creek Watershed (Appendix 5). The ONHP list includes species listed byone or more of the following: federal agencies including the US Fish and WildlifeService and NMFS; state agencies including ODFW and the Oregon Department ofAgriculture; and nonprofit and educational organizations such as Native Plant Society ofOregon, Oregon State University’s Oregon Flora Project (OSU), and the ONHP.Species that are not listed on federal or state lists, but are listed by another group arealso included in the table. For many of these listed species there is not enough data todetermine the status of their populations.
BiodiversityBiodiversity indices developed by the Hulse project for the Muddy Creek drainage of theMarys River basin near Corvallis, Oregon suggests that overall biodiversity has declinedprior to Euro-American settlement (Hulse et al 1997). The researchers attribute thedecline to a general pattern of land use change and loss of habitat. Given the projectedpopulation increases for the Muddy Creek area, which may be extrapolated to otherareas of the Rickreall Creek Watershed, biodiversity is projected to continue to decline.Stabilization at current levels can only be achieved via a reduction in human populationgrowth or change in land use allocations (Hulse et al. 1997).

Rickreall Watershed Assessment: Soils 89
Chapter 6 : SOIL QUALITY AND LAND HEALTH
Soil quality is important through its influence on hydrology, sediment characteristics,nutrient dynamics, slope stability, vegetative cover and land use. Many inherentsoil qualities, such as degree of soil development, soil depth, slope and soil texture,are the result of the soil-forming factors -- of parent material and relief changed overtime by organisms and climate. Other soil qualities are more dynamic and tend tobe strongly influenced by land use and management, and these include soilinfiltration capacity, soil organic matter, and nutrient content and soil tilth. Thischapter assesses the relationships of soil qualities, land use and management, andthe impacts on watershed health and water quality.
Soil GroupsThe diverse soil types of the Rickreall Creek Watershed are grouped here, for thepurpose of watershed assessment, into 8 broad groups based on soil hazards forerosion, soil wetness and flooding (Map 6-1). These soils are listed and each groupis described in Appendix 6). At 800-1000 feet above sea level a climatic soilclassification break occurs (>60 in. precipitation per year), with udic moistureregime soils above this elevation and xeric moisture regime below. The soils thatformed in the valley are less leached and have a higher base saturation than thesoils of the foothills and mountains. This characteristic is due in part to less rainfallat lower elevations and the length of time that the soils have been exposed toweathering (Knezevich 1982.)
The Polk County Soil Survey (Knezevich 1982) is the original source of spatialinformation and interpretations about local soils. Polk County digitized these soilsurvey maps into a Geographic Information System (GIS). An update of the soilsurvey was completed using GIS-functionality to correct slope designations with ahigh-resolution (10 m pixel) digital elevation model. Some of the soil delineationswere given more field checking (e.g. Bellpine soils) as part of that update. Thatproject was a cooperative one involving Polk County GIS shop and NRCS soilscientist. The soil coverage created in that project and interpretations were used tocreate new soil coverage for the watershed analysis. The model used here togroup soils is in the Appendix 6. Watershed and reflect the capability class of soilsfor general land uses.
Soil Erosion and Delivery to StreamsIn reference condition, soils in the Rickreall Creek Watershed were covered by lushvegetation year round and experienced low rates of soil erosion. Soil loss rate wasprobably similar to that measured under established grass crops (0.01-0.11 tons peracre per year). Disturbances such as fire and landslides temporarily denudedvegetation causing localized erosion. Historians have recorded the practice ofburning the valley floor and foothills by the Kalapuyas
(see Chapter: History). Frequent, low intensity prairie and savanna fires probablydid not cause a large amount of soil erosion. Periodic fires that burned in the CoastRange forests may have been more intensive, leaving soils exposed to severe

Rickreall Watershed Assessment: Soils 90
erosion. Fire history reconstruction for the Oregon Coast Range indicates anaverage fire interval of about 230 years under the current climate (Long et al. 1998).(Cite Agee Reference too)
Soil erosion is a natural process that often is accelerated by human activities.Accelerated soil erosion on cropland, forest roads, and construction sites is apotential source of sediment pollution to surface waters. Where moderate to severeerosion occurs, the productive capacity and value of land can decrease over time.Sediments can fill natural depressions and drainages, road ditches, and pools increeks, destroying fish and wildlife habitat and shortening the life of reservoirs andwetlands. Sediment from forested uplands can decrease the storage capacity ofthe Mercer Reservoir and can result in expensive dredging operations.
Clay-sized sediments eroded from uplands and stream banks may have nutrientsand pesticides bound to them and are a major source of non-point pollution. Theconcentrations of numerous pesticides are positively correlated with theconcentration of suspended sediment in runoff in small streams in the WillametteBasin (Anderson et al. 1997) Fine textured sediments can remain suspended andcause turbidity that negatively affects many beneficial uses.
Forest UplandsForest Practices Impacts on the Forested Uplands of the WatershedLogging in the Oregon Coast Range is challenging where slopes are steep, soilsare sometimes shallow or moderately deep, and soils are loose and easilycompacted by ground-based yarding. Constructing roads into the forest requirescrossing numerous streams and potentially unstable slopes. Heavy winter rainscan produce significant runoff and subsurface flow that can result in drainageproblems and road fill failures.
Over time logging practices have evolved to reduce impacts of forest managementactivities such as road construction and site preparation following harvests. Timberharvest practices have changed to reduce ground disturbance and to minimizeimpact to watersheds and streams. However, much of this watershed was loggedbefore the current Oregon Forest Practices Act rules were adopted and as a resultsome of the forested uplands were adversely impacted during harvests.
Soil Compaction and Displacement in the Forested UplandsSoil compaction, puddling and rutting can be caused by methods and machineryused in forestry and road construction. Such soil disturbances can decrease thesoil infiltration capacity and trigger increased runoff and sediment yield. Groundskidding logs can disturb significant areas of the harvested stands (Froehlich 1984).Johnson and Beschta (1980) report that new skid trails have about 50% lowerinfiltration capacity than undisturbed forest soils for soils of the Coast Range.Lower infiltration capacity can trigger increased runoff and soil loss if precipitationintensities exceed infiltration rate.
The BLM (1998) watershed analysis that included the Rickreall Creek Watershedforested uplands sections concludes that soil compaction and /or displacement

Rickreall Watershed Assessment: Soils 91
have resulted from timber harvesting by ground-based yarding equipment,mechanical site preparation, and slash burning. Ground based logging usingcrawler tractors was used on a majority of the area in 1940's to the 1960's andresulted in extensive areas of disturbed, compacted and displaced soils. In theiranalysis, BLM reports only 313 acres out of almost 26, 000 acres (1%) of BLMlands in the analysis area that have compacted soils from past logging practicesand no other specific data is presented. This is a low assessment of percentcompacted ground following timber harvest, compared to other studies in the CoastRange (cited in the preceding paragraph).
The BLM (1998) analysis states that surface disturbance associated with forestpractices in the watershed has resulted in greater soil erosion by water, dry ravelingand debris avalanche landslide. The report states that, in shallow soils, areas thatwere once forested have reverted to brush, following logging. This is due largely tothe difficulty of establishing trees in shallow soil areas. Accelerated erosionreduces the acreage of productive forestland, reduces the return rate of debrisavalanches in headwall areas and eventually most of the eroded material entersstreams.
Mass Erosion in the Forested UplandsReference ConditionsUnder reference conditions mass erosion is the dominant erosion process in thesteep forested headwater portion of the watershed. A study of an undisturbedCoast Range forest reported an average of 14 small slides per square kilometer,with 8% of small streams (USFS Class III and IV) impacted by channel scour anddeposition (Ketcheson and Froehlich 1978). The majority of the measured slideswere on slopes greater than 80%. Concave headwalls with over-thickened colluvialdeposits are responsible for a large portion of mass movements in the Coast Rangethat reach stream channels. Other high-risk landslide areas include steep, deeplyincised channels and lower portions of long rectilinear slopes (Ketcheson andFroehlich 1978). Headwall failures are usually associated with high intensity rainfalling on saturated soil. These slides deliver coarse material for stream substrateand large woody debris that provide complexity to stream habitat, but can also canadversely affect fish habitat and water quality with excessive fine sediments.
Mass Erosion: Historical and Current ConditionsAccelerated mass wasting from uplands has not been adequately quantified in thewatershed. The expected amount of sediment that has or will be delivered toRickreall Creek and its tributaries, and ultimately to Mercer Reservoir, via masserosion has not been well established. The relative contributions and interactions ofnatural and landuse-induced mass erosion are similarly not well quantified for thiswatershed.
While past forest harvesting and roads may have increased mass erosion ratesabove historic conditions, current forest practices attempt to minimize mass erosion.Efforts are underway to identify areas of high risk of mass erosion. An example ofthis is a GIS-based digital terrain model, developed by Siuslaw National Forest,

Rickreall Watershed Assessment: Soils 92
which rates risk of mass erosion based on slope steepness and configuration (KBennett, USFS, pers. comm.). Likewise models that integrate factors of the climateand the terrain are being used predict when debris avalanches and other landslideswill occur based on rainfall intensity patterns (DOGAMI 2000).
Most landslides in the watershed originate on slopes with gradients greater than60% (BLM 1998), represented by Soil Group H and shaded Gray on the Soil Map(Map 6-1). Slope hazards and landslide slide tracks in the watershed have beendescribed by the BLM watershed analysis (BLM 1998). These data were derivedfrom interpretation of aerial photographs from five years, dating back to 1956. Inthe overall forested uplands of the analysis area, slide rates were on average oneper 495 acres, but on slopes greater than 60% there was an average of one slideper 23 acres of land.
Slides on public and private land are proportional to the area in each type ofownership. Slides were primarily associated with roads and clearcuts. Past loggingpractices are implicated as a root cause since 56 percent of the slides measuredoccurred prior to 1956. However, large storms can function as major triggers oflandslides, for example, for the slides counted between 1956 and 1996, 37 percentof the slides occurred during the 1996 peak storm event and originated from roadsand recently logged areas. From this information it can be concluded that extremeweather events that trigger landslides will continue to test the adequacy of theOregon Forest Practices Act in the future.
Controversy persists about the impact of forest harvesting and roads on thefrequency and magnitude of landslides. Ketcheson and Froehlich (1978) reportedslightly fewer small debris slides in clearcut forest blocks than in undisturbed forest.However the slides in clearcut areas traveled 1.7 times farther and impacted moresmall streams with channel scour and deposition than slides in undisturbed forest.Swanson et al. (1977) reported a nearly twofold increase in slides followingharvesting over all lands and a four-fold increase following harvesting on the mostslide-prone ground.
Debris avalanches are a major process in upper watersheds and a primary sourceof sediment there. It is useful to make some assumptions based on best availableinformation. Given the uncertainties of rock structure and weather, managementstrategies that focus on carefully managing the steeper parts of the watershed(slopes greater than 60%) should over the long run be effective in reducingsediment delivery from mass erosion.
Fire and Flood in the WatershedTwo recent events demonstrated the profound force and uncertainty of nature in theRickreall Creek Watershed. A wildfire in 1987 burned 5000 acres and was followedin February 1996 by a severe set of storms that left much of the Pacific Northwestwith severe erosion on mountain slopes and flooded river valleys. This one-two-punch resulted in serious erosion in the watershed that was focused in theRockhouse Creek subwatershed right above the Mercer Reservoir. These twoevents called for emergency reponses and suggest an ongoing need for emergency

Rickreall Watershed Assessment: Soils 93
readiness as a watershed management strategy. Perhaps a Fire and FloodEmergency Response Team should be created and coordinated by the watershedcouncil.
Rockhouse Creek Fire 1987In October 1987, a wildfire burned 5000 acres in the Coast Range west of Dallas,including 2500 acres in the Rockhouse Creek and Rickreall Creek watersheds. Thefire burned young forest cover over roughly half of the acreage of the MercerReservoir watershed, the water supply for the City of Dallas. A force of 1200firefighters battled the blaze for 8 days. Miles of fire line were dug by hand and withbulldozers. With 40% of Rockhouse Creek watershed burned and much of itseverely burned the winter rainy season was about to start. The watershed and thereservoir were in a precarious position, setup for severe soil erosion andsedimentation of the reservoir. This watershed is very steep with long slopes andsoil depth ranging from shallow to deep.
An emergency watershed protection plan was quickly developed that called foraerial seeding of bare soils and the construction of 19 sediment dams constructedof large bales on 7 waterways, and the construction of a rock sediment retentiondam at the mouth of Rockhouse Creek. The City of Dallas obtained funds fromUSDA-SCS Emergency Water Protection to implement the plan. Without thesemeasures the estimates of erosion were 80 to 100 tons of soil per acre. Anestimated 100 acre-feet or more of sediment would reach the reservoir the firstwinter and another 16 acre feet would enter the Rickreall creek below the dam. Atthe estimated dredging cost of $10,000 to $15,000 per acre-foot of sediment, thecost to remove the sediment from the reservoir would be over $1 million.
Debris Flows in February Storms 1996The storms of February 1996 tested both the integrity of the watershed's forestedslopes, and the land use practiced upon them. Several studies recordedobservations of the effects of these storms on watersheds. The NRCSGeomorphologist, Jenine Castro, made a report of numerous debris flows inRockhouse Creek subwatershed following these storm events (Memo from J.Castro to City of Dallas, April 5, 1996). This watershed had been largely cut overand replanted, and then it was severely burned in the 1987 wildfire.
Castro characterized the debris flows as carrying a "tremendous amount ofsediment into Mercer Reservoir; much of the sediment was deposited in and alongthe tributary channels." She estimated 90% of the debris flows originated fromroads. These roads lacked waterbars and were very steep and capturedstreamflow during the event. She mentions a large (8-10 acre) landslide that iscontributing sediment to the reservoir but did not visit the slide and did not give itsexact location.
Castro predicted that many more such flows would occur in the next ten years thatwould reduce the capacity of the Mercer Reservoir and increase turbidity. Practicesrecommended as short term fixes included installation of filter fabric to trapsediments, inspection of road crossings, construction of additional sediment basinsand stabilization of the large landslide. Ken Hale, NRCS Dallas, commented on a

Rickreall Watershed Assessment: Soils 94
large unstable area above the Reservoir, but was unsure of its location. J. Castromade a similar claim but had not actually seen it. This area needs to be identified.
The long-term approach includes mapping slopes that have high risk of failure andsubsequent sediment delivery. Unnecessary roads should be obliterated and otherroads made more stable by outsloping and waterbarring. Crossings and culvertsmust be sized for longer return period storms. Watershed revegetation wasdeemed "extremely important" and it was suggested that a revegetation plan bedeveloped along with private landowners.
Recent dredging in the Reservoir at the mouth of Rockhouse Creek removed50,000 cubic yards, required 2000 truckloads to be hauled and cost $125,000.00.(Compare this to cost of erosion control after fire)
Reports of1996-Storm Effects on SlidesAerial reconnaissance of the Oregon Coast Range that included the Upper SiletzRiver Watershed just west of Rickreall Creek following the 1996 storms was used toobserve landslides and evaluate the associated landuses (Weaver and Hagans1996). In the Northern Coast Range portion of that survey, most slides (71%) werein recent clearcuts and only 6% were in uncut areas, while roads were onlyassociated with 15% of observed slides. In the Upper Siletz Watershed 63% wereassociated with new clearcuts, 10% were in uncut areas and 36% originated atroads. The most common geomorphic position associated with slides in the UpperSiletz was steep swales that were often the headwaters to stream channels thatbegin just down slope.
An Oregon Department of Forestry (ODF) landslide survey following the severestorms of winter 1995-1996 supports the above findings for stands harvested 0 to 9years ago, but not for stands aged 10 to 100 years (Dent et al. 1998). The ODFsurvey was conducted on forestland where state forest practices had been followed.Landslides from these severe storm events were most frequent on very steepslopes (greater than 65%). Most of the sites harvested and reforested from 0 to 9years experienced increased landslide frequency and mass erosion amountscompared to undisturbed forest sites (>100 years old). However, stands that wereharvested and reforested in the past 10 to 30, and 30 to 100 years experiencedfewer slides and less mass erosion than the undisturbed older forests over 100years old (K. Mills, ODF, pers. comm.)
Forest RoadsRoads can increase surface erosion, mass wasting, and stream sedimentation.Road density (miles per square mile) has been used as a meter to compare thepotential impacts of roads on different watersheds. One problem with interpretingroad density information is that usually more information is needed about roadconditions, size, traffic and road location in the landscape in order to make anevaluation of road impacts on the watershed. This additional information is oftenmore difficult to obtain and to interpret.
Road densities on forested lands in the BLM megawatershed analysis were 4.1miles of road per square mile on the average and road density was similar for public
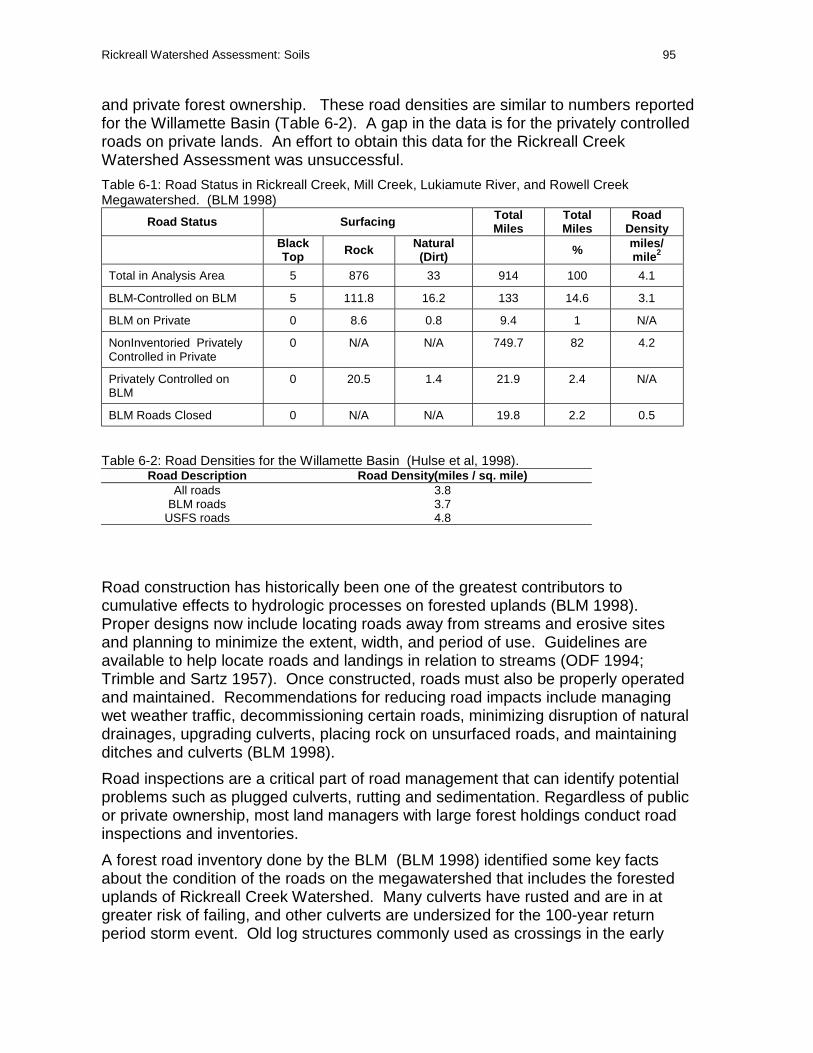
Rickreall Watershed Assessment: Soils 95
and private forest ownership. These road densities are similar to numbers reportedfor the Willamette Basin (Table 6-2). A gap in the data is for the privately controlledroads on private lands. An effort to obtain this data for the Rickreall CreekWatershed Assessment was unsuccessful.
Table 6-1: Road Status in Rickreall Creek, Mill Creek, Lukiamute River, and Rowell CreekMegawatershed. (BLM 1998)
Road Status Surfacing TotalMiles
TotalMiles
RoadDensity
BlackTop Rock Natural
(Dirt) % miles/mile2
Total in Analysis Area 5 876 33 914 100 4.1
BLM-Controlled on BLM 5 111.8 16.2 133 14.6 3.1
BLM on Private 0 8.6 0.8 9.4 1 N/A
NonInventoried PrivatelyControlled in Private
0 N/A N/A 749.7 82 4.2
Privately Controlled onBLM
0 20.5 1.4 21.9 2.4 N/A
BLM Roads Closed 0 N/A N/A 19.8 2.2 0.5
Table 6-2: Road Densities for the Willamette Basin (Hulse et al, 1998).Road Description Road Density(miles / sq. mile)
All roads 3.8BLM roads 3.7
USFS roads 4.8
Road construction has historically been one of the greatest contributors tocumulative effects to hydrologic processes on forested uplands (BLM 1998).Proper designs now include locating roads away from streams and erosive sitesand planning to minimize the extent, width, and period of use. Guidelines areavailable to help locate roads and landings in relation to streams (ODF 1994;Trimble and Sartz 1957). Once constructed, roads must also be properly operatedand maintained. Recommendations for reducing road impacts include managingwet weather traffic, decommissioning certain roads, minimizing disruption of naturaldrainages, upgrading culverts, placing rock on unsurfaced roads, and maintainingditches and culverts (BLM 1998).
Road inspections are a critical part of road management that can identify potentialproblems such as plugged culverts, rutting and sedimentation. Regardless of publicor private ownership, most land managers with large forest holdings conduct roadinspections and inventories.
A forest road inventory done by the BLM (BLM 1998) identified some key factsabout the condition of the roads on the megawatershed that includes the foresteduplands of Rickreall Creek Watershed. Many culverts have rusted and are in atgreater risk of failing, and other culverts are undersized for the 100-year returnperiod storm event. Old log structures commonly used as crossings in the early
Rickreall Watershed Assessment: Soils 96
days of tractor logging are "in various stages of collapse". The report does notidentify any specific locations where this occurs. Some roads need to be coveredwith rock to help cut down on sedimentation. The road surface and general roadcondition is most critical near stream crossings and priority should be placed oninspecting the road segments that have the highest potential to contribute sedimentto the creek.
In Oregon, the timber industry has made a commitment to remove or rehabilitatehigh hazard roads as part of the agreement for the Oregon Plan for Salmon andWatersheds. However, none of the requested road information was provided byprivate forest landowners on their roads. This remains an information gap that isneeded to evaluate the potential impact of forested roads on Rickreall Creek and onthe Mercer Reservoir.
Updated information from comprehensive road inventory conducted on state landswas made available in 1999 and will be integrated into ODF’s GIS (R. Nall, pers.comm.). Road information is available from Siuslaw National Forest in their GIS“road coverage” (K. Bennett, USFS, pers. comm.). Roads in agricultural and urbanareas can have potential impacts on water quality also, especially in lowlandstreams. Further assessment of roads in the watershed is needed.
Agricultural AreasSoil Erosion and RunoffUnder normal rainfall conditions, soil erosion in the Willamette Valley ranges fromslight to severe depending on slope steepness, slope configuration, soil erodibility,and crop management practices (Table 6-3). Several agricultural practices leavethe soil exposed during the winter rainy season and have been implicated intriggering severe soil erosion on sloping land such as Soil Groups B and C (Map 6-1).
The potential for severe soil erosion events on agricultural land in the watershed isdocumented in the historical accounts from the winters of 1949 (USDA-SCS 1949),1956 (Torbitt and Sternes 1956), and 1964-1965 (Baum and Keiser 1965). Thehighest rates of soil loss have been the result of episodic intense rainfall duringconditions of low infiltration capacity. During these storms, infiltration was limited bysaturation of the soil, snow cover and frozen ground and sealing of soil surfaces byraindrop impact on unprotected cropland.
Practices contributing to high erosion include: fall-plowed cropland not seeded andwithout sufficient crop residues; fall-conventionally-seeded small grains, legumes,and grasses; and clean-tilled orchards and Christmas tree farms without covercrops (Young et al. 1980; USDA SCS 1949; Bela 1979).
Perennial grass crops provide good soil cover and are conservative of nutrients,with the possible exception of the year of crop establishment. Yet, cropped fieldsthat receive intermittent concentrated flood flows may experience moderate rillerosion even with established grass crops.
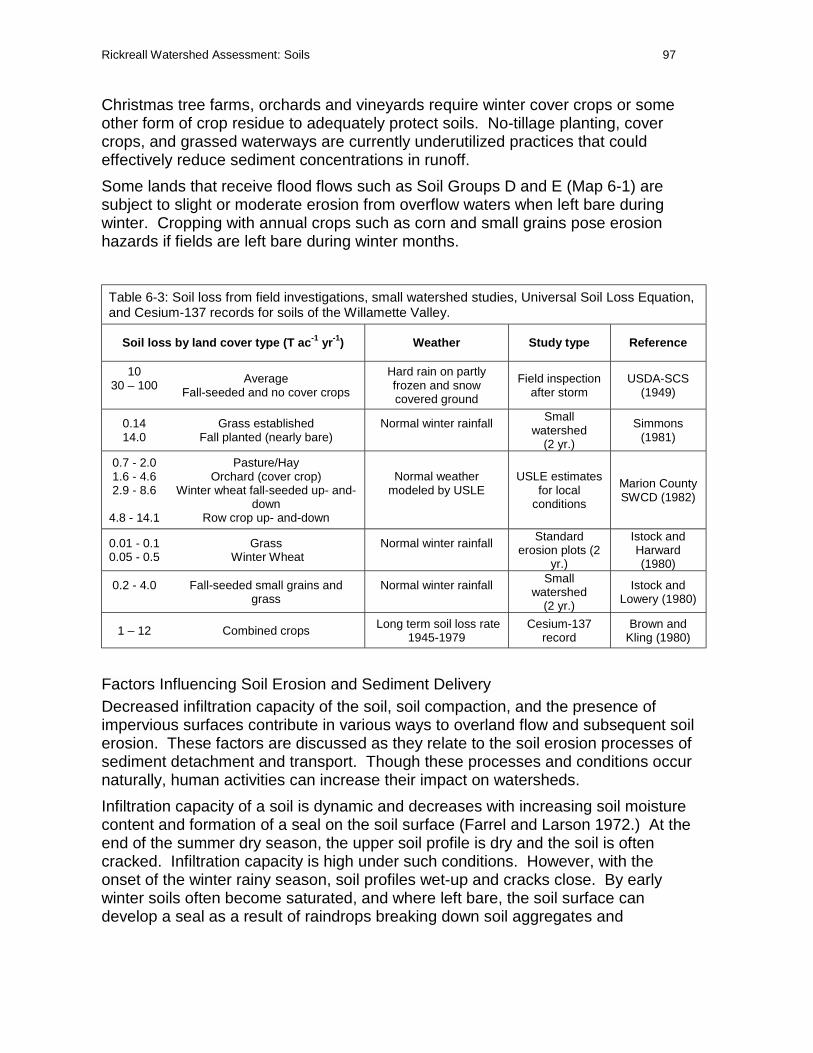
Rickreall Watershed Assessment: Soils 97
Christmas tree farms, orchards and vineyards require winter cover crops or someother form of crop residue to adequately protect soils. No-tillage planting, covercrops, and grassed waterways are currently underutilized practices that couldeffectively reduce sediment concentrations in runoff.
Some lands that receive flood flows such as Soil Groups D and E (Map 6-1) aresubject to slight or moderate erosion from overflow waters when left bare duringwinter. Cropping with annual crops such as corn and small grains pose erosionhazards if fields are left bare during winter months.
Table 6-3: Soil loss from field investigations, small watershed studies, Universal Soil Loss Equation,and Cesium-137 records for soils of the Willamette Valley.
Soil loss by land cover type (T ac-1 yr-1) Weather Study type Reference
1030 – 100 Average
Fall-seeded and no cover crops
Hard rain on partlyfrozen and snowcovered ground
Field inspectionafter storm
USDA-SCS(1949)
0.1414.0
Grass establishedFall planted (nearly bare)
Normal winter rainfall Smallwatershed
(2 yr.)
Simmons(1981)
0.7 - 2.01.6 - 4.62.9 - 8.6
4.8 - 14.1
Pasture/HayOrchard (cover crop)
Winter wheat fall-seeded up- and-down
Row crop up- and-down
Normal weathermodeled by USLE
USLE estimatesfor local
conditions
Marion CountySWCD (1982)
0.01 - 0.10.05 - 0.5
Grass Winter Wheat
Normal winter rainfall Standarderosion plots (2
yr.)
Istock andHarward(1980)
0.2 - 4.0 Fall-seeded small grains andgrass
Normal winter rainfall Smallwatershed
(2 yr.)
Istock andLowery (1980)
1 – 12 Combined crops Long term soil loss rate1945-1979
Cesium-137record
Brown andKling (1980)
Factors Influencing Soil Erosion and Sediment DeliveryDecreased infiltration capacity of the soil, soil compaction, and the presence ofimpervious surfaces contribute in various ways to overland flow and subsequent soilerosion. These factors are discussed as they relate to the soil erosion processes ofsediment detachment and transport. Though these processes and conditions occurnaturally, human activities can increase their impact on watersheds.
Infiltration capacity of a soil is dynamic and decreases with increasing soil moisturecontent and formation of a seal on the soil surface (Farrel and Larson 1972.) At theend of the summer dry season, the upper soil profile is dry and the soil is oftencracked. Infiltration capacity is high under such conditions. However, with theonset of the winter rainy season, soil profiles wet-up and cracks close. By earlywinter soils often become saturated, and where left bare, the soil surface candevelop a seal as a result of raindrops breaking down soil aggregates and
Rickreall Watershed Assessment: Soils 98
repacking the silt particles into a thin skin. Occasionally soils freeze or are coveredwith snow and this also may lower the infiltration capacity (Lowery et al. 1980.)
Overland flow or runoff begins when precipitation exceeds infiltration capacity of thesoil. Where vegetation, forest litter or crop residues protect soils, there is generallylittle surface runoff in the Willamette Valley. Where soils are bare and surface sealshave formed, detached silt and clay soil particles can be carried off in thin sheetflow and in small rills, and the amount of sediment transported in runoff can belarge. Runoff also occurs where subsurface water moves downslope overimpermeable sub-soil layers or bedrock and then comes to the surface on lowerslopes. This condition occurs extensively in the Willamette Valley and often isexpressed in the occurrence of side-hill seeps. Where these lands are farmed andremain bare in the winter, significant erosion can occur. Subsurface drainage suchas tiling and ditching has been used to reduce runoff in such conditions, but this canhave the side effects of reducing base flow of streams in some cases (Lowery et al.1982). In late winter and spring, infiltration capacity increases again as plants grow,soils drain and surface seals crack. In addition to increasing erosive cutting action,increased runoff and erosion can alter stream flows and increase stream bankerosion.
Soil compaction, puddling, and rutting can be caused by farm machinery operatingon wet and plastic soils. Soil compaction can reduce the infiltration capacity andsoil productivity. Puddling and rutting destroy soil structure and can concentraterunoff and cause severe soil erosion and subsequent sediment delivery to surfacewaters.
Little information is available that relates upslope soil loss or streambank erosionamounts to sediment delivery to the Rickreall Creek and its tributaries.
Streambank ErosionThe streambank of Rickreall Creek is overall fairly well protected with vegetationand supports a healthy, narrow riparian forest. Active streambank erosion isevident over short stretches of the creek and tributary streams that have had bankvegetation denuded. High flows saturate soils and can undercut the toes of banks.Unprotected stream banks slough or cave in large slabs, delivering nutrient-rich soildirectly into the stream. Productive streamside land is lost as a result. Quantitativeinformation on the amount of sediment eroded from stream banks is insufficient tomake an accurate assessment of the problem. A stream bank inventory andmonitoring of bank erosion is needed to answer the question of the importance ofbank erosion in the watershed.
The USDA-NRCS office in Dallas maintains records of much of the stream bankwork that has occurred in the Rickreall Creek. Privacy issues make it difficult toobtain this information and it has not been adequately summarized. Perhaps acooperative arrangement could be reached between NRCS and the watershedcouncil to determine a way to release summary information about past stream bankwork that would protect the privacy of streambank landowners.
The City of Dallas is purchasing riparian lands along the creek that pass through thecity and they are maintaining woody vegetation as part of a temperature
Rickreall Watershed Assessment: Soils 99
management plan. Temperature management plans that maintain streambankvegetation provide multiple benefits of streamside trees, shade, habitat, visual andnoise reducing screens and bank structural support.
While current forest practices require riparian buffers, there are no similar rules forriparian buffers associated with pastures, cropland and urban land. Land usepractices that can accelerate stream bank erosion include:
• Livestock grazing on banks and with access to creek
• Clean tilling or mowing to the edge of a channel
• Streamside recreation
• Land uses in the watershed that decrease the infiltration capacity of the land andstorage of runoff, including increasing the amount of impervious surfaces
• Development on the banks that destroy riparian vegetation
• Chemical overspray and drift
• Reduction of these negative impacts could be addressed well with a streambankinformation and education program.
• Practices that protect banks and that reduce bank erosion include:
• Revegetation of creek banks
• Soil bioengineering erosion control
• Leaving creekside buffers
• Fencing livestock away from creeks
• Improving soil quality in watershed to reducing flooding.
These practices are well suited to cost share programs and volunteer watershedwork days for the Watershed Council, and community and student groups.
Fertilizers and PesticidesHistorical and Current ConditionsEarly agriculture relied on crop rotations with legumes and forages and severalother crops to maintain nutrients. Tillage, crop rotations and cover crops were usedto control weeds. Fertilizer use gained acceptance and wider use following WorldWar I and the trend continued to increase.
Fertilizer and pesticides are widely used on farms, forest plantations, residentiallawns, golf courses, and highway rights-of-way. Nutrients can enter surface waterattached to sediment or dissolved in runoff and also dissolved in subsurface flow.Nitrate and pesticides leached from through the soil can contaminate groundwaterresources as well.

Rickreall Watershed Assessment: Soils 100
FertilizerGrass seed crops in western Oregon receive between 125 and 256 lbs. of nitrogenper acre per year (Horneck and Hart 1988). Young et al. (1999) estimated that theamount of nitrogen applied annually to grass seed fields could be reduced by anaverage of 30% and growers could still optimize crop and economic returns.
A major research project is underway to determine long term impacts of grass seedproduction on water quality (Griffith et al. 1997, Horwath et al. 1998). Work hasfocused on poorly drained soils such as Group E (Soil Map 6-1), which are wellsuited to perennial ryegrass crops and they have substantial subsurface flow aboveclayey subsoil. Between crop uptake and denitrification in the poorly drainedriparian soils, shallow-groundwater NO3-N is reduced to low levels, even whenfertilized with nitrates up to 170 lbs. of nitrogen per acre per year. In another study,Young et al. (1999) found that using nitrogen fertilizers at recommended rates (90to 100 lbs. of nitrogen per acre) would result in a low potential for leaching of NO3-Non fine-textured soils where grass seed crops are grown.
Because there have been few measurements of nutrient losses from uplands andthe subsequent concentrations in surface water, nutrient and chemical transportand their impacts on water quality are not adequately known for the watershed.
Nitrate concentrations in runoff and shallow wells frequently exceeded 10 mg perliter from three of six agricultural watersheds in the southern Willamette Valley(Simmons 1981). Nitrate losses are highest when runoff events occur shortly afterfertilizer applications, and even then amount to less than 4% of total appliedfertilizer. Simmons (1981) reported total phosphorus (TP) losses of 0.36 to 20.9 kgper hectare, and dissolved inorganic phosphorus runoff concentrations 0.1 to 5.1mg per liter. These are environmentally significant concentrations of P since 0.05mg P L-1 can cause algae growth in surface waters.
PesticidesPesticide applications have been poorly tracked in the past, but pesticide transportand impact in the watershed are beginning to be scrutinized. In 1999 OregonLegislature passed House Bill 3602, which tracks pesticide use throughout the stateincluding agriculture, forestry, industrial and urban users. The program is due to beoperational in 2002 and can provide valuable information on pesticide use within thewatershed since watershed location is one of the pieces of information tracked.This program should provide information to future watershed assessments.
Anderson et al. (1997) collected data to characterize the distribution of dissolvedpesticide concentrations in small streams throughout the Willamette Basin. Theyreported that a total of 36 pesticides were detected, with five herbicides includingAtrazine and Diuron detected frequently. Pesticide concentrations for all thosetested were usually less than 1.0 ug per liter, however an unusually high number ofconcentrations were in the range 1-90 ug per liter. One problem in interpretingthese data is that aquatic life toxicity criteria have only been established for three ofthe detected chemicals. Anderson et al. (1997) published several tables onpesticide properties and commonly applied rates for the Willamette Valley.
Rickreall Watershed Assessment: Soils 101
Significant correlation exists between land use and pesticide detection in surfacewater of the Willamette Valley (Anderson et al. 1997). The amount of forested landin a watershed was negatively associated with pesticide occurrence. Inpredominantly agricultural watersheds, the instream concentrations of a fewpesticides that were applied to a wide variety of crops were significantly correlatedwith estimates of the amount used.
A pilot study measured herbicide movement in runoff and in shallow subsurfaceflow to streams from grass seed fields in poorly drained Dayton silt loam soils. Theapplication rates for the herbicide Diuron varied from 1.8 lb active ingredient (a.i.)per acre for perennial ryegrass seed crops up to 10 lb a.i. per acre for treatment ofrights-of-way and field borders. Diuron was detected at instream concentrations of1 to 12 ug L-1, suggesting that no environmentally significant residues of Diuron arelikely in aquatic systems next to grass seed fields, though further research isneeded (Jenkins et al. 1994). Yet, concentrations of diuron in the Willamette Valleyas high as 5-10 mg per liter were measured in very small ponded areas, where theherbicide had drained following application. That is a thousand-fold higherconcentration than the ug per liter instream levels discussed earlier. Recent studiessuggest that these levels of this pesticide could have potentially adverse effects onaquatic species (Schuytema and Nebeker 1998). Such relationships requirefurther study.
Livestock and WatershedsLivestock issues include management of confined animal feeding operations(CAFOs) and livestock grazing in the riparian zones of streams. The problemassociated with animal facilities result from runoff, facility wastewater and manure.Water-quality parameters that can be directly impacted by livestock include fecalcoliform levels, nutrients, habitat modification, sedimentation, and watertemperatures. Grazing and livestock access can deteriorate stream bankvegetation and increase bank failures. Overgrazed pastures are potential sedimentsource areas. Livestock can have significant impacts on riparian zones. Excludinganimals from these areas with fencing and providing off-stream watering helps toalleviate impacts. Such practices as manure management, filter strips and riparianplanting are available to be cost shared up to 75% (USDA-EQIP Program).[Statistics on CAFOs permitted in the watershed by the Oregon Department ofAgriculture (ODA, Chuck Harmon, pers. comm.). Inventories are needed todetermine impacts of livestock on creeks and riparian areas.
Rickreall DairyThe Rickreall Dairy is the only commercial dairy in the Rickreall Creek Watershed.The dairy operator was interviewed as part of this watershed assessment and weinventoried control measures that the dairy has taken to meet its pollution controlresponsibilities. The dairy has 3200 cattle including 1500 heifers and is locatedadjacent to and north of the creek just east of Rickreall in the town Derry. The dairyhas a water right to the creek and uses creek water to clean the barn and to irrigatecrops.
Rickreall Watershed Assessment: Soils 102
The dairy has a confined animal feeding operation permit (CAFO) from the OregonDepartment of Agriculture. There has been considerable investment in manure andliquid wastewater handing systems at the dairy. Liquid wastewater from barncleaning and milkhouse waste are stored in a large lagoon and nutrient rich slurry isirrigated on the adjacent cropland. The lagoon is required as winter nutrient slurrystorage, since they can not fertigate in the rainy season (October 1 to April1). Thewaste storage lagoon may reduce the nutrient, pathogen and organic loading tosurface waters.
Monitoring wells were installed to monitor groundwater quality next to the lagoon.In addition to not winter applying nutrients, the permit requires that the croplandtreated not have more than 55 pounds nitrate-N in the upper four foot soil profilegoing into winter rainy season. This is a conservative amount of N compared totypical grass seed operations in the Willamette Valley (See nutrient section). Soiltests of the five-foot soil profile in fall of 1999 had measured N-levels above thisamount and the diary was served notice by ODA. Originally the permit wasapproved with 295 acres of land available for irrigation with slurry from the lagoon.Summer of 2000, the dairy purchased an additional 330 acres available forfertigation.
The soils that the dairy is applying the nutrient slurry to are poorly drained andclayey soils Cove and Bashaw. These soils are nearly level to slightly depressionaland have very slowly permeable clay subsoils and substratum. Recent research inthe Willamette Valley on similar soils revealed an aquaclude between shallowsubsurface water and deeper aquifers (D'Amore et al. 2000). Given the hydrologicconditions of this soil there is not a large risk of nitrate leaching to groundwater.Additionally similarly clayey poorly drained soils in Willamette Valley grass seedcropland have been shown to be efficient at denitrification. Based on the sitehydrology and the potential for ponding and overflow on these soils futuremonitoring should probably be directed at N losses through shallow subsurfaceflows and N and P and bacteria losses through winter runoff. Mass balance shouldbe done to make sure that soils are not receiving excessive N or P.
The Dairy employs a wide range of nutrient conservation practices. Manure solidsare placed on a concrete pad and covered. Silage is made in covered piles onconcrete as well. Manure piles are windrow composted on site and sold as acomposted cow manure soil amendment. Raingutters were installed on the barnand the runoff water from the roof and the concrete run north into the cropland andaway from the Rickreall Creek.
Details of CAFO includes a list of practices and improvements, wastewater holdingponds and covered manure piles, recycled water and an automatic barn cleaningsystem. Winter application of manure is prohibited. The amount of N applied to thesoil is monitored as well with soil tests.
Water Quality for Livestock WateringThe dairy is located downstream from the City of Dallas Wastewater TreatmentPlant, and uses groundwater from Rickreall's municipal wells to water their cattle,even though they own rights to use creek water for this purpose they have concerns

Rickreall Watershed Assessment: Soils 103
about water contamination, particularly bacteria. Past releases of raw sewage fromthe plant were given by the operator as the reason for this concern. However, thedairy has not tested water from the creek to confirm this. When asked about thequality of the creek water before and after the new WWTP, dairy operatorcommented that the creek used to smell badly in summer but does not smell anymore ( L. Kazemier, pers. comm).
The operator pointed out large growths of filamentous algae that currently occurbelow the WWTP but not upstream the WWTP. The men at the dairy had to clearthe intake screen in the creek twice a day, when it clogged with algae.Observations of the creek on that day confirmed the dense growths of algae thatwere floating and attached, and in some places algae covered the creeks gravelbottom from bank to bank. There were no such growths observed on that day in thecreek at the bridge immediately upstream from the WWTP.
SB1010 Agricultural Water Quality Management Area PlanOregon's Senate Bill 1010 (SB-1010) requires the reduction of non-point sourcepollution from agriculture. As part of the response to this law the OregonDepartment of Agriculture along with local Soil and Water Conservation Districts aredeveloping plans to enhance the water quality from agricultural lands. A LocalAdvisory Committee is currently being selected for the Agricultural Water QualityManagement Area Plan for the area that includes Rickreall Creek, Ash Creek,Luckiamute River and Marys River. Candidates for the committee will be selectedfrom a wide variety of agricultural operations. A similar plan has already beendeveloped for the Yamhill River Subbasin.
The water quality management area plans outline education strategies to informlandowners and farmers about agricultural water quality issues and to encouragethem to use best management practices. Senate Bill 1010 also mandates that theplan contain a description of measures required to prevent and control waterpollution from agricultural activities in the planning area. The list of "prevention andcontrol measures" will in turn become administrative rules and form the basis forplan enforcement. A main emphasis of SB-1010 is to encourage producers todevelop Voluntary Conservation Plans, which outline management strategies foraddressing nonpoint source pollution. The Department of Agriculture hasdesignated the Benton Soil and Water Conservation District (Benton SWCD) as itsLocal Management Agency for the development and implementation of the plan.Benton SWCD will work cooperatively with the Polk SWCD, USDA NaturalResources Conservation Service, USDA Farm Service Agency, and ExtensionService to provide technical, financial and educational assistance. The plan for thearea to the North, Yamhill Subbasin Plan, identifies important general categories offactors affecting water quality, these are:
• Erosion prevention and sediment control
• Irrigation
• Livestock waste
Rickreall Watershed Assessment: Soils 104
• Nutrients
• Pesticides chemigated irrigation water
• Road, staging areas and farmsteads
• Streamside areas
Sections of the Yamhill County plan may not go far enough in protecting soil andwater resources. For instance in the Yamhill Subbasin Plan a grower can have soilloss at two times the tolerable soil loss rate and still be in compliance with the plan.The Rickreall Creek Watershed Council can have input into the plan that is to bedeveloped for Rickreall Creek. The plan development and implementation ifsuccessful can improve the water quality of the lower reaches of Rickreall Creekand groundwater resources under the watershed. Issues likely to be addressed inthe plan includes those listed above and agricultural drainage water quality,pesticide and nitrate contamination of groundwater, land application of wastewaters, soil quality management, treatment of roadsides and ditches, wetlandrestoration and others.
Rural RoadsDitch clearing may have positive and negative effects on watershed condition.Routine ditch clearing can trigger significant erosion in the ditch and increasesediment delivery to streams. However, periodic road ditch clearing by excavatorsis needed to keep ditches and culverts functional. During ditch clearing protectivevegetation is removed with accumulated sediment and there is a potential toundercut stable cutslopes and initiate bank sloughing. Bare ditch bottoms withloosened soil are susceptible to erosive cutting and can yield significant amounts ofsediment until stabilized or vegetation reestablishes.
Complimentary practices such as relief culverts, rock checks and channel linersneed to be used with ditch cleaning in places where ditches erode. Soilconservation in agriculture and best management practices in forestland arepreventive measures that serve to reduce the frequency of ditch cleanings becausethey reduce the amount of sediment that is transported to road ditches.
Roadside ditches that are contributing sediment have not been inventoried so thereis no data on this.
Failing On-Site Sewage SystemsIn the course of discussions with watershed council members over the past sixmonths it is commonly asserted that failing onsite sewage systems are contributingto the nonpoint source contaminant loads to Rickreall Creek.
On-site sewage disposal systems, septic systems, provide sewage disposal andtreatment for individual properties that cannot hook up to a sanitary sewer. Areasoutside of Dallas City limits use on-site systems for treatment of wastewater. Mostof the systems in the watershed are conventional systems with a septic tank and adrain-field. A variety of alternative systems are available for sites where soil
Rickreall Watershed Assessment: Soils 105
conditions are unsuitable to a conventional system. These alternatives usepressurized distribution lines and sand filtering to help overcome the naturallimitations of some soils. Technical and maintenance intensity and cost generallyincrease with the use of alternative systems. Prior to the approval of thesealternative systems much of the area in the watershed had soils with severelimitations for conventional on-site sewage systems. Poorly drained soils withclayey subsoils (such as Cove, Bashaw, Dayton and others) were generally deniedthe use of a conventional system since they are wet soils and have slowlypermeable subsoils. Prior to 1980 the overall approval rate for on-site systemswas 70 percent. Since the alternative systems have been authorized the overallapproval rate in Polk County is 99 percent. The County reports that it has record ofonly one on-site system that has failed, for systems installed under the rules thathave been in effect since 1974. According to Polk County there are no singleareas with enough malfunctions to consider a community system. They are notaware of any direct sewage discharges and maintain that all systems installed since1974 should not be creating nonpoint contamination. (On-site Waste reviewcomments provided by Gene Clemens, Director of Community Development, PolkCounty). It was not reported how many on-site systems were installed before 1974.
Rock Quarries and Gravel MiningDalton Rock, who stated the quarry in 1993 right along Rickreall Creek, runs a rockquarry in the basalt rocks. The crushed rock is a valuable resource that can reducesedimentation on forest roads. The quarry supplies rock throughout the centralWillamette Valley for road rock and asphalt making. Dalton Rock has receivednumerous environmental awards for its operations and reclamation work. They usesedimentation ponds and other techniques for controlling sediment and erosion onthe site. Currently the operation is expanding its production area within a 122-acrepermit boundary. (Source Dalton Rock)
Zoning Districts by Natural Subdivisions of the WatershedThis section is intended to provide general information and would need to be muchmore detailed to adequately address all the intricacies of the zoning rules and thezones.
Zoning districts in the watershed closely follow natural subdivisions of thewatershed (see Map 7-1). These subdivisions discussed in the introduction arebased on associated geology, topography, climate, soils, stream classification,vegetation and predominant landuse activities. Several of the zones have as one oftheir stated purposes the conservation and protection of watersheds, soils and othernatural resources including fish and wildlife habitat. Zoning can be an effective toolin the overall watershed management. Effective zoning is an expression of thenatural character of the land and of the values of the citizens with a clear vision andrealistic goals.
The Timber Conservation Zoning District is predominantly located in the steeperforested uplands of the Coast Range and Foothills. One of the purposes of thezone is to conserve, protect and encourage forest management for timber
Rickreall Watershed Assessment: Soils 106
production and harvesting, protect associated natural resources includingwatersheds, soil, fish and wildlife habitat and provide for compatible recreationaluses. The timber conservation zoning district is defined and described in Chapter177, Polk County Code, which explicitly states in 177.010(B) of the purpose of thezone "Conserve and protect watersheds soil, fish and wildlife habitats and othersuch uses associated with forests,
The Farm/Forest Zoning District closely approximates the Foothills Subdivisionwhere mixed agricultural and forestry landuses occur. The purpose of theFarm/Forest Zone is to provide for the full range of agricultural and forest uses,while providing for the maximum property tax benefits (e.g. farm use assessment,timber tax treatment, open space deferral etc.) available and conformity withFarm/Forest objectives. There are isolated lands within the zone that have noactual or potential use for agriculture or forest purposes. Other non- naturalresource uses must not be adverse to the accepted agricultural and forestpractices. Some of the uses that may be established under these rules include:forest operations, farm use, road widening, single family dwelling, cemetery, solidwaste disposal site and others. In this zone new non-resource dwellings are limitedto certain soils (with capability class IV -VIII) and there is a 40-acre lot size limit forcreation of new parcels (Draft Review Comments, Gene Clemens Polk CountyDirector of Community Development). In keeping with the diverse character of thiszone the land use varies from intensive to extensive, and this zone was adopted todeal with a myriad of potential uses while primarily favoring farm and forest uses.(Chapter 138, Polk County Code)
The Exclusive Farm Use Zoning District includes the natural subdivisions of theWillamette Valley including the terraces, floodplains and also includes the lowermargins of the foothills where intensive agriculture is the main landuse. Thepurpose and intent of the Exclusive Farm Use Zoning District (EFU) is to conserveagricultural lands, and this is done by establishing clear standards for the use anddevelopment of designated agricultural lands. The EFU is applied to lands definedas "agricultural lands" by Oregon Administrative Rule (OAR) 660-33-020(1). This isintended to provide primarily for agricultural uses on lands classified as primefarmland, capability class I and II soils and other important agricultural soils that arecapability class III and IV. Resource uses permitted in this zone are listed inChapter 136, Polk County Code.
The AR-5, Acreage Residential-Five Acre Zone is intended to be a buffer areabetween farm zones and higher density urban and urbanizing areas to reduceconflicts between residential use and normal farming practices. Another strategicuse of the zone is to provide for orderly growth of the urban areas so the communitywill be able to afford the service to and within new urban areas, including the costsof maintenance of utilities, roads and protective and social services. The zone isintended to provide for efficient redivision of acreage subdivisions and promote pre-planning of future important streets. This zone accommodates people who want tolive in the country as hobby farmers, horse, goat, and llama enthusiasts or in orderto have a rural lifestyle with a large garden and orchard. Part of the stated purposeof the zone includes not adversely affecting fish and wildlife resources and habitat

Rickreall Watershed Assessment: Soils 107
areas, natural areas and scenic areas. Permitted and conditional uses are providedin Chapter 128.500, Polk County Code.
Conversion of Land to Urban and Residential DevelopmentUrban and suburban development has occurred primarily on land that had soils tthat also had high potential agricultural productivity. The City of Dallas sits onAbiqua, Salkum, McAlpin, Suver, and Dupee soils. Some of the Abiqua soils in thecity occasionally flood along Rickreall Creek. The town of Rickreall was builtmainly on Malabon and Salkum soils.
Urban development in Dallas and other areas might cause severe soil compactionand increase runoff. Planting grass on construction sites during winter protectsbare soil from splash erosion. Precautions such as seeding with grass and thenmulching the bare ground or hydro-seeding can significantly reduce soil losses fromconstruction sites. Fabric fencing (silt fence) and straw bales can help slow runoffand trap sediments.
Impervious surfaces include roofs, driveways, parking lots and rock quarries convertprecipitation directly into surface runoff and short-circuit natural hydrologic storagethat moderates flows. Rainwater is shunted from infiltration and soil storage, andbase flow declines because water is hurried out of the watershed as runoff(Ferguson 1994). Stream erosion and elevated sediment levels can follow theincreased flows. Benefits of baseflow such as instream flows and aquifer rechargecan decline in urbanizing sub-basins as the area of impervious surface increases.
Map 6-1 shows the High value Farmland Soils Map overlay with zoning. Furtheranalysis is needed to determine the impacts that past development has had on theproductive soil base. Soil information should be used to plan for futuredevelopment in order to protect soils with the highest natural productivity potentialfor agriculture and forestry uses.
Wetland, Riparian and Watershed RestorationSoil maps and GIS soil coverage can be used to conserve and restore wetlandsand riparian areas. The soil survey contains several interpretative tables that areuseful for such purposes. There are tables for water management interpretations(Knezevich, 1982) evaluates soil types for suitability for pond reservoir areas,embankments, dikes and levees, drainage, and irrigation. Another set of tablesprovides a rating of soils for wetland plants, shallow water areas and wetlandwildlife. It is important to realize that for small restoration projects (of a few acresor less) the soil survey map might be too small a scale (1:20,000) and should beenhanced by site specific soil investigations. Some wetland and riparian restorationefforts go awry or fail when soil characteristics are ignored or when workers rely onthe small-scale county soil map. Onsite soil and geomorphic investigations canhelp guide restoration of hydrology and vegetation to better assure project success.

Rickreall Watershed Assessment: Soils 108
SummaryPolk County soils were classified for the purpose of watershed analysis. Soils weregrouped by major associated landuse, capability class, slope, productivity, hydricsoils and flood frequency. From this classification a new soils GIS coverage wascreated that helps the reader to see the soil as more of a functional part of thelandscape of the watershed. From this map generalizations can be made aboutareas that are more prone to soil erosion, areas that flood, areas that are potentiallysuitable to wetland restoration. In forested uplands the steeper soils most like tohave slides can be identified.
In the forested uplands, mass erosion has been the dominant process for sedimentdelivery. Erosion events follow disturbances such as the Rock House Creek Fire.Forest practices and existing networks of forest roads are tested by such eventsand by particularly wet winters such as 1996, when numerous slides occurred in thewatershed and many roads failed. More data on roads in particular are needed toevaluate the impacts to the upper watershed. Accelerated mass wasting fromuplands can be a major source of stream sediment in the watershed, and practicesand remedial action is needed to reduce sediment load to reservoir.
The potential for large soil loss events has been documented here. Care must beexercised to protect soil from water erosion. This is achieved with winter cover andwith drainage tile in areas where side-hill seeps occur in agricultural fields.
Fertilizers and Pesticides from agriculture are not well quantified and their impactson water quality in the watershed have not been well characterized. Recentresearch has shown that there is substantial denitrification in riparian areas withpoorly drained soils adjacent to grass seed farms. In the future, more landscapeprocess research should continue in the Willamette Valley. New pesticidereporting laws that go into effect in 2002 might contribute useful information infuture assessments about pesticides used in the watershed and their fates.
Data are sparse or inadequate for sediment delivery, stream bank erosion, forested-upland debris avalanche, road condition and inventory. These all need to beinventoried. This is time consuming and expensive data.
Productive soils have been converted to urban and residential landuse. Locallyimpervious surfaces convert precipitation directly into surface runoff and short-circuit natural hydrologic storage. Zoning laws are in place to help protect thenatural resource value of agricultural and forest lands, and at the same time offersresidential areas a buffer from farming and logging practices.
A large dairy and a rock quarry located on Rickreall Creek are discussed tohighlight examples of some of the potential nonpoint is source issues in thewatershed and to point to the amount of effort that already goes into practices toprotect the watershed and Rickreall Creek.
Soil data and interpretations can help people who are trying to restore wetlands andriparian areas. GIS capabilities will provide tools to better use this information.There is a need for more use of the available soil interpretation information inplanning. In cases where small projects are being planned, the 1:20,000 soil map

Rickreall Watershed Assessment: Soils 109
and GIS coverage made from it, may not be of fine enough resolution and onsiteinvestigations should be used instead.
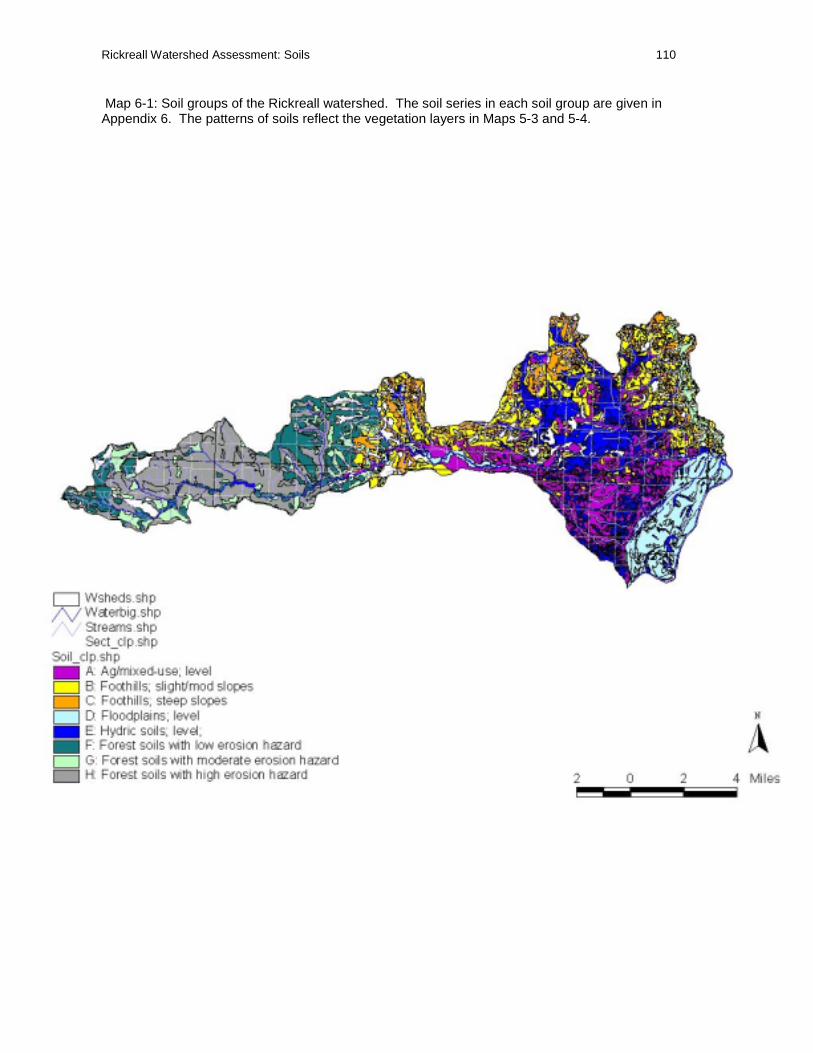
Rickreall Watershed Assessment: Soils 110
Map 6-1: Soil groups of the Rickreall watershed. The soil series in each soil group are given inAppendix 6. The patterns of soils reflect the vegetation layers in Maps 5-3 and 5-4.

Rickreall Watershed Assessment: Socioeconomics 111
Chapter 7 : ECONOMICS AND DE MOGRAPHICS
The majority of economic data available from state and federal agencies is aggregatedat the county level. The assumption used in the analysis is that the trends for PolkCounty reflect trends for the Rickreall Watershed. While 100 % of the RickreallWatershed is in Polk County, only 12 % of Polk County lies within the watershed (Map1-1). Judging by the location of the watershed and that it crosses a mix of landusetypes and populations, it is assumed that the mix of land uses and social profiles forwatershed are reasonably represented by the Polk County data.
Ninety percent of the Rickreall watershed is in private ownership. The largest block ofpublic lands is the Baskett Slough National Wildlife Refuge (ca. 6000 acres). Most ofthe remaining public lands are in the upper watershed (Map 1-3). There are scatteredsmaller public holdings such as the city park and city facilities, a county park andfairgrounds at Rickreall and school grounds.
The land use by area is primarily agriculture, followed by forestry with lesser areas inurban, rural residential, and light industry. A landuse map is not available at this time,but one can get a good idea of the mix of landuses by viewing the watershed compositeorthophotos (Map 1-2), population density (Map 1-4), vegetation layer (5-4), and zoningmap (Map 7-1). There are clear differences between the upper and lower portions ofthe watershed. The upper portion is nearly all forest in large holdings. The lowerportion is a more diverse mix of large and small private holdings, mix of zoning types,and mix of population densities.
The distribution of taxlots by size class provides an indication of private ownershippatterns. The sizes of the taxlots are a good representation of the density of multiplesmall private holdings. An exception is where a single entity owns multiple taxlots—inwhich case one would over estimate the area in small holdings (see the Baskett Slougharea). But since there is a large area in very small taxlots, it is reasonable to assumethese represent actual individual ownerships and not large farms. The taxlot size mapindicates that nearly 40 % of the lower watershed is in hundreds of small holdings.These holdings are concentrated in and near the communities (e.g., Dallas, Rickreall,Eola, and Independence) and scattered along the main highways.
The remaining area in the lower watershed is in large taxlots and is mostly agriculturalfields of over 100 acres (see aerial photos and vegetation map). Over 50 % of thevegetation of lower watershed is classed as perennial grass seed production (Map 5-4).Another 20 % is classed as other agriculture and orchards. Lawns, driveways, roads,and rooftops are not broken out in the vegetation classes, but it is likely that a largeportion of the “other agriculture and orchards” vegetation class are in rural residentialland use.
Economic Characteristics of Polk CountyThe forested lands of Polk County have provided a widely fluctuating timber harvestover time (Figure 7-1). The total harvests appear to show an increasing trend over timewith harvests in 1998 totaling about 110 million board feet (MMBF)). Peak harvestyears occurred in 1963 and 1988 (160 MMBF each year) and the low harvest was in
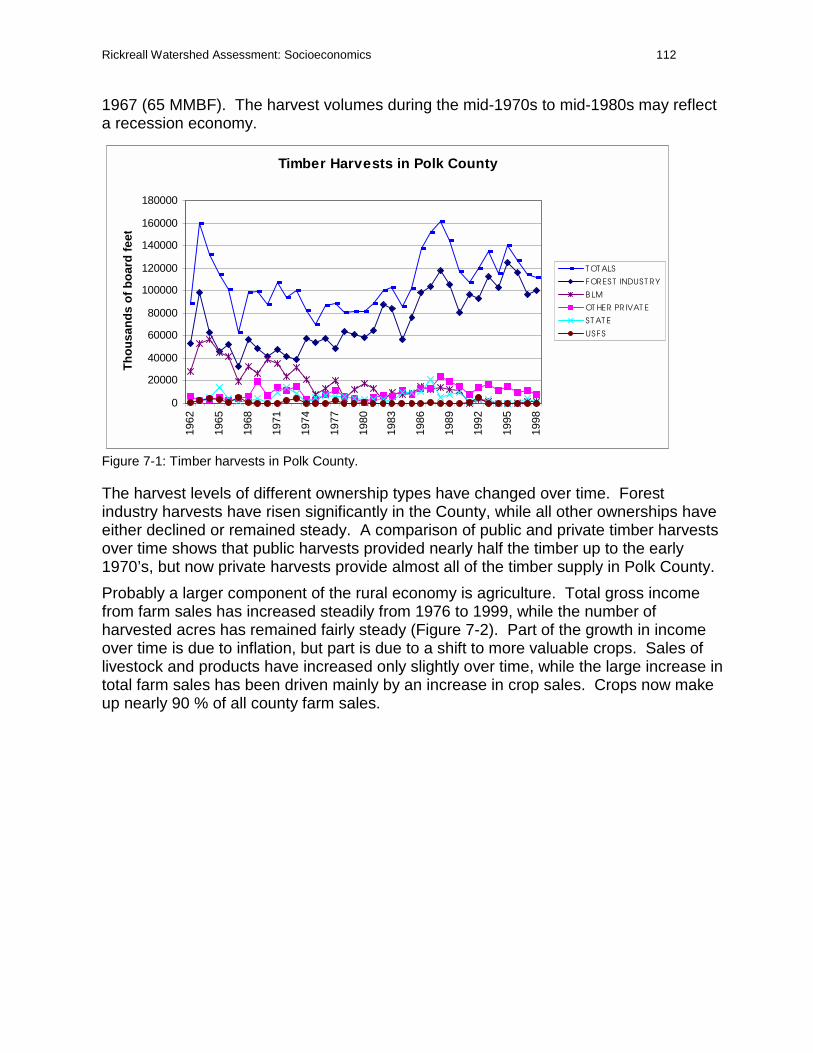
Rickreall Watershed Assessment: Socioeconomics 112
1967 (65 MMBF). The harvest volumes during the mid-1970s to mid-1980s may reflecta recession economy.
Figure 7-1: Timber harvests in Polk County.
The harvest levels of different ownership types have changed over time. Forestindustry harvests have risen significantly in the County, while all other ownerships haveeither declined or remained steady. A comparison of public and private timber harvestsover time shows that public harvests provided nearly half the timber up to the early1970’s, but now private harvests provide almost all of the timber supply in Polk County.
Probably a larger component of the rural economy is agriculture. Total gross incomefrom farm sales has increased steadily from 1976 to 1999, while the number ofharvested acres has remained fairly steady (Figure 7-2). Part of the growth in incomeover time is due to inflation, but part is due to a shift to more valuable crops. Sales oflivestock and products have increased only slightly over time, while the large increase intotal farm sales has been driven mainly by an increase in crop sales. Crops now makeup nearly 90 % of all county farm sales.
Timber Harvests in Polk County
0
20000
40000
60000
80000
100000
120000
140000
160000
18000019
62
1965
1968
1971
1974
1977
1980
1983
1986
1989
1992
1995
1998
Th
ou
san
ds
of
bo
ard
fee
t
T OT ALS
FORES T INDUS T RY
B LM
OT HER PR IVAT E
ST AT E
US FS

Rickreall Watershed Assessment: Socioeconomics 113
Figure 7-2: Polk County agriculture sales and harvested acres over time.
In the mid-1970’s to the 80’s grains produced the greatest value in crop sales. Sincethe mid-1980’s, specialty products and grass and legume seeds have generated thegreatest dollar value of gross sales in Polk County (Figure 7-3, see also Table 7-1).Grass and legume seeds now make up 44 % of all crop sales, while specialty productscomprise 26 %. Specialty products in Polk County in 1999 consisted of 42 % forestfarm sales, 32 % Christmas trees, and 19 % nursery (see Table 7-2 for breakdowns).
There has been a shift in acres of crop types over time (Figure 7-4). The acreage incrops has shifted continually away from grain in the mid-1970s to be replaced by grassseed and legume seed production today. The proportional acreage in grass and legumeseeds has risen from 20 % in 1976 to 65 % in 1999. Despite the growth in dollar salesof specialty products, the harvested acreage of these products is only listed at 580acres, this is because no acres are counted for farm forest sales or nursery (see Table7-2).
Dairy is the only commodity that has remained in the top five agricultural value productsfrom Polk County over the last 25 years (Table 7-1).
Polk County Gross Agriculture Sales and Crop Acres in Production
0
20000
40000
60000
80000
100000
120000S
ales
in t
ho
usa
nd
s o
f $
or
To
tal A
cres
T otal Crop Acres
All Crop S ales (thousands of $)
Livestock & Poultry Sales (thousands $)

Rickreall Watershed Assessment: Socioeconomics 114
Figure 7-3: Polk County crop sales over time by crop type.
Table 7-1 Top five agricultural commodities in Polk County in 1999 and 1976.
Item Sales in 1999
Tall fescue $19,082,000
Dairy 14,204,000
Perennial ryegrass 11,484,000
Christmas trees 9,614,000
Nursery crops 7,348,000
Item Sales in 1976
Wheat $8,178,000
Dairy 2,884,000
Annual ryegrass 2,015,000
Sweet cherries 1,762,000
Cattle 1,672,000
Polk County Gross Crop Sales
0
5000
10000
15000
20000
25000
30000
35000
40000
45000
Sal
es in
th
ou
san
ds
of
$
GRAS S & LEGUME S EED
S PECIALT Y PRODUCT
T REE FRUIT AND NUT
HAY AND FORAGE
FIELD CROP
S MALL FRUIT AND B ERRY
VEG AND T RUCK CROP
GRAINS

Rickreall Watershed Assessment: Socioeconomics 115
Figure 7-4: Polk County acres in crops over time.
Table 7-2: Total agriculture report for Polk County 1999.County Report for Polk County in 1999 HARVEST YIELD PROD. PRICE VALUE PCT VALUE HARVEST YIELD PROD. PRICE
/UNIT /UNIT /UNIT /UNIT PROD.(000) SOLD SALES(000) UOM UOM UOM UOM
WHEAT 3500 68 238000 $3.29 $784 98 $768 ACRES BU/A BU $/BU
BARLEY 300 58 17300 $1.62 $28 82 $23 ACRES BU/A BU $/BU
OATS 1300 99 128700 $1.35 $174 80 $139 ACRES BU/A BU $/BU
1000 - GRAINS TOTALS 5100 $986 $930
ALFALFA HAY 1000 5 5000 $100.00 $500 25 $125 ACRES T/A TONS $/T
OTHER HAY 10000 2 20000 $75.00 $1,500 20 $300 ACRES T/A TONS $/T
HAY SILAGE 2000 32 64000 $14.00 $896 25 $224 ACRES T/A TONS $/T
SILAGE CORN 1500 28 42000 $27.00 $1,134 50 $567 ACRES T/A TONS $/T
GRASS AND GRAIN STRAW 0 0 76000 $40.00 $3,040 95 $2,888 ACRES T/A TONS $/T
2000 - HAY & FORAGE TOTALS 14500 $7,070 $4,104
CRIMSON CLOVER 200 600 120 $60.00 $72 60 $43 ACRES LBS/A 000 LBS $/CWT
RED CLOVER 3500 400 1400 $55.00 $770 100 $770 ACRES LBS/A 000 LBS $/CWT
HAIRY VETCH 330 380 124 $75.00 $93 100 $93 ACRES LBS/A 000 LBS $/CWT
CHEWINGS FESCUE 70 800 56 $80.00 $45 100 $45 ACRES LBS/A 000 LBS $/CWT
TALL FESCUE 29000 1400 40600 $47.00 $19,082 100 $19,082 ACRES LBS/A 000 LBS $/CWT
ANNUAL RYEGRASS 14000 2000 28000 $20.00 $5,600 100 $5,600 ACRES LBS/A 000 LBS $/CWT
PERENNIAL RYEGRASS 14500 1440 20880 $55.00 $11,484 100 $11,484 ACRES LBS/A 000 LBS $/CWT
ORCHARDGRASS 4300 920 3978 $44.00 $1,750 100 $1,750 ACRES LBS/A 000 LBS $/CWT
COMMON VETCH 165 700 116 $20.00 $23 100 $23 ACRES LBS/A 000 LBS $/CWT
ARROWLEAF CLOVER 350 700 245 $65.00 $159 100 $159 ACRES LBS/A 000 LBS $/CWT
OTHER MISC. GRASS SEED &LEGUMES 100 0 0 $0.00 $35 100 $35 ACRES
3000 - GRASS & LEGUMES TOTALS 66515 $39,113 $39,084
Polk County Acres in Crops
0
10000
20000
30000
40000
50000
60000
70000
Acr
es
GR AS S & LEGUME SEED
HAY AND FOR AGE
T R EE FRUIT AND NUT
GR AINS
F IELD CR OP
VEG AND T RUCK CROP
SPECIALT Y PRODUCT
SMALL FR UIT & B ER RY

Rickreall Watershed Assessment: Socioeconomics 116
Table 7-2 cont. HARVEST YIELD PROD. PRICE VALUE PCT VALUE HARVEST YIELD PROD. PRICE
County Report for Polk County in 1999 /UNIT /UNIT /UNIT /UNIT PROD.(000) SOLD SALES(000) UOM UOM UOM UOM
PEPPERMINT FOR OIL 415 57 23847 $14.47 $345 100 $345 ACRES LBS/A LBS $/LB
HOPS 830 1730 1436 $2.04 $2,930 100 $2,930 ACRES LBS/A 000 LBS $/LB
SUGARBEET FOR SEED 90 2770 249 $0.58 $144 100 $144 ACRES LBS/A 000 LBS $/LB
RADISH SEED 50 1400 70 $60.00 $42 100 $42 ACRES LBS/A 000 LBS $/CWT
VEG AND FLOWER SEED 130 0 0 $0.00 $240 100 $240 ACRES
MISC. FIELD CROPS 900 0 0 $0.00 $295 100 $295 ACRES TONS
4000 - FIELD CROPS TOTALS 2415 $3,996 $3,996
APPLES 140 220 30800 $15.50 $477 100 $477 ACRES BX/A BX $/BX
SWEET CHERRIES 1120 4 4700 $770.00 $3,619 100 $3,619 ACRES T/A TONS $/T
TART CHERRIES 500 2 1100 $450.00 $495 100 $495 ACRES T/A TONS $/T
PEACHES 20 150 3000 $25.00 $75 100 $75 ACRES BX/A BX $/BX
BARTLETT PEARS 10 9 90 $420.00 $38 100 $38 ACRES T/A TONS $/T
ASIAN PEARS 10 2 20 $800.00 $16 100 $16 ACRES T/A TONS $/T
PRUNES AND PLUMS 485 4 2130 $240.00 $511 100 $511 ACRES T/A TONS $/T
WINE GRAPES 1120 2 2800 $1,220.00 $3,416 100 $3,416 ACRES T/A TONS $/T
HAZELNUTS 2200 2080 2290 $0.44 $2,015 100 $2,015 ACRES LBS/A TONS $/LB
WALNUTS 30 1100 15 $0.85 $26 100 $26 ACRES LBS/A TONS $/LB
5000 - TREE FRUIT & NUTS TOTALS 5635 $10,688 $10,688
STRAWBERRIES 40 4.6 368 $52.72 $194 100 $194 ACRES T/A 000 LBS CTS/LB
RED RASPBERRIES 80 4862.5 389 $69.41 $270 100 $270 ACRES LBS/A 000 LBS CTS/LB
BLACK RASPBERRIES 25 2320 58 $194.83 $113 100 $113 ACRES LBS/A 000 LBS CTS/LB
EVERGREEN BLACKBERRIES 85 8200 697 $54.38 $379 100 $379 ACRES LBS/A 000 LBS CTS/LB
MARION AND OTHER BLACKBERRIES 180 6527.8 1175 $75.57 $888 100 $888 ACRES LBS/A 000 LBS CTS/LB
BOYSENBERRIES 25 5520 138 $65.22 $90 100 $90 ACRES LBS/A 000 LBS CTS/LB
BLUEBERRIES 60 8883.3 533 $79.92 $426 100 $426 ACRES LBS/A 000 LBS CTS/LB
GOOSEBERRIES 20 4250 85 $62.00 $53 100 $53 ACRES LBS/A 000 LBS CTS/LB
6000 - SMALL FRUIT & BERRIESTOTALS 515 $2,413 $2,413
DRY STORAGE ONIONS 35 330 12 $5.00 $60 100 $60 ACRES CWT/A 000 CWT $/CWT
SWEET CORN FRESH 50 170 8500 $14.00 $119 100 $119 ACRES CWT/A CWT $/CWT
SNAP BEANS PROCESSED 389 5 2183 $150.30 $328 100 $328 ACRES T/A TONS $/T
SWEET CORN PROCESSED 918 5 6707 $75.10 $504 100 $504 ACRES T/A TONS $/T
CABBAGE 15 20 300 $120.00 $36 100 $36 ACRES T/A TONS $/T
TOMATOES 12 300 3600 $36.20 $130 100 $130 ACRES CWT/A CWT $/CWT
SQUASH AND PUMPKINS 20 25 460 $120.00 $55 100 $55 ACRES T/A TONS $/T
OTHER MISC. VEG. & TRUCK CROPS 110 0 0 $0.00 $320 100 $320 ACRES
GARLIC 75 5 300 $400.00 $120 100 $120 ACRES T/A TONS $/T
7000 - VEG & TRUCK CROPS TOTALS 1624 $1,672 $1,672
NURSERY CROPS 0 0 0 $0.00 $7,348 100 $7,348 ACRES
GREENHOUSE CROPS 0 0 0 $0.00 $794 100 $794 ACRES
MISC. SPECIALTY CROPS 0 0 0 $0.00 $465 100 $465 ACRES
FARM FOREST PRODUCTS 0 0 7700 $575.00 $4,428 100 $4,428 ACRES 000 BF $/000BF

Rickreall Watershed Assessment: Socioeconomics 117
CHRISTMAS TREES 580 0 754 $12.75 $9,614 100 $9,614 ACRES TREE/A 1000S $/TREE
Table 7-2 cont. HARVEST YIELD PROD. PRICE VALUE PCT VALUE HARVEST YIELD PROD. PRICE
County Report for Polk County in 1999 /UNIT /UNIT /UNIT /UNIT PROD.(000) SOLD SALES(000) UOM UOM UOM UOM
FEE HUNTING AND RECREATION 0 0 0 $0.00 $65 100 $65 PEOPLE $/REC.
8000 - SPECIALTY PRODUCTSTOTALS
580 $22,714 $22,714
BEEF COWS 4300 0 0 $0.00 $0 0 $0 NO. HEAD HD MKTD
CATTLE 16900 0 0 $0.00 $2,644 100 $2,644 NO. HEAD HD MKTD
HOGS AND PIGS 1025 2 2100 $100.00 $210 100 $210 NO. HEAD HD MKTD
SHEEP AND LAMBS 11950 0 0 $0.00 $649 100 $649 NO. HEAD HD MKTD
EWES 5600 0 0 $0.00 $0 0 $0 NO. HEAD
DAIRY PRODUCTS 5600 176 986000 $14.70 $14,494 98 $14,204 NO. HEAD CWT/COW CWT $/CWT
FARM CHICKENS 5350 0 4200 $1.19 $5 100 $5 NO. HEAD HD MKTD $/HEAD
BROILERS 0 0 2360000 $1.97 $4,649 100 $4,649 NO. HEAD HD MKTD $/HEAD
CHICKEN EGGS 4800 20 96 $87.00 $84 92 $77 NO. HEAD DOZ/HD 000 DOZ CTS/DOZ
WOOL 9944 6 60000 $13.00 $8 15 $1 NO. HEAD LBS/HD LBS CTS/LB
HONEY AND BEESWAX 720 0 0 $0.00 $17 100 $17 NO. HEAD LBS CTS/LB
HORSES AND MULES 3100 0 0 $0.00 $410 100 $410 NO. HEAD
MISC. POULTRY AND OTHERPRODUCTS
0 0 0 $0.00 $325 100 $325 NO. HEAD
RABBITS 725 0 18500 $4.25 $79 100 $79 NO. HEAD HEAD $/HEAD
9000 - LIVESTOCK & POULTRYTOTALS 70014 $23,574 $23,270
UOM = Unit of Measure

Rickreall Watershed Assessment: Socioeconomics 118
Population ProjectionsPopulation growth in Dallas and Polk County are shown in Figure 7-5.
Figure 7-5: Population projection for Polk County and Dallas.
A study conducted by a regional research consortium called the Pacific NorthwestEcosystem Research Consortium (Hulse et al. 1997) has implications for the Rickreall.This study focused on the Muddy Creek sub-basin in the southeastern part of the MarysRiver Watershed. The Muddy Creek sub-basin is similar to the Rickreall. The MuddyCreek watershed was chosen as a prototype for the larger Willamette River basinproject because previous analyses showed that, between 1970 and 1990, land usechange in the basin was greatest at the periphery of major metropolitan areas. Theauthors noted that the Muddy Creek sub-basin is near a metro area (Corvallis) that islikely to experience strong development pressure within the next 20-30 years.
The Hulse report estimated that 88% of the Muddy Creek sub-basin is privately owned.Most is zoned for Exclusive Farm Use (42% of the watershed), Forest Conservation(35%) or Secondary Forest uses (11%). Approximately 12% of the watershed is inpublic ownership. Despite this, the watershed is projected to experience significantgrowth in residential development over the next 15 years. The Benton CountyDevelopment Department projects 1000 new people (or 400 households) in the sub-basin by the year 2015. Combining this information with population projections fromPSU led to a baseline projection (called the “Plan Trend Future” in the report) of 1,118new people or 475 new dwellings by 2025. The research team bounded this baselineprojection with alternative growth scenarios, ranging from a high development scenarioof 1,250 new households by 2025 (a doubling of the 1990 resident population of thewatershed) to a high conservation scenario of only 125 new households over 1990levels.
Population growth
0
10000
20000
30000
40000
50000
60000
70000
80000
90000
1900 1920 1940 1960 1980 2000 2020 2040
Year
Po
pu
lati
on
Polk County
Dallas
Rickreall Watershed Assessment: Socioeconomics 119
The research team then estimated the impact of the scenarios on biodiversity and waterquality. They concluded that the high development future would put twice as manyspecies per year at risk of losing >50 % of their habitat over the next 30 years comparedto the last 150 years. They recommended seeking a land use/land cover pattern that ismore conservative than the Plan Trend Future. In terms of water quality, theyconcluded that under the Plan Trend Future, water quality would degrade by the year2025. A future that tends toward the high conservation scenario is necessary tomaintain water quality at 1990 levels.
Further information about development pressures in the Rickreall watershed wouldrequire more time and resources. The Polk County Development Department cancompile data on building permits over time, by location, and could at least approximatethe watershed boundaries. In addition, the Polk County Assessor’s Office has data onevery tax lot in the County. Records could be analyzed to find dates of lot subdivision,as well as the year any house was built. From this analysis, a database of land andhousing development over time could be constructed.
Recreational Resources and Use in the Rickreall WatershedThe predominance of private land in the watershed results in relatively few developedrecreation areas. Polk County has one park – Nesmith – next to the fairgrounds nearRickreall. The city has several parks and an arboretum. In addition to the parks, theBaskett Slough National Wildlife Refuge allows recreational use. Refuge offers hikingtrails and abundant wildlife viewing opportunities.
Access to the private road into the upper watershed is allowed. Motorized use isprohibited without a permit except during hunting seasons. Private lands in thewatershed offer opportunities for waterfowl, big game, and small game hunting.
Summary and ConclusionsMuch of the data used to describe socioeconomic conditions is only available at thecounty level. Therefore, some caution must be used when interpreting the results forthe Rickreall watershed. The data on agricultural sales and acreage, as well as thedata on timber harvest, primarily describe rural parts of Polk County. If we assume thatthe portion of Polk County that is in the Rickreall has a similar distribution of agriculturaland forest lands as the part of the county outside of the watershed, then the trendsshown in these statistics should be fairly representative of the watershed. The datashow that the number of acres in agriculture has been holding fairly steady over time,while the value of agricultural output has been rising. Agricultural landowners haveincreased the amount of acreage in grass seeds, while decreasing the acreage ingrains. Further investigation should look at the differences in farming practices (e.g.,pesticide applications) for grass seed and grains and assess the implications for waterquality.
Timber harvest levels have fluctuated widely over time in Polk County. Today’s levelsare lower than the long-term average for the County. Most of the public lands in thewatershed are being managed under the Northwest Forest Plan, and very little harvesthas come from those lands in recent years. An increase in harvest from private lands

Rickreall Watershed Assessment: Socioeconomics 120
has resulted, and further investigation should look at the differences in harvest practicesof private and public owners.
Changes in the economic structure of the county will also have implications for thewatershed. As Dallas has grown in both population and economic opportunities, newresidents have created a demand for rural residential housing. In addition, moreresidents of the watershed may have found work in Corvallis, Salem, or Portland,leading to more commuting out of the watershed. Further investigation shoulddocument the number of new dwellings that have been built in the watershed over time.These data are available from the Polk County Development Department by specialrequest. Further analysis should also look at the impact on water supply as moreresidences are built.
Finally, few data on recreation use within the watershed exist. Current use does notappear to have major impacts on water quality, and the water resources of thewatershed are not a major recreational attraction. As population continues to grow,however, recreational use should be monitored.

Rickreall Watershed Assessment: Socioeconomics 121
Map 7-1: Polk County comprehensive plan zoning
5 0 5 Miles
N
EW
S
Compname % Area
AGRICULTURE 55.3
FOREST 33.0
FARM - FOREST 9.2
URBAN RESERVE 1.7
RURAL LAND 0.7
RURAL COMMUNITY CENTER 0.1
PUBLIC LANDS 0.0
COMMERCIAL 0.0
INDUSTRIAL 0.0 Data: Polk County GIS
County Comprehensive Plan ZoningAGRICULTUREFORESTFARM - FORESTURBAN RESERVERURAL LANDRURAL COMMUNITY CENTERCOMMERCIALINDUSTRIALPUBLIC LANDS

Rickreall Watershed Assessment: Bibliography 122
BIBLIOGRAPHY
Aikens C. 1975. Archaeological Studies in the Willamette Valley, Oregon. University of OregonAnthropological Papers, No. 8. Eugene, OR.
Altman B, C Benson, I Waite. 1997. Summary of information on aquatic biota and their habitats in theWillamette Basin, Oregon, through 1995. Water-Resources Investigations Report 97-4023. U.S.Geological Survey Portland, OR. [A product of the National Aquatic Water Quality AssessmentProgram (NAWQA) of USGS whose mission is to describe water quality conditions and change.Thorough review of published information with written summaries and syntheses. Also includes aseries of data tables and information rich appendices. Report available through USGS in Denver303-202-4210.]
Anderson C, T Wood, J Morace. 1997. Distribution of Dissolved Pesticides and Other Water QualityConstituents in small Streams, and their Relation to Land Use, in the Willamette River Basin,Oregon, 1996. US Dept of the Int. US Geological Survey. Water-Resources InvestigationsReport 97-4268. Prepared in cooperation with the Oregon Dept of Environmental Quality andOregon Association of Clean Water Agencies. Portland, OR.
Baldwin EM. 1976. Geology of Oregon. Kendall/Hunt Publishing Company. Dubuque, IowaOSUVALLEY
Baum RC, VG Kaiser. 1965. Damage to Oregon farms and ranches by the recent floods. J. Soil andWater Cons. 20:152-153.
Bela JL. 1979. Geologic Hazards of Eastern Benton County, Oregon. State of Oregon, Department ofGeology and Mineral Industries.
Bennett E. 1998. Wren Subwatershed Marys River Watershed Analysis (Draft). In Cooperation with theSiuslaw National Forest, Corvallis, OR. [A complete watershed analysis with GIS maps for theWren Subwatershed based largely on aerial photo interpretation.]
Beschta RL, 1978. Long-term patterns of sediment production following road construction and logging inthe Oregon Coast Range. Water Resources Research. 14: 1011-1016. [Suspended sedimentproduction after road construction, logging and slash disposal was significantly increased onwatersheds in Oregon Coast Range. A 25% patch cut showed increases in 3 of 8 post treatmentyears. Mass soil erosion from roads primarily caused these increases. Surface erosion from asevere slash burn was the primary cause of increased sediment yields for 5 post treatment yearson a watershed that was 82% clearcut.
Beschta RL, SJ O'Leary, RE Edwards, KD Knoop. 1981. Sediment and organic matter transport inOregon Coast Range streams. Water Resources Research Institute. V. 70 Oregon StateUniversity. Corvallis, Oregon. Valley Library. [Research in two Oregon Coast Range streams,Flynn creek and Oak Creek measured bedload transport, particulate organic matter transport,total suspended solids concentration and turbidity during storm runoff. Both creeks drain forestlands of predominantly mature Douglas fir. The study shows relationships between flow and totalsuspended solids during storm runoff events. Total suspended solids is the most important factoraffecting turbidity of Oregon Coast Range Streams. However relationships between these twoparameters varied between storms and between drainages; therefore the authors conclude thatpredictive relationships must be developed on a watershed by watershed basis. Results alsodemonstrated that turbidities (hence total suspended solids concentrations) quickly return to lessthan 30 ntu (nephlomatic turbidity units) following runoff peak. Oak Creek had turbidities lessthan 30 ntu within 24 hours for 96% of the storms measured. The years-sampled representrelatively frequent, but small to moderate runoff events. References includes 49 citations.]
BLM [Bureau of Land Management] 1997. Benton Foothills Watershed Analysis Area. US Dept. of theInterior. Bureau of Land Management, Salem, OR. [A watershed analysis completed on thelower elevation areas of Marys River drainage, includes Muddy Creek subwatershed and upperGreasy Creek subwatershed areas.]

Rickreall Watershed Assessment: Bibliography 123
BLM [Bureau of Land Management.] 1998. Rowell Creek/Mill Creek/Rickreall Creek/ Luckiamute RiverWatershed Analysis. Marys Peak Resource Area. Salem District, Bureau of Land Management,1717 Fabry Road, Salem, Oregon 97306. [This Watershed Analysis was conducted inaccordance with the Northwest Forest Plan (NFP), a regional ecosystem management planinitiated in 1994 by federal land management agencies. The analysis provides "foundation-layingdata structure needed to support the ecosystem management objectives described in the NFP."This report has useful information on forest condition, landslides, fish and channel habitat, andriparian conditions. The GIS map products include slope hazard, landslides, forest seralstages/habitat types, riparian reserves, and stream bank shading and water temperature,potential for large woody debris in streams, stream classification, and forest density managementopportunities.]
Boatwright Engineering, Inc., No date. Comprehensive water and sewer plan for Polk County, Oregon.Mid Valley Council of Governments. [Good summary of history of Polk County with credit givento Smith, 1964. Available at Dallas Public Library DAL R/352.0795 P75W.]
Bond C. pers. comm. Professor Emeritus, Dept. Fisheries and Wildlife, Oregon State Univesity. [Spokewith Bond at his Corvallis home, as part of Marys River Watershed assessment in 1998. Citedhere as his comments about salmonid distributions in the Coast Range are relevant to theRickreall watershed.]
Boyd R. 1986. Strategies of Indian Burning In The Willamette Valley. Canadian Journal of Anthropology.Fall: p.65-86. [Excellent use of historical information to analyze prehistoric Kalapuyan burningpractices in the Willamette Valley and specific effects on vegetation. Good bibliography,organization, and use of footnotes.]
Bonn BA. 1998. Dioxins and Furans in Bed Sediment and Fish Tissue of the Willamette Basin, Oregon.U.S. Geological Survey. Water Resources Investigations. Report 97-4082-D. 12 p. OSU ValleyLibrary TD 223.A343 no 97-4082-D Concentrations of toxics are compared with land use types.At Corvallis (river mile 137) reported levels are below nationwide background levels.
Bonn BA, SR Hinkle, DA Wentz, and MA Uhrich. 1995. Analysis of Nutrient and Ancillary Surface andGroundwater of the Willamette Basin, Oregon, 1980-90. U.S. Geological Survey. WaterResources Investigations. Report 95-4036. 85 p. OSU Valley Library TD 223.A343 no 95-4036.Nutrient and water quality data for groundwater and surface water. This is an analysis of waterquality using surface and groundwater data that includes the Marys River data. Surface water-nitrate, DO, temperature is compared with land use. Groundwater-nitrate concentration iselevated in shallow alluvial wells.
Brahmani B. 1993. Final Report of the volunteer well water nitrate test. EPA 319 Grant to OregonDepartment of Environmental Quality. Report provides data from the well owner water samplingsurvey. The township, rnage and section number and nitrate level of the well water samples wasentered into a geographic information system database. From this data maps of nitrate levelsacross the state and including through Polk County. Data from this report are difficult to interpretin order to make specific statements about nitrate contamination of wells. There are areas in theRickreall creek watershed that are over 7 ppm nitrate. However within the Willamette Valleythere were significant numbers of wells that were at or over the drinking water standard of 10 mg/lnitrate; (In Eugene 10% of wells sampled had greater than 10 mg/l and in Junction City 22% wereover the standard)]
Brown RB and GF Kling 1980. Erosion and sediment as indicated by redistribution of CESIUM-137. InErosion, Sediment and Water Quality in the High Winter Rainfall Report. Special Report 690.Agricultural Experiment Station, Oregon State University, Corvallis. OSU VALLEY S105 E55.690
Castro J. M. 1996. NRCS Geomorphologist, Regional Salmon Habitat Recovery Team, Letter to City ofDallas: Sediment in Mercer Reservoir, 2 p. [ Letter reporting findings of an inspection of theRickreall watershed following the floods of February,1996. Castro reports on numerous debrisflows that caused sediment to be deposited in and along tributary channels. One comment is that"These debris flows almost entirely (90%?) originated from roads." There is also mention of an 8

Rickreall Watershed Assessment: Bibliography 124
to 10 acre landslide that is contributing sediment to the reservoir, however Castro had not been tothis particular landslide. The writer estimates many more debris flows (100's) and landslides willoccur in the watershed over the next ten years. " This long-term sediment source will reduce thecapacity of Mercer Reservoir and increase turbidity of the reservoir]
CH2MHill. 1996. Evaluation of existing conditions along Rickreall Creek, Dallas wastewater treatmentfacilities plan. Draft Technical Memorandum prepared by M Girts, D Keegan, G White, and MGallagher for City of Dallas. Unpublished report on file with Rickreall Watershed Council.[Describes results of a foot survey of stream habitat, aquatic invertebrates and fish observationsfrom the mouth to the wastewater treatment plant outfall at river mile 10.5. Also includes reviewof data regarding vegetation, wildlife, and wetlands along or near Rickreall Creek and notes theavailability of a photo log created during the survey.]
CH2MHill. 1997. Supplemental Rickreall Creek in-stream water temperature information. TechnicalMemorandum prepared by G White for M Hamlin, Oregon Department of Environmental Quality.Unpublished report on file at Rickreall Watershed Council. [Part of an ongoing data review ofpotential effects of proposed effluent discharges on Rickreall Creek in-stream watertemperatures, as related to aquatic resources.]
CH2MHill. 1999. Regional water supply plan. Phase 2. Cities of Dallas, Monmouth, Independence, andPolk County. Revised January 28, 1999. Report on file with City of Dallas.
Clyman J. 1984. Journal of a mountain man. Edited by LM Hasselstrom. Mountain Press PublishingCo., Missoula, MT
Collins L. 1951. The Cultural Position of the Kalapuya in the PacificNorthwest. MS Thesis, University ofOregon, Eugene, OR.
Csuti B, A Kimerling, T O’Neil, M Shaughnessy, E Gaines, M Huso. 1998. Atlas of Oregon wildlife:distribution, habitat, and natural history. Oregon State University Press, Corvallis, OR [Shortdescriptions and distribution maps of the 426 species of amphibians, reptiles, breeding birds, andmammals that are native to Oregon plus 15 commonly seen introduced species. Maps werecomplied from a variety of data sources and represent the likely (or predicted) distributions ofhabitat used by the species of interest. Good first approximation of species distributions.]
Dallas, City of. 1994. Agricultural reuse of reclaimed wastewater from the Dallas Sewage treatmentplant, Dallas, Oregon. Unpublished report on file at Rickreall Watershed Council. Draft report.[Background information on the wastewater treatment plant, regulations governing reuse ofwastewater, water flow and withdrawals on Rickreall Creek, NPDES permit limitations, effluentdata for 1992-1994, Rickreall Creek water rights.]
Dallas, City of. 1994. Environmental assessment: Wastewater facility plan, Dallas, Oregon. Unpublishedreport on file at Rickreall Watershed Council. [Part of City’s application for discharge permit forwastewater treatment plant that proposed to pipe the effluent to the Willamette River. Reportincludes description of the project, its need, existing conditions, alternatives, and the projectedenvironmental impacts associated with the project. ]
Dallas, City of. 1996. Supplemental environmental analysis to the revised wastewater facility plan,Dallas, Oregon. Unpublished report on file at Rickreall Watershed Council. [Part of City’sapplication for discharge permit for wastewater treatment plant that proposed to discharge theeffluent to Rickreall Creek with a separate discharge of copper-containing wastewater onto land.Report includes description of the project, its need, existing conditions, alternatives, and theprojected environmental impacts associated with the project. ]
Davies J. 1980. Douglas of the forests: the North American journals of David Douglas. University ofWashington Press, Seattle. [Startin on page 92 are Douglas’ notes relating to early conditions inthe Willamette Valley, 1826. At OSU library.]
Davies K, editor. 1961. Peter Skene Ogden's Snake Country Journal, 1826-27. The Hudson's BayRecord Society, London: pp.143-174. [Appendix B to this volume is the daily journal of AlexanderMcLeod's summer, 1826.]

Rickreall Watershed Assessment: Bibliography 125
Dent L, G Robison, K Mills, A Skaugset, J Paul. 1998. Oregon Department of Forestry 1996 stormimpacts monitoring project preliminary report. Oregon Dept. of Forestry, Philomath, OR.[This is alandslide inventory conducted after the big storms of the winter of 1996-1996. Landslidefrequency was broken out by years since harvest.]
DEQ [Department of Environmental Quality]. 1998. Qregon’s Final 1998 Water Quality Limited Streams– 303(d) List. Partial list of streams in Willamette Basin, including Rickreall Creek andneighboring streams. Downloaded from the DEQ website.
DEQ [Department of Environmental Quality]. 1998. National Pollutant Discharge Elimination System
DEQ [Department of Environmental Quality]. 1993. Rickreall Creek water quality report: Total maximumdaily load program. Unpublished report on file with Rickreall Watershed Council.
Dimick R, F Merryfield. 1945. The fishes of the Willamette River System in Relation to pollution. BulletinSeries no. 20, June 1945. Engineering Experimental Station. Oregon State University, Corvallis,OR. [The first extensive sampling of Willamette River fish over most of the mainstem.]
Douglas D. 1959. Journal kept by David Douglas during his travels in North America 1823-1827.Antiquarian Press Ltd. New York. [First published in 1914, reprinted in 159. Publications of hisdiary—actually two diaries. Excellent source on historic conditions. Documents his observationsof natural history, landscapes, Native Americans during his travels in the Pacific Northwest.Noteworthy source as Douglas was trained in the sciences].
Dunnette D, editor. 1997. River Quality: dynamics and restoration. Edited by A Laenen. CRC Press,Inc. Lewis Publishers, Boca Raton, New York. [A compilation of information on history andchannelization of the Willamette River with maps and bibliography.]
Farnell J. 1979. Marys River and Rickreall Creek Navigability Studies. Division of State Lands. Salem,OR. [A very good compilation of early logging and historical river use on the Rickreall Creek,available at the Dallas Public Library, OSU Library and Division of State Lands, Salem.]
Farrel DA, WE Larson. 1972. Dynamics of the soil-water system during a rainstorm. Soil Sci. 119:242-249.
Federal Register. 1998. Proposed Rules. Upper Willamette River ESU. Vol. 63, No. 46. p. 1800.Tuesday, March 10, 1998. [Short description of what is known regarding the distribution of nativewinter steelhead in the Upper Willamette basin.]
Federal Register. 2000. Designated critical habitat: critical habitat for 19 Evolutionary Significant Units ofsalmon and steelhead in Washington, Oregon, Idaho, and California. Vol. 65 No. 32 / Wedneday,February 16, 2000 pp: 7764- 7786.
Ferguson BK. 1994. Stormwater Infiltration. Lewis Publisher. Boca Raton. OSU VALLEY TD 657.5F47. [Describes many opportunities for using infiltration in managing runoff and stormwater.]
Froehlich HA. 1984. The interaction of skyline logging and soil and water impacts. Pp. 7-11, inProceedings of the fourth Northwest Skyline Symposium.
Gannet MW, DG Woodward. 1997. Groundwater and Surface-Water Relations in the Willamette ValleyOregon. Pp. 131-139, in River Quality: Dynamics and Restoration. CRC Press Inc.
Gilsen L. 1989. Luckiamute Basin Survey. Oregon State Historic Preservation Office, Salem, Oregon.
Griffith SM, TW Thomson. 1996. N rate and timing relationships with tissue N concentration and seedyield in perennial ryegrass. Pp. 41-42 in, WC Young, Ed., 1996 Seed Production Research atOregon State University USDA-ARS Cooperating. Department of Crop and Soil Science Ext/CrS110 4/97.
Griffith SM, JS Owen, WR Horwath, PJ Winington, Jr, JE Baham, LF Elliot. 1997. Nitrogen movement andwater quality at a poorly drained agricultural and riparian site in the Pacific Northwest. Soil Sci.Plant Nutr. 43:1025-1030.

Rickreall Watershed Assessment: Bibliography 126
Habeck J. 1961. The original vegetation of the Mid-Willamette Valley . Northwest Science 35:65-77.[cited in Boyd 1986.]
Hale K. 1988. Rockhouse Creek fire emergency watershed protection project. Memo to Don Greinerdated 1/19/88. On file with Rickreall Watershed Council. [Report of extent of fire that burned5000 acres of the watershed in October 1987. This describes the conditions before and after thefire, and makes estimates of the erosion potential. It was estimated that without emergencywatershed treatment, over 100-acre feet of sediment would reach the reservoir the first winter,approximately 12% of the reservoir capacity. Treatment included aerial seeding of grass, strawbale check dams and a rock sediment trapping structure. In December stream bank erosion wasoccurring on all severely burned streams. Grass had sprouted and was about one inch tall byDecember 10, 1987. There were measured 6-9 plants per foot in the burn area and 20 plants perfoot in the stream bottoms. Some of the clover had sprouted also. Bale dams were filling upwith sediment and a few had partly failed. It was estimated that the combination of grassseeding, hay bale dams and rock structure would stabilize or trap 25-30% of the first year erodedsediment. This estimate would still have 75-acre feet of sediment going into the reservoir thefirst year.]
Harvey GA. 1947. Douglas of the fir: a biography of David Douglas botanist. Harvard Univesity Press,Cambridge, MA. [starting on page 93, he provides descriptions of Douglas’ travels through theWillamette Valley in 1826. At OSU library.]
Harward ME, GF Kling, and JD Istok. 1980. Erosion, Sediments and Water Quality in the High WinterRainfall Zone of the Northwestern United States. Oregon Agricultural Experiment Station Reportno 602. This is a detailed multipart study of sediment, nutrients and pesticides in runoff fromcropland. This is known as the Elkins Road Watershed Studies—small agricultural watershedstudies. Data is given for nutrient and pesticide losses in runoff. Includes the Silverton HillsErosion Study in Marion County.
Hinkle S. 1997. Quality of shallow groundwater in alluvial aquifers of Willamette Basin, Oregon, 1993-1995. U.S.G.S. Water Resources Investigations Report 97-4082-B. OSU VALLEY.
Holt A. 1998. Video recording of history of Rickreall and Luckiamute watersheds. Talk given to RickreallWatershed Council in 1998. Video on file with Rickreall Watershed Council. [The assessmentteam also met with Holt and R. Marsh and the information in this document is a combination ofthe video, pers. comm. and from reviews of the draft document.]
Hooten B. 1997. The status of coastal cutthrout trout in Oregon. Pages 57-67 in JD Hall, PA Bisson,and RE greswell, eds. Sea-Run Cutthroat Trout: Biology, Management, and FutureConservation. Oregon Chapter, American Fisheries Society, Corvallis, OR. [Review of theliterature and unpublished data on the coastal cutthroat trout in Oregon]
Horneck D A and JM Hart. 1988. A survey of nutrient uptake and soil test values in perennial ryegrassand turf type tall fescue fields in the Willamette Valley. In Seed Production Research. Ed. W.Young, III. Pp 13-14, Oregon State University Extension and USDA-ARS, Corvallis.
Horwath WR, LF Elliot, JF Steiner, JH Davis, SM Griffith. 1998. Denitrification in cultivated andnoncultivated riparian areas of grass cropping systems. J. Environ Qual. 27:225-231.
Huddleston JH. 1993. Land use in relation to geomorphic surfaces and soils in the Willamette Valley,Oregon. Pp. 140-047 in, JM Kimble ed., Proceedings of the Eighth International SoilManagement Workshop. Oregon, California and Nevada. July 11-24,1992. [This is a very gooddiscussion that relates geomorphology, soils and land use in the Willamette Valley. This paperalso discusses land use impacts on water quality. Herb Huddleston is a pedology professor atOSU.]
Hulse D, L Goorjian, D Richey, M Flaxman, C Hummon, D White, K Freemark, J Eilers, J Bernert, KVache, J Kaytes, D Diethelm. 1997. Possible Futures for the Muddy Creek Watershed, BentonCounty, Oregon. University of Oregon, Eugene, OR. [This study is a “prototype” for a largerstudy of the Willamette River Basin. The Muddy Creek Watershed was chosen because it hadcharacteristics similar to other critical areas of the Willamette River Basin, such as being close to

Rickreall Watershed Assessment: Bibliography 127
an urban area experiencing rapid growth. Background characteristics of the watershed aredescribed (history, demographics, etc.), and key indicators are chosen for analysis. Theresearchers focused on biodiversity of species, and water quality. Responses of these indicatorsto alternative growth scenarios were analyzed. Scenarios were based on extensive public inputfrom residents of the watershed, and ranged from high growth to high conservation. Analysisshowed that the current trend in growth would lead to a decline of both biodiversity and waterquality by 2020. This report also contained a reference to the Willamette Basin Planning Atlas, byPNW-ERC, which depicts some of the critical natural and cultural factors influencing land andwater use decisions. Information is provided on natural landforms, human populations, andhuman alterations of the landscape, both current conditions and historical changes since about1850. Version 1.0 of the Atlas was published in 1998. Copies may be purchased at cost ($125 +$5 shipping and handling) from the University of Oregon. Contact Dorothy Bollman at (541)346-0675.]
Hulse DA, J Branscomb, G Duclos, S Gregory, S Payne, D Richey, H Dearborn, D Diethelm, L Ashkenas,P Minear, J Christy, E. Alverson, M Richmond. 1998. Willamette River Basin, A Planning Atlas,Ver. 1.0. Pacific Northwest Ecosystem Research Consortium. The Institute for a SustainableEnvironment, University of Oregon, Eugene, OR. [The first in a series of planning guidesdeveloped for the Willamette River Basin, this atlas explores the history and physicalcharacteristics of the valley. It also contains excellent GIS images. Reviews historic landscapeattributes and explores trends in the present human-impacted landscape.]
Istock JD, and ME Harward 1980. Erosion in the Silverton Hills Area, Marion County. In Erosion,Sediment and Water Quality in the High Winter Rainfall Report. Special Report 690. AgriculturalExperiment Station, Oregon State University, Corvallis. OSU VALLEY S105 E55. 690
Istok JD, and ME Harward. 1982. Clay mineralogy in relation to landscape instability in the Coast Rangeof Oregon. Soil Sci. Soc. Am. J. 46:1326-1331. [The types of landslides and mass erosionevents are associated with the mineralogy of soils. The clay fraction of debris avalanches isdominated by nonexpanding layer-silicates that have large particle sizes and small water holdingcapacities. The clay fraction of samples from sites undergoing failure by creep and slumpconsited mainly of smectite, expanding clay.]
Istock JD and B Lowery. 1980. Gross Erosion. In Erosion, Sediment and Water Quality in the HighWinter Rainfall Report. Special Report 690. Agricultural Experiment Station, Oregon StateUniversity, Corvallis. OSU VALLEY S105 E55. 690
Istok JD, B Brown, L Boersma, RW Katz, and A Murphy. 1984. Statistical analysis of climatological datato characterize erosion potential: 5. Joint precipitation and freezing events in western Oregon.Special Report 690. Agricultural Experiment Station, Oregon State University, Corvallis. OSUVALLEY S105 E55. 690.
Jenkins JJ, L Yu, JH Huddleston, and ME Melbye. 1994. Herbicide movement in runoff from grass seedfields in the Peckenpaugh Creek Drainage Basin, Linn County, Oregon, a pilot study. OregonState University, Corvallis.
Johnson MG and R Betscha. 1980. Logging, infiltration capacity and surface erodibility in WesternOregon. Journal of Forestry. 78:334-337.
Jones J and GE Grant. 1996. Peak flow response s to clear-cutting and roads in small and large basins,Western Cascades, Oregon. Water Resources Research 32:959-974.
Jones K. pers. comm. ODFW research biologist stationed at the Corvallis field office. His comments arethose made during the preparation of the Marys River Watershed assessment in 1998. They arecited here as they are still relevant.]
Ketcheson G and HA Froehlich. 1978. Hydrologic factors and environmental impacts of mass soilmovements in the Oregon Coast Range. Water Resources Research Institute. Report number56. Oregon State University. Corvallis, Oregon

Rickreall Watershed Assessment: Bibliography 128
Long CJ, C Whitlock, PJ Bartlein, and SH Millspaugh. 1998. A 9000-year fire history from the OregonCoast Range, based on a high-resolution charcoal study. Canadian J. of Forest Research.28:774-787.
Lowery B, MJ Pronold, JA Vomocil. 1980. Relative changes in infiltration. Special Report 690.Agricultural Experiment Station, Oregon State University, Corvallis. OSU VALLEY S105 E55.690
Lowery B, GF Kling, and JA Vomocil. 1982. Overland flow from sloping land: effects of perched watertables and subsurface drains. Soil Sci. Soc
Mamoyac S. pers. comm. ODFW district fisheries biologist, Corvallis, OR.
Marion County SWCD. 1982. Mid-Willamette Valley foothills erosion study. Final Report. OSU VALLEYS 624.07 M521.
Marsh R. pers. comm. Local historian. Polk County Historical Society.
Markle D, T Pearsons, D Bills. 1991. Natural history of Oregonichthys (Pices: Cyprinidae) with adescription of a new species from the Umpqua River of Oregon: Copeia 1991, v. 2, p. 277-293.[Relates to the Oregon Chub (Oregonichthys crameri).]
Martel Laboratories, Inc. 1980 Geology of the Salem Oregon Quadrangle Scale 1:250,000. MartelLaboratories Inc. , 1025 Cromwell Bridge Road, Baltimore Maryland 21204, prepared for UnitedStates Department of Energy. Available at Map Room-Valley Library, Oregon State University,Corvallis, Oregon.
Miles TR, J Burt, K Hale, J Lofton. 1989. Emergency watershed protection using straw bales. Paperprepared for presentation at 20th Annual International Erosion Control Association Conference.February 16 and 17, 1989, Vancouver, BC. Paper on file at Rickreall Watershed Council.[Description of Rockhouse Creek Fire, the erosion potential, description of the emergency projectorganization, grass seeding, straw bale sediment dams, rock structure, tree planting andsurvival, benefits and conclusions. The public cost of the project was $70,000 not includingODFW contributed shrubs and legume seed, nor 500 man hours for City of Dallas. This wascredited with a 25 percent reduction in sediment reaching the reservoir and an estimated savingsof over $200,000 to dredge approximately 25-acre feet of sediment from the reservoir.]
Minor and Toepel 1991. Unpublished report contracted by the Country Fair, Veneta. [Full cite notavailable. The report should be readily available through OSU or UO. Minor and Toeppel havedone a number of reports for BLM (Yaquina Head) and are based in Eugene--may be affiliatedwith UO.]
Moore KM, KK Jones, and JM Dambacher. 1997. Methods for Stream Habitat Surveys. InformationReport 97-4. Portland. Oregon Department of Fish & Wildlife.
Nelson G. pers. comm. Department of Water Resources, Council Technical Advisor, and watershedresident. [Spoke with Nelson during a phone conversation. Nelson also reviewed two draftversions of this document and provided many helpful comments.]
Nicholas J. 1978. A review of literature and unpublished information on cutthroat trout (Salmo clarkiclarki) of the Willamette watershed. Information Report Series, Fisheries No. 78-1. OregonDepartment of Fish and Wildlife, Portland, OR.
ODFW. 1997. ODFW Aquatic Inventories Project Stream Habitat Distribution Coverages. NaturalProduction Section. Corvallis. Oregon Department of Fish & Wildlife.
Oman J. 1994. Geologic groups (lithology and age). GIS Layer – grouping of P-types in Oregon Geologymap, Arc Info coverage obtained from Corvallis Forestry Sciences Laboratory.
Oregon Administrative Rules. OAR 660-033-(8)a. [High Value Farmland Defined]
Oregon Department of Environmental Quality Water Quality Division. 1992. Oregon Wellhead ProtectionProgram, Public Advisory Plan. 1992. [The Wellhead Protection Program is required by theFederal Safe Drinking Water Act to: specify duties of state and local agencies and public water
Rickreall Watershed Assessment: Bibliography 129
suppliers; determine the extent of wellhead protection areas (WHPA); Identify all sources ofcontamination in each WHPA; develop a contaminant source management program;, providecontingency plans to obtain alternate drinking water supplies for each public water system incontamination occurs; plan new well fields to consider potential contaminant sources during thesiting process and establish public participation. The Wellhead Protection Program in Oregon ispart of the 1989 Oregon Groundwater Act. This document provides good, if not dated,information on protecting groundwater resources. Appendix provides very good referencematerial on where to find more information on such topics as point and nonpoint sourcegroundwater index files, hazardous wastes, underground storage tanks.]
Parsons MR, JD Istock, and RB Brown. 1980. Storm runoff and sediment transport. Pp. 74-76, inErosion, Sediment and Water Quality in the High Winter Rainfall Zone of the Northwestern UnitedStates. Special Report 602. Agricultural Experiment Station, Oregon State University, Corvallis.OSU VALLEY S105 E55. 602.
Penoyer PE , AR Niem. 1975. Geology and groundwater resource of Kings Valley area, central OregonCoast Range, Oregon. Water Resources Research Institute. No. 39[92 p: ill.]
Polk Soil and Water Conservation District. 1993. Soluble phosphorus and nitrate water sampling resultsfrom 8 streams and 2 wells in Polk County. Unpublished report on file with Rickreall WatershedCouncil.
Polk County. 1998. Chapter 128.5. AR-5 Acreage Residential-Five Acre Zone.
Polk County. 1998. Chapter 136. Exclusive Farm Use Zoning District. [Describes the purpose, definitions,authorized uses and development, nonconforming uses, prohibited uses and developmentstandards for the exclusive farm use zoning district.
Polk County. 1998. Chapter 138. Farm /Forest (FF) Zoning District.
Polk County. 1998. Chapter 177. Timber Conservation Zoning District.
Polk County. 1996. Overview of Polk County Data Layers. [Listings of GIS data available from thecounty including: Cadastre Library; Planimetric Features; and Derived features.]
Polk County. 1999. Polk county Public Information Program. Session #1-Comprehensive PlanningBasics, March 15, 1999. [Describes the comprehensive plan and how it functions, relation tozoning ordinance, landuse actions, procedures for hearings notice and appeals, and an overviewof the Polk county Planning Division.]
Polk County. 1999. Polk county Public Information Program. Session #2-Technical Features of theOregon Planning Program, April 19, 1999. [Describes Oregon's Statewide Planning Program,Statewide Planning Goals and implementation, statutes and administrative rules and review, andkey features of the Oregon program including urban growth boundaries, periodic review, goalexceptions, urban, rural, and urbanizable land etc.]
Polk County Itemizer-Observer. November 11 and 18, 1987. News accounts of the Rockhouse CreekFire erosion control efforts. [Story with photos of helicopters seeding burned slopes and crewsplacing large straw bales
Prout JM 1989. Dallas Watershed burn-- soil movement observations. File of Rockhouse Creek Fire,Ken Hale, Natural Resource Conservation Service. [A one page table report of soil erosion fromsix plots showing seeding treatment, soil loss, duration, season, slope grade, slope length,estimated ground cover. Soil movement was greatest from control ( not seeded plots 83 tons peracre in the 13 months following the fire. By comparison, the seeded plots lost approximately 30tons per acre in the first year and a half.]
Reckendorf F and R Parsons. 1966. Soil Development Over a Hearth In Willamette Valley, Oregon," IN:Northwest Science, Vol. 40: 46-55.
Rinella FA and ML Janet. Seasonal and Spatial Variability of Nutrients and Pesticides in Streams of theWillamette Basin, Oregon, 1993-95. U.S. Department of the Interior and U.S. Geological Survey.Water Resources Investigations Report 97-4082-C. Portland, Oregon. 54 p. OSU Valley Library

Rickreall Watershed Assessment: Bibliography 130
TD 223.A343 no 97-4082-c [Nutrient and pesticides in surface waters. Sampling was conductedin watersheds adjacent to the Watershed. It included mainly sites in the Willamette Basin, highand low flows, urban, forested, agriculture and mixed land uses. Pesticide use data is provided.]
Scheerer P, T Cornwell, K Jones. 1998. Oregon Chub Investigations. Annual Progress Report / FishResearch Project Oregon, Oregon Dept. of Fish and Wildlife, Portland, OR. [Also spoke withScheerer about the Oregon Chub during the preparation of the Marys River Watershedassessment in 1998.]
Scott L. 1923. John Work’s Journey from Fort Vancouver to Umpqua River, and Return, in 1834.Oregon Historical Society Quarterly. Vol. 24, No. 3: 238-268.
Shea D. 1998. Video recording of water supply talk given to Rickreall Watershed Council in 1998. Videoon file with Rickreall Watershed Council.
Shulters, MV. 1974. Lakes of Oregon. Volume 2: Benton, Lincoln, and Polk Counties. Open file report.USDI Geological Survey and Water Resources Division, Salem, Oregon. [One page descriptionsof physical, chemical, and bathymetric data of lakes including Mercer Reservoir, Morgan BrothersReservoir, Marx Brothers Reservoir, and Humbug Lake in the Rickreall Watershed.]
Smith, RE. 1964. A preliminary comprehensive plan for Polk County, Oregon. Mid Willamette ValleyPlanning Council, Salem.
Storm R. 1941. Effect of the white man’s settlement on wild animals in the Marys River Valley. MSThesis, Oregon State College, Corvallis, OR. [Review of historical journal and narratives ofhistorical wildlife abundance in Benton County, OSU Library LD4330 1941 84 cop. 2]
Sullivan TJ, RB Raymond, JA Bernert, M Gallagher, and JM Eilers. 1994. Watershed planning in PolkCounty; Final Report for Polk County, City of Dallas, and Polk Soil and Water ConservationDistrict. Prepared by E & S Environmental Chemistry, Inc. Corvallis, OR. [Listing of dataavailable for watershed planning.]
Surfleet CG. 1997. Precipitation characteristics for landslide hazard assessment for the Central OregonCoast Range. M.S. Thesis. Oregon State University, Corvallis, OR.
Swanson FJ, MM Swanson, C Woods.1977. Inventory of mass erosion in the Mapleton Ranger District,Siuslaw National Forest. Final Report, Forest Sciences Laboratory, Corvallis, Oregon.
Taskey R, 1978. Relationships of clay mineralogy to landscape stability in Western Oregon. PhDDisertation, Oregon State University, Corvallis, OR. [Recommended by draft 1 reviewer but notreviewed here. See also Istok and Harward, 1982.]
Tetra Tech, Inc. 1993. Willamette River Basin Water Quality Study. Component 8: Willamette River BasinNonpoint Source Pollution Component Report. TC8983-08. Final Report. Tetra Tech, Inc. 15400NE 90th , Suite 100 Redmond, Washington 98052-3521. Oregon Department of EnvironmentalQuality.
Tetra Tech Inc. 1995. Willamette River Basin Water Quality Study. A Summary of Recent ScientificReports on the Willamette River. Tetra Tech, Inc. 15400 NE 90th , Suite 100 Redmond,Washington 98052-3521. [Submitted to ODEQ. DEQ Contract No. 97-094. parameters;biological responses to stressors, point sources, nonpoint sources, and ecological systemsinvestigations.]
Vaughn W. c.1890. Early Settlement of Tillamook County. [Unpublished journal entries and memoirstypewritten in 1923, available through the Tillamook Historical Society, Tillamook, Oregon: 83pp..]
Viessman W, Jr, JW Knapp, GL Lewis, TE Harbaugh. 1972. Introduction to hydrology. 2nd Ed. Harperand Row Publishers. New York.
White C. 1998. Video recording of agricultural water use talk given to Rickreall Watershed Council in1998. Video on file with Rickreall Watershed Council. [Claude White is also a farmer in the lower
Rickreall Watershed Assessment: Bibliography 131
Rickreall watershed. The assessment team had an opportunity to meet with White during the firstwatershed tour.]
Wilkes C. 1845. Narrative of the United States Exploring Expedition During the Years 1838, 1839, 1840,1841, 1842. (Vol. V). Lea & Blanchard, Philadelphia, Pennsylvania.
Willamette / North Coast PIEC. 2000. Bureau of Land Management, Salem Office GIS data. ContactRyan Dalton, BLM Salem, 1717 Fabry Rd, Salem OR. 503-375-5716.
Willamette Valley Project. 1936. Willamette Valley Project: A regional Plan. Oregon State PlanningBoard, Salem, Oregon.
Water Resources Department. 1992. Willamette Basin. Report prepared by the Water ResourcesDepartment, Salem, OR
Watershed Professionals Network. 1999. Oregon Watershed Assessment Manual. June 1999.Prepared for the Governors Wateshed Enhancement Board, Salem, Oregon.
Wevers M, D Nemeth, J Haxton, S Mamoyac. 1992. Coast Range Subbasin Fish Management Plan.Oregon Department of Fish and Wildlife, Northwest Region, Corvallis, OR.
Zenk H. 1976. Contributions to Tualatin ethnography: subsistence and ethnobiology. Masters Thesis,Portland State University. [cited in Boyd 1986].

Rickreall Watershed Assessment: Appendix 3-1 Clean Water Act 132
APPENDIX 3-1: Clean Water Act and Other Regulations
Clean Water Act BackgroundIn 1972, Congress enacted the first comprehensive national clean water legislation inresponse to growing public health concern for serious and widespread water pollution.The Clean Water Act (CWA) is the primary federal law that protects the health of ournation’s waters, including lakes, rivers and coastal areas. Like most other federalenvironmental laws, CWA enforcement is shared by the U.S. Environmental ProtectionAgency (EPA) and the states, with states having primary responsibility. In Oregon thestate agency with the primary responsibility is the Oregon Department of EnvironmentalQuality (DEQ).
Over the last 25 years, the quality of rivers, lakes and bays nationally has improveddramatically as a result of the cooperative efforts by federal, state and localgovernments and communities to implement the public health and pollution controlprograms established by the Clean Water Act. The Clean Water Act has twofundamental national goals: 1) to eliminate the discharge of pollutants into the nation’swaters, and 2) to achieve water quality levels that are “fishable and swimmable”.
To achieve its objectives, the CWA provides that all discharges into the nation’s riversare unlawful, unless specifically authorized by a permit. Thus, industrial and municipaldischargers must obtain permits from EPA under the Act’s National Pollutant DischargeElimination System (NPDES) program (authorized in section 402 of the Act). A NPDESpermit requires the discharger (source) to attain technology-based effluent limits.Permits specify the control technology applicable to each pollutant, the effluentlimitations a discharger must meet, and the deadline for compliance. Sources arerequired to maintain records and to carry out effluent monitoring activities. Permits areissued for 5-year periods and must be renewed thereafter to allow continued discharge.For more general background on the provisions of the Clean Water Act see CRS IssueBrief for Congress (1999).
The Clean Water Act of 1972 was intended to clean up our rivers, streams andgroundwater and to protect the multitude of benefical uses of our nation waters. TheAct has used technology-based limits to clean up point source discharges. Pointsources have been controlled through permit oversight, which have worked to ensurethat industries and municipalities have not exceeded standards. Over the years therehas been a shift from the major point sources that were addressed first to an increasingemphasis on nonpoint source pollution. Nonpoint sources are addressed primarilythrough the voluntary implementation of Best Management Practices (BMP’s) by cities,farmers, forest industries and individual citizens.
The Clean Water Act has resulted in considerable progress in cleaning up point sourcewater pollution. Currently, the number one source of pollution affecting U.S. waterwaysis nonpoint source, or runoff pollution. Examples of common nonpoint source pollutantsinclude:sediment;pesticides and nutrients running off farm fields, forest lands and urbanlawns;oil, grease, heavy metals, and other toxic materials carried from streets highways,rooftops and parking lots into storm sewers;farm animal waste from barnyards and petwaste from urban areas; andsoil washed away from logging and construction sites.

Rickreall Watershed Assessment: Appendix 3-1 Clean Water Act 133
Nonpoint sources of pollution are not subject to CWA permits or other regulatoryrequirements under federal law. They are covered by state programs for themanagement of runoff under section 319 of the Clean Water Act. Both point andnonpoint sources of water pollution can impact the “beneficial uses” of waterbodies, asdescribed in the next section.
Regulatory Management ToolsThe Clean Water Act activates a variety of tools for regulatory oversight of waterbodies.These include:
303(d) list,
Total Maximum Daily Loads (TMDL),
National pollution Discharge Elimination System (NPDES) permits,
Best Management Practices (BMP's) to address nonpoint source pollution.
The state of Oregon uses other tools to address water quality and to complementFederal tools including:
Senate Bill 1010,
Oregon Forest Practices Act and the
Oregon Groundwater Act.
Major Legislation Relating to Groundwater Protection
FederalSafe Drinking Water Act (SDWA)
Provides a system of national standards and treatment technologies for public drinkingwater.
Clean Water Act (CWA) Sec. 106 Groundwater Protection Strategy—40 CFR, Part 130
Provides planning funds to assist state in developing a comprehensive groundwaterprotection program.

Rickreall Watershed Assessment: Appendix 3-1 Clean Water Act 134
Resource Conservation and Hazardous Waste Recovery Act (RCRA)
Regulates nonhazardous waste facilities such as municipal landfills.
Regulates hazardous material generated from industrial waste, which can contaminate groundwater.
Provides for the regulation of underground storage tanks (UST).
Comprehensive Environmental Response, Compensation and Liability Act (CERCLA)
Superfund Program
StateOregon Groundwater Act (1989)
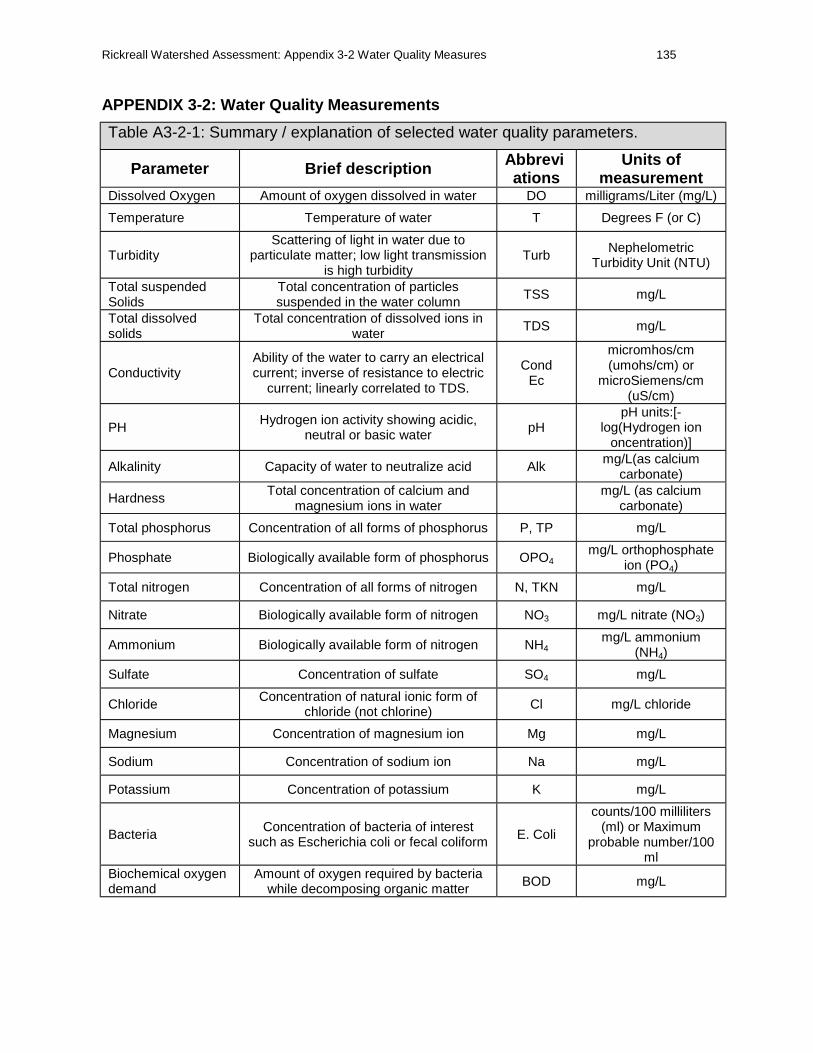
Rickreall Watershed Assessment: Appendix 3-2 Water Quality Measures 135
APPENDIX 3-2: Water Quality Measurements
Table A3-2-1: Summary / explanation of selected water quality parameters.
Parameter Brief description Abbreviations
Units ofmeasurement
Dissolved Oxygen Amount of oxygen dissolved in water DO milligrams/Liter (mg/L)
Temperature Temperature of water T Degrees F (or C)
TurbidityScattering of light in water due to
particulate matter; low light transmissionis high turbidity
TurbNephelometric
Turbidity Unit (NTU)
Total suspendedSolids
Total concentration of particlessuspended in the water column
TSS mg/L
Total dissolvedsolids
Total concentration of dissolved ions inwater
TDS mg/L
ConductivityAbility of the water to carry an electricalcurrent; inverse of resistance to electric
current; linearly correlated to TDS.
CondEc
micromhos/cm(umohs/cm) or
microSiemens/cm(uS/cm)
PHHydrogen ion activity showing acidic,
neutral or basic water pHpH units:[-
log(Hydrogen iononcentration)]
Alkalinity Capacity of water to neutralize acid Alkmg/L(as calcium
carbonate)
HardnessTotal concentration of calcium and
magnesium ions in watermg/L (as calcium
carbonate)
Total phosphorus Concentration of all forms of phosphorus P, TP mg/L
Phosphate Biologically available form of phosphorus OPO4mg/L orthophosphate
ion (PO4)
Total nitrogen Concentration of all forms of nitrogen N, TKN mg/L
Nitrate Biologically available form of nitrogen NO3 mg/L nitrate (NO3)
Ammonium Biologically available form of nitrogen NH4mg/L ammonium
(NH4)
Sulfate Concentration of sulfate SO4 mg/L
ChlorideConcentration of natural ionic form of
chloride (not chlorine) Cl mg/L chloride
Magnesium Concentration of magnesium ion Mg mg/L
Sodium Concentration of sodium ion Na mg/L
Potassium Concentration of potassium K mg/L
BacteriaConcentration of bacteria of interest
such as Escherichia coli or fecal coliform E. Coli
counts/100 milliliters(ml) or Maximum
probable number/100ml
Biochemical oxygendemand
Amount of oxygen required by bacteriawhile decomposing organic matter BOD mg/L

Rickreall Watershed Assessment: Appendix 3-3 303(d) List 136
APPENDIX 3-3: Section 303(d) of the Federal Clean Water Act
The 1972 Federal Clean Water Act in Section 303(d) requires each state todevelop a list of waters that do not meet state standards for water quality. Thelist provides a way to identify problems and develop and implement plans toprotect beneficial uses while achieving federal and state water quality standards.
The list identifies areas of water quality problems, but does not specify thecauses of those problems. Water quality problems that are considered includeparameters such as nutrients, bacteria, toxic contaminants, turbidity andtemperature. For these waters that do not meet standards, states are required toestablish TMDL’s, which are discussed in a later in this chapter.
The Oregon Department of Environmental Quality (DEQ) determines whichwaters should be placed on the 303(d) list using existing scientific data and bestprofessional judgment. DEQ first presents a draft list for public comment. Aftercomments are reviewed and considered, a final list is developed and sent to U.S.Environmental Protection Agency (EPA) for approval. The final list isaccompanied by a list of priorities that target resources for correcting waterquality problems. DEQ must submit an updated list to the EnvironmentalProtection Agency (EPA) every two years.
A stream, river, lake or estuary may be removed from the list if there is evidencethat: 1) it is meeting water quality standards; 2) it is violating water qualitystandards due only to natural conditions (meaning that there is no human-causedinfluence); 3) its Total Maximum Daily Load (TMDL) has been approved; or 4) itwas placed on the list in error. (ODEQ,http://waterquality.deq.state.or.us/wq/303dlist/303dfactsheet.htm).
For example, the State Standard sets the temperature at 64°F statewide unlessthere is habitat for cold-water fish spawning or bull trout, which require standardsof 55°F and 50°F, respectively. If a stream or river violates temperaturestandards, DEQ would require that responsible parties or management agenciesdevelop a water temperature management plan to address the problem. Iftemperatures still do not meet water quality standards after an approvedtemperature management plan has been implemented and if DEQ determinesthat all feasible steps have been taken to address the problem, then thetemperature actually attained will become the standard for that water.

Rickreall Watershed Assessment: Appendix 3-4 TMDLs 137
APPENDIX 3-4: TMDLs, Storm Water
Total Maximum Daily Loads (TMDL’s)The EPA requires state’s to develop TMDL’s for waters that do not meetstandards for water quality. A TMDL is a strategy for bringing a waterbody backinto compliance with water quality standards—for improving water quality to thepoint where recognized beneficial uses of water are fully supported. A full TMDLdevelopment process determines the pollutants or stressors causing waterquality impairments, identifies maximum permissible loading capacities for thewaterbody in question, and then, for each relevant pollutant, assigns loadallocations (Total Maximum Daily Loads) to each of the different sources, pointand nonpoint, in the watershed.
TMDL Planning and Management in the Rickreall Creek WatershedRickreall Creek was removed from the 303(d) list in 1994 for the dissolvedoxygen parameter, after a TMDL after USEPA approved a TMDL for biologicaloxygen demand (BOD) in 1994(http://waterquality.deq.state.or.us/wq/TMDLs/approvedTMDLs.htm).
At the time of development of this TMDL, nonpoint sources were not beingconjunctively addressed with point sources via the TMDL process. More recentmodifications to the TMDL process have resulted in a point source—nonpointsource approach that is on schedule to be undertaken in the Rickreall CreekWatershed in the year 2003. (DEQ Personal Communication, Mark Hamlin,2000) See below for a timeline of events regarding TMDL planning in theRickreall Creek watershed. (DEQ, 1997)
Storm Water ProgramEPA issued Phase I of the Municipal Stormwater Permit Program in 1990. Thisprogram targets stormwater discharge from medium and large municipal stormsewer systems as well as stormwater discharges from industrial activities,including discharges from construction activities disturbing five acres or more.Phase I of the Municipal Stormwater Permit Program (MSPP), (not to beconfused with previously discussed Phase I of the WWTP facility plan) requiresthat all owners/operators of small municipal storm sewer systems reducedischarge of pollutants from a regulated system to the “maximum extentpracticable” to protect water quality. (Federal Register Vol. 63, No 6, p.1574)
Phase II-MSPP addresses stormwater discharges from activities exempt underPhase I:
construction activities disturbing less than five acres
light industrial activities
“donut holes”—small municipal storm sewer systems located in a largercommunity regulated under Phase I.

Rickreall Watershed Assessment: Appendix 3-4 TMDLs 138
Phase II -MSPP Addresses stormwater discharges from:
small municipal storm sewer systems in urbanized areas (serving a population ofless than 100,000)
construction activities that disturb between one and five acres
By 2005, the City of Dallas is to have addressed stormwater management issuesand developed a management plan for urban nonpoint sources associated withthe urban area of Dallas (DEQ, 2000). At that time, the City of Dallas will need toensure that it has regulations or ordinances in place that satisfy the proposedPhase II minimum control measures for:
construction site stormwater runoff
post-construction stormwater management in new development andredevelopment
illicit discharge detection and elimination
pollution prevention/good housekeeping for municipal operations
(American Public Works Association, 1999)

Rickreall Watershed Assessment: Appendix 3-5 Standards 139
APPENDIX 3-5: Description of Water Quality Standards
Bacteria (Esherichia coli) or Water Contact Recreation (Fecal Coliform)BENEFICIAL USES AFFECTED: Water Contact Recreation
STANDARDS or CRITERIA: OAR 340-41-(basin)(2)(e and
Standards applicable to all basins:
(e) Bacteria standards:
(A) Numeric criteria: Organisms of the coliform group commonly associated with fecalsources (MPN or equivalent membrane filtration using a representative number ofsamples) shall not exceed the criteria described in subparagraphs (i):
(i) Freshwaters and Estuarine Waters other than shellfish growing waters:
(I) A 30-day log mean of 126 E. coli organisms per 100 ml, based on a minimum of five(5) samples;
(II) No single sample shall exceed 406 E. coli organisms per 100 ml;
(f) Bacterial pollution or other conditions deleterious to waters used for domesticpurposes, livestock watering, irrigation, bathing or shellfish propagation, or otherwiseinjurious to public health shall not be allowed.
Freshwaters and Estuarine Waters other than shellfish growing waters: A log mean of200 fecal coliform per 100 milliliters based on a minimum of five samples in a 30 dayperiod with no more than ten percent of the samples in the 30 day period exceeding 400per 100 ml].
WATER QUALITY LIMITED CRITERIA: A 30-day log mean of 126 E coli organisms per100 ml or more than 10% of the and a minimum of at least two exceedences exceedsamples exceed 406 E coli organisms per 100 ml or, if E coli data are not available, thegeometric mean of fecal coliform bacteria exceeds 200 per 100 milliliters or more than10 percent of the samples and a minimum of at least two exceedences exceed 400 per100 milliliters for the season of interest;
TIME PERIOD:
Summer: June 1 through September 30 (period of highest use for water contactrecreation);
Fall-Winter-Spring (FWS): October 1 to May 31
ConductivityStandard: There is no standard for conductivity but it can be used to interpret waterquality information.
Conductivity or specific conductance is a measure of water's ability to conduct anelectrical current, and it depends on temperature and concentrations of dissolvedsubstances such as salts. Surface waters in the Willamette Valley and Coast Range are

Rickreall Watershed Assessment: Appendix 3-5 Standards 140
typically 150 mhos /cm or less. Domestic and industrial wastewater, storm water,irrigation return water and other agricultural runoff can have higher conductivity thereceiving stream. Ground water base flow can typically has higher conductivity than thecreek. (WQMTGB, 1999)
CopperStandard: For freshwater organisms, EPA has established an acute copperconcentration of 18 ug/L and 12 ug/L as a chronic concentration (EPA, 1986)
Dissolved OxygenBENEFICIAL USES AFFECTED: Resident Fish and Aquatic Life, Salmonid Spawning &Rearing
STANDARDS or CRITERIA: OAR 340-41-(basin)(2)(a)
Dissolved Oxygen concentration shall not be less than the following:
Standards applicable to all basins (adopted 1/11/96, effective 7/1/96)
During times and in waters that support salmonid spawning until fry emergence from thegravels:
Dissolved Oxygen shall not be less than 11 mg/l; unless intergravel dissolved oxygen isgreater than 8.0 mg/l (as a spatial median minimum), then DO criteria is 9.0; or
where conditions of barometric pressure, altitude and naturally occurring temperaturespreclude attainment of the 11 or 9 mg/l standard, then dissolved oxygen levels shall notbe less than 95% saturation.
Spatial median minimum intergravel dissolved oxygen concentration shall not fall below6.0 mg/l.
For waters identified as providing cold-water aquatic resources, the dissolved oxygenshall not fall below 8.0 mg/l (unless it is diurnal monitoring data that can be used toestimate the 7-day minimum, then the minimum shall not fall below 6.5) or whereconditions of barometric pressure, altitude and naturally occurring temperaturespreclude attainment of the 8.0 mg/l standard, then dissolved oxygen levels shall not beless than 90% saturation.
For waters identified as providing cool-water aquatic resources, the dissolved oxygenshall not be less than 6.5 mg/l.
For waters identified as providing warm-water aquatic resources, the dissolved oxygenshall not be less than 5.5 mg/l.
WATER QUALITY LIMITED CRITERIA: Greater than 10 percent of the samples exceedthe appropriate standard and a minimum of at least two exceedences of the standardfor a season of interest.
TIME PERIOD:
Rearing: as identified by ODFW Staff; Spawning through fry emergence: as identified byODFW Staff

Rickreall Watershed Assessment: Appendix 3-5 Standards 141
Flow ModificationBENEFICIAL USES AFFECTED: Resident Fish & Aquatic Life, Salmonid FishSpawning & Rearing
STANDARDS or CRITERIA: OAR 340-41-(basin)(2)(i)
The creation of tastes or odors or toxic or other conditions that are deleterious to fish orother aquatic life or affect the potability of drinking water or the palatability of fish orshellfish shall not be allowed.
-or-
OAR 340-41-027
Standards applicable to all basins:
Waters of the state shall be of sufficient quality to support aquatic species withoutdetrimental changes in the resident biological communities.
WATER QUALITY LIMITED CRITERIA: Documented flow conditions that are asignificant limitation to fish or other aquatic life as indicated by the following information:
Beneficial uses are impaired. This documentation can consist of data on aquaticcommunity status that show aquatic communities (primarily macroinvertebrates) whichare 60% or less of the expected reference community for both multimetric scores andmultivariate model scores are considered impaired. Streams with either multimetricscores or multivariate scores between 61% and 75% of expected referencecommunities are considered as streams of concern. Streams greater than 75% ofexpected reference communities using either multimetric or multivariate models areconsidered unimpaired. -or-
Where monitoring methods determined a Biotic Condition Index, Index of BioticIntegrity, or similar metric rating of poor or a significant departure from referenceconditions utilizing a suggested EPA biomonitoring protocol or other techniqueacceptable to DEQ. -or-
Fishery data on escapement, redd counts, population survey, etc. that show fishspecies have declined due to water quality conditions; and an established or applied forInstream Water Right, and documentation that flows are not frequently being met suchas through statistical summaries of stream flow based on actual flow measurements,and identification of human contribution to the reduction of instream flows belowacceptable level indicated (e.g. evidence of water rights and diversions above or in thesegment.
TIME PERIOD:
Annual
Macroinvertebrate Life (Biological Criteria)BENEFICIAL USES AFFECTED: Resident Fish and Aquatic Life
STANDARDS or CRITERIA: OAR 340-41-027
Standards applicable to all basins:

Rickreall Watershed Assessment: Appendix 3-5 Standards 142
Waters of the state shall be of sufficient quality to support aquatic species withoutdetrimental changes in the resident biological communities.
"Aquatic species" means any plants or animals which live at least part of their life cyclein waters of the State.
"Biological Criteria": means numerical values or narrative expressions that describe thebiological integrity of aquatic communities inhabiting waters of a given designatedaquatic life use.
"Resident Biological Community" means aquatic life expected to exist in a particularhabitat where water quality standards for a specific ecoregion, basin, or water body aremet. This shall be established by accepted biomonitoring techniques.
"Without Detrimental Changes in the Resident Biological Community" means no loss ofecological integrity when compared to natural conditions at an appropriate referencesite or region.
"Ecological Integrity" means the summation of chemical, physical and biological integritycapable of supporting and maintaining a balanced, integrated, adaptive community oforganisms having a species composition, diversity, and functional organizationcomparable to that of the natural habitat of the region.
"Appropriate Reference Site or Region" means a site on the same water body, or withinthe same basin or ecoregion that has similar habitat conditions, and represents thewater quality and biological community attainable within the areas of concern.
WATER QUALITY LIMITED CRITERIA1: Aquatic communities (primarilymacroinvertebrates) which are 60% or less of the expected reference community forboth multimetric scores and multivariate model scores are considered impaired.Streams with either multimetric scores or multivariate scores between 61% and 75% ofexpected reference communities are considered as streams of concern. Streamsgreater than 75% of expected reference communities using either multimetric ormultivariate models are considered unimpaired. -or-
Where monitoring methods determined a Biotic Condition Index, Index of BioticIntegrity, or similar metric rating of poor or a significant departure from referenceconditions utilizing a suggested EPA biomonitoring protocol or other techniqueacceptable to DEQ.
TIME PERIOD:
Annual
NutrientsBENEFICIAL USES AFFECTED: Aesthetics or use identified under related parameters
WATER QUALITY LIMITED CRITERIA: Greater than 10 percent of the samples exceedstandard and a minimum of at least two exceedences of the standard or criteria used indraft TMDLs for a season of interest;
TIME PERIOD:

Rickreall Watershed Assessment: Appendix 3-5 Standards 143
June through September or as specified under the specific standard above
Ammonia Evaluation Indicator for Ammonia (no standard established)
Table 3-9 Critical Values for Total Ammonia Concentrations mg/l 1 Where Salmonidsare Present
Acute Criterion Chronic CriterionPH 15 C 20 C 25 C 15 C 20 C 25 C6.5 30 29 20 2.8 1.76 1.237.5 14.9 14.6 10.2 2.6 1.78 1.258.0 6.9 6.8 4.8 1.57 1.10 0.789.0 0.86 0.91 0.72 0.195 0.148 0.12
1 Values from Ambient H20 Quality Criteria
Total Nitrogen Evaluation Indicator: 0.30 mg/l (no standard established)
Nitrate Evaluation Indicator: (Drinking H20) 10 mg/l (no standard established)
Drinking water standard for nitrate is intended to protect babies from infantmethemoglobinemia (blue baby syndrome) and protect livestock such as cattle wherehigher rates of calf abortion are related to high nitrate concentrations in water.
Total Phosphorus Evaluation Indicator: 0.05 mg/l (no standard established)
The indicator value is the concentration that has been shown to lead to acceleratedeutrophication in lakes.
pHBENEFICIAL USES AFFECTED: Resident Fish & Aquatic Life, Water ContactRecreation
STANDARDS or CRITERIA: OAR 340-41-(basin)(2)(d)
Summary: pH shall not fall outside the following ranges for the waters in WillametteBasin: 6.5 to 8.5;
* when 25% of the measurements taken between June and September are greater thanpH 8.7, the Department shall determine whether the value higher than 8.7 areanthropogenic or natural in origin
WATER QUALITY LIMITED CRITERIA: Greater than 10 percent of the samples exceedstandard and a minimum of at least two exceedences of the standard for a season ofinterest;
TIME PERIOD:

Rickreall Watershed Assessment: Appendix 3-5 Standards 144
Summer: June 1 through September 30;
Fall-Winter-Spring (FWS): October 1 to May 31;
The pH of the stream water is a measure of how acidic or basic the water is. Thisparameter can affect the production and survival of fish and emergence and survival ofaquatic insects. The solubility and toxicity of certain water pollutants like heavy metalsand ammonia varies with the water pH. Excessive plant growth can alter the water pH.Photosynthesis and respiration produce slight variability in diurnal and seasonal pHvalues (WQMTGB, 1999).
SedimentationBENEFICIAL USES AFFECTED: Resident Fish & Aquatic Life, Salmonid FishSpawning & Rearing
STANDARDS or CRITERIA: OAR 340-41-(basin)(2)(j)_The formation of appreciablebottom or sludge deposits or the formation of any organic or inorganic depositsdeleterious to fish or other aquatic life or injurious to public health, recreation, orindustry shall not be allowed.
WATER QUALITY LIMITED CRITERIA: Documented that sedimentation is a significantlimitation to fish or other aquatic life as indicated by the following information:
Beneficial uses are impaired. This documentation can consist of data on aquaticcommunity status that show aquatic communities (primarily macroinvertebrates) areimpaired. -or-
Fishery data on escapement, redd counts, population survey, etc. that show fishspecies have declined due to water quality conditions; and documentation through awatershed analysis or other published report which summarizes the data and utilizesstandard protocols, criteria and benchmarks. Measurements of cobble embeddednessor percent fines are considered under sedimentation. Documentation should indicatethat there are conditions that are deleterious to fish or other aquatic life.
TIME PERIOD:
Annual
TemperatureBENEFICIAL USES AFFECTED: Resident Fish & Aquatic Life, Salmonid FishSpawning & Rearing
STANDARDS or CRITERIA: OAR 340-41-(basin)(2)(b)
Seven (7) day moving average of the daily maximum shall not exceed the followingvalues unless specifically allowed under a DEQ approved basin surface watertemperature management plan:
64° F (17.8° C);
55° F (12.8° C) during times and in waters that support salmon spawning, eggincubation and fry emergence from the egg and from the gravels;
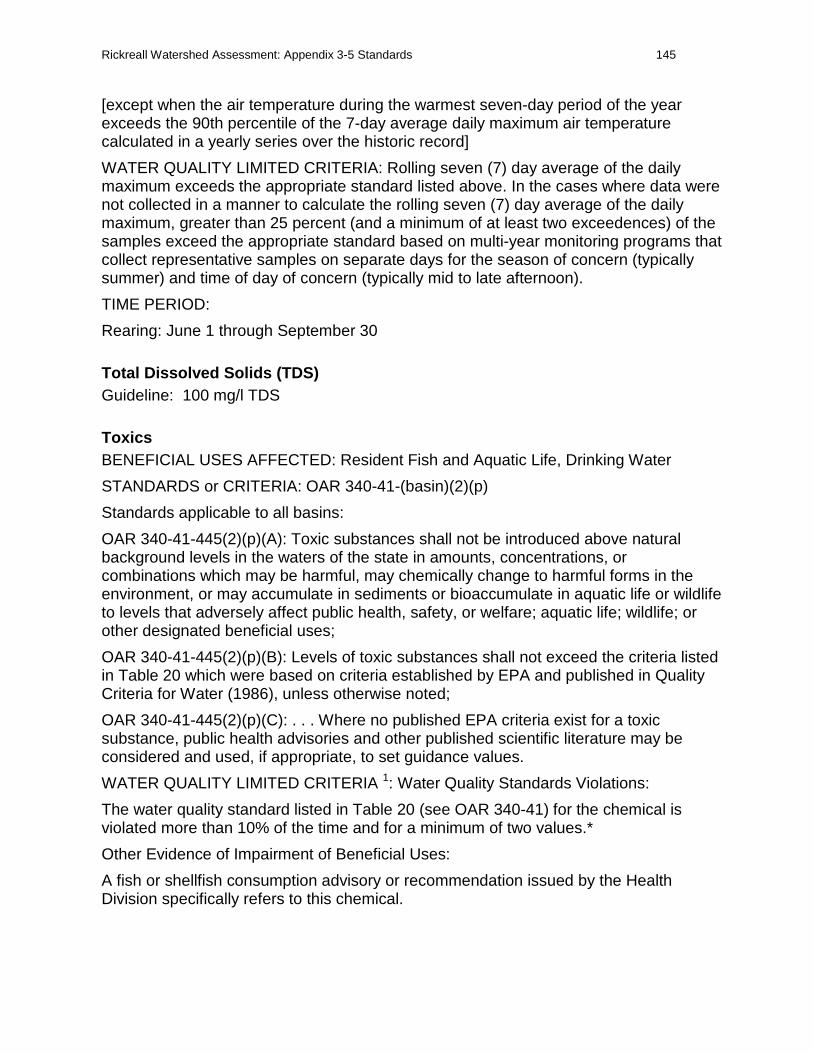
Rickreall Watershed Assessment: Appendix 3-5 Standards 145
[except when the air temperature during the warmest seven-day period of the yearexceeds the 90th percentile of the 7-day average daily maximum air temperaturecalculated in a yearly series over the historic record]
WATER QUALITY LIMITED CRITERIA: Rolling seven (7) day average of the dailymaximum exceeds the appropriate standard listed above. In the cases where data werenot collected in a manner to calculate the rolling seven (7) day average of the dailymaximum, greater than 25 percent (and a minimum of at least two exceedences) of thesamples exceed the appropriate standard based on multi-year monitoring programs thatcollect representative samples on separate days for the season of concern (typicallysummer) and time of day of concern (typically mid to late afternoon).
TIME PERIOD:
Rearing: June 1 through September 30
Total Dissolved Solids (TDS)Guideline: 100 mg/l TDS
ToxicsBENEFICIAL USES AFFECTED: Resident Fish and Aquatic Life, Drinking Water
STANDARDS or CRITERIA: OAR 340-41-(basin)(2)(p)
Standards applicable to all basins:
OAR 340-41-445(2)(p)(A): Toxic substances shall not be introduced above naturalbackground levels in the waters of the state in amounts, concentrations, orcombinations which may be harmful, may chemically change to harmful forms in theenvironment, or may accumulate in sediments or bioaccumulate in aquatic life or wildlifeto levels that adversely affect public health, safety, or welfare; aquatic life; wildlife; orother designated beneficial uses;
OAR 340-41-445(2)(p)(B): Levels of toxic substances shall not exceed the criteria listedin Table 20 which were based on criteria established by EPA and published in QualityCriteria for Water (1986), unless otherwise noted;
OAR 340-41-445(2)(p)(C): . . . Where no published EPA criteria exist for a toxicsubstance, public health advisories and other published scientific literature may beconsidered and used, if appropriate, to set guidance values.
WATER QUALITY LIMITED CRITERIA 1: Water Quality Standards Violations:
The water quality standard listed in Table 20 (see OAR 340-41) for the chemical isviolated more than 10% of the time and for a minimum of two values.*
Other Evidence of Impairment of Beneficial Uses:
A fish or shellfish consumption advisory or recommendation issued by the HealthDivision specifically refers to this chemical.

Rickreall Watershed Assessment: Appendix 3-5 Standards 146
The chemical has been found to cause a biological impairment via a field test ofsignificance such as a bioassay. The field test must involve comparison to a referencecondition.
TIME PERIOD: Annual
TurbidityBENEFICIAL USES AFFECTED: Resident Fish and Aquatic Life, Water Supply,Aesthetics
STANDARDS or CRITERIA: OAR 340-41-(basin)(2)(c)
No more than ten percent cumulative increase in natural stream turbidities shall beallowed, as measured relative to a control point immediately upstream of the turbiditycausing activities.
WATER QUALITY LIMITED CRITERIA: A systematic or persistent increase (of greaterthan 10%) in turbidity due to an operational activity that occurs on a persistent basis(e.g. dam release or irrigation return, etc).
TIME PERIOD:
Annual
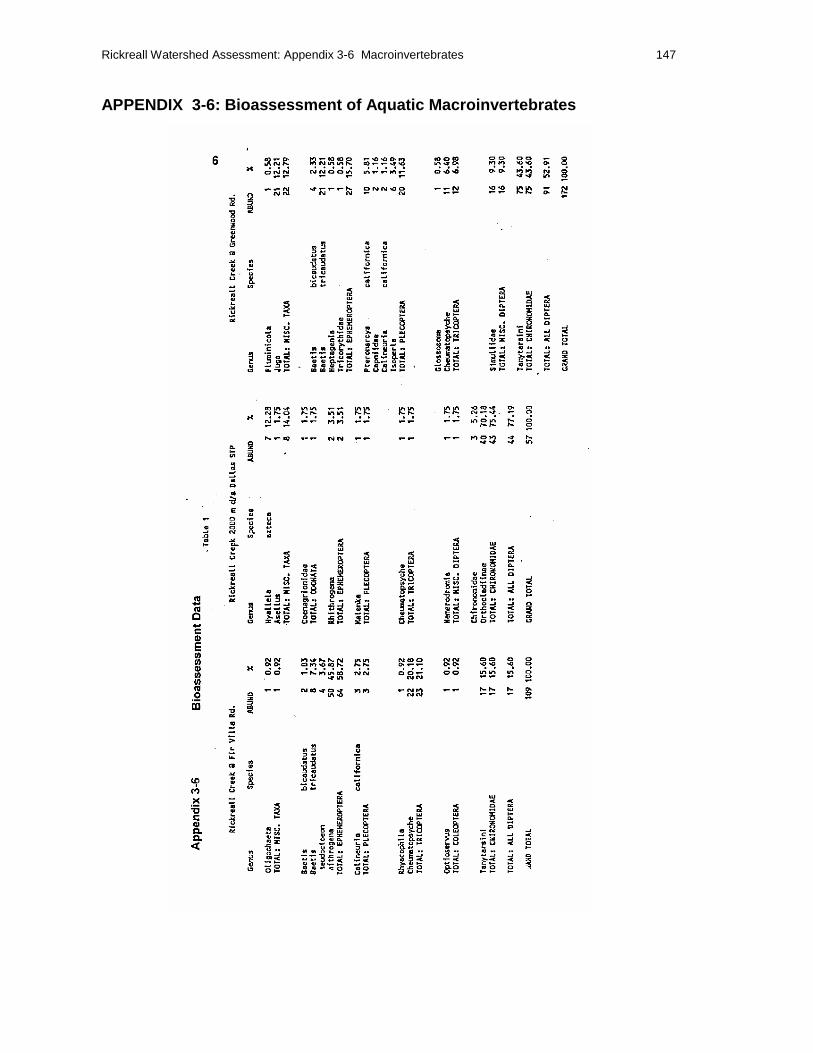
Rickreall Watershed Assessment: Appendix 3-6 Macroinvertebrates 147
APPENDIX 3-6: Bioassessment of Aquatic Macroinvertebrates

Rickreall Watershed Assessment: Appendix 3-6 Macroinvertebrates 148

Rickreall Watershed Assessment: Appendix 3-6 Macroinvertebrates 149

Rickreall Watershed Assessment: Appendix 3-7 Temperature 150

Rickreall Watershed Assessment: Appendix 5 Sensitive Species 151
APPENDIX 5: Sensitive species (other than fish) in the Willamette Valley.
The Federal rank lists species in order of perceived peril as: 1) ListedEndangered (LE), 2) Listed Threatened (LT), 3) Proposed Endangered (PE), 4)Proposed Threatened (PT), 5) Species of Concern (SoC), and 6) Candidates forlisting (C). Eight species in Table A5-1 are either Listed Endangered or ListedThreatened. The bald eagle is being considered for removal from the federalthreatened list, and the gray wolf probably has been extirpated from thewatershed. The six remaining federally listed species include:peregrine falconand Kincaid’s lupine, Northern spotted owl, marbled murrelet, Aleutian goose,and dotted water-flax seed. Two species are proposed for federal endangeredlisting: Fender’s blue butterfly and Willamette daisy, while one is proposed for athreatened listing: three-colored monkey flower.
The state system is similar to the federal system in regards to threatened andendangered ranks, but replaces “Candidates” and “Species of Concern” with four“Sensitive Species” rankings. These include “Critical” (SC), for species withlisting pending; “Vulnerable” (SV), for species where listing is not thought to beimminent and may be avoided with action; “Peripheral” (SP), for species that arenaturally rare or whose Oregon populations are on the edge of their ranges; and“Undetermined” (SU), for species whose status is unclear from lack ofinformation. The state Endangered Species Act is more limited in scope than thefederal ESA and only actively applies to lands owned or managed by the state.Criteria for state listing of a species extends to populations that are 1) activelyundergoing or are in imminent danger of habitat deterioration, 2) being over-utilized or where over-utilization is likely to occur, or 3) not being protectedadequately by existing programs. “Sensitive” status is given to any species thatmight qualify as “Endangered” or “Threatened” in the future. Other speciesincluded in the tables with no federal or state status are listed by another groupand generally indicate species that may be f concern or about which not enoughinformation is known.
Table A5-1: Sensitive species that potentially occur or formerly occurred in the Rickreall CreekWatershed (Oregon Natural Heritage Program).Status abbreviations: LE = Fed. Listed Endangered, PE = Fed. Proposed Endangered, LT =Fed. Listed Threatened, PT = Fed. Proposed Threatened, C = Fed. Candidate Species, SoC =Fed. Species of Concern, SC = State Sensitive Critical, SV = State Sensitive Vulnerable, SP =State Sensitive Peripheral, SU = State Sensitive, Undetermined status. Those species with nolisted status are proposed by Oregon Natural Heritage Program or the Nature Conservancy asspecies that merit attention.
Common name Scientific name Fed. status State status
REPTILESNorthwestern pond turtle Clemmys marmorata marmorata SoC SCpainted turtle Chrysemys picta - SCsharptail snake Contia tenuis - SVAMPHIBIANSOregon spotted frog Rana pretiosa C SCsouthern seep salamander Rhyacotriton variegates SoC SVtailed frog Ascaphus truei SoC SVNorthern red-legged frog Rana aurora aurora SoC SV/SUClouded salamander Aneides ferreus - SV
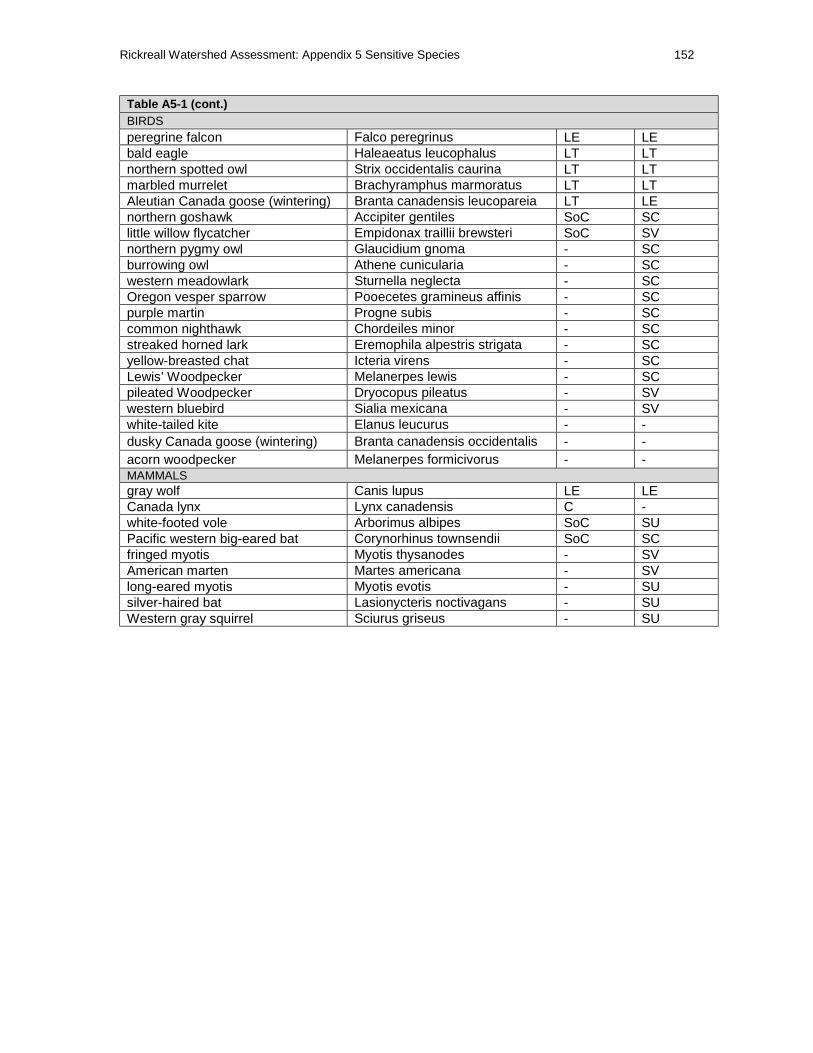
Rickreall Watershed Assessment: Appendix 5 Sensitive Species 152
Table A5-1 (cont.)BIRDSperegrine falcon Falco peregrinus LE LEbald eagle Haleaeatus leucophalus LT LTnorthern spotted owl Strix occidentalis caurina LT LTmarbled murrelet Brachyramphus marmoratus LT LTAleutian Canada goose (wintering) Branta canadensis leucopareia LT LEnorthern goshawk Accipiter gentiles SoC SClittle willow flycatcher Empidonax traillii brewsteri SoC SVnorthern pygmy owl Glaucidium gnoma - SCburrowing owl Athene cunicularia - SCwestern meadowlark Sturnella neglecta - SCOregon vesper sparrow Pooecetes gramineus affinis - SCpurple martin Progne subis - SCcommon nighthawk Chordeiles minor - SCstreaked horned lark Eremophila alpestris strigata - SCyellow-breasted chat Icteria virens - SCLewis’ Woodpecker Melanerpes lewis - SCpileated Woodpecker Dryocopus pileatus - SVwestern bluebird Sialia mexicana - SVwhite-tailed kite Elanus leucurus - -dusky Canada goose (wintering) Branta canadensis occidentalis - -acorn woodpecker Melanerpes formicivorus - -MAMMALSgray wolf Canis lupus LE LECanada lynx Lynx canadensis C -white-footed vole Arborimus albipes SoC SUPacific western big-eared bat Corynorhinus townsendii SoC SCfringed myotis Myotis thysanodes - SVAmerican marten Martes americana - SVlong-eared myotis Myotis evotis - SUsilver-haired bat Lasionycteris noctivagans - SUWestern gray squirrel Sciurus griseus - SU

Rickreall Watershed Assessment: Appendix 5 Sensitive Species 153
Table A5-1 (cont.)
INSECTS
Common name Scientific name Fed status State status
Fender's blue butterfly Icaricia icarioides fenderi PE -Fender's rhyacophilan caddisfly Rhyacophila fenderi SoC -Haddock's rhyacophilan caddisfly Rhyacophila haddocki SoC -Roth's blind ground beetle Pterostichus rothi SoC -Vertree's ceraclean caddisfly Ceraclea vertreesi SoC -Siskiyou chloealtis grasshopper Chloealtis aspasma SoC -montane bog dragonfly Tanypteryx hageni - -Mary's Peak ice cricket Grylloblatta spp. - -American acetropis grass bug Acetropis americana - -stink bug Dendrocoris arizonensis - -foliaceous lace bug Derephysia foliacea - -Heidemann's nabid (bug) Hoplistoscelis heidemanni - -Martin's water-measurer Hydrometra martini - -marsh ground beetle Acupalpus punctulatus - -potentilla root borer beetle Chrysobothris potentillae - -Corvallis diving beetle Hydroporus corvallis - -Taylor's checkerspot butterfly Euphydryas editha taylori - -Mulsant's small water strider Mesovelia mulsanti - -true fir pinalitus (bug) Pinalitus solivagus - -Douglas-fir platylygus (bug) Platylygus pseudotsugae - -Alsea ochrotrichian micro caddisfly Ochrotrichia alsea - -Willamette callippe fritillarybutterfly
Speyeria callippe spp. - -
valley silverspot butterfly Speyeria zerene bremneri - -

Rickreall Watershed Assessment: Appendix 5 Sensitive Species 154
Table A5-1 (cont.)VASCULAR PLANTSKincaid's lupine Lupinus sulphureus LE LEdotted water-flax seed Spirodela punctata LT LTWillamette daisy Erigeron decumbens PE LEthree-colored monkeyflower Mimulus tricolor PT LT
peacock larkspur Delphinium pavonaceum SoC LEWillamette Valley larkspur Delphinium oreganum SoC LE
white-topped aster Aster curtus SoC LTtall bugbane Cimicifuga elata SoC Cshaggy horkelia Horkelia congesta SoC Cloose-flowered bluegrass Poa laxiflora SoC CNelson's sidalcea Sidalcea nelsoniana - Cwhorled marsh-pennywort Hydrocotyle verticillata - -dwarf isopyrum Isopyrum stipitatum - -thin-leaved peavine Lathyrus holochlorus - -small-flowered lipocarpha Lipocarpha micrantha - -Bradshaw's lomatium Lomatium bradshawii - -Howell's montia Montia howellii - -meadow sidalcea Sidalcea campestris - -
humped bladderwort Utricularia gibba - -narrow-leaved milkweed Asclepias fascicularis* - -
dotted water-meal Wolffia borealis - -
showy milkweeed Asclepias speciosa* - -Wahoo Euonymus occidentalis - -indian rhubarb Peltiphyllum peltatum - -
Timwort Cicendia quadrangularis - -
Mountain lady-slipper Cypripedium montanum - -
adder’s tongue Ophioglossum pusillum - -
upland yellow violet Viola nuttalli praemorsa - -
Columbia water-meal Wolffia columbiana - -LE = Listed EndangeredPE = Proposed Endangered C = Candidate Species
LT = Listed Threatened PT = Proposed Threatened SoC = Species of Concern
Additional State Sensitive Rankings: SC = sensitive critical, S V = sensitive vulnerable, SP =sensiteve peripheral, SU = sensitive, undetermined status.
*Corvallis Chapter Native Plant Society of Oregon, Species of Concern

Rickreall Watershed Assessment: Appendix 5 Sensitive Species 155
Special Plants and FungiThere are four lists currently used by the Natural Heritage Council to rank specialplants and fungi (Table A5-2). List 1 consisting of the taxa which are endangeredor threatened throughout their range or are presumed extinct. List 2 containsspecies that are threatened, endangered or possibly extirpated from Oregon, butare stable or more common elsewhere. List 3 is a review list for species thatneed more information to determine their status. All fungi in the survey are newand are placed on the review list by the Oregon Natural Heritage Program. List 4contains taxa of concern that are not currently threatened or endangered.
Table A5-2: Sensitive Special plants and fungi (source: ONHP).
Lichens Mosses Fungi Liverworts
List 1:Sulcaria badia
List 1:
Sphaerocarposhians
List 2:
Micromitriumtenerum
Physcomitrella patens
List 3:
Bryoria subcanaUsnea hesperina List 3:
Physcomitrium immersum
List 3:Otidea leporinaPhaeocollybiaradicata
Ramaria gracilisRhizopogonbrunneiniger
Rhizopogonexiguus
Rhizopogonsubcinnamomeus
Rhizopogonsubradicatus
Sarcosomalatahense
List 3:BondarzewiamesentericaElaphomycesdecipiens
Gymnomycesmonosporus
Helvella elasticaHelvellamaculata
Leptoniaoccident
Leucogastercitrinus
Martelliaidahoensis

Rickreall Watershed Assessment: Appendix 6 156
APPENDIX 6: Soil Groups for Rickreall Watershed
Agricultural and Mixed Land Use Soils of the Main Valley Floor andFoothillsTable A6-1. Soil Group A (PURPLE) Main valley floor terraces, Level to nearly level with fewlimitations, diverse agriculture and urban uses. Capability classes I and Is and IIw.
Map Unit Series Type Slopeclass
CapabilityClass
1A Abiqua Silty clay loam 0-3 I3 Amity Silt loam 0-3 II w
12A Briedwell Silt loam 0-3 IIs18 Coburg Silty clay loam 0-3 IIw45 Malabon Silty clay loam 0-3 II s
48A McAlpin Silty clay loam 0-3 II w65B Santiam Silt loam 0-3 IIw75A Willamette Silt loam 0-3 I77A Woodburn Silt loam 0-3 II w
Table A6-2. Soil Group B (YELLOW) Gently to strongly sloping soils of the terraces and foothills;Slight to moderate erosion hazard; Capability classes IIe and IIIe.
Map Unit Series Type Slopeclass
CapabilityClass
1B Abiqua Silty clay loam 3-5 II e8C Bellpine Silty clay loam 3-12 II e8D Bellpine Silty clay loam 12-20 III e
12C Briedwell Silt loam 3-12 IIIe15C Chehulpum Silt loam 3-12 Vis26C Dixonville Silty clay loam 3-12 II e26D Dixonville Silty clay loam 12-20 III e27C Dupee Silt loam 3-12 III e29C Hazellair Silt loam 3-12 III e30C Helmick Silt loam 3-12 IIIe31C Helvetia Silt loam 0-12 IIIe35C Jory Silt loam 2-12 II e35D Jory Silt loam 12-20 III e36C Jory Silty clay loam 2-12 IIe36D Jory Silty clay loam 12-20 IIIe48B McAlpin Silty clay loam 3-6 IIe52C Nekia Silty clay loam 2-12 IIe52D Nekia Silty clay loam 12-20 IIIe56C Philomath Silty clay 3-12 VI e61C Ritner GR Silty clay loam 3-12 Ivs64B Salkum Silty clay loam 2-6 IIe64C Salkum Silty clay loam 6-12 IIe65C Santiam Silt loam 6-15 IIe65D Santiam Silt loam 15-20 IIIe67C Steiwer Silt loam 3-12 IIIe68C Suver Silty clay loam 3-12 IIIe74C Willakenzie Silty clay loam 2-12 IIIe74D Willakenzie Silty clay loam 12-20 IIIe75C Willamette Silt loam 3-12 II e75D Willamette Silt loam 12-20 IIIe77C Woodburn Silt loam 3-12 IIe77D Woodburn Silt loam 12-20 III e

Rickreall Watershed Assessment: Appendix 6 157
Table A6-3. Soil Group C (ORANGE) Steeply sloping soils of old terraces and foothills; high hazardof erosion; Capability classes IVe and VIe.
Map Unit Series Type Slopeclass
CapabilityClass
8E Bellpine Silty clay loam 20-30 IV e12D Briedwell Gravelly loam 7-20 IV e15E Chehulpum Silt loam 12-40 VIIs16E Chehulpum-Steiwer complex Silt loam 12-40 VIIs27D Dupee Silty clay loam 3-12 IVe29D Hazellair Silt loam 12-20 IV e30D Helmick Silt loam 12-20 IVe30E Helmick Silt loam 20-50 VIe31 Helvetia Silt loam 12-20 IVe
35E Jory Silt loam 20-30 IV e36E Jory Silty clay loam 2-30 IV e52E Nekia Silty clay loam 20-30 IVe56E Philomath Silty clay 12-45 VI e60C Rickreall Silty clay loam 3-12 VIe60D Rickreall Silty clay loam 12-20 VIe60E Rickreall Silty clay loam 20-50 VIIe60F Rickreall Silty clay loam 50-75 VIIe61D Ritner GR Silty clay loam 12-30 VIs67D Steiwer Silty clay loam 12-20 IVe67E Steiwer Silt loam 20-50 VIe68D Suver Silty clay loam 12-20 IVe68E Suver Silty clay loam 20-30 IVe74E Willakenzie Silty clay loam 20-30 IVe76C Witzel Very stony loam 3-12 Vis78 Xerochrepts and Haploxerolls Steep VIe
Table A6-4. Soil Group D (LIGHT BLUE) Level and nearly level soils of the floodplains that areoccasionally flooded, usually support diverse agriculture, and have slight to moderate risk of erosionfrom floodwater; Capability classes IIw, IIs, and IVw.
Map Unit Series Type Flood Hazard Slopeclass
CapabilityClass
2 Abiqua Occasional 0-3 Iiw13 Camas Gr. sandy loam Common 0-3 IV w14 Chahalis Silty clay loam Common 0-3 II w17 Cloquato Silt loam Common 0-3 II w46 Malabon, Silty clay loam Occasional Iiw49 McBee Silty clay loam Occasional 0-3 II w53 Newberg Silty clay loam Common 0-3 II w54 Newberg Loam Common 0-3 II w58 Pilchuck f. sandy loam Common 0-3 IV w62 Riverwash Gravel, Cobbles, Sand Frequent 0-5 VIIIw79 Xerofluvents Loamy Frequent 0-5 Viw
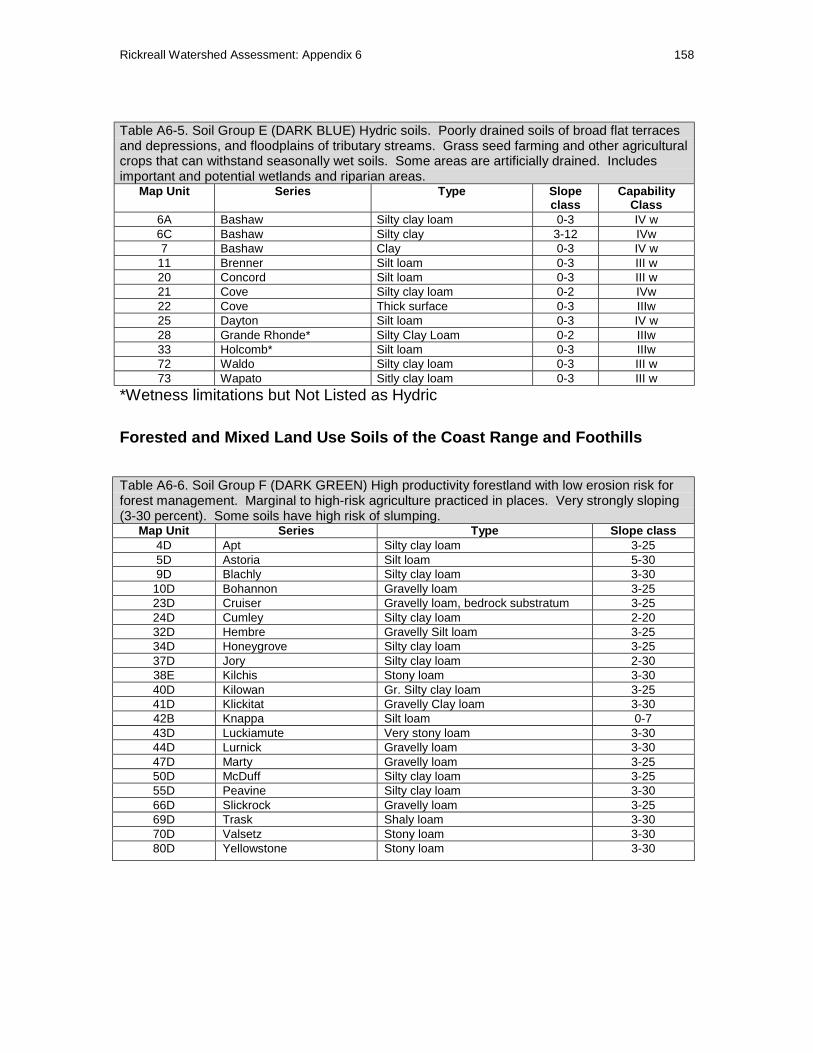
Rickreall Watershed Assessment: Appendix 6 158
Table A6-5. Soil Group E (DARK BLUE) Hydric soils. Poorly drained soils of broad flat terracesand depressions, and floodplains of tributary streams. Grass seed farming and other agriculturalcrops that can withstand seasonally wet soils. Some areas are artificially drained. Includesimportant and potential wetlands and riparian areas.
Map Unit Series Type Slopeclass
CapabilityClass
6A Bashaw Silty clay loam 0-3 IV w6C Bashaw Silty clay 3-12 IVw7 Bashaw Clay 0-3 IV w
11 Brenner Silt loam 0-3 III w20 Concord Silt loam 0-3 III w21 Cove Silty clay loam 0-2 IVw22 Cove Thick surface 0-3 IIIw25 Dayton Silt loam 0-3 IV w28 Grande Rhonde* Silty Clay Loam 0-2 IIIw33 Holcomb* Silt loam 0-3 IIIw72 Waldo Silty clay loam 0-3 III w73 Wapato Sitly clay loam 0-3 III w
*Wetness limitations but Not Listed as Hydric
Forested and Mixed Land Use Soils of the Coast Range and Foothills
Table A6-6. Soil Group F (DARK GREEN) High productivity forestland with low erosion risk forforest management. Marginal to high-risk agriculture practiced in places. Very strongly sloping(3-30 percent). Some soils have high risk of slumping.
Map Unit Series Type Slope class4D Apt Silty clay loam 3-255D Astoria Silt loam 5-309D Blachly Silty clay loam 3-30
10D Bohannon Gravelly loam 3-2523D Cruiser Gravelly loam, bedrock substratum 3-2524D Cumley Silty clay loam 2-2032D Hembre Gravelly Silt loam 3-2534D Honeygrove Silty clay loam 3-2537D Jory Silty clay loam 2-3038E Kilchis Stony loam 3-3040D Kilowan Gr. Silty clay loam 3-2541D Klickitat Gravelly Clay loam 3-3042B Knappa Silt loam 0-743D Luckiamute Very stony loam 3-3044D Lurnick Gravelly loam 3-3047D Marty Gravelly loam 3-2550D McDuff Silty clay loam 3-2555D Peavine Silty clay loam 3-3066D Slickrock Gravelly loam 3-2569D Trask Shaly loam 3-3070D Valsetz Stony loam 3-3080D Yellowstone Stony loam 3-30
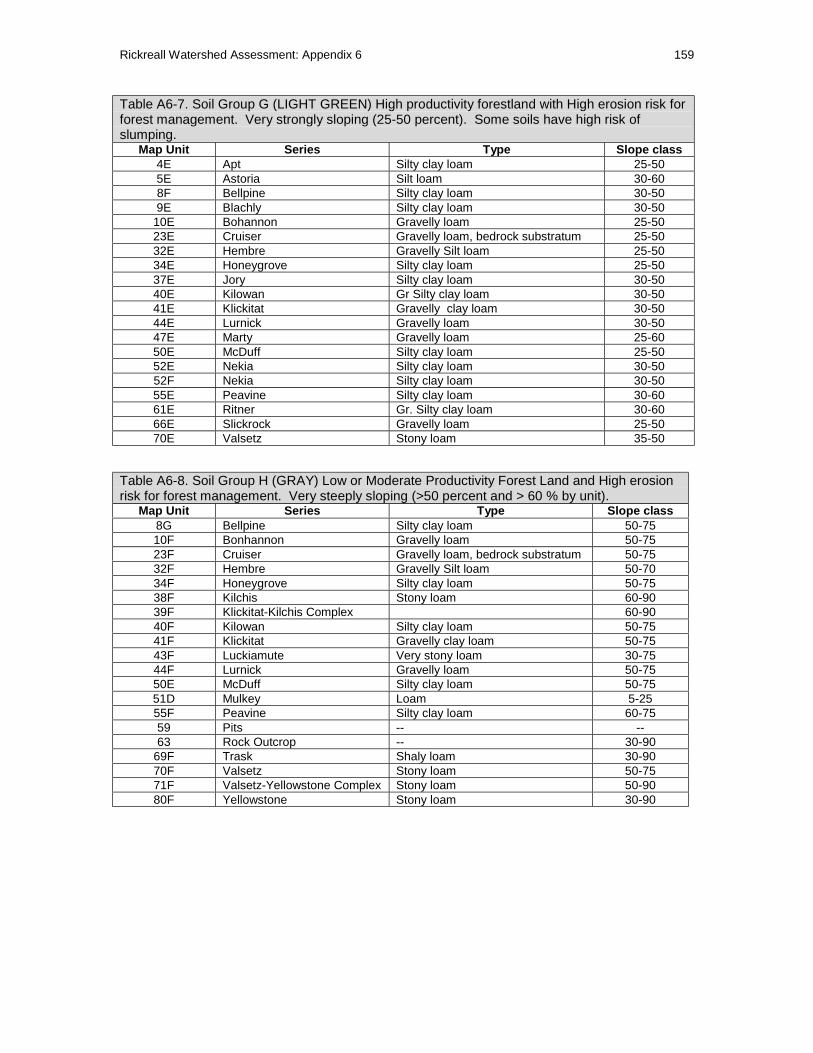
Rickreall Watershed Assessment: Appendix 6 159
Table A6-7. Soil Group G (LIGHT GREEN) High productivity forestland with High erosion risk forforest management. Very strongly sloping (25-50 percent). Some soils have high risk ofslumping.
Map Unit Series Type Slope class4E Apt Silty clay loam 25-505E Astoria Silt loam 30-608F Bellpine Silty clay loam 30-509E Blachly Silty clay loam 30-50
10E Bohannon Gravelly loam 25-5023E Cruiser Gravelly loam, bedrock substratum 25-5032E Hembre Gravelly Silt loam 25-5034E Honeygrove Silty clay loam 25-5037E Jory Silty clay loam 30-5040E Kilowan Gr Silty clay loam 30-5041E Klickitat Gravelly clay loam 30-5044E Lurnick Gravelly loam 30-5047E Marty Gravelly loam 25-6050E McDuff Silty clay loam 25-5052E Nekia Silty clay loam 30-5052F Nekia Silty clay loam 30-5055E Peavine Silty clay loam 30-6061E Ritner Gr. Silty clay loam 30-6066E Slickrock Gravelly loam 25-5070E Valsetz Stony loam 35-50
Table A6-8. Soil Group H (GRAY) Low or Moderate Productivity Forest Land and High erosionrisk for forest management. Very steeply sloping (>50 percent and > 60 % by unit).
Map Unit Series Type Slope class8G Bellpine Silty clay loam 50-7510F Bonhannon Gravelly loam 50-7523F Cruiser Gravelly loam, bedrock substratum 50-7532F Hembre Gravelly Silt loam 50-7034F Honeygrove Silty clay loam 50-7538F Kilchis Stony loam 60-9039F Klickitat-Kilchis Complex 60-9040F Kilowan Silty clay loam 50-7541F Klickitat Gravelly clay loam 50-7543F Luckiamute Very stony loam 30-7544F Lurnick Gravelly loam 50-7550E McDuff Silty clay loam 50-7551D Mulkey Loam 5-2555F Peavine Silty clay loam 60-7559 Pits -- --63 Rock Outcrop -- 30-90
69F Trask Shaly loam 30-9070F Valsetz Stony loam 50-7571F Valsetz-Yellowstone Complex Stony loam 50-9080F Yellowstone Stony loam 30-90

Rickreall Watershed Assessment: Index 160
INDEX
3303(d) list, 37
Aagriculture
early, 29algae, 106American pioneers, 20ammonia, 45
Bbeneficial uses, 34biodiversity, 90Boise Cascade, 83Boyle Lakes, 64, 88
CCAFOs, 104California Trail, 25cattle, 104channel habitat types, 81chlorine, 50CLAMS, 85Clean Water Act, 34coho salmon, 73conductivity, 43copper, 43, 50crop sales, 116cubic feet per second, 52culverts, 83cutthroat trout, 70Cynthian, 25
DDallas gage, 52dams
historic, 25David Douglas, 24discharge, 13, 52, 56
low flow, 56dissolved oxygen, 44, 50diuron, 104
Eebris flows, 96economy, 115elevation, 5, 11Eola Hills, 10erosion
streambank, 101
Ffarm sales, 115fecal coliform bacteria, 43, 50fertilize, 102fire
1987 Rockhouse, 62, 95fire interval, 92fish species, 67flow modification, 44, 50ford
historic, 25, 27
GGeology, 10gill net surveys, 70Grand Ronde Tribes, 22grizzly bear, 89grizzly bears, 25groundwater, 47
Hherbicide, 104
JJames Clyman, 22
KKalapuyan, 20
Llakes, 62lamprey, 74Landforms, 10landscape
historic, 24landslides, 94Laurel Mountain, 11, 13log drives, 28logging
historic, 27
MmacroinvertebrateS, 45mass erosion, 93Mercer Reservoir, 6, 61, 85metals, 47mills
historic, 25Missoula Flood, 10

Rickreall Watershed Assessment: Index 161
NNative American, 22navigable waters, 27nitrate, 103nitrogen, 102
OONHP, 89Oregon chub, 73
Ppeak flows, 56pesticides, 47, 103pH, 45phosphorus, 45Pleistocene floods, 9population density, 10population growth, 120
historic, 25precipitation, 11pyroculture, 20
Rrailroad
historic, 29rainbow trout, 70rain-on-snow, 58recreation areas, 121reservoirs, 60Rickreall
early photos, 29Rickreall Dairy, 104Rickreall gage, 52Riley Peak, 11riparian forests, 85riparian purchases, 101roads, 97, 107
historic, 29Roads, 10rock quarry, 108Rockhouse Creek, 70, 95
Ssand rollers, 74sediment, 45
Senate Bill 1010, 50, 106sensitive species, 89Silver Falls, 11soil compaction, 93soil types, 91splashdams, 28spring chinook, 73steelhead, 69stormwater, 38streamflow, 52surveys
CH2MHill, 80historic, GLO, 27ODFW, 75streams, 70upper extent, 71
Sustainable Forestry Initiative, 83
Ttemperature, 13, 46, 50TMDL, 37total dissolved solids, 46turbidity, 47Tyco Industries, 9, 38
Vvegetation, 85
historic, 24ViIlwok’s Dam, 67Villwok’s dam, 85
Wwater
early supplies, 29water budget, 54water quality
chlorine toxicity, 37criteria, 34monitoring, 51standards, 34
water withdrawal, 58wells, 49wetlands, 64, 85
inventory, 89Willamette Industries, 9, 38, 83winter steelhead, 68WWTP, 37

Rickreall Watershed Assessment: Glossary 162
GLOSSARY
Short definitions are given for some of the terms used in this document. In manycases, definitions are given in the text. The readers are also directed to theappendixes; in particular water quality parameters are described in Appendix 3.x.
100-yr storm A statistical statement that the storm was so big, one wouldn't expect it foranother 100 years.
303 (d) list List of waters in the state that do not meet standards for water quality.
Alluvial Deposits created by moving water. Typically soil deposits.
Anadromous Fish that spawn in fresh water and live in salt water. Resident fish stay in a localarea of the stream all year long.
Aquifer Area of the ground that has an amount of water saturated in the soils and cracksof the bedrock. `
Biodiversity Measure of numbers of different species and/or habitats within an area.
BLM U.S. Bureau of Land Management
Board feet Measure of lumber or timber. One board foot is equivalent to a 12" x 12" boardthat is 1 " thick.
CAFO Confined animal feeding operation. CAFOs are often dairies.
CFS Cubic feet per second.
Channel The river bed and banks that contains the water of a stream or river.
Colluvial Deposits created by slides, erosion from hillslopes.
Constrained A channel that has steep and high banks with little opportunity for the flood waterto enter a floodplain.
Dam The material or structure that impounds or holds back a stream or river.
DEQ Oregon Department of Environmental Quality
Embeddedness The degree to which cobble or gravel sized substrate is buried by sand or finerparticles. Embeddedness inhibits macroinvertebrates and fry (young fish).
Erosion The detachment of soil particles and their subsequent movement. The wearingaway of a soil profile (the structure and layering).
Euro-American Person of European decent that has become a U.S. citizen--in contrast to NativeAmerican.
Extirpated Locally extinct or died off.
Fish barrier Some obstruction in the stream that stops fish from swimming up or down. Canbe a falls, culvert, of shallow water, or dam. Barriers can be seasonal.

Rickreall Watershed Assessment: Glossary 163
Fluvial Of flowing water.
Gage Variant of gauge. A measuring device such as a graduated rod to derive streamdischarge or a graduated collector to measure rainfall.
Geomorphology Physical form of the landscape
Gill net A net that is set out to catch fish. It stretches when a fish tries to swim throughthe holes and tightens behind their gills, trapping them.
GIS Geographic Information System--a computer aided way to make maps usingvarious data sets. These maps can easily be measured by the computer too.
GLO surveys Land surveys to establish section lines during the mid 1800's. These surveysalso recorded vegetation types
Gradient The steepeness of a stream channel or hillslope.
Headwall The steepest portion of a valley usually at the head or start of a stream.
Hydrograph Plot of stream flow volumes over time.
Hydrology The study of flowing water. Or the information about flow in a stream.
Low flow Low flows in a stream such as during late summer.
macroinvertebrates Relatively large sized invertebrates (lacking a backbone)--typically insects.
Mass wasting The event of large amounts of soil and bedrock moving suddenly as a landslideor slump.
Naturally reproducing Term for fish that may not have been native (there before Euro-Americansettlement) but currently reproduces on it own as a native fish.
OAR Oregon Administrative Rules. The state law.
ODF Oregon Department of Forestry
ODFW Oregon Department of Fish and Game.
Off-channel habitat Slow water areas along the edges of stream or side channels and beaver pondsthat offer refuge for young fish and shelter during floods.
Old-growth Stand of trees, conifers, that have characteristics of large and old-aged trees.Typically over 200 years old.
ONHP Oregon Natural Heritage Program.
Orthophoto Aerial photo that has been digitized (made into tiny dots) and reformatted(stretched) so as to remove distortions on the corners of the photo. Orthophotosare flat projects just like a map. Aerial photos project slightly curved.
Over-allocated The condition where the sum of all the permitted withdrawals from a stream aregreater than what has been deemed should stay in the channel as an instreamright.
Peak flow Flood flows in a stream.

Rickreall Watershed Assessment: Glossary 164
Perennial Grows without needed replanting for several years. Most agriculture crops areannuals.
Pools and riffles Areas of a stream: pools are deeper and slower water, riffles are shallow andfast flowing--they create turbulence on the surface.
Reservoir The impoundment or lake that is created by a dam.
Riparian Of rivers or stream side.
Savanna A mixture of grasslands and scattered trees.
SB 1010 Senate Bill # 10-10. A law passed in Oregon to begin to reduce non-pointsource pollution to stream. (Not from a single point such as a pipe, but from adispersed area such as a road, field or construction site.
Sediment Mineral matter that is transported by waters. Can be clay sized (very small) toboulder sized.
Spring chinook Chinook salmon that enter the river to spawn in late winter or spring. Salmon inthe Willamette are spring chinook. Most salmon on the coast are fall chinook.
Steelhead Ocean traveling rainbow trout that comes back to its stream of origin to spawn.
Substrate The mineral particles on the bottom of a steam. Can be sand up to bedrock.
Water right The amount of water a permittee is allowed to withdraw during a time period.
Watershed Area of land that is drained by a stream or river--a basin.
Wetland Any shallow, permanently or seasonally wet area. Usually still or slow movingwaters. Includes the soils and vegetation.
Withdrawals Removal of water from a water body.
Woody debris Larger logs-typicall counted during stream surveys. Woody debris is good forfish habitat.
WWTP Waste water treatment plant or sewage treatment plant.