Richtmyer-Meshkov Instability on a Low Atwood...
24
1075-PI (12-2005) Replaces (2-2005) Issue SANDIA REPORT SAND2009-6235 Unlimited Release Printed September 2009 Richtmyer-Meshkov Instability on a Low Atwood Number Interface after Reshock Chris Weber Prepared by Sandia National Laboratories Albuquerque, New Mexico 87185 and Livermore, California 94550 Sandia is a multiprogram laboratory operated by Sandia Corporation, a Lockheed Martin Company, for the United States Department of Energy’s National Nuclear Security Administration under Contract DE-AC04-94AL85000. Approved for public release; further dissemination unlimited.
Transcript of Richtmyer-Meshkov Instability on a Low Atwood...

1075-PI (12-2005) Replaces (2-2005) Issue
SANDIA REPORT SAND2009-6235 Unlimited Release Printed September 2009
Richtmyer-Meshkov Instability on a Low Atwood Number Interface after Reshock Chris Weber Prepared by Sandia National Laboratories Albuquerque, New Mexico 87185 and Livermore, California 94550
Sandia is a multiprogram laboratory operated by Sandia Corporation, a Lockheed Martin Company, for the United States Department of Energy’s National Nuclear Security Administration under Contract DE-AC04-94AL85000. Approved for public release; further dissemination unlimited.

2
Issued by Sandia National Laboratories, operated for the United States Department of Energy by Sandia Corporation. NOTICE: This report was prepared as an account of work sponsored by an agency of the United States Government. Neither the United States Government, nor any agency thereof, nor any of their employees, nor any of their contractors, subcontractors, or their employees, make any warranty, express or implied, or assume any legal liability or responsibility for the accuracy, completeness, or usefulness of any information, apparatus, product, or process disclosed, or represent that its use would not infringe privately owned rights. Reference herein to any specific commercial product, process, or service by trade name, trademark, manufacturer, or otherwise, does not necessarily constitute or imply its endorsement, recommendation, or favoring by the United States Government, any agency thereof, or any of their contractors or subcontractors. The views and opinions expressed herein do not necessarily state or reflect those of the United States Government, any agency thereof, or any of their contractors. Printed in the United States of America. This report has been reproduced directly from the best available copy. Available to DOE and DOE contractors from
U.S. Department of Energy Office of Scientific and Technical Information P.O. Box 62 Oak Ridge, TN 37831 Telephone: (865) 576-8401 Facsimile: (865) 576-5728 E-Mail: [email protected] Online ordering: http://www.osti.gov/bridge
Available to the public from
U.S. Department of Commerce National Technical Information Service 5285 Port Royal Rd. Springfield, VA 22161 Telephone: (800) 553-6847 Facsimile: (703) 605-6900 E-Mail: [email protected] Online order: http://www.ntis.gov/help/ordermethods.asp?loc=7-4-0#online

3
SAND2009-6235 Unlimited Release
Printed September 2009
Richtmyer-Meshkov Instability on a Low Atwood Number Interface after Reshock
Chris Weber
University of Wisconsin-Madison 1500 Engineering Drive
Madison, WI 53706
Abstract The Richtmyer-Meshkov instability after reshock is investigated in shock tube experiments at the Wisconsin Shock Tube Laboratory using planar laser imaging and a new high speed interface tracking technique. The interface is a 50-50% volume fraction mixture of helium and argon stratified over pure argon. This interface has an Atwood number of 0.29 and near single mode, two-dimensional, standing wave perturbation with an average amplitude of 0.35 cm and a wavelength of 19.4 cm. The incident shock wave of Mach number 1.92 accelerates the interface before it is reshocked by a reflected Mach 1.70 shock wave. The amplitude growth after reshock is reported for variations in this initial amplitude, and several amplitude growth rate models are compared to the experimental growth rate after reshock. A new growth model is introduced, based on a model of circulation deposition calculated from one-dimensional gas dynamics parameters. This model is shown to compare well with the amplitude growth rate after reshock and the circulation over a half-wavelength of the interface after the first shock wave and after reshock.

4
5
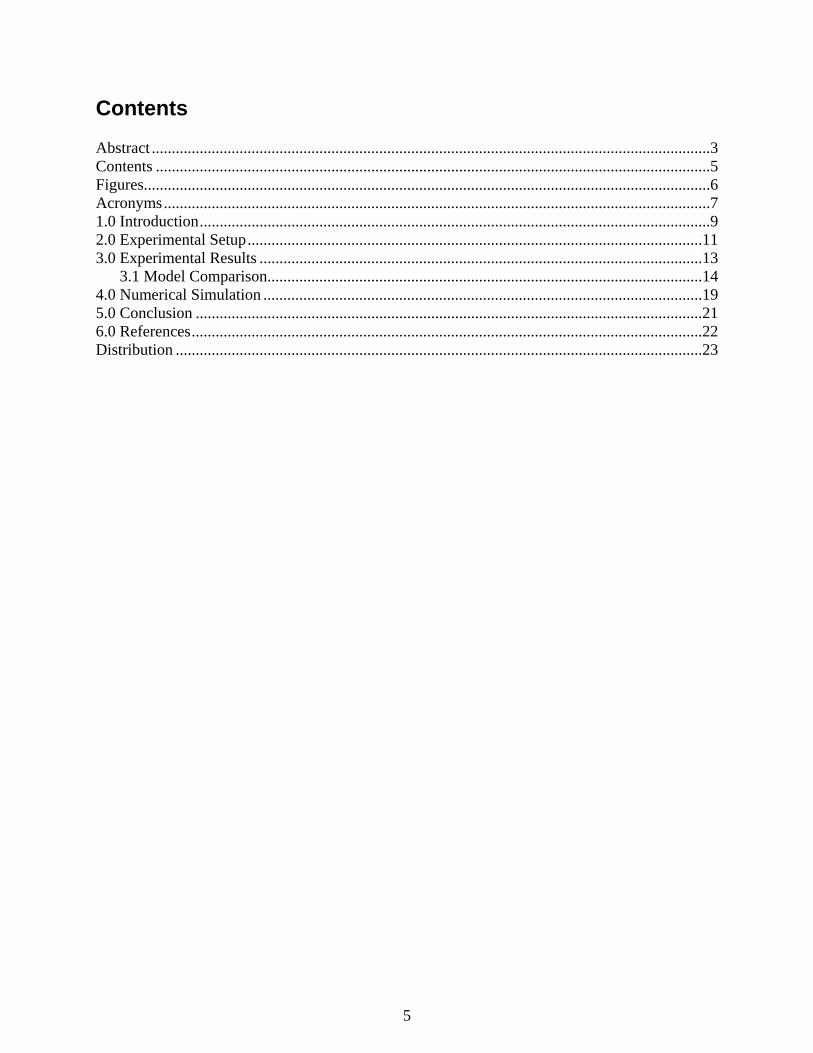
Contents Abstract ............................................................................................................................................3 Contents ...........................................................................................................................................5 Figures..............................................................................................................................................6 Acronyms .........................................................................................................................................7 1.0 Introduction ................................................................................................................................9 2.0 Experimental Setup ..................................................................................................................11 3.0 Experimental Results ...............................................................................................................13 3.1 Model Comparison.............................................................................................................14 4.0 Numerical Simulation ..............................................................................................................19 5.0 Conclusion ...............................................................................................................................21 6.0 References ................................................................................................................................22 Distribution ....................................................................................................................................23

6
Figures Figure 1: Initial Condition image and modal content ....................................................................11 Figure 2: Planar images of the instability ......................................................................................13 Figure 3: Experimental x-t diagram from an initially flat interface ...............................................14 Figure 4: Amplitude vs. time after reshock for six experiments ....................................................15 Figure 5: Diagram of a shock wave passing through a light-over-heavy sinusoidal interface ......16 Figure 6: Experimental amplitude growth rate divided by the model growth rate ........................18 Figure 7: Simulation results comparing the amplitude growth rate from the simulation with
experiment .....................................................................................................................19
7
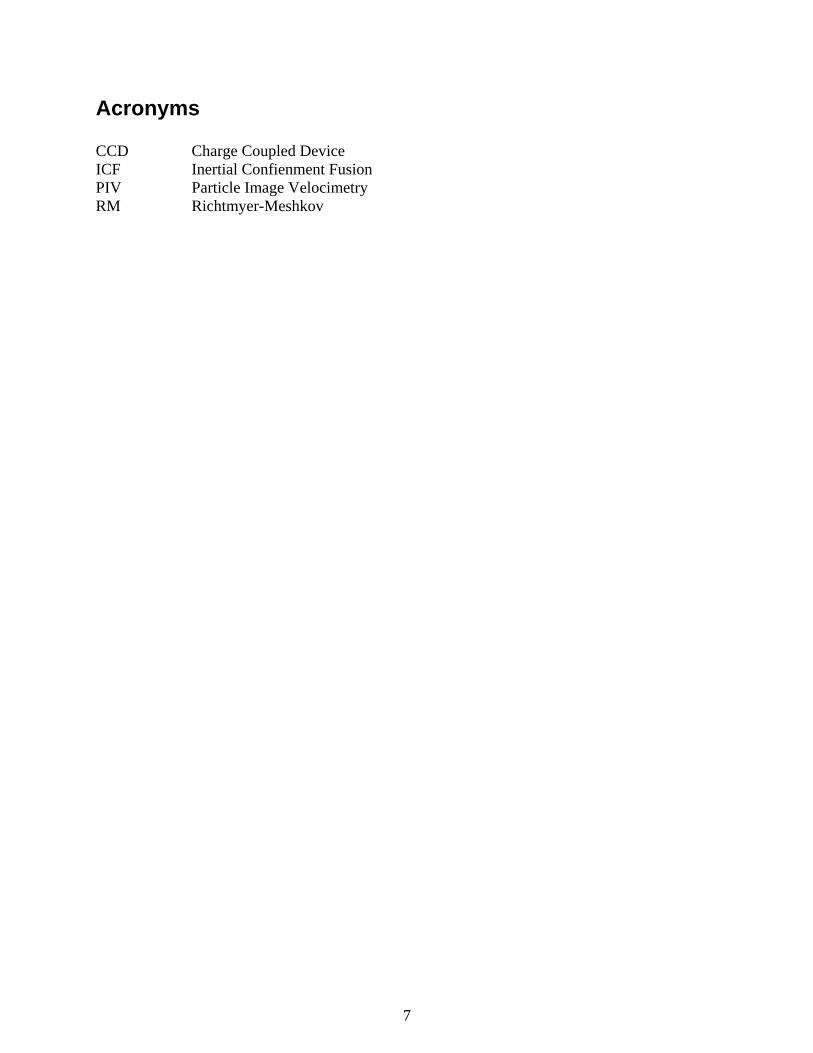
Acronyms CCD Charge Coupled Device ICF Inertial Confienment Fusion PIV Particle Image Velocimetry RM Richtmyer-Meshkov

8

9
Richtmyer-Meshkov Instability on a Low Atwood Number Interface after Reshock
1.0 Introduction The Richtmyer-Meshkov (RM) instability [1, 2] occurs when a density gradient is accelerated by a shock wave. If this density gradient is misaligned with the pressure gradient, vorticity will be deposited baroclinically causing deformation of the interface and mixing to occur. This mixing becomes important during the compression of an inertial confinement fusion (ICF) fuel capsule, behind the shock wave of a supernova, and as a mechanism for mixing fuel in hypersonic engines. In all of these applications, knowledge of how the instability develops over time and the role certain parameters play in the instability is of current interest. An apt way of identifying the relevant physics in the RM instability is to develop models based on well understood concepts, such as linear stability theory or buoyancy and drag, and compare their application to the RM instability to experimental and numerical results. Additionally, multiphysics codes used to simulate high energy regimes, such as that during ICF or supernova explosion, need experimental data for validation. Experiments of the RM instability provide useful test cases for the hydrodynamic component of these codes. The interface between two gases that is accelerated by a shock wave is unstable regardless of the path the shock wave takes. If the shock wave travels from the light gas to the heavy one, perturbations on the interface will grow in amplitude. If the shock travels in the reverse direction, the vorticity will be of the opposite sign than the previous case, and the perturbation will first compress and reverse phase, and then grow in the opposite direction. These cases can be combined in a shock tube by allowing a once-shocked interface to be reshocked by a shock wave that reflects from the end wall. Shock tube experiments investigating the RM instability after reshock have the advantage that the interface is nearly stationary after reshock, allowing the interface to be viewed in the same window for a longer period of time. At the time of reshock, the interface has grown in amplitude. When the reflected shock wave passes through this larger interface, the vorticity deposited will be much larger than that from the first shock interaction. The larger vorticity will cause the amplitude growth rate after reshock to be several times larger in magnitude than prior to reshock. Previous shock tube experiments investigating the RM instability after reshock have obtained full field images using either planar imaging [3, 4] or schlieren [5, 6]. The amount of data collected for each experiment is limited by the laser pulse rate or the camera frame rate. The current work uses two continuous laser beams to acquire high speed amplitude measurements. This new method has two advantage: data can be taken with higher temporal resolution and the measurements are taken from the same plane as the planar imaging. The experimental results are
10
compared with models and a simulation. Additionally a new model is introduced for circulation and amplitude growth rate estimates for single or multiple shock waves.

11
2.0 Experimental Setup The experiments are performed at the Wisconsin Shock Tube Laboratory [7]. The shock tube is a downward firing, 9.13 m vertical tube. The driver has a circular cross section with a 0.41 m radius and a 2.08 m length while the driven section has a square cross section with 0.25 m sides. A high-pressure boost tank is connected to the driver section by a pneumatically-driven fast-opening valve to control the diaphragm rupture time. Piezoelectric pressure transducers mounted along the shock tube side walls are used to trigger the controlling electronics and to measure the shock speed. The interface is created in the shock tube by flowing pure argon gas from below and a 50-50% volume fraction mixture of helium and argon from above [8]. The gases meet to form a stagnation plane and exit through slots in the shock tube due to a pressure differential provided by a vacuum pump. The slots are centered in a pair of 5.08×25.4 cm2 rectangular pistons that are embedded in the walls. After the gases have flowed for a sufficient time to ensure purity, the pistons are oscillated at 1.25 Hz for 14 revolutions to create a standing wave with an initial amplitude of 0.35 cm and a wavelength of 19.4 cm. The interface has an Atwood number
1212 / rrrrA of 0.29. A sample initial condition image is shown in Figure 1 along with a modal decomposition which contains two dominant modes.
Figure 1: Initial condition image and modal content. Ly is the streamwise region of
interest for the initial condition and Lx is the spanwise dimension. Before the experiment begins, the driver is filled to 85% of the diaphragm rupture pressure. Approximately 300 ms before the acceleration of the desired standing wave occurs, a high-pressure boost tanks opens, filling the driver with gas, and rupturing the diaphragm. The long length of the shock tube ensures a planar shock wave by the time it reaches the interface. The incident Mach 1.92 shock wave transmits through the interface and reflects from the end wall as a Mach 1.70 shock wave. Flow visualization is performed by seeding the bottom gas with Al2O3 particles using a fluidized bed. Four lasers enter from the bottom of the tube, illuminating a plane halfway between the front and back walls. Planar images are acquired using a KrF excimer laser for an initial condition image and a dual cavity Nd:YAG laser for post-shocked/re-shocked images. The initial condition image is recorded on a cooled Andor CCD camera and a pair of post-shocked or re-shocked images are captured with a Lavision PIV camera.

12
In addition to planar imaging, a high speed diagnostic is implemented using two continuous argon ion laser beams entering from the bottom of the tube and positioned below the spike and bubble of the initial condition. The Mie scattering signals from the laser beams are recorded with two high speed cameras from Redlake and IDT at 116,509 Hz. The data from these cameras are used to track the transmitted and reflected shock waves and observe the interface as it travels through the viewing window. This setup allows for an experimental x-t diagram to be constructed from each camera. Amplitude growth over time can then be determined using the x-t diaphragms from the two cameras.

13
3.0 Experimental Results A set of planar images is shown in Figure 2. The first image is taken 0.10 ms before the reflected shock wave has reached the interface. The interface has grown to 0.92 cm in amplitude. The first image shows a few stray particles up to a centimeter above the interface. The seeding method allows for a distribution of particles of various sizes, with larger particles taking longer to accelerate in the presence of high velocity gradients, such as the passage of the incident shock wave. The maximum particle size is estimated to be 2.1 m. This value is calculated using the distance lag of the particles in Figure 2(a) and the velocity of the interface [9]. The defined contour of the interface suggests that most particles are of sufficiently small size to show no lag.
Figure 2: Planar images of the instability. Image (a) was taken 1.86 ms after being
accelerated by the first shock wave but 0.10 ms before being reshocked. The following images all occur after being reshocked with the time after reshock being (b) 0.06 ms, (c)
0.34 ms, (d) 0.61 ms, (e) 0.86 ms, (f) 1.09 ms, (g) 1.34 ms, and (h) 1.63 ms. The images after reshock, Figure 2(b)-(h), initially show the interface compresses in amplitude at 0.06 ms and then reverses in phase by 0.61 ms. Later in time, after 0.86 ms, secondary instabilities can be seen arising on the interface, predominantly at the mid location between the spike and the bubble. The rarefaction that reflects from the end wall is expected to be arriving at the interface after the 0.86 ms image.
(a) (b) (c) (d)
(e) (f) (g) (h)

14
Figure 3: Experimental x-t diagram from an (a) initially flat interface showing the
scattered light signal, revealing the transmitted and reflected shock waves and the path of the interface. (b) Experimental x-t diagrams showing the interface location for a bubble (blue) and spike (red) from a single experiment. Also plotted is the interface location from
an initially flat experiment (black). Figure 3(a) shows an example of an experimental x-t diagram taken from an initially flat interface. In the beginning (tr ≈ -2 ms), unshocked seeded argon can be seen. At tr ≈ -1 ms the transmitting shock can be seen traveling through the diagram, where it compresses the seeded argon, causing the scattered signal to intensify. At tr ≈ 0.5 ms the interface travels through the diagram until it is reshocked at tr = 0 m and 78 cm from its initial location. The reshocked interface then travels upward in the tube (to the left in the diagram) until the rarefaction wave that reflects off the bottom wall causes the interface to become nearly stationary. At tr ≈ 0.6 ms the pulse from the Nd:YAG laser can be seen. At tr ≈ 3.5 ms a wave that has reflected off the contact surface between the driver gas and the driven gas causes the interface to move downward. Figure 3(b) shows the locations for a spike and bubble from a single experiment compared with that from an initially flat interface experiment. 3.1 Model Comparison Amplitude vs time after reshock of six experiments are extracted from the experimental x-t diagrams and plotted in Figure 4. The differences in initial condition amplitudes resulted in the amplitude before reshock to range from 0.82 cm to 1.76 cm. The variation in the amplitude growth rates due to the different initial conditions allows for a comparison to several reshock growth rate models. Brouillette and Sturtevant [5] extended Richtmyer’s impulsive model: 0k vA (1)
60 65 70 75 80−2
0
2
4
6
8t r
(ms)
x (cm)55 60 65 70 75 80 85
−1
0
1
2
3
4
5
x (cm)
t r(m
s)
(b) (a)

15
Figure 4: Amplitude vs. time after reshock for six experiments. The amplitude before reshock is 0.82 cm (black), 0.97 cm (blue), 1.05 cm (magenta), 1.33 cm (cyan), 1.48 cm
(red), and 1.76 cm (green). to include multiple shock interactions through a summation of the impulsive growth of each:
=k i
iv
iA
+i . (2)
Mikaelian [10] extended the phenomenological model of the Rayleigh-Taylor mixing layer experiments and simulations of Read [11] and Youngs [12] to the Richtmyer-Meshkov instability after reshock: =0.14vA+. (3) Although this model describes three-dimensional multimode interfaces, it has been shown previously to provide a good estimate of amplitude growth of single mode interfaces after reshock [13]. Jacobs and Sheeley [14] showed that for a low A interface the circulation on a half- wavelength is related to the amplitude growth rate by
+0= k4. (4)
We use this relation with a model estimating the circulation deposited on the interface to produce a new growth rate model. The velocity field around the interface as the incident shock is refracting can be approximated by dividing the region into the corresponding values calculated from one-dimensional gas dynamics, shown in Figure 5(a). The circulation deposited on the interface can be modeled by performing a line integral about a closed contour, P, forming a box around a half-wavelength:
−1 0 1 2 3 4−2
−1
0
1
2
3
4
5
6
tr (ms)
η(c
m)

16
.p
d d A v s
This line integral, shown in Figure 5(a), becomes =u
2ry
1+u
2ry
2+u
1y
3u
2y
4u
2y
5, (5)
where y
1=u
tt+W
rt, y
2=W
ttu
tt, y
3=W
itW
tt,
y4=W
rt, and y
5=W
it, and t=
20
Wi.
Figure 5: Diagram of a shock wave passing through a light-over-heavy sinusoidal
interface. (a) Single shock interaction: incident shock wave is propagating downward through an unshocked interface. (b) Reshock interaction: reflected shock wave is
traveling up through the once-shocked interface. The time is taken to be the time it takes for the incident shock wave to travel across the entire interface, i.e. t=2
0/W
i. Combining Eqs. (4) & (5), and noting that u
1=0, yields an estimate for
the growth rate due to the incident shock wave.
+0= k
0
2Wi [ ]u
2r ( )W
r+W
tu
2 ( )W
i+W
r (6)
A similar approach is applied to the reshocked interface, shown in Figure 5(b). In this case, the wave reflects off the interface as a rarefaction wave, which we can estimate to be traveling at the sound speed in that medium. The line integral becomes =u
2ry
1+u
5y
2+u
5y
3u
5ry
4u
5ry
5,
where, y
1=W
5ttW
5t, y
2=W
5t, y
3=a
5rt,
(b) (a)

17
y4=W
5ttu
5rt, y
5=a
5rt+u
5rt, and t=
20r
u2rW
5
.
We can simplify these equations by noting that u
5=0. The signs of all velocities are taken to be
positive downwards in Figure 5(a,b). Since the vorticity from the two interactions will add to the net circulation, the two growth rates should be added to provide the net growth rate after reshock. The final growth rate after reshock is
0
0 0 5 5 5 2 5 55 22
rr r r t r t
r
ku a W u W W
W u
(7)
The experimental growth rates divided by the growth rate predicted by each of the models are shown in Figure 6. The time is scaled by the wave number and the model growth rate. Figure 6(a) uses the growth rate determined by the Brouillette and Sturtevant model, Eq. (2). Reshock occurs at = 0 and the rarefaction wave that reflects off the end wall interacts with the interface at ≈ 0.3. At a time halfway between the reshock and rarefaction, the model underestimates the growth rate on average by 59%. It is interesting to note, however, that the growth rate of only the interaction of the second shock, shown in Figure 6(b), does accurately describe the growth rate of the experiments after reshock by overestimating the growth by only 7%. The model growth rate from the Mikaelian model, Eq. (3), is used in the scaling of Figure 6(c). Here we find the model does not collapse the growth rates well, but it does roughly match the growth rate of the average of the experiments. The average growth rate is overestimated by 12% The 1-D circulation based growth rate model, using Eq. (7), is used in the scaling of Figure 6(d). The model overestimates the growth rate on average by 19%. It performs best when the amplitude before reshock is larger: for the 0 1.75r cm experiment, the model was above the
experimental growth rate by 2%.

18
Figure 6: Experimental amplitude growth rate divided by the model growth rate. The
model growth rates used are from (a) the Brouillette-Sturtevant model, (b) the impulsive model using only reshock, (c) the Mikaelian model, and (d) the 1-D circulation based
model. The models vary in their ability to collapse the experimental growth rate to a single curve. The maximum difference in the normalized growth rates between the different experiments
exp exp
0 0max minr r
is largest for the Mikaelian model at 0.90. This model does not contain a parameter for the initial amplitude, so experiments with high initial amplitude are growing faster than the model and the opposite for smaller initial amplitude experiments. The Brouillette and Sturtevant model collapses the experimental data better, with a maximum difference in normalized growth rate of 0.49. The 1-D growth rate model provides the best data collapse, with a maximum difference in normalized growth rate of 0.30.
(a)
(c) (d)
(b)
−0.2 0 0.2 0.4 0.6 0.8 1−1
0
1
2
3
4η̇
η̇0
r
kη̇0rtr
−0.2 0 0.2 0.4 0.6 0.8 1−1
0
1
2
3
4
η̇η̇0
r
kη̇0rtr
−0.2 0 0.2 0.4 0.6 0.8 1−1
0
1
2
3
4
η̇η̇0
r
kη̇0rtr
−0.2 0 0.2 0.4 0.6 0.8 1−1
0
1
2
3
4
η̇η̇0
r
kη̇0rtr

19
4.0 Numerical Simulation A numerical simulation of the average experimental conditions was performed using the hydrodynamics code Raptor, developed at LLNL, that solves the 2-D compressible Euler equations on a fixed (Eulerian) grid. The shock-capturing scheme uses a higher order Godunov solver to handle the shock propagation and suppress spurious oscillations near the discontinuity. Two levels of adaptive mesh refinement are applied to density gradients and along the interface with ratios of 4 and 4. The finest resolution has 512 cells per shock tube width (0.50 mm/cell). The initial condition is a single mode sine wave based on the average amplitude and wavelength of the experiments. The interface was given a hyperbolic tangent diffusion thickness to match the calculated value of 1.42 cm [8]. The domain is initialized from the stationary state to capture all shocks and waves that arise during the experiment. The amplitude growth rate from the simulation is compared with that from an experiment with a similar initial condition in Figure 7(a). The growth rate after reshock and after the reflected rarefaction are nearly identical, while the growth rate during the reflected rarefaction peaks higher for the experiment, both the simulation and experiment show the same trend. The 1-D model overestimates the growth rate after reshock of the simulation by 7%.
Figure 7: Simulation results comparing (a) the amplitude growth rate from the simulation
(black) with that from a similar experiment (red) and the 1-D model (dashed). (b) Circulation over a half wavelength from 1-D model (dashed) and the simulation: + (solid-
blue), (solid-red), and Net (solid-black).
The results of the simulation allow for a direct comparison between the circulation from the 1-D model and that in the simulation. The circulation over a half-wavelength is integrated from the vorticity field and plotted in Figure 7(b). The net circulation of the simulation is initially within about 2% of the circulation predicted by the model after the first shock. As the instability develops further in time the circulation becomes about 30% less in magnitude than the model prediction. After reshock the circulation initially is within 3% of that predicted by the model and becomes underestimated by about 40% as the instability develops in time. The model only
0 0.5 1 1.5 2−20
0
20
40
60
80
η̇(m
/s)
tr (ms)−2.5 −2 −1.5 −1 −0.5 0 0.5 1−5
0
5
10
tr (ms)
Γ(m
2/s
)

20
predicts the initial baroclinic circulation deposition, so the drop in the magnitude of the circulation as the instability develops in time is not expected to be reproduced by the model. The fact that the amplitude growth rate predicted by the model is higher than that seen in the experiment and simulation suggests that this reduction in circulation could be an important parameter in the amplitude growth rate.

21
5.0 Conclusion The Richtmyer-Meshkov instability after reshock has been investigated using a new experimental technique to resolve the bubble-spike amplitude with a very high temporal resolution. A 1-D circulation based growth rate model has been introduced that reconstructs the velocity field during the shock interaction and estimates a circulation about a half-wavelength by taking a contour integral through this velocity field. This model is shown to agree reasonably well with the growth rates after reshock for experiments of various initial amplitudes. The circulation predicted by this 1-D model is found to be in very good agreement with the circulation extracted from a numerical simulation. The instability growth is measured in much greater spatial and temporal resolution than in laser driven experiments and the data from these experiments can provide a good test case for the hydrodynamic component of ICF and astrophysics codes. The circulation based growth rate model reveals that the initial baroclinic vorticity deposition can be predicted from only 1-D gasdynamics parameters and the amplitude of the perturbation. The successful application of the model to the amplitude growth rate confirms the relationship between circulation and amplitude growth rate.
22
6.0 References
[1] R.D. Richtmyer. Taylor instability in shock acceleration of compressible fluids. Communications on Pure and Applied Mathematics, 13(2):297-319, 1960.
[2] E.E. Meshkov. Instability of the interface of two gases accelerated by a shock wave. Fluid Dynamics, 4(5):101–104, 1969.
[3] B.D. Collins and J.W. Jacobs. Plif flow visualization and measurements of the Richtmyer-Meshkov instability of an air/SF6 interface. Journal of Fluid Mechanics, 464:113-136, 2002.
[4] B.J. Balakumar, G.C. Orlicz, C.D. Tomkins, and K.P. Prestridge. Simultaneous particle-image velocimetry-planar laser-induced fluorescence measurements of Richtmyer-Meshkov instability growth in a gas curtain with and without reshock. Physics of Fluids, 20(12):124103, 2008.
[5] M. Brouillette and B. Sturtevant. Growth induced by multiple shock waves normally incident on plane gaseous interfaces. Physica D, 37(1-3):248–263, 1989.
[6] E. Leinov, G. Malamud, Y. Elbaz, L.A. Levin, G. Ben-Dor, D. Shvarts, and O. Sadot. Experimental and numerical investigation of the Richtmyer-Meshkov instability under re-shock conditions. Journal of Fluid Mechanics, 626:449-475, 2009.
[7] M.H. Anderson, B.P. Puranik, J.G. Oakley, P.W. Brooks, and R. Bonazza. Shock tube investigation of hydrodynamic issues related to inertial confinement fusion. Shock Waves, 10(5):377–387, 2000.
[8] C. Weber, B. Motl, J. Oakley, M.H. Anderson, and R. Bonazza. Richtmyer-Meshkov parameter study. Fusion Science and Technology, 56:460–464, 2009.
[9] A. Melling. Tracer particles and seeding for particle image velocimetry. Measurement Science and Technology, 8(12):1406–1416, 1997.
[10] K.O. Mikaelian. Turbulent mixing generated by Rayleigh-Taylor and Richtmyer-Meshkov instabilities. Physica D: Nonlinear Phenomena, 36(3), 1989.
[11] K.I. Read. Experimental investigation of turbulent mixing by Rayleigh-Taylor instability. Physica D: Nonlinear Phenomena, 12(1-3), 1984.
[12] D.L. Youngs. Numerical simulation of turbulent mixing by Rayleigh-Taylor instability. Physica D: Nonlinear Phenomena, 12(1-3), 1984.
[13] O. Schilling, M. Latini, and W.S. Don. Physics of reshock and mixing in single-mode Richtmyer-Meshkov instability. Physical Review E, 76(2):26319, 2007.
[14] J.W. Jacobs and J.M. Sheeley. Experimental study of incompressible Richtmyer–Meshkov instability. Physics of Fluids, 8:405, 1996.

23
Distribution 1 Chris Weber University of Wisconsin-Madison 1500 Engineering Drive Madison, WI 53706 1 Riccardo Bonazza University of Wisconsin-Madison 1500 Engineering Drive Madison, WI 53706 1 Mark Anderson University of Wisconsin-Madison 1500 Engineering Drive Madison, WI 53706 1 0747 Ben Cipiti, 6774 1 0378 Randy Summers, 1431 1 1136 Gary Rochau, 6771 1 9018 Central Technical Files, 8944 1 0899 Technical Library, 9536 (1 electronic copy)