Richard Palmer Michael Miller University of Washington Department of Civil and Environmental...
40
Richard Palmer Michael Miller University of Washington Department of Civil and Environmental Engineering and and Allocation Allocation Issues Issues in the Puget in the Puget Sound Sound
-
date post
19-Dec-2015 -
Category
Documents
-
view
213 -
download
0
Transcript of Richard Palmer Michael Miller University of Washington Department of Civil and Environmental...

Richard PalmerMichael Miller
University of Washington
Department of Civil and Environmental Engineering
Water Supply and Water Supply and Allocation Issues Allocation Issues
in the Puget in the Puget SoundSound
Objective and Outline
• What will be the climate and hydrology of the Puget Sound in 2020/2040 and what are the impacts of climate change on water supply issues?
• How can mid-term forecasts improve management of water supplies for people and fish?


Objective and Outline
• What will be the climate and hydrology of the Puget Sound in 2020/2040 and what are the impacts of climate change on water supply issues?
• How can mid-term forecasts improve management of water supplies for people and fish?

Puget Sound Region Demand Projections
50
100
150
200
250
300
350
400
450
500
550
Demand Year
King County WA
Pierce County, WA
Snohomish County, WA
Total Three County Demand

Current state of climate modeling
• Climate models are currently capable of credibly simulating present climate at the continental scale.
• Models are continually improving, yet key physical relationships remain poorly understood, the water vapor/cloud formation and feedback process being the most significant.
• Greater resolution and more complex parameterization of physical processes will continue as computing power increases and study continues.
• Models are not predictions of future, but can be considered as credible simulations of a multitude of possible futures.

GCMs - General Circulation Models
• IPCC discusses 34 GCMs• Coupled Model Intercomparison Study
examines 29 in more detail– Compares GCMs via historical observations for air
temperature, precipitation, sea temperature, air pressure, ice extent.
• We have selected nine of the more prominent models to demonstrate GCM selection process

Model Developed by Reference
CCSR/NIES2 Center for Climate System Research, University of Tokyo/National Institute for Environmental Studies
Emori et al, 1999
CGCM2 Canadian Centre of Climate Modelling and Analysis
Flato and Boer, 2001
CSIRO mk2 Commonwealth Scientific & Industrial Research Organisation
Gordon and O’Farrell, 1997
CSM1.3 * NCAR – National Center for Atmospheric Research
Boville et al., 2001
DOE PCM NCAR , US Department of Energy, Los Alamos, Naval Post Graduate Program, and US Army Corps of Engineers.
Washington et al., 2000
ECHAM4 Netherlands center for Climate Research - and Max Planck Institute (MPI)
Roeckner et al., 1996
GFDL_R30 Geophysical Fluid Dynamics Laboratory (GFDL) & NOAA
Knutson et al., 1999
HadCM3 Hadley Centre for Climate Prediction and Research
Gordon et al., 2000
MRI2 Meteorological Research Institute (Numerical prediction Division)
Yukimoto et al., 2000

Evaluation of Climate Change
Climate Shift
Meteorological Data
Hydrology Model
Demand Model
Operations Model

Precipitation will increase in the winter and decrease in the summer.
Temperatures will increase by 2° C by
2040, with higher temperatures in the
summer
Precipitation Fraction forClimate Change Scenarios
0.8
0.85
0.9
0.95
1
1.05
1.1
1.15
1.2
Oct Nov Dec Jan Feb Mar Apr May Jun Jul Aug Sep
Fra
ctio
n P
reci
pita
tion
2020 Climate Change
2040 Climate Change
Temperature Changefor Climate Change Scenarios
0
0.5
1
1.5
2
2.5
3
3.5
4
Oct Nov Dec Jan Feb Mar Apr May Jun Jul Aug SepD
egre
es C
2020 Climate Change
2040 Climate Change

DHSVMDistributed Hydrology-Soil-Vegetation Model
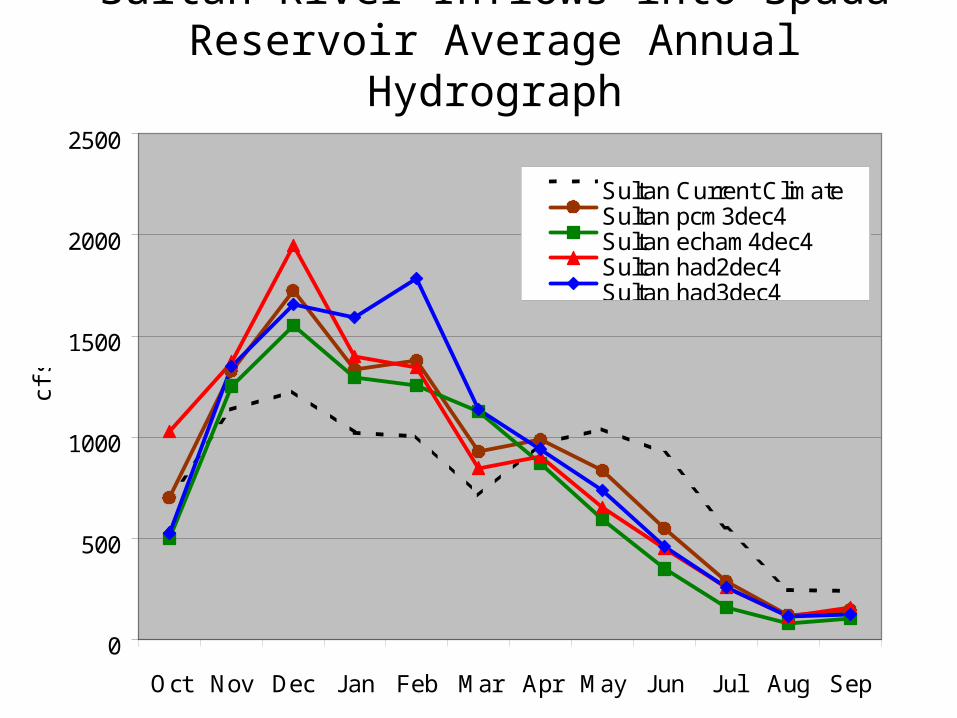
Sultan River Inflows into Spada Reservoir Average Annual Hydrograph
0
500
1000
1500
2000
2500
Oct Nov Dec Jan Feb Mar Apr May Jun Jul Aug Sep
cfs
Sultan Current ClimateSultan pcm3dec4Sultan echam4dec4Sultan had2dec4Sultan had3dec4

0
50
100
150
200
250
300
Oct Nov Dec Jan Feb Mar Apr May Jun Jul Aug Sep
cfs
Tolt Current ClimateTolt pcm3dec4Tolt echam4dec4Tolt had2dec4Tolt had3dec4
Tolt River Inflows into Tolt Reservoir Average Annual Hydrograph
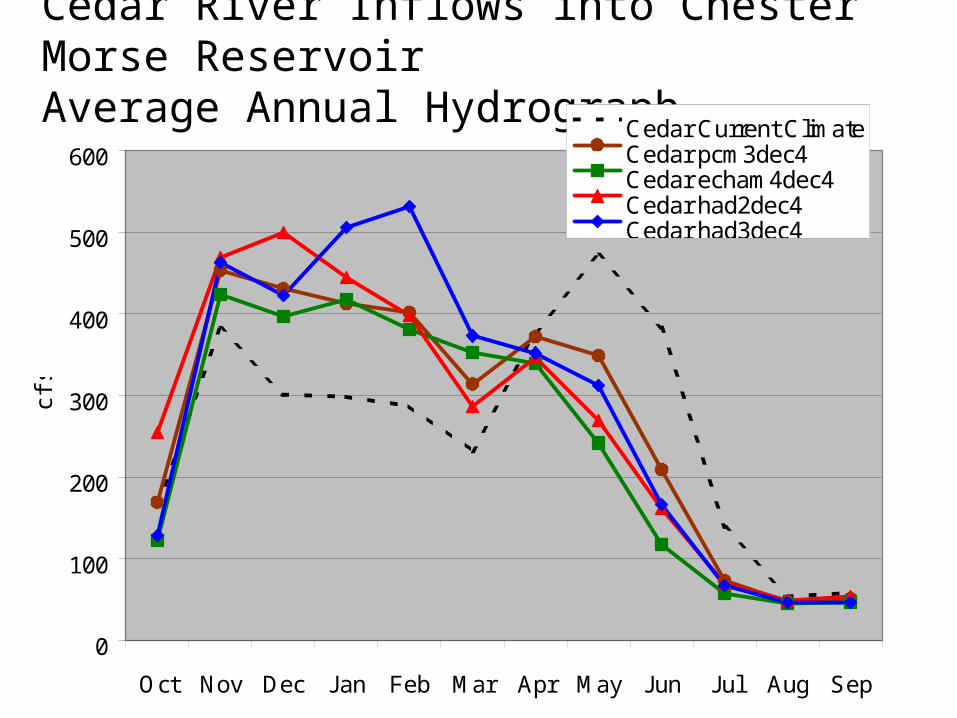
Cedar River Inflows into Chester Morse Reservoir Average Annual Hydrograph
0
100
200
300
400
500
600
Oct Nov Dec Jan Feb Mar Apr May Jun Jul Aug Sep
cfs
Cedar Current ClimateCedar pcm3dec4Cedar echam4dec4Cedar had2dec4Cedar had3dec4

Green River Inflows into Howard Hansen Reservoir Average Annual Hydrograph
0
500
1000
1500
2000
2500
Oct Nov Dec Jan Feb Mar Apr May Jun Jul Aug Sep
cfs
Green Current ClimateGreen pcm3dec4Green echam4dec4Green had2dec4Green had3dec4

Ranked Cumulative Winter Flow (JFM) 2040
32%
0
5000
10000
15000
20000
25000
30000
35000
0 0.2 0.4 0.6 0.8 1
Sultan Current ClimateSultan pcm3dec4Sultan echam4dec4Sultan had2dec4Sultan had3dec4
43%
cfs-weeks

Ranked Cumulative Spring (AMJ) Flow 2040
0
5000
10000
15000
20000
25000
0 0.2 0.4 0.6 0.8 1
Sultan Current ClimateSultan pcm3dec4Sultan echam4dec4Sultan had2dec4Sultan had3dec4
-30%
cfs-weeks

Results – Impacts on HydrologyPercent difference from current climate
cumulative seasonal flows
JFM AMJ JFM AMJMean
Absolute Percent
Difference2020 2020 2040 2040
Sultan 32 -18 43 -30 31
Tolt 16 -16 20 -21 18
Cedar 36 -23 49 -36 36
Green 28 -25 37 -37 32
Average 28 -20 37 -31

Conclusions• Climate impacts on the four basins’ hydrology are similar • Average percent difference in seasonal flows
– 2020 Winter : 28% 2020 Spring : -20%– 2040 Winter : 37% 2040 Spring : -31%
• Absolute average percent difference– Sultan : 31%– Tolt : 18%– Cedar : 36%– Green : 32%
• Average supply system impact is 15-17% increase in System Use (surface storage, groundwater and/or system shortfalls)

Climate Impact on Water Supply
Average climate impact on Supply Used, Percent Difference from Current Climate
Basin Max Min Avg
Sultan 37 0 15
Cedar/Tolt 32 12 17
Green 28 2 16
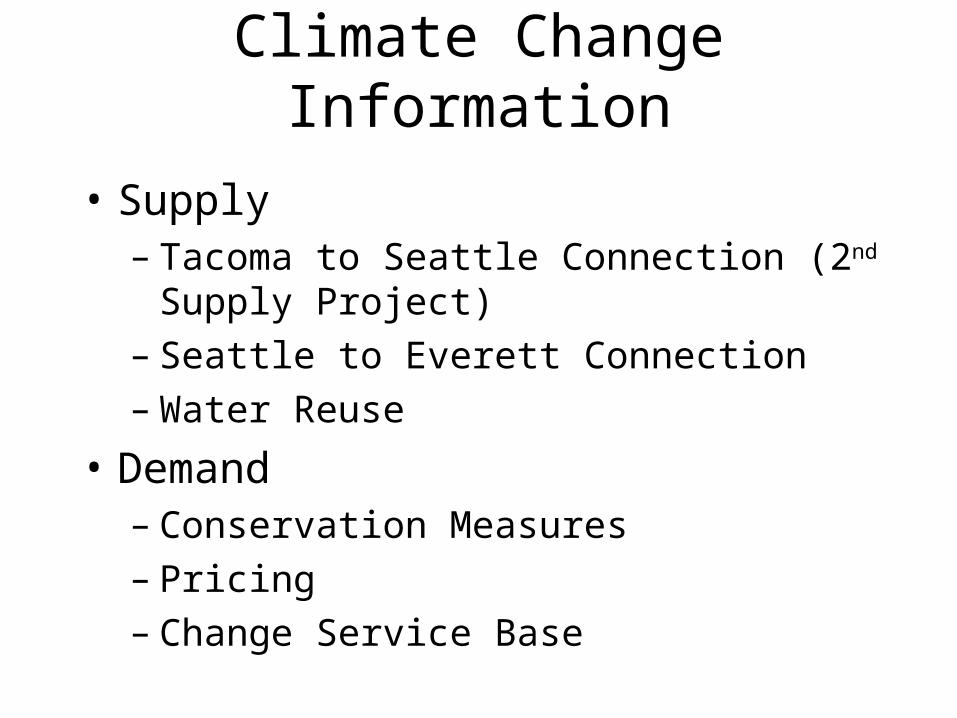
Possible Reactions to Climate Change Information
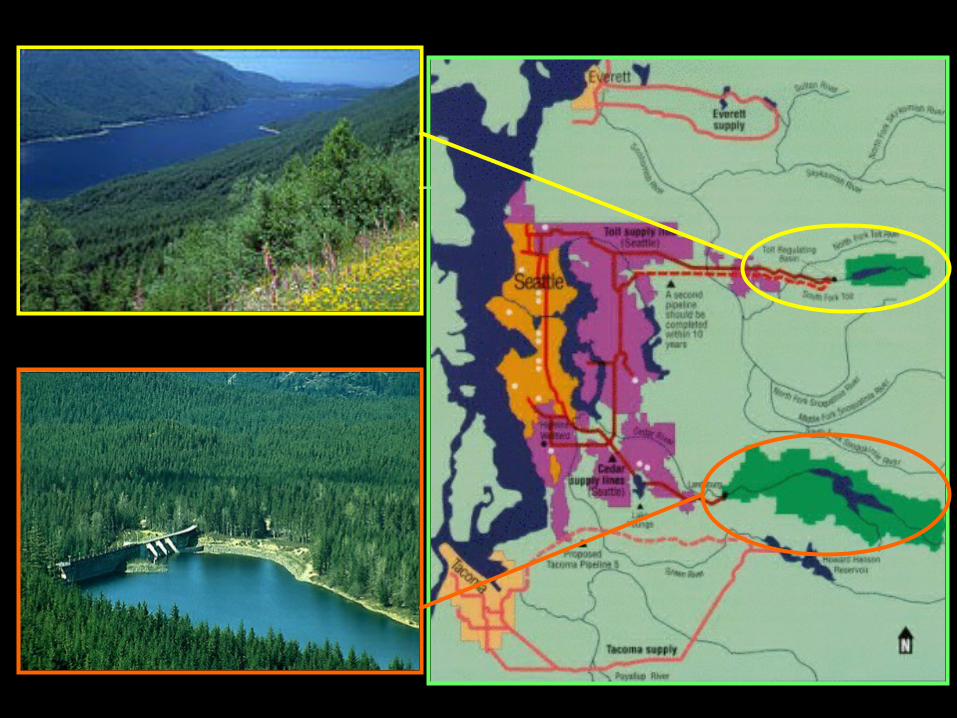
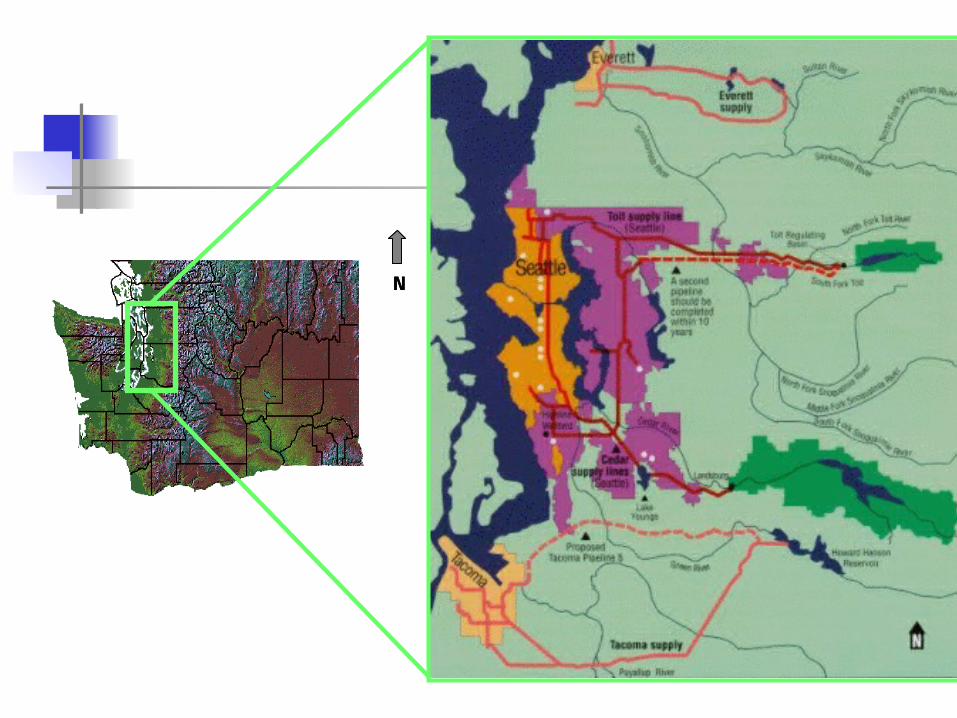
• Supply – Tacoma to Seattle Connection (2nd Supply Project) – Seattle to Everett Connection– Water Reuse
• Demand– Conservation Measures– Pricing – Change Service Base

Objective and Outline
• What will be the climate and hydrology of the Puget Sound in 2020/2040 and what are the impacts of climate change on water supply issues?
• How can mid-term forecasts improve management of water supplies for people and fish?
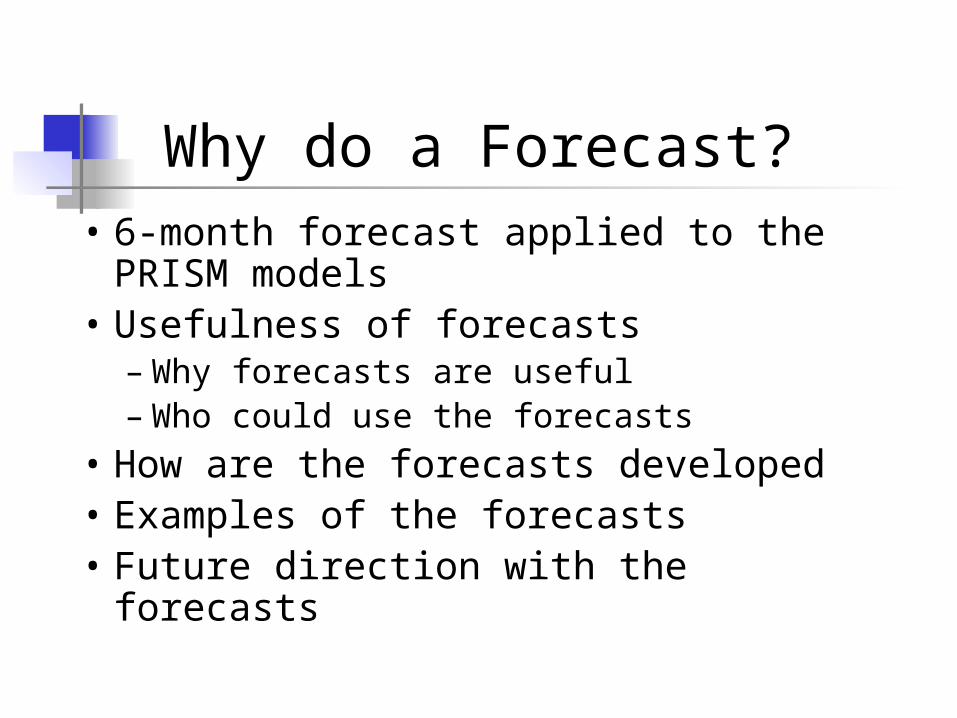
Why do a Forecast?• 6-month forecast applied to the PRISM
models• Usefulness of forecasts
– Why forecasts are useful– Who could use the forecasts
• How are the forecasts developed• Examples of the forecasts• Future direction with the forecasts
TSI
Auburn
Renton
N
TSI
Auburn
Renton
N

Applying 6-month Forecast• Prior to a forecast
– Water management decisions• 50 years of meteorological records
• 73 years water supply and demand records
• With a forecast – Water management decisions based on potential future
conditions
• Forecast continue using DHSVM and CRYSTAL for water supply and management

PRISM
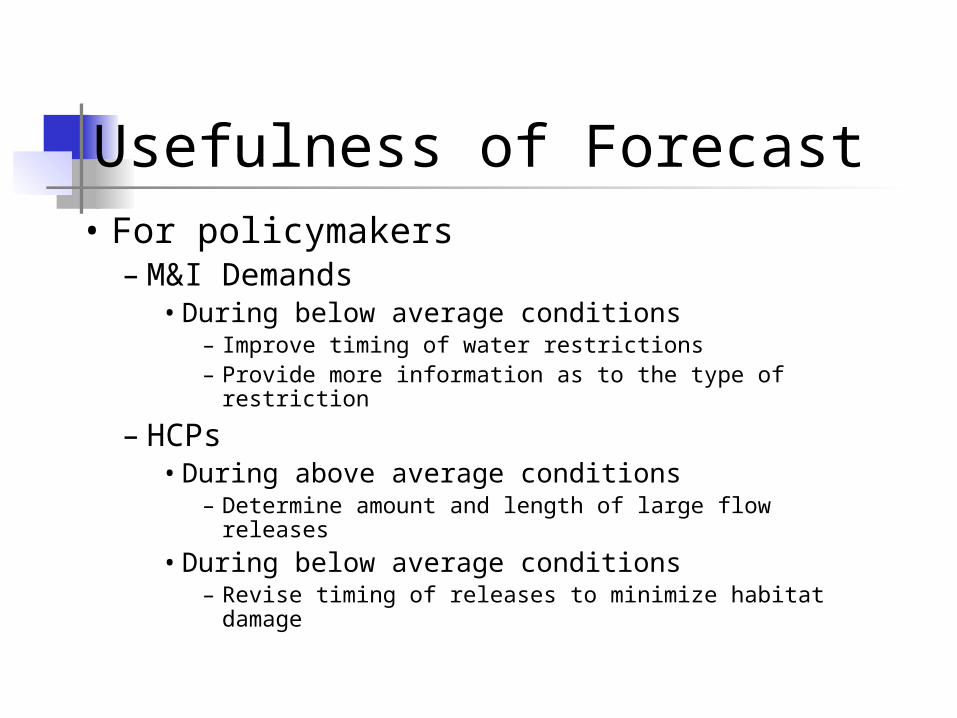
Usefulness of Forecast• For policymakers
– M&I Demands• During below average conditions
– Improve timing of water restrictions– Provide more information as to the type of restriction
– HCPs• During above average conditions
– Determine amount and length of large flow releases
• During below average conditions– Revise timing of releases to minimize habitat damage

Usefulness of the Forecast• For water managers
– During average and above average flow • Forecast potential of these resources• Discharge necessary to meet future flood control
– During below average flows • Forecast initial drought conditions a couple months
sooner• In the early summer months, forecasts could
indicate when fall and winter flows will increase

Forecast Development
• Developed by Andy Wood,
Edwin Maurer, Arun Kumar, and
Dennis Lettenmaier
• NCEP Data – Bias Correction– Downscaling
• DHSVM

NCEP Data• National Center for Environmental Prediction
(NCEP)– Global Spectral Models (GSMs)
– Hindcasts• Temperature and precipitation
• 10 initial conditions
• 21 years (79 – 99)
– Forecasts • 20 ensembles
• 6-month forecast
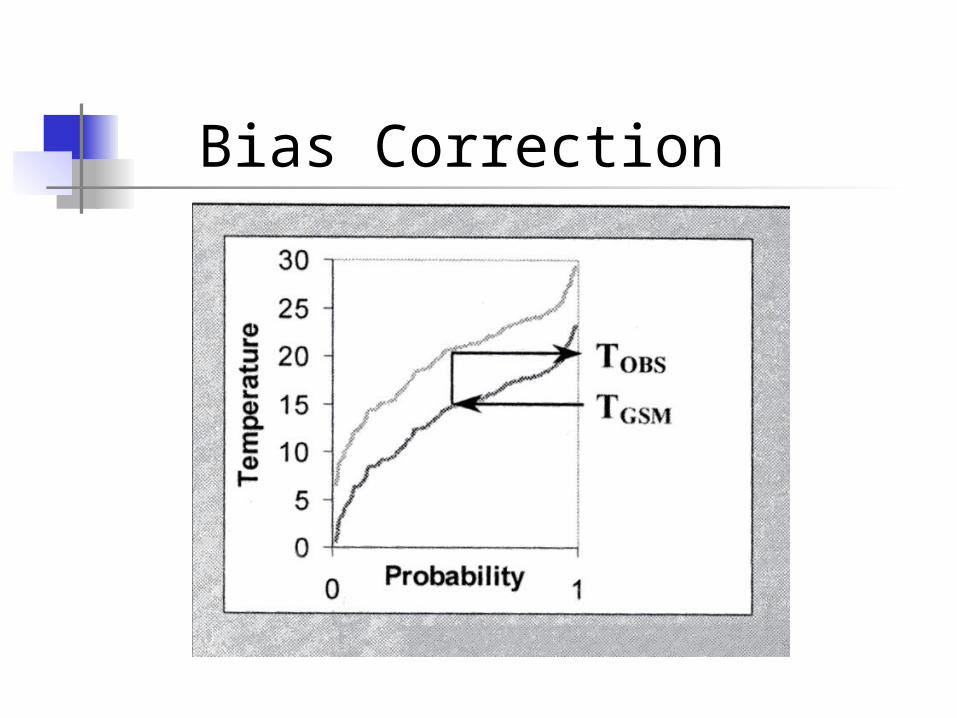
Bias Correction

Downscaling
• Forecasted meteorological data – Based on month from the historic 21-year
record (79-99), most similar precipitation– Precipitation is scaled (multiplicative process)– Temperature is shifted (additive process)
• Preformed to each month of each ensemble
DHSVM
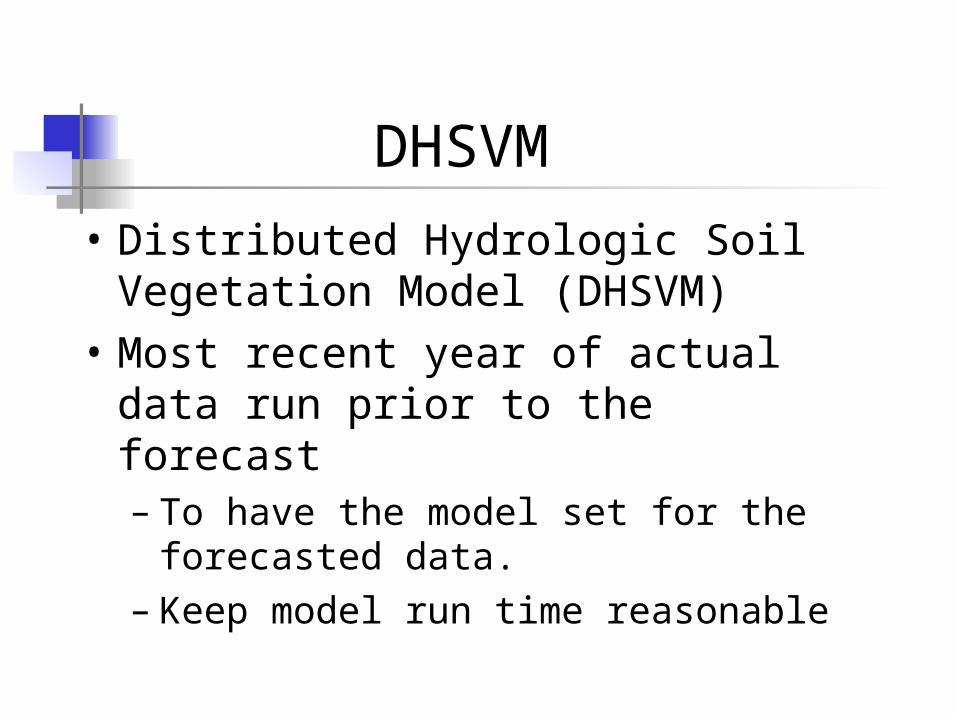
• Distributed Hydrologic Soil Vegetation Model (DHSVM)
• Most recent year of actual data run prior to the forecast– To have the model set for the forecasted data.– Keep model run time reasonable

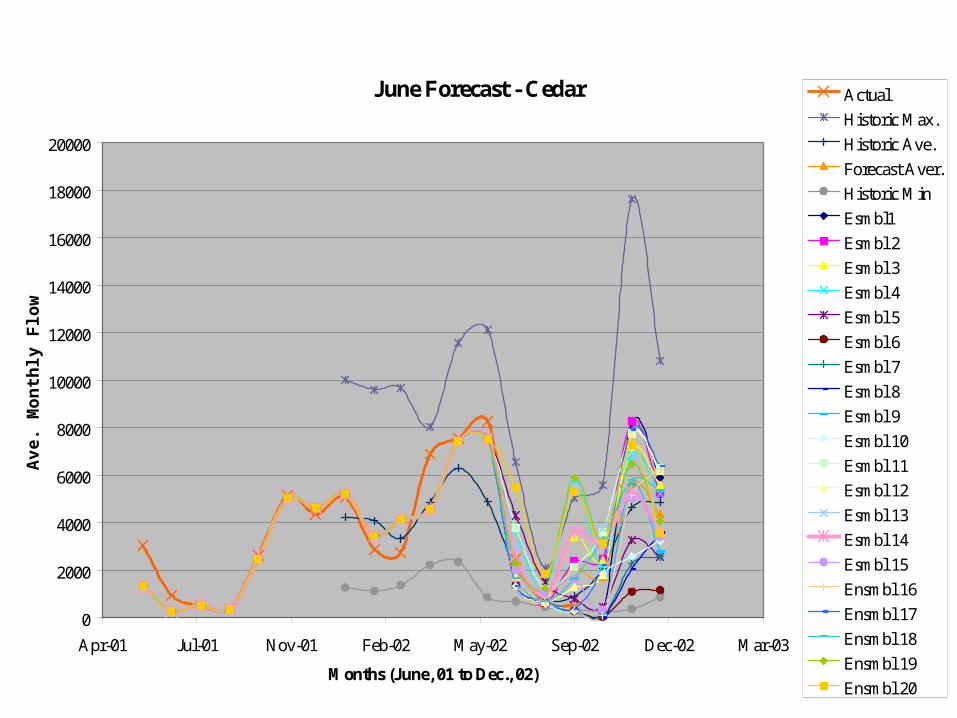
DHSVM Output
• 20 forecasts of stream flow
• Forecasts are compared to historic average flows
• Comparison used to forecast higher or lower then average flow.
June Forecast – Cedar
June Forecast - Cedar
0
2000
4000
6000
8000
10000
12000
14000
16000
18000
20000
Apr-01 Jul-01 Nov-01 Feb-02 May-02 Sep-02 Dec-02 Mar-03
Months (June, 01 to Dec., 02)
Ave
. M
onth
ly F
low
(af
w)
Actual
Historic Max.
Historic Ave.
Forecast Aver.
Historic Min
Esmbl1
Esmbl 2
Esmbl 3
Esmbl 4
Esmbl 5
Esmbl 6
Esmbl 7
Esmbl 8
Esmbl 9
Esmbl 10
Esmbl 11
Esmbl 12
Esmbl 13
Esmbl 14
Esmbl 15
Ensmbl 16
Ensmbl 17
Ensmbl 18
Ensmbl 19
Ensmbl 20

June Forecast - Cedar
0
2000
4000
6000
8000
10000
12000
14000
16000
18000
20000
Apr-01 Jul-01 Nov-01 Feb-02 May-02 Sep-02 Dec-02 Mar-03
Months
Ave
. M
onth
ly F
low
(af
w)
Forecast Aver.
Actual
Historic Max.
Historic Min
Historic Ave.
Forecast Start

Summary
• Climate Change – Initial results suggest significant impacts on
water supply– Lower summer flows will challenge releases for
both fish and folks– New management strategies are necessary– Future planning should include this impact

Summary on Forecasting
• Forecasting with longer-range climate indicators offers promise
Past forecasts did not provide sufficient lead time for certain times of year
• Will have on line forecasts this quarter