Richard Deiss Mobility in higher education€¦ · Richard Deiss Mobility in higher education...
20
1 International conference on learning mobility in higher education Prague 6-7 October 2011 Richard Deiss Mobility in higher education Evidence from Eurostat, Eurobarometer and other sources
Transcript of Richard Deiss Mobility in higher education€¦ · Richard Deiss Mobility in higher education...

1
International conference on learning mobility in higher education
Prague 6-7 October 2011
Richard Deiss
Mobility in higher education Evidence from Eurostat, Eurobarometer and other
sources

2
19. Mobility in history – programme namegivers
Comenius
1592-1670
"
"
"
"
"
"
$
$
""
$$
$
$
" "
Erasmus
1466-1536
Grundtvig
1783-1872
Leonardo
1452-1519
1505: 7% of students in Germany from
outside the German Empire, Leiden
1575-1700: 45% foreigners, 1600: 80%
of Swedish students study abroad
Marie Curie
1867-1934

18. Higher education-worldwide growth
0
20
40
60
80
100
120
140
160
180
1900 1910 1920 1930 1940 1950 1960 1970 1980 1990 2000 2008
World tertiary student population 1900-2008
World
EU 27
1900
EU 0.2
USA 0.16
0.5 one in 3300
1950:
USA: 2.7
EU 1.0
China 0.1
2008:
China 26.7
EU 19.0
USA 18.2
India 14.2
159,
one in
43
2000: 2.1 million students study abroad, 2.0% of all students (1980: 1.1 million, 2.2%, 1990 1.3 m, 1.9%)
2009: 3.7 million tertiary students study abroad, ca. 2.2% of students
Before 1800: less
than 50 000
students in Europe

4
Tertiary students in EU27 (Million)
15
15,5
16
16,5
17
17,5
18
18,5
19
19,5
20
2000 2001 2002 2003 2004 2005 2006 2007 2008 2009
Tertairy attainment 30-34 y olds, EU 27
20
22
24
26
28
30
32
34
36
2000
2001
2002
2003
2004
2005
2006
2007
2008
2009
2010
Years
%
Education headline targets in EU 2020 Strategy
Tertiary attainment (30-34 year olds) to reach 40%
Early school leavers (18-24) to be reduced to 10%
17. Europe 2020 education headline targets
5
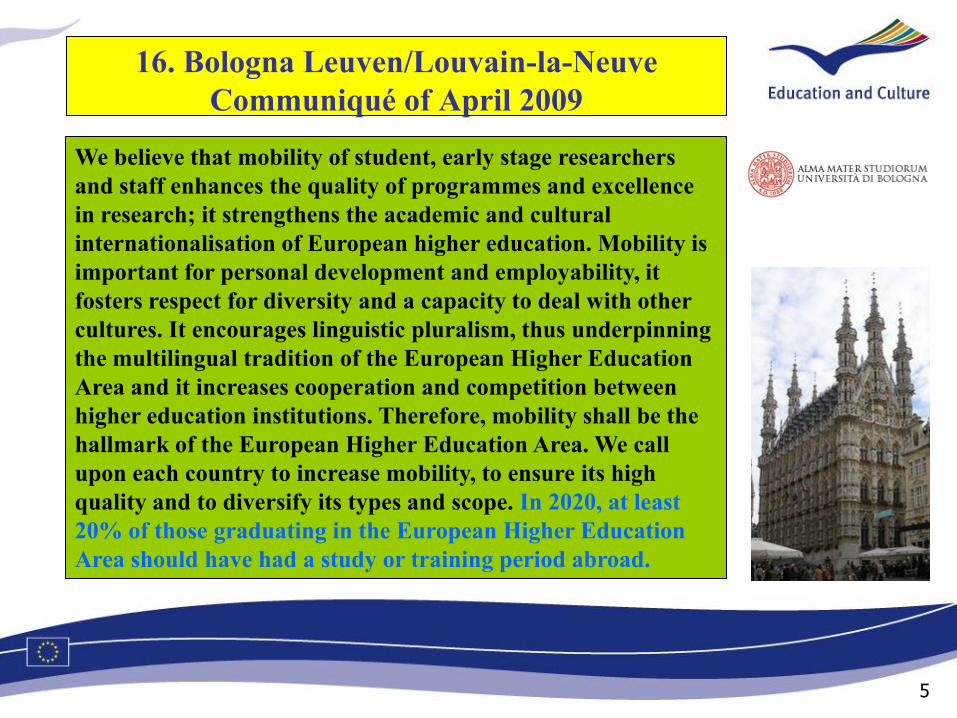
16. Bologna Leuven/Louvain-la-Neuve
Communiqué of April 2009
We believe that mobility of student, early stage researchers
and staff enhances the quality of programmes and excellence
in research; it strengthens the academic and cultural
internationalisation of European higher education. Mobility is
important for personal development and employability, it
fosters respect for diversity and a capacity to deal with other
cultures. It encourages linguistic pluralism, thus underpinning
the multilingual tradition of the European Higher Education
Area and it increases cooperation and competition between
higher education institutions. Therefore, mobility shall be the
hallmark of the European Higher Education Area. We call
upon each country to increase mobility, to ensure its high
quality and to diversify its types and scope. In 2020, at least
20% of those graduating in the European Higher Education
Area should have had a study or training period abroad.
6
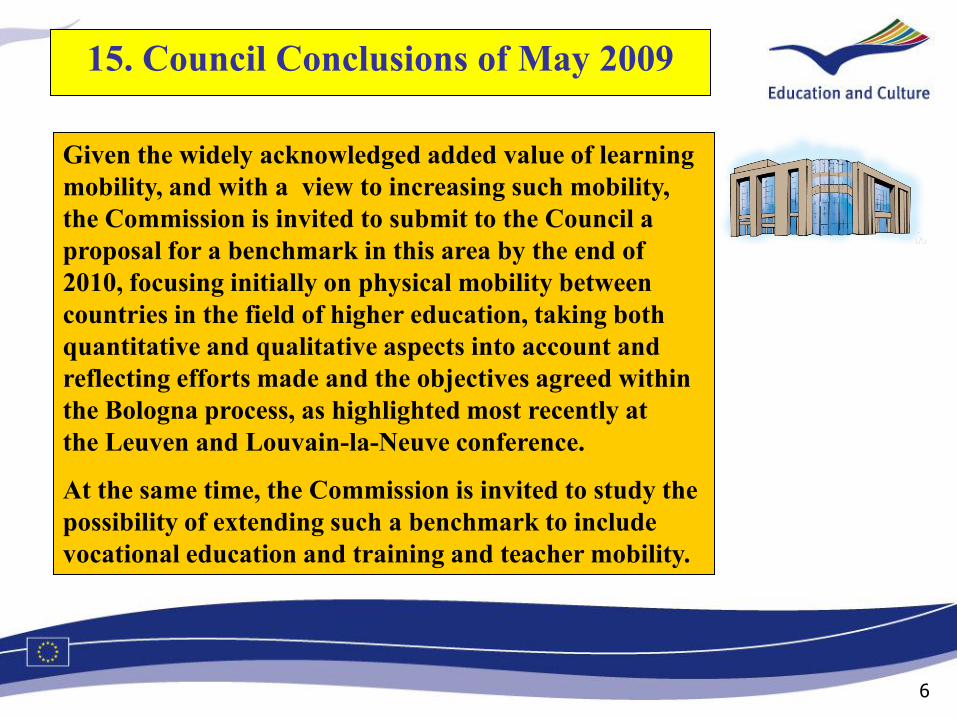
15. Council Conclusions of May 2009
Given the widely acknowledged added value of learning
mobility, and with a view to increasing such mobility,
the Commission is invited to submit to the Council a
proposal for a benchmark in this area by the end of
2010, focusing initially on physical mobility between
countries in the field of higher education, taking both
quantitative and qualitative aspects into account and
reflecting efforts made and the objectives agreed within
the Bologna process, as highlighted most recently at
the Leuven and Louvain-la-Neuve conference.
At the same time, the Commission is invited to study the
possibility of extending such a benchmark to include
vocational education and training and teacher mobility.

14.Commission mobility benchmark proposal
In 2020, at least 20% of EU graduates from higher
education should have had a study or training period
abroad.
Mobility is defined as physical, not virtual, mobility.
Worldwide mobility of EU graduates would be taken
into account and it would include both short term
(credit) and long term (degree) mobility in all tertiary
cycles. The minimum duration should be in line with the
Erasmus definition of mobility i.e. minimum of 3 months
(2 months minimum for placements organised by so-
called short cycle higher education institutions) or
alternatively mobility resulting in at least 15 ECTS
credits.
Proposal in May 2011 Staff Working Document
Currently being discussed in the Education Committee of the Council
Council Conclusions expected for November 2011

8
13. Data, indicators and benchmarks
Data Data
Indicators Combination of data sets
Data
production
(statistics)
Indicator
identification
(policy experts)
Benchmarks
(policy decision
makers)
Benchmarks Combination indicators +targets
Normal process: building indicators on available
data and benchmarks on available indicators.

Graph Rule Graph Rule useful
Precision
harmful
Precision The more precise the data the
more useful they are.
Data should be at least precise
enough to mirror trends over time
correctly. If data do not show the
direction of change correctly, they
can be even harmful.
Usefulness of data
Units covered
Comprehensiveness The better the coverage of
data the more useful they are.
In the EU context data should
cover as many countries as
possible, at least the large
majority of Member States.
Usefulness of data
Time since survey
Freshness The fresher the data the more
useful they are.
The importance of freshness
depends on the speed of change in
what the data measure.
Usefulness of data
Comparability
Comparability The more comparable the
data the more useful they are.
Data should ideally be comp-
arable between countries and
over time. However, harmo-
nisation can sometimes imply
breaks in series.
needed
available
Known
used
-Underlying data: to be precise, timely, comparable, comprehensive
-Analytical soundness, relevance, elasticity (malleability)
12. Quality criteria
Data needs and use Quality criteria for data
Quality criteria for indicators
(They) use statistics as a drunken man uses lamp posts- for support rather than for illumination. B. Disraeli

11. Mobility measurement- some basic rules
Mobility level found
Minimum duration of mobility
Cumulative mobility
Age
Perception of being mobile
Duration of stay Duration of stay
Difficulty to measure mobility
Mobility level found
Scope of definition
Mobility level
Precision of statistics
If you want to measure change, don’t change the measure. Al Beaton

11
10. Data sources
Data set Data available Data developments
Eurostat
(UOE)
Long term mobility students
(UOE), outgoing, incoming
Data on Data on credit (short
term) mobility in preparation
Eurostat
(UOE)
Mobility of graduates (mostly
on foreign graduates, not
Data on mobile graduates
being improved
DG EAC
(Erasmus)
Short term mobility
(students)
Eurydice Qualitative information on
education systems
Mobility publication in
preparation
Eurobarometer One off survey (2011) on
youth mobility
Eurostudent 3-yearly data on student
mobility
Eurostudent V (2012-15) in
preparation
For Eurydice reports, see also: http://eacea.ec.europa.eu/education/eurydice/index_en.php
12
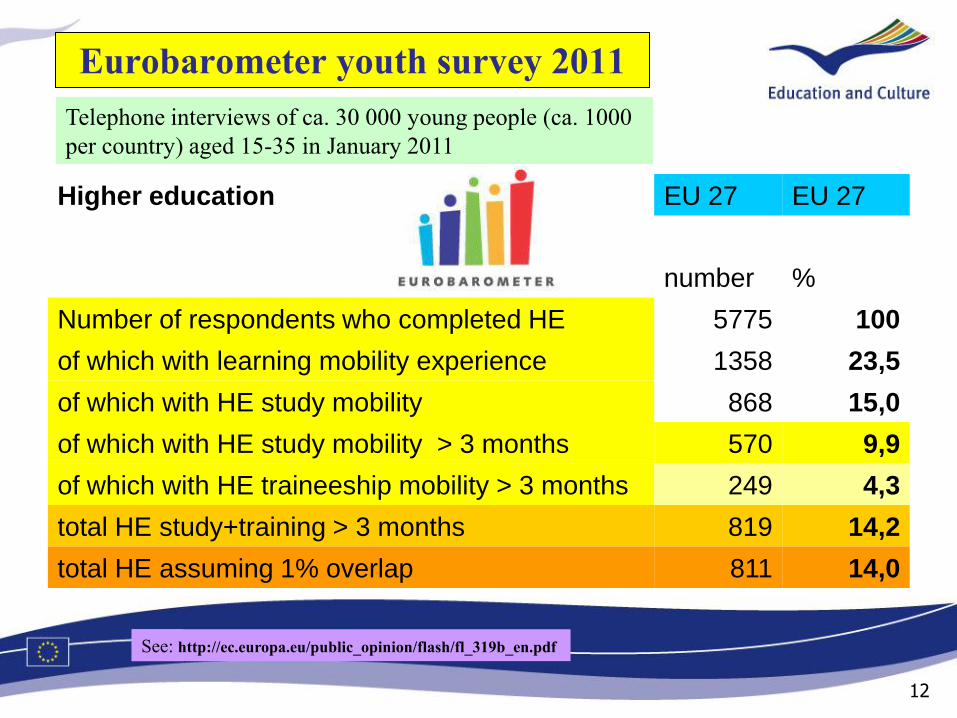
Eurobarometer youth survey 2011
Higher education EU 27 EU 27
number %
Number of respondents who completed HE 5775 100
of which with learning mobility experience 1358 23,5
of which with HE study mobility 868 15,0
of which with HE study mobility > 3 months 570 9,9
of which with HE traineeship mobility > 3 months 249 4,3
total HE study+training > 3 months 819 14,2
total HE assuming 1% overlap 811 14,0
Telephone interviews of ca. 30 000 young people (ca. 1000
per country) aged 15-35 in January 2011
See: See: http://ec.europa.eu/public_opinion/flash/fl_319b_en.pdf

13
Outward mobility of Erasmus students, 2008/09
(students sent per 100 students)
8. Erasmus mobility
About 0.8% of EU students
participate in Erasmus in a given
year,
over a 5 year period 4% of
students affected
highest participation rate: LU
(14.1%,) lowest UK (0.3%)
highest incoming rate: Malta
(3.7%), lowest: Romania,
Bulgaria (0.1%)
net receivers: Nordic
countries, English speaking
countries (UK, IRL, MT), Spain,
Portugal, Cyprus, NL
See: http://ec.europa.eu/education/erasmus/doc/stat/table1.pdf

14
1987/88 99/00 04/05 07/08 08/09 2009/10 Total
EU-27 3 244 106 418 141 391 155078 159750 168 048 1 818 779
Turkey, Croatia - - 1142 6274 6920 8251 29 877
IS, FL, NO - 1248 1504 1343 1523 1496 22 513
Total
(EU-27 + EEA + CC ) 3 244 107 666 144 037 162 695 168 193 177 705 2 195 271
Placements EU-27 - - - 19 085 29 349 34 709 83 143
Total incl. placements 3 244 107 666 144 037 182 697 198 523 213 266 2 278 414
7. EU programme data (Erasmus)
October 2002: 1 millionth Erasmus student, October 2009: 2 millionth Erasmus student,
Goal of 3 million Erasmus students in 2012

6. Eurostat data: incoming long term mobility
0
5
10
15
20
25
30
<1 1-4.9 5-9.9 10-19.9 20-49.9 50+
Foreign students Mobile students
Share in %
Size of country (population, m)
Data on incoming
mobility better than on
outgoing
Incoming mobility
growing (2000: 5% of
students, 2008: 7.8% of
students)
More data on foreign
students than on mobile
students (past: only
citizenship data)
Incoming mobility
high in small and in
large countries
See: http://epp.eurostat.ec.europa.eu/portal/page/portal/education/data/database

5. Eurostat data: incoming students
2000 2007 2008 2009
Total 788.5 1430.2 1467.4 1554.1
Europe 384.4 599.6 608.1 653.3
- EU 27 316.4 479.2 487.8
- other Europe 68.0 120.4 120.3
- of which Russia 12.5 29.6 30.2 33.0
Africa 134.2 246.0 241.7 252.9
Morocco 38.2 46.3 44.2 44.8
Algeria 14.9 21.8 20.3 20.8
Nigeria 3.5 22.0 23.3 27.5
Asia 183.0 405.5 413.5 459.3
China 18.6 117.5 115.8 123.6
India 6.6 39.3 43.1 53.9
Japan 10.7 12.4 10.5 10.3
America 63.1 121.6 124.3 141.1
USA 22.7 32.2 30.8 32.1
Canada 5.8 10.8 10.8 11.5
Brazil 6.8 12.9 14.6 17.6
Oceania 2.9 7.7 7.1 7.1
Australia 2.1 5.6 5.2 5.2
Unknown nat. 20.9 49.8 64.3 34.3
2009: 1.5 million
foreign students in the
EU, of which 0.5
million from other EU,
0.9 million from outside
Europe
Asia and Africa
largest continents of
origin
Number of Chinese
students grew by a
factor of 7 since 2000
Number of Indian
students grew by a
factor of 6 since 2000
Over 40% of world
mobile students go to
the EU

4. Eurostat data: outbound long term mobility
Eurostat outgoing
mobility data based on
incoming mobility
statistics of host
countries
Only long term
mobility (> 1 year) and
mobility to other EU,
Candidate, EEA
countries covered
Growth from 2.1% of
students in 2000 to
2.8% in 2008
Highest level:
Luxembourg (80%),
Cyprus (58%), lowest:
UK (0.6%)
Outbound mobility declines with country size
18
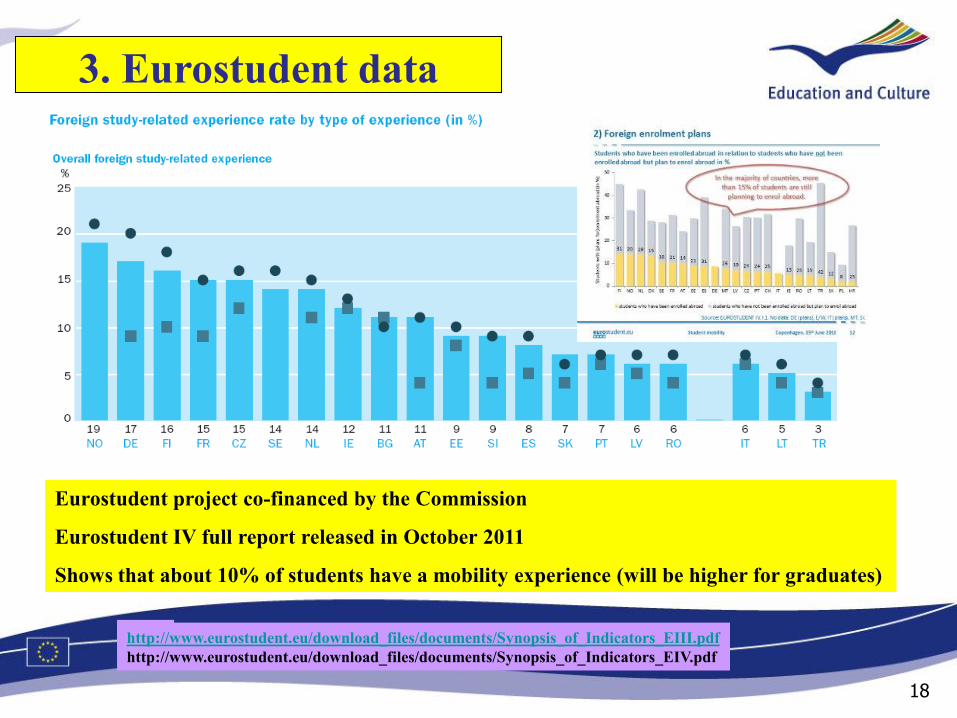
3. Eurostudent data
Eurostudent project co-financed by the Commission
Eurostudent IV full report released in October 2011
Shows that about 10% of students have a mobility experience (will be higher for graduates)
See: http://www.eurostudent.eu/download_files/documents/Synopsis_of_Indicators_EIII.pdf
http://www.eurostudent.eu/download_files/documents/Synopsis_of_Indicators_EIV.pdf

19
2. Outlook 2011-2020
Mobility benchmarks adopted by Council (Education) end of November 2011
New benchmarks on employability and language skills expected for 2012
New EU programme generation: 2014-2020
EU enlargement (Croatia): 2013
Bologna goals 2020: reporting 2012, 2015, 2018
Eurostat improved administrative data collection on mobility: 2014
New Eurostat mobility data (household survey): 2015
Implementation of ISCED 2011

20 20
Thank you for your attention !
For the Commissions’ progress report (mobility section) see also:
http://ec.europa.eu/education/lifelong-learning-policy/doc/report10/chapter1_en.pdf


![[WMD2016] Digital Marketer >> Ryan Deiss "Automate your ideal sales convo"](https://static.fdocuments.net/doc/165x107/58f9b3da760da3da068bda3c/wmd2016-digital-marketer-ryan-deiss-automate-your-ideal-sales-convo-58f9b4125c605.jpg)