Valuation: Packet 2 Relative Valuation, Asset-based valuation and Private Company Valuation

Improving the Valuation of Large Commercial Properties
for Real Estate Tax Purposes
Richard Almy © 2006
Lincoln Institute of Land Policy Working Paper
The findings and conclusions of this paper are not subject to detailed review and do not necessarily reflect the official views and policies of the Lincoln Institute of Land Policy.
Please do not photocopy without permission of the author.
Contact the author directly with all questions or requests for permission.
Lincoln Institute Product Code: WP06RA1

Abstract
The aims of this project are to examine systematically methods for valuing large office buildings for property tax purposes, identify issues, evaluate their seriousness, and describe potential solutions for consideration by the profession. The prices of recently sold prominent office buildings often are greater than their appraised values, leading to fears that commercial properties generally are undervalued relative to residential properties. Evidence of trends in residential and commercial property prices is examined. The practices used to value office properties in five selected assessment jurisdictions are examined in detail, and they are evaluated relative to applicable professional standards.

About the Author Richard Almy is a partner in Almy, Gloudemans, Jacobs & Denne, a small firm that provides consulting services in mass valuation and property tax administration to governments and related organizations internationally. He formerly was research director and executive director of the International Association of Assessing Officers. He began his career as an appraiser with the Detroit Board of Assessors.
6230 South Peck Avenue, La Grange, Illinois 60525 • +708 354 8265 • [email protected]

Table of Contents
Introduction 1 Issues 1 Approach 2 Trends in the Value of Residential and Non-Residential Property 4 Data Sources and Research 5 Conclusions 9 Analysis of Valuation Practices: A Search for Best Practices 11 Overview of Commercial Property Assessment Systems 11 Management and Quality Assurance 18 Property Characteristic Data 26 Applying the Income Approach 30 Applying the Sales Comparison Approach 40 Applying the Cost Approach 41 Value Review and Reconciliation 42
Documentation and Reporting 42 Appeal System 43
Conclusions and Recommendations 45 References 47 Appendices 50

1
Improving the Valuation of Large Commercial Properties for Real Estate Tax Purposes
Introduction
This study is an outgrowth of an earlier study of the valuation of commercial property in Cook County, Illinois (Dye, Almy and Crane 2003). The impetus for that study was a concern of taxing authorities that several recent rulings by the Illinois Property Tax Appeal Board (PTAB) would significantly degrade the total assessed valuation of non-residential property under the County’s classified property tax system.1 At the same time, some taxing officials were concerned that many major non-residential properties were, in fact, under-valued. In examining how commercial properties were valued in Cook County for property tax purposes, practices in other jurisdictions were considered. It became clear that some of the concerns raised were not confined to Chicago. The aim of the current project is to examine standards and methods for valuing these properties systematically, identify issues, evaluate their seriousness, and describe best practices and potential solutions for consideration by the profession. The hope is that a better analysis of the valuation problem will lead to more useful standards and will alleviate the concerns of various stakeholders, including valuation professionals. Issues The main questions that this study addresses are:
1) Is the aggregate value of commercial and industrial property generally declining relative to residential property? This question is examined in the section on value trends, which summarizes recent work in tracking trends and in estimating the value of stocks of real estate in the U.S. and in major metropolitan areas.
2) Are systems generally used in North America for valuing large commercial property for property tax purposes adequate? This question is examined in the section on best practices.
In addition to these overarching questions, there are a number of narrower issues to consider, including:
Χ Have assessors (and their critics) given sufficient attention to how the valuation problem is defined? As will be discussed, how the valuation problem is perceived affects both how the exercise is carried out and how the results are evaluated.
Χ Are appropriate resources being devoted? Χ Are valuations based on appropriate data?
1 Over-valuation was only one reason for reducing an assessed value. Another was a provision in the classification law that the highest legal level of assessment could be no more than 2.5 times the lowest. The main classes and their legal levels of assessment are: (1) vacant land, 22 percent; (2) residential property (six or fewer dwelling units), 16 percent; (3) apartment buildings (more than six units), 26 percent; (4) commercial property (class 5A), 38 percent, and (5) industrial property (class 5B), 36 percent. An important issue, not examined here, is how the Illinois Department of Revenue measures assessment levels for equalization purposes. Suffice it to say, the Department found that the actual level of assessment of residential property was about 10 percent, which caused PTAB to conclude that commercial and industrial property should not be assessed at their classification ordinance levels.

2
Χ Are appropriate valuation methods being used? Χ Is valuation quality being adequately measured? Χ In sum, are professional valuation standards adequate?
The section on best practices examines facets of systems for valuing commercial properties for property tax purposes. It considers the questions posed above. Where appropriate, it characterizes valuation practices in three ways:
Expected practice
A practice that meets standards and that would ordinarily be expected of any assessment district (of course, circumstances may exist that make a standard or a recommended practice inapplicable)
A better practice
Exceeds standards—a better practice that most districts could employ
A promising idea
Possibly a still better practice; something worthy of consideration by an agency that aspires to be the best
A policy issue that is not examined in detail is the effect of value-change limits and property-tax-rate-increase limits on taxpayers and other stakeholders’ perceptions of the fairness and accuracy of the underlying assessments. Some officials worry that by weakening the link between valuation and taxation, the feedback normally provided by the appeals system is distorted. In other words, taxpayers may not be scrutinizing the valuation process as carefully as they might if property tax obligations were directly correlated with assessments. Assessors may be lulled into complacency. Approach Largely to keep the project manageable, this study focuses on the valuation of large, generally investment grade high-rise office buildings. They constitute a significant but difficult-to-value component of the non-residential property tax base. Yet their underlying economics should be amenable to valuation in a mass valuation system, since the chief purpose of many of them is to generate revenue directly through rents rather than indirectly through the production of goods, as in the case of industrial property. Of course, appreciation in value may be a hope. The project had two major thrusts. The relevant professional literature was reviewed (see references. Second, site visits were made to the assessment agencies listed below. All had large office markets (which were in stress at the time of the study). Market value was the basis of assessment in each. They were representative of leading assessment offices, and each had particular aspects of its operations that were especially interesting. CCAO—the Cook County (Illinois) Assessor’s Office was selected because:
Χ As noted, the valuation of high-value commercial properties has been controversial; Χ The office is committed to improving the initial quality of its valuations and to increasing
access to information about assessments, thereby reducing appeals; and Χ The office is in the midst of massive investments to upgrade its systems and procedures. Chicago is the seat and center of Cook County. Chicago’s office market is concentrated in its central business district, which is known as “the Loop.” As part of a rolling triennial

3
revaluation cycle, property in Chicago was reassessed as of 1 January 2003 for 2004 taxes. In an attempt to demonstrate its achievements, the CCAO publicized key features of the assessments of the 100 largest office buildings in the Loop.
HCAD—the Harris County (Texas) Appraisal District was selected because:
Χ Its jurisdictional structure is unusual in the U.S.; and Χ It has a well-regarded commercial property valuation system.
In the U.S., assessment normally is the responsibility of a general-purpose local government like a county or city. Texas is different: there special-purpose governments have been formed with the basic purpose of assessing realty and personalty for property tax purposes. Except for one two-county district, they are coterminous with counties. They were created to eliminate overlapping assessment districts, to insulate assessment from undue political influence while aligning assessment operations with legal requirements. Each district is governed by a board and managed by a chief appraiser. (HCAD serves about 400 taxing districts.) The larger districts have a reputation for being well managed. Houston, the seat of Harris County, also is famous for being un-zoned. This means that the office market is more dispersed than in most cities. Property is revalued annually in Texas.
KCDA—the King County (Washington) Department of Assessments was selected because of:
Χ Its well-regarded valuation system; and Χ For its commitment to complying with the Uniform Standards of Professional Appraisal
Practice (USPAP), including publishing the details of the analyses upon which assessments are based.
King County includes Seattle. The county revalues all properties annually. The Washington Department of Revenue requires annual progress reports as part of its efforts to monitor revaluation performance.
MPAC—Ontario’s Municipal Property Assessment Corporation was selected because:
Χ Like HCAD, it has a corporate structure, although it is the assessment agency for the entire province (and the 445 municipalities therein);2 and
Χ Among its other recent administrative and procedural reforms, it has an innovative income and expense data collection program.
In Ontario, office properties are concentrated in Ottawa and Toronto. Ontario nominally reassesses annually. However, for the 2004 and 2005 taxation years, assessments were updated to a June 30, 2003 valuation date (the reassessment for the 2005 tax year was cancelled). For taxes levied in 2006, the valuation date will be 1 January 2005. Annual
2 It also is responsible for maintaining voter registration rolls.

4
updates thereafter will have a valuation date of January 1st of the year before the taxation year.
Facilities in the Greater Toronto Area were visited, including MPAC’s headquarters in the City of Pickering and its central processing facility and customer contact center in Scarborough (City of Toronto). MPAC also has twenty-seven field offices throughout Ontario including the cities of Toronto and Ottawa.
VOA—the Valuation Office Agency was selected because, as the assessment agency for England and Wales:
Χ The agency is in the midst of a modernization program like other case studies,; Χ One goal of the program is to improve the initial quality of valuations and, thereby,
lessen the volume of appeals; and Χ Whether capital value assessment systems could learn lessons from how the VOA
estimates annual rental values of each tenant’s property; that is, could these estimates be summed to develop an estimate of the income of the entire building?
England and Wales have two distinct property taxes: (1) A capital value-based tax on residential (“domestic”) property known as the Council Tax, and (2) an annual rental value-based tax on non-domestic (non-residential) property known as the Uniform Business Rate.3 The Uniform Business Rate is reassessed every five years. Annual rental value is approximately equal to net operating income (NOI). The VOA is an executive agency of the central government. It operates under an agreement with several ministries and senior agencies. It is governed by the Board of Inland Revenue. Although property tax valuation is its major activity, VOA provides valuations for other governmental purposes, and it provides advice to government on property valuation matters. The City of London office of the VOA was visited. The City office is one of two in London that have concentrations of large office buildings.
Trends in the Value of Residential and Non-Residential Property
Just as the market value of any particular property is an unknowable quantity, the total market value of any class of property is unknown. Yet wise property tax policy requires knowledge of magnitude and trends in the potential property tax base. The need for such knowledge is becoming more acute as taxing authorities experience the pinch of tax limits. Interventions by taxing authorities in the assessment process can be expensive and siphon funds from more worthwhile activities. They also complicate assessment administration. Estimates of the total value of property in various categories have uses in other areas as well. Unfortunately, property tax policy makers and administrators are hampered by the provincialism inherent in a highly decentralized tax. In addition, there are few relevant statistical series available at the national level, despite academic interest in national and regional wealth, portfolio theory, and property price “bubbles.”
3 Northern Ireland and Scotland have different property tax systems.

5
Data Sources and Research Several researchers have attempted to shed light on the total value of real estate in the United States.4 All have faced the obstacle of inadequacies in readily available data sources. Figure 1 displays computations of various ratios of business values to residential values from the studies summarized below. Caution in interpreting the data is advised, given differences in source data, methodologies, and assumptions. However, there is an overall downward trend in the data, indicating that the aggregate value of commercial and industrial property generally is declining relative to residential property.
BEA—the Bureau of Economic Analysis of the U.S. Department of Commerce is the source of a long-running time series on asset values. It began publishing statistics on the value of non-residential and residential structures beginning in 1925, and industry-specific data are available from 1987. This series has several shortcomings: It does not include the value of land, the value of structures is derived from permit data, and the data cannot be disaggregated regionally, which would be useful for property tax policy analysis. In figure 1, the ratio constructed from the BEA data is the value of non-farm, non-manufacturing structures divided by the value of owner-occupied residential structures.5
FRB—the Federal Reserve Board, as part of its flows of funds accounts, has since 1945 published statistics on real estate assets values of (a) households and non profit organizations (with breakdowns for each), (b) non-farm, non-financial corporate business, and (c) non-farm, non-corporate business . These values are based on BEA statistics, but include estimated land value. The ratio constructed from the FRB data is in figure 1 (a) the sum of the real estate balance sheet values for non-farm, non-financial corporate businesses plus non-residential real estate values for non-farm, non-corporate businesses divided by (b) the real estate balance sheet values of households.6 At least over the period analyzed, the FRB data has the same trend as the BEA data, although the ratios are lower, suggesting that land is a significant part of total residential real estate value.
4 One of the earliest was Raymond W. Goldsmith, The National Wealth of the United States in the Post War Period, National Bureau of Economic Research, 1964. 5 Bureau of Economic Analysis, National Income and Product Accounts (NIPAs) tables 4.1 and 5.1, respectively. 6 Federal Reserve Board, Release Z1, for 8 December 2005, tables B-102, B-103, and B-100, respectively.

6
2010200019901980197019601950
Year
1.20
1.00
0.80
0.60
0.40
0.20
0.00
Rat
io o
f Bus
ines
s Va
lue
to R
esid
entia
l Val
ue
Fit line for TotalTPVMilesMalpezziKendricksIbbotsonHartzellFRBEconomistBEASource
Figure 1: Trends in Ratio of Business Value to Residential Value
See text for sources and other notes.
R Sq Linear = 0.37
TPV—the studies of “Taxable Property Values” made by the Governments Division of the U.S. Bureau of the Census (also in the Department of Commerce) as part of its quinquennial Census of Governments from 1956 to 1981.7 The TPV studies included a sales ratio study of samples of mostly larger U.S. assessment jurisdictions. The results of these studies, when combined with statistics on assessed values, could be used to produce a snapshot of the value of U.S. real estate every five years.8 Figure 1 contains ratios of (a) the assessed values of commercial and industrial property to (b) the assessed values of single-family non-farm houses (1982 Census of
7 With the exception of the 1957 Census of Governments, in which the TPV studies were in volume 5, the TPV studies were the subject of volume 2 of each Census of Governments. 8 Users sometimes ascribe the data to the year of the census rather than the year to which the data apply, which is one year earlier.
7
Governments, p. xiii). The data suggest that commercial and industrial property values declined relative to the value of residential property.
Kendricks combined BEA and TPV data to produce estimates of land values and structure values by sectors. In figure 1, the ratios constructed from Kendricks’s data are of (a) the value of personal sector realty to (b) business sector realty, possibly mixing some classes of property.
Miles—with the demise of the TPV study, researchers turned to state- and county-level data, sometimes from commercial sources of assessment information. Miles reports on six studies in the 1980s using a variety of data sources and methodologies, including the 1981 TPV study and the BEA and FRB’s statistics for 1988. Different classes were studied. Figure 1 displays the ratio of classes most commonly associated with single-family residential property and of commercial and industrial property as a group.
Ibbotson—figure 1 also displays a ratio from a study by Ibbotson. He, notably, estimated that the value of business property was only 20 percent of the value of residential property.9
Hartzell et al. built upon a 1988 study by Miles et al.10 Using assessment and census data for 1989, they (Hartzell et al.) estimated the value of various real estate sectors in forty-four large metropolitan areas, with extrapolations to all counties in the U.S. to produce national estimates.
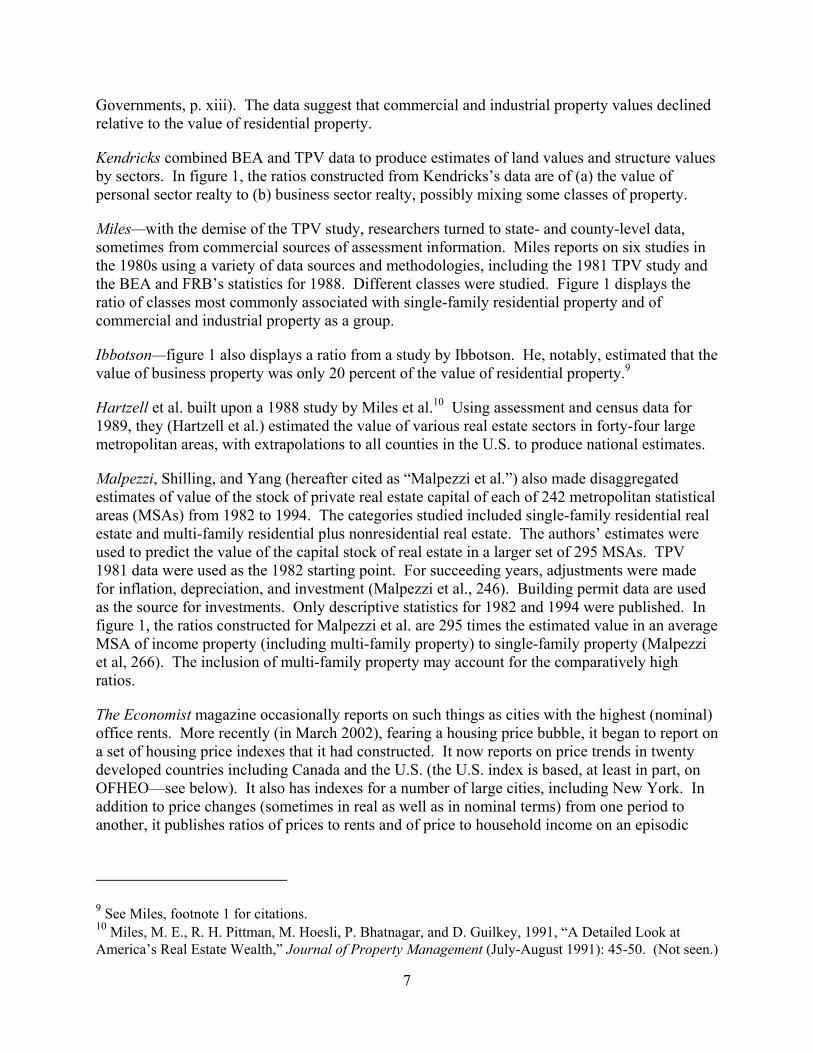
Malpezzi, Shilling, and Yang (hereafter cited as “Malpezzi et al.”) also made disaggregated estimates of value of the stock of private real estate capital of each of 242 metropolitan statistical areas (MSAs) from 1982 to 1994. The categories studied included single-family residential real estate and multi-family residential plus nonresidential real estate. The authors’ estimates were used to predict the value of the capital stock of real estate in a larger set of 295 MSAs. TPV 1981 data were used as the 1982 starting point. For succeeding years, adjustments were made for inflation, depreciation, and investment (Malpezzi et al., 246). Building permit data are used as the source for investments. Only descriptive statistics for 1982 and 1994 were published. In figure 1, the ratios constructed for Malpezzi et al. are 295 times the estimated value in an average MSA of income property (including multi-family property) to single-family property (Malpezzi et al, 266). The inclusion of multi-family property may account for the comparatively high ratios.
The Economist magazine occasionally reports on such things as cities with the highest (nominal) office rents. More recently (in March 2002), fearing a housing price bubble, it began to report on a set of housing price indexes that it had constructed. It now reports on price trends in twenty developed countries including Canada and the U.S. (the U.S. index is based, at least in part, on OFHEO—see below). It also has indexes for a number of large cities, including New York. In addition to price changes (sometimes in real as well as in nominal terms) from one period to another, it publishes ratios of prices to rents and of price to household income on an episodic
9 See Miles, footnote 1 for citations. 10 Miles, M. E., R. H. Pittman, M. Hoesli, P. Bhatnagar, and D. Guilkey, 1991, “A Detailed Look at America’s Real Estate Wealth,” Journal of Property Management (July-August 1991): 45-50. (Not seen.)

8
basis. It compares house prices with equity prices. The irregular nature of its coverage of house and commercial prices makes it difficult to gain a clear picture of long-term trends.11
There are several additional sources of house price trend data, including median existing home prices reported by the National Association of Realtors and median new home prices reported by the Census Bureau, which includes a constant-quality index. The Office of Federal Housing Enterprise Oversight (OFHEO) estimates and publishes quarterly more sophisticated house price indexes (HPI) for single-family detached properties using data on certain mortgage transactions obtained from the Federal Home Loan Mortgage Corporation and the Federal National Mortgage Association. The indexes, which began in 1996, are produced for the fifty states, nine Census divisions, and the nation as whole (Calhoun).
Figure 2 displays estimates of the total value (in current dollars) of the residential and business categories of real estate and of all privately owned real estate (including agricultural land). It appears that, led by residential values, there has been almost uninterrupted growth in real estate asset values since the 1950s. According to the TPV studies, the imputed market value of locally assessed realty grew from $0.7 trillion to $6.8 trillion between 1956 and 1981. The BEA series grew from $ 8.6 trillion in 1987 to $ 23.0 trillion in 2004. The FRB series grew from $0.6 trillion in 1950 to almost $29 trillion in 2004. In August 2002, The Economist reported that the total value of all U.S. housing was “almost $14 trillion” (“As safe as what?” p. 7). Applying its index to this figure suggests that the value of the US housing stock was about $ 20 trillion in 2004. (In May 2003, The Economist estimated that in developed countries, the value of residential property approached $ 50 trillion, while the value of commercial property was about $ 15 trillion (Woodall, 3). The magazine’s estimate of value of residential property in developed countries climbed to $ 70 trillion (“In come the waves” p. 66).12)
11 Unfortunately, small-scale graphics are used to present longer trends. Few details of how the index is constructed have been reported. Its base originally was 1980; now it is 1975. The index relies on data from a number of sources. It is updated quarterly; sometimes previous figures are revised. 12 It is unclear whether this estimate is based on the twenty countries The Economist now studies or on the original thirteen.

9
2010200019901980197019601950
Year
30.00
25.00
20.00
15.00
10.00
5.00
0.00
Valu
e ($
Tril
lions
)
FRB
FRB
FRBFRB
FRB
FRB
FRB FRBFRBFRBFRBFRB
FRB
FRB
BEA
FRB
BEA
FRB
BEA
FRB
BEA
BEA
BEA
Malpezzi
BEA
BEABEA
Ibbotson
TPVKendricks
FRB
FRB
FRBFRB
FRB
FRB
FRBFRB
FRBFRBFRB FRB
BEA
BEA
IbbotsonMalpezzi
TPV
FRB
FRB
FRB
BEA
FRB
BEABEA
BEABEA
TotalBusinessResidential
Figure 2: Trends in Real Estate Asset Values
2.2 Conclusions
From the published research available, the value of residential real estate in the U.S. has been increasing relative to the value of business real estate since the 1950s. Several causes underlie the divergence. Happily, a trend of under-valuing commercial and industrial properties relative to residential properties does not appear to be one of them—at least during the period of the TPV studies. Admittedly, the evidence based on aggregate assessment to sales price ratios is far from clear because of methodological changes and because of changes in underlying legal assessment ratios.
Factors that account for the divergence include larger houses. Recently, people have preferred to invest in their houses rather than equities, anticipating that price appreciation will continue. Currently, interest rates are near historical lows, making it possible to finance more. Lending institutions are happy to oblige. Tax systems often favor housing over financial assets; for

10
example by making mortgage payments and property taxes deductible, by taxing housing at lower rates than other types of real estate, and by taxing capital gains preferentially (“Going through the roof,” page 61). In fashionable locations, short-term constraints on increasing the supply can increase prices. There is some evidence that rigorous development restrictions can shift prices higher permanently. Nevertheless, fears of an impending bursting of a property price bubble in some markets appear warranted. Rents appear not to be rising commensurately with prices (Woodall, 8-9).
As noted, there are clear weaknesses in available data and studies. The estimation methods appear to mask evidence of cycles. Desirably, nationally consistent data would be published for sectors of the real estate market and regions. In addition, estimating methods would detect short-term cyclical movements, especially when volatility was high. Except for the defunct TPV studies, the available data are incapable of shedding light on (relative) under- (or over-) valuation by assessors. This provides no grounds for complacency as the impetus for Dye et al. demonstrates. Earlier, the Kansas Division of Legislative Post Audit examined the valuation of office buildings in four Kansas counties as a result of observed differences between property tax appraisals and transaction prices. Charges of undervaluation of commercial properties are common in the news (see Mahoney, for example). Although section 3 cannot directly address question of over- or undervaluation, the review of valuation systems and methods should help others identify strengths and weaknesses in valuation practices in their locale.

11
Analysis of Valuation Practices: A Search for Best Practices
Overview of Commercial Property Assessment Systems Background
Valuation is the activity of estimating what value is; assessment is the act of adopting a particular value estimate as the basis for taxation.13 Here the chief concern is with the market value estimates used as the basis for assessments. Although technical and legal definitions vary as to detail, market value simply is an expected price—the price for a property that would most likely be agreed to in an open market, assuming that the seller and buyer were reasonably well informed and under no unusual pressure.
In essence then, part of an appraiser’s job is to look at properties the way typical buyers and sellers would. This requires appraisers to consider what actual sales prices and other market evidence (such as rents) reveal. In addition, professional standards, particularly the Uniform Standards of Professional Appraisal Practices (USPAP), require appraisers to work systematically, document their work, communicate their opinions of value clearly, and behave ethically.14 The conventional textbook valuation process has seven steps: (1) define the valuation problem; (2) make a preliminary analysis and plan; select and collect data; (3) develop highest and best use opinion; (4) develop indicator(s) of land/site value; (5) develop indicator(s) of improved property value; (6) reconcile value indicators and reach value conclusion; and (7) report opinion(s) of value(s).15 These steps reflect a so-called “single-property appraisal” perspective.
Although there are crossovers, appraisers tend to belong to one of two camps: those who usually appraise one property at a time (individual- or single-property appraisal) and those responsible for appraising many properties en masse (mass appraisal). Academic valuation researchers constitute a smaller, third camp. Because they belong to different professional organizations and read different journals, members of the various camps sometimes fail to appreciate the contributions made by the others. However, appraisers of all stripes have been pressured to improve their analyses and achieve cost savings through automation. This has led to the acceptance of automated valuation models (AVMs), which are a form of mass appraisal model.
Often portrayed as an independent search for an objective “truth,” valuation combines both art and science. The art of valuation reflects the experience and judgment the valuer brings to the task. Available technology and data affect the science that can be employed. Different mixes of these ingredients can result in striking differences in the results, even when no attempt is made to shade the outcome.
13 “Valuation” and “appraisal” are synonymous, as are the verbs “value” and “appraise” and the nouns “valuer” and “appraiser.” Appraisal and related terms are most commonly used in the US. 14 It should be noted that unless there is a formal, legal requirement to do so, compliance by assessors with USPAP and the standards issued by the International Association of Assessing Officers is voluntary. 15 See, for example, Appraisal Institute 1992, page 73.

12
Valuation Problem Definition
As previously suggested, how a valuation problem is defined is crucial. Because assessment pre-dated the development of formal valuation standards, assessors may not give this step in the valuation process much conscious thought, and an independent appraiser hired in an assessment appeal may do so perfunctorily. Among the things that need to be considered include the users and uses of the appraisals, various assumptions, limitations, and, of course, the type of property and the nature of its market.
USPAP, which increasingly governs appraisal work in the United States, requires appraisers to identify clients, users, and intended uses of appraisals (see Statement on Appraisal Standards No. 9). The discussion betrays a single-property appraisal orientation. However, there essentially are two uses of valuations for (recurrent) property tax purposes: (1) ultimately to determine the size of the total tax base and (2) to apportion fairly property tax burdens according to the values of individual properties.16 With some overlap, there essentially are three groups of users of these valuations: (1) tax recipients, (2) taxpayers, and (3) other stakeholders, including oversight agencies, the makers of equalization grants, and the recipients of those grants. Governments generally are most interested in the first use; taxpayers generally are more interested in the second use (that is, their total property tax bill is their main concern). It is less clear who the client is. One possibility is the example of the King County assessor, who as an elected official and as part of his efforts to comply with USPAP, considers himself to be the client of the work done by the appraisal staff, and, he issues memoranda of instructions to the staff. Others might consider taxing districts, taxpayers, or both as their “clients.”
USPAP also requires appraisers to determine an “acceptable” scope of work.17 At least for property tax administration, its guidance is not wholly illuminating. It proffers the following:
“The scope of work is acceptable when it is consistent with: • The expectations of participants in the market for the same or similar
appraisal services; and • what the appraiser’s peers’ actions would be in performing the same or
similar assignment in compliance with USPAP.”
The standards and texts of the International Association of Assessing Officers (IAAO) provide some guidance on technical system requirements. Lacking from USPAP and IAAO standards is guidance on what level of effort or expenditure is warranted. All users of property tax appraisals have an interest in economy of administration (Adam Smith’s fourth canon: “Every tax ought to be so contrived as both to take out and keep out of the pockets of the people as little as possible, over and above what it brings into the public treasury of the state.” Wealth of Nations, 1776). Although there are no norms, the ratio of expenses for assessment and collection to total property tax revenues of all taxing bodies usually is no more than 2 percent in the US (partly because property tax rates are high by international standards). In the districts studied, expenditures of assessment were less than 1 percent of annual property tax revenues. Clearly the average cost of
16 Valuation data also have general public- and private-sector uses. 17 See, for example, Standards Rule 6-2(c).

13
valuations must be only a fraction of this total. The chief ways to reduce the costs of valuation are to (1) reduce the amount of data on each property that is required, (2) reduce the amount of individual human effort in reaching a value conclusion, and (3) increase economies of scale through automation and through putting property data to more uses than property tax administration. However, it is also reasonable to postulate that the resources devoted to valuation should be commensurate with the amount at risk, namely the taxes assessed (which are a function of the effective tax rate and the value of the property). Thus, spending more on a typical office building appraisal than on the appraisal of a typical residence would be warranted.
Along with considering the use of the valuation, the problem definition phase of the valuation process requires the appraiser to answer additional questions, the answers to which usually will vary from assignment to assignment when properties are valued individually. In mass valuation for property tax purposes, except for identifying and locating the properties to be valued, the valuation standard and valuation date generally are legislated and uniform, thereby making that part of the definitional task simpler. In addition, a number of assumptions are made to simplify the valuation task and to provide a measure of uniformity. For example, the taxpayer may be presumed to possess “fee simple” rights to the property. Properties usually are presumed to be “typically managed.” Except in rare instances, the current use is assumed to be the “highest and best” use.
When such assumptions diverge from reality, which often is the case with leased office buildings, the analysis of available market evidence is not really simplified. Sales prices may be influenced by existing leases. That is, they reflect the value of the leased fee interest rather than a fee simple interest. Owners may protest when the assessor’s market value estimate exceeds their investment value.
In summary, single-property valuers and property tax valuers often face different sets of user requirements, which may hinder mutual understanding. For single-property valuers, discovery and listing are comparatively trivial tasks, except for concerns about environmental risks and hidden defects. They often rely on the assessor’s data on the subject property and on the comparables that are selected (although a contemporary inspection of each property is required). “Client satisfaction” arguably is more straightforward: Only a single valuation is in question. As long as it is logical and supported by evidence, the result likely will be accepted, although there is a downstream risk that the appraiser’s competence will be questioned, should something go wrong. If this happens, the single-property appraiser’s potential exposure is much greater than an assessor’s; this exposure could be the entire value of the property or the amount for which a mortgage is sought rather than merely the taxes at stake (unless the appraiser is working for an appellant). Moreover, appeal systems ordinarily shield assessors from much of their exposure. Hence the greater level of effort (or expenditure) and attention to detail of single-property appraisal is warranted.
Some of the distinctions between mass valuation and individual-property valuation are more apparent than real. What most distinguishes mass valuation from individual-property valuation is the emphasis on systematic use databases and previously calibrated valuation models. Both types of valuation produce individual value estimates for each property. Individual-property valuation generally involves explicit consideration of fewer comparable properties (with attendant concerns about the statistical validity of their conclusions) but of more general market

14
factors. The value estimate may incorporate more judgment. Data and conclusions are reported in more detail. However, the mere fact that mass valuations are not made and presented in the same way as individual valuations does not necessarily make them inferior.
Valuation Methods and System Components
Expected practice
Emphasis on the income approach in the valuation of large office buildings.
Basis Standard on Mass Appraisal of Real Property, section 4.4
Of the three conventional “approaches to value,” the North American assessment agencies reviewed appropriately emphasized the income approach, although they recognized the value of sales comparisons and replacement cost estimates as consistency checks. As will be discussed, the sales comparison approach seldom can be directly used in the valuation of large office buildings because sales are few and because prices often reflect factors not directly related to the real estate itself. However, the same comparison methods can be used to analyze rents (as the VOA does). Although the cost approach historically has been the predominant approach in property tax valuation, it is losing favor in the districts studied. Newly constructed office buildings and owner-occupied office buildings, however, present situations in which continued use of the cost approach is warranted.
A modern mass valuation system embodies a number of linked procedures, including those listed below.
Quality assurance and control—Quality assurance and control, including the evaluation of valuation accuracy, will be discussed further. However, perceptions of quality can be almost as important as the measures taken to ensure quality. It is axiomatic that frequent revaluations improve valuation accuracy. Other factors that may affect the real or apparent accuracy of valuations include:
• The relationship between real estate cycles and valuation cycles; Long lags between a valuation date and the date as of which property taxes based on a valuation are due can be problematic, especially when the trajectory of the market has changed in the interim. In a similar vein, when year-to-year fluctuations in income and operating expenses are smoothed to produce stabilized income and expense amounts, properties that have superior management may appear undervalued and poorly managed properties may seem overvalued.
• Valuation policies (such as valuing conservatively to avoid appeals or valuing aggressively to provoke appeals and thereby force the disclosure of market data); and

15
• The design of ratio studies, especially how commercial properties are stratified, how sales are screened, and the period from which sales are selected.
Collection and maintenance of data on the attributes of the inventory of taxable properties—Inventorying assessable properties is the most labor-intensive and, hence, expensive aspect of assessment administration. Consequently, assessors need to determine data needs, devise ways of collecting needed data cost-effectively, carry out data collection and maintenance on an ongoing basis, ensure that data are complete and accurate, and ensure that the data are stored securely and available when needed.
Collection of evidence of market values, such as sales, rents, construction costs, and so on—Commercial real estate markets tend to be in an almost constant flux. This makes it necessary for assessment offices to monitor continuously factors that affect property prices, rents, and operating expenses as the districts studied did.
Market analysis—A preliminary task in the valuation of any type of property is the identification of markets (such as the office building market), submarkets (such as investment grade office buildings), and market areas. As the districts studied were well aware, commercial market areas often varied by property type and usually differed from residential neighborhoods in that they often are more greatly influenced by the nodes and routes of transportation networks. They recognized that market for large office buildings was broader than the assessment district, even international in extent. Consequently, they tracked market trends through industry publications and commercial databases. Also monitored were such things as the inventory added through new construction and absorption rates. They also attempted to understand real estate cycles and how changing fashions affected values (such as how major tenants contributed to the perceived prestige of particular buildings).
Location is universally recognized as an important factor affecting rents and property values. Valuing land and accounting for the effects of location on improved property values are among the most important, yet difficult valuation tasks. Although traditional land valuation methods are capable of accounting for many location factors, they depend crucially on judgment, as sales of land in developed areas usually are scarce. Land value models usually are simple geographically stratified per-unit models with mechanical adjustments for size and shape. Most computer-assisted mass appraisal (CAMA) systems merely automate the calculations. Although each of the studied jurisdictions had a geographic information system (GIS), each relied more on traditional manual delineation of market areas, partly following industry practices.18 Except when the plot is vacant (or nearly so), little importance attaches to the resulting land value estimates, as the crucial estimate is the estimate of total market value.
The districts evaluated tracked the available inventory of office space (including new construction, absorption rates, and sub-leased space). They compared data collected locally with published statistics.
18 In high-value areas of London, the VOA, which separately values each tenancy for property tax purposes, treats each building as a market area, much as a large condominium development might be regarded as a separate market area in North America.

16
Development and application of valuation models—at the heart of a mass valuation system is one or more mass appraisal “models.” A model merely is a mathematical representation of the effects on market values the types of property supply and demand factors relevant to the approach (income capitalization, sales comparison, or cost) chosen. Mass valuation modeling involves model “specification” and “calibration.” Specification is theoretical and involves deciding which valuation approach to use, which property characteristics likely have a significant effect on property values, and how those characteristics are assumed to affect value (rental or capital). Calibration is the process of estimating the rates and coefficients associated with the variables in a mass appraisal model. Calibration is the empirical, analytical work valuers do in estimating base rates, adjustment coefficients, and the like. Specification and calibration may be repeated several times as a model is tested and refined. When the valuer is satisfied with the model, it is “applied,” after which the results are reviewed and reconciled as necessary.
Valuation models can be developed in a number of mathematical forms and presentation formats (see Gloudemans). Replacement cost models generally are presented in a tabular format. Stratified per-unit models are commonly used in applying the income approach, as will be seen. Multivariate models typically are used in valuing residential and smaller commercial properties. Stratified per-unit models reflect only typical value relationships within the stratum, not the marginal contributions to value of each attribute that is used to define the stratum. In contrast, multivariate models attempt to explain simultaneously the marginal effect of each of several attributes explicitly.
Communicating values to taxpayers and tax administrators—USPAP and the Internet are changing the way assessors communicate with taxpayers and stakeholders.
Administering appeals—administering appeals well is crucial to the acceptance of assessments. Regardless of the structure of the appeals process, it gives taxpayers opportunities to question their assessments and seek revisions. Especially when the initial appeal is to the assessor or when the assessor serves as the clerk of an appeals body, simply managing appeals can be challenging. Assessors must also be able to explain valuation procedures convincingly and to defend valuations before appeal bodies.
Figures 3 and 4 provide general and detailed views of valuation systems. Figure 3 attempts to depict a generalized assessment system in its setting. Figure 4 provides more detail on main processes.

17
Figure 3
III. Assessment IV. Review &appeal
II. Legislative and administrative oversight
I. Taxpayer and stakeholder interactions
Real Estate Tax Valuation System Schematic
A. Management
B. Data collection& maintenance
C. Data storage &retrieval
D. Marketanalysis & modelbuilding
E. Modelapplication,review, &reconciliation
F. Communication
G. Appeal support& defense

18
Figure 4 MASS VALUATION SYSTEM
I. Data collection and maintenance
IV. Model application, review,reconciliation
II. Exploratory data analysisData quality reviewData distributionsMarket patternsTime trends
III. Model development
B. Property attribute data
SpecificationValuation approachMathematical formVariables
Calibration
Quality assurancePlausibilityRatio studiesGoodness-of-fit statisticsResiduals analysisHold-out sample performance
Application
Review & reconciliation
Final value determination
Location dataMarket areaNeighborhoodGrid coordinates
Land / site dataSizeUseShape, access, etc.
Building dataSize, usable areaUseConstruction detailsAge / conditionOther
A. Market data
Sales dataPrice, date, etc.Description of property soldUsability of sale
Cost dataGeneralSpecific
Income and expense dataDescription of property rentedMarket rentsVacancy ratesStabilized allowable ratesOverall rates
Management and Quality Assurance
Expected practice
Well-managed programs for valuing large commercial properties
Basis Although there are few explicit standards that relate to valuation program management, the Standard on Mass Appraisal of Real Property implicitly requires good management (section 5).
The necessity of identifying, describing, and valuing all assessable property in an assessment district by legal deadlines requires assessors to plan, marshal resources, manage work carefully, and to take steps to ensure that valuations comply with standards. Especially considering the tax losses and inequities that may result from undervaluation and the cost of defending appealed

19
assessments when properties are over-valued, a properly designed, managed, and supported commercial property valuation system is crucial. In reality, sophisticated management is comparatively rare in assessment administration.
A promising idea
Assign responsibility for assessment to an autonomous governmental corporation.
It probably is no accident that HCAD, MPAC, and VOA have sophisticated management systems. HCAD and MPAC are examples of legislative efforts to rationalize property tax administration. Texas transferred responsibility for assessment from a diffuse and confusing pattern of overlapping county, municipality, and special-district assessment offices to county appraisal districts. MPAC is but one example of a provincial corporation being created to achieve similar simplifications.19 In both types of agencies, assessment executives report to a board that represents the interests of taxpayers, taxing districts, and other stakeholders. VOA illustrates a different approach: it is an executive agency of Britain’s Inland Revenue (tax administration). It also has an autonomous corporate structure. The advantages of such organizations are clearer accountability, a better matching of technical resources with needs, the potential of achieving economies of scale, and a separation of the technicalities of assessment from the politics of taxation, which can make it easier to obtain adequate funding. The challenge, of course, is to realize the potential advantages without becoming unresponsive to the natural concerns of taxpayers and others.
Conventional North American political, organizational, and fiscal structures do not require strategic planning, budgets that focus on work accomplished, or demand innovative management. The professional literature provides few models.20 However, all of the agencies reviewed exhibited elements of forward-thinking management, as will be discussed.
19 Others include the British Columbia Assessment Authority and the Municipal Assessment Agency, Inc., of Newfoundland and Labrador. 20 For general treatments of the management of assessment agencies, see Assessment Administration and Assessment Practices: Self-Evaluation Guide, 2nd edition, both of which IAAO published in 2003.

20
Planning, Estimating Resource Requirements, and Budgeting
A better practice
Make specific performance commitments (objectives) and incorporate specific performance measures (“key performance indicators”) in plans, funding requests, and management reports.
All of the agencies reviewed make use of strategic planning and annual work plans. MPAC’s and VOA’s planning perhaps is the most elaborate. The VOA annually prepares a “Forward Plan.” The plans reviewed incorporate several significant changes, including a revaluation of domestic (residential) property, which [was] to serve as a new basis for the local property tax known as the Council Tax.21 On the non-domestic (business) front, the VOA hopes to transform the non-residential property tax (non-domestic rates) from an “appeals driven system” to a system that is “right first time,” thereby reducing the time, expense, and uncertainties associated with a massive appeals workload. A related goal is to demystify the property tax system and to make more information available on the Worldwide Web. The VOA annually agrees to a work plan that incorporates output and quality targets (key performance indicators). HCAD and MPAC also utilize performance indicators.
A management challenge that all assessment offices face is securing sufficient resources and using available resources wisely. As previously noted, there are no resource or budget norms for property tax administration, partly because there has been little research on the costs of assessment administration apart from sporadic surveys of assessment budgets.22 Studies of resource utilization are difficult to make because assessors’ offices typically are not required to account for how they actually spend their resources and because of differences in budgeting and accounting practices. However, from an object classification perspective, employee costs predominate. Functionally, data collection and maintenance predominate. Obtaining adequate funding for training and development, especially if travel is involved, often is difficult.
HCAD and MPAC have developed comparatively sophisticated management and budgeting systems. For example, instead of basing each year’s budget on the previous year’s object class appropriation, HCAD’s budgeting incorporates zero-based budgeting principles, and a separate budget is prepared for each activity for which a division is responsible. In the absence of a change in legislation or a system, a prior-year activity is assumed to be still necessary. However, the proposed work must be justified. The system requires division managers, annually to prepare Microsoft Word and Excel-based budget proposals that are sent to the agency’s budget director for later consideration by the agency head (the chief appraiser) and a budget committee
21 The Council Tax revaluation that was scheduled to be introduced in 2007 was postponed in 2005 until 2010. 22 The most recent survey is Cook County Assessor’s Office, “1999 Major Assessment Jurisdiction Survey.”

21
composed of district top management. The budget committee holds a workshop to produce a consolidated budget, which is submitted to the district’s board of directors for adoption. 23
To assist HCAD division managers in preparing their requests, the budget director has prepared a budget package. It contains instructions; six schedules, including one for proposed new programs; and examples of filled out schedules. Table 1 contains descriptions of the schedules.
Table 1: Harris County Appraisal District Budget Package Schedule Name Format Description
1 Division Overview Excel The schedule contains a block for a narrative description of the division’s responsibilities and a table in which activities are listed. Three years of actual and estimated workload measures are recorded.
2 Activity/Program Description Word For each activity identified in schedule 1, the manager states (1) the services provided, (2) the customers served, (3) the service improvement objectives for the budget year in question, and (4) qualitative measures of service.
3 Funding Summary Excel This schedule is completed last. It is a conventional object classification table that displays three years of funding statistics (the current budget request, the request for the previous year, and actual and budget for the year before that.
4 Request for Positions Excel This schedule provides the basis for the salary request in schedule 3. Current, new, and reclassified positions in the division are listed in budget-priority order, and the associated salary is listed (salaries are governed by class schedules and steps).
5 Detail on Line Items Excel This schedule provides the basis for certain object classifications (line items) in schedule 3. It contains a table for documenting the object class and the associated amount. There also is a box for entering the rationale for the request.
6 Project Proposal Excel This schedule contains tables for requesting new expenditures. One table documents what is to be purchased; another provides a rationale and assigns a priority to the purchase.
23 The approved budget document, however, focuses on financial statistics and associated policies.

22
Organization and Staffing
Few clear lessons can be drawn from the organization plans of the districts studied. They reflect the history of each organization. Obviously, they reflect the size of the assessment district and the need to serve the public. Together, they present interesting examples of different approaches to work specialization.
CCAO’s organization plan essentially follows work processes, although it has some branch offices essentially to provide more convenient access to taxpayers. Accordingly, field staff are responsible for data collection, the director of valuation standards and practices develops valuation models, and teams of analysts deal with appeals. However, there are residential and non-residential specialists, and a team of three was largely responsible for the latest revaluation of Chicago’s Loop. In HCAD, office buildings are part of the portfolio of the Complex Property Unit, which has a staff of seven. (The unit also is responsible for banks and condominiums.) In KCDA, some appraisers have multiple valuation responsibilities. Commercial appraisers, for example, are responsible for valuing all the properties in the county in particular “specialty” category (such as, large office buildings, regional malls, or hotels) plus all ordinary commercial properties in an assigned area. Therefore the annual valuation of office buildings of 100,000 or more square feet is the responsibility of a single appraiser who also values a geographic area of commercial properties.
Land valuation is the responsibility of specialists in HCAD, and this was the arrangement in CCAO before recent staffing reductions. In KCDA, land valuation is the responsibility of each “geographic” appraiser. When land is appraised by another, the office building appraiser generally accepts land values as a “given,” with the result that the building value is the remainder when the land value is subtracted from the total value of the property developed from the income approach. In KCDA, the office building specialist has the option of relying on the geographic appraiser’s opinion of land value or of estimating another.
As is the case with CCAO, the person making the initial valuation may not defend it on appeal for efficiency and quality control reasons. In VOA, each appeal case is assigned to a specific “owner.” Reflecting the geographic extent of their jurisdictions, MPAC and VOA also have branch offices (some functions, such as mail processing, are centralized, however).
Computer Support
Expected practice
Use of computers in the valuation of large office buildings
Basis The Standard on Automated Valuation Models and the Standard on Mass Appraisal of Real Property implicitly require a CAMA system (section 5.3), but neither explicitly set out the functionality that such systems should have.

23
Ideally, a large assessment district would have a modern computer-assisted mass appraisal (CAMA) system that would support the valuation of all types of property and would support all three approaches to value. It would also help manage work, and it would be well integrated with the tax administration system and a geographic information system. Currently, these ideals are not met, although progress is being made with work flow management and with system integration. Even in the area of valuation, most CAMA systems on the market fall short in several ways. Although they may provide an adequate facility for automating replacement cost calculations of most residential and commercial structures, built-in facilities for valuing land, for building sales-based models, and for applying the income approach tend to be rudimentary at best. Internally developed systems also may be deficient. Because large assessment districts were early users of computers, their “legacy” systems tend to be technologically obsolete as well. However, they usually have specialized applications missing from commercially available CAMA systems.
All the agencies studied use spreadsheet applications in the valuation of large office buildings. As will be discussed, these applications can be quite sophisticated, and some are linked to databases or are on shared drives, improving accessibility and security. In addition, all of the districts reviewed have initiatives to upgrade their systems to improve data management, achieve better system integration, and ultimately to improve valuation analyses. Common features include greater use of the web, GIS, and imagery.
• KCDA is currently in the process of replacing its assessment administration system, which interacts with the Treasurer’s office. Its valuation application is considered generally satisfactory. However, office building valuation currently is done in Excel because the valuation specialist prefers its greater flexibility and because building the same degree of functionality in the general valuation application would not be cost effective.
• CCAO is finishing a multi-year office automation program. Initially, the office drew upon the services of contractors. The new CAMA system is SQL Server based. It will have a number of applications designed to facilitate use of the income approach on a mass basis. They are being developed by in-house staff. One is a “worksheet” (colloquially known as a “CAAD”—for County Assessor’s Appeals Department) that includes separate windows for the following: property description, income analysis, and capitalization. Another is the narrative appraisal report template discussed later. Experimental analyses currently are made in Excel, although they are linked to the database, as is the case with HCAD and MPAC (below). A number of forms are scannable, including income and expense data forms.
• HCAD in 2001 contracted with Software Techniques, Inc. for its CAMA system. Office building data currently are held in Access and analyzed using Excel. The system allows analysts to generate several standard reports, including an income and expense data report for selected categories of properties (selection criteria include area, class, and land use code).

24
• MPAC is replacing its legacy system, the Ontario Assessment System (OASYS), with the Integrated Property System (IPS). Residential property was the first to be converted, and commercial will come later. Consequently, commercial property data are held in, and analyzed using, Lotus 123 until IPS is modified accordingly. As will be discussed, MPAC collects income and expense data in an application known as “TIP” (tenant information program). MPAC also has developed several trademarked IT applications to address the needs of taxpayers, municipalities, and others. They include “AboutMyProperty,” which enables taxpayers to look up data about their properties and on comparison properties; “Municipal Connect,” which enables municipalities to make use of assessment data; and “propertyline,” which enables anyone to buy assessment, sale, and value estimates. In addition, it is one of the sponsors of the “Ontario Parcel” website (along with Teranet, Inc. and the Ministry of Natural Resources).
• VOA similarly has several IT modernization efforts, including partnerships with other holders of land data and the use of an AVM for the planned Council Tax revaluation. Its valuation application, which is under development, is on an Oracle platform. Currently, Excel is used in income analyses, and some graphical analyses are used. It also has an automated income and expense data system known as “MERI” (Making it easy to supply rental information).
All of the agencies reviewed had initiatives to make greater use of the Internet. In addition to information of general interest, all the agencies make it possible to look up individual assessment data. CCAO, HCAD, KCDA, and VOA essentially allow anyone to look up any assessment (although the inquirer would have to know the property identifier or address). MPAC has adopted guidelines for the release of assessment data (known as “GRAD”). CCAO provides images and allows users to select “comparables” that share key attributes with subject properties.
Increasingly, forms can be downloaded. MPAC and VOA make it possible to submit income and expense data electronically. CCAO allows some forms to be submitted electronically.
Workflow Management
Given their size, workflow management obviously is an important concern in all the districts reviewed, especially when the agency has to meet legal deadlines. MPAC provides an outstanding example of a workflow management system. To better handle mail and telephone contacts with taxpayers, MPAC has established a centralized “customer contact center” near a “central processing facility.” The center’s management continuously monitors work loads and work completed and provides weekly and monthly summaries to MPAC top management. CCAO has a dedicated taxpayer assistance department. It recently has incorporated workflow management in its field operations. KCDA also has a centralized customer contact center where telephone inquiries and walk-in inquires are handled daily five days a week. It tracks progress as part of an annual progress report to the Washington State Department of Revenue. VOA similarly has volume and quality standards and maintains work program statistics.

25
Quality Assurance
As noted, the quality of the appraisals of large, high-value properties is in doubt in many jurisdictions. This issue has two main facets: (1) the efforts assessors make to ensure accurate, fair appraisals and (2) the ways in which appraisal accuracy is evaluated.
Expected practice
A large assessment district will devote extensive efforts to quality assurance, including measures to ensure that data were complete and accurate, improve professional and technical skills, and ensure that appraisals met accuracy standards.
Basis The Standard on Mass Appraisal of Real Property requires high quality data (section 3.3.2.1). The Standard on Ratio Studies provides detailed recommendations.
Quality assurance is a key responsibility and challenge for any large assessor’s office. In addition, the appeal system and oversight by higher-tier governments have quality control implications. An assessor not only must correctly appraise a wide array of properties ranging from deteriorated obsolete properties to the latest in new uses, but also persuade sophisticated taxpayers and stakeholders that the values are correct. All of the agencies reviewed devoted considerable attention to quality assurance. Of course, many measures are general in application and do not focus on high-value properties.
As befits an organization of its size and geographic scope, MPAC has an especially highly developed quality assurance effort. Although quality assurance is an organization-wide concern, MPAC has a quality services unit that coordinates QA efforts, makes data and procedural quality checks in the field, makes internal audits, and performs related services. CCAO also makes field audits. As an example of state-level oversight, KCDA must file annual revaluation progress reports with the Washington Department of Revenue.
Focusing on things germane to office building valuation, the agencies reviewed attempt to make data submittal requirements clear so that only accurate data are submitted. The very structure of spreadsheets, worksheets, and forms has quality assurance implications.
HCAD has written definitions of, and procedures for handling, things not definitively treated in textbooks, such as tenant improvements and leasing commissions. VOA’s quality assurance efforts are directed toward maintaining the valuation list and defending it. It uses computerized edits to detect questionable assessments and manually checks samples of assessments for procedural consistency.
Evaluating the quality of appraisals. A thesis of this study is that for several reasons fairly evaluating the quality of the appraisals of large office buildings (and of other property types with

26
distinctive individual members) using common approaches is inherently difficult and perhaps as difficult as making the valuations in the first place.
• Ratio studies are the principal tool for objectively analyzing assessment performance. However, their usefulness depends on the quantity and quality of indicators of value (usually open-market, arm’s-length sales, adjusted as necessary). Unfortunately, samples of sales of commercial properties often are too small, unrepresentative, or both. Too often, valuation performance is inferred from non-representative sales of smaller commercial properties, which usually constitute an entirely different market. Conventional procedures for screening sales do not examine factors important to institutional investors. Although the IAAO 1999 recognizes for the need to adjust sales prices for assumed leases, no guidance is provided in analyzing leases in a multi-tenant structure. There is less guidance on how to account for alleged intangibles. More fundamentally, ratio studies provide evidence of the overall accuracy of appraisals, not the accuracy of individual appraisals.
• Performance audits theoretically are valuable in compensating for weaknesses in ratio studies. If the assessor’s systems and procedures conform to legal requirements and professional standards, the resulting values can be presumed to be accurate reflections of the underlying market values, at least in the absence of evidence to the contrary. However, valuation standards provide a lot of room to maneuver (Kansas Legislative Division of Post Audit, 5).
• Independent appraisals—taxpayers, other stakeholders, and even assessors make use of independent appraisals to challenge assessments. Any bias aside, using one appraisal to evaluate another is fraught with risk, and difference in the thickness of the appraisal reports or the credentials of the appraisers are unreliable indicators of appraisal quality. Another problem is: which standards should be used—those of single-property appraisers or the mass appraisal field. In a similar vein, the volume of appeals, or their disposition, is a dubious indicator appraisal quality.
Property Characteristic Data Property characteristic data include the location, land, and structural attributes needed in valuation and tax administration.24 The method of valuation greatly affects attribute data needs, with the sales comparison and income approaches requiring much less data than the cost approach. Two questions may need to be considered:
24 Of course, other data elements, such as the identity of the property and the taxpayer, are maintained in assessment record systems.

27
1. Are the attribute data currently available in property records sufficient to make effective use of appropriate valuation methods? That is, are they reasonably complete and accurate, and are they in digital form with appropriate variable definitions and codes?
2. If additional attribute data are needed, how can they best be obtained?
With the exception of location characteristics, these questions pertain mostly to the cost approach, because it potentially can require a massive amount of detail.
While it is easy to reach a consensus on the types of data that are important, it is more difficult to reduce attribute data needs to the precise set of definitions and codes that are needed to inventory commercial buildings—and office buildings in particular—systematically and to store data electronically, so that they can easily be retrieved for analysis. As will be discussed, some key attributes are elusive and impermanent. Physical, legal, and economic attributes may be interrelated. The data storage medium also needs to be considered.
Location and Spatial Attributes
Location attributes affect both land and building values. In addition, location within a building can obviously affect market rent. As expected, location is considered an important factor in the valuation of large office buildings in the districts studied. Each of the agencies studied had delineated office market areas; none routinely used more granular location variables. Often industry area designations were used.
As noted, VOA treats each building as a sub-location. Although location differences within a building may be considered, the effects of such differences on rents currently are not analyzed systematically. Treating a building as a sub-location may confound efforts to isolate the effects of quality and location (Fairfield et al., 20).
Size Attributes
As is widely recognized, size has an important influence of the value of real estate. The relationship is complex, and defining the optimum size at any time may be difficult. From the perspective of a tenant or occupier, the size of a space must be sufficient for the intended use. Excess space may add value, but not proportionately. Too much space drains financial resources. From the perspective of a landlord, the situation is even more complex. The supply of, and demand for, space generally must be considered. When a building is first erected, land-use controls that define the “envelope” that a building might occupy obviously may be important. At the same time, consideration likely would be given to achieving economies of scale. After it goes on stream, a building is evaluated in terms of its competitors and current demand for space.
Characteristics that reflect the size of an office property include land area, the number of stories, and various building area measurements. Building area measurement also is a complex issue. Traditionally, the cost approach relied on external measurements made by the assessor’s office. In contrast, the real estate industry focuses on internal, leasable area measurements (often made by space measurement firms for owners or managers, although VOA measures the area of

28
assessable spaces according to UK standards). The North American agencies reviewed accepted measurements made according to BOMA standards. However, there are two versions of the office building measurement standard in use: the 1980 standard and the 1996 standard.25 The 1996 standard includes “building common area” in rentable area measurements, thereby making such measurements larger than they would be under the 1980 standard. In addition some properties are measured on a non-standard basis.
Although all of the North American agencies grappled with such differences, all used some measure of total area as a primary descriptive characteristic. HCAD and KCDA used net rentable area (NRA), which is gross building (floor) area minus vertical penetrations. MPAC uses gross leasable area (GLA). CCAO’s valuation spreadsheet allowed for discrepancies in area measurements. None of the North American agencies explicitly considered size adjustments. However, all segregated retail and parking space (the latter being measured on a stall basis), with KCDA distinguishing between daily and monthly spaces. HCAD distinguished restaurant space from retail space. CCAO recorded storage area.
Use Attributes
Office buildings obviously are designed for office use. Thus, “use” defines a submarket rather than a variable. However, the question of whether the “highest and best” use of particular office buildings is as office space may be relevant, especially in the case of older buildings. (Of course, assessors are warranted in treading carefully when deeming that a use other than current use is the highest and best use. In Ontario, property is valued on a current-use basis, and annual rental value inherently is on a current-use basis.) As noted, subsidiary uses, such as parking and retail spaces represent use variables that usually need to be considered in valuation. CCAO finds retail space to be an important attribute. HCAD considers major tenant types (e.g., petroleum, energy, banks, lawyers, technology). A “use” attribute that has “size” implications as well is the size of tenancies. Both HCAD and MPAC find average tenant size to be important. MPAC’s rent roll form contains a size field. The size and location of tenancies often can be obtained from plans maintained by building managers.
Of course, use categories and codes need to be established. CCAO recently converted from a traditional coding system developed for a former cost manual to Marshall and Swift occupancy groups.
Quality Attributes
Quality is an important yet often elusive property attribute. Office building market participants commonly use two informal and overlapping ways of classifying the overall quality office buildings.26 One has an international perspective and the other, a metropolitan perspective. The international scheme contains three classes: investment, institutional, and speculative.
25 BOMA International, 1996, Standard Method for Measuring Floor Area in Office Buildings, ANSI/BOMA/Z65.1-1996. 26 BOMA, which provides details of the building classification systems on its website as a means of standardizing the discussion of office markets, does not recommend publishing the classification ratings for individual properties.

29
Interjurisdictional comparisons could be made of such categories. The metropolitan scheme consists of the alphabetic designations: “A,” “B,” and “C.” Sometimes, a fourth class (D) is used, and it is common to use such designations as AA or A+. Although they traditionally have used quality variables dictated by the cost approach, assessors typically record these designations as well. The best class “As” sometimes are referred to as “Trophy” properties. Because they are somewhat influenced by fashion (designed by a renowned architect, occupied by a particular prestigious tenant, or in a fashionable location), the designations are elusive and impermanent. (Most of the buildings of interest to this study would be in the “A” or “B” categories. However, making interjurisdictional comparisons of, say, class A buildings would be unwise.)
On the other hand, assessors traditionally have relied on factors needed to apply the cost approach (e.g., structural type, workmanship). Currently, most rely on the Marshall Valuation Service, which also has used letters to designate construction categories (A, fireproofed steel frame; B, fireproofed reinforced concrete frame; C, masonry load-bearing walls; D, wood frame; and E, pre-fabricated metal frame). HCAD has attempted to link the two approaches.
Age is used as a surrogate for—or it figures in—building quality in two main ways. Chronological age or effective age (which takes into account maintenance and modernization efforts) is used to determine depreciation allowances under the cost approach. A measure of age also is used in estimates of remaining economic life, which is directly used in some income approach techniques and is a stratification factor in others. In addition, age often is a factor in designating a building as class A, B, or C, and it may have an influence on expense allowances. All of the agencies reviewed consider age an important factor, and they all recorded year built. Older buildings may have obsolete elevators and HVAC systems, and they may not be able to accommodate modern data processing and communication systems easily.
Other Attributes and Data Elements
Most of the agencies stored photographic images to assist in describing properties and to document attribute decisions. Databases generally recorded the appraiser or analyst responsible for a property, and some held information on lawyers and appraisers representing taxpayers.
Although not a physical attribute, tenant quality is seen as an important factor in explaining a building’s performance. Except for being an implicit factor that reflects a building’s alphabetic classification, none of the agencies reviewed formally consider tenant quality.
Data Maintenance
Given that the major office building population is widely known and that major developments are widely publicized, none of the North American districts reviewed devoted many resources to re-inspecting properties. KCDA has a statutory requirement to physically inspect every property at least once every six years. Approximately 20 percent of the properties within the office building specialty are inspected each year. There (and elsewhere), an “inspection” in conjunction with a revaluation might consist of a visit to the lobby and a representative floor and ensuring that photographs were reasonably current. (“Referencers” [data collectors] from the VOA inspect each premises on a cyclical basis to verify both its condition and the general condition of the building.)

30
All agencies rely on permit data to alert them to new construction and major renovations. MPAC is working on an electronic exchange of zoning and permit data with municipalities through a system known as Municipal Connect. Construction plans would be used to obtain or verify area measurements and to obtain necessary construction details.
Applying the Income Approach Overview
Expected practice
Use of direct capitalization
Basis Standard on Mass Appraisal of Real Property, section 4.4 (implicitly)
Applying the income approach fundamentally involves (a) estimating the future income stream over the remaining economic life of a property and (b), using a “discount rate” or rate-of-return on investments of comparable risk, to “capitalize” that stream into a present value as of the valuation date. The income approach is theoretically preferred in the valuation of commonly rented properties because it mirrors the thinking of market participants. (Of course, it is not directly applicable to owner-occupied office buildings.) There are, however, several approaches and techniques that can be used in applying the income approach. A basic choice is between “direct capitalization” models (V = I / R, where value equals income divided by rate and where I is net income) and more complex “yield capitalization” models (like discounted cash flow analysis—or DCF, which explicitly consider more than one year’s income). The agencies studied generally rely on direct capitalization. 27 Yield capitalization methods require assumptions that are difficult to support in an appeal, except in rare instances such as in single-tenant buildings when the tenant vacated the building.
Although the actual data may be held in separate tables in a database management system and although the components usually are estimated separately, the final valuation algorithm generally resembles the chain of calculations shown in figure 5. In fact, the North American agencies display, if not develop, the results of their valuation activities in spreadsheets (CCAO’s and HCAD’s production systems use worksheets that are property specifc). Essentially, stratified value per-unit models are used. In these, typical rates per square foot (or other area measure) for the stratum in question are developed for income and expenses. Selected details of the spreadsheets will be described later.
27 The Valuation Office Agency uses the comparative method to estimate the annual rental value of each occupancy.

31
Figure 5: Generalized Income Approach Process
(1) (2) (3) (4) (5) (6) (7) (8) (9) (10) (11)
No of
units *
Rent per unit
= PGI - VCL = EGR + Oth inc. = EGI - Exp = NOI ⁄ Cap
rate = MV
As will be described, the first step in this valuation algorithm is to estimate the potential gross (maximum possible) income from rent (PGI, column 3). It is determined by multiplying the number of units (1) by the current market rent per unit (2). Only when the demand for rental properties exceeds the supply would actual rental income approach PGI, so appraisers reduce PGI to allow for vacancy and collection losses (VCL, column 4) to arrive at effective gross income from rent (EGR, column 5). Thus it also is important to study typical vacancy rates and to attempt to quantify typical collection losses. Some properties may receive income from other sources (such as parking), so it also is necessary to estimate the amount of other income that a property would be expected to generate (“Oth inc,” column 6), which would be added to EGR to arrive at effective gross income (EGI, column 7). A further issue is whether to classify recoveries from net leases as income or as a deduction from expenses. Although EGI may be capitalized to estimate market values, better practice is to deduct the property-related expenses that normally would be incurred in generating EGI (Exp, column 8) and capitalizing net operating income (NOI, column 9) instead. The analysis of expenses is as complicated as the analysis of income, as will be discussed. Any reported expenses that relate more to the business enterprise than to the property (such as mortgage payments and income taxes) must be disallowed. Another issue is the treatment of property taxes. Year-to-year fluctuations needed to be smoothed out and typical levels of expense found. The final analytical step is to find an appropriate overall capitalization rate (Cap rate, column 10).
The usual approach in analyzing income and expense data is to enter the data for a number of properties of a given type into a spreadsheet and use that to estimate per-unit income averages and expense ratios that are both “typical” and “stabilized.” After reported data are entered into tables, the range in amounts per unit is examined. If the range is narrow, a simple model based on typical per-unit amounts could be developed. Although not common with large office buildings, assessors’ offices also can use regression models to estimate EGI per unit, expense ratios, and overall capitalization rates. Estimates of these figures can then be input into whichever capitalization technique that the office uses.
Income and Expense Data Needs
Data on current rents and operating expenses are crucial to an effective application of the income approach. Although potentially plentiful, acquiring rental property income and expense data usually is more difficult than acquiring sales data. Although rental rates are publicly advertised, they may not closely correspond to actual income, which along with operating expenses, is considered proprietary by most owners and managers. Income and expense data also are needed in a standardized form, and all of the agencies reviewed have developed standard income and expense data collection forms. Interpretation of the data depends on the nature of leases.

32
Two data acquisition strategies are available: (1) using surveys to obtain property-specific data from tenants, managers, and owners and (2) compiling general data from trade sources.
Income and Expense Data Surveys
Expected practice
A system for routinely surveying building owners, managers, and tenants to obtain current rent, income, and expense data.
Basis Standard on Mass Appraisal of Real Property, section 3.5
The survey strategy requires carefully designed questionnaires to be distributed to owners, their agents, tenants, or a combination of these. To encourage more useful responses, separate questionnaires can developed for major categories of rental property. The questionnaires would state the purpose of, and authority for, the request; provide information about when and where they are to be filed; provide a contact for additional information about the request or assistance in complying with it; and ask for details on the property, leases, rental rates and other sources of income, vacancy rates, collection losses, recoveries, and major categories of expenses (including who is responsible for paying them). Useful data are easier to obtain if the surveys match industry accounting categories, such as BOMA’s.
Although all the agencies studied regularly used questionnaires to collect income and expense data, MPAC’s program is noteworthy. It seeks detailed information on rents and summary information on income and expenses. Its rental data request essentially asks for a rent roll in a standardized format with details on each lease. Its income and expense questionnaire also is nicely detailed. MPAC also requests copies of a standard lease and a floor plan. (Although not for large office and retail properties, MPAC allows respondents to submit financial statements in lieu of the income and expense questionnaire.)
VOA’s rent returns, which are sent to occupiers, (in paper and electronic [MERI] forms) are well designed. They are formatted so that instructions are alongside questions. Their flow elicits information in a logical yet flexible structure. They provide places to explain specific circumstances.
33
A better practice
Request rent rolls and the details of leases.
All of the agencies reviewed attempt to obtain copies or synopses of leases, and they have a picture of typical leases. As noted, MPAC requests details on each lease and asks for a copy of standard leases. The request allows respondents to check off whether an expense item is included in rent. The VOA’s rent returns are designed to elicit information about actual lease provisions, making it easy to identify where actual leases deviate from assumptions underlying annual rental value and where adjustments may be needed.
It should be noted that IAAO 2003a, page 20, recommends against detailed information requests on the grounds that survey response rates would be reduced. Accepting this advice would preclude the use of sophisticated income and expense models in the valuation of complex properties such as large office buildings. It also ignores the existence of laws mandating data disclosures. Notably, MPAC and VOA have taken pains to tailor their information requests to match industry standards.
A better practice
Mandatory disclosure of rental property income and expense data when requested
MPAC and VOA have the legal authority to demand income and expense data. The authority is coupled with the duty to hold such data confidential. (Connecticut and New Jersey mandate the disclosure of income and expense data, and data from individual returns are treated confidentially). More commonly, disclosures are required during the appeals process, when the failure to comply can jeopardize the chances of a successful appeal.
Estimating income-based models from voluntarily supplied data has the risk of biased results if, as is often is the case, owners of distressed properties are more likely to comply than owners in more favorable circumstances. Respondents generally may be tempted to minimize income and maximize expenses. Additionally, larger properties may have more complex, and thus more difficult to interpret, income and expense accounting statements.
When a request is not complied with, both MPAC and VOA have found longstanding enforcement systems to be cumbersome and ineffective. Formerly in England, the failure to file a return was a criminal offence, which was too expensive to prosecute. Now civil penalties (fines) can be assessed after a warning. Fines (which the municipality receives) also are MPAC’s enforcement mechanism.

34
A promising idea
Automate the filing of income and expense data
MPAC and VOA have introduced programs to accept electronic submission of income and expense disclosures. MPAC’s program is known as the Tenant Information Program (TIP), and the VOA program is known as MERI (for Multiple Electronic Rental Information). TIP came about because apartment owners wanted to automate their data submissions requirements (which included information for census purposes about their tenants). MPAC was quick to realize that income and expense data submissions could be automated as well, and it approached property management system software providers about its needs. Arrangements to automate income and expense data were made with several, including Lnyx Systems, Inc.; Realm Business Solutions, Inc.; Spectra Computer Solutions, Ltd.; and Yardi Systems. Data may be entered through these providers, directly to the MPAC website through a secure link, or on paper forms. VOA’s MERI program is part if its strategy to use the Internet effectively and thereby effect cost savings while making taxpayer compliance more convenient.
External (Third-Party) Market Information Sources
Expected practice
Subscriptions to applicable commercial property market information sources
Basis Standard on Automated Valuation Models (AVMs), section 6.2
The valuation process requires general market data as well as property-specific data. As the agencies reviewed amply demonstrate, assessment offices can make use of a variety of sources of data about real estate markets in general and the office market in particular. Examples of sources are given below, and details of their services can be found on their websites (appendix A2) or in appendix A3.
Data Services. The leading companies that publish data on sales prices and other details about specific properties currently include:
• CoStar Group publishes a number of real estate information products for the real estate industry. Most of the North American districts reviewed purchased on-line access to CoStar’s sales database. The database covers about fifty US markets and provides detailed and verified information on sales of commercial properties, including office buildings.

35
• Reis, Inc., offers real estate market data, news, and research services on a subscription basis. Offices are among the markets its studies.
These services provide confirmation of sales and may provide information not available from official sources.
Professional and Trade Associations. Several professional and trade associations have longstanding experience reports. Associations that publish data on the office market include:
Χ The Building Owners and Managers Association (BOMA) publishes the Experience Exchange Report annually.
Χ The National Council of Real Estate Investment Fiduciaries (NCREIF) maintains the NCREIF Property Index (NPI, formerly, the Russell/NCREIF Property Index).
Χ The Institute of Real Estate Management (IREM) annually publishes Income/Expense Analysis: Offices.
Advisors. PricewaterhouseCoopers (PWC) is one of the more prominent firms of real estate advisors that publishes material that focuses on the office and other segments of the commercial property market. Its products include:
Χ Korpacz Real Estate Investor Survey—a quarterly survey of major institutional real estate investors and analysis of major markets, including several major-city office markets. The survey provides insights into how investors value properties.
Χ Real Estate Value Cycles—a semiannual analysis of the cyclicality of vacancy rates for five property types in fifty-four metropolitan areas.
Χ Emerging Trends in Real Estate—a longstanding high-level annual survey of commercial real estate investors.
Investors. Major real estate investment firms also publish information. For example, Prudential Real Estate Investors publishes in downloadable form accessible reports on a variety of topics.
In addition, valuers can develop a network of personal data sources. HCAD made this a centerpiece of its appraisal program. Each year, the Complex Properties group schedules about ten “pulse-taking” meetings with major asset managers. The effort helps build industry support for the appraisal program, which is especially important in Houston’s post-Enron depressed office market.
Pulling It Together. At least in major office markets, the wealth of data available from industry sources may be a mixed blessing. Analysts must reconcile differences and screen out fluff. It generally is felt that industry sources are less reliable in downturns. However, the reward from analyzing industry data is a framework for evaluating the validity of locally collected data or a defensible set of alternative value indicators. All of the agencies reviewed did a credible job of distilling the information available. KCDA publishes its conclusions in its summary reports.

36
A promising idea
Publish property market reports containing summary statistics derived from local market research.
Assessment agencies that publish property market statistics include the VAO and the Hong Kong Rating and Valuation Department, which has long published property market statistics.28 In making available useful information about property markets, such programs tend to burnish the reputation of the valuation agency.
Income Analysis
Expected practice
Analysis of current market rents and the factors that affect them
Basis Standard on Mass Appraisal of Real Property, section 3.1
The aim of income analysis is to estimate current market rents and the income that those rents imply in current market conditions. As suggested in columns 1 through 7 of figure 5 (above), income analysis embraces (a) estimating potential gross income from rent (PGI, column 3); (b) estimating by how much this theoretical maximum should be reduced to reflect such things as vacancy and collection losses (VCL, column 4) to arrive at effective gross income from rent (EGR, column 5); and (c) determining whether—and by how much—income other sources (such as parking, “Oth inc,” column 6) should be added to the equation to arrive at effective gross income (EGI, column 7). As will be seen, current market realities add complexity to this simple algorithm.
In essence, one or more income models are developed. In the North American agencies studied, stratified value-per-unit (square foot or square meter) models were developed for office buildings. Expressing rent/income per unit of area reflects how rents typically are quoted and facilitates comparisons among office building strata. MPAC has used the regression analysis capabilities of Lotus 123 to estimate retail rents, and it is considering using SPSS. Fairfield et al. reports on a pilot project in the City of Calgary, Alberta, to estimate rents per square foot using a multiplicative regression model.
All of the agencies reviewed were fully cognizant that, in accordance with professional standards, income estimates should include only income that properly would be ascribed to the real property in its location, not the businesses occupying the premises, the quality of property
28 See http://www.rvd.gov.hk/en/publications/pro-review.htm and http://www.voa.gov.uk/publications/property_market_report/pmr-jul-05/index.htm.

37
management, or intangible factors, such as goodwill. They also recognized that rental rates could vary with the size, location, or use of the space. Each had systems that could accommodate such differences with varying degrees of success. They all recognized that rents negotiated near the valuation date best reflected current market rents. If actual rents were close to market rents, they might be used. However, they recognized that face rents or headline rents may not reflect actual negotiated rents. Moreover, rent-free periods (concessions) needed to be taken into account.
Because it is difficult for an assessor to evaluate management quality, typical income and expense figures, are deemed to reflect typical management. Income flows are averaged across comparable businesses to reflect typical management and smoothed or stabilized across years to eliminate random yearly fluctuations. Of course, simple averaging is of little help in identifying specific evidence of non-typical management. Is a negative deviation between contract (actual) rent and market rent (the rent that would be expected if the lease were negotiated as of the date of appraisal) evidence of bad lease writing, and hence, poor management? What if the situation is reversed?
It is generally accepted that when contract rents deviate from current market rents, sales of such properties reflect leased fee interests rather than fee simple interests. This issue is recognized in the IAAO Standard on Ratio Studies, but there is little guidance on how sales (or indicated OARs) should be screened and adjusted for appraisal purposes.
Although often lumped in practice, losses from vacancies and from uncollected rents are two different things. Except when a former tenant continues to pay rent, vacancy rates are directly observable. Collection losses attributable to tenant defaults would only show up in operating statements. However, concessions are a form of foregone rent, which would not. In practice, vacancy and collection loss allowances tend to be based mostly on vacancy rates. However, allowances normally are standardized by averaging across properties and over years. Some of the agencies studied display both the actual vacancy rate and the allowed rate.
In net leases, tenants are responsible for all or part of specified expense items. They may pay them directly or reimburse the owner. Reimbursements, however, may not occur in the same year—or they may not be made at all, which would be analogous to a collection loss. Issues such as these need to be sorted out. MPAC’s rental data request provides for recording certain recoveries as an income item in the year in which they are received.
As was previously suggested, the agencies analyze income from subsidiary sources such as retail and parking separately. HCAD attempts to adjust for rents that entitle the tenant to parking. KCDA and MPAC display both reported and normalized income figures in working copies of spreadsheets. EGI figures generally are presented in monetary and per square foot amounts.

38
Expense Analysis
Expected practice
Analysis of operating expenses and the factors that affect them.
Basis Standard on Mass Appraisal of Real Property, section 4.4
The aim of expense analysis is to estimate the amounts (expense allowances) by which EGI should be reduced to arrive at NOI (see figure 5). Even with standardized forms, it can be difficult to express expense data in truly comparable terms because of differences in fiscal years, in accounting systems, and in the willingness of owners and managers to supply complete and accurate data. Nevertheless, the North American agencies studied developed stratified models of allowable expenses per square foot (meter), of percentages of EGI, or both for office buildings. The indicated amounts were compared to industry averages.
Most categories of allowable expenses are uncontroversial. These include “variable” expenses for such things as cleaning, repairs and maintenance, utilities, road and grounds, security, and administration. Allowable “fixed” expense categories include building insurance and licenses and the like. (Property taxes are discussed below.)
More problematic categories of expense include property taxes, “pass-throughs” (recoveries), leasing commissions, and tenant improvement allowance.
• Property taxes—taxpayers generally treat property taxes as “fixed” expenses. IAAO generally advocates that they be treated as a variable expense, because they are based, at least in part, on the assessor’s determination of market value. Thus, they are not recognized as an allowable expense; instead the capitalization rate is increased by the estimated effective tax rate. In reality, property tax payments in a regime of increase limits may neither be fixed nor as variable as allowing for them in the capitalization rate would imply.
• Recoveries—payments made by tenants to the landlord for normal operating expenses under the provisions of a net lease can be problematic in that the assessor may fail to recognize them or that they are not treated consistently. The MPAC income and expense questionnaire asks for details on recoveries of various types allowing them to be properly recognized. CCAO treats recoveries as income when they are reported.
• Leasing commissions—whether and how to recognize leasing commissions, which are a common item in depressed markets, is an unsettled issue. They vary and are not widely quoted. One solution, which HCAD has adopted, is to make standard allowances; it

39
assumes leasing commissions are 4 percent for new leases and 2 percent for renewals. (MPAC requests that they be recorded in its income and expense questionnaire.)
• Tenant improvements (improvements demanded by a prospective tenant over and above ordinary painting and similar refurbishments) are another problematic item. Generally, however, such expense allowances are weighted by the amount of space to which they apply in a year (the ratio of new to existing tenants) and are amortized over the normal life of a lease (CCAO and HCAD).
Capitalization Rates
Expected practice
Analysis of direct and indirect evidence of capitalization rates
Basis Standard on Mass Appraisal of Real Property, section 4.4 (implicitly)
The aim of capitalization rate analysis is to select the rate (or rates) to use to find the present capital value of a stream of income. The selection of the rate to capitalize NOI arguably is the most crucial decision in applying the income approach. The most straightforward approach to estimating overall capitalization rates is to divide the net income of each recently sold property by its sale price and find the typical ratio for the type of property.
The North American agencies reviewed placed considerable reliance on published overall capitalization rates (OARs), such as those reported in the Korpacz Real Estate Investor Survey. The benefit of this approach is not having to justify another rate. The disadvantage is that the rates may not represent current market realities, especially in peaks and troughs, as some research has suggested (Sivitanides et al.). HCAD takes the precaution of building up overall capitalization rates. However, when an office building was sold and the office had a current estimate of net income, the agencies would compute the indicated OAR. They studied overall rate patterns, and compared the rate with typical published rates. KCDA has guidelines for analyzing sales to develop OARs. All were troubled by the high sale prices and commensurately low OARs on trophy property sales.
Developing the Value Estimate
In direct capitalization, the development of the valuation estimate is straightforward: value equals NOI divided by OAR. To achieve the required comparability (see Gloudemans, 159), properties are stratified according to such characteristics as quality of office building, size, and location. Given the range of observed income and expense rates and the range in capitalization rates, the component estimates discussed above usually cannot be considered precise. For this reason, the agencies reviewed made extensive use of the “what if” capacities of spreadsheets.

40
Similar in concept to HCAD’s worksheet, CCAO’s new valuation worksheets has several windows that can be used to develop estimates of value under the income approach. The “income analysis” window contains panels for documenting the estimate of gross income from each source (number of units and the estimated market rent per unit); the vacancy and collection loss percentage used and the resulting monetary amount (to be subtracted from estimated gross income); and operating expenses per square foot and the resultant monetary amount. The window also includes a panel for comparing actual and stabilized figures for a given year. The “capitalization” window allows a valuation analyst to see summary information on capitalization rate statistics by property type, the overall rate and the effective tax rate (or “load”) selected for a particular property, the net operating income estimate for the property, and the resultant value estimate.
Applying the Sales Comparison Approach In a market value-based property tax system, the sales comparison approach is theoretically preferred when there are sufficient sales, which seldom is the case with large office buildings. However, large assessment districts may have sufficient sales to use direct sales comparisons in the valuation of typical apartment, retail, office, warehouse, and industrial properties. In any event, the agencies reviewed examine every office building sale carefully.
Acquiring and Processing Sales Data
Expected practice
A comprehensive effort to collect sales data, build a sales file, and evaluate the usefulness of each sale in appraisal and ratio studies.
Basis Standard on Mass Appraisal of Real Property, section 4.3
The four North American agencies reviewed attempted to collect, analyze, and store information about every sale of an office property. All except HCAD had the advantage of a law requiring the disclosure of sales information. 29 Nevertheless, standard disclosure forms, the design of which is dominated by the needs of residential property buyers and sellers, typically do not provide the information needed to confirm and properly evaluate complex sales. Consequently, all the agencies took several steps to ensure that information was correct and to get behind every sale. They attempted to discuss each sale with a party or a person familiar with the transaction. They also consulted sources like CoStar and Reis. In particular, they attempted to understand each property’s lease situation, the market environment at the time of the sale, and other possible motivations of the buyer or seller, especially when they were foreigners or when the property in question was highly regarded.
29 Texas is among the ten or so states that handicap property tax administration by not mandating sales disclosures.

41
For example, CCAO, which has had no shortage of sales of top loop office buildings (69 of 100 sold at least once since 1995), wisely has adopted the view that it is irrational to regard sales prices as irrational. The challenge is to understand the sale. Among other things, it attempts to place each sale in a point in the real estate cycle and relate that point to the valuation date in the County’s triennial revaluation cycle. Its working valuation spreadsheet allowed for data on the two most recent sales to be displayed.
A better practice
Do not characterize sales of investment-grade properties as “irrational.”
CCAO’s policy is that the sale of an investment grade property never is “irrational” or “unexplainable.” It attempts to reconcile systematically differences between the office’s value estimate and the sale price.
Modeling Sales
None of the agencies attempted to model sales prices of large office buildings as a basis for real estate assessments. However, they all attempt to compute indicated overall rates, and they look for patterns and trends in those rates and in prices per square foot (or meter).
A better practice
Use statistical and graphical analysis to detect relationships that stratification does not reveal.
MPAC and VOA have made some use of the graphical capabilities of their spreadsheet programs, and MPAC has done some linear regressions.
Applying the Cost Approach As is well-known, assessment districts have relied on the cost approach for decades. Largely because they have the capacity to do so and because standards recommend use of all applicable valuation approaches, all the North American agencies reviewed generate estimates of the depreciated replacement costs of office buildings. However, with the exception of newly constructed and owner-occupied office buildings, none of the districts relied on the approach. Except for MPAC, none of the districts attempt to specify and calibrate cost models locally. (MPAC has developed a cost modeling system known as ACS [automated costing service].) Instead, they rely on a cost-estimating service, such as the Marshall Valuation Service, which, in addition to cost models, also publishes time and location modifiers for model costs. However, the districts do not accept such cost estimates without question. KCDA found the ratio between its cost approach estimates and other estimates exhibited too much variation.

42
Value Review & Reconciliation
Expected practice
A procedure for reviewing system-generated estimates of market values for reasonableness and consistency.
Basis Standard on Automated Valuation Models (AVMs), section 8.8
Accepted practice is to review system-generated preliminary estimates of market values for reasonableness and consistency before issuing assessment notices. As part of this process, the reviewer would ensure that each selected estimate was the one that appeared most credible of the available estimates when more than one approach to value was used. The North American agencies reviewed generally accepted estimates based on the income approach in preference to cost approach-based estimates.
Review procedures need to be structured so that neither the initial estimates nor any revised estimates exhibit favoritism or other bias. The agencies reviewed generally required supervisory approval of the values of major properties. In KCDA, the reasons for any departures from normal models were documented. CCAO and VOA employ reviews by quality control staff.
Documentation and Reporting The Uniform Standards of Professional Appraisal Practice (USPAP) calls for greater documentation and communication of appraisals than has been traditional in property tax administration. Traditional documentation essentially is of two types: (1) working documents and (2) official documents (like legally required assessment notices and assessment rolls).
Working Documentation
Working documentation includes records of the physical attributes of properties (like traditional property record cards), spreadsheets used in analysis, tables of standard income and expense rates, and summaries of the values of individual properties.
HCAD, KCDA, and MPAC have developed a well-designed, computer-generated income approach summary reports that detail the basis of their income and expense estimates, the capitalization rate used, and other details. CCAO is developing similar reports in its new computer system. VOA has similar documentation of the details of its models and value estimates.

43
Reporting
Largely because income and expense data for specific properties generally are regarded as confidential, assessors have been careful about the disclosure of sensitive working documents, such as income and expense analysis worksheets. Usually, a property owner could obtain the details of her or his assessments but could not obtain information about the details of other properties other than property characteristics and appraised values. While still respecting confidentiality, assessors are making public more information about the economic basis of assessments. They recognize that better communication can increase the credibility of the assessment program and thereby eliminate merely protective appeals. All of the districts reviewed would give taxpayers summary valuation reports.
A better practice
Publish a USPAP-compliant “mass appraisal summary report.”
As noted, King County attempts to document fully the basis of its valuations in “summary mass appraisal reports” in compliance with USPAP, and CCAO is moving in the same direction under its policy of openness. Although not yet on its website, CCAO prepares a report of each township revaluation project. As discussed below, CCAO also is developing full narrative report template for use in assessment appeals.
KCDA’s major office building summary mass appraisal report provides a remarkable amount of detail on how value estimates were developed. The introductory section of the report contains appraisal date, the assessment roll affected, and the previous physical inspection dates. It also provides summary statistics of the population of properties (194) and of a sales ratio study. The introduction concludes that the ratio study results are inconclusive, because there were only nine usable sales, one of which was questionable. A section entitled “analysis process” identifies the responsible appraiser, discusses his evaluation of highest and best use, and describes how sales data were obtained. Each of the three approaches to value was considered, with the sales comparison approach receiving little weight due to the paucity of sales. Although the cost approach was applied (using the Marshall Valuation Service), it was not relied on during the reconciliation process. The development of the income approach is described in detail, and valuation parameters such as market rents, vacancy rates, and expense allowances are documented for each submarket. The conclusions are buttressed by a detailed analysis of third-party market data. As required by USPAP, assumptions, departures, and limiting conditions are disclosed—notably a policy of not adjusting sales for time over the two-year period of sales analyzed. The next section described the office market in King County. For administrative consistency, the report contains a ratio study analysis, the paucity of sales notwithstanding.
In 2004, CCAO took another approach: it publicized the new assessments of the “top 100” Loop office buildings. The release commented on the conclusions the office had drawn about the office market and also detailed the previous assessments and any sales prices.

44
Appeal System No assessment system is perfect, and some assessments will be erroneous. Because they are designed to address such problems, appeal procedures serve an important quality control function. An assessor’s responsibility in an appeal system depends on how it is structured. In Illinois, an initial appeal is to the assessor; thereafter, a taxpayer may appeal to the County Board of Review and to the State Property Tax Appeal Board. In Ontario, a taxpayer may request a reconsideration of an assessment and appeal it to an independent assessment review board. In England, initial complaints (proposals) also are made to the VOA, and appellants may then appeal to independent valuation tribunals. In Texas and Washington, initial appeals are made to independent local bodies (an appraisal review board or a county board of equalization, respectively).
Expected practice
Systems for administering large volumes of appeals and for marshalling evidence to support valuation conclusions
Basis Standard on Mass Appraisal of Real Property, section 5.4.2 (implicitly)
When the initial appeal is to the assessor, the assessor must manage the entire appeal process: record the appeals, hear the appellants (or consider their written submissions), conduct research, determine whether appealed assessments should be altered or not, communicate the findings, and implement any changes. The workload can be considerable. CCAO processes over 100,000 appeals annually, and a significant percentage of non-residential assessments are appealed in each triennial reassessment. Virtually all non-residential assessments are appealed in England in each revaluation cycle. Both CCAO and VOA are striving to reduce appeals by improving the initial quality of assessments.
Even when the appeal is to an independent body, the assessor often must defend the assessment and may provide administrative support to the board. Valuation support activities involve field checks of appealed properties and comparables, analysis of assessments and any information provided by taxpayers in advance of appeal hearings, and presenting the assessor’s case before the board succinctly and professionally. Usually checklists and templates are developed to ensure appeals are responded to
A better practice
Develop a computer-supported “USPAP compliant” appraisal report to assist in the defense of the assessments of high-value properties.
When a high-value property’s assessment is appealed, the taxpayer typically will buttress its case by commissioning an appraisal by a professionally qualified independent appraiser. The heft of

45
the appraiser’s credentials and of the appraisal report can be persuasive even when the appraiser’s analysis seems slanted. Although CCAO is not formally the defendant in appeals beyond its office, the Board of Review, which is the defendant, frequently asks for CCAO’s assistance.
Experience revealed that an appraisal report that resembled the reports offered by single-property appraisers were more effective than other defense strategies. Lengthy narrative reports are expensive to assemble. Consequently, CCAO has developed an appraisal report template that links a text document, the property attribute database, and tables with valuation parameters, thereby reducing keystroking and transcription errors. The text can be edited and parameters can be changed with the resulting value estimate being updated.
Conclusions and Recommendations
Section 4 contains conclusions and recommendations addressed to policy makers, practitioners, and organizations like the Lincoln Institute of Land Policy (LILP) and the International Association of Assessing Officers (IAAO) that bridge policy and practice and that enunciate standards of practice. Although they focus on the situation in the United States, some of the conclusions and recommendations may have broader application.
Policy studies—the property tax policy debate in the United States is hampered by a lack of data on the underlying value of real estate assets in various sectors of the economy by region and over time. Ideally, some institutional arrangement would be found that would recreate the kinds of empirical studies that the Census Bureau formerly made in its TPV studies. Desirably, nationally consistent data would be published for sectors of the real estate market and regions. In addition, estimating methods would detect short-term cyclical movements, especially in office and other commercial markets. Such studies could serve as the basis for policy studies in property taxation that the now defunct Advisory Commission on Intergovernmental Relations formerly made.
A policy issue that came into clearer focus during the course of this study is the increasingly tenuous link between valuation and taxation. When taxable values are only distantly related to current market values, whether as a result of an outdated valuation, an arcane equalization procedure like that in Illinois, or limits on changes in tax assessments like those in England and Ontario, feedback on the efficacy of the tax system is distorted. Taxpayers may not scrutinize valuations. Assessors may be lulled into complacency.
Another issue with policy implications that came into clearer focus is the lack of attention paid to cost-effective management of valuation programs. Improving the accuracy of valuations often comes at a cost. Yet the appraisal profession—broadly defined—has paid scant attention to whether increased expenditures on valuation are warranted in terms of either increased accuracy or reducing the risks of valuation errors. In the arena of valuations for property tax purposes, the responsibility for funding valuation programs may not be well aligned with the exposure of either lost revenues or refunds following successful appeals.
Clearly, such efforts as that of Dye et al., the Kansas Legislative Division of Post Audit, and the Hong Kong Rating and Valuation Department suggest that a better understanding of the interaction between the economy, tax policy, and assessment practices is possible without major
46
new institutional initiatives. LILP has an enviable record of fostering useful research, and IAAO could further its reputation as a clearinghouse.
Practices and standards—a general conclusion is that professional standards need to be more specific. Too often, the standards fall back on expressions like “acceptable” (as in scope of work) without providing measurable standards. There also is a need to bridge disciplines (assessors, single-property appraisers, and academics) to reach a common understanding of valuation issues and to address them with a common vocabulary (see eREI, for example).
A comparison of what standards and treatises say and the practices of the agencies reviewed in this report reveal numerous opportunities to improve the former. Issues that need addressing include:
• More specific guidance on how to evaluate sales of investment grade properties (and to reconcile inconsistencies in market fundamentals—falling rents, rising vacancies, and rising prices—if they persist).
• Specific (and consistent) guidance on lease analysis and the collection and analysis of income and expense data in a multi-tenant property.
IAAO should consider developing standards on performance audits and recommended performance measures. Further research on using multivariate methods in the appraisal of large office buildings would seem warranted. This research could include better ways to specify location and quality differences. Although they have not yet been employed in the valuation of land in central business districts, where value gradients are especially steep and the risks of interpolation errors would be great, geostatistical methods and techniques like location value response surface analysis (LVRSA) would be worthy of exploration.

47
References
Almy, Richard R., Robert C. Denne, Robert J. Gloudemans, and Russ Thimgan. 2003. Assessment Practices: Self-Evaluation Guide, 2nd edition. Chicago [Now Kansas City]: International Association of Assessing Officers.
Almy, Richard R., Robert J. Gloudemans, Robert C. Denne, and Stuart W. Miller. 1978. Improving Real Property Assessment: A Reference Manual. Chicago [now Kansas City]: International Association of Assessing Officers.
Appraisal Institute. 1992. The Appraisal of Real Estate. 10th edition. Chicago: Appraisal Institute. (Also 12th edition, 2001.)
Appraisal Standards Board. 2005. Uniform Standards of Professional Appraisal Practice and Advisory Opinions, 2005 edition. Washington, DC: The Appraisal Foundation. (Cited as “USPAP.”)
“As safe as what?” 2002. The Economist (31 August 2002): 57-58.
Building Owners and Managers Association International. 2005. 2005 BOMA Experience Exchange Report: Official Survey Form. Downloaded from http://www.boma.org.
Calhoun, Charles A. 1996. “OFHEO House Prices Indexes: HPI Technical Description.” Washington, DC: Office of Federal Housing Enterprise Oversight. http://www.ofheo.gov/Media/Archive/house/hpi_tech.pdf.
Case, Karl E., John M. Quigley, and John M. Schiller. 2001. “Comparing Wealth Effects: The Stock Market versus the Housing Market.” Cowles Foundation Discussion Paper No. 1335.
Cook County Assessor’s Office. 1999. 1999 Major Assessment Jurisdiction Survey.
“Cracks in the brick work?” 2004. The Economist (3 January 2004): 51.
Dye, Richard F., Richard R. Almy, and Charlotte Crane. 2003. “Commercial Property Valuation in Cook County.” A study prepared for the Metropolitan Mayors Caucus and funded by the Chicago Community Trust.
Eckert, Joseph K., Robert J. Gloudemans, and Richard R. Almy. 1990. Property Appraisal and Assessment Administration. Chicago: International Association of Assessing Officers.
eREI. n.d. “Commercial Real Estate Research Terms & Data Standards.” A report prepared for the National Association of Realtors, National Center for Real Estate Research. Thousand Oaks, California: eREI.

48
Fairfield, Harvey, Roy Fegan and Léonel St. Amand. 2001. “Alternative Valuation Methods for Downtown Office Properties.” A paper presented at the 67th International Conference on Assessment Administration, 9-12 September 2001, Miami Beach, Florida.
Fisher, Jeffrey D., and Robert S. Martin. 1994. Income Property Valuation. Chicago: Dearborn Financial Publishing, Inc.
Gloudemans, Robert J. 1999. Mass Appraisal of Real Property. Chicago: International Association of Assessing Officers.
“Going through the roof.” 2002. The Economist (30 March 2002): 59-61.
Hartzell, David J., Robert H. Pittman, and David H. Downs. 1994. “An Updated Look at the Size of the U.S. Real Estate Market Portfolio.” The Journal of Real Estate Research 9 (Spring 1994): 197-212.
“In come the waves.” 2005. The Economist (18 June 2005): 66-68.
International Association of Assessing Officers. 2003. Assessment Administration. Chicago [now Kansas City]: International Association of Assessing Officers.
________. 1996. Property Assessment Valuation. 2nd edition. Chicago [now Kansas City]: International Association of Assessing Officers.
________. 1999. Standard on Ratio Studies. Chicago [now Kansas City]: International Association of Assessing Officers. (Can be downloaded from http://www.iaao.org.)
________. 2002. “Standard on Mass Appraisal of Real Property,” Assessment Journal, January/February 2002, pp. 34-51. (Can be downloaded from http://www.iaao.org.)
_________. 2003a. Standard on Automated Valuation Models (AVMs). Chicago [now Kansas City]: International Association of Assessing Officers. (Can be downloaded from http://www.iaao.org.)
________. 2003b. Standard on Facilities, Computers, Equipment, and Supplies. Chicago [now Kansas City]: International Association of Assessing Officers. (Can be downloaded from http://www.iaao.org.)
Kansas Legislative Division of Post Audit. 2002. “Valuing Commercial Buildings for Property Tax Purposes: Determining Whether Current Procedures Ensure Accurate Appraisals at Fair Market Value.” Performance Audit Report.
Kendrick, John W. 1976. The National Wealth of the United States: By Major Sector and Industry. New York, N.Y.: The Conference Board. (Not seen for this project.)
Mahoney, Ryan. 2005. “Businesses Silent on Property Tax Audit Results.” Atlanta Business Chronicle, September 16, 2005.

49
Malpezzi, Stephen, James D. Skilling and Yu-Yun Jessie Yang. 2001. “The Stock of Private Real Estate Capital in U.S. Metropolitan Areas.” Journal of Real Estate Research 22, no. 3: 243-270.
Miles, Mike. 1990. “What Is the Value of All U.S. Real Estate?” Real Estate Review 20 (Summer 1990): 69-77.
Sivitanides, Petros, Jon Southard, Raymond G. Torto, and William C. Wheaton. 2001. “The Determinants of Appraisal-Based Capitalization Rates.” Boston, Mass.: Torto Wheaton Research.
Slade, Barrett A. 2000. “Office Rent Determinants during Market Decline and Recovery.” Journal of Real Estate Research 20, no. 3: 357-380.
U.S Department of Commerce. Bureau of the Census. 1959. 1957 Census of Governments. Vol. 5, Taxable Property Values in the United States. Washington, DC: U.S. Government Printing Office.
________. 1968. 1967 Census of Governments. Vol. 2, Taxable Property Values. Washington, DC: U.S. Government Printing Office.
________. 1973. 1972 Census of Governments. Vol. 2, Taxable Property Values and Assessment-Sale Price Ratios. Issued in two parts. Washington, DC: U.S. Government Printing Office.
________. 1978. 1977 Census of Governments. Vol. 2, Taxable Property Values and Assessment/Sale Price Ratios. Washington, DC: U.S. Government Printing Office.
________. 1984. 1982 Census of Governments. Vol. 2, Taxable Property Values and Assessment-Sales Price Ratios. Washington, DC: U.S. Government Printing Office.
U.S Department of Commerce. Bureau of Economic Analysis. 2003. Fixed Assets and Consumer Durable Goods in the United States: 1925-1999. Washington, DC: U.S. Government Printing Office.
Valuation Office Agency. 2002. “Forward Pan 2002-2007.” http://www.voa.gov.uk.
Woodall, Pam. 2003. “Close to bursting: A survey of property.” The Economist (31 May 2003).

50
Appendices
A1. Acronyms AVM Automated valuation model
BEA Bureau of Economic Analysis (of the U.S. Department of Commerce)
BOMA Building Owners and Managers Association
CAMA Computer-assisted mass appraisal
CCAO Cook County (Illinois) Assessor’s Office
DCF Discount cash flow [analysis]
EGI Effective gross income
EGR Effective gross rent
FRB (U.S.) Federal Reserve Board
GIS Geographic information system
GLA Gross leasable area
HCAD Harris County (Texas) Appraisal District
HPI House price index
IAAO International Association of Assessing Officers
IPS Integrated property system (of MPAC)
IREM National Institute of Real Estate Management
IT Information technology
KCDA King County Department of Assessment
LILP Lincoln Institute of Land Policy
MERI Multiple Electronic Rental Information (the VOA’s automated income and expense data acquisition program)
MPAC (Ontario) Municipal Property Assessment Corporation

51
MSA Metropolitan statistical area
NCREIF National Council of Real Estate Investment Fiduciaries
NIPAs National Income and Product Accounts
NOI Net operating income
NPI NCREIF Property Index
NRA Net rentable area
OAR Overall rate
OASYS Ontario assessment system
OFHEO Office of Federal Housing Enterprise Oversight
PGI Potential gross income
PTAB [Illinois] Property Tax Appeal Board
PWC PricewaterhouseCoopers
TIP Tenant information program (of MPAC)
TPV Taxable Property Values (a now defunct series of studies by the U.S. Bureau of the Census
ULI Urban Land Institute
USPAP Uniform Standards of Professional Appraisal Practice
VCL Vacancy and collection loss [allowance]
VOA Valuation Office Agency (of England and Wales)
A2. Websites
Organization / URL
BOMA International http://www.boma.org
Bureau of Economic Analysis http://www.bea.gov/
52
Organization / URL
Cook County Assessor’s Office http://www.cookcountyassessor.com
CoStar http://www.costar.com
Federal Reserve Board http://www.federalreserve.gov/
Harris County Appraisal District http://www.hcad.org
Hong Kong Rating and Valuation Department http://www.rvd.gov.hk/en/publications/pro-review.htm
Institute of Real Estate Management http://www.irem.org
International Association of Assessing Officers http://www.iaao.org
King County Department of Assessments http://www.metrokc.gov/assessor/
Lincoln Institute of Land Policy http://www.lincolninst.edu
Municipal Property Assessment Corporation http://www.mpac.ca
National Council of Real Estate Investment Fiduciaries http://www.ncreif.com
PricewaterhouseCoopers Valuation Group http://www.pwcreval.com
REIS http://www.reis.com
Valuation Office Agency http://www.voa.gov.uk

53
A3. Sources of Published Office Market Data
BOMA: Experience Exchange Report An annual. The 2004 edition, containing data for 2003, cost $400 for a CD-ROM version; paper and network versions also are available. BOMA also publishes Functional Accounting Guide and Chart of Accounts, (1999 edition $58) and Standard Method for Measuring Floor Areas in an Office Building (1996, $37).
IREM: Income/Expense Analysis: Offices The 2004 edition has been published, and the price of the 304-page book is $350. Individual metropolitan area packages also may be purchased in downloadable PDF or XLS format ($175).
NCREIF: NCREIF Property Index NCREIF publishes a range of products, including: annual subscription to its database, $4,000, quarterly report on property value trends, $1,500.
PWC: Korpacz Real Estate Investor Survey In 2005, an annual on-line subscription was $300; paper had higher rates.
PWC: Real Estate Value Cycles According to the website of the PWC valuation group, the most recent report was for the second quarter of 2003; an annual on-line subscription in 2005 was $195.
ULI: Emerging Trends in Real Estate Formerly published by PWC. The price for the 2005 edition was $60.