Rich diversity of crystallographic phase formation in 2D ...
26
1 Rich diversity of crystallographic phase formation in 2D Rex:Mo1-xS2 (< . ) alloy H. Sharona, 1,2 B. Vishal, 1,2 U. Bhat, 1,2 A. Paul, 1,2 A. Mukherjee, 1,2 S. C. Sarma, 3,4 S. C. Peter, 3,4 and R. Datta 1,2 * 1 International Centre for Materials Science, 2 Chemistry and Physics of Materials Unit, Jawaharlal Nehru Centre for Advanced Scientific Research, Bangalore 560064, India. 3 New Chemistry Unit, 4 School of Advanced Materials, Jawaharlal Nehru Centre for Advanced Scientific Research, Bangalore 560064, India. Abstract We report on the observation of rich variety of crystallographic phase formation in RexMo1-xS2 alloy for x < 0.5. For x < 0.23, no low dimensional super-structural modulation is observed and inter-cation hybridization remains discrete forming dimers to tetramers with increasing Re concentration. For x > 0.23, super-strutural modulaton is observed. Depending on the Re concentrations (x = 0.23, 0.32, 0.38 and 0.45) and its distributions, various types of cation hybridization results in rich variety of low dimensional super-structural modulation as directly revealed by high resolution transmission electron microscopy. These layered alloy system may be useful for various energy and novel device applications. Key Words: ReMoS alloy, MoS2, ReS2
Transcript of Rich diversity of crystallographic phase formation in 2D ...
1
Rich diversity of crystallographic phase formation in 2D Rex:Mo1-xS2 (𝒙 <
𝟎. 𝟓) alloy
H. Sharona,1,2 B. Vishal,1,2 U. Bhat,1,2A. Paul,1,2 A. Mukherjee,1,2 S. C. Sarma,3,4 S. C. Peter,3,4
and R. Datta1,2 *
1International Centre for Materials Science, 2Chemistry and Physics of Materials Unit, Jawaharlal Nehru Centre
for Advanced Scientific Research, Bangalore 560064, India.
3New Chemistry Unit, 4School of Advanced Materials, Jawaharlal Nehru Centre for Advanced Scientific
Research, Bangalore 560064, India.
Abstract
We report on the observation of rich variety of crystallographic phase formation in RexMo1-xS2
alloy for x < 0.5. For x < 0.23, no low dimensional super-structural modulation is observed and
inter-cation hybridization remains discrete forming dimers to tetramers with increasing Re
concentration. For x > 0.23, super-strutural modulaton is observed. Depending on the Re
concentrations (x = 0.23, 0.32, 0.38 and 0.45) and its distributions, various types of cation
hybridization results in rich variety of low dimensional super-structural modulation as directly
revealed by high resolution transmission electron microscopy. These layered alloy system may
be useful for various energy and novel device applications.
Key Words: ReMoS alloy, MoS2, ReS2
2
Corresponding author e-mail: [email protected]
I. Introduction
Atomically thin transition metal dichalcogenides (TMDs) e.g., MoS2, WS2, ReS2 etc. have
attracted immense research attention in recent times due to their unique electronic properties
in monolayer, few layers, and heterostructure forms.1-12 These layered TMDs exhibit various
structural polytypes with distinct properties which are useful in many novel devices and energy
applications.11,13-17 For example, the most stable form of monolayer MoS2 is 1H (trigonal
prismatic, space group 𝑃6̅3/𝑚𝑚𝑐) which is a semiconductor with fundamental direct band gap
of 1.88 eV [𝐾 → 𝐾]. In bulk form, MoS2 is an indirect band gap semiconductor with a band
gap of 1.42 eV [𝛤 → Λ].18 Metastable 1T form of MoS2 is metallic in nature which is useful for
charge extraction and the modulated 1Td semiconducting form is found to be suitable for
hydrogen evolution reaction (HER) and supercapacitor application.19,20 Theoretical
calculations of various other possible phases such as 1Tʹ (√3𝑎 × 𝑎) is predicted to exhibit non-
trivial topological states21 and the trimeric (√3𝑎 × √3𝑎) phase is predicted to be a thinnest
ferroelectric material.22 Since, each phase has their own unique properties, various efforts have
been made to stabilise and engineer such phases.23-26 In this context it is already reported that
Li intercalation stabilizes 2𝑎 × 2𝑎 (1Td) polytype whereas, K intercalation stabilizes
√3𝑎 × √3𝑎 (𝑥 ≈ 0.3) and 2𝑎 × 2𝑎 (1Td) (𝑥 ≤ 0.3) polytypes depending on the K
concentration.27,28
On the other hand, ReS2 belongs to Gr.-VII TMDs (space Gr. 𝑃1̅) which has a distorted
octahedral structure and often termed as 1Td .29 In 1Td phase, four Re atoms hybridizes to form
super-structure. The origin of this type of periodic modulation lies at low dimensional Peierls
distortions which is favoured if the strain energy associated with the modulation is
compensated by opening up a band gap at the Fermi level.30 ReS2 retains its fundamental direct
3
band gap in more than monolayer form unlike MoS2 and this is attributed to its weak interlayer
electronic and vibrational coupling.31 The band gap of ReS2 is 1.52 and 1.42 eV in monolayer
and bulk form, respectively which is advantageous over MoS2 in fabricating various thin
electronic devices.19
As already mentioned that the stabilization of various structural polytypes of layered TMDs
have been reported to exploit their unique properties. Similarly, alloys between different TMDs
have been explored to tailor the structure and properties.32-37 In this context, experimental study
in Mo1-xRexS2 alloy system revealed two different polytypes at 𝑥 = 0.5 and a trimeric
polytype at 𝑥 = 0.25.32 The density functional theory (DFT) based calculation indicated that
the Mo0.5Re0.5S2 alloy may be a suitable candidate for nanoscale switching application
involving transformation between semiconducting to conducting state with a minute
perturbation of ~ 90 meV and shown to be an efficient catalyst for HER.32-38 The effect of Re
substitution in MoS2 lattice on the structure and property has been reported by few groups.24,38-
43 Re prefer to substitute Mo lattice sites43 and act as a n-type dopant by creating a shallow and
deep defect level in bulk and monolayer form, respectively.44,45 HRTEM and HAADF imaging
revealed various Re positions in MoS2 lattice: isolated dopant, dimer, trimer, tetramer and
pathways to phase transition from 2H to 1Td structure of the alloy depending on Re
concentrations.32 A structural cross over from 1H to 1T polytype at 𝑥 = 50% has been
predicted by theoretical calculation.32 The detailed dynamics involved in such a phase
transition can be found in a report where it was shown that the Re atom act as a nucleation
site.43 Subsequent report shows the composition dependent structure of Mo1-xRexS2 (0 < x <
0.2) alloy by X-ray photoelectron spectroscopy where Re-Re undergoes dimerization at x =
0.05 and tetramerization with further increase in Re concentration.39
In the present report, we describe the rich variety of crystallographic phase formation for Re
concentration less than 50% as observed directly under HRTEM. No periodic super-structural
4
modulation is observed for 𝑥 < 0.23, but discrete dimers and tetramers are observed to be
formed depending on Re concentration. For x = 0.23, 0.32, 0.38, and 0.45, different types of
super-structural modulation are observed and the asymmetry in modulation vector increases
with increasing Re concentration. These are with supercells 2𝑎 × 2𝑎 for x = 0.23,0.32
and 2𝑎 × 𝑎, √3𝑎 × 𝑎 for x = 0.38 and 0.45, respectively. Density functional theory (DFT)
based calculations suggests the possibility of various types of cation-cation hybridization in
this system which occurs not only between Re atoms but also between Re-Mo atoms both in
the 1H and 1Td configuration. A fine sampling of composition in theoretical calculation reveals
the structural cross over between 1H and 1Td to be at ~37.5%. The interaction between Re-Mo
atoms other than expected interaction between Re atoms is a unique finding of the present
investigation. The observed diversity of structural phases may provide an opportunity to exploit
this alloy system in various novel device and energy application.
II.A. Material synthesis and experimental methods
In short, the synthesis process involved first mixing the Mo (powder, 99.9%, Sigma Aldrich),
Re (1.00 mm diameter wire, 99.97%, Alfa Aesar) and S (powder-325 mesh, 99.5%, Alfa Aeser)
in ratio of 3:1:8 and then placing it in a sealed in a quartz tube (10-5 mbar). The sealed tube is
then heated to 200 °C with a heating rate of 10 °C/h followed by annealing at the same
temperature for two hours. After this the temperature is increased to 900 °C with a heating rate
of 20 °C/h followed by annealing at the same temperature for 120 hours. The quartz tube
containing powders is then cooled to room temperature under air and then sample is collected
for various study.32
All the HRTEM images are recorded in an aberration corrected FEI TITAN 80-300 keV
transmission electron microscope. To exfoliate monolayer of specimens, powder sample is first
probe sonicated for 45 minutes with a probe of tip size of 3 mm and then dropped on a holey
5
Carbon grid. Composition analysis is carried out by EDS to identify areas with different Re
concentration for high resolution imaging.
II.B. Calculation methods
Electronic structure calculations are performed using all electron density functional theory
based WEIN2k code.46 To solve Kohn-Sham equation this code utilises a full potential
linearized augmented plane wave (FLPAW) + local orbital as basis set. The calculations are
performed for two different polytypes of monolayer alloy Mo1-x RexS2 with different x = 0.625,
0.125, 0.1875, 0.25, 0.3125, 0.375, 0.4375 and 0.50. These polytypes are 1H and various 1Td
configurations. The most stable configurations in case of pristine MoS2 and ReS2 are 1H and
1Td, respectively. The alloy of 1H configuration is created by using a supercell of 4×4×1 from
pristine MoS2 with different number of Re substitution at Mo site to obtain the desire
concentrations. On the other hand, for 1Td structure with a 2𝑎 × 2𝑎 superstructure modulation
a 2×2×1 supercell is considered. To optimize lattice parameter, generalised gradient
approximation (GGA) with Perdew-Burke-Ernzerhof (PBE) exchange correlation functional
are used. The Self consistence field (SCF) cycles are then followed with energy, charge and
force convergence criteria below 0.0001 Ry, 0.0001e and 1mRy/au respectively. The optimized
in-plane lattice parameters of 1H MoS2 is 𝑎 = 𝑏 = 3.1917 Å and for 1Td ReS2 is 𝑎 = 6.4308 Å
, 𝑏 = 6.4912 Å and 𝛾 = 119.03°, all alloy calculation was started with these lattice parameters
for respective structural configurations. The muffin tin radius for atoms are chosen in such way
to avoid overlap between each other and -6 Ry energy separation of core and valence states is
chosen. The RmtKmax parameter is set to 7 where Rmt is the muffin tin radius of the smallest
atom (Sulphur). The 1000 k points are used in first Brillouin zone during SCF cycle. To study
the stability of different phases cohesive energy values are extracted for various alloy phases.
III. Results and Discussion
6
The rich variety of structures as recorded in HRTEM images is described first in succession
with increasing Re concentration. The observed structural variations can be classified into two
broad categories based on the cation-cation hybridization: (1) short range interaction and (2)
periodic super-structural modulation. Short range interaction depicts local inter-cation
interactions involving two or few atoms with shorter interatomic bond length compared to the
surroundings. This is observed for alloys with 𝑥 < 23% where the global structure remains as
1H-polytype. The periodic super-structural modulation involving inter cation hybridization is
observed for 𝑥 > 23%. The periodic super-structural modulation changes systematically in
terms of asymmetry in modulation vectors along different primary lattice vector directions with
increasing Re concentrations in the lattice. The HRTEM images, FFT pattern, and theoretically
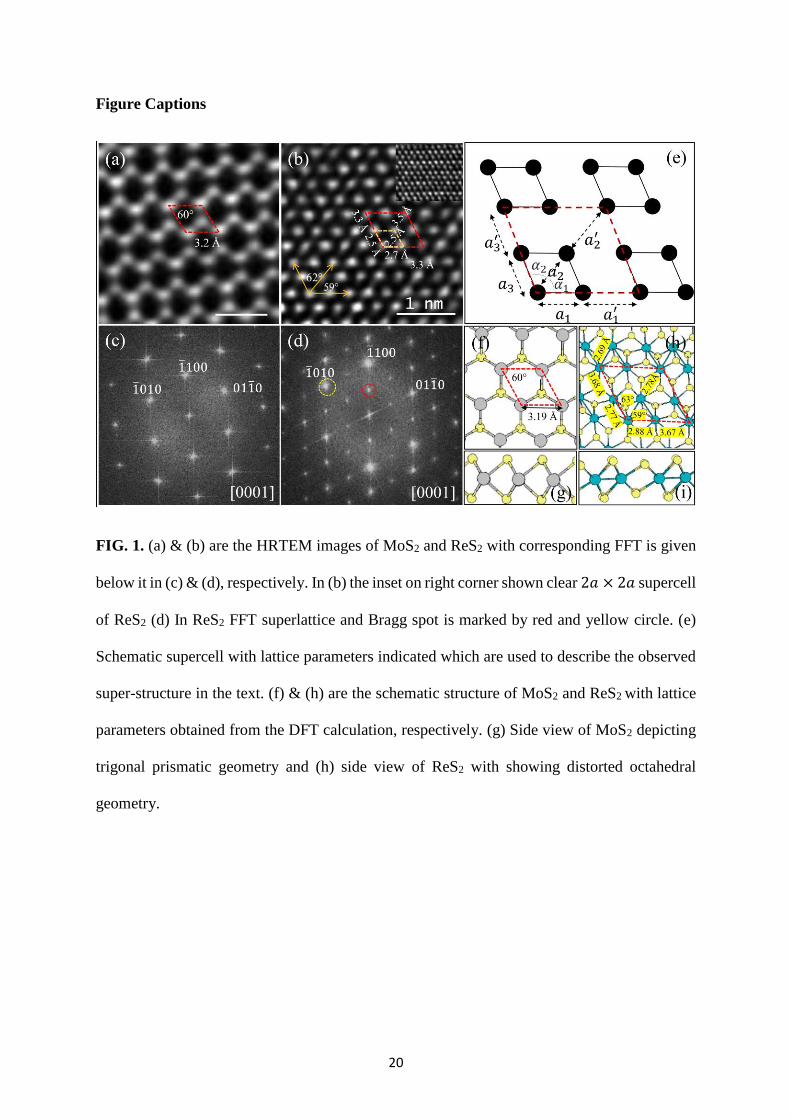
optimized schematic structures along <0001> Z.A for both MoS2 and ReS2 are given in Fig. 1.
The 1H structure of MoS2 has hexagonal geometry where Mo-Mo and S-S separation on the
projected (0001) plane is 3.2 Å (Fig. 1(a)). In case of ReS2, four Re Atoms hybridized to form
Re4 cluster leading to a quasi 2D chain-like (2𝑎 × 2𝑎) superstructure (Fig. 1(b)). The
superlattice spots corresponding to the superstructure of ReS2 is shown in Fig. 1(d) and one
such spot is marked with the red circle. Various Re-Re bond-lengths are outlined. The observed
superstructures of the alloy system can be described in terms of deviation from the ideal MoS2
and ReS2 structures. Now to define the super-structures for the alloy system a unit cell
consisting of four rhombuses is sketched with cations at its corners (Fig. 1(e)). This can be used
to define various super-structural configurations in terms of inter atomic lattice vectors and
angle subtended by them. The cation-cation hybridization can occur along three directions i.e.
𝑎1, 𝑎2 and 𝑎3 with different magnitudes of modulation vectors. The observed modulation for
various alloy systems is significantly different compared to ReS2. To distinguish such
modulation from ReS2, we define a parameter ∆𝑎𝑛 = 𝑎𝑛′ − 𝑎𝑛 where n = 1, 2, 3 and the
magnitude of ∆𝑎𝑛 indicates strength of a modulation. In case of ReS2, ∆𝑎1 = 0.6 Å , ∆𝑎2 =
7
1 Å, and ∆𝑎3 = 0.8 Å, showing stronger modulation is along the diagonal followed by the two
sides of the rhombus. In case of MoS2, all the ∆𝑎 values equal to zero indicating absence of
any superstructure.
III.A. Mo1-xRexS2 alloy with 𝒙 < 𝟐𝟎%
As already mentioned, that the monolayer of MoS2 has lattice parameters of 𝑎 = 𝑏 = 3.2 Å
and 𝛼 = 60° exhibiting hexagonal symmetry. Though there are few reports on the nature of Re
substitution in MoS2 lattice either at lower concentration (< 1%).44,47 and intermediate
concentration (25, 50%),32,39 however for various other intermediate concentrations detailed
aspects on the local structure and possible electronic properties are not available. In the present
investigation, for 𝑥 = 1 − 17%, HRTEM images reveals local hybridization between two
cations forming a dimer and an increase in population of such local dimers with increasing Re
concentration. The Figure 2 (a) & (e) are the HRTEM image of Mo0.99Re0.01S2 alloy and
example line scan showing various cation-cation distance, respectively. Most of the inter-cation
distances are ~3.2 Å, which is typical of Mo-Mo interatomic distance with local random values
of 2.79 Å as indicated in the Fig. 2(a). This local short inter-atomic distance is due to dimer
formation involving pair of cations. The density of such random dimers increases with Re
concentration of 7, 14, and 17 % (Fig. 2(b)-(d)). Local clustering involving more than two
cations can be observed for 𝑥 = 17% and is indicated in the image (Fig. 2(d)). These are local
tetramer type modulation having average lattice parameters: 𝑎1= 2.6/2.8 Å, 𝑎1′ = 3.1, 𝑎2 =
2.8/2.9 Å, 𝑎2′ = 2.9/3.1 Å, 𝛼1 = 58° and 𝛼2 = 55° . The cluster formation in this case can be
between Re and Mo atoms other than expected interaction between Re atoms as confirmed
from the intensity of line scan and later by theoretical calculation.
III.B. Mo1-xRexS alloy with 𝒙 > 𝟐𝟎%
8
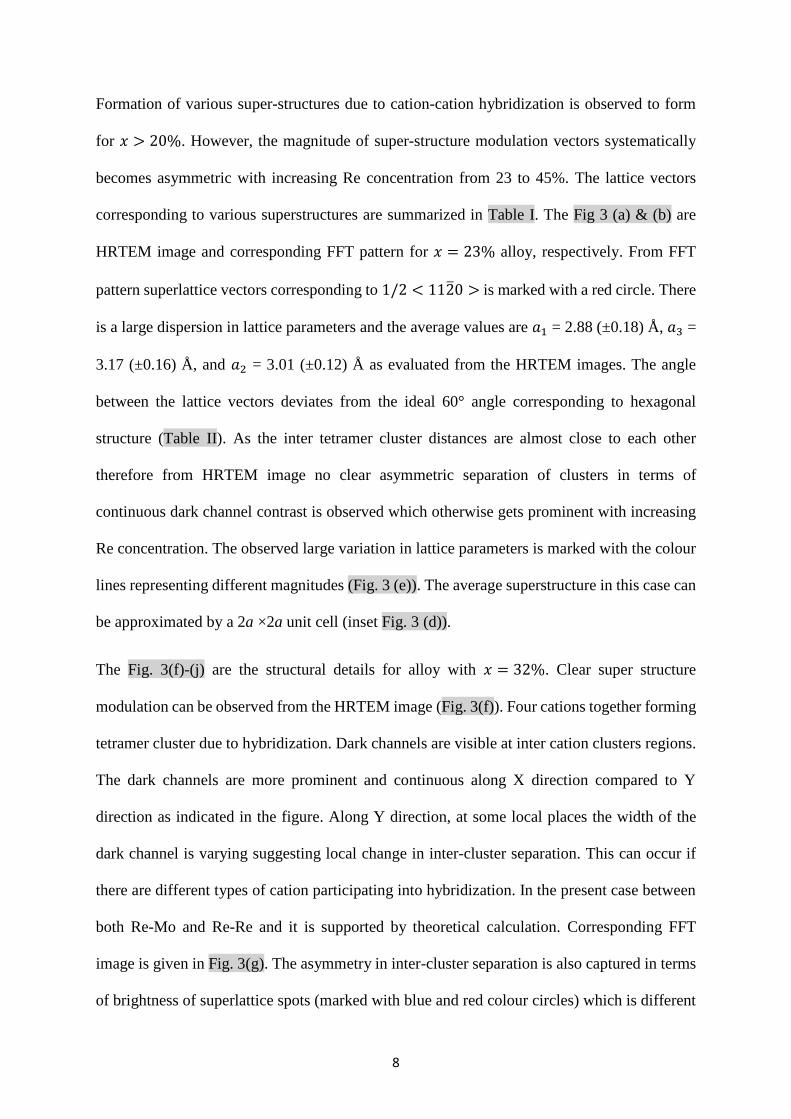
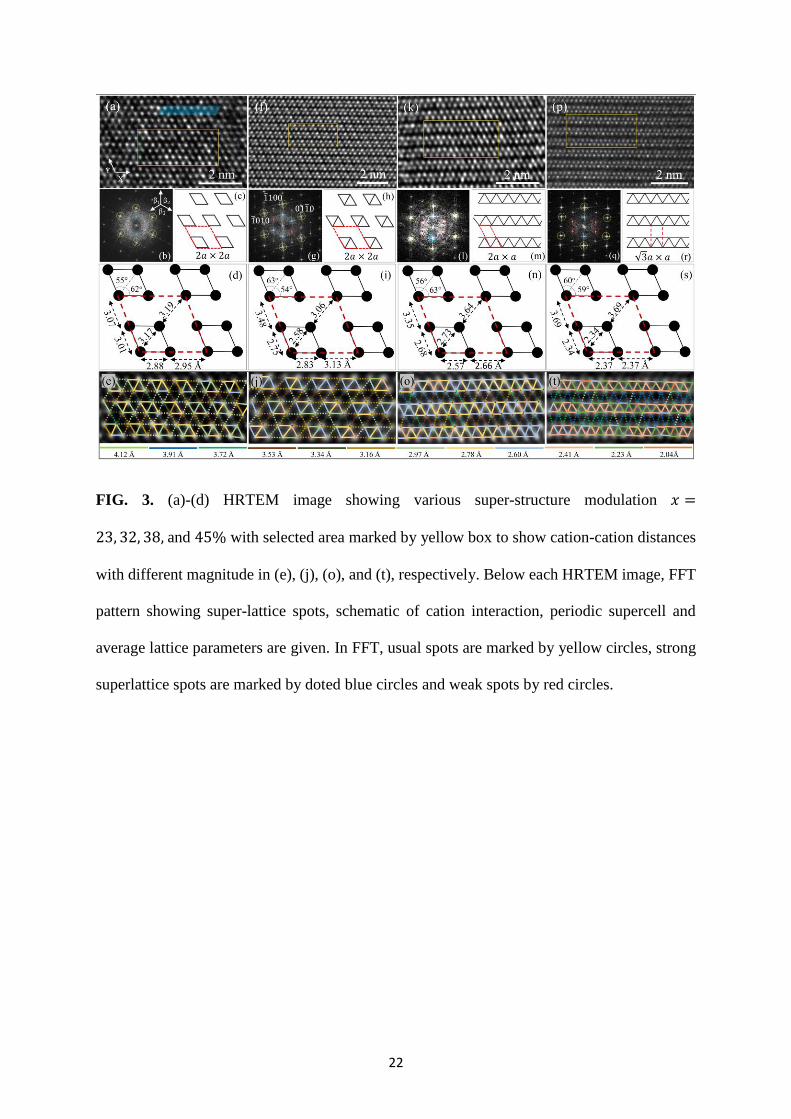
Formation of various super-structures due to cation-cation hybridization is observed to form
for 𝑥 > 20%. However, the magnitude of super-structure modulation vectors systematically
becomes asymmetric with increasing Re concentration from 23 to 45%. The lattice vectors
corresponding to various superstructures are summarized in Table I. The Fig 3 (a) & (b) are
HRTEM image and corresponding FFT pattern for 𝑥 = 23% alloy, respectively. From FFT
pattern superlattice vectors corresponding to 1/2 < 112̅0 > is marked with a red circle. There
is a large dispersion in lattice parameters and the average values are 𝑎1 = 2.88 (±0.18) Å, 𝑎3 =
3.17 (±0.16) Å, and 𝑎2 = 3.01 (±0.12) Å as evaluated from the HRTEM images. The angle
between the lattice vectors deviates from the ideal 60° angle corresponding to hexagonal
structure (Table II). As the inter tetramer cluster distances are almost close to each other
therefore from HRTEM image no clear asymmetric separation of clusters in terms of
continuous dark channel contrast is observed which otherwise gets prominent with increasing
Re concentration. The observed large variation in lattice parameters is marked with the colour
lines representing different magnitudes (Fig. 3 (e)). The average superstructure in this case can
be approximated by a 2a ×2a unit cell (inset Fig. 3 (d)).
The Fig. 3(f)-(j) are the structural details for alloy with 𝑥 = 32%. Clear super structure
modulation can be observed from the HRTEM image (Fig. 3(f)). Four cations together forming
tetramer cluster due to hybridization. Dark channels are visible at inter cation clusters regions.
The dark channels are more prominent and continuous along X direction compared to Y
direction as indicated in the figure. Along Y direction, at some local places the width of the
dark channel is varying suggesting local change in inter-cluster separation. This can occur if
there are different types of cation participating into hybridization. In the present case between
both Re-Mo and Re-Re and it is supported by theoretical calculation. Corresponding FFT
image is given in Fig. 3(g). The asymmetry in inter-cluster separation is also captured in terms
of brightness of superlattice spots (marked with blue and red colour circles) which is different
9
along different directions. There are two pairs of bright spots marked by blue circles and one
pair of weak spots marked by red circle in FFT (Fig. 3(g)). The superlattice spots in FFT pattern
is stronger compared to the 23% case. The average super structure modulation is 2a×2a (Fig.
3(h)). The average structural parameters are given in Fig. 3(i). In this case the variation in
lattice vectors is observed as well and is indicated with the colour lines in Fig. 3(j). The details
of the structure for 𝑥 = 38% is given in Fig. 3(k)-(o). In this case, inter-cluster separation or
magnitude of modulation along one direction is more compared to other directions. The
asymmetry or anisotropy is clearly visible in the FFT pattern (Fig. 3(l)) and is marked with the
blue circle along 1̅100 for brighter spots and red circles for less bright spot along 011̅0 and
1̅010 directions. The average super-structure is 2a×a and the structural parameters are given
in Fig. 3(n). Local variation of inter cluster distance can be measured from the HRTEM image
and is shown in Fig. 3(o). The asymmetry in direction of structural modulation further increases
for alloy 𝑥 = 45% and the structure appears as one-dimensional chain like modulation or zig-
zag type [Fig. 3(p)-(t)]. The average supercell is of √3𝑎 × 𝑎. The variation in structural
parameters is reduced in this case and is shown in Fig. 3(t).
As already pointed out that the origin in rich variation of super-structural modulation lies at the
inter-cationic interactions which is found to be diverse in nature. This suggests the possibility
of interaction interactions between Mo-Mo, Mo-Re besides expected Re-Re interactions. To
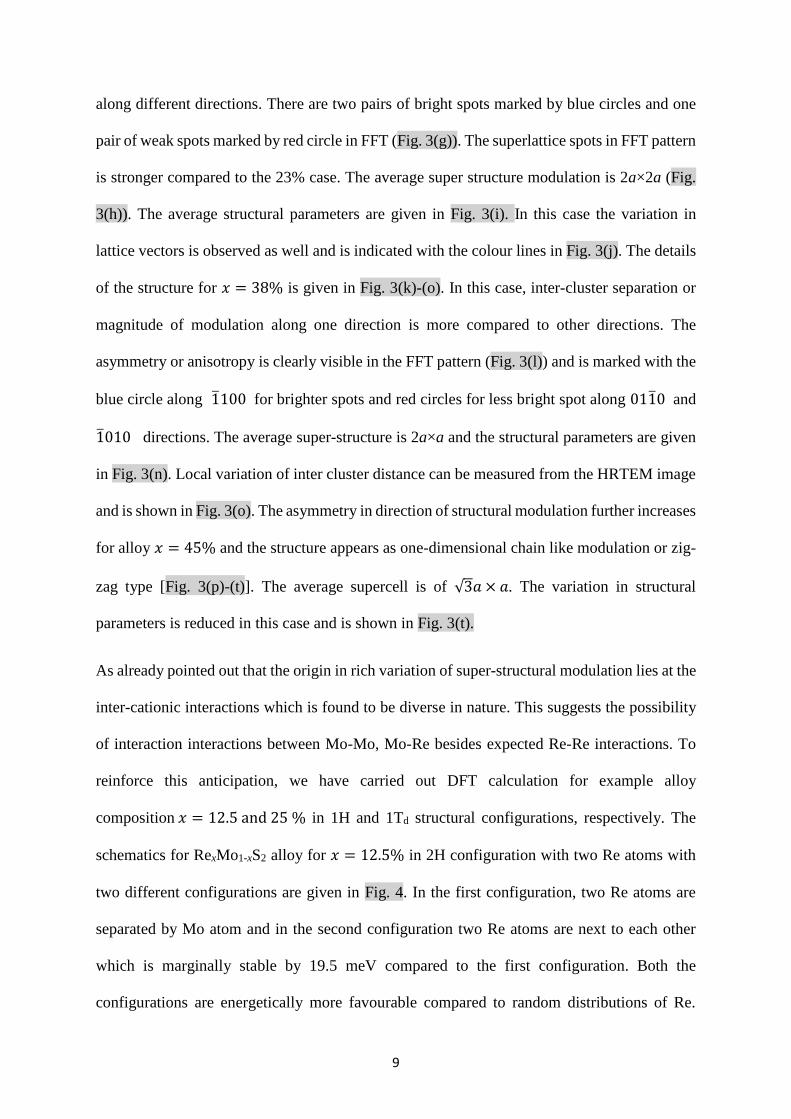
reinforce this anticipation, we have carried out DFT calculation for example alloy
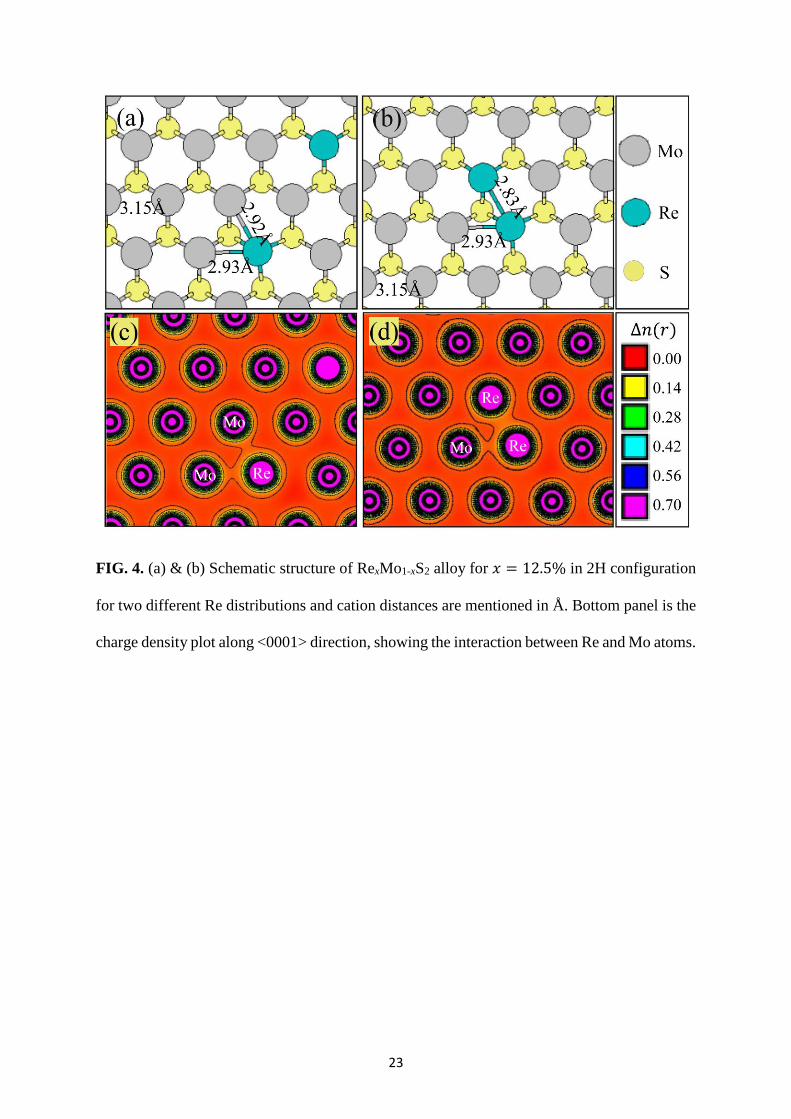
composition 𝑥 = 12.5 and 25 % in 1H and 1Td structural configurations, respectively. The
schematics for RexMo1-xS2 alloy for 𝑥 = 12.5% in 2H configuration with two Re atoms with
two different configurations are given in Fig. 4. In the first configuration, two Re atoms are
separated by Mo atom and in the second configuration two Re atoms are next to each other
which is marginally stable by 19.5 meV compared to the first configuration. Both the
configurations are energetically more favourable compared to random distributions of Re.
10
Presence of interaction can be observed between one Re with two Mo atoms and two Re and
one Mo atom for the configurations 1 & 2, respectively. This supports the formation of dimer
in 1H configuration of the alloy lattice. This result is similar to the Svetlana et al but in that
case no inter cation interaction types is considered.39 In general, Re atoms in lattice tend to
hybridises with nearest Mo atoms to form dimers with bond length of 2.9 Å locally. The
interaction distance in case of Re-Re dimer is 2.8 Å. The Re-Mo dimer formation occurs due
to electron transfer from 5d orbital of Re to nearest Mo 4d orbitals Fig. 4(c) and Re-Re dimer
are formed by charge sharing of 5d orbitals of Re forming a covalent bonding Fig. 4(d). The
valence charge density plot for the both the cases are shown in Fig 4. (c) & (d) where charge
sharing between interacting cations is clearly visible. In a paper published by Brandao et al47
where it was shown by electron paramagnetic resonance technique that in MoS2, intrinsic Re
impurities found to introduces local site symmetry reduction and anisotropic electronic
delocalisation favouring inter cation interaction.
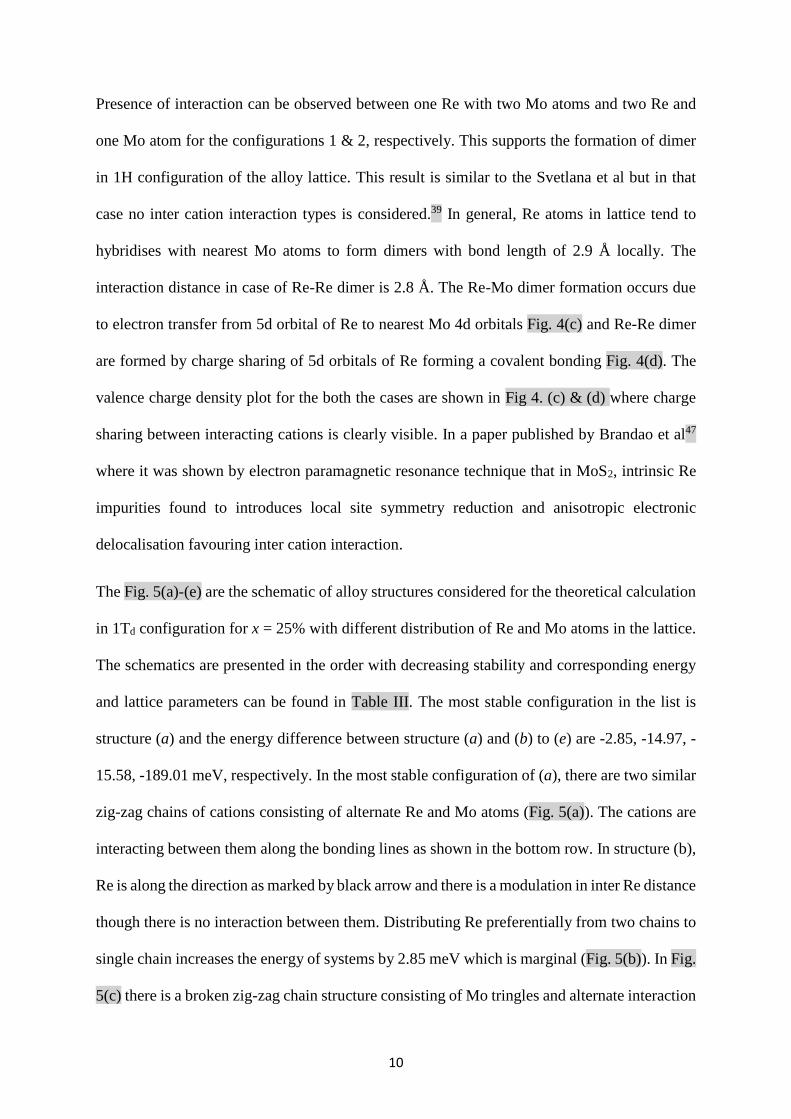
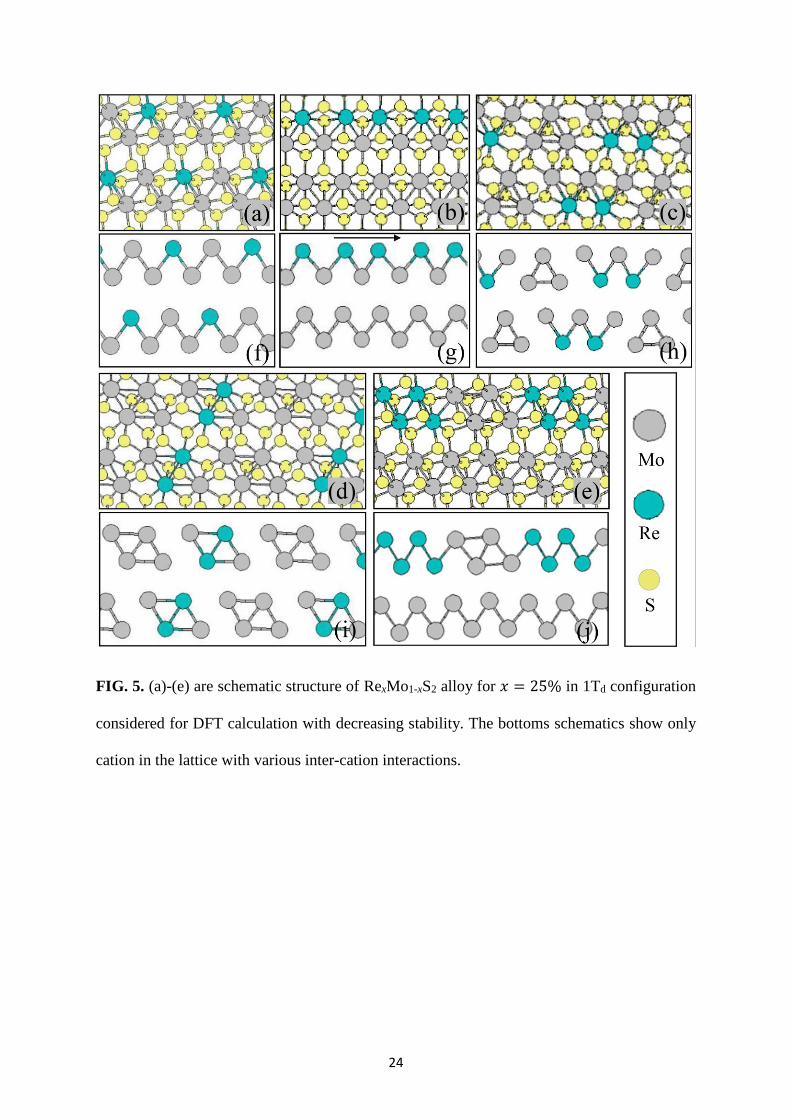
The Fig. 5(a)-(e) are the schematic of alloy structures considered for the theoretical calculation
in 1Td configuration for x = 25% with different distribution of Re and Mo atoms in the lattice.
The schematics are presented in the order with decreasing stability and corresponding energy
and lattice parameters can be found in Table III. The most stable configuration in the list is
structure (a) and the energy difference between structure (a) and (b) to (e) are -2.85, -14.97, -
15.58, -189.01 meV, respectively. In the most stable configuration of (a), there are two similar
zig-zag chains of cations consisting of alternate Re and Mo atoms (Fig. 5(a)). The cations are
interacting between them along the bonding lines as shown in the bottom row. In structure (b),
Re is along the direction as marked by black arrow and there is a modulation in inter Re distance
though there is no interaction between them. Distributing Re preferentially from two chains to
single chain increases the energy of systems by 2.85 meV which is marginal (Fig. 5(b)). In Fig.
5(c) there is a broken zig-zag chain structure consisting of Mo tringles and alternate interaction
11
between three Mo and two Re atoms. There is a slight energy cost for structure (c) by ~12 meV
compared to structure (b). Four atoms cation clusters forming periodic structural modulation
of Mo and Re atoms is shown in Fig. 5(d). The structure (e) where all the Re atoms are close
to each other is energetically least favourable i.e. 189.01 meV compared to structure (a). From
the above calculations it is clear that the interaction between different types of cations are
possible and even preferable over expected interactions between Re atoms only.
In this context Svetlana et al showed the formation of Re-dimer in the MoS2 lattice for 𝑥 = 5%
by X-ray photo absorption spectroscopy (XPS).39 An increase in Re concentration, rhombus
like cluster corresponding to Re tetramer was observed to form. The HRTEM image shows
local tetramer formation for 𝑥 = 15% and the DFT calculation for 10% alloy affirms higher
stability of tetramer cluster compared to dimer and random Re distribution in 1H lattice of
MoS2. However, in this case there is no diverse types of inter-cation interaction considered for
the calculation. In another report, an enhanced HER activity was reported for MoS2 alloyed
with Re at 50% in 1Td configuration.38 By HRTEM random distribution of Re at 5% and
tetramer cluster at 55% in the MoS2 lattice in DT (2𝑎 × 2𝑎) configuration was shown. First
principle calculation shows the stability of DT phase is more than 2H for 𝑥 = 50% particularly
at wider channel regions of the DT structure. However, for x higher than 50%, HER activity
was reported to decrease due to reduced density of states at the Fermi level.
The pristine monolayer 1H MoS2 has direct band gap of 1.7 eV at 𝐾 point18 with valence band
maxima (VBM) composed of Mo 4𝑑𝑥2−𝑦2,𝑥𝑦 and S 3𝑝𝑥,𝑦 orbitals and conduction band minima
(CBM) consists of Mo 4𝑑𝑧2 and S 3𝑝𝑥,𝑦 orbitals. Whereas around Λ point VBM consist of Mo
𝑑𝑧2 and S 𝑝𝑧 and CB of Mo 𝑑𝑥2−𝑦2,𝑥𝑦 and S 𝑝𝑥,𝑦 and lesser 𝑝𝑧 orbital contributions forming
hybridized 𝑝-𝑑 bonding and antibonding states respectively.48,49 On the other hand monolayer
ReS2 has a distorted 1Td structure with VBM and CBM are formed from bonding Re
12
5𝑑𝑥2−𝑦2,𝑥𝑦(𝑡2𝑔), S 3𝑝 orbitals primarily 𝑝𝑧 and antibonding Re 5𝑑𝑥2−𝑦2,𝑥𝑦∗ , S 3𝑝∗ orbitals50
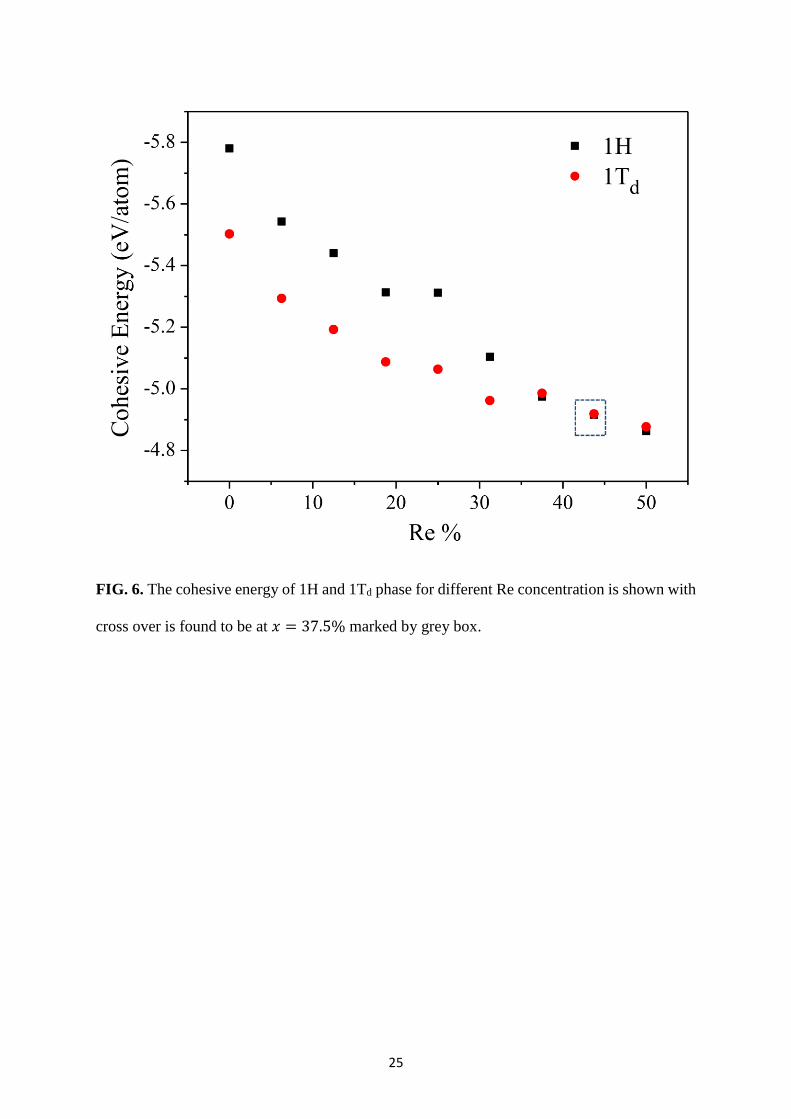
with direct band gap of 1.5 eV at Γ point.18 The Re alloyed MoS2 can exhibit either 1H or 1Td
phase depending on Re concentration as discussed earlier using HRTEM images. Cohesive
energy calculation based on fine sampling of composition for two different alloy structures
reveal a structural cross over at 37.5% Re concentration which is less than earlier prediction
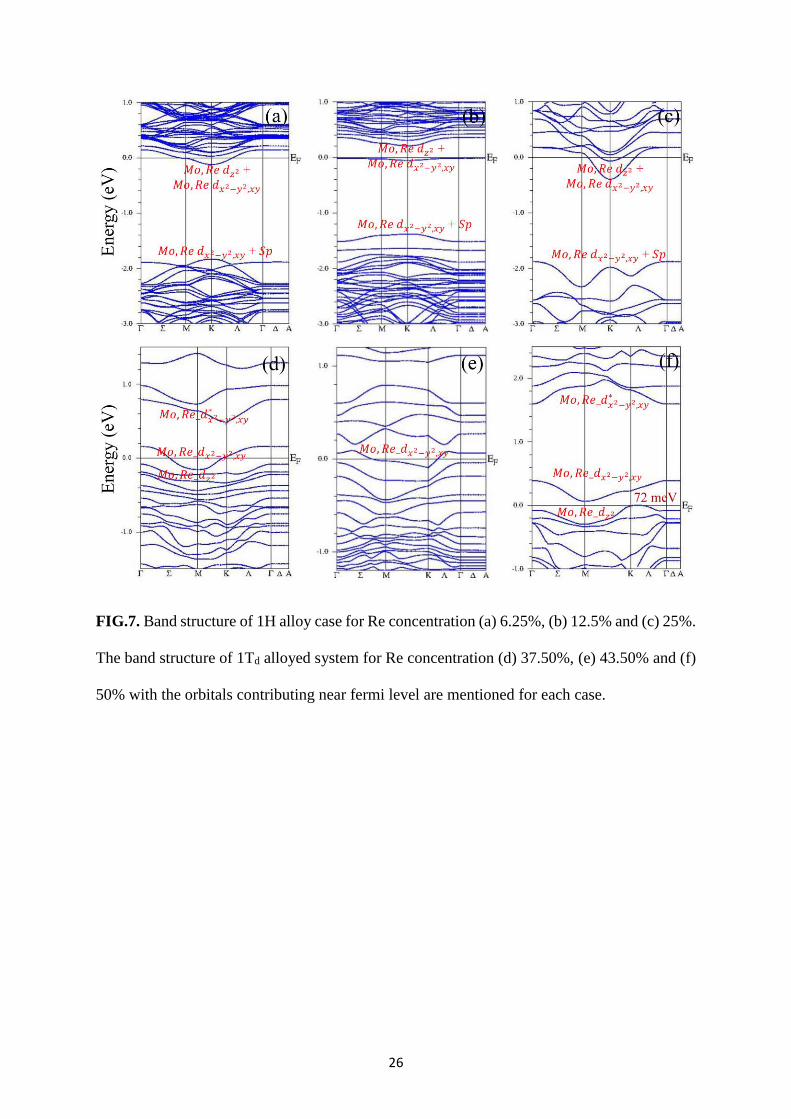
(Fig .6). The stable 1H alloy phases are found to be metallic in nature with Fermi level (𝐸𝑓)
shifts into conduction band with no secondary minima at Λ point as observed for pristine MoS2
case. 𝐸𝑓 moves further deep into conduction band with increasing Re concentration (Fig.7).
The major orbitals contributing near 𝐸𝑓 are Re and Mo 𝑑𝑧2 , 𝑑𝑥2−𝑦2,𝑥𝑦 and S 𝑝 orbitals
(Fig.7(a)-(d)). These orbital contributions are more uniform over 𝐾 − Λ − 𝛤 direction compare
to MoS2 where weight of each orbital contribution differ along given direction indicate
delocalised nature of electron in these alloys.47
The alloyed system in 1Td phase remain metallic till 43.75 Re % (Fig.6(f)-(h)) and a small band
gap of 72 meV appears at 50% as reported earlier.32 These 1Td phases have same orbital
contribution as ReS2 at Fermi level that is Re 𝑑𝑥2−𝑦2,𝑥𝑦 in addition to Mo orbitals. These 1Td
alloys exhibit flat band dispersion. In ReS2, Re atom tetramerization is formed by Re-Re atom
hybridisation involving 5𝑑𝑥2−𝑦2,𝑥𝑦 orbitals. The similar bonding nature is observed in Re
alloyed 1Td phases with Re-Re, Mo-Mo and Mo-Re bonds are formed by 𝑑𝑥2−𝑦2,𝑥𝑦 type of
orbitals.
In the present investigation a range of structural variation is observed due to the variation in
Re concentrations. From discrete dimer to tetramer and with increasing Re concentration super-
structure formation with increasing asymmetry of hybridization. In our earlier report we have
stated that 1H to 1T structural cross over at 𝑥 = 50% from the theoretical calculation.
However, fine sampling of composition points reveals that the cross over occurs at ~ 37.5%
13
(Fig. 6). We see diverse interactions between cations, this suggests that the hybridization is not
only expected Re-Re but also between Re-Mo and different combinations of these.
V. Conclusions
In conclusion, we have shown rich diversity of cation hybridization leading to variety of super-
structural modulation in Mo1-xRexS system for x < 50%. For 𝑥 < 23%, only short-range
interaction is observed. For 𝑥 > 23% super-structural modulation is observed, and asymmetry
of modulation vector increases with Re concentration. Theoretical calculation suggests that
interaction between cations is not only limited between Re atoms but also between Re-Mo
atoms.
ACKNOLEDGMENT
The authors sincerely thank to ICMS, JNCASR for the financial support.
REFERENCES
1 K. S. Novoselov, D. Jiang, F. Schedin, T. J. Booth, V. V. Khotkevich, S. V. Morozov, and A.
K. Geim, Proc. Natl. Acad. Sci. 102,10451-10453 (2005).
2G. Eda, H. Yamagachi, D. Voiry, T. Fujita, M. Chen, and M. Chhowalla, Nano Lett. 11, 5111-
5116 (2012).
3E. V. Calman, C. J. Dorow, M. M. Fogler, L. V. Butov, S. Hu, A. Mishchenko, and A. K.
Geim, Appl. Phys. Lett. 108, 101901 (2016).
4H. S. S. R. Matte, B. Plowman, R. Datta, and C. N. R. Rao, Dalton Trans. 40, 10322-10325
(2011).
14
5T. Cao, G. Wang, W. Han, H. Ye, C. Zhu, J. Shi, Q. Niu, P. Tan, E. Wang, B. Liu, and J. Feng,
Nat. Commun. 3, 887-892 (2012).
6K. F. Mak, C. Lee, J. Hone, J. Shan, and T. F. Heinz, Phys. Rev. Lett. 105, 136805 (2010).
7G. Wang, A. Chernikov, M. M. Glazov, T. F. Heinz, X. Marie, T. Arnand, and B. Urbaszek,
Rev. Mod. Phys. 90, 21001 (2018).
8A. Splendiani, L. Sun, Y. Zhang, T. Li, J. Kim, C. Y. Chim, G. Galli, and F. Wang, Nano Lett.
10, 1271-1275 (2010).
9M. M. Ugeda, A. J. Bradley, S. F. Shi, F. H. da Jornada, Y. Zhang, D. Y. Qiu, W. Ruan, S. K.
Mo, Z. Hussain, Z. X. Shen, F. Wang, S. G. Louie, and M. F. Crommie, Nat. Mater. 13, 1091-
1095 (2014).
10D. Xiao, G. B. Liu, W. Feng, X. Xu, and W. Yao, Phys. Rev. Lett. 108, 196802 (2012).
11M. Chhowalla, H. S. Shin, G. Eda, L. J. Li, K. P. Loh, and H. Zhang, Nat. Chem. 5, 263-275
(2013).
12U. Bhat, R. Singh, B. Vishal, A. Sharma, S. Horta, R. Sahu, and R. Datta, Phys. Status. Solidi
B 255, 1700691 (2018).
13H. Yang, S. W. Kim, M. Chhowalla, and Y. H. Lee, Nat. Phys. 13, 931-938 (2017).
14A. Singh, S. N. Shirodkar, and U. V. Waghmare, 2D Mater. 2, 035013 (2015).
15D. Jariwala, V. K. Sangwan, L. J. Lauhon, T. J. Marks, and M. C. Hersam, ACS Nano 8(2),
1102-1120 (2014).
16C. Guo, J. Pan, H. Li, T. Lin, P. Liu, C. Song, D. Wang, G. Mu, X. Lai, H. Zhang, W. Zhou,
M. Chen, and F. Huang, J. Mater. Chem. C 5, 10855-10860 (2017).
15
17K. Leng, Z. Chen, X. Zhao, W. Tang, B. Tian, C. T. Nai, W. Zhou, and K. P. Loh, ACS Nano
10, 9208-9215 (2016).
18K. Dileep, R. Sahu, S. Sarkar, S. C. Peter, and R. Datta, J. Appl. Phys. 119, 114309 (2016).
19M. A. Lukowski, A. S. Daniel, F. Meng, A. Forticaux, L. Li, and S. Jin, J. Am. Chem. Soc.
135, 10274-10277 (2013).
20M. Acerce, D. Voiry, and M. Chhowalla, Nat. Nanotechnol. 10, 313-318 (2015).
21D. H. Choe, H. J. Sung and K. J. Chang Phys. Rev. B 93, 125109 (2016).
22S. N. Shirodkar and U. V. Waghmare, Phys. Rev. Lett. 112(15), 157601(5) (2014).
23H. Wang, H. Yuan, S. S. Hong, Y. Li, and Y. Cui, Chem. Soc. Rev. 44, 2664-2680 (2015).
24E. Benevente, M. A. Santa Ana, F. Mendizábal, G. González, Coord. Chem. Rev. 224, 87–
109 (2002).
25Y. C. Lin, D. O. Dumcenco, Y. Huang, and K. Suenaga, Nat. Nanotechnol. 9, 391-396
(2014).
26Y. Kang, S. Najmaei, Z. Liu, Y. Bao, Y. Wang, X. Zhu, N. J. Halas, P. Nordlander, P. M.
Ajayan, J. Lou, and Z. Fang, Adv. Mater. 26, 6467 -6471 (2014).
27D. Yang, S. J. Sandoal, W. M. R. Divigalpitiya, J. C. Irwin, and R. F. Frindt, Phys. Rev. B
43(14), 12053-12056 (1991).
28F. Wypych, Th. Weber, and R. Prins, Chem. Mater. 10, 723-727 (1998).
29H. J. Lamfers, A. Meetsma, G. A. Wiegers, J. L. de Boer, J. Alloys Compd. 241, 34 -39
(1996).
30K. Rossnagel, J. Phys. : Condens. Matter 23, 213001 (2011).
16
31S. Tongay, H. Sahin, C. Ko, A. Luce,W. Fan, K. Liu, J. Zhou, Y. S. Huang, C. H. Ho, J. Yan,
D. F. Ogletree, S. Aloni, J. Ji, S. Li, J. Li, F. M. Peeters, and J. Wu, Nat. Commun. 5, 1-6
(2014).
32R. Sahu, U. Bhat, N. M. Batra, H. Sharona, B. Vishal, S. Sarkar, S. A. Aravindh, S. C. Peter,
S. Roqan, P. M. F. J. Costa, and R. Datta, J. Appl. Phys. 121, 105101(10) (2017).
33F. Raffone, C. Ataca, J. C. Grossman, and G. Cicero, J. Phys. Chem. Lett. 7, 2304-2309
(2016).
34D. O. Dumcenco, K. Y. Chen, Y. P. Wang, Y. S. Huang, K. K. Tiong, J. Alloys Compd. 506,
940-943 (2010).
35S. Zheng, L. Sun, T. Yin, A. M. Dubrovkin, F. Liu, Z. Liu, Z. X. Shen, and H. J. Fan, Appl.
Phys. Lett. 106, 063113(5) (2015)
36E. evolinsky, and D. Beerntsen, J. Appl. Phys. 35(7), 2086-2089 (1964).
37W. Tan, Z. Wei, X. Liu, J. Liu, X. Fang, D. Fang, X. Wang, D. Wang, J. Tang, and X. Fan,
Sci. Rep. 7, 15124(8) (2017).
38S. Z. Yang, Y. Gong, P. Manchanda, Y. Y. Zhang, G. Ye, S. Chen, L. Song, S. T. Pantelides,
P. M. Ajayan, M. F. Chisholm, and W. Zhou, Adv. Mater. 30, 1803477(7) (2018).
39S. A. Dalmatova, A. D. Fedorenko, L. N. Mazalov, I. P. Asanov, A. Yu. Ledneva, M. S.
Tarasenko, A. N. Enyashin, V. I. Zaikovskii, and V. E. Fedorov, Nanoscale 10, 10232-10240
(2018).
40B. Xia, P. Liu, Y. Liu, D. Gao, D. Xue, and J. Ding, Appl. Phys. Lett. 113, 013101(5) (2018).
41T. Hallam, S. Monaghan, F. Gity, L. Ansari, M. Schmidt, C. Dowing, C. P. Cullen, V.
Nicolosi, P. K. Hurley, and G. S. Duesberg, Appl. Phys. Lett. 111, 203101(5) (2017).
17
42V. Kochat, A. Apte, J. A. Hachtel, H. Kumazoe, A. Krishnamoorthy, S. Susarla, J. C. Idrobo,
F. Shimojo, P. Vashishta, R. Kalia, A. Nakano, C. S. Tiwary, and P. M. Ajayan, Adv. Mater.
29, 1703754(8) 2017.
43Y. C. Lin, D. O. Dumcenco, H. P. Komsa, Y. Niimi, A. V. Krasheninnikov, Y. S. Huang, and
K. Suenaga, Adv. Mater. 26, 2857-2861 (2014).
44K. Zhang, B. M. Bersch, J. Joshi, R. Addou, C. R. Cormier, C. Zhang, K. Xu, N. C. Briggs,
K. Wang, S. Subramanian, K. Cho, S. F. Shirey, R. M. Wallace, P. M. Vora, and J. A. Robinson,
Adv. Funct. Mater. 28, 1706950(7) (2018).
45J. Y. Noh, H. Kim, M. Park, and Y. S. Kim, Phys. Rev. B 92, 115431(4) (2015).
46P. Blaha, K. Schwarz, G. K. H. Madsen, D. Kvasnicka, J. Luitz, R. Laskowski, F. Tran and
L. D. Marks, WIEN2k, An Augmented Plane Wave + Local Orbitals Program for Calculating
Crystal Properties (Karlheinz Schwarz, Techn. Universität Wien, Austria), ISBN 3-9501031-
1-2 (2018).
47F. D. Branda ̃o, G. M. Ribeiro, P. H. Vaz, J. C. González, and K. Krambrock, J. Appl. Phys.
119, 235701(8) (2016).
48X. Chen, Z. Chen, and J. Li, Chinese Sci. Bull. 58(14),1632-1641(2013).
49J. E. Padilha, H. Peelaers, A. Janotti, and C. G. Van de Walle, Phys. Rev. B 90(20), 205420
(2014).
50C. H. Ho, Y. S. Huang, J. L. Chen, T. E. Dann, and K. K. Tiong, Phys. Rev. B 60(23),
15766(6) (1999).
18
TABLES
TABLE I. Average lattice parameters of RexMo1-xS2 alloy in Å for different Re concentrations.
TABLE II. Angles between tree modulation vectors in FFT in degree and its deviation from
hexagonal symmetry 𝛿𝛽𝑛 = |𝛽𝑛 − 60| for different Re concentration.
Re % 𝒂𝟏 𝒂𝟏′ 𝒂𝟐 𝒂𝟐
′ 𝒂𝟑 𝒂𝟑′ 𝜶𝟏 𝜶𝟐
100 2.7 3.3 2.5 3.5 2.5 3.3 59 62
23 2.88 2.95 3.01 3.07 3.17 3.19 62 55
32 2.83 3.13 2.75 3.48 2.58 3.06 54 63
38 2.57 2.66 2.68 3.35 2.73 3.64 63 56
45 2.37 2.37 2.34 3.69 2.34 3.69 59 60
Re % 𝛃𝟏 𝛃𝟐 𝛃𝟑 𝛅𝛃𝟏 𝛅𝛃𝟐 𝛅𝛃𝟑
0 60 60 60
23 61 62 57 1 1 3
32 56 63 61 4 3 1
38 69 61 50 9 1 10
45 68 68 44 8 8 16
100 55 64 61 5 4 1
19
TABLE III. Cohesive energies of various structures for RexMo1-xS2 alloy with 𝑥 = 25% considered
for theoretical calculations. Relative energy difference between the structures is also given.
Mo0.75
Re0.25
S2 Cohesive energy (eV) ΔE= E
m-E meV Band Gap (eV)
a -5.25249
Metallic
b -5.24964 -2.850 0.050
c -5.23752 -14.97 0.123
d - 5.23691 -15.58 Metallic
e -5.06348 -189.01 Metallic
20
Figure Captions
FIG. 1. (a) & (b) are the HRTEM images of MoS2 and ReS2 with corresponding FFT is given
below it in (c) & (d), respectively. In (b) the inset on right corner shown clear 2𝑎 × 2𝑎 supercell
of ReS2 (d) In ReS2 FFT superlattice and Bragg spot is marked by red and yellow circle. (e)
Schematic supercell with lattice parameters indicated which are used to describe the observed
super-structure in the text. (f) & (h) are the schematic structure of MoS2 and ReS2 with lattice
parameters obtained from the DFT calculation, respectively. (g) Side view of MoS2 depicting
trigonal prismatic geometry and (h) side view of ReS2 with showing distorted octahedral
geometry.
21
FIG. 2. (a)-(d) HRTEM images of RexMo1-xS2 alloy for 𝑥 = 1, 7, 14, & 17%. The
corresponding FFT pattern is given in the inset showing absence of any super-lattice spots. (e)-
(h) are the line profiles from each image, respectively from the green dotted box showing the
distribution of inter-cation distance. Shorter inter cation bond length is indicated with black
arrow. The number of dimers increase in (b) compared to (a). In (d) local tetramer cluster is
marked by blue parallelogram.
22
FIG. 3. (a)-(d) HRTEM image showing various super-structure modulation 𝑥 =
23, 32, 38, and 45% with selected area marked by yellow box to show cation-cation distances
with different magnitude in (e), (j), (o), and (t), respectively. Below each HRTEM image, FFT
pattern showing super-lattice spots, schematic of cation interaction, periodic supercell and
average lattice parameters are given. In FFT, usual spots are marked by yellow circles, strong
superlattice spots are marked by doted blue circles and weak spots by red circles.
23
FIG. 4. (a) & (b) Schematic structure of RexMo1-xS2 alloy for 𝑥 = 12.5% in 2H configuration
for two different Re distributions and cation distances are mentioned in Å. Bottom panel is the
charge density plot along <0001> direction, showing the interaction between Re and Mo atoms.
24
FIG. 5. (a)-(e) are schematic structure of RexMo1-xS2 alloy for 𝑥 = 25% in 1Td configuration
considered for DFT calculation with decreasing stability. The bottoms schematics show only
cation in the lattice with various inter-cation interactions.
25
FIG. 6. The cohesive energy of 1H and 1Td phase for different Re concentration is shown with
cross over is found to be at 𝑥 = 37.5% marked by grey box.
26
FIG.7. Band structure of 1H alloy case for Re concentration (a) 6.25%, (b) 12.5% and (c) 25%.
The band structure of 1Td alloyed system for Re concentration (d) 37.50%, (e) 43.50% and (f)
50% with the orbitals contributing near fermi level are mentioned for each case.