Rhode Island’s Statewide Results for Students in … expectations while 29.2% of monitored English...
77
Page | 1 Rhode Island’s Statewide Results for Students in Grades 3 through 8 and High School 2017 PARCC, PSAT/NMSQT & SAT School Day Dr. Ken Wagner, Commissioner Rhode Island Department of Education 255 Westminster Street Providence, RI 02903 (401) 222-4600 08.24.2017
Transcript of Rhode Island’s Statewide Results for Students in … expectations while 29.2% of monitored English...
P a g e | 1
Rhode Island’s Statewide Results for Students in Grades 3 through 8 and High School 2017 PARCC, PSAT/NMSQT & SAT School Day
Dr. Ken Wagner, Commissioner Rhode Island Department of Education 255 Westminster Street Providence, RI 02903 (401) 222-4600
08.24.2017
2
TABLE OF CONTENTS
Executive Summary .................................................................................................... 3
Introduction ................................................................................................................ 6
PARCC Statewide Results
Statewide Overview ............................................................................................. 8 English Language Arts (ELA)/Literacy ................................................................... 9 Mathematics ...................................................................................................... 12 Student Group .................................................................................................... 17
PARCC District Results
English Language Arts and Mathematics 2017…………………………………………..…..20
PARCC School Results
Elementary and Middle School ELA/Literacy 2015-2017 .................................. 29 Elementary and Middle School Mathematics 2015-2017 ................................. 43 High School ELA/Literacy and Mathematics 2017 ............................................. 58
PSAT/NMSQT & SAT Results
PSAT/NMSQT and SAT School Day Statewide Results ....................................... 62 SAT School Day Student Group Results………………………………………………….……….63 PSAT/NMSQT School Results ............................................................................ 64 SAT School Day School Results……………………………………………………………………… 67
Appendices
Appendix A. Clarifying Information .................................................................. 71 Appendix B. PARCC Performance Level Descriptors ......................................... 74 Appendix C. Split-Level Schools ........................................................................ 76 Appendix D. Calculating Standard Error (SE) ................................................... 77
3
EXECUTIVE SUMMARY
This report provides information about Rhode Island’s 2017 administration of the PARCC (Partnership for Assessment of Readiness for College and Careers) state assessment along with comparisons to our 2015 and 2016 PARCC administrations when appropriate and PSAT/NMSQT and SAT School Day. This year marks the third and final administration of the PARCC assessment, which measures student progress on challenging learning standards designed to prepare students for their future opportunities in the next grade, post-secondary education, or their careers. The 2016-2017 school year was the first statewide administration of PSAT/NMSQT and SAT School Day. Governor Gina M. Raimondo included funds in the state budget to make the PSAT and SAT free for every public high school sophomore and junior. This ensures that all students can use the SAT to consider higher education opportunities.
The PARCC assessments summarize student performance through one of five performance levels. They include: Exceeded Expectations, Met Expectations, Approached Expectations, Partially Met Expectations, or Did Not Yet Meet Expectations. The knowledge and skills students need to demonstrate at each of the performance levels were based on the recommendations of educator panels representing each of the participating states in the Consortium. Rhode Island teachers were strong participants on these panels. All states in the Consortium have adopted these same performance standards.
The PSAT/NMSQT and SAT are highly relevant to student future success because they focus on the skills and knowledge at the heart of education. Increasing participation in the SAT is the first step to having more students be college and career ready. The SAT sets an appropriately high standard for Rhode Island students and will be a good tool to help the state close the gap between expected future job requirements for post-secondary education and current college enrollment and completion. Providing these tests for free is also about equity by increasing access to college for all students.
This year’s results offer Rhode Island information on our students’ progress on state standards and challenging learning expectations. This new information provides valuable insight into the benchmarks set last year and will help us monitor our continuing progress toward meeting our shared commitment to provide all students with an opportunity to leave our schools ready to pursue their goals and dreams.
To be clear, academic readiness in these areas does not provide a complete picture about our students. School communities must develop students’ academic knowledge and skills in reading and mathematics but also in the arts and sciences. In addition, a comprehensive program develops students’ abilities to persist through challenging assignments, work collaboratively, innovate, and problem solve. This is the work our school communities actively engage in every day to help Rhode Island students grow. Assessments serve only one purpose – to give us the information necessary to continuously improve teaching, and this year’s results remind us that there is still much work ahead of us. As we stated last year, these results are not an evaluation of the collective efforts of teachers and leaders, nor do they signal everything that our students are
A Rhode Island graduate is one who is well-prepared for postsecondary education, work, and life. He or she
can think critically and collaboratively and can act as a
creative, self-motivated, culturally competent learner and citizen.
2020 Vision for Education: Rhode Island’s Strategic Plan
4
capable of accomplishing academically. Today we offer a check on Rhode Island’s efforts to ensure that all students have the opportunity to learn. We are proud of the foundational work that has been accomplished and invite you to stay committed to our ongoing progress.
Overall Achievement
Results of the spring 2017 PARCC assessments revealed that, overall, Rhode Island students’ scores remained unchanged from the previous year while participation rates continued to increase. With a change in testing requirements at the high school level, year-to-year comparisons are not always available. In ELA, grade 10 was not required in 2016-17. In Mathematics, the requirements changed from all students needing to take the Algebra I and Geometry assessments in 2015-16 to students only required to test once in high school in 2016-17.
STATE-LEVEL RESULTS
At the state level, approximately 39% of students across grades 3 through 9 met or exceeded expectations on PARCC English Language Arts/Literacy assessment. Student proficiency rates in grades 3 – 8 remained consistent with 2016 levels with 40% meeting or exceeding expectations. Grade 9 ELA/Literacy performance increased by 1% compared with 2016 performance. Mathematics proficiency for grade 3-8 students compared to 2016, has 33% of students meeting or exceeding expectations. Algebra I performance decreased by 1 percentage point compared with 2016. 28% of students met or exceeded expectations in 2016 while 27% met or exceeded expectations in 2017.
As a result of statewide conversations in all communities and increased engagement with families, the statewide participation rates in both PARCC subjects reached 98% (up from 96% in 2015-16). The participation rate is above the U.S. Department of Education requirement of 95% or better participation in state assessments.
Of the 75% of Rhode Island public school students who participated in the free PSAT/NMSQT, 31% are on track to meet the “College and Career Ready” benchmark in both Evidence-Based Reading and Writing (EBRW) and Mathematics. 56% of students who participated are considered on track to meet the college and career readiness benchmark for EBRW and 34% for Mathematics. In April 2017, 79% of Rhode Island grade 11 students participated in the SAT School Day. Of the 79% of students who participated, 32% met the SAT College and Career Ready benchmark in both EBRW and Mathematics, 56% met the college and career readiness benchmark for EBRW and 34% met the college and career readiness benchmark for Mathematics.
STUDENT GROUP RESULTS
Statewide, 39% of the total students testing population met or exceeded expectations in ELA/Literacy. Females outperformed males by 14 percentage points. The gap between students with and without disabilities was 38 percentage points. 5.2% of English learners met or exceeded
5
expectations while 29.2% of monitored English Language Learners met or exceeded expectations. 41.5% of non-ELL students met or exceeded expectations. The achievement gap for low income versus non-low income students was 32 percentage points.
In Mathematics, 31.6% of students met or exceeded expectations statewide. 32.3% of females met or exceeded expectations, while 30.9% of males met or exceeded expectations. 35.5% of students without disabilities met or exceeded expectations, compared with 5.3% of students with disabilities who met or exceeded expectations. 16.8% of low income students met or exceeded expectations, compared with the 45.7% proficiency rate of non-low income students.
DISTRICT RESULTS1
Fifty-seven Rhode Island districts participated in PARCC English Language Arts/Literacy testing. 34 districts exceeded the state average of 39% of students meeting or exceeding expectations in English Language Arts/Literacy. Fifty of the 57 districts met or exceeded the participation rate target of 95% for ELA/Literacy.
Of the 57 districts that participated in PARCC Mathematics testing, 28 districts met or exceeded expectations, achieving greater than the state average of 31.6% proficiency, and 53 districts met or exceeded the 95% participation target.
SCHOOL RESULTS2
Of Rhode Island’s 235 elementary and middle schools that participated in PARCC English Language Arts/Literacy testing, 14 had statistically significant increases in the percent of students who met or exceeded expectations while 15 had statistically significant decreases. Seventeen schools had 70% or more students who met or exceeded expectations (of those, 3 schools had 80% or more); 87 schools had 50% or more students who met or exceeded expectations; and 137 met or exceeded the state average of 39% on the PARCC English Language Arts/Literacy assessment.
Of Rhode Island’s 235 elementary and middle schools that participated in PARCC Mathematics testing, 8 had statistically significant increases in the percent of students who met or exceeded expectations while only 7 had a statistically significant decrease. Seven schools had 70% or more students who met or exceeded (of those, 4 schools had 75% or more); 61 schools had 50% or more students who met or exceeded expectations; and 139 schools met or exceeded the state average of 32% in Mathematics.
1 Throughout this report the term “district” is used as an inclusive identifier of traditional districts, charter schools, and state-operated schools, all of which are “Local Education Agencies” or LEAs. 2 See Appendix C for information on how schools were counted.
6
INTRODUCTION State assessments in English Language Arts/Literacy and Mathematics provide information that helps us understand how Rhode Island students are progressing on agreed-upon learning standards as expressed by the Common Core State Standards (CCSS). The results are one indicator among many that give us information about the health and vibrancy of our schools and their progress toward ensuring that all students are learning important skills and knowledge that will prepare them to be productive citizens, successful post-secondary learners, and employees in fulfilling personal careers.
This year’s administration of the PARCC assessments sheds light on our progress toward our state’s learning standards. The information does not define a district, school, or, most importantly, a student. Rather, the information offers an objective check on student learning and should be considered within a set of information that is known about his or her academic progress. PARCC assessments provide important information to families and to educators about student achievement and student progress in relation to their peers. Teachers and family members3 will use these results to identify student strengths and needs and to improve instruction. Schools and districts will review this year’s data against the work that has been done to align curriculum and instructional practices to the CCSS. The 2016-2017 school year was the first statewide administration of PSAT/NMSQT and SAT School Day. Governor Gina M. Raimondo included funds in the state budget to make the PSAT and SAT free for every public high school sophomore and junior. This ensures that all students can use the SAT to consider higher education opportunities. The PSAT/NMSQT and SAT are highly relevant to student future success because they focus on the skills and knowledge at the heart of education. The SAT sets an appropriately high standard for Rhode Island students and should be a good tool to help the state close the gap between expected future job requirements for post-secondary education and current college enrollment and completion. Connections to Teaching and Learning
Assessments are part of a larger system of teaching and learning. In isolation, assessment results cannot improve student achievement. Their power is realized when the results are reviewed against a school’s curriculum, instructional practices, student work, grading practices, along with other local data and then action on this analysis is taken. We are able to see where we are in relation to last year and whether we are heading in
Assessments should be used in service of teaching and learning. They are the starting
point for our work- not the conclusion.
7
the right direction or need to make further adjustments. The work ahead of us is to use this information as one tool for the state, districts, schools, as well as parents and other stakeholders to work together to advocate for and support improved student learning.
Families can use the results to engage their child in conversations about school and his or her progress.3 Families can work with their child’s teacher(s) to understand the report within the context of many other indicators of student learning. Finally, collectively, families can work within their school community to help shape the school’s goals and planning.
Teachers can use this year’s results to reflect on the instructional shifts they have made in comparison to their students’ performance on the assessment. Student performance overall, on subclaims and on specific assessment questions may help them evaluate materials, supports, and curriculum they have used. The process of reviewing is best done in partnership with teachers working at the same grade level or instructing the same course. The collective analysis along with feedback through the evaluation process should shape ongoing professional learning.
Schools can use this information to look at patterns across grade levels and between student groups to make informed curriculum decisions, ensure that all students have the opportunity to learn, engage parents, and to make decisions that guarantee that all students are placed with teachers who can meet their needs.
Districts can use the results to review each school’s performance to identify which supports and resources best meet the needs of their students. Districts can review patterns of performance between schools to identify those that need additional support. The results of these analyses can be used to engage the community on plans to move the district and its schools forward.
3 More information on PARCC score reports for students is available online at www.UnderstandTheScore.org
8
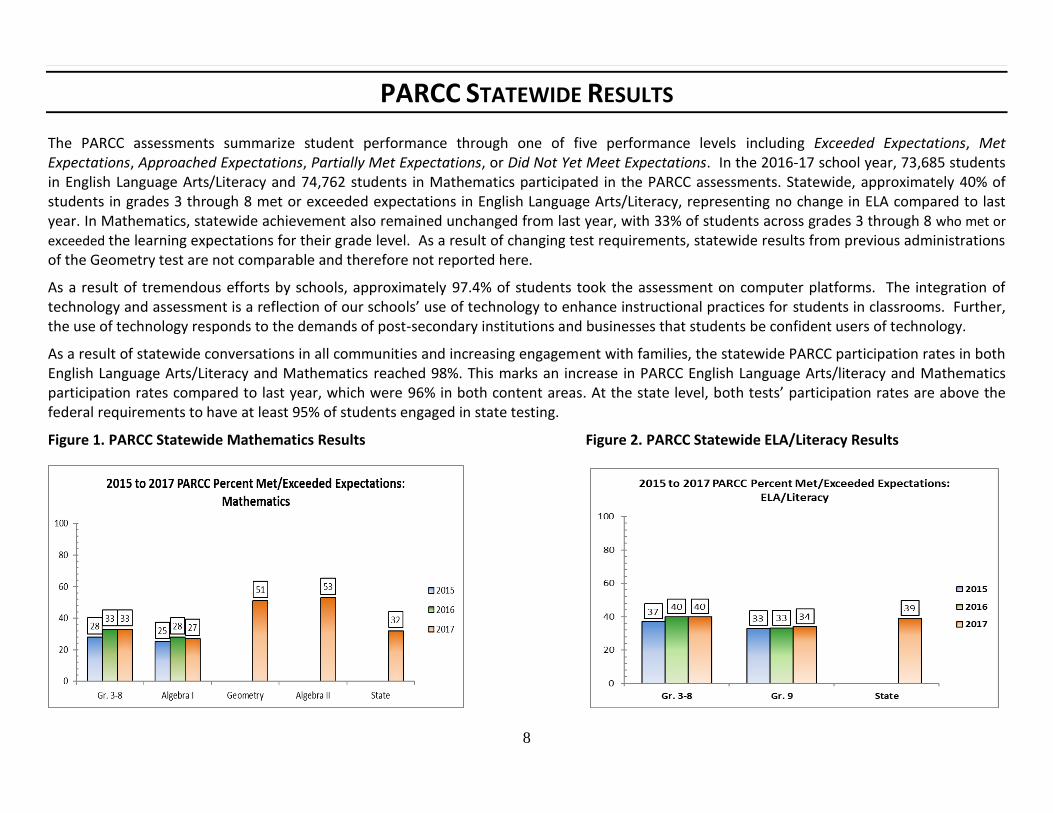
PARCC STATEWIDE RESULTS The PARCC assessments summarize student performance through one of five performance levels including Exceeded Expectations, Met Expectations, Approached Expectations, Partially Met Expectations, or Did Not Yet Meet Expectations. In the 2016-17 school year, 73,685 students in English Language Arts/Literacy and 74,762 students in Mathematics participated in the PARCC assessments. Statewide, approximately 40% of students in grades 3 through 8 met or exceeded expectations in English Language Arts/Literacy, representing no change in ELA compared to last year. In Mathematics, statewide achievement also remained unchanged from last year, with 33% of students across grades 3 through 8 who met or
exceeded the learning expectations for their grade level. As a result of changing test requirements, statewide results from previous administrations of the Geometry test are not comparable and therefore not reported here.
As a result of tremendous efforts by schools, approximately 97.4% of students took the assessment on computer platforms. The integration of technology and assessment is a reflection of our schools’ use of technology to enhance instructional practices for students in classrooms. Further, the use of technology responds to the demands of post-secondary institutions and businesses that students be confident users of technology.
As a result of statewide conversations in all communities and increasing engagement with families, the statewide PARCC participation rates in both English Language Arts/Literacy and Mathematics reached 98%. This marks an increase in PARCC English Language Arts/literacy and Mathematics participation rates compared to last year, which were 96% in both content areas. At the state level, both tests’ participation rates are above the federal requirements to have at least 95% of students engaged in state testing.
Figure 1. PARCC Statewide Mathematics Results Figure 2. PARCC Statewide ELA/Literacy Results
9
PARCC State-Level English Language Arts/Literacy Results
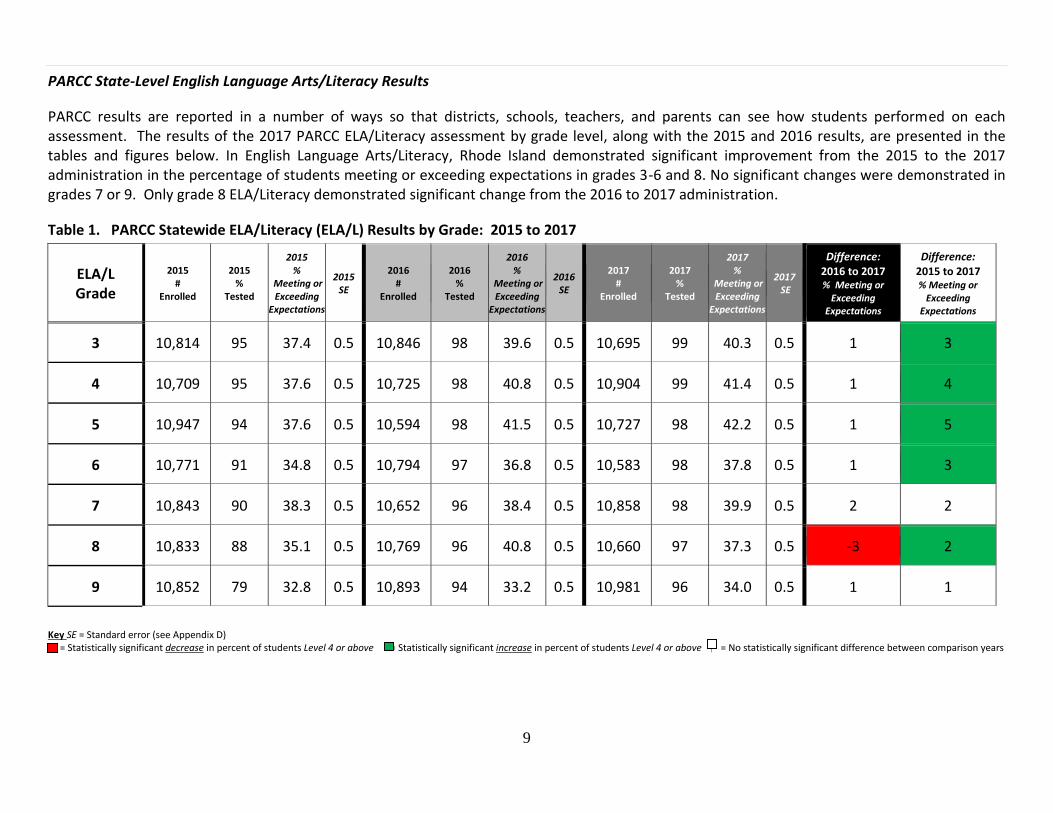
PARCC results are reported in a number of ways so that districts, schools, teachers, and parents can see how students performed on each assessment. The results of the 2017 PARCC ELA/Literacy assessment by grade level, along with the 2015 and 2016 results, are presented in the tables and figures below. In English Language Arts/Literacy, Rhode Island demonstrated significant improvement from the 2015 to the 2017 administration in the percentage of students meeting or exceeding expectations in grades 3-6 and 8. No significant changes were demonstrated in grades 7 or 9. Only grade 8 ELA/Literacy demonstrated significant change from the 2016 to 2017 administration.
Table 1. PARCC Statewide ELA/Literacy (ELA/L) Results by Grade: 2015 to 2017
ELA/L Grade
2015 #
Enrolled
2015 %
Tested
2015 %
Meeting or Exceeding
Expectations
2015 SE
2016 #
Enrolled
2016 %
Tested
2016 %
Meeting or Exceeding
Expectations
2016 SE
2017 #
Enrolled
2017 %
Tested
2017 %
Meeting or Exceeding
Expectations
2017 SE
Difference: 2016 to 2017 % Meeting or
Exceeding Expectations
Difference: 2015 to 2017 % Meeting or
Exceeding Expectations
3 10,814 95 37.4 0.5 10,846 98 39.6 0.5 10,695 99 40.3 0.5 1 3
4 10,709 95 37.6 0.5 10,725 98 40.8 0.5 10,904 99 41.4 0.5 1 4
5 10,947 94 37.6 0.5 10,594 98 41.5 0.5 10,727 98 42.2 0.5 1 5
6 10,771 91 34.8 0.5 10,794 97 36.8 0.5 10,583 98 37.8 0.5 1 3
7 10,843 90 38.3 0.5 10,652 96 38.4 0.5 10,858 98 39.9 0.5 2 2
8 10,833 88 35.1 0.5 10,769 96 40.8 0.5 10,660 97 37.3 0.5 -3 2
9 10,852 79 32.8 0.5 10,893 94 33.2 0.5 10,981 96 34.0 0.5 1 1
Key SE = Standard error (see Appendix D) = Statistically significant decrease in percent of students Level 4 or above = Statistically significant increase in percent of students Level 4 or above = No statistically significant difference between comparison years
10
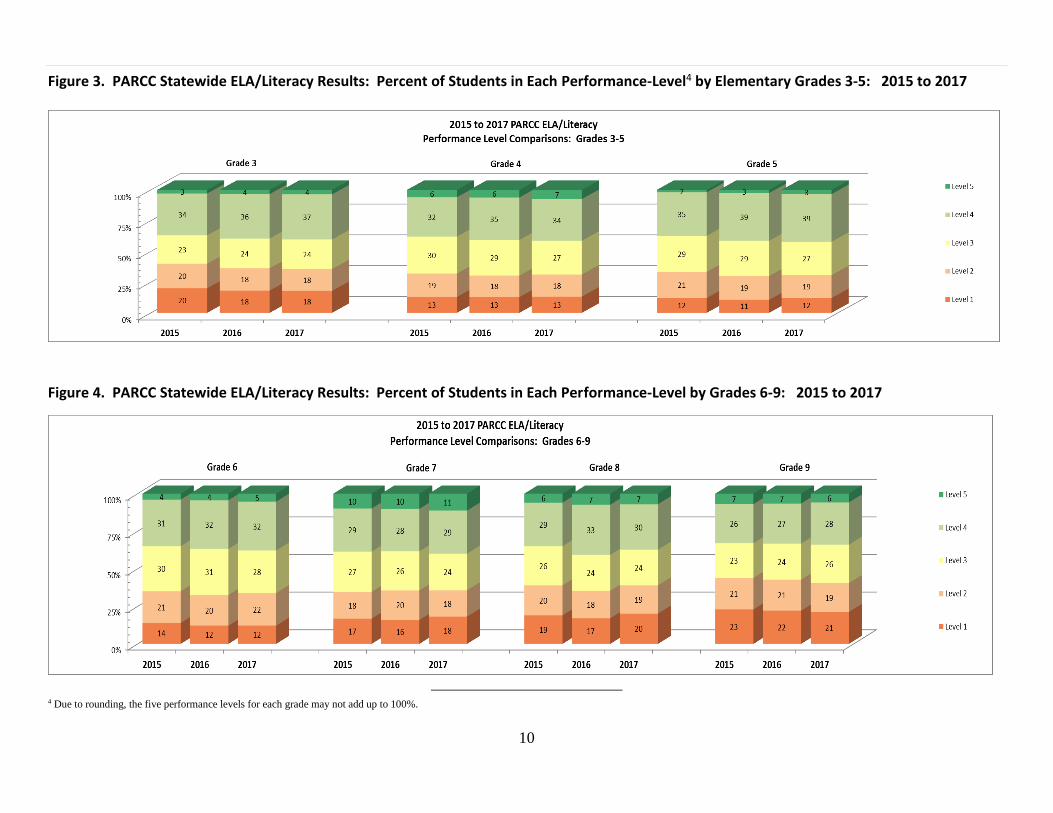
Figure 3. PARCC Statewide ELA/Literacy Results: Percent of Students in Each Performance-Level4 by Elementary Grades 3-5: 2015 to 2017
Figure 4. PARCC Statewide ELA/Literacy Results: Percent of Students in Each Performance-Level by Grades 6-9: 2015 to 2017
4 Due to rounding, the five performance levels for each grade may not add up to 100%.
11
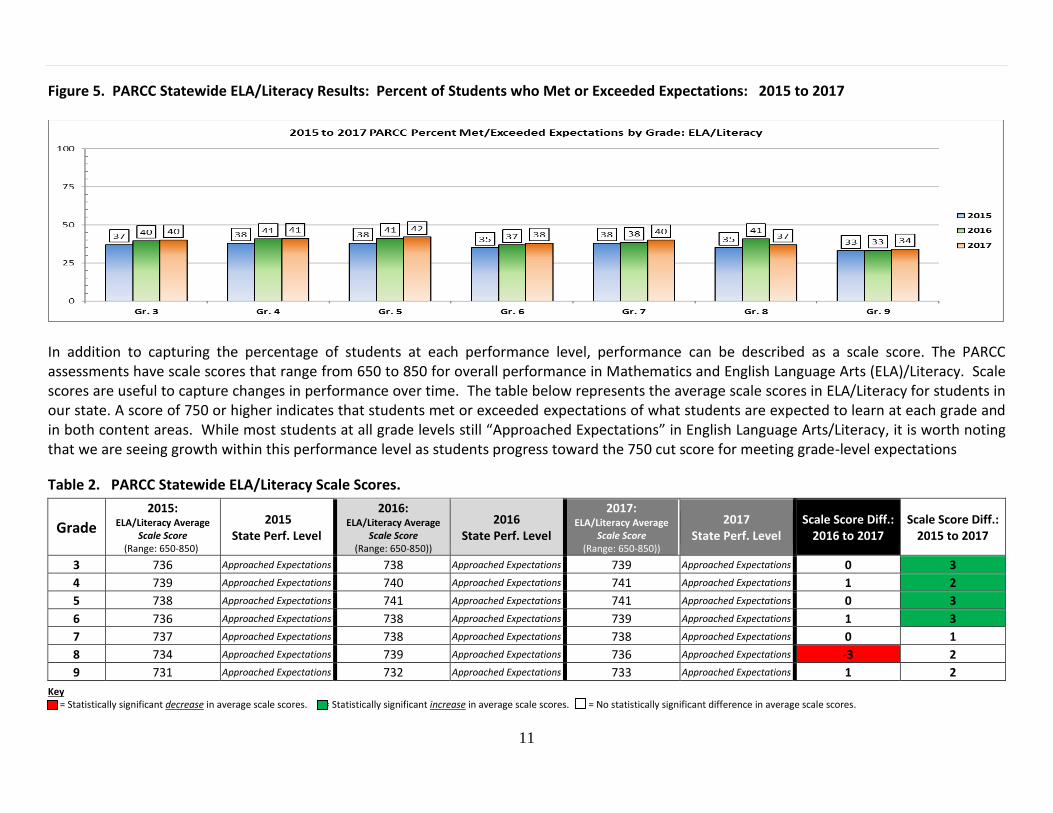
Figure 5. PARCC Statewide ELA/Literacy Results: Percent of Students who Met or Exceeded Expectations: 2015 to 2017
In addition to capturing the percentage of students at each performance level, performance can be described as a scale score. The PARCC assessments have scale scores that range from 650 to 850 for overall performance in Mathematics and English Language Arts (ELA)/Literacy. Scale scores are useful to capture changes in performance over time. The table below represents the average scale scores in ELA/Literacy for students in our state. A score of 750 or higher indicates that students met or exceeded expectations of what students are expected to learn at each grade and in both content areas. While most students at all grade levels still “Approached Expectations” in English Language Arts/Literacy, it is worth noting that we are seeing growth within this performance level as students progress toward the 750 cut score for meeting grade-level expectations
Table 2. PARCC Statewide ELA/Literacy Scale Scores.
Key = Statistically significant decrease in average scale scores. = Statistically significant increase in average scale scores. = No statistically significant difference in average scale scores.
Grade
2015: ELA/Literacy Average
Scale Score (Range: 650-850))
2015 State Perf. Level
2016: ELA/Literacy Average
Scale Score (Range: 650-850))
2016 State Perf. Level
2017: ELA/Literacy Average
Scale Score (Range: 650-850))
2017 State Perf. Level
Scale Score Diff.: 2016 to 2017
Scale Score Diff.: 2015 to 2017
3 736 Approached Expectations 738 Approached Expectations 739 Approached Expectations 0 3
4 739 Approached Expectations 740 Approached Expectations 741 Approached Expectations 1 2
5 738 Approached Expectations 741 Approached Expectations 741 Approached Expectations 0 3
6 736 Approached Expectations 738 Approached Expectations 739 Approached Expectations 1 3
7 737 Approached Expectations 738 Approached Expectations 738 Approached Expectations 0 1
8 734 Approached Expectations 739 Approached Expectations 736 Approached Expectations -3 2
9 731 Approached Expectations 732 Approached Expectations 733 Approached Expectations 1 2
12
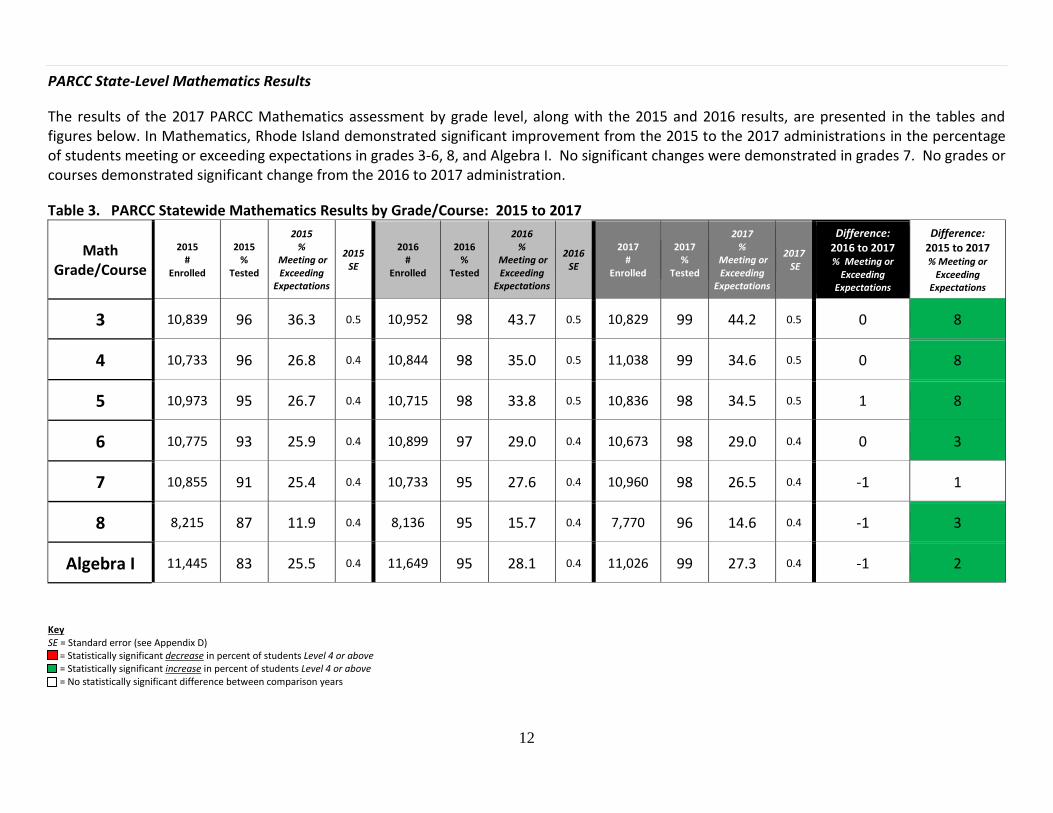
PARCC State-Level Mathematics Results
The results of the 2017 PARCC Mathematics assessment by grade level, along with the 2015 and 2016 results, are presented in the tables and figures below. In Mathematics, Rhode Island demonstrated significant improvement from the 2015 to the 2017 administrations in the percentage of students meeting or exceeding expectations in grades 3-6, 8, and Algebra I. No significant changes were demonstrated in grades 7. No grades or courses demonstrated significant change from the 2016 to 2017 administration.
Table 3. PARCC Statewide Mathematics Results by Grade/Course: 2015 to 2017
Math Grade/Course
2015 #
Enrolled
2015 %
Tested
2015 %
Meeting or Exceeding
Expectations
2015 SE
2016 #
Enrolled
2016 %
Tested
2016 %
Meeting or Exceeding
Expectations
2016 SE
2017 #
Enrolled
2017 %
Tested
2017 %
Meeting or Exceeding
Expectations
2017 SE
Difference: 2016 to 2017 % Meeting or
Exceeding Expectations
Difference: 2015 to 2017 % Meeting or
Exceeding Expectations
3 10,839 96 36.3 0.5 10,952 98 43.7 0.5 10,829 99 44.2 0.5 0 8
4 10,733 96 26.8 0.4 10,844 98 35.0 0.5 11,038 99 34.6 0.5 0 8
5 10,973 95 26.7 0.4 10,715 98 33.8 0.5 10,836 98 34.5 0.5 1 8
6 10,775 93 25.9 0.4 10,899 97 29.0 0.4 10,673 98 29.0 0.4 0 3
7 10,855 91 25.4 0.4 10,733 95 27.6 0.4 10,960 98 26.5 0.4 -1 1
8 8,215 87 11.9 0.4 8,136 95 15.7 0.4 7,770 96 14.6 0.4 -1 3
Algebra I 11,445 83 25.5 0.4 11,649 95 28.1 0.4 11,026 99 27.3 0.4 -1 2
Key SE = Standard error (see Appendix D) = Statistically significant decrease in percent of students Level 4 or above = Statistically significant increase in percent of students Level 4 or above = No statistically significant difference between comparison years
13
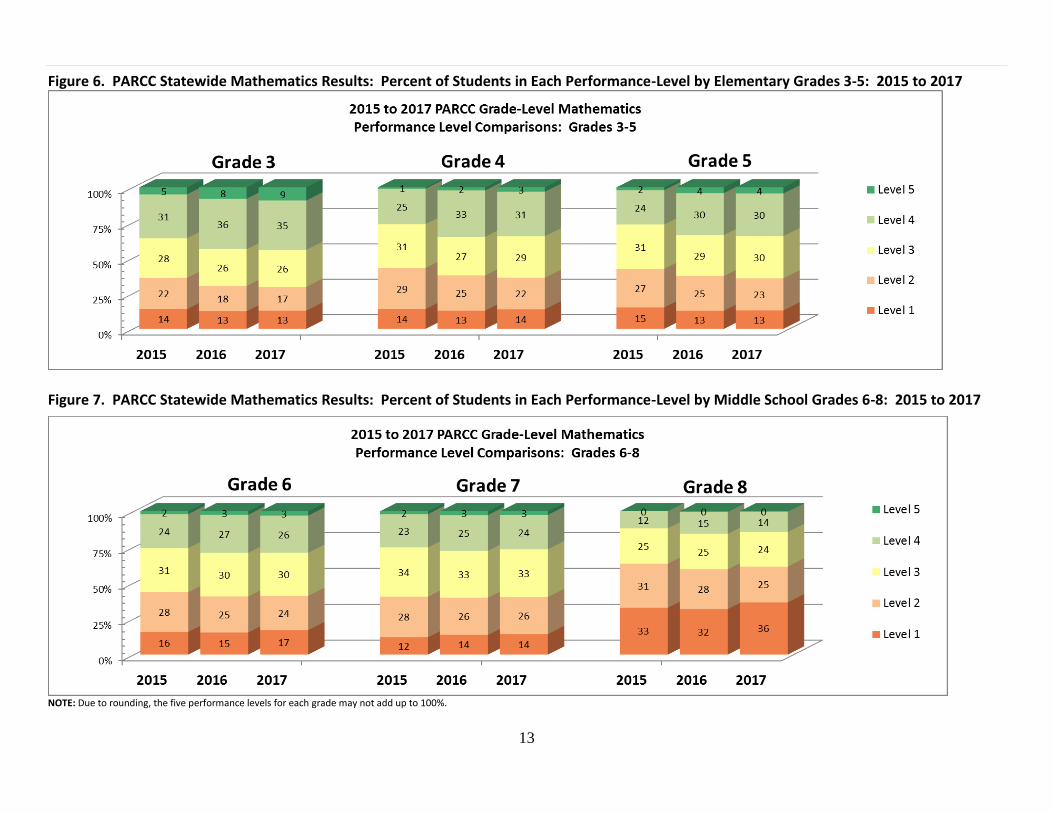
Figure 6. PARCC Statewide Mathematics Results: Percent of Students in Each Performance-Level by Elementary Grades 3-5: 2015 to 2017
Figure 7. PARCC Statewide Mathematics Results: Percent of Students in Each Performance-Level by Middle School Grades 6-8: 2015 to 2017
NOTE: Due to rounding, the five performance levels for each grade may not add up to 100%.
14
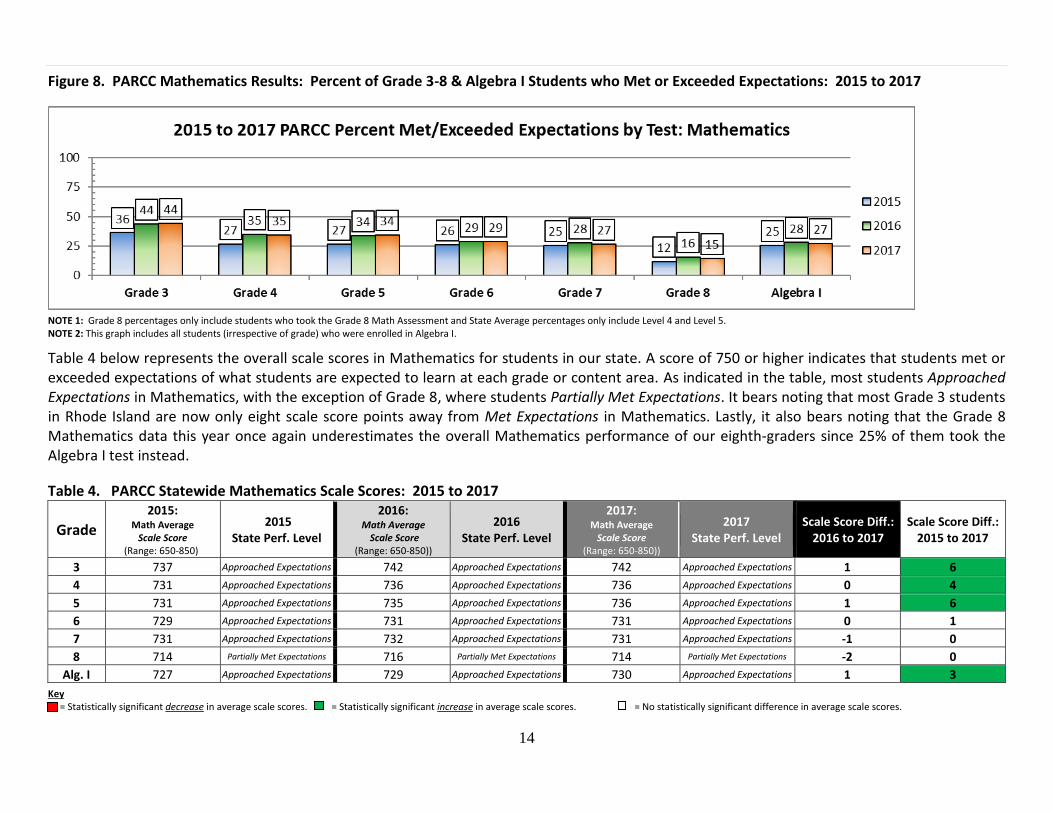
Figure 8. PARCC Mathematics Results: Percent of Grade 3-8 & Algebra I Students who Met or Exceeded Expectations: 2015 to 2017
NOTE 1: Grade 8 percentages only include students who took the Grade 8 Math Assessment and State Average percentages only include Level 4 and Level 5. NOTE 2: This graph includes all students (irrespective of grade) who were enrolled in Algebra I.
Table 4 below represents the overall scale scores in Mathematics for students in our state. A score of 750 or higher indicates that students met or exceeded expectations of what students are expected to learn at each grade or content area. As indicated in the table, most students Approached Expectations in Mathematics, with the exception of Grade 8, where students Partially Met Expectations. It bears noting that most Grade 3 students in Rhode Island are now only eight scale score points away from Met Expectations in Mathematics. Lastly, it also bears noting that the Grade 8 Mathematics data this year once again underestimates the overall Mathematics performance of our eighth-graders since 25% of them took the Algebra I test instead.
Table 4. PARCC Statewide Mathematics Scale Scores: 2015 to 2017
Key = Statistically significant decrease in average scale scores. = Statistically significant increase in average scale scores. = No statistically significant difference in average scale scores.
Grade
2015: Math Average
Scale Score (Range: 650-850))
2015 State Perf. Level
2016: Math Average
Scale Score (Range: 650-850))
2016 State Perf. Level
2017: Math Average
Scale Score (Range: 650-850))
2017 State Perf. Level
Scale Score Diff.: 2016 to 2017
Scale Score Diff.: 2015 to 2017
3 737 Approached Expectations 742 Approached Expectations 742 Approached Expectations 1 6
4 731 Approached Expectations 736 Approached Expectations 736 Approached Expectations 0 4
5 731 Approached Expectations 735 Approached Expectations 736 Approached Expectations 1 6
6 729 Approached Expectations 731 Approached Expectations 731 Approached Expectations 0 1
7 731 Approached Expectations 732 Approached Expectations 731 Approached Expectations -1 0
8 714 Partially Met Expectations 716 Partially Met Expectations 714 Partially Met Expectations -2 0
Alg. I 727 Approached Expectations 729 Approached Expectations 730 Approached Expectations 1 3
15
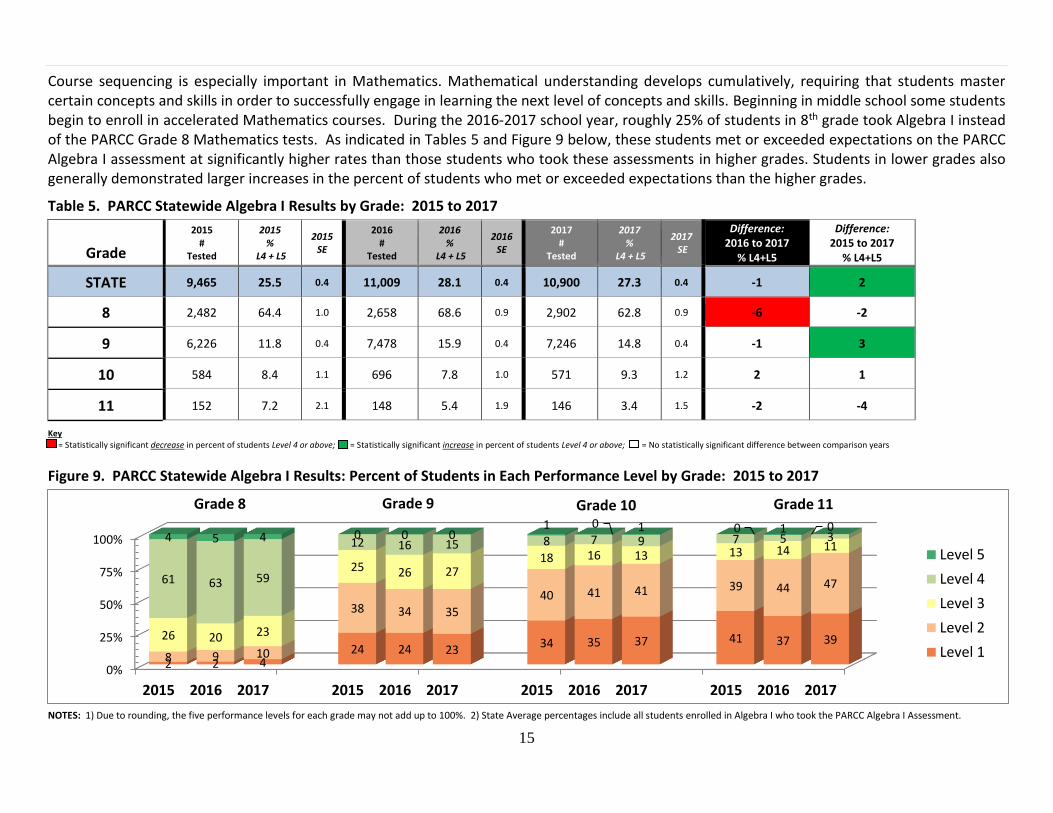
Course sequencing is especially important in Mathematics. Mathematical understanding develops cumulatively, requiring that students master certain concepts and skills in order to successfully engage in learning the next level of concepts and skills. Beginning in middle school some students begin to enroll in accelerated Mathematics courses. During the 2016-2017 school year, roughly 25% of students in 8th grade took Algebra I instead of the PARCC Grade 8 Mathematics tests. As indicated in Tables 5 and Figure 9 below, these students met or exceeded expectations on the PARCC Algebra I assessment at significantly higher rates than those students who took these assessments in higher grades. Students in lower grades also generally demonstrated larger increases in the percent of students who met or exceeded expectations than the higher grades.
Table 5. PARCC Statewide Algebra I Results by Grade: 2015 to 2017
Grade
2015 #
Tested
2015 %
L4 + L5
2015 SE
2016 #
Tested
2016 %
L4 + L5
2016 SE
2017 #
Tested
2017 %
L4 + L5
2017 SE
Difference: 2016 to 2017
% L4+L5
Difference: 2015 to 2017
% L4+L5
STATE 9,465 25.5 0.4 11,009 28.1 0.4 10,900 27.3 0.4 -1 2
8 2,482 64.4 1.0 2,658 68.6 0.9 2,902 62.8 0.9 -6 -2
9 6,226 11.8 0.4 7,478 15.9 0.4 7,246 14.8 0.4 -1 3
10 584 8.4 1.1 696 7.8 1.0 571 9.3 1.2 2 1
11 152 7.2 2.1 148 5.4 1.9 146 3.4 1.5 -2 -4
Key = Statistically significant decrease in percent of students Level 4 or above; = Statistically significant increase in percent of students Level 4 or above; = No statistically significant difference between comparison years
Figure 9. PARCC Statewide Algebra I Results: Percent of Students in Each Performance Level by Grade: 2015 to 2017
NOTES: 1) Due to rounding, the five performance levels for each grade may not add up to 100%. 2) State Average percentages include all students enrolled in Algebra I who took the PARCC Algebra I Assessment.
0%
25%
50%
75%
100%
2015 2016 2017 2015 2016 2017 2015 2016 2017 2015 2016 2017
2 2 424 24 23
34 35 37 41 37 39
8 9 10
38 34 35
40 41 41 39 44 47
26 20 23
25 26 2718 16 13 13 14 11
61 63 59
12 16 15 8 7 9 7 5 34 5 4 0 0 01 0 1 0 1 0
Level 5
Level 4
Level 3
Level 2
Level 1
Grade 9Grade 8 Grade 10 Grade 11
16
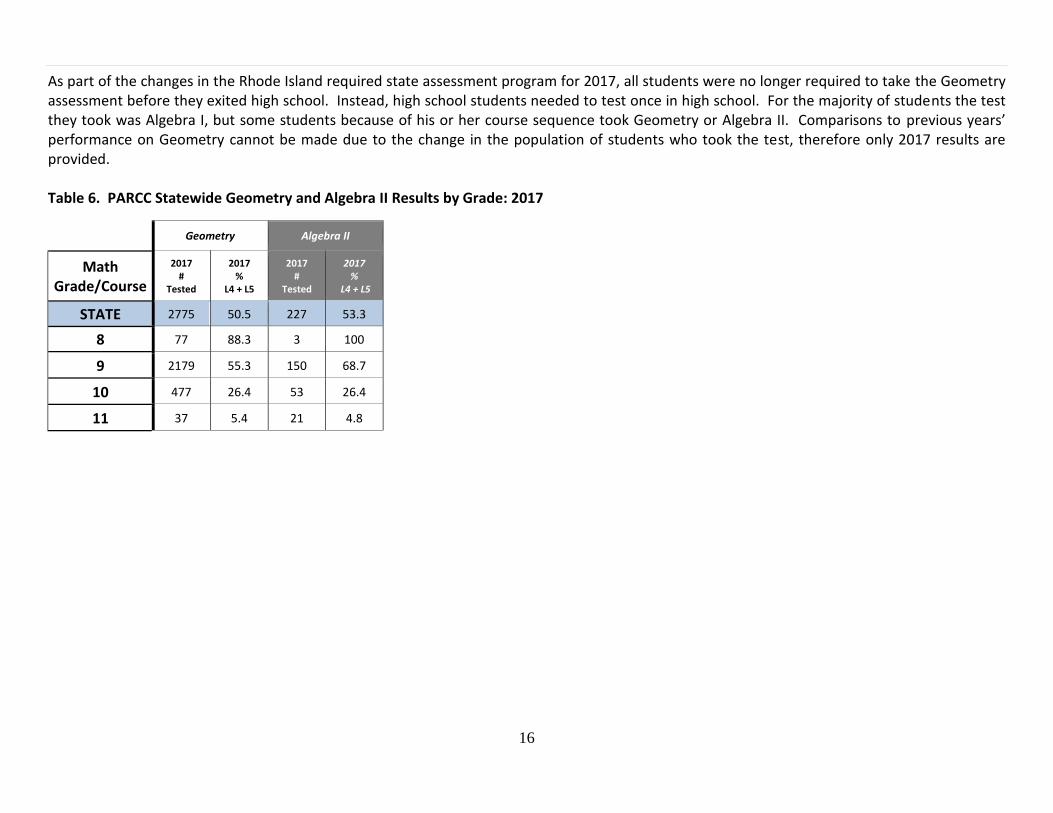
As part of the changes in the Rhode Island required state assessment program for 2017, all students were no longer required to take the Geometry assessment before they exited high school. Instead, high school students needed to test once in high school. For the majority of students the test they took was Algebra I, but some students because of his or her course sequence took Geometry or Algebra II. Comparisons to previous years’ performance on Geometry cannot be made due to the change in the population of students who took the test, therefore only 2017 results are provided. Table 6. PARCC Statewide Geometry and Algebra II Results by Grade: 2017
Geometry Algebra II
Math Grade/Course
2017 #
Tested
2017 %
L4 + L5
2017 #
Tested
2017 %
L4 + L5
STATE 2775 50.5 227 53.3
8 77 88.3 3 100
9 2179 55.3 150 68.7
10 477 26.4 53 26.4
11 37 5.4 21 4.8
17
PARCC Student Group Results
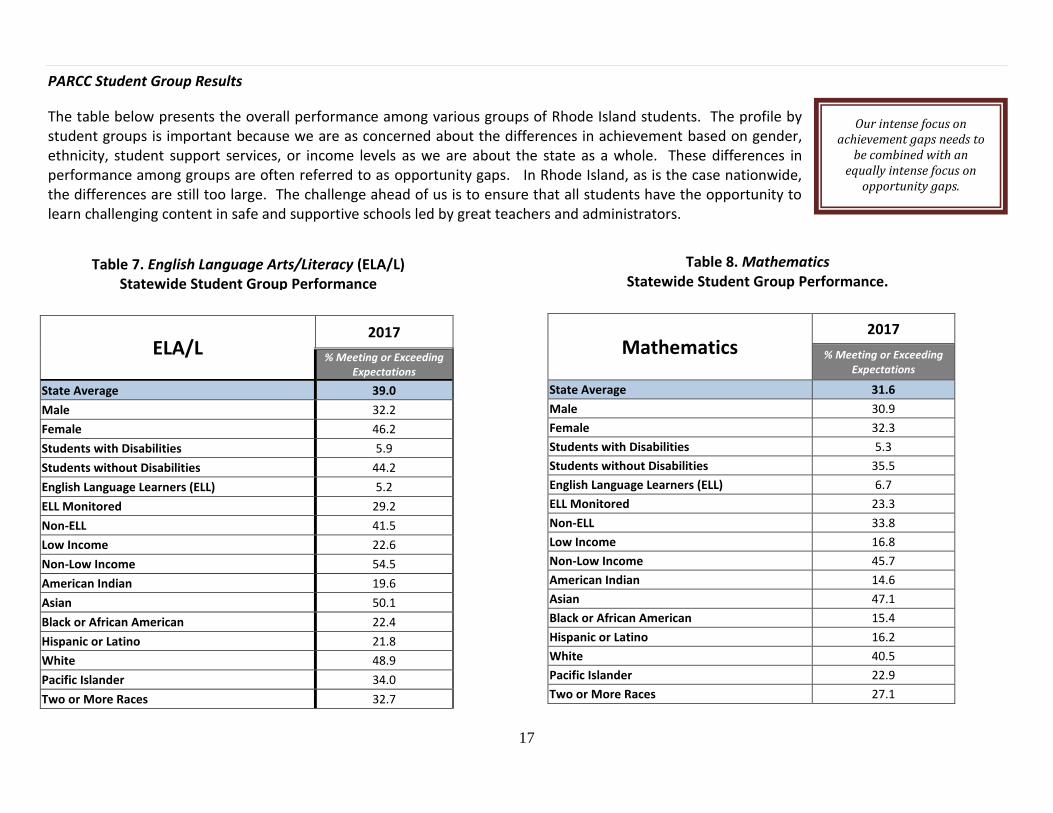
The table below presents the overall performance among various groups of Rhode Island students. The profile by student groups is important because we are as concerned about the differences in achievement based on gender, ethnicity, student support services, or income levels as we are about the state as a whole. These differences in performance among groups are often referred to as opportunity gaps. In Rhode Island, as is the case nationwide, the differences are still too large. The challenge ahead of us is to ensure that all students have the opportunity to learn challenging content in safe and supportive schools led by great teachers and administrators.
Mathematics 2017
% Meeting or Exceeding Expectations
State Average 31.6
Male 30.9
Female 32.3
Students with Disabilities 5.3
Students without Disabilities 35.5
English Language Learners (ELL) 6.7
ELL Monitored 23.3
Non-ELL 33.8
Low Income 16.8
Non-Low Income 45.7
American Indian 14.6
Asian 47.1
Black or African American 15.4
Hispanic or Latino 16.2
White 40.5
Pacific Islander 22.9
Two or More Races 27.1
ELA/L 2017
% Meeting or Exceeding Expectations
State Average 39.0
Male 32.2
Female 46.2
Students with Disabilities 5.9
Students without Disabilities 44.2
English Language Learners (ELL) 5.2
ELL Monitored 29.2
Non-ELL 41.5
Low Income 22.6
Non-Low Income 54.5
American Indian 19.6
Asian 50.1
Black or African American 22.4
Hispanic or Latino 21.8
White 48.9
Pacific Islander 34.0
Two or More Races 32.7
Our intense focus on achievement gaps needs to
be combined with an equally intense focus on
opportunity gaps.
National Education Policy Center
Table 7. English Language Arts/Literacy (ELA/L) Statewide Student Group Performance
Table 8. Mathematics Statewide Student Group Performance.
18
3932
46
6
44
5
2942
23
55
0
25
50
75
100
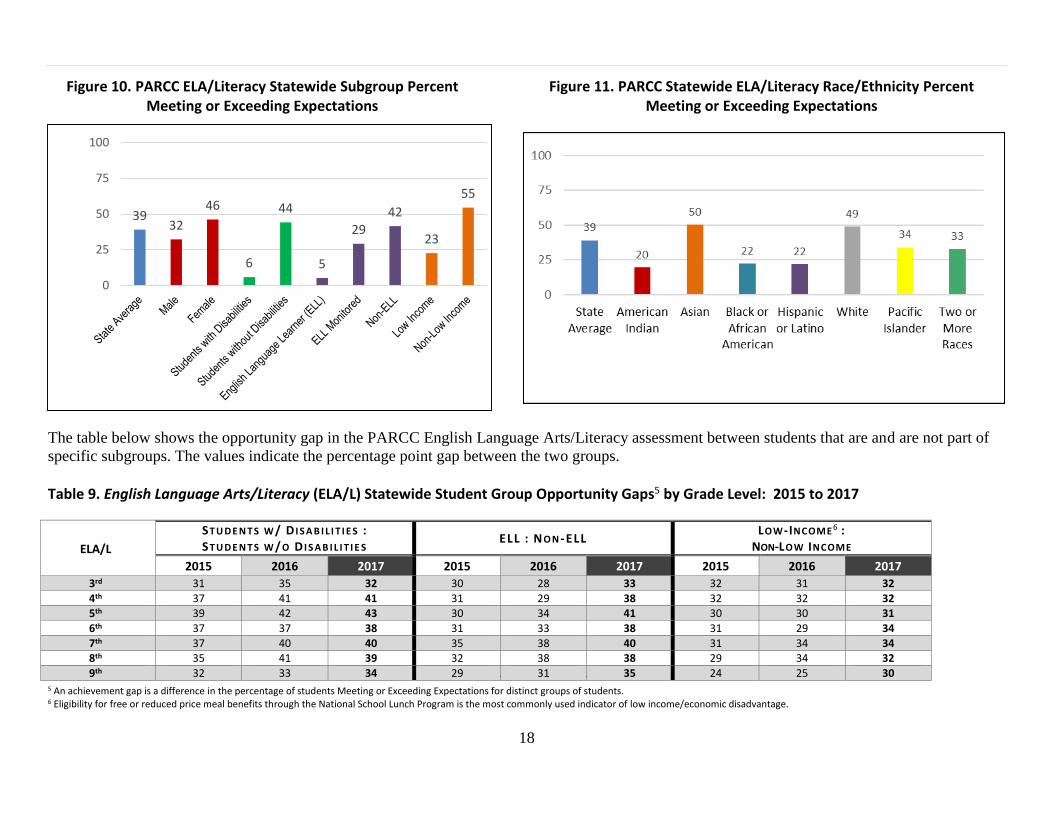
The table below shows the opportunity gap in the PARCC English Language Arts/Literacy assessment between students that are and are not part of
specific subgroups. The values indicate the percentage point gap between the two groups.
Table 9. English Language Arts/Literacy (ELA/L) Statewide Student Group Opportunity Gaps5 by Grade Level: 2015 to 2017
5 An achievement gap is a difference in the percentage of students Meeting or Exceeding Expectations for distinct groups of students. 6 Eligibility for free or reduced price meal benefits through the National School Lunch Program is the most commonly used indicator of low income/economic disadvantage.
ELA/L
ST U D E N T S W / D I S A B I L I T I E S : ST U D E N T S W /O D I S A B I L I T I E S
ELL : NO N -ELL LOW-INCOME 6 :
NON-LOW INCOME
2015 2016 2017 2015 2016 2017 2015 2016 2017
3rd 31 35 32 30 28 33 32 31 32
4th 37 41 41 31 29 38 32 32 32 5th 39 42 43 30 34 41 30 30 31
6th 37 37 38 31 33 38 31 29 34
7th 37 40 40 35 38 40 31 34 34 8th 35 41 39 32 38 38 29 34 32
9th 32 33 34 29 31 35 24 25 30
Figure 10. PARCC ELA/Literacy Statewide Subgroup Percent Meeting or Exceeding Expectations
Figure 11. PARCC Statewide ELA/Literacy Race/Ethnicity Percent Meeting or Exceeding Expectations
19
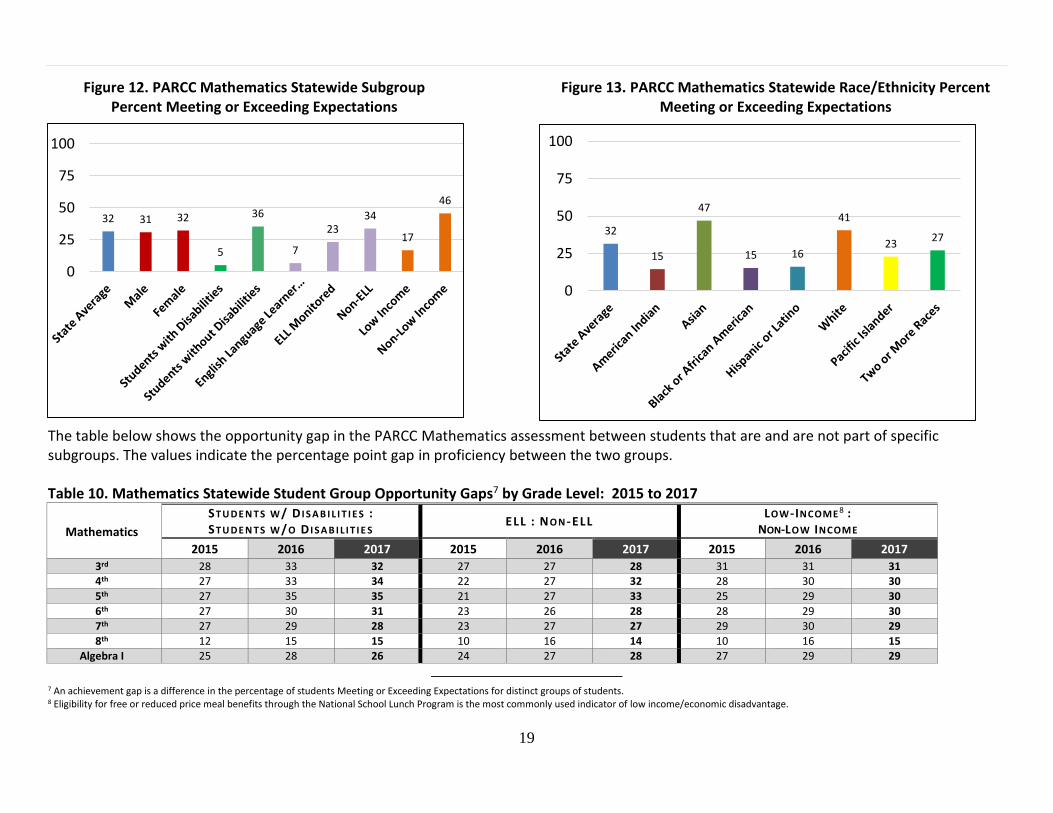
The table below shows the opportunity gap in the PARCC Mathematics assessment between students that are and are not part of specific subgroups. The values indicate the percentage point gap in proficiency between the two groups.
Table 10. Mathematics Statewide Student Group Opportunity Gaps7 by Grade Level: 2015 to 2017
Mathematics
ST U D E N T S W / D I S A B I L I T I E S : ST U D E N T S W /O D I S A B I L I T I E S
ELL : NO N -ELL LOW-INCOME 8 :
NON-LOW INCOME
2015 2016 2017 2015 2016 2017 2015 2016 2017
3rd 28 33 32 27 27 28 31 31 31 4th 27 33 34 22 27 32 28 30 30
5th 27 35 35 21 27 33 25 29 30
6th 27 30 31 23 26 28 28 29 30 7th 27 29 28 23 27 27 29 30 29
8th 12 15 15 10 16 14 10 16 15 Algebra I 25 28 26 24 27 28 27 29 29
7 An achievement gap is a difference in the percentage of students Meeting or Exceeding Expectations for distinct groups of students. 8 Eligibility for free or reduced price meal benefits through the National School Lunch Program is the most commonly used indicator of low income/economic disadvantage.
Figure 13. PARCC Mathematics Statewide Race/Ethnicity Percent Meeting or Exceeding Expectations
Figure 12. PARCC Mathematics Statewide Subgroup Percent Meeting or Exceeding Expectations
32
15
47
15 16
41
2327
0
25
50
75
100
32 31 32
5
36
7
2334
17
46
0
25
50
75
100
20
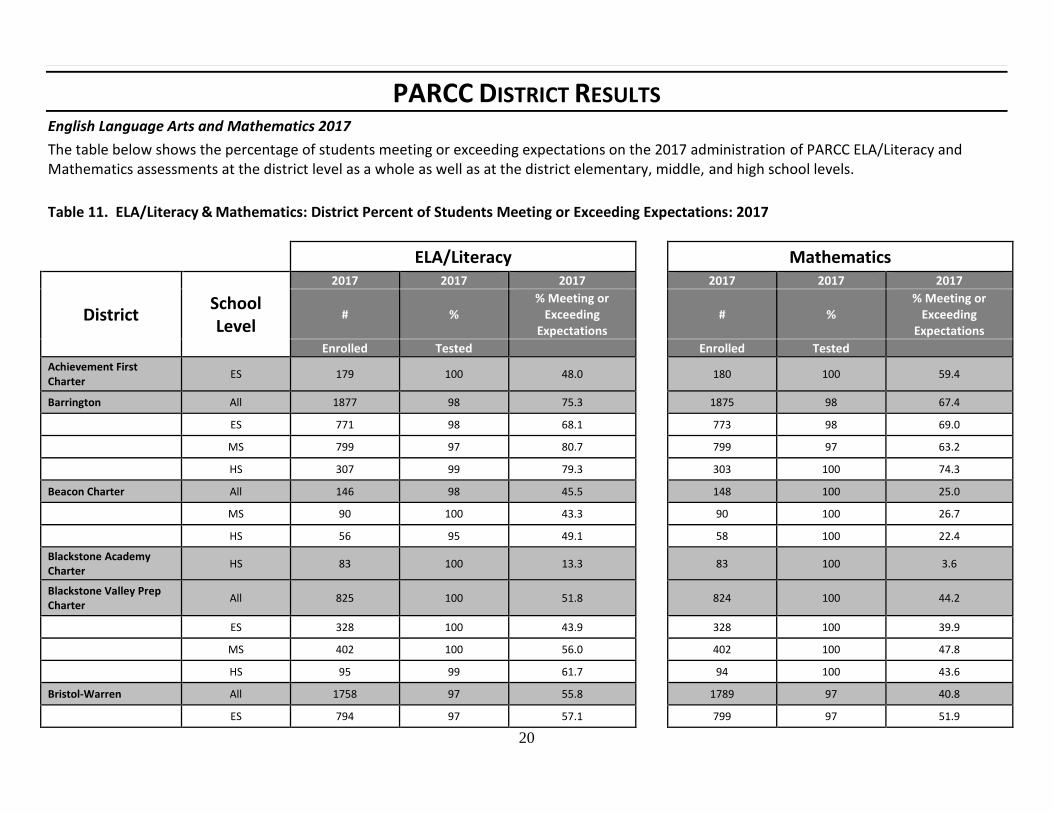
PARCC DISTRICT RESULTS English Language Arts and Mathematics 2017
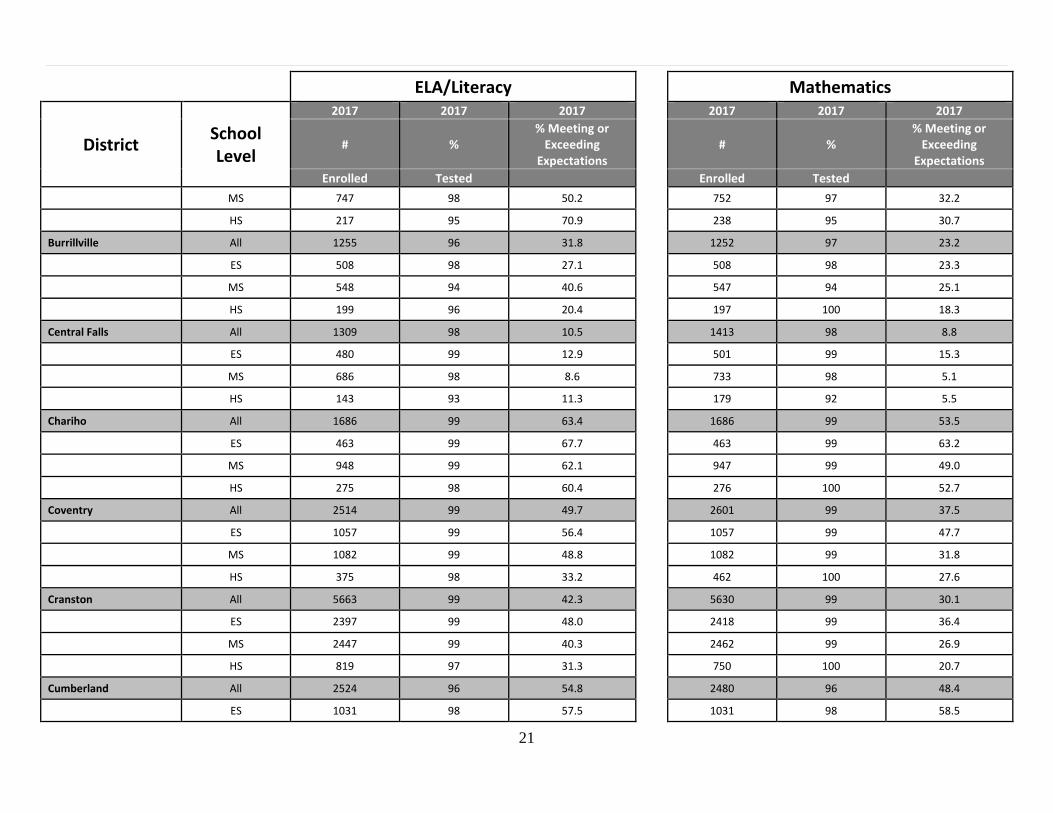
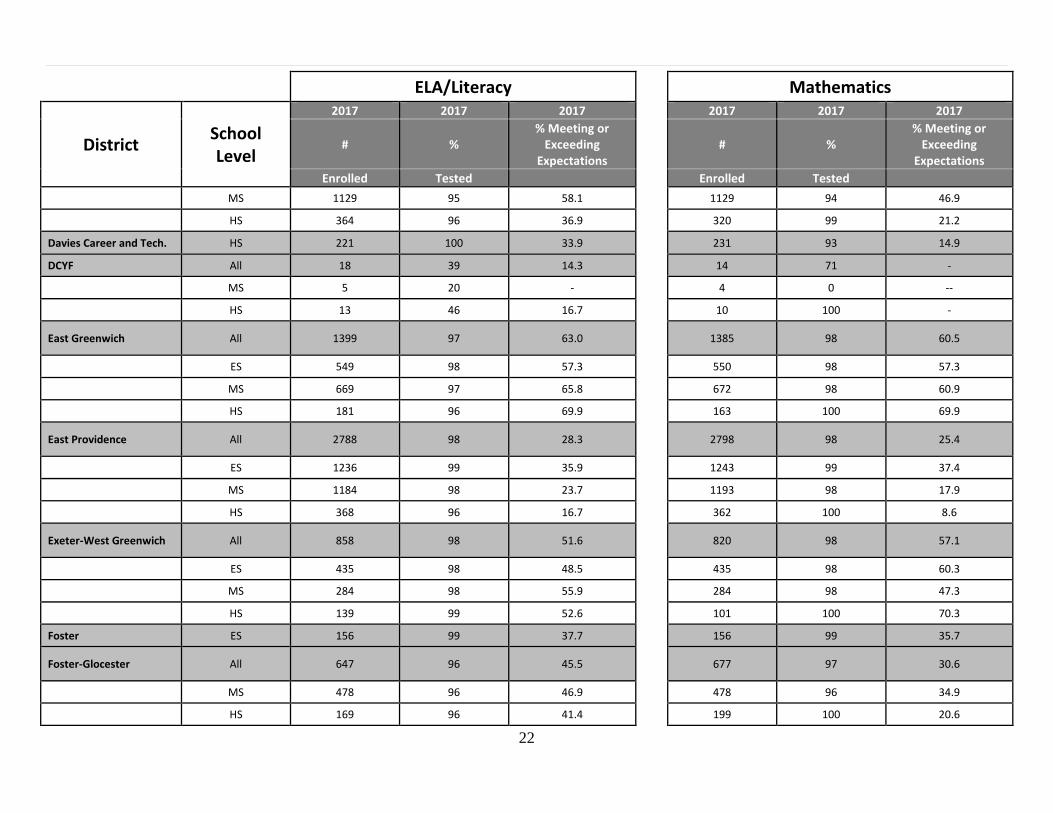
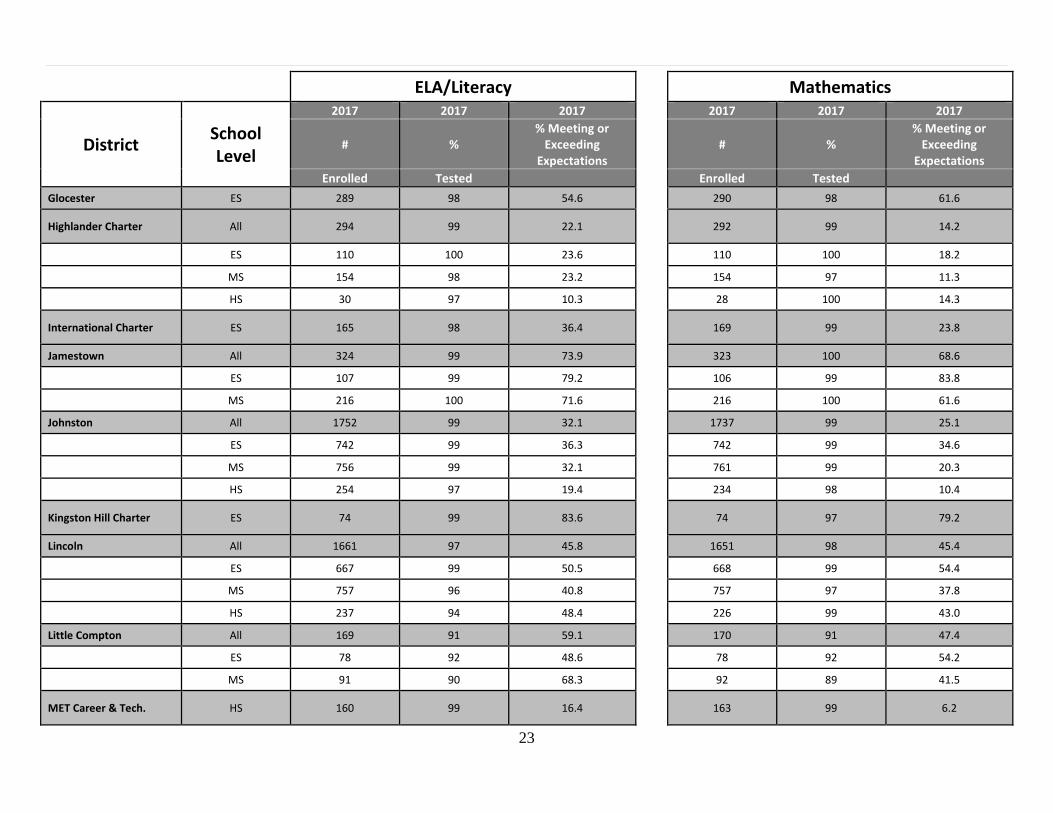
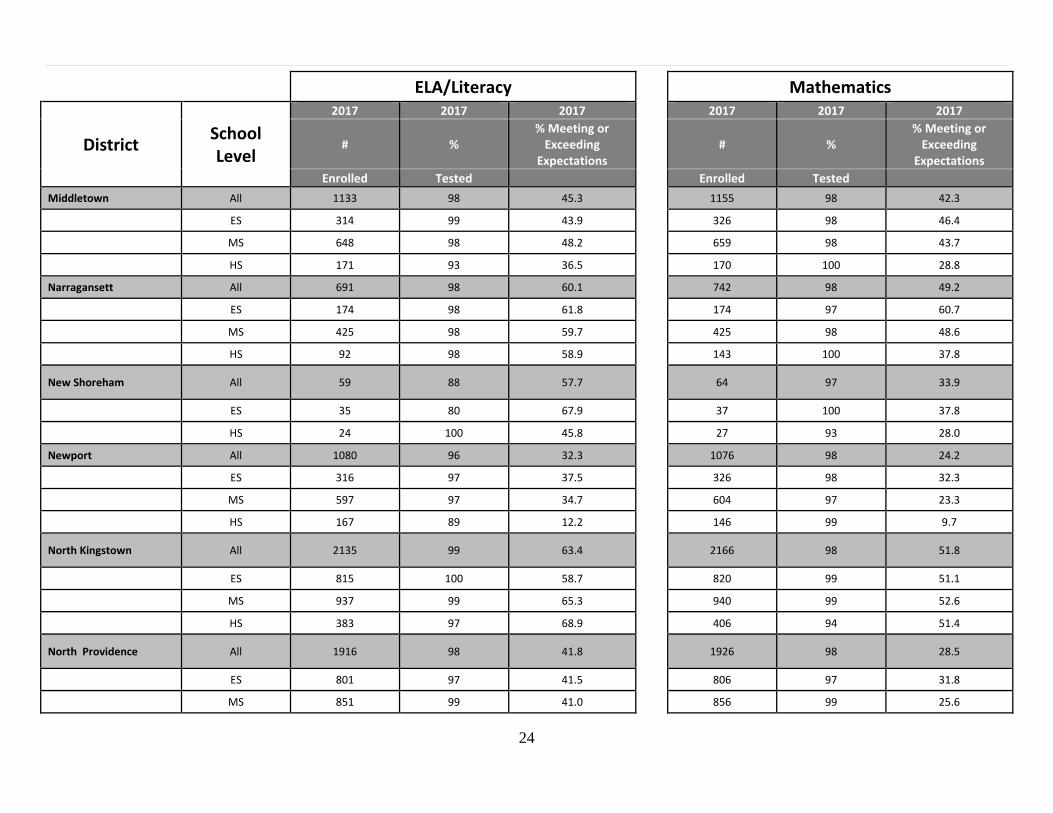
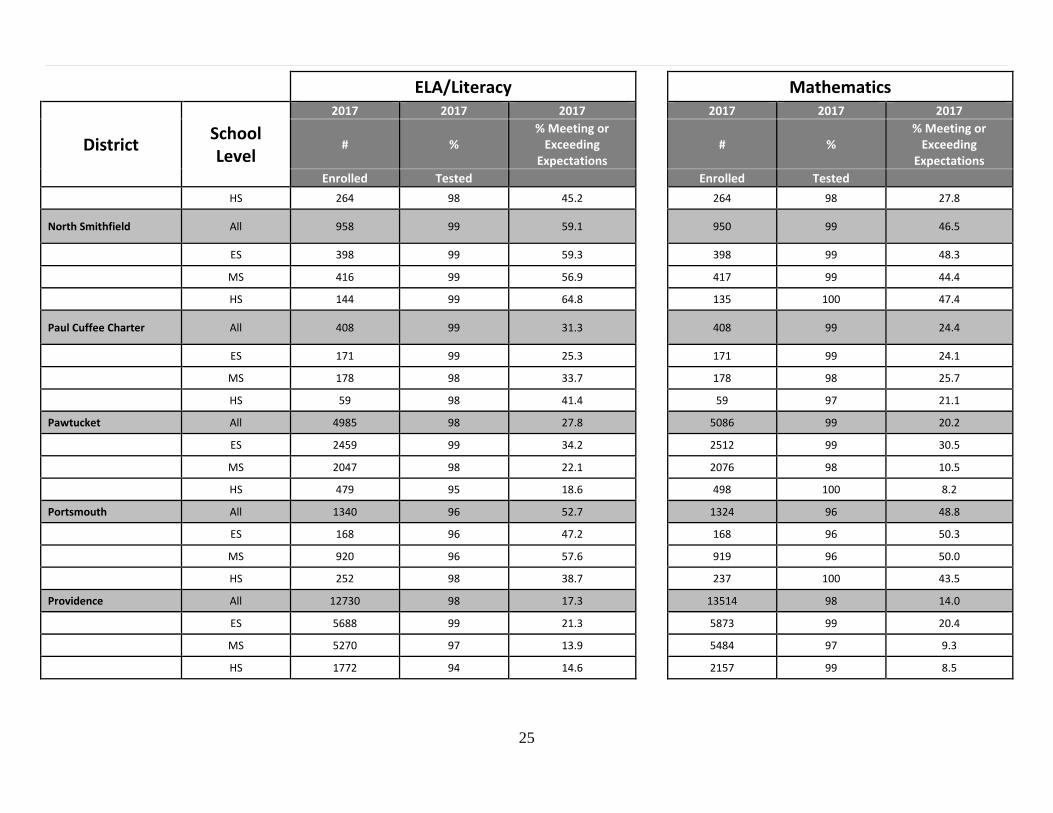
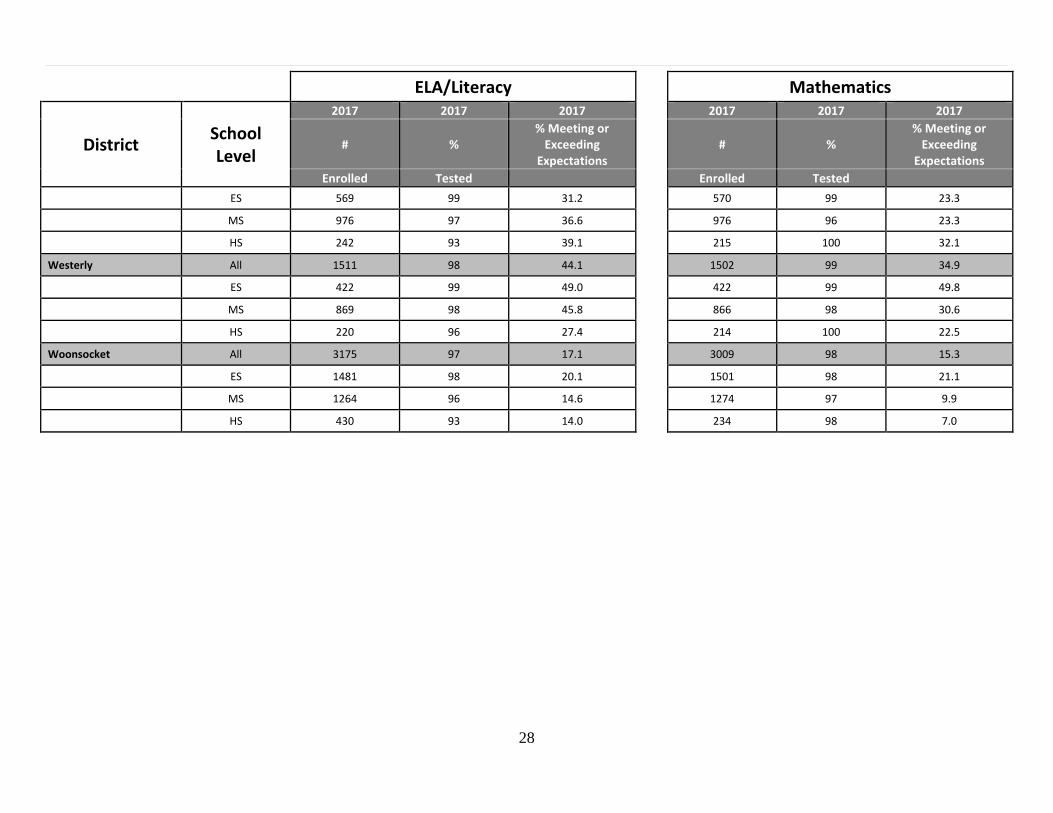
The table below shows the percentage of students meeting or exceeding expectations on the 2017 administration of PARCC ELA/Literacy and Mathematics assessments at the district level as a whole as well as at the district elementary, middle, and high school levels.
Table 11. ELA/Literacy & Mathematics: District Percent of Students Meeting or Exceeding Expectations: 2017
ELA/Literacy
Mathematics
District School Level
2017 2017 2017
2017 2017 2017
# % % Meeting or
Exceeding Expectations
# % % Meeting or
Exceeding Expectations
Enrolled Tested
Enrolled Tested
Achievement First Charter
ES 179 100 48.0
180 100 59.4
Barrington All 1877 98 75.3
1875 98 67.4
ES 771 98 68.1
773 98 69.0
MS 799 97 80.7
799 97 63.2
HS 307 99 79.3
303 100 74.3
Beacon Charter All 146 98 45.5
148 100 25.0
MS 90 100 43.3
90 100 26.7
HS 56 95 49.1
58 100 22.4
Blackstone Academy Charter
HS 83 100 13.3
83 100 3.6
Blackstone Valley Prep Charter
All 825 100 51.8
824 100 44.2
ES 328 100 43.9
328 100 39.9
MS 402 100 56.0
402 100 47.8
HS 95 99 61.7
94 100 43.6
Bristol-Warren All 1758 97 55.8
1789 97 40.8
ES 794 97 57.1
799 97 51.9
21
ELA/Literacy
Mathematics
District School Level
2017 2017 2017
2017 2017 2017
# % % Meeting or
Exceeding Expectations
# % % Meeting or
Exceeding Expectations
Enrolled Tested
Enrolled Tested
MS 747 98 50.2
752 97 32.2
HS 217 95 70.9
238 95 30.7
Burrillville All 1255 96 31.8
1252 97 23.2
ES 508 98 27.1
508 98 23.3
MS 548 94 40.6
547 94 25.1
HS 199 96 20.4
197 100 18.3
Central Falls All 1309 98 10.5
1413 98 8.8
ES 480 99 12.9
501 99 15.3
MS 686 98 8.6
733 98 5.1
HS 143 93 11.3
179 92 5.5
Chariho All 1686 99 63.4
1686 99 53.5
ES 463 99 67.7
463 99 63.2
MS 948 99 62.1
947 99 49.0
HS 275 98 60.4
276 100 52.7
Coventry All 2514 99 49.7
2601 99 37.5
ES 1057 99 56.4
1057 99 47.7
MS 1082 99 48.8
1082 99 31.8
HS 375 98 33.2
462 100 27.6
Cranston All 5663 99 42.3
5630 99 30.1
ES 2397 99 48.0
2418 99 36.4
MS 2447 99 40.3
2462 99 26.9
HS 819 97 31.3
750 100 20.7
Cumberland All 2524 96 54.8
2480 96 48.4
ES 1031 98 57.5
1031 98 58.5
22
ELA/Literacy
Mathematics
District School Level
2017 2017 2017
2017 2017 2017
# % % Meeting or
Exceeding Expectations
# % % Meeting or
Exceeding Expectations
Enrolled Tested
Enrolled Tested
MS 1129 95 58.1
1129 94 46.9
HS 364 96 36.9
320 99 21.2
Davies Career and Tech. HS 221 100 33.9
231 93 14.9
DCYF All 18 39 14.3
14 71 -
MS 5 20 -
4 0 --
HS 13 46 16.7
10 100 -
East Greenwich All 1399 97 63.0
1385 98 60.5
ES 549 98 57.3
550 98 57.3
MS 669 97 65.8
672 98 60.9
HS 181 96 69.9
163 100 69.9
East Providence All 2788 98 28.3
2798 98 25.4
ES 1236 99 35.9
1243 99 37.4
MS 1184 98 23.7
1193 98 17.9
HS 368 96 16.7
362 100 8.6
Exeter-West Greenwich All 858 98 51.6
820 98 57.1
ES 435 98 48.5
435 98 60.3
MS 284 98 55.9
284 98 47.3
HS 139 99 52.6
101 100 70.3
Foster ES 156 99 37.7
156 99 35.7
Foster-Glocester All 647 96 45.5
677 97 30.6
MS 478 96 46.9
478 96 34.9
HS 169 96 41.4
199 100 20.6
23
ELA/Literacy
Mathematics
District School Level
2017 2017 2017
2017 2017 2017
# % % Meeting or
Exceeding Expectations
# % % Meeting or
Exceeding Expectations
Enrolled Tested
Enrolled Tested
Glocester ES 289 98 54.6
290 98 61.6
Highlander Charter All 294 99 22.1
292 99 14.2
ES 110 100 23.6
110 100 18.2
MS 154 98 23.2
154 97 11.3
HS 30 97 10.3
28 100 14.3
International Charter ES 165 98 36.4
169 99 23.8
Jamestown All 324 99 73.9
323 100 68.6
ES 107 99 79.2
106 99 83.8
MS 216 100 71.6
216 100 61.6
Johnston All 1752 99 32.1
1737 99 25.1
ES 742 99 36.3
742 99 34.6
MS 756 99 32.1
761 99 20.3
HS 254 97 19.4
234 98 10.4
Kingston Hill Charter ES 74 99 83.6
74 97 79.2
Lincoln All 1661 97 45.8
1651 98 45.4
ES 667 99 50.5
668 99 54.4
MS 757 96 40.8
757 97 37.8
HS 237 94 48.4
226 99 43.0
Little Compton All 169 91 59.1
170 91 47.4
ES 78 92 48.6
78 92 54.2
MS 91 90 68.3
92 89 41.5
MET Career & Tech. HS 160 99 16.4
163 99 6.2
24
ELA/Literacy
Mathematics
District School Level
2017 2017 2017
2017 2017 2017
# % % Meeting or
Exceeding Expectations
# % % Meeting or
Exceeding Expectations
Enrolled Tested
Enrolled Tested
Middletown All 1133 98 45.3
1155 98 42.3
ES 314 99 43.9
326 98 46.4
MS 648 98 48.2
659 98 43.7
HS 171 93 36.5
170 100 28.8
Narragansett All 691 98 60.1
742 98 49.2
ES 174 98 61.8
174 97 60.7
MS 425 98 59.7
425 98 48.6
HS 92 98 58.9
143 100 37.8
New Shoreham All 59 88 57.7
64 97 33.9
ES 35 80 67.9
37 100 37.8
HS 24 100 45.8
27 93 28.0
Newport All 1080 96 32.3
1076 98 24.2
ES 316 97 37.5
326 98 32.3
MS 597 97 34.7
604 97 23.3
HS 167 89 12.2
146 99 9.7
North Kingstown All 2135 99 63.4
2166 98 51.8
ES 815 100 58.7
820 99 51.1
MS 937 99 65.3
940 99 52.6
HS 383 97 68.9
406 94 51.4
North Providence All 1916 98 41.8
1926 98 28.5
ES 801 97 41.5
806 97 31.8
MS 851 99 41.0
856 99 25.6
25
ELA/Literacy
Mathematics
District School Level
2017 2017 2017
2017 2017 2017
# % % Meeting or
Exceeding Expectations
# % % Meeting or
Exceeding Expectations
Enrolled Tested
Enrolled Tested
HS 264 98 45.2
264 98 27.8
North Smithfield All 958 99 59.1
950 99 46.5
ES 398 99 59.3
398 99 48.3
MS 416 99 56.9
417 99 44.4
HS 144 99 64.8
135 100 47.4
Paul Cuffee Charter All 408 99 31.3
408 99 24.4
ES 171 99 25.3
171 99 24.1
MS 178 98 33.7
178 98 25.7
HS 59 98 41.4
59 97 21.1
Pawtucket All 4985 98 27.8
5086 99 20.2
ES 2459 99 34.2
2512 99 30.5
MS 2047 98 22.1
2076 98 10.5
HS 479 95 18.6
498 100 8.2
Portsmouth All 1340 96 52.7
1324 96 48.8
ES 168 96 47.2
168 96 50.3
MS 920 96 57.6
919 96 50.0
HS 252 98 38.7
237 100 43.5
Providence All 12730 98 17.3
13514 98 14.0
ES 5688 99 21.3
5873 99 20.4
MS 5270 97 13.9
5484 97 9.3
HS 1772 94 14.6
2157 99 8.5

26
ELA/Literacy
Mathematics
District School Level
2017 2017 2017
2017 2017 2017
# % % Meeting or
Exceeding Expectations
# % % Meeting or
Exceeding Expectations
Enrolled Tested
Enrolled Tested
RI Nurses Institute Charter
HS 68 96 9.2
78 97 2.6
RI School for the Deaf All 28 86 4.2
28 100 -
ES 8 100 -
8 100 -
MS 14 100 7.1
14 100 -
HS 6 33 -
6 100 -
Scituate All 720 98 49.6
701 97 42.0
ES 271 98 60.0
271 97 51.9
MS 349 97 42.4
349 97 36.6
HS 100 100 47.0
81 99 32.5
Segue Institute Charter MS 234 100 43.2
234 100 16.2
Sheila Skip Nowell Charter
HS 9 89 -
34 76 -
Smithfield All 1315 93 54.3
1290 95 44.6
ES 573 94 62.8
573 94 47.0
MS 556 94 46.9
555 95 45.5
HS 186 86 50.0
162 97 33.1
South Kingstown All 1699 98 55.1
1708 98 54.2
ES 435 98 66.4
440 98 62.8
MS 1024 98 53.4
1027 98 53.4
HS 240 99 42.0
241 100 41.9
The Compass School Charter
All 113 99 69.6
113 99 54.5

27
ELA/Literacy
Mathematics
District School Level
2017 2017 2017
2017 2017 2017
# % % Meeting or
Exceeding Expectations
# % % Meeting or
Exceeding Expectations
Enrolled Tested
Enrolled Tested
ES 57 100 66.7
57 100 49.1
MS 56 98 72.7
56 98 60.0
The Greene School Charter
HS 41 98 35.0
44 95 23.8
The Learning Community Charter
All 367 100 55.9
367 100 37.6
ES 185 100 57.8
185 100 44.9
MS 182 100 53.8
182 100 30.2
Tiverton All 986 98 48.8
1014 99 41.7
ES 281 98 52.9
281 98 58.3
MS 556 99 47.2
556 98 37.8
HS 149 93 47.1
177 100 27.7
Trinity Academy Charter All 119 99 28.8
118 100 5.9
MS 85 100 34.1
85 100 5.9
HS 34 97 15.2
33 100 6.1
Urban Collaborative MS 136 98 9.0
136 97 3.8
Village Green Virtual Charter
HS 49 71 40.0
33 100 21.2
Warwick All 4821 98 40.9
4727 98 30.6
ES 2707 98 46.6
2716 98 38.5
MS 1401 97 34.7
1408 97 21.3
HS 713 97 31.4
603 98 16.4
West Warwick All 1787 97 35.2
1761 98 24.4
28
ELA/Literacy
Mathematics
District School Level
2017 2017 2017
2017 2017 2017
# % % Meeting or
Exceeding Expectations
# % % Meeting or
Exceeding Expectations
Enrolled Tested
Enrolled Tested
ES 569 99 31.2
570 99 23.3
MS 976 97 36.6
976 96 23.3
HS 242 93 39.1
215 100 32.1
Westerly All 1511 98 44.1
1502 99 34.9
ES 422 99 49.0
422 99 49.8
MS 869 98 45.8
866 98 30.6
HS 220 96 27.4
214 100 22.5
Woonsocket All 3175 97 17.1
3009 98 15.3
ES 1481 98 20.1
1501 98 21.1
MS 1264 96 14.6
1274 97 9.9
HS 430 93 14.0
234 98 7.0
29
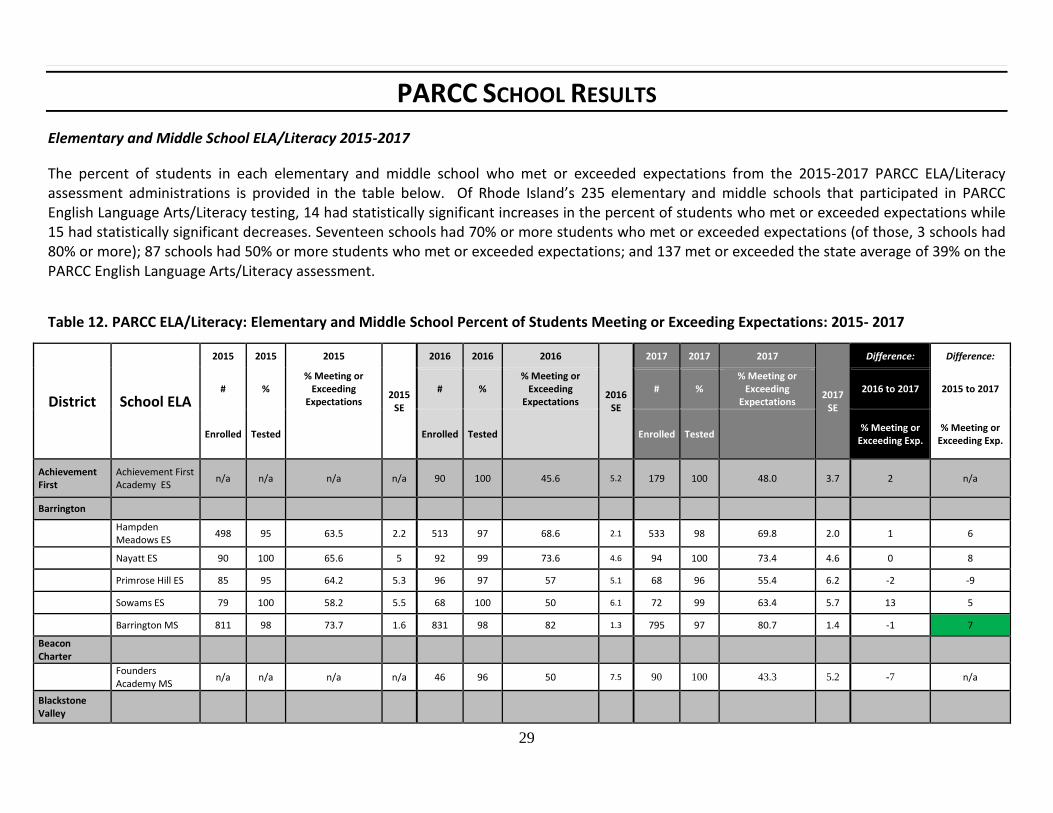
PARCC SCHOOL RESULTS
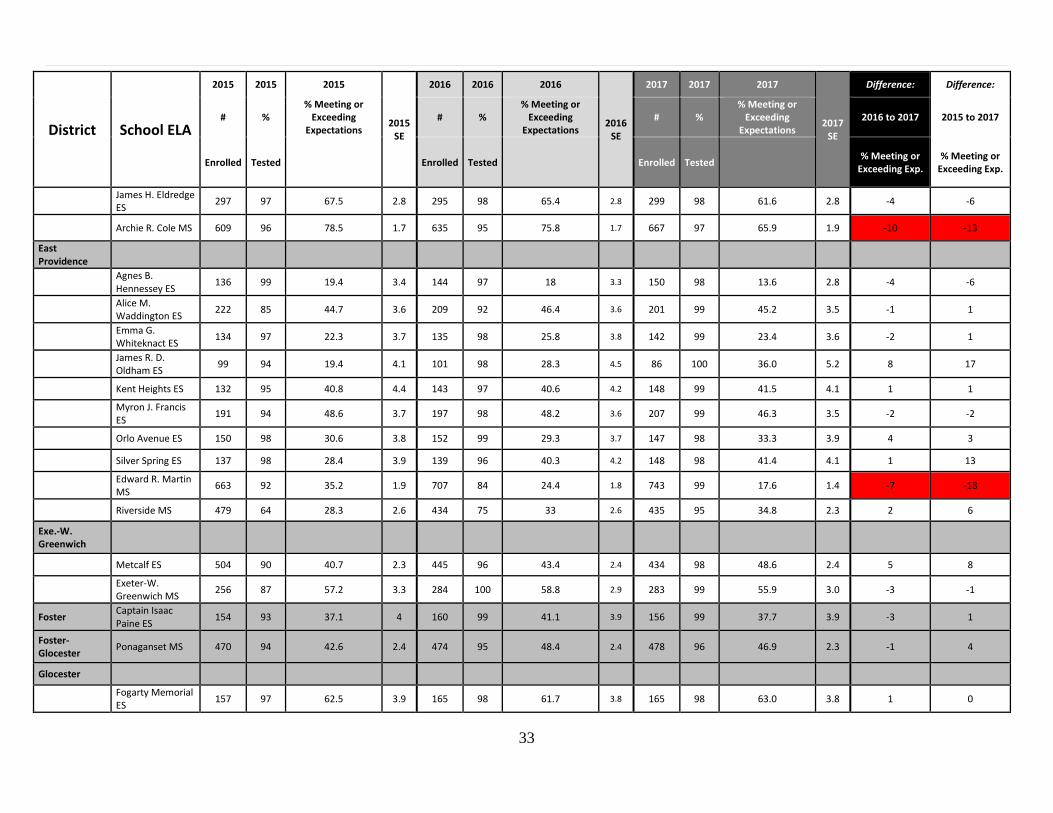
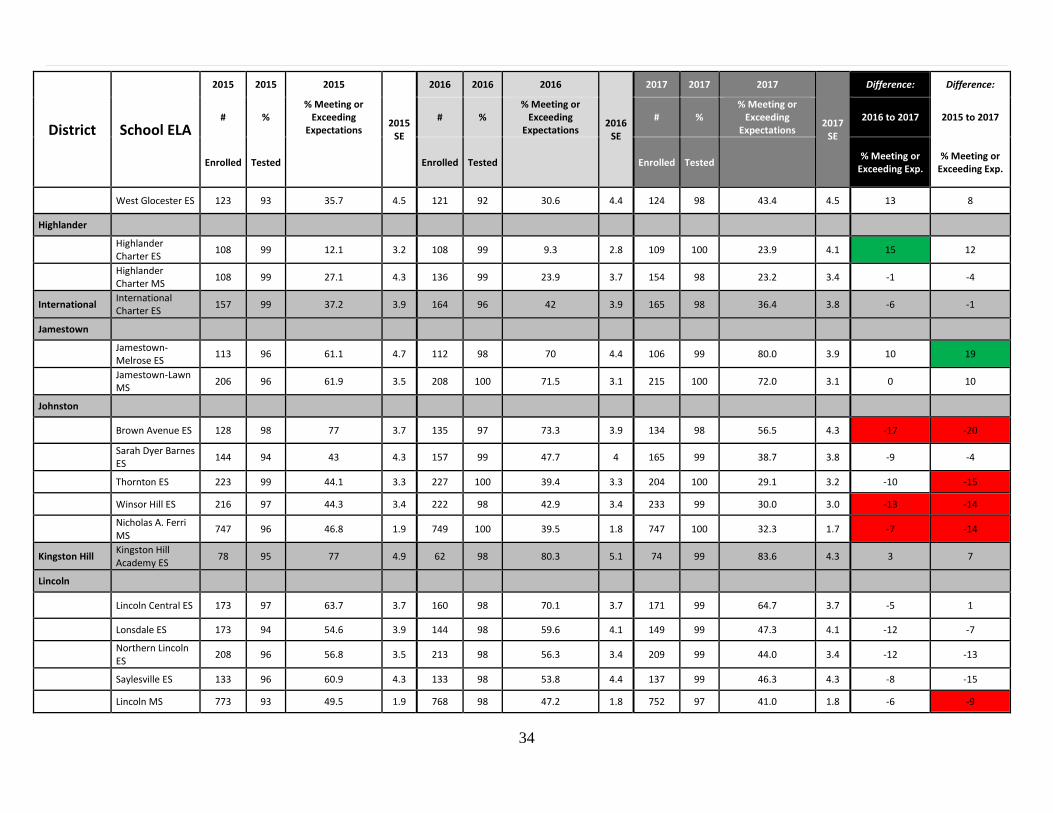
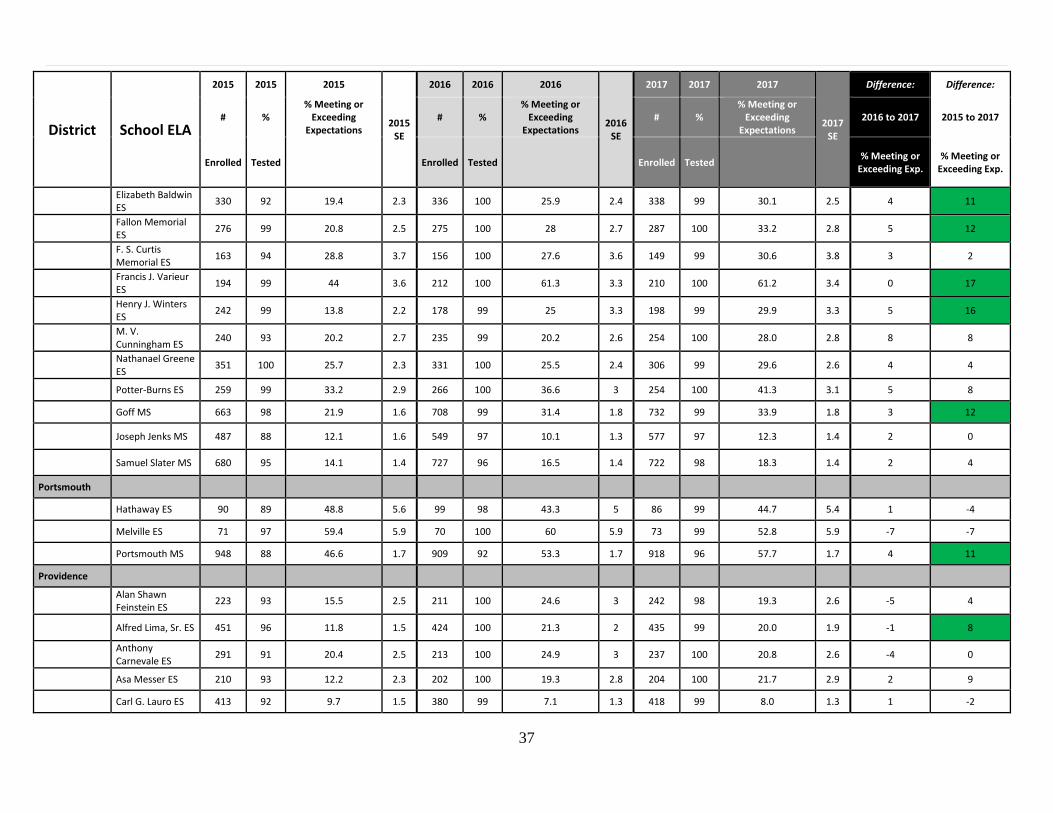
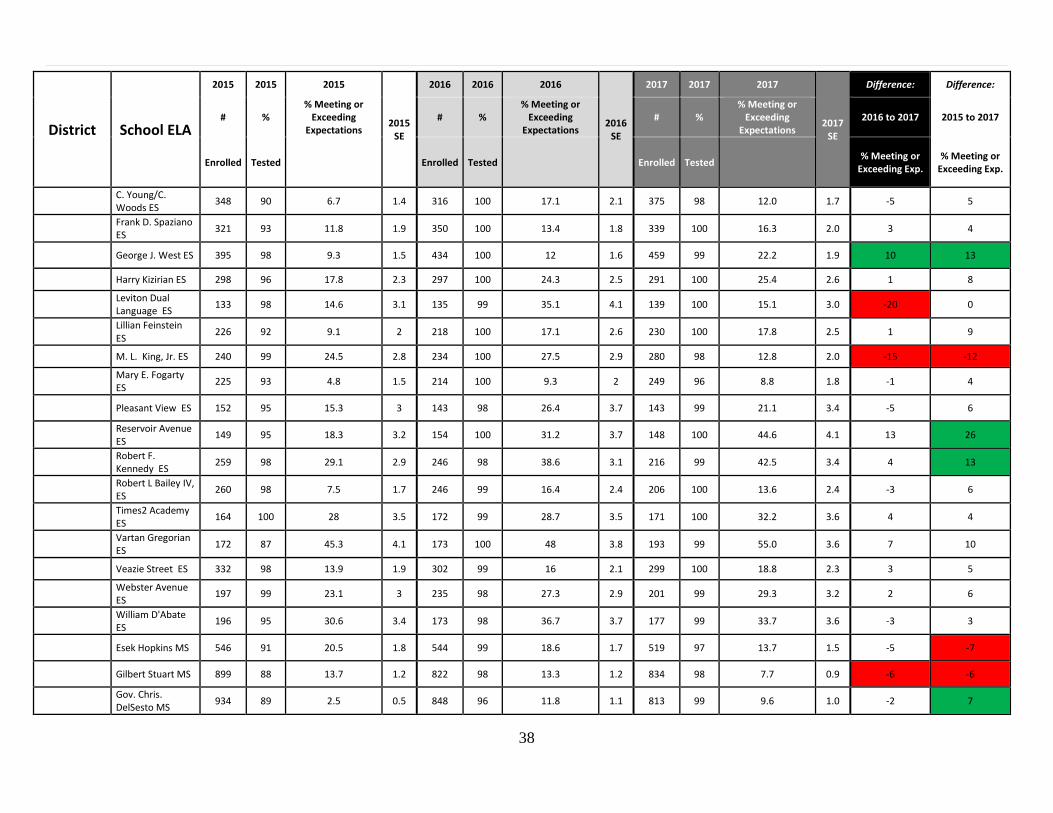
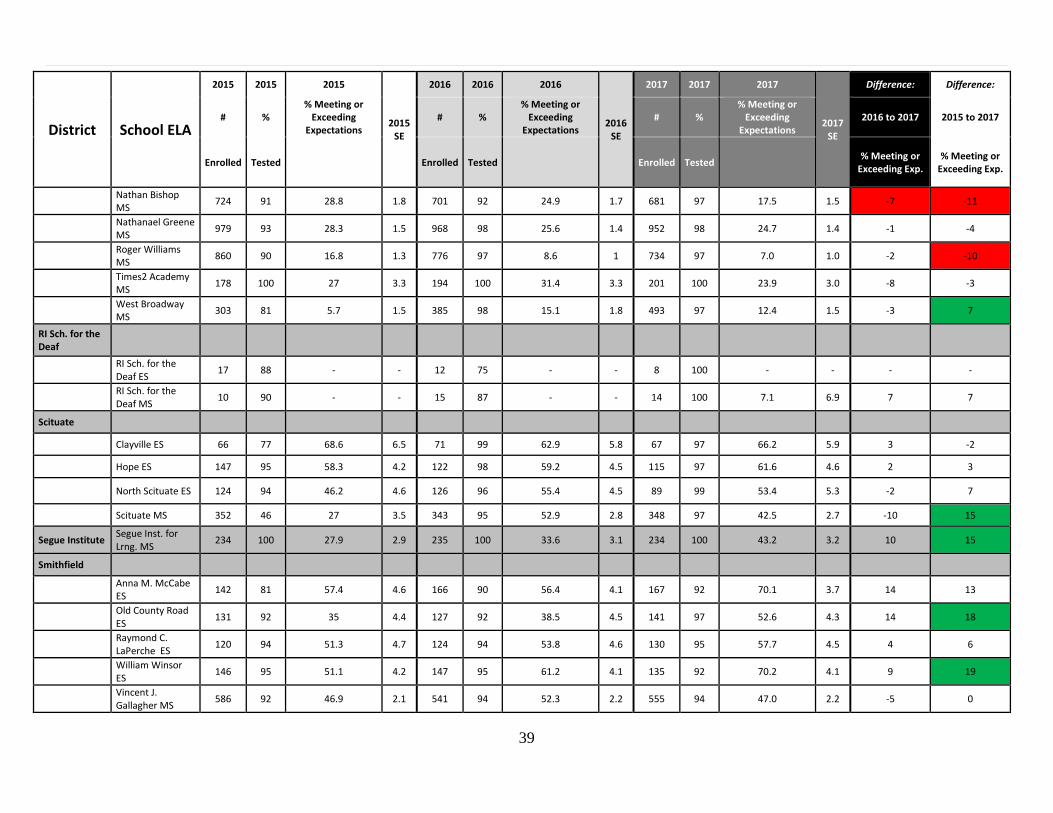
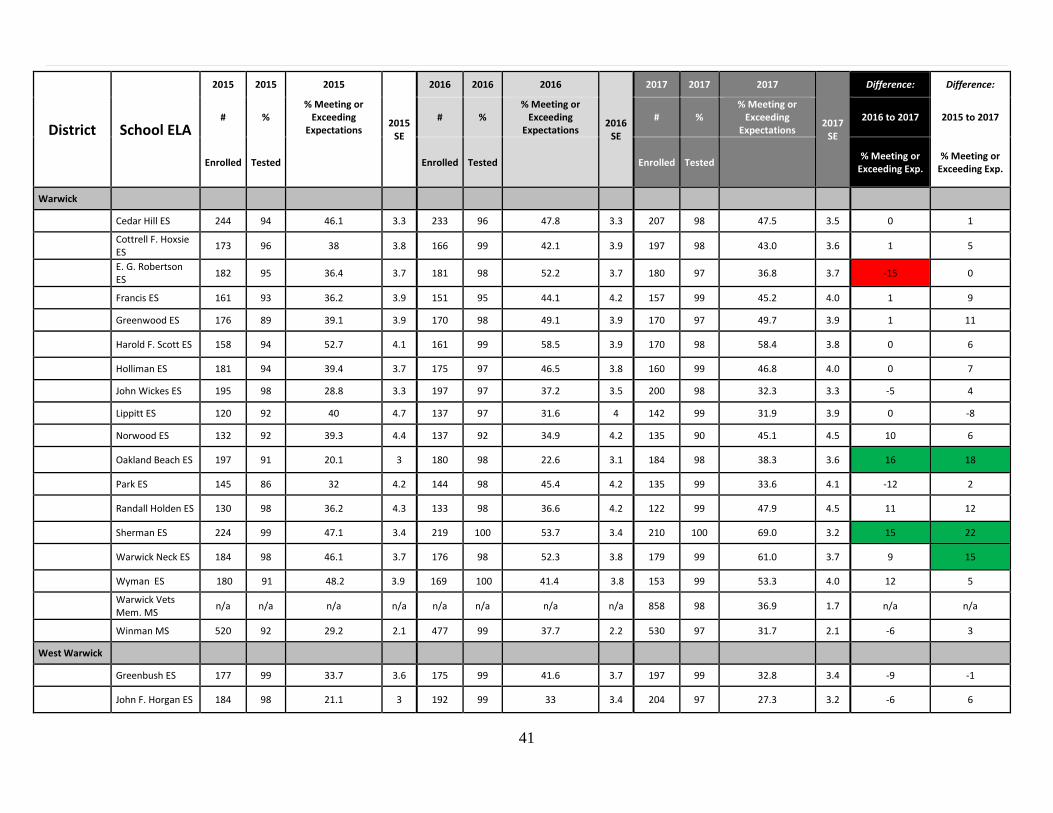
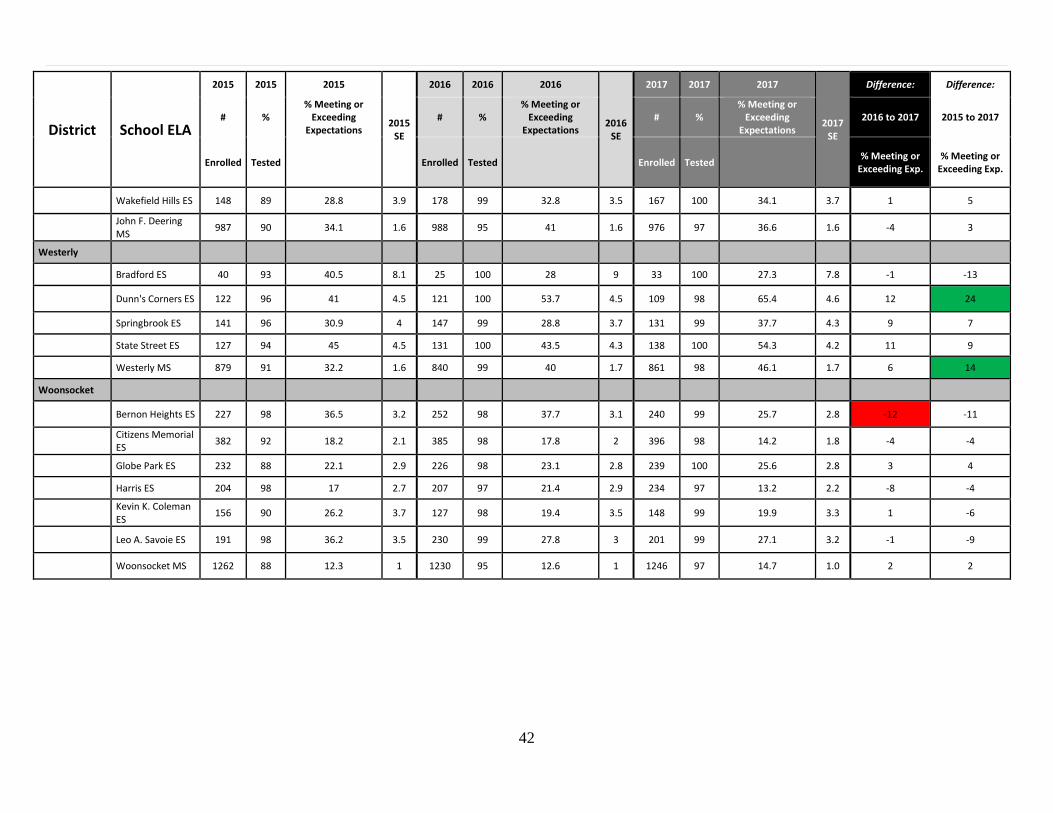
Elementary and Middle School ELA/Literacy 2015-2017
The percent of students in each elementary and middle school who met or exceeded expectations from the 2015-2017 PARCC ELA/Literacy assessment administrations is provided in the table below. Of Rhode Island’s 235 elementary and middle schools that participated in PARCC English Language Arts/Literacy testing, 14 had statistically significant increases in the percent of students who met or exceeded expectations while 15 had statistically significant decreases. Seventeen schools had 70% or more students who met or exceeded expectations (of those, 3 schools had 80% or more); 87 schools had 50% or more students who met or exceeded expectations; and 137 met or exceeded the state average of 39% on the PARCC English Language Arts/Literacy assessment.
Table 12. PARCC ELA/Literacy: Elementary and Middle School Percent of Students Meeting or Exceeding Expectations: 2015- 2017
District School ELA
2015 2015 2015
2015 SE
2016 2016 2016
2016 SE
2017 2017 2017
2017 SE
Difference: Difference:
# % % Meeting or
Exceeding Expectations
# % % Meeting or
Exceeding Expectations
# % % Meeting or
Exceeding Expectations
2016 to 2017 2015 to 2017
Enrolled Tested Enrolled Tested Enrolled Tested % Meeting or
Exceeding Exp. % Meeting or
Exceeding Exp.
Achievement First
Achievement First Academy ES
n/a n/a n/a n/a 90 100 45.6 5.2 179 100 48.0 3.7 2 n/a
Barrington
Hampden Meadows ES
498 95 63.5 2.2 513 97 68.6 2.1 533 98 69.8 2.0 1 6
Nayatt ES 90 100 65.6 5 92 99 73.6 4.6 94 100 73.4 4.6 0 8
Primrose Hill ES 85 95 64.2 5.3 96 97 57 5.1 68 96 55.4 6.2 -2 -9
Sowams ES 79 100 58.2 5.5 68 100 50 6.1 72 99 63.4 5.7 13 5
Barrington MS 811 98 73.7 1.6 831 98 82 1.3 795 97 80.7 1.4 -1 7
Beacon Charter
Founders Academy MS
n/a n/a n/a n/a 46 96 50 7.5 90 100 43.3 5.2 -7 n/a
Blackstone Valley

30
District School ELA
2015 2015 2015
2015 SE
2016 2016 2016
2016 SE
2017 2017 2017
2017 SE
Difference: Difference:
# % % Meeting or
Exceeding Expectations
# % % Meeting or
Exceeding Expectations
# % % Meeting or
Exceeding Expectations
2016 to 2017 2015 to 2017
Enrolled Tested Enrolled Tested Enrolled Tested % Meeting or
Exceeding Exp. % Meeting or
Exceeding Exp.
Blackstone Valley Prep 1 ES
166 100 55.4 3.9 164 100 50 3.9 162 100 41.4 3.9 -9 -14
Blackstone Valley Prep 2 ES
81 98 54.4 5.6 161 100 50.9 3.9 166 100 46.4 3.9 -5 -8
Blackstone Valley Prep MS
325 99 42.4 2.8 318 100 60.4 2.7 322 100 55.6 2.8 -5 13
* Blackstone Valley Prep 2 MS
n/a n/a n/a n/a n/a n/a n/a n/a 80 100 57.5 5.5 n/a n/a
Bristol-Warren
Colt Andrews ES 180 95 42.7 3.8 188 96 56.4 3.7 180 97 57.1 3.7 1 14
Guiteras ES 158 97 51 4 162 99 48.8 4 143 100 67.1 3.9 18 16
Hugh Cole ES 300 91 31.4 2.8 295 97 49.8 3 321 95 44.8 2.8 -5 13
Rockwell ES 147 97 66.4 3.9 140 100 70.7 3.8 139 99 76.8 3.6 6 10
Kickemuit MS 760 93 43.5 1.9 741 92 45.4 1.9 744 98 50.3 1.9 5 7
Burrillville
Steere Farm ES 279 72 28.4 3.2 287 91 28.6 2.8 284 99 29.6 2.7 1 1
W. L. Callahan ES 250 80 33.5 3.3 220 99 36.4 3.3 221 98 23.6 2.9 -13 -10
Burrillville MS 620 39 33.1 3 586 94 30.5 2 548 94 40.6 2.2 10 8
Central Falls
Ella Risk ES 235 95 14.3 2.3 197 99 17.4 2.7 211 99 13.5 2.4 -4 -1
Veterans Memorial ES
252 98 10.6 2 236 98 14.7 2.3 267 99 12.5 2.0 -2 2
Dr. E. F. Calcutt MS
659 92 8.9 1.2 683 99 10.4 1.2 684 98 8.7 1.1 -2 0
Chariho
Ashaway ES 64 94 63.3 6.2 74 100 51.4 5.8 85 99 66.7 5.1 15 3
Charlestown ES 122 95 63.8 4.5 115 97 62.2 4.6 107 97 74.0 4.3 12 10
Hope Valley ES 81 100 51.9 5.6 70 100 67.1 5.6 73 100 72.6 5.2 5 21
31
District School ELA
2015 2015 2015
2015 SE
2016 2016 2016
2016 SE
2017 2017 2017
2017 SE
Difference: Difference:
# % % Meeting or
Exceeding Expectations
# % % Meeting or
Exceeding Expectations
# % % Meeting or
Exceeding Expectations
2016 to 2017 2015 to 2017
Enrolled Tested Enrolled Tested Enrolled Tested % Meeting or
Exceeding Exp. % Meeting or
Exceeding Exp.
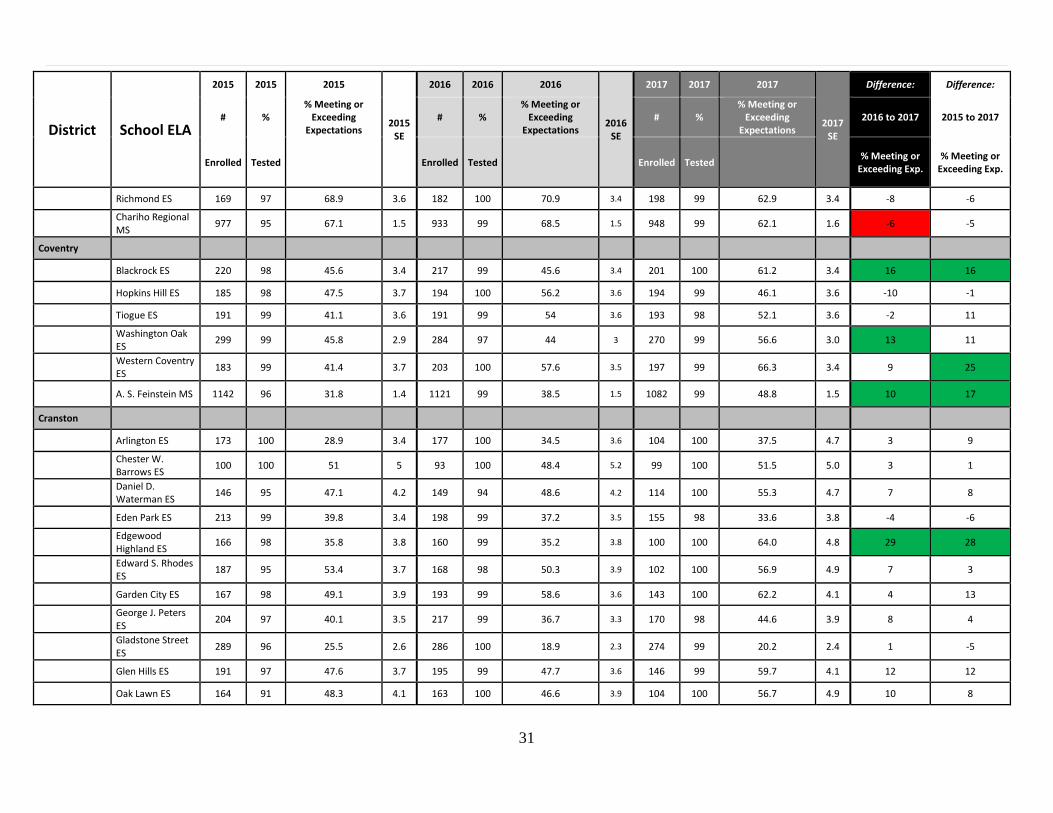
Richmond ES 169 97 68.9 3.6 182 100 70.9 3.4 198 99 62.9 3.4 -8 -6
Chariho Regional MS
977 95 67.1 1.5 933 99 68.5 1.5 948 99 62.1 1.6 -6 -5
Coventry
Blackrock ES 220 98 45.6 3.4 217 99 45.6 3.4 201 100 61.2 3.4 16 16
Hopkins Hill ES 185 98 47.5 3.7 194 100 56.2 3.6 194 99 46.1 3.6 -10 -1
Tiogue ES 191 99 41.1 3.6 191 99 54 3.6 193 98 52.1 3.6 -2 11
Washington Oak ES
299 99 45.8 2.9 284 97 44 3 270 99 56.6 3.0 13 11
Western Coventry ES
183 99 41.4 3.7 203 100 57.6 3.5 197 99 66.3 3.4 9 25
A. S. Feinstein MS 1142 96 31.8 1.4 1121 99 38.5 1.5 1082 99 48.8 1.5 10 17
Cranston
Arlington ES 173 100 28.9 3.4 177 100 34.5 3.6 104 100 37.5 4.7 3 9
Chester W. Barrows ES
100 100 51 5 93 100 48.4 5.2 99 100 51.5 5.0 3 1
Daniel D. Waterman ES
146 95 47.1 4.2 149 94 48.6 4.2 114 100 55.3 4.7 7 8
Eden Park ES 213 99 39.8 3.4 198 99 37.2 3.5 155 98 33.6 3.8 -4 -6
Edgewood Highland ES
166 98 35.8 3.8 160 99 35.2 3.8 100 100 64.0 4.8 29 28
Edward S. Rhodes ES
187 95 53.4 3.7 168 98 50.3 3.9 102 100 56.9 4.9 7 3
Garden City ES 167 98 49.1 3.9 193 99 58.6 3.6 143 100 62.2 4.1 4 13
George J. Peters ES
204 97 40.1 3.5 217 99 36.7 3.3 170 98 44.6 3.9 8 4
Gladstone Street ES
289 96 25.5 2.6 286 100 18.9 2.3 274 99 20.2 2.4 1 -5
Glen Hills ES 191 97 47.6 3.7 195 99 47.7 3.6 146 99 59.7 4.1 12 12
Oak Lawn ES 164 91 48.3 4.1 163 100 46.6 3.9 104 100 56.7 4.9 10 8
32
District School ELA
2015 2015 2015
2015 SE
2016 2016 2016
2016 SE
2017 2017 2017
2017 SE
Difference: Difference:
# % % Meeting or
Exceeding Expectations
# % % Meeting or
Exceeding Expectations
# % % Meeting or
Exceeding Expectations
2016 to 2017 2015 to 2017
Enrolled Tested Enrolled Tested Enrolled Tested % Meeting or
Exceeding Exp. % Meeting or
Exceeding Exp.
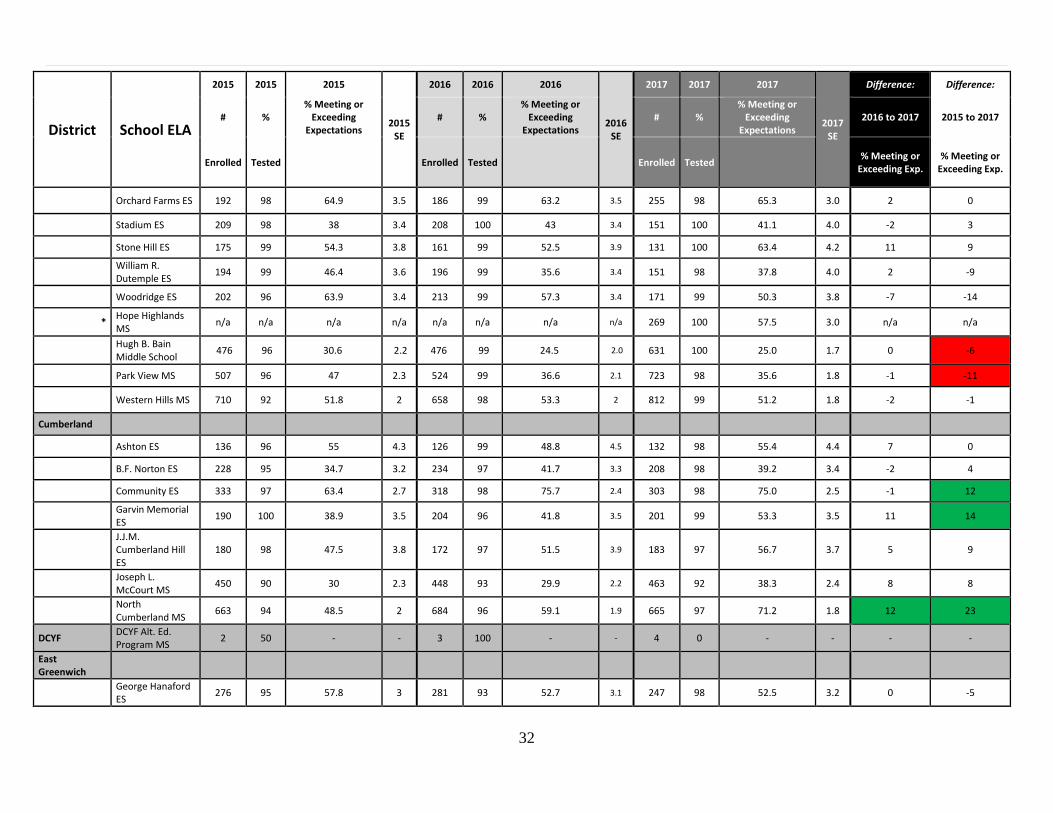
Orchard Farms ES 192 98 64.9 3.5 186 99 63.2 3.5 255 98 65.3 3.0 2 0
Stadium ES 209 98 38 3.4 208 100 43 3.4 151 100 41.1 4.0 -2 3
Stone Hill ES 175 99 54.3 3.8 161 99 52.5 3.9 131 100 63.4 4.2 11 9
William R. Dutemple ES
194 99 46.4 3.6 196 99 35.6 3.4 151 98 37.8 4.0 2 -9
Woodridge ES 202 96 63.9 3.4 213 99 57.3 3.4 171 99 50.3 3.8 -7 -14
* Hope Highlands MS
n/a n/a n/a n/a n/a n/a n/a n/a 269 100 57.5 3.0 n/a n/a
Hugh B. Bain Middle School
476 96 30.6 2.2 476 99 24.5 2.0 631 100 25.0 1.7 0 -6
Park View MS 507 96 47 2.3 524 99 36.6 2.1 723 98 35.6 1.8 -1 -11
Western Hills MS 710 92 51.8 2 658 98 53.3 2 812 99 51.2 1.8 -2 -1
Cumberland
Ashton ES 136 96 55 4.3 126 99 48.8 4.5 132 98 55.4 4.4 7 0
B.F. Norton ES 228 95 34.7 3.2 234 97 41.7 3.3 208 98 39.2 3.4 -2 4
Community ES 333 97 63.4 2.7 318 98 75.7 2.4 303 98 75.0 2.5 -1 12
Garvin Memorial ES
190 100 38.9 3.5 204 96 41.8 3.5 201 99 53.3 3.5 11 14
J.J.M. Cumberland Hill ES
180 98 47.5 3.8 172 97 51.5 3.9 183 97 56.7 3.7 5 9
Joseph L. McCourt MS
450 90 30 2.3 448 93 29.9 2.2 463 92 38.3 2.4 8 8
North Cumberland MS
663 94 48.5 2 684 96 59.1 1.9 665 97 71.2 1.8 12 23
DCYF DCYF Alt. Ed. Program MS
2 50 - - 3 100 - - 4 0 - - - -
East Greenwich
George Hanaford ES
276 95 57.8 3 281 93 52.7 3.1 247 98 52.5 3.2 0 -5
33
District School ELA
2015 2015 2015
2015 SE
2016 2016 2016
2016 SE
2017 2017 2017
2017 SE
Difference: Difference:
# % % Meeting or
Exceeding Expectations
# % % Meeting or
Exceeding Expectations
# % % Meeting or
Exceeding Expectations
2016 to 2017 2015 to 2017
Enrolled Tested Enrolled Tested Enrolled Tested % Meeting or
Exceeding Exp. % Meeting or
Exceeding Exp.
James H. Eldredge ES
297 97 67.5 2.8 295 98 65.4 2.8 299 98 61.6 2.8 -4 -6
Archie R. Cole MS 609 96 78.5 1.7 635 95 75.8 1.7 667 97 65.9 1.9 -10 -13
East Providence
Agnes B. Hennessey ES
136 99 19.4 3.4 144 97 18 3.3 150 98 13.6 2.8 -4 -6
Alice M. Waddington ES
222 85 44.7 3.6 209 92 46.4 3.6 201 99 45.2 3.5 -1 1
Emma G. Whiteknact ES
134 97 22.3 3.7 135 98 25.8 3.8 142 99 23.4 3.6 -2 1
James R. D. Oldham ES
99 94 19.4 4.1 101 98 28.3 4.5 86 100 36.0 5.2 8 17
Kent Heights ES 132 95 40.8 4.4 143 97 40.6 4.2 148 99 41.5 4.1 1 1
Myron J. Francis ES
191 94 48.6 3.7 197 98 48.2 3.6 207 99 46.3 3.5 -2 -2
Orlo Avenue ES 150 98 30.6 3.8 152 99 29.3 3.7 147 98 33.3 3.9 4 3
Silver Spring ES 137 98 28.4 3.9 139 96 40.3 4.2 148 98 41.4 4.1 1 13
Edward R. Martin MS
663 92 35.2 1.9 707 84 24.4 1.8 743 99 17.6 1.4 -7 -18
Riverside MS 479 64 28.3 2.6 434 75 33 2.6 435 95 34.8 2.3 2 6
Exe.-W. Greenwich
Metcalf ES 504 90 40.7 2.3 445 96 43.4 2.4 434 98 48.6 2.4 5 8
Exeter-W. Greenwich MS
256 87 57.2 3.3 284 100 58.8 2.9 283 99 55.9 3.0 -3 -1
Foster Captain Isaac Paine ES
154 93 37.1 4 160 99 41.1 3.9 156 99 37.7 3.9 -3 1
Foster-Glocester
Ponaganset MS 470 94 42.6 2.4 474 95 48.4 2.4 478 96 46.9 2.3 -1 4
Glocester
Fogarty Memorial ES
157 97 62.5 3.9 165 98 61.7 3.8 165 98 63.0 3.8 1 0
34
District School ELA
2015 2015 2015
2015 SE
2016 2016 2016
2016 SE
2017 2017 2017
2017 SE
Difference: Difference:
# % % Meeting or
Exceeding Expectations
# % % Meeting or
Exceeding Expectations
# % % Meeting or
Exceeding Expectations
2016 to 2017 2015 to 2017
Enrolled Tested Enrolled Tested Enrolled Tested % Meeting or
Exceeding Exp. % Meeting or
Exceeding Exp.
West Glocester ES 123 93 35.7 4.5 121 92 30.6 4.4 124 98 43.4 4.5 13 8
Highlander
Highlander Charter ES
108 99 12.1 3.2 108 99 9.3 2.8 109 100 23.9 4.1 15 12
Highlander Charter MS
108 99 27.1 4.3 136 99 23.9 3.7 154 98 23.2 3.4 -1 -4
International International Charter ES
157 99 37.2 3.9 164 96 42 3.9 165 98 36.4 3.8 -6 -1
Jamestown
Jamestown-Melrose ES
113 96 61.1 4.7 112 98 70 4.4 106 99 80.0 3.9 10 19
Jamestown-Lawn MS
206 96 61.9 3.5 208 100 71.5 3.1 215 100 72.0 3.1 0 10
Johnston
Brown Avenue ES 128 98 77 3.7 135 97 73.3 3.9 134 98 56.5 4.3 -17 -20
Sarah Dyer Barnes ES
144 94 43 4.3 157 99 47.7 4 165 99 38.7 3.8 -9 -4
Thornton ES 223 99 44.1 3.3 227 100 39.4 3.3 204 100 29.1 3.2 -10 -15
Winsor Hill ES 216 97 44.3 3.4 222 98 42.9 3.4 233 99 30.0 3.0 -13 -14
Nicholas A. Ferri MS
747 96 46.8 1.9 749 100 39.5 1.8 747 100 32.3 1.7 -7 -14
Kingston Hill Kingston Hill Academy ES
78 95 77 4.9 62 98 80.3 5.1 74 99 83.6 4.3 3 7
Lincoln
Lincoln Central ES 173 97 63.7 3.7 160 98 70.1 3.7 171 99 64.7 3.7 -5 1
Lonsdale ES 173 94 54.6 3.9 144 98 59.6 4.1 149 99 47.3 4.1 -12 -7
Northern Lincoln ES
208 96 56.8 3.5 213 98 56.3 3.4 209 99 44.0 3.4 -12 -13
Saylesville ES 133 96 60.9 4.3 133 98 53.8 4.4 137 99 46.3 4.3 -8 -15
Lincoln MS 773 93 49.5 1.9 768 98 47.2 1.8 752 97 41.0 1.8 -6 -9

35
District School ELA
2015 2015 2015
2015 SE
2016 2016 2016
2016 SE
2017 2017 2017
2017 SE
Difference: Difference:
# % % Meeting or
Exceeding Expectations
# % % Meeting or
Exceeding Expectations
# % % Meeting or
Exceeding Expectations
2016 to 2017 2015 to 2017
Enrolled Tested Enrolled Tested Enrolled Tested % Meeting or
Exceeding Exp. % Meeting or
Exceeding Exp.
Little Compton
Wilbur & McMahon ES
81 93 57.3 5.7 76 96 52.1 5.8 78 92 48.6 5.9 -3 -9
Wilbur & McMahon MS
95 82 57.7 5.6 102 82 53.6 5.4 91 90 68.3 5.1 15 11
Middletown
Aquidneck ES 115 92 53.8 4.8 87 98 43.5 5.4 75 97 53.4 5.8 10 0
Forest Avenue ES 86 95 36.6 5.3 79 97 39 5.6 68 99 34.3 5.8 -5 -2
Gaudet Learning Acad. ES
169 96 41.7 3.9 176 99 47.4 3.8 169 99 44.0 3.8 -3 2
Gaudet MS 705 92 41.8 1.9 644 98 40.5 2 640 98 48.8 2.0 8 7
Narragansett
Narragansett ES 201 98 60.4 3.5 200 97 47.9 3.6 171 98 62.9 3.7 15 2
Narragansett Pier MS
399 94 53.9 2.6 394 99 53.7 2.5 425 98 59.7 2.4 6 6
New Shoreham Block Island ES 48 88 52.4 7.7 43 95 56.1 7.8 35 80 67.9 8.8 12 15
Newport
Claiborne Pell ES 296 93 37.5 2.9 295 99 38.6 2.8 309 97 38.2 2.8 0 1
Frank E. Thompson MS
586 94 33 2 573 98 31.8 2 591 97 35.0 2.0 3 2
North Kingstown
Fishing Cove ES 123 93 60.9 4.6 120 97 72.4 4.1 109 99 63.0 4.6 -9 2
Forest Park ES 156 89 57.6 4.2 146 99 62.1 4 137 99 59.6 4.2 -3 2
Hamilton ES 218 98 71.4 3.1 194 98 65.4 3.4 198 99 74.1 3.1 9 3
Stony Lane ES 229 100 57.9 3.3 231 100 47.2 3.3 224 100 54.9 3.3 8 -3
S. M. H. Quidnessett ES
147 93 46.7 4.3 146 97 37.3 4.1 137 99 42.6 4.2 5 -4
Davisville MS 525 82 55.9 2.4 527 95 61.2 2.2 528 99 56.0 2.2 -5 0

36
District School ELA
2015 2015 2015
2015 SE
2016 2016 2016
2016 SE
2017 2017 2017
2017 SE
Difference: Difference:
# % % Meeting or
Exceeding Expectations
# % % Meeting or
Exceeding Expectations
# % % Meeting or
Exceeding Expectations
2016 to 2017 2015 to 2017
Enrolled Tested Enrolled Tested Enrolled Tested % Meeting or
Exceeding Exp. % Meeting or
Exceeding Exp.
Wickford MS 435 89 67.9 2.4 425 100 77.1 2 405 99 78.0 2.1 1 10
North Providence
Centredale ES 128 98 32.8 4.2 127 94 42.5 4.5 124 98 37.2 4.4 -5 4
Dr. Joseph A. Whelan ES
134 99 28.8 3.9 125 100 36.8 4.3 139 99 44.2 4.2 7 15
Greystone ES 124 96 32.8 4.3 125 99 44.4 4.5 127 98 47.2 4.5 3 14
James L. McGuire ES
146 95 31.2 3.9 140 98 33.6 4 130 98 40.2 4.3 7 9
Marieville ES 125 90 16.1 3.5 116 99 38.3 4.5 120 99 46.2 4.6 8 30
Stephen Olney ES 155 91 34.8 4 152 97 34.5 3.9 152 95 36.1 4.0 2 1
Birchwood MS 410 90 31.6 2.4 420 100 49.3 2.4 430 99 37.4 2.3 -12 6
Dr. Edward A. Ricci MS
425 91 27.6 2.3 435 99 36.6 2.3 420 99 44.8 2.4 8 17
North Smithfield
Dr. H. L.. H. Memorial ES
341 92 43.1 2.8 334 98 53.7 2.8 344 99 62.2 2.6 8 19
North Smithfield ES
44 93 31.7 7.3 46 100 52.2 7.4 52 100 40.4 6.8 -12 9
North Smithfield MS
441 89 49.9 2.5 454 99 54.5 2.3 411 99 57.5 2.5 3 8
Paul Cuffee
Paul Cuffee Charter ES
171 98 28.6 3.5 169 100 30.8 3.6 171 99 25.3 3.3 -5 -3
Paul Cuffee Charter MS
180 99 27.9 3.4 180 99 38.2 3.6 178 98 33.7 3.6 -4 6
Pawtucket
Agnes E. Little ES 220 98 24.1 2.9 235 99 27.9 2.9 214 100 33.8 3.2 6 10
Curvin-McCabe ES 219 93 19.1 2.8 238 99 21.7 2.7 221 99 31.1 3.1 9 12
37
District School ELA
2015 2015 2015
2015 SE
2016 2016 2016
2016 SE
2017 2017 2017
2017 SE
Difference: Difference:
# % % Meeting or
Exceeding Expectations
# % % Meeting or
Exceeding Expectations
# % % Meeting or
Exceeding Expectations
2016 to 2017 2015 to 2017
Enrolled Tested Enrolled Tested Enrolled Tested % Meeting or
Exceeding Exp. % Meeting or
Exceeding Exp.
Elizabeth Baldwin ES
330 92 19.4 2.3 336 100 25.9 2.4 338 99 30.1 2.5 4 11
Fallon Memorial ES
276 99 20.8 2.5 275 100 28 2.7 287 100 33.2 2.8 5 12
F. S. Curtis Memorial ES
163 94 28.8 3.7 156 100 27.6 3.6 149 99 30.6 3.8 3 2
Francis J. Varieur ES
194 99 44 3.6 212 100 61.3 3.3 210 100 61.2 3.4 0 17
Henry J. Winters ES
242 99 13.8 2.2 178 99 25 3.3 198 99 29.9 3.3 5 16
M. V. Cunningham ES
240 93 20.2 2.7 235 99 20.2 2.6 254 100 28.0 2.8 8 8
Nathanael Greene ES
351 100 25.7 2.3 331 100 25.5 2.4 306 99 29.6 2.6 4 4
Potter-Burns ES 259 99 33.2 2.9 266 100 36.6 3 254 100 41.3 3.1 5 8
Goff MS 663 98 21.9 1.6 708 99 31.4 1.8 732 99 33.9 1.8 3 12
Joseph Jenks MS 487 88 12.1 1.6 549 97 10.1 1.3 577 97 12.3 1.4 2 0
Samuel Slater MS 680 95 14.1 1.4 727 96 16.5 1.4 722 98 18.3 1.4 2 4
Portsmouth
Hathaway ES 90 89 48.8 5.6 99 98 43.3 5 86 99 44.7 5.4 1 -4
Melville ES 71 97 59.4 5.9 70 100 60 5.9 73 99 52.8 5.9 -7 -7
Portsmouth MS 948 88 46.6 1.7 909 92 53.3 1.7 918 96 57.7 1.7 4 11
Providence
Alan Shawn Feinstein ES
223 93 15.5 2.5 211 100 24.6 3 242 98 19.3 2.6 -5 4
Alfred Lima, Sr. ES 451 96 11.8 1.5 424 100 21.3 2 435 99 20.0 1.9 -1 8
Anthony Carnevale ES
291 91 20.4 2.5 213 100 24.9 3 237 100 20.8 2.6 -4 0
Asa Messer ES 210 93 12.2 2.3 202 100 19.3 2.8 204 100 21.7 2.9 2 9
Carl G. Lauro ES 413 92 9.7 1.5 380 99 7.1 1.3 418 99 8.0 1.3 1 -2
38
District School ELA
2015 2015 2015
2015 SE
2016 2016 2016
2016 SE
2017 2017 2017
2017 SE
Difference: Difference:
# % % Meeting or
Exceeding Expectations
# % % Meeting or
Exceeding Expectations
# % % Meeting or
Exceeding Expectations
2016 to 2017 2015 to 2017
Enrolled Tested Enrolled Tested Enrolled Tested % Meeting or
Exceeding Exp. % Meeting or
Exceeding Exp.
C. Young/C. Woods ES
348 90 6.7 1.4 316 100 17.1 2.1 375 98 12.0 1.7 -5 5
Frank D. Spaziano ES
321 93 11.8 1.9 350 100 13.4 1.8 339 100 16.3 2.0 3 4
George J. West ES 395 98 9.3 1.5 434 100 12 1.6 459 99 22.2 1.9 10 13
Harry Kizirian ES 298 96 17.8 2.3 297 100 24.3 2.5 291 100 25.4 2.6 1 8
Leviton Dual Language ES
133 98 14.6 3.1 135 99 35.1 4.1 139 100 15.1 3.0 -20 0
Lillian Feinstein ES
226 92 9.1 2 218 100 17.1 2.6 230 100 17.8 2.5 1 9
M. L. King, Jr. ES 240 99 24.5 2.8 234 100 27.5 2.9 280 98 12.8 2.0 -15 -12
Mary E. Fogarty ES
225 93 4.8 1.5 214 100 9.3 2 249 96 8.8 1.8 -1 4
Pleasant View ES 152 95 15.3 3 143 98 26.4 3.7 143 99 21.1 3.4 -5 6
Reservoir Avenue ES
149 95 18.3 3.2 154 100 31.2 3.7 148 100 44.6 4.1 13 26
Robert F. Kennedy ES
259 98 29.1 2.9 246 98 38.6 3.1 216 99 42.5 3.4 4 13
Robert L Bailey IV, ES
260 98 7.5 1.7 246 99 16.4 2.4 206 100 13.6 2.4 -3 6
Times2 Academy ES
164 100 28 3.5 172 99 28.7 3.5 171 100 32.2 3.6 4 4
Vartan Gregorian ES
172 87 45.3 4.1 173 100 48 3.8 193 99 55.0 3.6 7 10
Veazie Street ES 332 98 13.9 1.9 302 99 16 2.1 299 100 18.8 2.3 3 5
Webster Avenue ES
197 99 23.1 3 235 98 27.3 2.9 201 99 29.3 3.2 2 6
William D'Abate ES
196 95 30.6 3.4 173 98 36.7 3.7 177 99 33.7 3.6 -3 3
Esek Hopkins MS 546 91 20.5 1.8 544 99 18.6 1.7 519 97 13.7 1.5 -5 -7
Gilbert Stuart MS 899 88 13.7 1.2 822 98 13.3 1.2 834 98 7.7 0.9 -6 -6
Gov. Chris. DelSesto MS
934 89 2.5 0.5 848 96 11.8 1.1 813 99 9.6 1.0 -2 7
39
District School ELA
2015 2015 2015
2015 SE
2016 2016 2016
2016 SE
2017 2017 2017
2017 SE
Difference: Difference:
# % % Meeting or
Exceeding Expectations
# % % Meeting or
Exceeding Expectations
# % % Meeting or
Exceeding Expectations
2016 to 2017 2015 to 2017
Enrolled Tested Enrolled Tested Enrolled Tested % Meeting or
Exceeding Exp. % Meeting or
Exceeding Exp.
Nathan Bishop MS
724 91 28.8 1.8 701 92 24.9 1.7 681 97 17.5 1.5 -7 -11
Nathanael Greene MS
979 93 28.3 1.5 968 98 25.6 1.4 952 98 24.7 1.4 -1 -4
Roger Williams MS
860 90 16.8 1.3 776 97 8.6 1 734 97 7.0 1.0 -2 -10
Times2 Academy MS
178 100 27 3.3 194 100 31.4 3.3 201 100 23.9 3.0 -8 -3
West Broadway MS
303 81 5.7 1.5 385 98 15.1 1.8 493 97 12.4 1.5 -3 7
RI Sch. for the Deaf
RI Sch. for the Deaf ES
17 88 - - 12 75 - - 8 100 - - - -
RI Sch. for the Deaf MS
10 90 - - 15 87 - - 14 100 7.1 6.9 7 7
Scituate
Clayville ES 66 77 68.6 6.5 71 99 62.9 5.8 67 97 66.2 5.9 3 -2
Hope ES 147 95 58.3 4.2 122 98 59.2 4.5 115 97 61.6 4.6 2 3
North Scituate ES 124 94 46.2 4.6 126 96 55.4 4.5 89 99 53.4 5.3 -2 7
Scituate MS 352 46 27 3.5 343 95 52.9 2.8 348 97 42.5 2.7 -10 15
Segue Institute Segue Inst. for Lrng. MS
234 100 27.9 2.9 235 100 33.6 3.1 234 100 43.2 3.2 10 15
Smithfield
Anna M. McCabe ES
142 81 57.4 4.6 166 90 56.4 4.1 167 92 70.1 3.7 14 13
Old County Road ES
131 92 35 4.4 127 92 38.5 4.5 141 97 52.6 4.3 14 18
Raymond C. LaPerche ES
120 94 51.3 4.7 124 94 53.8 4.6 130 95 57.7 4.5 4 6
William Winsor ES
146 95 51.1 4.2 147 95 61.2 4.1 135 92 70.2 4.1 9 19
Vincent J. Gallagher MS
586 92 46.9 2.1 541 94 52.3 2.2 555 94 47.0 2.2 -5 0

40
District School ELA
2015 2015 2015
2015 SE
2016 2016 2016
2016 SE
2017 2017 2017
2017 SE
Difference: Difference:
# % % Meeting or
Exceeding Expectations
# % % Meeting or
Exceeding Expectations
# % % Meeting or
Exceeding Expectations
2016 to 2017 2015 to 2017
Enrolled Tested Enrolled Tested Enrolled Tested % Meeting or
Exceeding Exp. % Meeting or
Exceeding Exp.
South Kingstown
Matunuck ES 90 96 77.9 4.5 88 99 70.1 4.9 96 96 66.3 4.9 -4 -12
Peace Dale ES 159 97 81.8 3.1 150 100 78.7 3.3 146 99 72.4 3.7 -6 -9
Wakefield ES 106 96 80.4 3.9 103 97 71 4.5 99 100 71.7 4.5 1 -9
West Kingston ES 124 97 73.3 4 121 100 52.9 4.5 94 96 51.1 5.3 -2 -22
Broad Rock MS 520 95 58.5 2.2 516 98 60.7 2.2 507 98 58.1 2.2 -3 0
Curtis Corner MS 518 95 56.1 2.2 505 98 54.9 2.2 517 97 48.7 2.2 -6 -7
The Compass School
The Compass School ES
59 98 79.3 5.3 55 100 78.2 5.6 57 100 66.7 6.2 -12 -13
The Compass School MS
54 91 71.4 6.5 56 96 72.2 6.1 56 98 72.7 6.0 1 1
The Learning Comm.
The Learning Comm. ES
185 100 30.3 3.4 190 100 53.2 3.6 185 100 57.8 3.6 5 28
The Learning Comm. MS
180 100 25.6 3.3 178 100 42.7 3.7 182 100 53.8 3.7 11 28
Tiverton
Fort Barton ES 92 88 79 4.5 97 100 76.3 4.3 98 100 67.3 4.7 -9 -12
Pocasset ES 91 75 50 6.1 93 100 43 5.1 82 99 38.3 5.4 -5 -12
Walter E. Ranger ES
101 83 56 5.4 97 97 72.3 4.6 98 98 50.0 5.1 -22 -6
Tiverton MS 573 79 50.9 2.4 547 99 48.8 2.2 554 99 47.2 2.1 -2 -4
Trinity Academy
Trinity Academy MS
75 99 6.8 2.9 83 100 12 3.6 85 100 34.1 5.1 22 27
Urban Collaborative
Urban Collaborative MS
138 96 6.8 2.2 135 98 12.9 2.9 136 98 9.0 2.5 -4 2
41
District School ELA
2015 2015 2015
2015 SE
2016 2016 2016
2016 SE
2017 2017 2017
2017 SE
Difference: Difference:
# % % Meeting or
Exceeding Expectations
# % % Meeting or
Exceeding Expectations
# % % Meeting or
Exceeding Expectations
2016 to 2017 2015 to 2017
Enrolled Tested Enrolled Tested Enrolled Tested % Meeting or
Exceeding Exp. % Meeting or
Exceeding Exp.
Warwick
Cedar Hill ES 244 94 46.1 3.3 233 96 47.8 3.3 207 98 47.5 3.5 0 1
Cottrell F. Hoxsie ES
173 96 38 3.8 166 99 42.1 3.9 197 98 43.0 3.6 1 5
E. G. Robertson ES
182 95 36.4 3.7 181 98 52.2 3.7 180 97 36.8 3.7 -15 0
Francis ES 161 93 36.2 3.9 151 95 44.1 4.2 157 99 45.2 4.0 1 9
Greenwood ES 176 89 39.1 3.9 170 98 49.1 3.9 170 97 49.7 3.9 1 11
Harold F. Scott ES 158 94 52.7 4.1 161 99 58.5 3.9 170 98 58.4 3.8 0 6
Holliman ES 181 94 39.4 3.7 175 97 46.5 3.8 160 99 46.8 4.0 0 7
John Wickes ES 195 98 28.8 3.3 197 97 37.2 3.5 200 98 32.3 3.3 -5 4
Lippitt ES 120 92 40 4.7 137 97 31.6 4 142 99 31.9 3.9 0 -8
Norwood ES 132 92 39.3 4.4 137 92 34.9 4.2 135 90 45.1 4.5 10 6
Oakland Beach ES 197 91 20.1 3 180 98 22.6 3.1 184 98 38.3 3.6 16 18
Park ES 145 86 32 4.2 144 98 45.4 4.2 135 99 33.6 4.1 -12 2
Randall Holden ES 130 98 36.2 4.3 133 98 36.6 4.2 122 99 47.9 4.5 11 12
Sherman ES 224 99 47.1 3.4 219 100 53.7 3.4 210 100 69.0 3.2 15 22
Warwick Neck ES 184 98 46.1 3.7 176 98 52.3 3.8 179 99 61.0 3.7 9 15
Wyman ES 180 91 48.2 3.9 169 100 41.4 3.8 153 99 53.3 4.0 12 5
Warwick Vets Mem. MS
n/a n/a n/a n/a n/a n/a n/a n/a 858 98 36.9 1.7 n/a n/a
Winman MS 520 92 29.2 2.1 477 99 37.7 2.2 530 97 31.7 2.1 -6 3
West Warwick
Greenbush ES 177 99 33.7 3.6 175 99 41.6 3.7 197 99 32.8 3.4 -9 -1
John F. Horgan ES 184 98 21.1 3 192 99 33 3.4 204 97 27.3 3.2 -6 6
42
District School ELA
2015 2015 2015
2015 SE
2016 2016 2016
2016 SE
2017 2017 2017
2017 SE
Difference: Difference:
# % % Meeting or
Exceeding Expectations
# % % Meeting or
Exceeding Expectations
# % % Meeting or
Exceeding Expectations
2016 to 2017 2015 to 2017
Enrolled Tested Enrolled Tested Enrolled Tested % Meeting or
Exceeding Exp. % Meeting or
Exceeding Exp.
Wakefield Hills ES 148 89 28.8 3.9 178 99 32.8 3.5 167 100 34.1 3.7 1 5
John F. Deering MS
987 90 34.1 1.6 988 95 41 1.6 976 97 36.6 1.6 -4 3
Westerly
Bradford ES 40 93 40.5 8.1 25 100 28 9 33 100 27.3 7.8 -1 -13
Dunn's Corners ES 122 96 41 4.5 121 100 53.7 4.5 109 98 65.4 4.6 12 24
Springbrook ES 141 96 30.9 4 147 99 28.8 3.7 131 99 37.7 4.3 9 7
State Street ES 127 94 45 4.5 131 100 43.5 4.3 138 100 54.3 4.2 11 9
Westerly MS 879 91 32.2 1.6 840 99 40 1.7 861 98 46.1 1.7 6 14
Woonsocket
Bernon Heights ES 227 98 36.5 3.2 252 98 37.7 3.1 240 99 25.7 2.8 -12 -11
Citizens Memorial ES
382 92 18.2 2.1 385 98 17.8 2 396 98 14.2 1.8 -4 -4
Globe Park ES 232 88 22.1 2.9 226 98 23.1 2.8 239 100 25.6 2.8 3 4
Harris ES 204 98 17 2.7 207 97 21.4 2.9 234 97 13.2 2.2 -8 -4
Kevin K. Coleman ES
156 90 26.2 3.7 127 98 19.4 3.5 148 99 19.9 3.3 1 -6
Leo A. Savoie ES 191 98 36.2 3.5 230 99 27.8 3 201 99 27.1 3.2 -1 -9
Woonsocket MS 1262 88 12.3 1 1230 95 12.6 1 1246 97 14.7 1.0 2 2

43
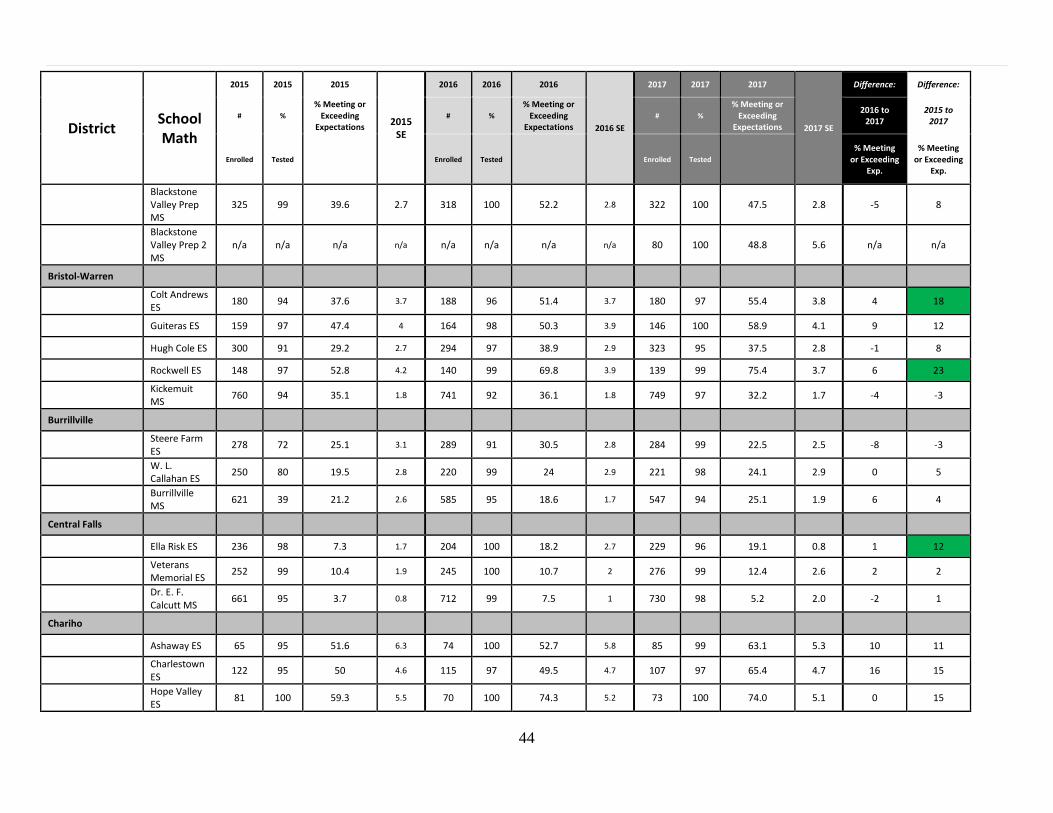
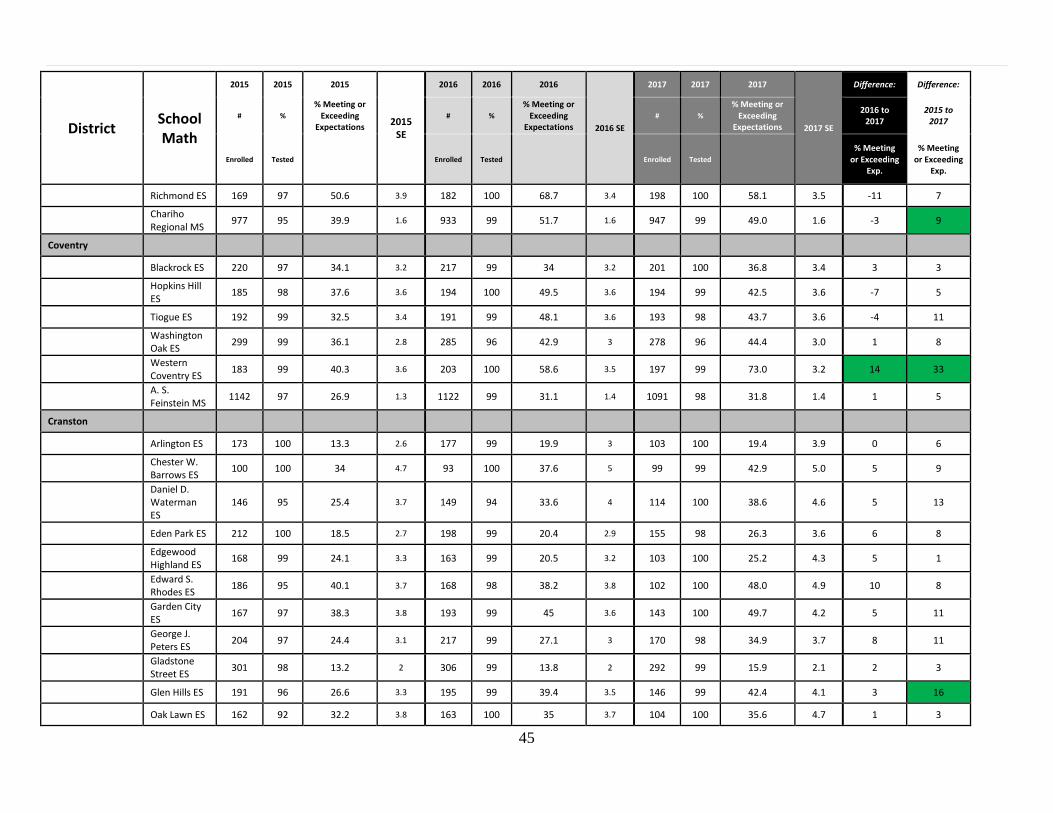
Elementary and Middle School Mathematics 2015-2017
The percent of students in each elementary and middle school who met or exceeded expectations from the 2015-2017 PARCC Mathematics assessment administrations is provided in the table below. Of Rhode Island’s 235 elementary and middle schools that participated in PARCC Mathematics testing, 8 had statistically significant increases in the percent of students who met or exceeded expectations while only 7 had a statistically significant decrease. Seven schools had 70% or more students who met or exceeded expectations (of those, 4 schools had 75% or more); 61 schools had 50% or more students who met or exceeded expectations; and 139 schools met or exceeded the state average of 32% in Mathematics.
Table 14. Mathematics: Elementary and Middle School Percent of Students Meeting or Exceeding Expectations: 2015- 2017
District School Math
2015 2015 2015
2015 SE
2016 2016 2016
2016 SE
2017 2017 2017
2017 SE
Difference: Difference:
# %
% Meeting or Exceeding
Expectations
# %
% Meeting or Exceeding
Expectations
# %
% Meeting or Exceeding
Expectations
2016 to 2017
2015 to 2017
Enrolled Tested Enrolled Tested Enrolled Tested % Meeting
or Exceeding Exp.
% Meeting or Exceeding
Exp.
Achievement First Achievement First Academy
n/a n/a n/a n/a 90 100 75.6 4.5 180 100 59.4 3.7 -16 n/a
Barrington
Hampden Meadows ES
499 95 56.5 2.3 514 98 67.9 2.1 535 98 69.4 2.0 1 13
Nayatt ES 90 100 75.6 4.5 93 99 84.8 3.7 94 100 79.8 4.1 -5 4
Primrose Hill ES
85 96 63.4 5.3 96 97 62.4 5 68 96 53.8 6.2 -9 -10
Sowams ES 80 99 60.8 5.5 68 100 73.5 5.4 72 99 69.0 5.5 -5 8
Barrington MS
812 98 59.6 1.7 831 98 70.1 1.6 795 97 63.5 1.7 -7 4
Beacon Charter Founders Academy MS
n/a n/a n/a n/a 46 100 17.4 5.6 90 100 26.7 4.7 9 n/a
Blackstone Valley
Blackstone Valley Prep 1 ES
166 100 61.4 3.8 163 100 57.1 3.9 162 100 41.4 3.9 -16 -20
Blackstone Valley Prep 2 ES
81 98 68.4 5.2 161 100 52.2 3.9 166 100 38.6 3.8 .14 -30
44
District School Math
2015 2015 2015
2015 SE
2016 2016 2016
2016 SE
2017 2017 2017
2017 SE
Difference: Difference:
# %
% Meeting or Exceeding
Expectations
# %
% Meeting or Exceeding
Expectations
# %
% Meeting or Exceeding
Expectations
2016 to 2017
2015 to 2017
Enrolled Tested Enrolled Tested Enrolled Tested % Meeting
or Exceeding Exp.
% Meeting or Exceeding
Exp.
Blackstone Valley Prep MS
325 99 39.6 2.7 318 100 52.2 2.8 322 100 47.5 2.8 -5 8
Blackstone Valley Prep 2 MS
n/a n/a n/a n/a n/a n/a n/a n/a 80 100 48.8 5.6 n/a n/a
Bristol-Warren
Colt Andrews ES
180 94 37.6 3.7 188 96 51.4 3.7 180 97 55.4 3.8 4 18
Guiteras ES 159 97 47.4 4 164 98 50.3 3.9 146 100 58.9 4.1 9 12
Hugh Cole ES 300 91 29.2 2.7 294 97 38.9 2.9 323 95 37.5 2.8 -1 8
Rockwell ES 148 97 52.8 4.2 140 99 69.8 3.9 139 99 75.4 3.7 6 23
Kickemuit MS
760 94 35.1 1.8 741 92 36.1 1.8 749 97 32.2 1.7 -4 -3
Burrillville
Steere Farm ES
278 72 25.1 3.1 289 91 30.5 2.8 284 99 22.5 2.5 -8 -3
W. L. Callahan ES
250 80 19.5 2.8 220 99 24 2.9 221 98 24.1 2.9 0 5
Burrillville MS
621 39 21.2 2.6 585 95 18.6 1.7 547 94 25.1 1.9 6 4
Central Falls
Ella Risk ES 236 98 7.3 1.7 204 100 18.2 2.7 229 96 19.1 0.8 1 12
Veterans Memorial ES
252 99 10.4 1.9 245 100 10.7 2 276 99 12.4 2.6 2 2
Dr. E. F. Calcutt MS
661 95 3.7 0.8 712 99 7.5 1 730 98 5.2 2.0 -2 1
Chariho
Ashaway ES 65 95 51.6 6.3 74 100 52.7 5.8 85 99 63.1 5.3 10 11
Charlestown ES
122 95 50 4.6 115 97 49.5 4.7 107 97 65.4 4.7 16 15
Hope Valley ES
81 100 59.3 5.5 70 100 74.3 5.2 73 100 74.0 5.1 0 15
45
District School Math
2015 2015 2015
2015 SE
2016 2016 2016
2016 SE
2017 2017 2017
2017 SE
Difference: Difference:
# %
% Meeting or Exceeding
Expectations
# %
% Meeting or Exceeding
Expectations
# %
% Meeting or Exceeding
Expectations
2016 to 2017
2015 to 2017
Enrolled Tested Enrolled Tested Enrolled Tested % Meeting
or Exceeding Exp.
% Meeting or Exceeding
Exp.
Richmond ES 169 97 50.6 3.9 182 100 68.7 3.4 198 100 58.1 3.5 -11 7
Chariho Regional MS
977 95 39.9 1.6 933 99 51.7 1.6 947 99 49.0 1.6 -3 9
Coventry
Blackrock ES 220 97 34.1 3.2 217 99 34 3.2 201 100 36.8 3.4 3 3
Hopkins Hill ES
185 98 37.6 3.6 194 100 49.5 3.6 194 99 42.5 3.6 -7 5
Tiogue ES 192 99 32.5 3.4 191 99 48.1 3.6 193 98 43.7 3.6 -4 11
Washington Oak ES
299 99 36.1 2.8 285 96 42.9 3 278 96 44.4 3.0 1 8
Western Coventry ES
183 99 40.3 3.6 203 100 58.6 3.5 197 99 73.0 3.2 14 33
A. S. Feinstein MS
1142 97 26.9 1.3 1122 99 31.1 1.4 1091 98 31.8 1.4 1 5
Cranston
Arlington ES 173 100 13.3 2.6 177 99 19.9 3 103 100 19.4 3.9 0 6
Chester W. Barrows ES
100 100 34 4.7 93 100 37.6 5 99 99 42.9 5.0 5 9
Daniel D. Waterman ES
146 95 25.4 3.7 149 94 33.6 4 114 100 38.6 4.6 5 13
Eden Park ES 212 100 18.5 2.7 198 99 20.4 2.9 155 98 26.3 3.6 6 8
Edgewood Highland ES
168 99 24.1 3.3 163 99 20.5 3.2 103 100 25.2 4.3 5 1
Edward S. Rhodes ES
186 95 40.1 3.7 168 98 38.2 3.8 102 100 48.0 4.9 10 8
Garden City ES
167 97 38.3 3.8 193 99 45 3.6 143 100 49.7 4.2 5 11
George J. Peters ES
204 97 24.4 3.1 217 99 27.1 3 170 98 34.9 3.7 8 11
Gladstone Street ES
301 98 13.2 2 306 99 13.8 2 292 99 15.9 2.1 2 3
Glen Hills ES 191 96 26.6 3.3 195 99 39.4 3.5 146 99 42.4 4.1 3 16
Oak Lawn ES 162 92 32.2 3.8 163 100 35 3.7 104 100 35.6 4.7 1 3
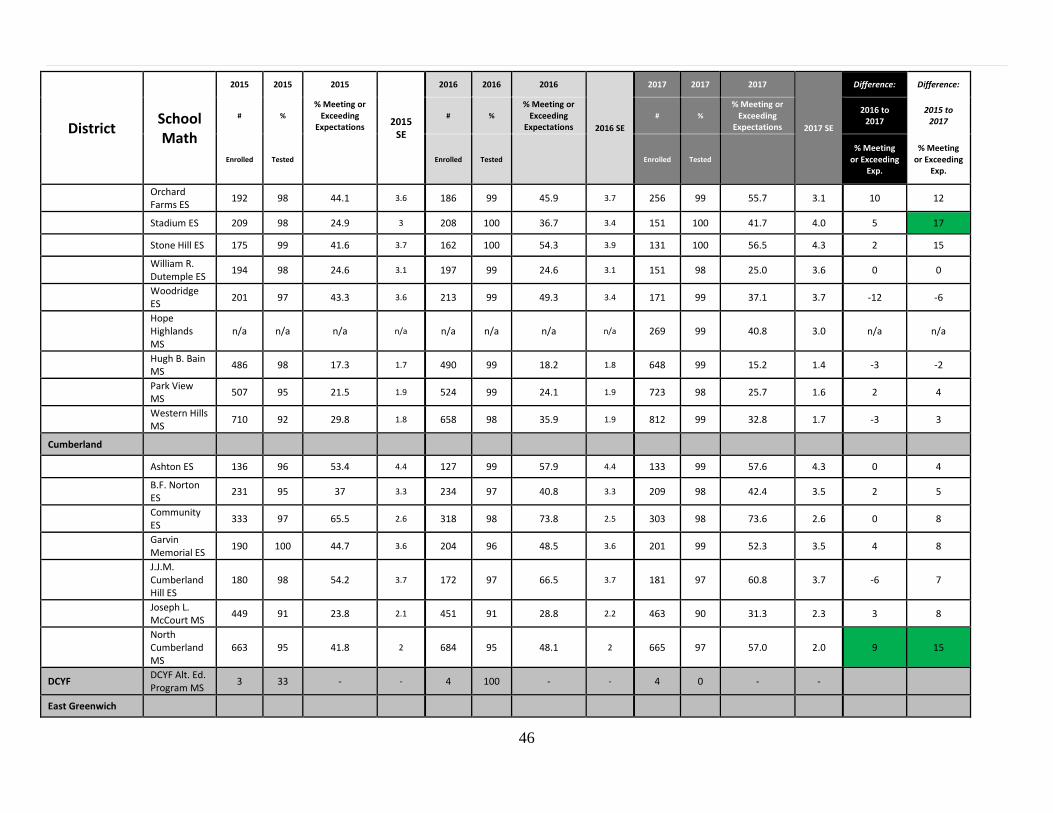
46
District School Math
2015 2015 2015
2015 SE
2016 2016 2016
2016 SE
2017 2017 2017
2017 SE
Difference: Difference:
# %
% Meeting or Exceeding
Expectations
# %
% Meeting or Exceeding
Expectations
# %
% Meeting or Exceeding
Expectations
2016 to 2017
2015 to 2017
Enrolled Tested Enrolled Tested Enrolled Tested % Meeting
or Exceeding Exp.
% Meeting or Exceeding
Exp.
Orchard Farms ES
192 98 44.1 3.6 186 99 45.9 3.7 256 99 55.7 3.1 10 12
Stadium ES 209 98 24.9 3 208 100 36.7 3.4 151 100 41.7 4.0 5 17
Stone Hill ES 175 99 41.6 3.7 162 100 54.3 3.9 131 100 56.5 4.3 2 15
William R. Dutemple ES
194 98 24.6 3.1 197 99 24.6 3.1 151 98 25.0 3.6 0 0
Woodridge ES
201 97 43.3 3.6 213 99 49.3 3.4 171 99 37.1 3.7 -12 -6
Hope Highlands MS
n/a n/a n/a n/a n/a n/a n/a n/a 269 99 40.8 3.0 n/a n/a
Hugh B. Bain MS
486 98 17.3 1.7 490 99 18.2 1.8 648 99 15.2 1.4 -3 -2
Park View MS
507 95 21.5 1.9 524 99 24.1 1.9 723 98 25.7 1.6 2 4
Western Hills MS
710 92 29.8 1.8 658 98 35.9 1.9 812 99 32.8 1.7 -3 3
Cumberland
Ashton ES 136 96 53.4 4.4 127 99 57.9 4.4 133 99 57.6 4.3 0 4
B.F. Norton ES
231 95 37 3.3 234 97 40.8 3.3 209 98 42.4 3.5 2 5
Community ES
333 97 65.5 2.6 318 98 73.8 2.5 303 98 73.6 2.6 0 8
Garvin Memorial ES
190 100 44.7 3.6 204 96 48.5 3.6 201 99 52.3 3.5 4 8
J.J.M. Cumberland Hill ES
180 98 54.2 3.7 172 97 66.5 3.7 181 97 60.8 3.7 -6 7
Joseph L. McCourt MS
449 91 23.8 2.1 451 91 28.8 2.2 463 90 31.3 2.3 3 8
North Cumberland MS
663 95 41.8 2 684 95 48.1 2 665 97 57.0 2.0 9 15
DCYF DCYF Alt. Ed. Program MS
3 33 - - 4 100 - - 4 0 - -
East Greenwich
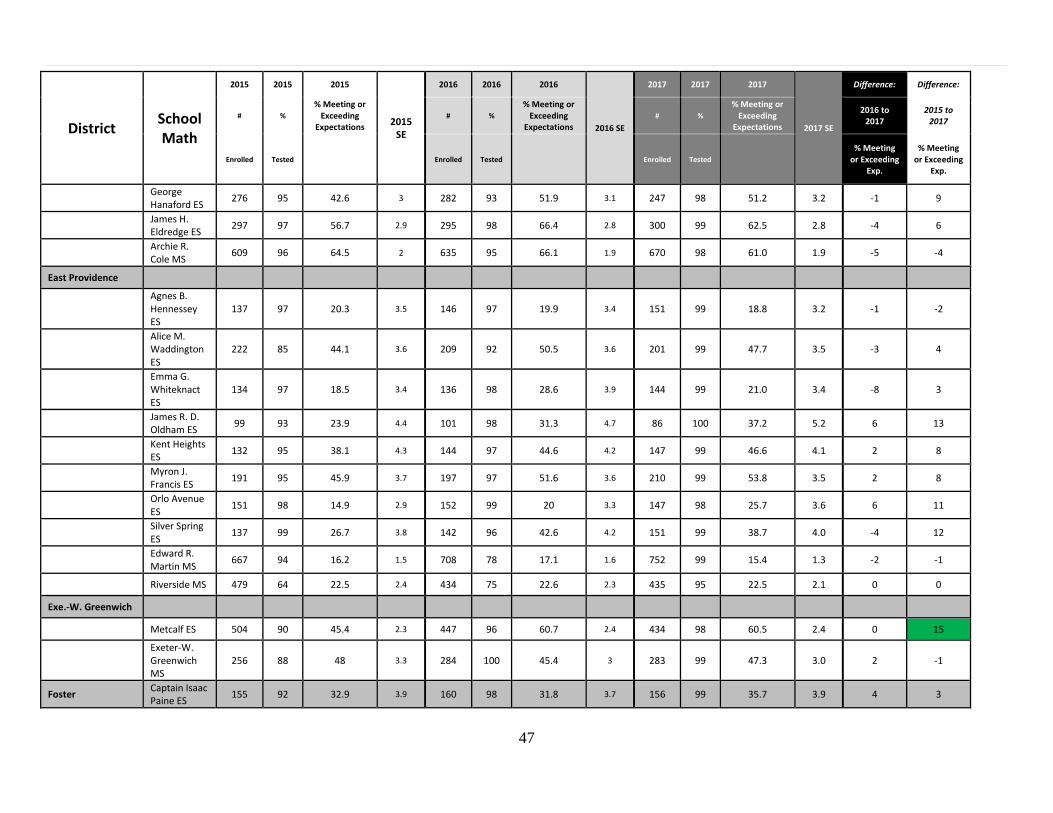
47
District School Math
2015 2015 2015
2015 SE
2016 2016 2016
2016 SE
2017 2017 2017
2017 SE
Difference: Difference:
# %
% Meeting or Exceeding
Expectations
# %
% Meeting or Exceeding
Expectations
# %
% Meeting or Exceeding
Expectations
2016 to 2017
2015 to 2017
Enrolled Tested Enrolled Tested Enrolled Tested % Meeting
or Exceeding Exp.
% Meeting or Exceeding
Exp.
George Hanaford ES
276 95 42.6 3 282 93 51.9 3.1 247 98 51.2 3.2 -1 9
James H. Eldredge ES
297 97 56.7 2.9 295 98 66.4 2.8 300 99 62.5 2.8 -4 6
Archie R. Cole MS
609 96 64.5 2 635 95 66.1 1.9 670 98 61.0 1.9 -5 -4
East Providence
Agnes B. Hennessey ES
137 97 20.3 3.5 146 97 19.9 3.4 151 99 18.8 3.2 -1 -2
Alice M. Waddington ES
222 85 44.1 3.6 209 92 50.5 3.6 201 99 47.7 3.5 -3 4
Emma G. Whiteknact ES
134 97 18.5 3.4 136 98 28.6 3.9 144 99 21.0 3.4 -8 3
James R. D. Oldham ES
99 93 23.9 4.4 101 98 31.3 4.7 86 100 37.2 5.2 6 13
Kent Heights ES
132 95 38.1 4.3 144 97 44.6 4.2 147 99 46.6 4.1 2 8
Myron J. Francis ES
191 95 45.9 3.7 197 97 51.6 3.6 210 99 53.8 3.5 2 8
Orlo Avenue ES
151 98 14.9 2.9 152 99 20 3.3 147 98 25.7 3.6 6 11
Silver Spring ES
137 99 26.7 3.8 142 96 42.6 4.2 151 99 38.7 4.0 -4 12
Edward R. Martin MS
667 94 16.2 1.5 708 78 17.1 1.6 752 99 15.4 1.3 -2 -1
Riverside MS 479 64 22.5 2.4 434 75 22.6 2.3 435 95 22.5 2.1 0 0
Exe.-W. Greenwich
Metcalf ES 504 90 45.4 2.3 447 96 60.7 2.4 434 98 60.5 2.4 0 15
Exeter-W. Greenwich MS
256 88 48 3.3 284 100 45.4 3 283 99 47.3 3.0 2 -1
Foster Captain Isaac Paine ES
155 92 32.9 3.9 160 98 31.8 3.7 156 99 35.7 3.9 4 3
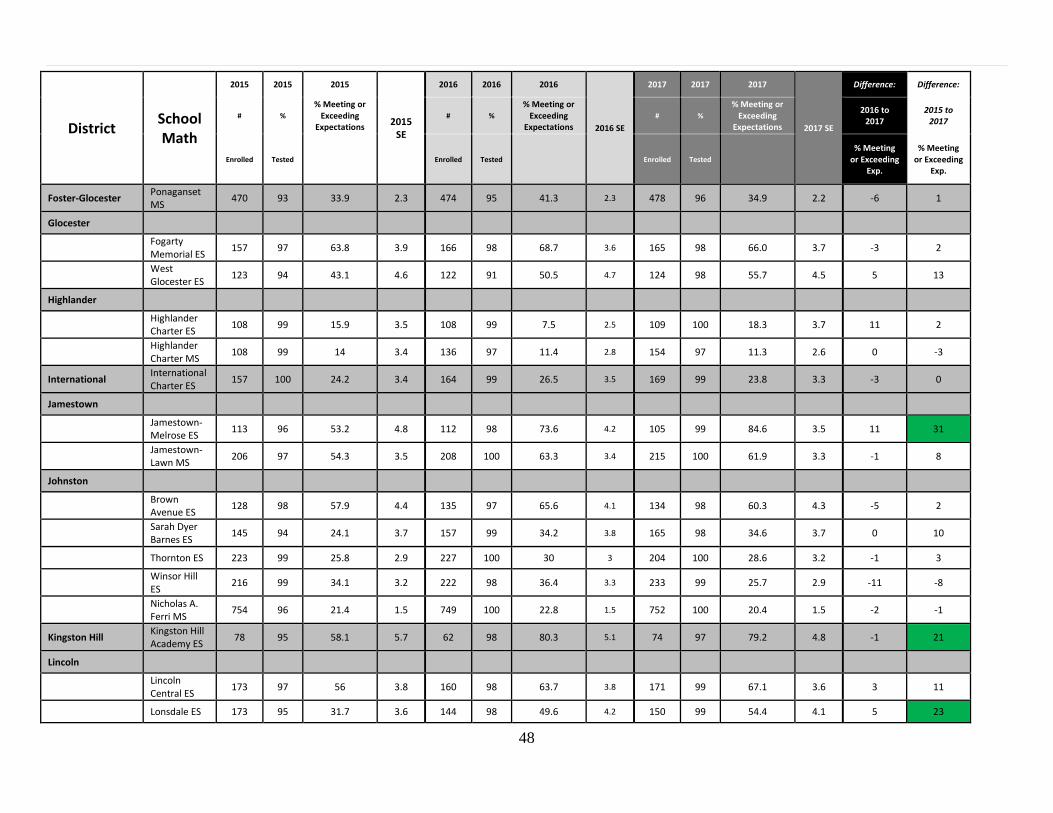
48
District School Math
2015 2015 2015
2015 SE
2016 2016 2016
2016 SE
2017 2017 2017
2017 SE
Difference: Difference:
# %
% Meeting or Exceeding
Expectations
# %
% Meeting or Exceeding
Expectations
# %
% Meeting or Exceeding
Expectations
2016 to 2017
2015 to 2017
Enrolled Tested Enrolled Tested Enrolled Tested % Meeting
or Exceeding Exp.
% Meeting or Exceeding
Exp.
Foster-Glocester Ponaganset MS
470 93 33.9 2.3 474 95 41.3 2.3 478 96 34.9 2.2 -6 1
Glocester
Fogarty Memorial ES
157 97 63.8 3.9 166 98 68.7 3.6 165 98 66.0 3.7 -3 2
West Glocester ES
123 94 43.1 4.6 122 91 50.5 4.7 124 98 55.7 4.5 5 13
Highlander
Highlander Charter ES
108 99 15.9 3.5 108 99 7.5 2.5 109 100 18.3 3.7 11 2
Highlander Charter MS
108 99 14 3.4 136 97 11.4 2.8 154 97 11.3 2.6 0 -3
International International Charter ES
157 100 24.2 3.4 164 99 26.5 3.5 169 99 23.8 3.3 -3 0
Jamestown
Jamestown-Melrose ES
113 96 53.2 4.8 112 98 73.6 4.2 105 99 84.6 3.5 11 31
Jamestown-Lawn MS
206 97 54.3 3.5 208 100 63.3 3.4 215 100 61.9 3.3 -1 8
Johnston
Brown Avenue ES
128 98 57.9 4.4 135 97 65.6 4.1 134 98 60.3 4.3 -5 2
Sarah Dyer Barnes ES
145 94 24.1 3.7 157 99 34.2 3.8 165 98 34.6 3.7 0 10
Thornton ES 223 99 25.8 2.9 227 100 30 3 204 100 28.6 3.2 -1 3
Winsor Hill ES
216 99 34.1 3.2 222 98 36.4 3.3 233 99 25.7 2.9 -11 -8
Nicholas A. Ferri MS
754 96 21.4 1.5 749 100 22.8 1.5 752 100 20.4 1.5 -2 -1
Kingston Hill Kingston Hill Academy ES
78 95 58.1 5.7 62 98 80.3 5.1 74 97 79.2 4.8 -1 21
Lincoln
Lincoln Central ES
173 97 56 3.8 160 98 63.7 3.8 171 99 67.1 3.6 3 11
Lonsdale ES 173 95 31.7 3.6 144 98 49.6 4.2 150 99 54.4 4.1 5 23
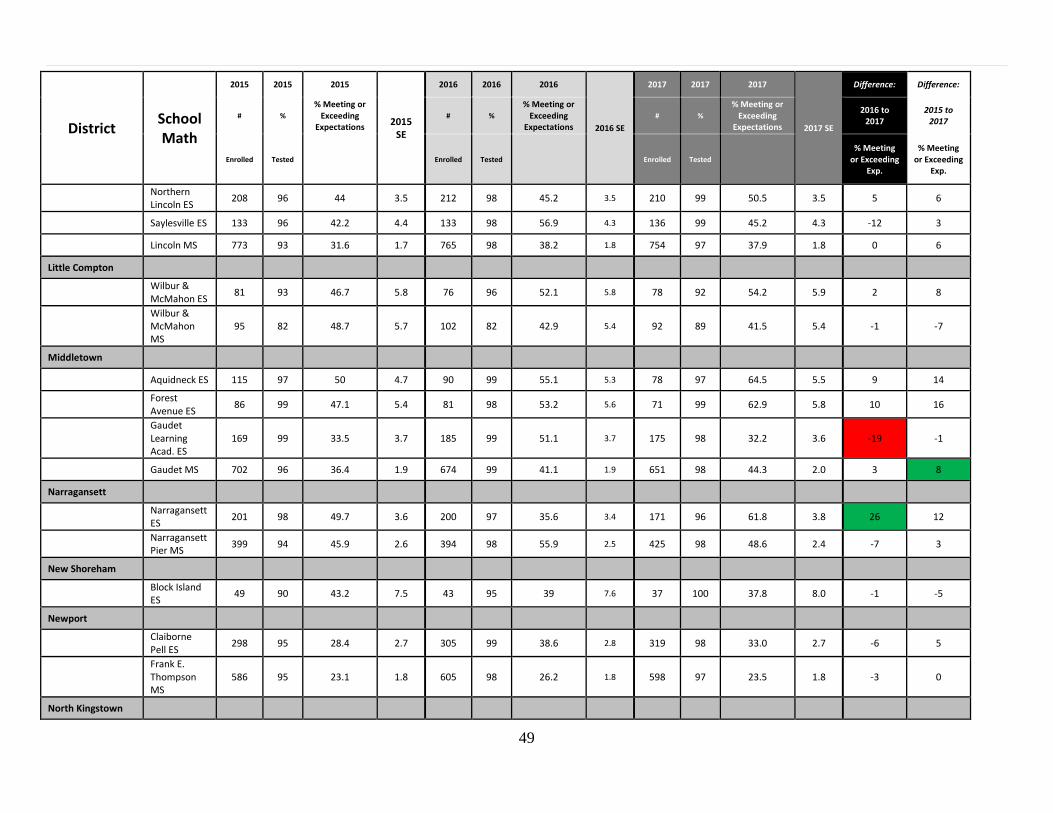
49
District School Math
2015 2015 2015
2015 SE
2016 2016 2016
2016 SE
2017 2017 2017
2017 SE
Difference: Difference:
# %
% Meeting or Exceeding
Expectations
# %
% Meeting or Exceeding
Expectations
# %
% Meeting or Exceeding
Expectations
2016 to 2017
2015 to 2017
Enrolled Tested Enrolled Tested Enrolled Tested % Meeting
or Exceeding Exp.
% Meeting or Exceeding
Exp.
Northern Lincoln ES
208 96 44 3.5 212 98 45.2 3.5 210 99 50.5 3.5 5 6
Saylesville ES 133 96 42.2 4.4 133 98 56.9 4.3 136 99 45.2 4.3 -12 3
Lincoln MS 773 93 31.6 1.7 765 98 38.2 1.8 754 97 37.9 1.8 0 6
Little Compton
Wilbur & McMahon ES
81 93 46.7 5.8 76 96 52.1 5.8 78 92 54.2 5.9 2 8
Wilbur & McMahon MS
95 82 48.7 5.7 102 82 42.9 5.4 92 89 41.5 5.4 -1 -7
Middletown
Aquidneck ES 115 97 50 4.7 90 99 55.1 5.3 78 97 64.5 5.5 9 14
Forest Avenue ES
86 99 47.1 5.4 81 98 53.2 5.6 71 99 62.9 5.8 10 16
Gaudet Learning Acad. ES
169 99 33.5 3.7 185 99 51.1 3.7 175 98 32.2 3.6 -19 -1
Gaudet MS 702 96 36.4 1.9 674 99 41.1 1.9 651 98 44.3 2.0 3 8
Narragansett
Narragansett ES
201 98 49.7 3.6 200 97 35.6 3.4 171 96 61.8 3.8 26 12
Narragansett Pier MS
399 94 45.9 2.6 394 98 55.9 2.5 425 98 48.6 2.4 -7 3
New Shoreham
Block Island ES
49 90 43.2 7.5 43 95 39 7.6 37 100 37.8 8.0 -1 -5
Newport
Claiborne Pell ES
298 95 28.4 2.7 305 99 38.6 2.8 319 98 33.0 2.7 -6 5
Frank E. Thompson MS
586 95 23.1 1.8 605 98 26.2 1.8 598 97 23.5 1.8 -3 0
North Kingstown

50
District School Math
2015 2015 2015
2015 SE
2016 2016 2016
2016 SE
2017 2017 2017
2017 SE
Difference: Difference:
# %
% Meeting or Exceeding
Expectations
# %
% Meeting or Exceeding
Expectations
# %
% Meeting or Exceeding
Expectations
2016 to 2017
2015 to 2017
Enrolled Tested Enrolled Tested Enrolled Tested % Meeting
or Exceeding Exp.
% Meeting or Exceeding
Exp.
Fishing Cove ES
123 94 50.9 4.6 120 97 54.3 4.6 112 99 58.6 4.7 4 8
Forest Park ES
156 90 44.3 4.2 147 99 56.8 4.1 137 99 47.8 4.3 -9 4
Hamilton ES 218 97 60.8 3.4 194 98 64.4 3.5 198 99 61.7 3.5 -3 1
Stony Lane ES
229 100 46.5 3.3 231 100 56.3 3.3 224 100 53.6 3.3 -3 7
S. M. H. Quidnessett ES
147 93 33.6 4 144 99 33.1 3.9 139 99 32.8 4.0 0 -1
Davisville MS 525 82 47 2.4 528 95 50.2 2.2 531 99 44.9 2.2 -5 -2
Wickford MS 435 87 52.4 2.6 424 100 60.9 2.4 405 99 63.3 2.4 2 11
North Providence
Centredale ES
128 98 24 3.8 127 94 33.6 4.3 124 98 21.5 3.7 -12 -3
Dr. Joseph A. Whelan ES
134 99 25 3.8 125 100 36.8 4.3 139 99 26.8 3.8 -10 2
Greystone ES 124 96 35.3 4.4 125 99 41.9 4.4 127 99 34.1 4.2 -8 -1
James L. McGuire ES
149 95 27 3.7 142 98 32.4 4 134 97 34.6 4.2 2 8
Marieville ES 125 90 20.4 3.8 117 99 38.8 4.5 121 99 35.8 4.4 -3 15
Stephen Olney ES
155 90 22.9 3.5 152 97 27 3.7 153 94 38.2 4.0 11 15
Birchwood MS
410 90 16 1.9 420 99 24.7 2.1 431 99 27.8 2.2 3 12
Dr. Edward A. Ricci MS
430 92 9.8 1.5 436 99 18 1.8 423 100 23.5 2.1 6 14
North Smithfield
Dr. H. L.. H. Memorial ES
341 91 39.4 2.8 333 98 47.1 2.8 344 99 48.7 2.7 2 9
North Smithfield ES
44 93 41.5 7.7 46 98 57.8 7.4 52 100 46.2 6.9 -12 5
North Smithfield MS
443 88 32.7 2.4 454 99 34 2.2 412 99 44.9 2.5 11 12
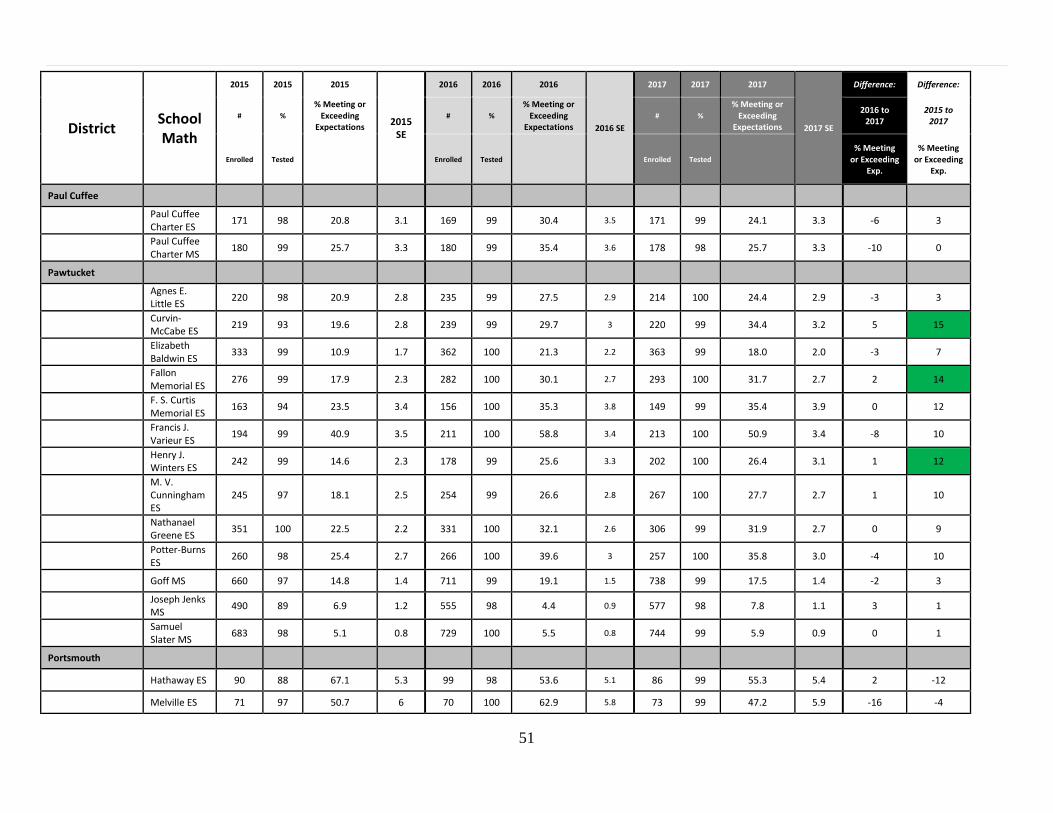
51
District School Math
2015 2015 2015
2015 SE
2016 2016 2016
2016 SE
2017 2017 2017
2017 SE
Difference: Difference:
# %
% Meeting or Exceeding
Expectations
# %
% Meeting or Exceeding
Expectations
# %
% Meeting or Exceeding
Expectations
2016 to 2017
2015 to 2017
Enrolled Tested Enrolled Tested Enrolled Tested % Meeting
or Exceeding Exp.
% Meeting or Exceeding
Exp.
Paul Cuffee
Paul Cuffee Charter ES
171 98 20.8 3.1 169 99 30.4 3.5 171 99 24.1 3.3 -6 3
Paul Cuffee Charter MS
180 99 25.7 3.3 180 99 35.4 3.6 178 98 25.7 3.3 -10 0
Pawtucket
Agnes E. Little ES
220 98 20.9 2.8 235 99 27.5 2.9 214 100 24.4 2.9 -3 3
Curvin-McCabe ES
219 93 19.6 2.8 239 99 29.7 3 220 99 34.4 3.2 5 15
Elizabeth Baldwin ES
333 99 10.9 1.7 362 100 21.3 2.2 363 99 18.0 2.0 -3 7
Fallon Memorial ES
276 99 17.9 2.3 282 100 30.1 2.7 293 100 31.7 2.7 2 14
F. S. Curtis Memorial ES
163 94 23.5 3.4 156 100 35.3 3.8 149 99 35.4 3.9 0 12
Francis J. Varieur ES
194 99 40.9 3.5 211 100 58.8 3.4 213 100 50.9 3.4 -8 10
Henry J. Winters ES
242 99 14.6 2.3 178 99 25.6 3.3 202 100 26.4 3.1 1 12
M. V. Cunningham ES
245 97 18.1 2.5 254 99 26.6 2.8 267 100 27.7 2.7 1 10
Nathanael Greene ES
351 100 22.5 2.2 331 100 32.1 2.6 306 99 31.9 2.7 0 9
Potter-Burns ES
260 98 25.4 2.7 266 100 39.6 3 257 100 35.8 3.0 -4 10
Goff MS 660 97 14.8 1.4 711 99 19.1 1.5 738 99 17.5 1.4 -2 3
Joseph Jenks MS
490 89 6.9 1.2 555 98 4.4 0.9 577 98 7.8 1.1 3 1
Samuel Slater MS
683 98 5.1 0.8 729 100 5.5 0.8 744 99 5.9 0.9 0 1
Portsmouth
Hathaway ES 90 88 67.1 5.3 99 98 53.6 5.1 86 99 55.3 5.4 2 -12
Melville ES 71 97 50.7 6 70 100 62.9 5.8 73 99 47.2 5.9 -16 -4
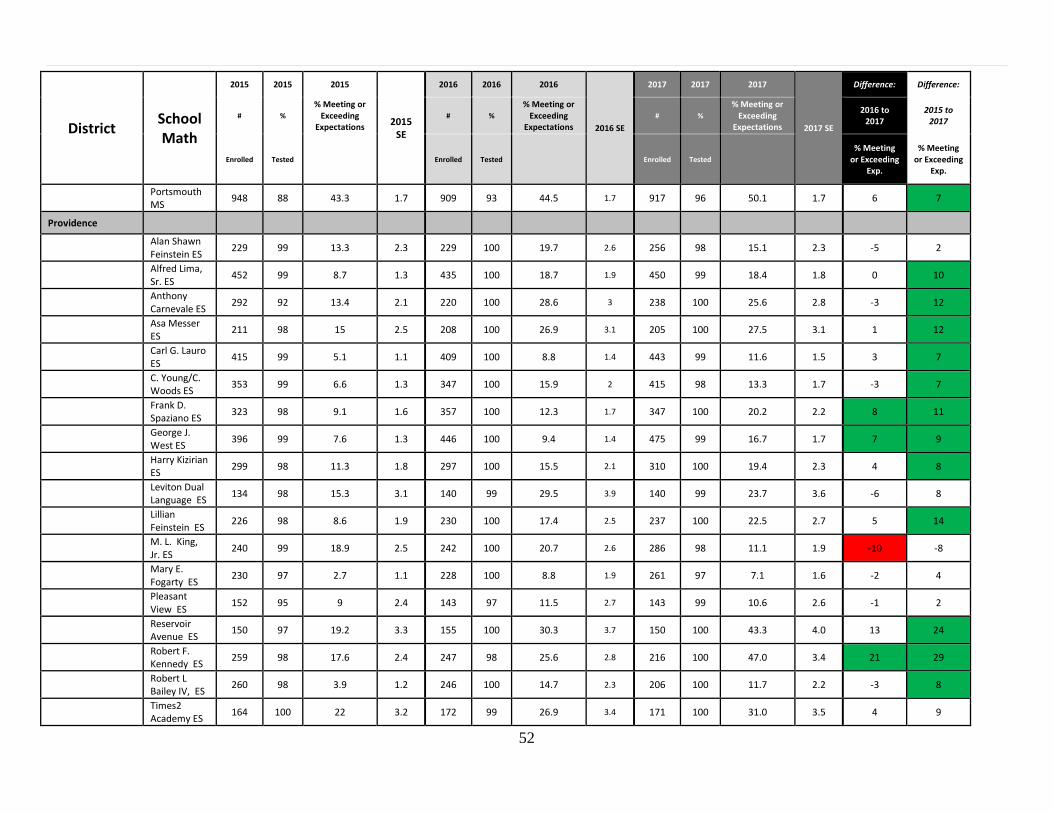
52
District School Math
2015 2015 2015
2015 SE
2016 2016 2016
2016 SE
2017 2017 2017
2017 SE
Difference: Difference:
# %
% Meeting or Exceeding
Expectations
# %
% Meeting or Exceeding
Expectations
# %
% Meeting or Exceeding
Expectations
2016 to 2017
2015 to 2017
Enrolled Tested Enrolled Tested Enrolled Tested % Meeting
or Exceeding Exp.
% Meeting or Exceeding
Exp.
Portsmouth MS
948 88 43.3 1.7 909 93 44.5 1.7 917 96 50.1 1.7 6 7
Providence
Alan Shawn Feinstein ES
229 99 13.3 2.3 229 100 19.7 2.6 256 98 15.1 2.3 -5 2
Alfred Lima, Sr. ES
452 99 8.7 1.3 435 100 18.7 1.9 450 99 18.4 1.8 0 10
Anthony Carnevale ES
292 92 13.4 2.1 220 100 28.6 3 238 100 25.6 2.8 -3 12
Asa Messer ES
211 98 15 2.5 208 100 26.9 3.1 205 100 27.5 3.1 1 12
Carl G. Lauro ES
415 99 5.1 1.1 409 100 8.8 1.4 443 99 11.6 1.5 3 7
C. Young/C. Woods ES
353 99 6.6 1.3 347 100 15.9 2 415 98 13.3 1.7 -3 7
Frank D. Spaziano ES
323 98 9.1 1.6 357 100 12.3 1.7 347 100 20.2 2.2 8 11
George J. West ES
396 99 7.6 1.3 446 100 9.4 1.4 475 99 16.7 1.7 7 9
Harry Kizirian ES
299 98 11.3 1.8 297 100 15.5 2.1 310 100 19.4 2.3 4 8
Leviton Dual Language ES
134 98 15.3 3.1 140 99 29.5 3.9 140 99 23.7 3.6 -6 8
Lillian Feinstein ES
226 98 8.6 1.9 230 100 17.4 2.5 237 100 22.5 2.7 5 14
M. L. King, Jr. ES
240 99 18.9 2.5 242 100 20.7 2.6 286 98 11.1 1.9 -10 -8
Mary E. Fogarty ES
230 97 2.7 1.1 228 100 8.8 1.9 261 97 7.1 1.6 -2 4
Pleasant View ES
152 95 9 2.4 143 97 11.5 2.7 143 99 10.6 2.6 -1 2
Reservoir Avenue ES
150 97 19.2 3.3 155 100 30.3 3.7 150 100 43.3 4.0 13 24
Robert F. Kennedy ES
259 98 17.6 2.4 247 98 25.6 2.8 216 100 47.0 3.4 21 29
Robert L Bailey IV, ES
260 98 3.9 1.2 246 100 14.7 2.3 206 100 11.7 2.2 -3 8
Times2 Academy ES
164 100 22 3.2 172 99 26.9 3.4 171 100 31.0 3.5 4 9
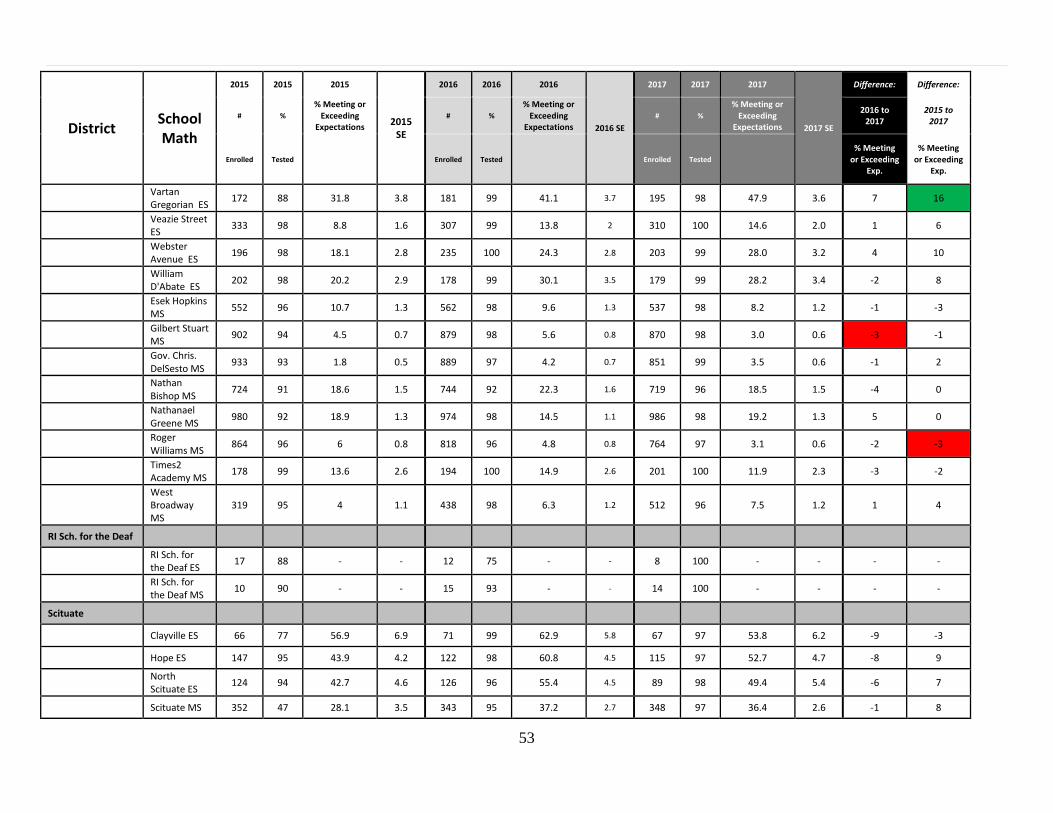
53
District School Math
2015 2015 2015
2015 SE
2016 2016 2016
2016 SE
2017 2017 2017
2017 SE
Difference: Difference:
# %
% Meeting or Exceeding
Expectations
# %
% Meeting or Exceeding
Expectations
# %
% Meeting or Exceeding
Expectations
2016 to 2017
2015 to 2017
Enrolled Tested Enrolled Tested Enrolled Tested % Meeting
or Exceeding Exp.
% Meeting or Exceeding
Exp.
Vartan Gregorian ES
172 88 31.8 3.8 181 99 41.1 3.7 195 98 47.9 3.6 7 16
Veazie Street ES
333 98 8.8 1.6 307 99 13.8 2 310 100 14.6 2.0 1 6
Webster Avenue ES
196 98 18.1 2.8 235 100 24.3 2.8 203 99 28.0 3.2 4 10
William D'Abate ES
202 98 20.2 2.9 178 99 30.1 3.5 179 99 28.2 3.4 -2 8
Esek Hopkins MS
552 96 10.7 1.3 562 98 9.6 1.3 537 98 8.2 1.2 -1 -3
Gilbert Stuart MS
902 94 4.5 0.7 879 98 5.6 0.8 870 98 3.0 0.6 -3 -1
Gov. Chris. DelSesto MS
933 93 1.8 0.5 889 97 4.2 0.7 851 99 3.5 0.6 -1 2
Nathan Bishop MS
724 91 18.6 1.5 744 92 22.3 1.6 719 96 18.5 1.5 -4 0
Nathanael Greene MS
980 92 18.9 1.3 974 98 14.5 1.1 986 98 19.2 1.3 5 0
Roger Williams MS
864 96 6 0.8 818 96 4.8 0.8 764 97 3.1 0.6 -2 -3
Times2 Academy MS
178 99 13.6 2.6 194 100 14.9 2.6 201 100 11.9 2.3 -3 -2
West Broadway MS
319 95 4 1.1 438 98 6.3 1.2 512 96 7.5 1.2 1 4
RI Sch. for the Deaf
RI Sch. for the Deaf ES
17 88 - - 12 75 - - 8 100 - - - -
RI Sch. for the Deaf MS
10 90 - - 15 93 - - 14 100 - - - -
Scituate
Clayville ES 66 77 56.9 6.9 71 99 62.9 5.8 67 97 53.8 6.2 -9 -3
Hope ES 147 95 43.9 4.2 122 98 60.8 4.5 115 97 52.7 4.7 -8 9
North Scituate ES
124 94 42.7 4.6 126 96 55.4 4.5 89 98 49.4 5.4 -6 7
Scituate MS 352 47 28.1 3.5 343 95 37.2 2.7 348 97 36.4 2.6 -1 8
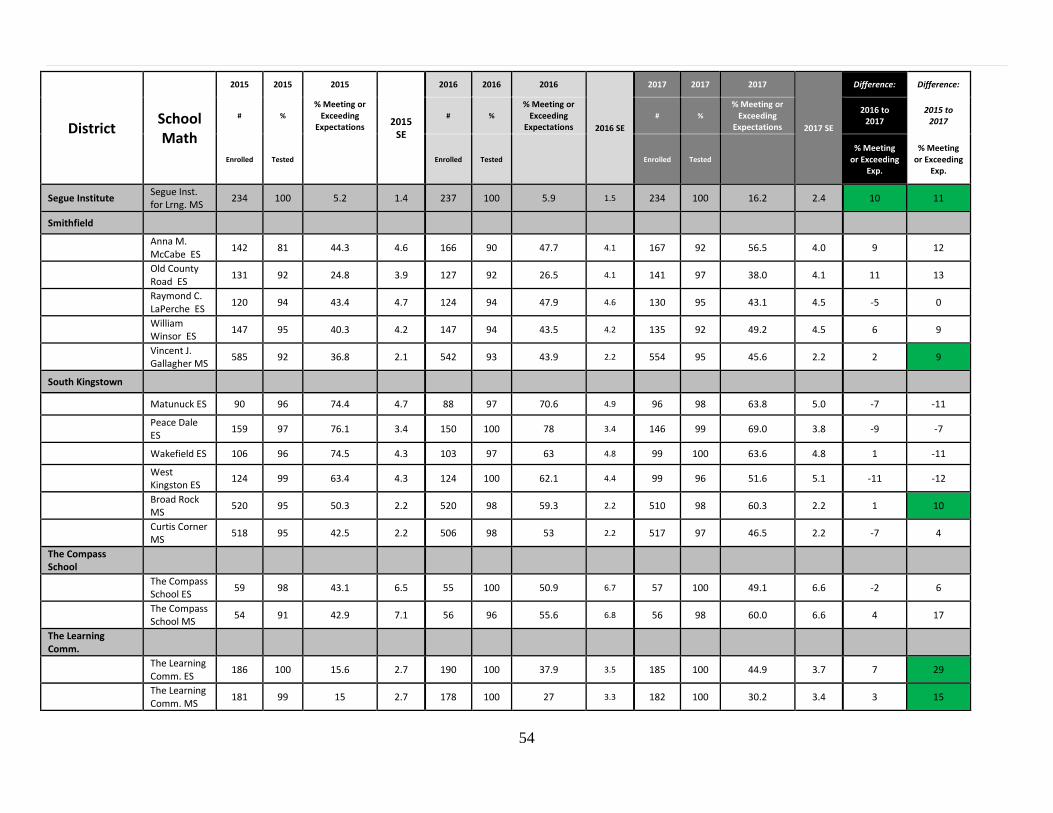
54
District School Math
2015 2015 2015
2015 SE
2016 2016 2016
2016 SE
2017 2017 2017
2017 SE
Difference: Difference:
# %
% Meeting or Exceeding
Expectations
# %
% Meeting or Exceeding
Expectations
# %
% Meeting or Exceeding
Expectations
2016 to 2017
2015 to 2017
Enrolled Tested Enrolled Tested Enrolled Tested % Meeting
or Exceeding Exp.
% Meeting or Exceeding
Exp.
Segue Institute Segue Inst. for Lrng. MS
234 100 5.2 1.4 237 100 5.9 1.5 234 100 16.2 2.4 10 11
Smithfield
Anna M. McCabe ES
142 81 44.3 4.6 166 90 47.7 4.1 167 92 56.5 4.0 9 12
Old County Road ES
131 92 24.8 3.9 127 92 26.5 4.1 141 97 38.0 4.1 11 13
Raymond C. LaPerche ES
120 94 43.4 4.7 124 94 47.9 4.6 130 95 43.1 4.5 -5 0
William Winsor ES
147 95 40.3 4.2 147 94 43.5 4.2 135 92 49.2 4.5 6 9
Vincent J. Gallagher MS
585 92 36.8 2.1 542 93 43.9 2.2 554 95 45.6 2.2 2 9
South Kingstown
Matunuck ES 90 96 74.4 4.7 88 97 70.6 4.9 96 98 63.8 5.0 -7 -11
Peace Dale ES
159 97 76.1 3.4 150 100 78 3.4 146 99 69.0 3.8 -9 -7
Wakefield ES 106 96 74.5 4.3 103 97 63 4.8 99 100 63.6 4.8 1 -11
West Kingston ES
124 99 63.4 4.3 124 100 62.1 4.4 99 96 51.6 5.1 -11 -12
Broad Rock MS
520 95 50.3 2.2 520 98 59.3 2.2 510 98 60.3 2.2 1 10
Curtis Corner MS
518 95 42.5 2.2 506 98 53 2.2 517 97 46.5 2.2 -7 4
The Compass School
The Compass School ES
59 98 43.1 6.5 55 100 50.9 6.7 57 100 49.1 6.6 -2 6
The Compass School MS
54 91 42.9 7.1 56 96 55.6 6.8 56 98 60.0 6.6 4 17
The Learning Comm.
The Learning Comm. ES
186 100 15.6 2.7 190 100 37.9 3.5 185 100 44.9 3.7 7 29
The Learning Comm. MS
181 99 15 2.7 178 100 27 3.3 182 100 30.2 3.4 3 15
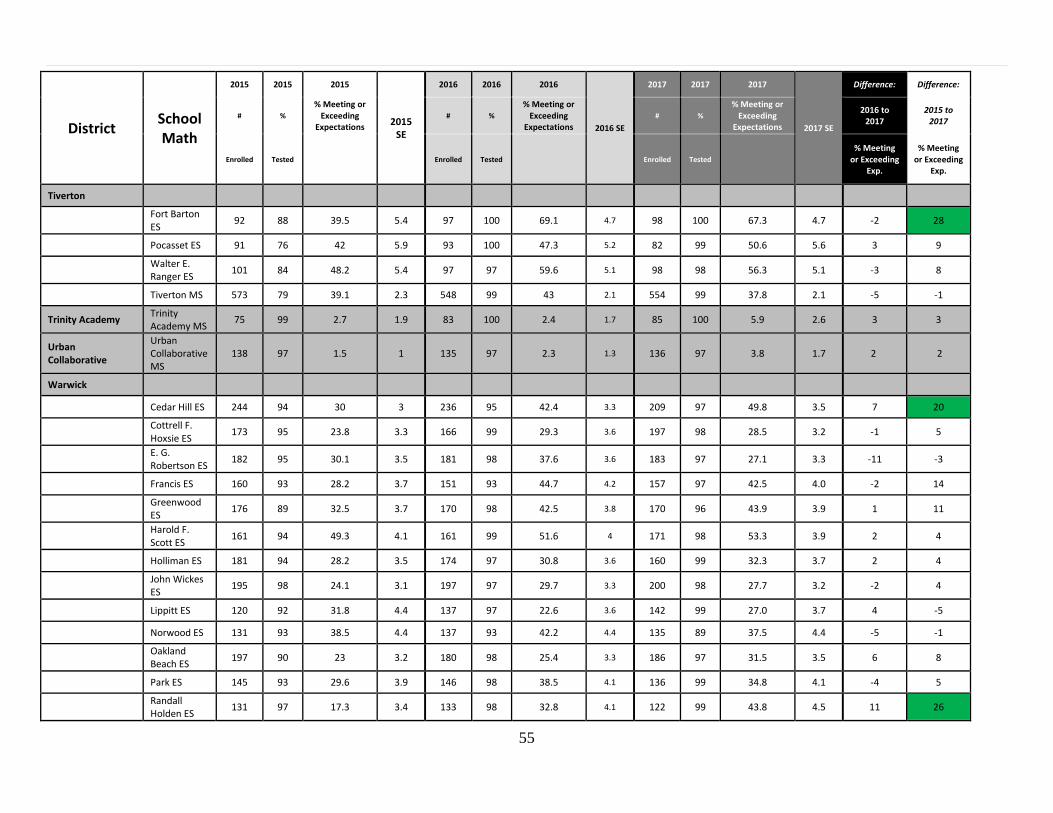
55
District School Math
2015 2015 2015
2015 SE
2016 2016 2016
2016 SE
2017 2017 2017
2017 SE
Difference: Difference:
# %
% Meeting or Exceeding
Expectations
# %
% Meeting or Exceeding
Expectations
# %
% Meeting or Exceeding
Expectations
2016 to 2017
2015 to 2017
Enrolled Tested Enrolled Tested Enrolled Tested % Meeting
or Exceeding Exp.
% Meeting or Exceeding
Exp.
Tiverton
Fort Barton ES
92 88 39.5 5.4 97 100 69.1 4.7 98 100 67.3 4.7 -2 28
Pocasset ES 91 76 42 5.9 93 100 47.3 5.2 82 99 50.6 5.6 3 9
Walter E. Ranger ES
101 84 48.2 5.4 97 97 59.6 5.1 98 98 56.3 5.1 -3 8
Tiverton MS 573 79 39.1 2.3 548 99 43 2.1 554 99 37.8 2.1 -5 -1
Trinity Academy Trinity Academy MS
75 99 2.7 1.9 83 100 2.4 1.7 85 100 5.9 2.6 3 3
Urban Collaborative
Urban Collaborative MS
138 97 1.5 1 135 97 2.3 1.3 136 97 3.8 1.7 2 2
Warwick
Cedar Hill ES 244 94 30 3 236 95 42.4 3.3 209 97 49.8 3.5 7 20
Cottrell F. Hoxsie ES
173 95 23.8 3.3 166 99 29.3 3.6 197 98 28.5 3.2 -1 5
E. G. Robertson ES
182 95 30.1 3.5 181 98 37.6 3.6 183 97 27.1 3.3 -11 -3
Francis ES 160 93 28.2 3.7 151 93 44.7 4.2 157 97 42.5 4.0 -2 14
Greenwood ES
176 89 32.5 3.7 170 98 42.5 3.8 170 96 43.9 3.9 1 11
Harold F. Scott ES
161 94 49.3 4.1 161 99 51.6 4 171 98 53.3 3.9 2 4
Holliman ES 181 94 28.2 3.5 174 97 30.8 3.6 160 99 32.3 3.7 2 4
John Wickes ES
195 98 24.1 3.1 197 97 29.7 3.3 200 98 27.7 3.2 -2 4
Lippitt ES 120 92 31.8 4.4 137 97 22.6 3.6 142 99 27.0 3.7 4 -5
Norwood ES 131 93 38.5 4.4 137 93 42.2 4.4 135 89 37.5 4.4 -5 -1
Oakland Beach ES
197 90 23 3.2 180 98 25.4 3.3 186 97 31.5 3.5 6 8
Park ES 145 93 29.6 3.9 146 98 38.5 4.1 136 99 34.8 4.1 -4 5
Randall Holden ES
131 97 17.3 3.4 133 98 32.8 4.1 122 99 43.8 4.5 11 26
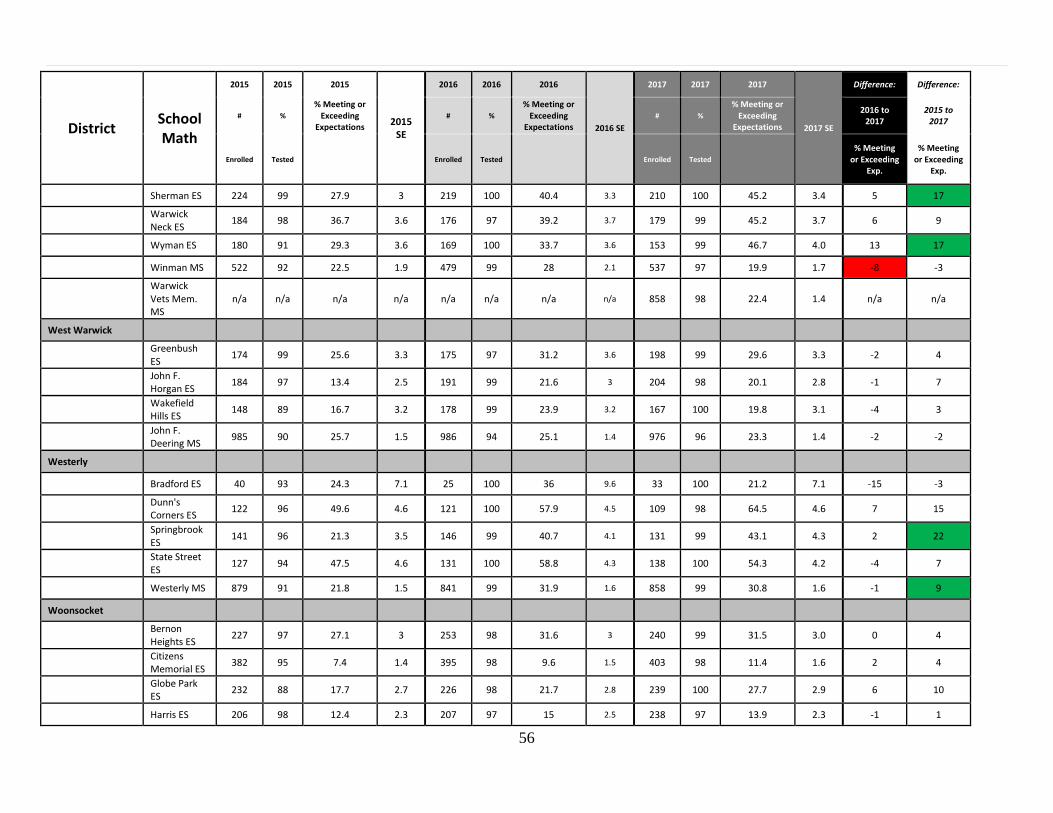
56
District School Math
2015 2015 2015
2015 SE
2016 2016 2016
2016 SE
2017 2017 2017
2017 SE
Difference: Difference:
# %
% Meeting or Exceeding
Expectations
# %
% Meeting or Exceeding
Expectations
# %
% Meeting or Exceeding
Expectations
2016 to 2017
2015 to 2017
Enrolled Tested Enrolled Tested Enrolled Tested % Meeting
or Exceeding Exp.
% Meeting or Exceeding
Exp.
Sherman ES 224 99 27.9 3 219 100 40.4 3.3 210 100 45.2 3.4 5 17
Warwick Neck ES
184 98 36.7 3.6 176 97 39.2 3.7 179 99 45.2 3.7 6 9
Wyman ES 180 91 29.3 3.6 169 100 33.7 3.6 153 99 46.7 4.0 13 17
Winman MS 522 92 22.5 1.9 479 99 28 2.1 537 97 19.9 1.7 -8 -3
Warwick Vets Mem. MS
n/a n/a n/a n/a n/a n/a n/a n/a 858 98 22.4 1.4 n/a n/a
West Warwick
Greenbush ES
174 99 25.6 3.3 175 97 31.2 3.6 198 99 29.6 3.3 -2 4
John F. Horgan ES
184 97 13.4 2.5 191 99 21.6 3 204 98 20.1 2.8 -1 7
Wakefield Hills ES
148 89 16.7 3.2 178 99 23.9 3.2 167 100 19.8 3.1 -4 3
John F. Deering MS
985 90 25.7 1.5 986 94 25.1 1.4 976 96 23.3 1.4 -2 -2
Westerly
Bradford ES 40 93 24.3 7.1 25 100 36 9.6 33 100 21.2 7.1 -15 -3
Dunn's Corners ES
122 96 49.6 4.6 121 100 57.9 4.5 109 98 64.5 4.6 7 15
Springbrook ES
141 96 21.3 3.5 146 99 40.7 4.1 131 99 43.1 4.3 2 22
State Street ES
127 94 47.5 4.6 131 100 58.8 4.3 138 100 54.3 4.2 -4 7
Westerly MS 879 91 21.8 1.5 841 99 31.9 1.6 858 99 30.8 1.6 -1 9
Woonsocket
Bernon Heights ES
227 97 27.1 3 253 98 31.6 3 240 99 31.5 3.0 0 4
Citizens Memorial ES
382 95 7.4 1.4 395 98 9.6 1.5 403 98 11.4 1.6 2 4
Globe Park ES
232 88 17.7 2.7 226 98 21.7 2.8 239 100 27.7 2.9 6 10
Harris ES 206 98 12.4 2.3 207 97 15 2.5 238 97 13.9 2.3 -1 1
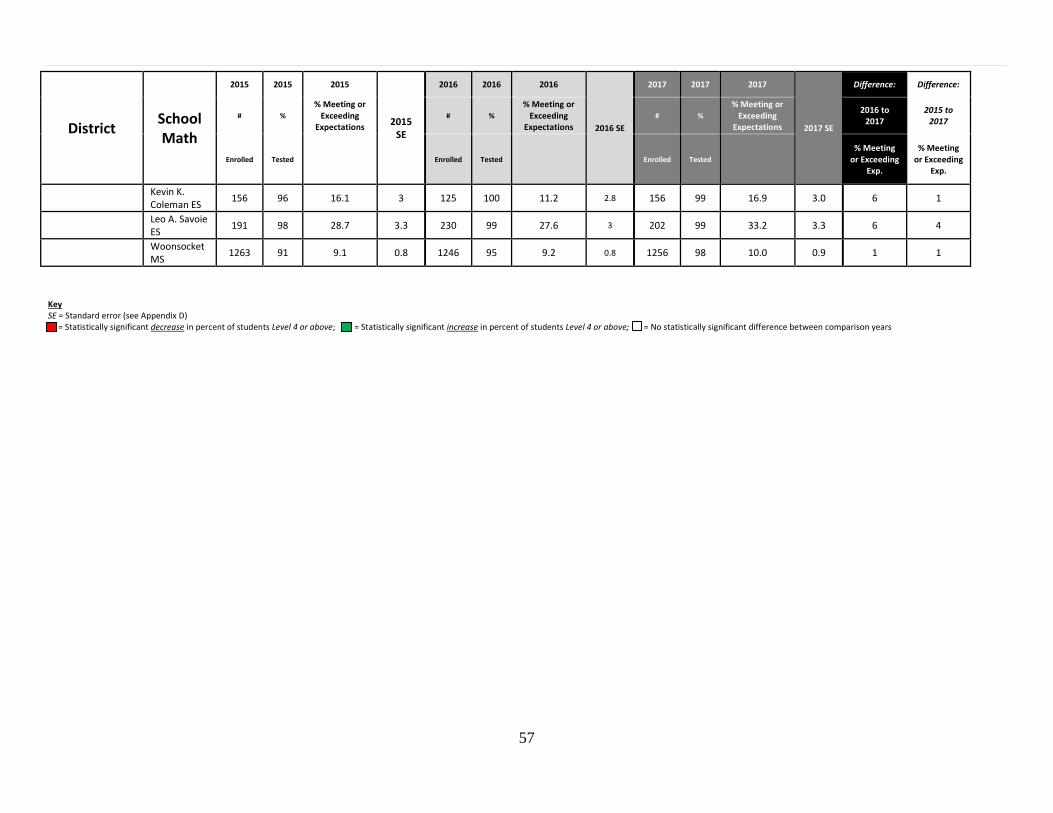
57
District School Math
2015 2015 2015
2015 SE
2016 2016 2016
2016 SE
2017 2017 2017
2017 SE
Difference: Difference:
# %
% Meeting or Exceeding
Expectations
# %
% Meeting or Exceeding
Expectations
# %
% Meeting or Exceeding
Expectations
2016 to 2017
2015 to 2017
Enrolled Tested Enrolled Tested Enrolled Tested % Meeting
or Exceeding Exp.
% Meeting or Exceeding
Exp.
Kevin K. Coleman ES
156 96 16.1 3 125 100 11.2 2.8 156 99 16.9 3.0 6 1
Leo A. Savoie ES
191 98 28.7 3.3 230 99 27.6 3 202 99 33.2 3.3 6 4
Woonsocket MS
1263 91 9.1 0.8 1246 95 9.2 0.8 1256 98 10.0 0.9 1 1
Key SE = Standard error (see Appendix D) = Statistically significant decrease in percent of students Level 4 or above; = Statistically significant increase in percent of students Level 4 or above; = No statistically significant difference between comparison years

58
High School ELA/Literacy and Mathematics 2017
The percent of students in each high school meeting or exceeding expectations from the 2017 PARCC ELA/Literacy and Mathematics assessment administration is shared in the table below. Because of the change in required high school tests administered during the 2017 administration, multiple years of school level data are not provided for comparison.
Table 13. PARCC ELA/Literacy and Mathematics: School Percent of Students Meeting or Exceeding Expectations: 2017
ELA/Literacy
Mathematics
District School
2017 2017 2017
2017 SE
2017 2017 2017
2017 SE # %
% Meeting or Exceeding
Expectations
# %
% Meeting or Exceeding
Expectations
Enrolled Tested
Enrolled Tested
Barrington Barrington HS 306 100 79.3 2.3
303 100 74.3 2.5
Beacon Charter Beacon Charter HS 56 95 49.1 6.9
58 100 22.4 5.5
Blackstone Acad. Blackstone Academy HS
83 100 13.3 3.7
83 100 3.6 2.0
Blackstone Valley Blackstone Valley Prep HS
95 99 61.7 5.0
94 100 43.6 5.1
Bristol-Warren Mt. Hope HS 212 96 71.6 3.2
235 94 31.1 1.7
Burrillville Burrillville HS 198 96 20.4 2.9
197 100 18.3 1.9
Central Falls Central Falls Sr. HS 142 93 11.4 2.8
177 92 5.6 0.8
Chariho Chariho Regional HS
241 100 66.3 3.1
244 100 58.6 3.2
The R.Y.S.E. School HS
33 91 13.3 6.2
31 97 6.7 4.6
Coventry Coventry HS 373 98 33.3 2.5
460 100 27.7 2.1
Cranston Cranston HS East 438 97 25.1 2.1
383 100 18.3 2.0
Cranston HS West 334 99 42.3 2.7
341 100 24.0 2.3
NEL/CPS Career Acad. HS
36 100 8.3 4.6
20 100 10.0 6.7
Cumberland Cumberland HS 359 96 37.3 2.6
315 99 21.5 2.3
Davies Career-Tech.
Davies Career-Tech. HS
221 100 33.9 3.2
231 93 14.9 2.4

59
ELA/Literacy
Mathematics
District School
2017 2017 2017
2017 SE
2017 2017 2017
2017 SE # %
% Meeting or Exceeding
Expectations
# %
% Meeting or Exceeding
Expectations
Enrolled Tested
Enrolled Tested
DCYF DCYF Alt. Ed. Program HS
7 0 - -
- - -
East Greenwich East Greenwich HS 179 96 70.3 3.5
162 100 70.4 3.6
East Providence East Providence HS 364 96 16.8 2.0
359 100 8.6 1.5
Exe.-W. Greenwich
Exeter-W. Greenwich HS
139 99 52.6 4.3
101 100 70.3 4.5
Foster-Glocester Ponaganset HS 169 96 41.4 3.9
199 100 20.6 2.9
Highlander Highlander Charter HS
30 97 10.3 5.7
28 100 14.3 6.6
Johnston Johnston Senior HS 248 98 19.3 2.5
231 98 10.1 2.0
Lincoln Lincoln Senior HS 235 94 48.6 3.4
224 99 43.4 3.3
MET Career & Tech.
MET Career & Tech. HS
160 99 16.4 2.9
163 99 6.2 1.9
Middletown Middletown HS 168 93 37.2 3.9
165 100 29.7 3.6
Narragansett Narragansett HS 91 99 58.9 5.2
142 100 38.0 4.1
New Shoreham Block Island MS + HS
24 100 45.8 10.2
27 93 28.0 9.0
Newport Rogers HS 165 89 12.2 2.7
145 99 9.8 2.5
North Kingstown N. Kingstown Senior HS
379 97 69.1 2.4
402 94 52.0 2.6
North Providence
North Providence HS
262 98 45.3 3.1
262 98 28.0 2.8
North Smithfield North Smithfield HS
144 99 64.8 4.0
135 100 47.4 4.3
Paul Cuffee Paul Cuffee Charter HS
59 98 41.4 6.5
59 97 21.1 5.4
Pawtucket J. M. Walsh HS 55 100 41.8 6.7
55 100 16.4 5.0
Shea Senior HS 187 97 20.4 3.0
202 100 8.5 2.0
Tolman Senior HS 223 97 11.1 2.1
236 100 6.4 1.6

60
ELA/Literacy
Mathematics
District School
2017 2017 2017
2017 SE
2017 2017 2017
2017 SE # %
% Meeting or Exceeding
Expectations
# %
% Meeting or Exceeding
Expectations
Enrolled Tested
Enrolled Tested
Portsmouth Portsmouth HS 249 99 38.9 3.1
236 100 43.6 3.2
Providence 360 HS 76 91 7.2 3.1
82 100 2.4 1.7
ACES HS 49 98 16.7 5.4
54 98 3.8 2.6
Central HS 251 95 5.9 1.5
398 100 2.8 0.8
Classical HS 274 99 57.2 3.0
286 100 50.7 3.0
Dr. Jorge Alvarez HS
159 91 2.1 1.2
186 97 0.6 0.6
E-Cubed Acad. HS 86 94 12.3 3.7
110 100 3.6 1.8
Evolutions HS 80 89 5.6 2.7
83 100 0.0 0.0
Hope HS 193 91 2.9 1.3
252 93 1.7 0.8
Mount Pleasant HS 177 97 7.0 1.9
235 99 3.0 1.1
Prov. Career & Tech. HS
182 100 4.9 1.6
182 100 1.6 0.9
Times2 Academy HS
67 100 19.4 4.8
69 100 1.4 1.4
W. B. Cooley Senior HS
149 95 5.0 1.8
199 99 0.0 0.0
RI Nurses Institute
RI Nurses Institute HS
68 96 9.2 3.6
78 97 2.6 1.8
RI Sch. for the Deaf
RI Sch. for the Deaf HS
6 33 - -
6 100 - -
Scituate Scituate HS 100 100 47.0 5.0
81 99 32.5 5.2
Sheila Skip Nowell
Nowell Acad. I HS 6 100 - -
16 75 - -
Nowell Acad. II HS 3 67 - -
18 78 - -
Smithfield Smithfield Senior HS
186 86 50.0 4.0
162 97 33.1 1.2
South Kingstown South Kingstown HS
239 100 42.0 3.2
241 100 41.9 3.2
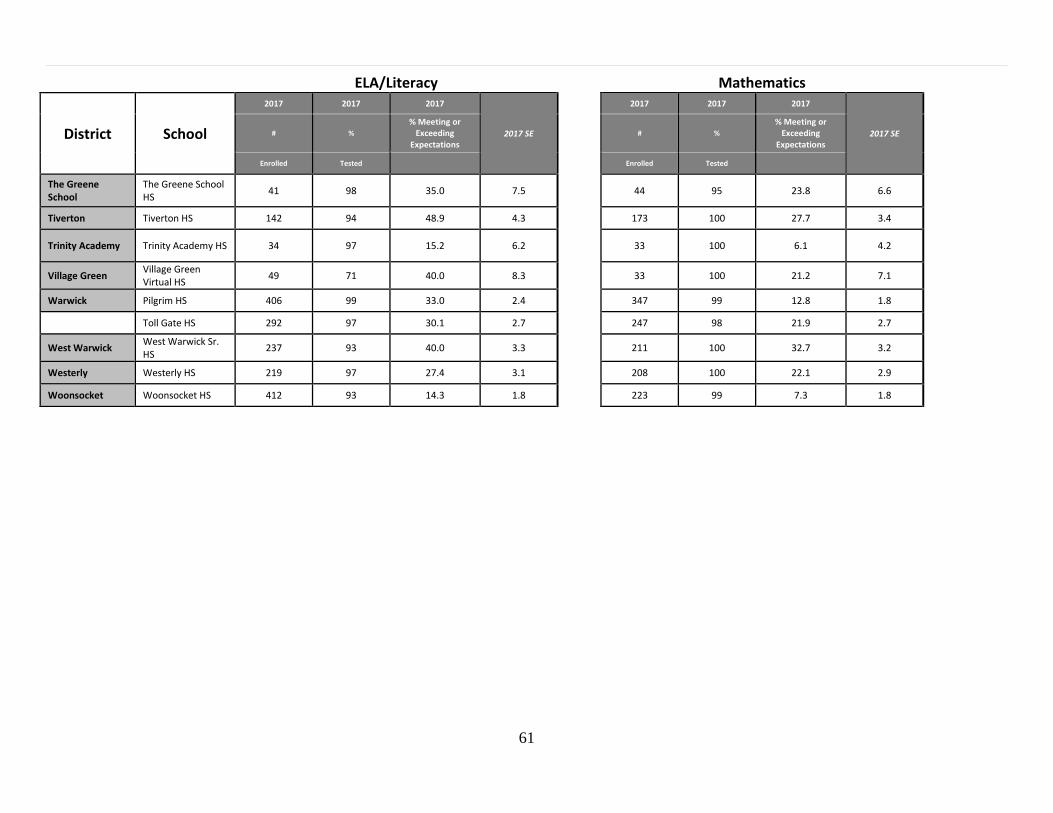
61
ELA/Literacy
Mathematics
District School
2017 2017 2017
2017 SE
2017 2017 2017
2017 SE # %
% Meeting or Exceeding
Expectations
# %
% Meeting or Exceeding
Expectations
Enrolled Tested
Enrolled Tested
The Greene School
The Greene School HS
41 98 35.0 7.5
44 95 23.8 6.6
Tiverton Tiverton HS 142 94 48.9 4.3
173 100 27.7 3.4
Trinity Academy Trinity Academy HS 34 97 15.2 6.2
33 100 6.1 4.2
Village Green Village Green Virtual HS
49 71 40.0 8.3
33 100 21.2 7.1
Warwick Pilgrim HS 406 99 33.0 2.4
347 99 12.8 1.8
Toll Gate HS 292 97 30.1 2.7
247 98 21.9 2.7
West Warwick West Warwick Sr. HS
237 93 40.0 3.3
211 100 32.7 3.2
Westerly Westerly HS 219 97 27.4 3.1
208 100 22.1 2.9
Woonsocket Woonsocket HS 412 93 14.3 1.8
223 99 7.3 1.8

62
PSAT/NMSQT AND SAT SCHOOL DAY RESULTS PSAT-NMSQT and SAT Statewide Results
The 2016-2017 school year was the first statewide administration of PSAT/NMSQT and SAT School Day. The PSAT/NMSQT and SAT provide section scores in Evidence-Based Reading and Writing (EBRW) and Mathematics as well as a total score. Section scores on the PSAT/NMSQT for EBRW and Mathematics range from 160–760 and the total score ranges from 320 -1520. Benchmarks are the scores that represent college readiness. The PSAT/NMSQT college readiness benchmark is 430 for EBRW and 480 for Mathematics. Section scores on the SAT School Day for EBRW and Mathematics range from 200–800 and the total score ranges from 400 -1600. The SAT School Day college readiness benchmark is 480 for EBRW and 530 for Mathematics.
The PSAT/NMSQT was administered October 2016 in 63 Rhode Island schools. This represented 75% of all 10th grade students eligible to take the assessment in Rhode Island schools. Of the 75% of students who participated, 31% are on track to meet the “College and Career Ready” benchmark in both EBRW and Mathematics. As a state, 56% of participating students are considered on track to meet the college and career readiness benchmark for EBRW and 34% for Mathematics.
In April 2017, 79% of Rhode Island grade 11 students participated in the SAT School Day. Of the 79% of students who participated, 32% met the SAT College and Career Ready benchmark in both EBRW and Mathematics. 56% of participating students met the college and career readiness benchmark for EBRW and 34% for Mathematics.
Figure 14. 2017 PSAT/NMSQT Statewide Results Figure 15. 2017 School Day SAT Statewide Results
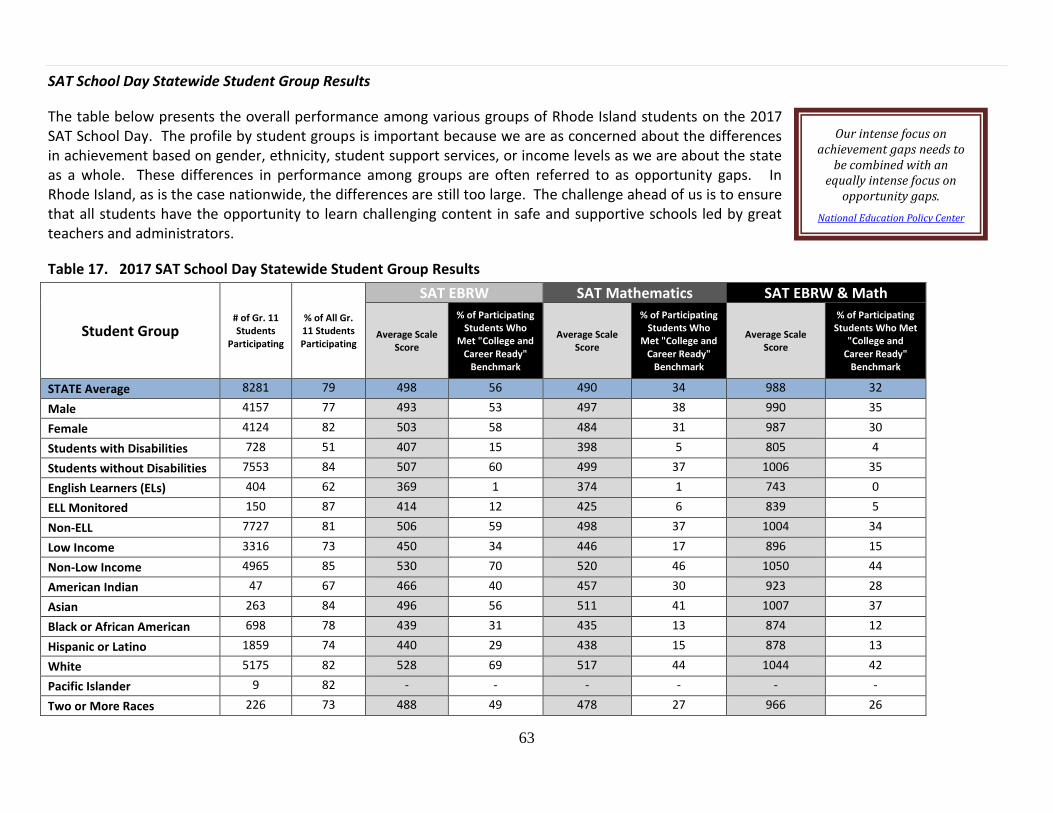
63
SAT School Day Statewide Student Group Results
The table below presents the overall performance among various groups of Rhode Island students on the 2017 SAT School Day. The profile by student groups is important because we are as concerned about the differences in achievement based on gender, ethnicity, student support services, or income levels as we are about the state as a whole. These differences in performance among groups are often referred to as opportunity gaps. In Rhode Island, as is the case nationwide, the differences are still too large. The challenge ahead of us is to ensure that all students have the opportunity to learn challenging content in safe and supportive schools led by great teachers and administrators.
Table 17. 2017 SAT School Day Statewide Student Group Results
Student Group # of Gr. 11 Students
Participating
% of All Gr. 11 Students Participating
SAT EBRW SAT Mathematics SAT EBRW & Math
Average Scale Score
% of Participating Students Who
Met "College and Career Ready"
Benchmark
Average Scale Score
% of Participating Students Who
Met "College and Career Ready"
Benchmark
Average Scale Score
% of Participating Students Who Met
"College and Career Ready"
Benchmark
STATE Average 8281 79 498 56 490 34 988 32
Male 4157 77 493 53 497 38 990 35
Female 4124 82 503 58 484 31 987 30
Students with Disabilities 728 51 407 15 398 5 805 4
Students without Disabilities 7553 84 507 60 499 37 1006 35
English Learners (ELs) 404 62 369 1 374 1 743 0
ELL Monitored 150 87 414 12 425 6 839 5
Non-ELL 7727 81 506 59 498 37 1004 34
Low Income 3316 73 450 34 446 17 896 15
Non-Low Income 4965 85 530 70 520 46 1050 44
American Indian 47 67 466 40 457 30 923 28
Asian 263 84 496 56 511 41 1007 37
Black or African American 698 78 439 31 435 13 874 12
Hispanic or Latino 1859 74 440 29 438 15 878 13
White 5175 82 528 69 517 44 1044 42
Pacific Islander 9 82 - - - - - -
Two or More Races 226 73 488 49 478 27 966 26
Our intense focus on achievement gaps needs to
be combined with an equally intense focus on
opportunity gaps.
National Education Policy Center
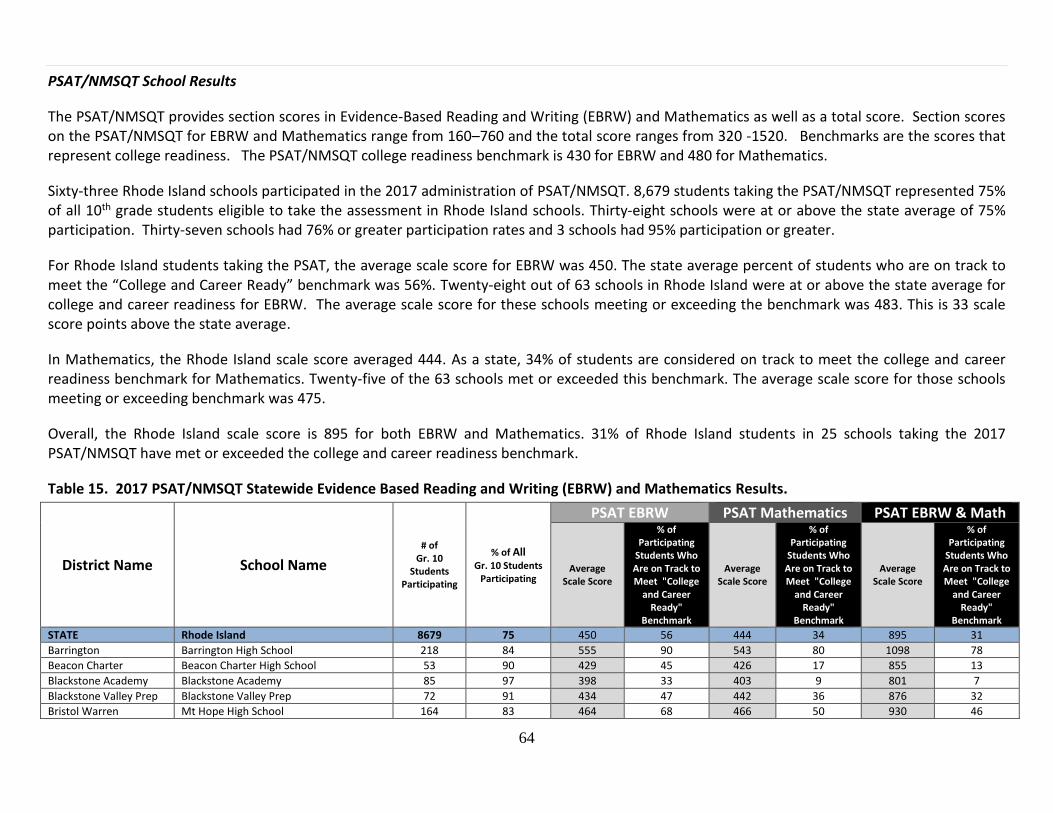
64
PSAT/NMSQT School Results
The PSAT/NMSQT provides section scores in Evidence-Based Reading and Writing (EBRW) and Mathematics as well as a total score. Section scores on the PSAT/NMSQT for EBRW and Mathematics range from 160–760 and the total score ranges from 320 -1520. Benchmarks are the scores that represent college readiness. The PSAT/NMSQT college readiness benchmark is 430 for EBRW and 480 for Mathematics.
Sixty-three Rhode Island schools participated in the 2017 administration of PSAT/NMSQT. 8,679 students taking the PSAT/NMSQT represented 75% of all 10th grade students eligible to take the assessment in Rhode Island schools. Thirty-eight schools were at or above the state average of 75% participation. Thirty-seven schools had 76% or greater participation rates and 3 schools had 95% participation or greater.
For Rhode Island students taking the PSAT, the average scale score for EBRW was 450. The state average percent of students who are on track to meet the “College and Career Ready” benchmark was 56%. Twenty-eight out of 63 schools in Rhode Island were at or above the state average for college and career readiness for EBRW. The average scale score for these schools meeting or exceeding the benchmark was 483. This is 33 scale score points above the state average.
In Mathematics, the Rhode Island scale score averaged 444. As a state, 34% of students are considered on track to meet the college and career readiness benchmark for Mathematics. Twenty-five of the 63 schools met or exceeded this benchmark. The average scale score for those schools meeting or exceeding benchmark was 475.
Overall, the Rhode Island scale score is 895 for both EBRW and Mathematics. 31% of Rhode Island students in 25 schools taking the 2017 PSAT/NMSQT have met or exceeded the college and career readiness benchmark.
Table 15. 2017 PSAT/NMSQT Statewide Evidence Based Reading and Writing (EBRW) and Mathematics Results.
District Name School Name
# of Gr. 10
Students Participating
% of All Gr. 10 Students
Participating
PSAT EBRW PSAT Mathematics PSAT EBRW & Math
Average Scale Score
% of Participating
Students Who Are on Track to Meet "College
and Career Ready"
Benchmark
Average Scale Score
% of Participating
Students Who Are on Track to Meet "College
and Career Ready"
Benchmark
Average Scale Score
% of Participating
Students Who Are on Track to Meet "College
and Career Ready"
Benchmark
STATE Rhode Island 8679 75 450 56 444 34 895 31
Barrington Barrington High School 218 84 555 90 543 80 1098 78
Beacon Charter Beacon Charter High School 53 90 429 45 426 17 855 13
Blackstone Academy Blackstone Academy 85 97 398 33 403 9 801 7
Blackstone Valley Prep Blackstone Valley Prep 72 91 434 47 442 36 876 32
Bristol Warren Mt Hope High School 164 83 464 68 466 50 930 46
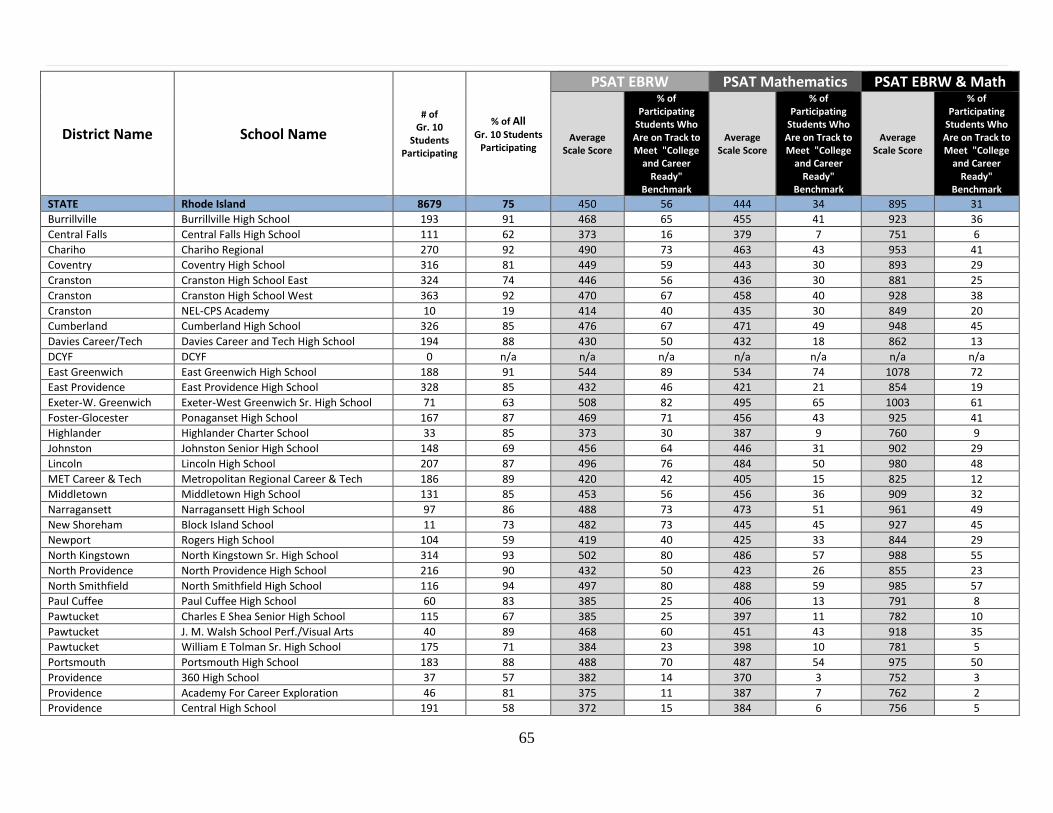
65
District Name School Name
# of Gr. 10
Students Participating
% of All Gr. 10 Students
Participating
PSAT EBRW PSAT Mathematics PSAT EBRW & Math
Average Scale Score
% of Participating
Students Who Are on Track to Meet "College
and Career Ready"
Benchmark
Average Scale Score
% of Participating
Students Who Are on Track to Meet "College
and Career Ready"
Benchmark
Average Scale Score
% of Participating
Students Who Are on Track to Meet "College
and Career Ready"
Benchmark
STATE Rhode Island 8679 75 450 56 444 34 895 31
Burrillville Burrillville High School 193 91 468 65 455 41 923 36
Central Falls Central Falls High School 111 62 373 16 379 7 751 6
Chariho Chariho Regional 270 92 490 73 463 43 953 41
Coventry Coventry High School 316 81 449 59 443 30 893 29
Cranston Cranston High School East 324 74 446 56 436 30 881 25
Cranston Cranston High School West 363 92 470 67 458 40 928 38
Cranston NEL-CPS Academy 10 19 414 40 435 30 849 20
Cumberland Cumberland High School 326 85 476 67 471 49 948 45
Davies Career/Tech Davies Career and Tech High School 194 88 430 50 432 18 862 13
DCYF DCYF 0 n/a n/a n/a n/a n/a n/a n/a
East Greenwich East Greenwich High School 188 91 544 89 534 74 1078 72
East Providence East Providence High School 328 85 432 46 421 21 854 19
Exeter-W. Greenwich Exeter-West Greenwich Sr. High School 71 63 508 82 495 65 1003 61
Foster-Glocester Ponaganset High School 167 87 469 71 456 43 925 41
Highlander Highlander Charter School 33 85 373 30 387 9 760 9
Johnston Johnston Senior High School 148 69 456 64 446 31 902 29
Lincoln Lincoln High School 207 87 496 76 484 50 980 48
MET Career & Tech Metropolitan Regional Career & Tech 186 89 420 42 405 15 825 12
Middletown Middletown High School 131 85 453 56 456 36 909 32
Narragansett Narragansett High School 97 86 488 73 473 51 961 49
New Shoreham Block Island School 11 73 482 73 445 45 927 45
Newport Rogers High School 104 59 419 40 425 33 844 29
North Kingstown North Kingstown Sr. High School 314 93 502 80 486 57 988 55
North Providence North Providence High School 216 90 432 50 423 26 855 23
North Smithfield North Smithfield High School 116 94 497 80 488 59 985 57
Paul Cuffee Paul Cuffee High School 60 83 385 25 406 13 791 8
Pawtucket Charles E Shea Senior High School 115 67 385 25 397 11 782 10
Pawtucket J. M. Walsh School Perf./Visual Arts 40 89 468 60 451 43 918 35
Pawtucket William E Tolman Sr. High School 175 71 384 23 398 10 781 5
Portsmouth Portsmouth High School 183 88 488 70 487 54 975 50
Providence 360 High School 37 57 382 14 370 3 752 3
Providence Academy For Career Exploration 46 81 375 11 387 7 762 2
Providence Central High School 191 58 372 15 384 6 756 5
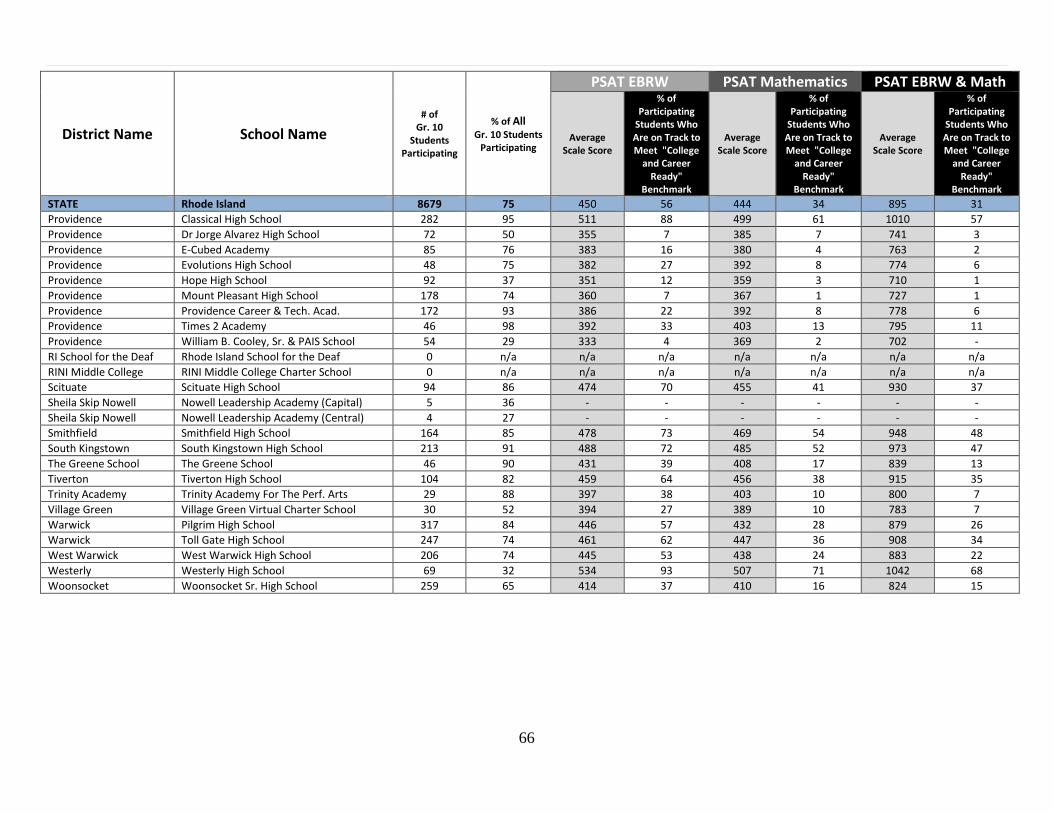
66
District Name School Name
# of Gr. 10
Students Participating
% of All Gr. 10 Students
Participating
PSAT EBRW PSAT Mathematics PSAT EBRW & Math
Average Scale Score
% of Participating
Students Who Are on Track to Meet "College
and Career Ready"
Benchmark
Average Scale Score
% of Participating
Students Who Are on Track to Meet "College
and Career Ready"
Benchmark
Average Scale Score
% of Participating
Students Who Are on Track to Meet "College
and Career Ready"
Benchmark
STATE Rhode Island 8679 75 450 56 444 34 895 31
Providence Classical High School 282 95 511 88 499 61 1010 57
Providence Dr Jorge Alvarez High School 72 50 355 7 385 7 741 3
Providence E-Cubed Academy 85 76 383 16 380 4 763 2
Providence Evolutions High School 48 75 382 27 392 8 774 6
Providence Hope High School 92 37 351 12 359 3 710 1
Providence Mount Pleasant High School 178 74 360 7 367 1 727 1
Providence Providence Career & Tech. Acad. 172 93 386 22 392 8 778 6
Providence Times 2 Academy 46 98 392 33 403 13 795 11
Providence William B. Cooley, Sr. & PAIS School 54 29 333 4 369 2 702 -
RI School for the Deaf Rhode Island School for the Deaf 0 n/a n/a n/a n/a n/a n/a n/a
RINI Middle College RINI Middle College Charter School 0 n/a n/a n/a n/a n/a n/a n/a
Scituate Scituate High School 94 86 474 70 455 41 930 37
Sheila Skip Nowell Nowell Leadership Academy (Capital) 5 36 - - - - - -
Sheila Skip Nowell Nowell Leadership Academy (Central) 4 27 - - - - - -
Smithfield Smithfield High School 164 85 478 73 469 54 948 48
South Kingstown South Kingstown High School 213 91 488 72 485 52 973 47
The Greene School The Greene School 46 90 431 39 408 17 839 13
Tiverton Tiverton High School 104 82 459 64 456 38 915 35
Trinity Academy Trinity Academy For The Perf. Arts 29 88 397 38 403 10 800 7
Village Green Village Green Virtual Charter School 30 52 394 27 389 10 783 7
Warwick Pilgrim High School 317 84 446 57 432 28 879 26
Warwick Toll Gate High School 247 74 461 62 447 36 908 34
West Warwick West Warwick High School 206 74 445 53 438 24 883 22
Westerly Westerly High School 69 32 534 93 507 71 1042 68
Woonsocket Woonsocket Sr. High School 259 65 414 37 410 16 824 15
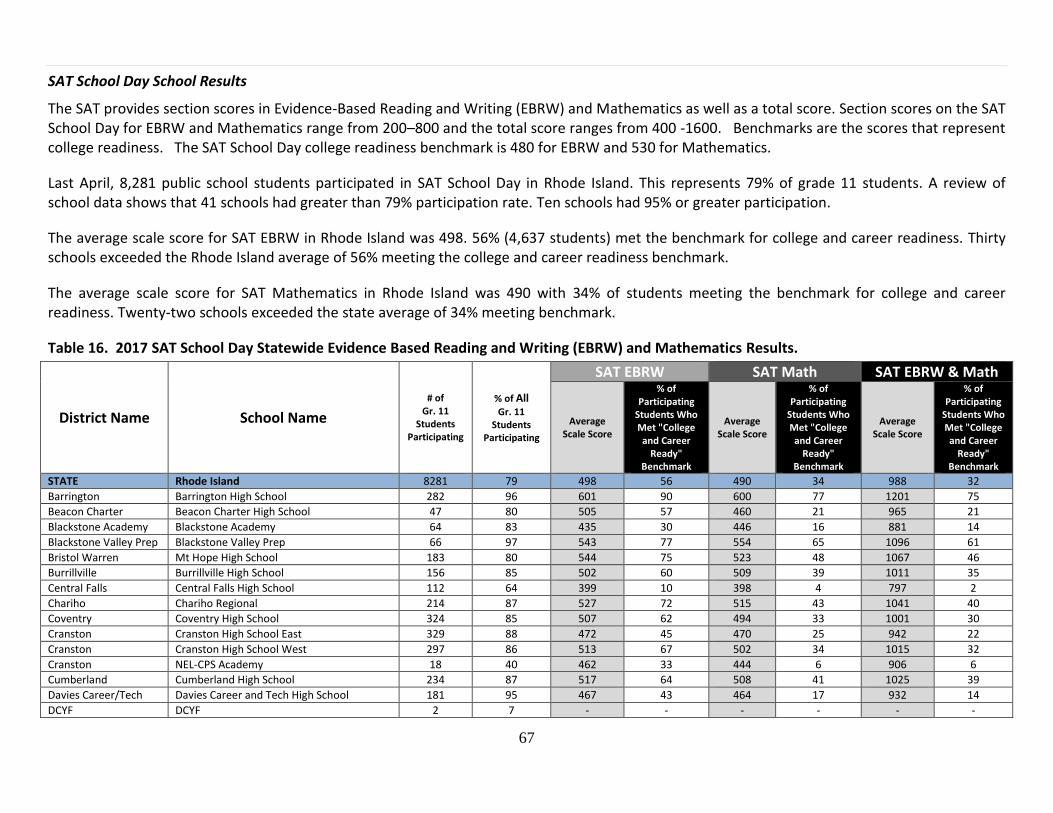
67
SAT School Day School Results
The SAT provides section scores in Evidence-Based Reading and Writing (EBRW) and Mathematics as well as a total score. Section scores on the SAT School Day for EBRW and Mathematics range from 200–800 and the total score ranges from 400 -1600. Benchmarks are the scores that represent college readiness. The SAT School Day college readiness benchmark is 480 for EBRW and 530 for Mathematics.
Last April, 8,281 public school students participated in SAT School Day in Rhode Island. This represents 79% of grade 11 students. A review of school data shows that 41 schools had greater than 79% participation rate. Ten schools had 95% or greater participation.
The average scale score for SAT EBRW in Rhode Island was 498. 56% (4,637 students) met the benchmark for college and career readiness. Thirty schools exceeded the Rhode Island average of 56% meeting the college and career readiness benchmark.
The average scale score for SAT Mathematics in Rhode Island was 490 with 34% of students meeting the benchmark for college and career readiness. Twenty-two schools exceeded the state average of 34% meeting benchmark.
Table 16. 2017 SAT School Day Statewide Evidence Based Reading and Writing (EBRW) and Mathematics Results.
District Name School Name
# of Gr. 11
Students Participating
% of All Gr. 11
Students Participating
SAT EBRW SAT Math SAT EBRW & Math
Average Scale Score
% of Participating
Students Who Met "College and Career
Ready" Benchmark
Average Scale Score
% of Participating
Students Who Met "College and Career
Ready" Benchmark
Average Scale Score
% of Participating
Students Who Met "College and Career
Ready" Benchmark
STATE Rhode Island 8281 79 498 56 490 34 988 32
Barrington Barrington High School 282 96 601 90 600 77 1201 75
Beacon Charter Beacon Charter High School 47 80 505 57 460 21 965 21
Blackstone Academy Blackstone Academy 64 83 435 30 446 16 881 14
Blackstone Valley Prep Blackstone Valley Prep 66 97 543 77 554 65 1096 61
Bristol Warren Mt Hope High School 183 80 544 75 523 48 1067 46
Burrillville Burrillville High School 156 85 502 60 509 39 1011 35
Central Falls Central Falls High School 112 64 399 10 398 4 797 2
Chariho Chariho Regional 214 87 527 72 515 43 1041 40
Coventry Coventry High School 324 85 507 62 494 33 1001 30
Cranston Cranston High School East 329 88 472 45 470 25 942 22
Cranston Cranston High School West 297 86 513 67 502 34 1015 32
Cranston NEL-CPS Academy 18 40 462 33 444 6 906 6
Cumberland Cumberland High School 234 87 517 64 508 41 1025 39
Davies Career/Tech Davies Career and Tech High School 181 95 467 43 464 17 932 14
DCYF DCYF 2 7 - - - - - -
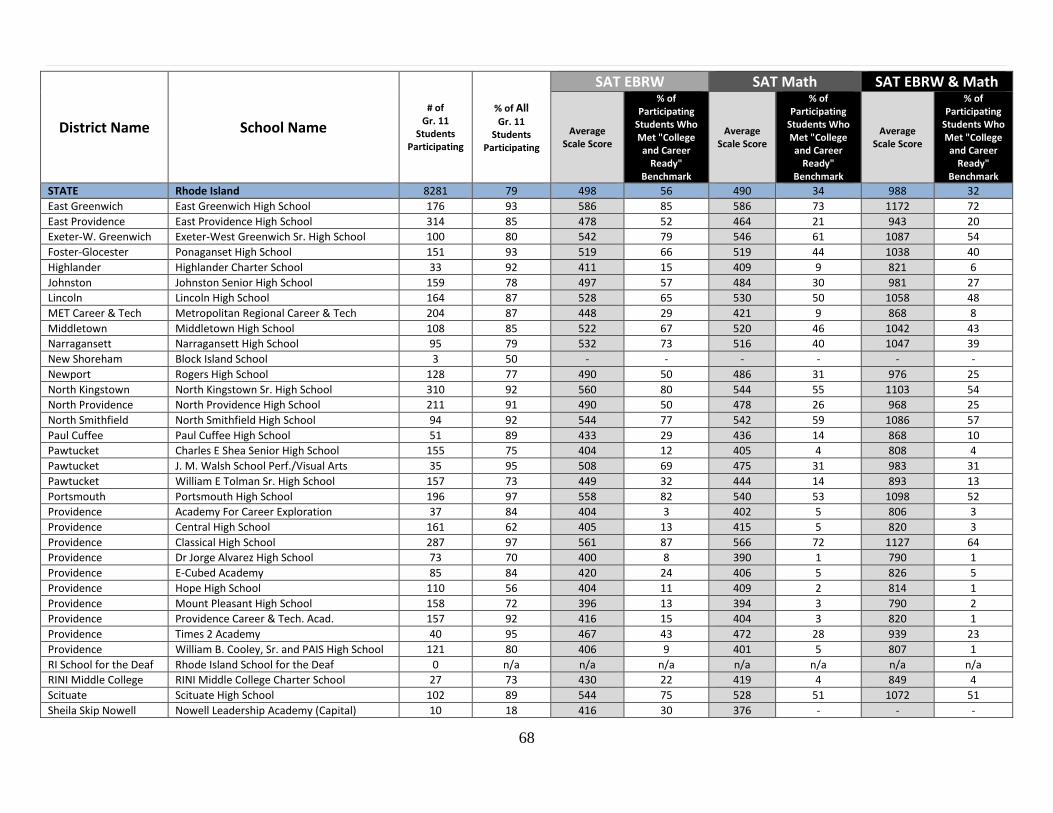
68
District Name School Name
# of Gr. 11
Students Participating
% of All Gr. 11
Students Participating
SAT EBRW SAT Math SAT EBRW & Math
Average Scale Score
% of Participating
Students Who Met "College and Career
Ready" Benchmark
Average Scale Score
% of Participating
Students Who Met "College and Career
Ready" Benchmark
Average Scale Score
% of Participating
Students Who Met "College and Career
Ready" Benchmark
STATE Rhode Island 8281 79 498 56 490 34 988 32
East Greenwich East Greenwich High School 176 93 586 85 586 73 1172 72
East Providence East Providence High School 314 85 478 52 464 21 943 20
Exeter-W. Greenwich Exeter-West Greenwich Sr. High School 100 80 542 79 546 61 1087 54
Foster-Glocester Ponaganset High School 151 93 519 66 519 44 1038 40
Highlander Highlander Charter School 33 92 411 15 409 9 821 6
Johnston Johnston Senior High School 159 78 497 57 484 30 981 27
Lincoln Lincoln High School 164 87 528 65 530 50 1058 48
MET Career & Tech Metropolitan Regional Career & Tech 204 87 448 29 421 9 868 8
Middletown Middletown High School 108 85 522 67 520 46 1042 43
Narragansett Narragansett High School 95 79 532 73 516 40 1047 39
New Shoreham Block Island School 3 50 - - - - - -
Newport Rogers High School 128 77 490 50 486 31 976 25
North Kingstown North Kingstown Sr. High School 310 92 560 80 544 55 1103 54
North Providence North Providence High School 211 91 490 50 478 26 968 25
North Smithfield North Smithfield High School 94 92 544 77 542 59 1086 57
Paul Cuffee Paul Cuffee High School 51 89 433 29 436 14 868 10
Pawtucket Charles E Shea Senior High School 155 75 404 12 405 4 808 4
Pawtucket J. M. Walsh School Perf./Visual Arts 35 95 508 69 475 31 983 31
Pawtucket William E Tolman Sr. High School 157 73 449 32 444 14 893 13
Portsmouth Portsmouth High School 196 97 558 82 540 53 1098 52
Providence Academy For Career Exploration 37 84 404 3 402 5 806 3
Providence Central High School 161 62 405 13 415 5 820 3
Providence Classical High School 287 97 561 87 566 72 1127 64
Providence Dr Jorge Alvarez High School 73 70 400 8 390 1 790 1
Providence E-Cubed Academy 85 84 420 24 406 5 826 5
Providence Hope High School 110 56 404 11 409 2 814 1
Providence Mount Pleasant High School 158 72 396 13 394 3 790 2
Providence Providence Career & Tech. Acad. 157 92 416 15 404 3 820 1
Providence Times 2 Academy 40 95 467 43 472 28 939 23
Providence William B. Cooley, Sr. and PAIS High School 121 80 406 9 401 5 807 1
RI School for the Deaf Rhode Island School for the Deaf 0 n/a n/a n/a n/a n/a n/a n/a
RINI Middle College RINI Middle College Charter School 27 73 430 22 419 4 849 4
Scituate Scituate High School 102 89 544 75 528 51 1072 51
Sheila Skip Nowell Nowell Leadership Academy (Capital) 10 18 416 30 376 - - -
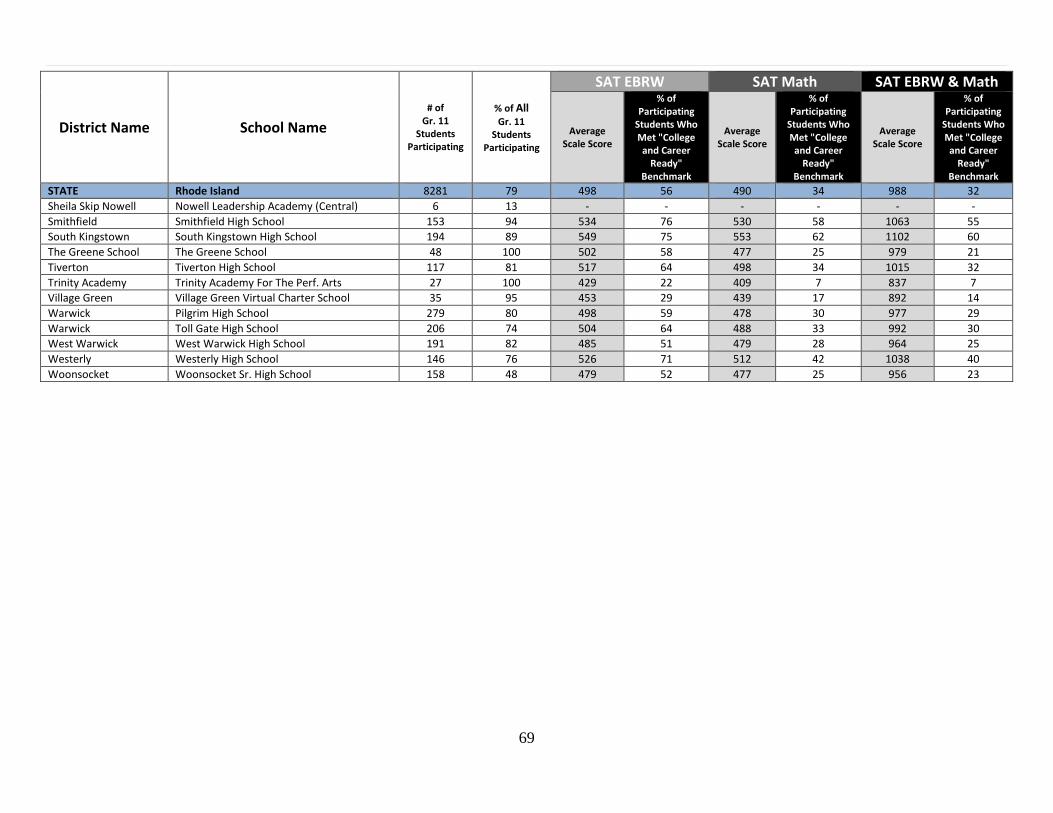
69
District Name School Name
# of Gr. 11
Students Participating
% of All Gr. 11
Students Participating
SAT EBRW SAT Math SAT EBRW & Math
Average Scale Score
% of Participating
Students Who Met "College and Career
Ready" Benchmark
Average Scale Score
% of Participating
Students Who Met "College and Career
Ready" Benchmark
Average Scale Score
% of Participating
Students Who Met "College and Career
Ready" Benchmark
STATE Rhode Island 8281 79 498 56 490 34 988 32
Sheila Skip Nowell Nowell Leadership Academy (Central) 6 13 - - - - - -
Smithfield Smithfield High School 153 94 534 76 530 58 1063 55
South Kingstown South Kingstown High School 194 89 549 75 553 62 1102 60
The Greene School The Greene School 48 100 502 58 477 25 979 21
Tiverton Tiverton High School 117 81 517 64 498 34 1015 32
Trinity Academy Trinity Academy For The Perf. Arts 27 100 429 22 409 7 837 7
Village Green Village Green Virtual Charter School 35 95 453 29 439 17 892 14
Warwick Pilgrim High School 279 80 498 59 478 30 977 29
Warwick Toll Gate High School 206 74 504 64 488 33 992 30
West Warwick West Warwick High School 191 82 485 51 479 28 964 25
Westerly Westerly High School 146 76 526 71 512 42 1038 40
Woonsocket Woonsocket Sr. High School 158 48 479 52 477 25 956 23

P a g e | 70
70
APPENDICES
Page
Appendix A: Clarifying Information 71
Appendix B: Performance Level Descriptors 73
Appendix C: Split-Level Schools
75
Appendix D: Calculating Standard Error (SE) to Determine Statistical Significance of Differences 76
P a g e | 71
71
APPENDIX A
Clarifying Information
“Minimum Cell Size” Reporting Policy
RIDE Policy on minimum cell size for reporting data stipulates that if the number of students is less than 10 or if 100% of students performed at the same level (e.g. all students were at Level 2), then data must be suppressed to ensure confidentiality of individual student results. Throughout this report, cells with a dash (-) indicate that the number of students included in calculations was less than 10 or all students performed the same. PARCC Performance Levels
Based on the spring 2015 assessments, educators and experts were convened to determine what score each student must earn on the assessment in order to achieve a particular performance level. Performance levels help determine whether a student is on-track with grade-level expectations. To review the specific ELA/Literacy descriptors, go to: http://parcconline.org/assessments/test-design/ela-literacy/ela-performance-level-descriptors To review the specific Mathematics descriptors, go to: http://parcconline.org/assessments/test-design/mathematics/math-performance-level-descriptors PARCC uses five performance levels that delineate the knowledge, skills, and practices students are able to demonstrate:
o Level 1: Did not yet meet expectations o Level 2: Partially met expectations o Level 3: Approached expectations o Level 4: Met expectations. o Level 5: Exceeded expectations
A student performing at Level 4 or Level 5 met or exceeded grade-level expectations and demonstrated a strong grasp of grade-level standards and readiness for the next step in a his/her educational development. Scores on the PARCC assessments will range from 650 to 850, with a 700 representing the threshold of Level 2, 725 representing the threshold of Level 3, and 750 representing the threshold of Level 4. The threshold score for Level 5 will vary slightly by assessment and will be approximately 800.
P a g e | 72
72
A variety of stakeholders, nominated by the states, participated in panels to review the assessments. To determine what range of scores best matches each performance level, panelists used performance level descriptors for English language arts/literacy and Mathematics that indicate what a typical student at each level should know based on his/her command of grade-level standards. They used the performance level descriptors and actual assessment results and compared them to empirical studies to make their judgments. Each group went through at least three rounds of review per assessment to develop the "threshold scores," also known as "cut scores," for each performance level. Two research studies helped determine the percentage of students likely to be college-and career-ready and the percentage of students likely to be on track for the next academic level at earlier grades: a postsecondary faculty judgment study; and a benchmark study of the SAT, ACT, NAEP, TIMSS, and PISA assessments. Download additional information about the PARCC Performance Levels: Setting Performance Levels for the PARCC Assessment College and Career Readiness Benchmarks on SAT Suite of Assessments
Students are considered college- and career-ready when their SAT section scores meet both the Mathematics and the Evidence-Based Reading and Writing benchmarks. It is important to note that college readiness is a continuum — students scoring below the SAT benchmarks can still be successful in college, especially with additional preparation and perseverance. Students with an SAT Mathematics section score that meets or exceeds the benchmark have a 75% chance of earning at least a C in first-semester, credit-bearing college courses in algebra, statistics, pre-calculus, or calculus. Students with an SAT Evidence-Based Reading and Writing (ERW) section score that meets or exceeds the benchmark have a 75% chance of earning at least a C in first-semester, credit-bearing college courses in history, literature, social sciences, or writing classes. Students who took the PSAT/NMSQT saw grade-level benchmarks on their score reports. Grade-level benchmarks indicate whether students are on track for college and career readiness. They are based on expected student growth toward SAT benchmarks at each grade. The benchmarks used in this report were:
SAT School Day Benchmarks o Evidence-Based Reading and Writing: 480 o Mathematics: 530
PSAT/NMSQT Benchmarks o Evidence-Based Reading and Writing: 430 o Mathematics: 480
P a g e | 73
73
APPENDIX B
PARCC Performance Level Descriptors (PLDs)
PARCC Performance Level Descriptors
Performance level descriptors (PLDs) outline the knowledge, skills, and practices that students performing at any given level should be able to demonstrate in each content area at each grade level to signal that they are academically prepared to engage successfully in further studies in each content area, the next grade's material and, later, at the high school-level for students to demonstrate that they are college and career ready. English Language Arts/Literacy (ELA/Literacy) PLDs: Grades 3-9
Performance level descriptors (PLDs) describe what student performance looks like at four levels: partial command of the content; moderate command; strong command; and distinguished command. In English Language Arts/Literacy, the performance levels at each grade level are written for the two assessment claims of reading and writing. Reading Claim
For the reading claim, the performance levels at each grade level are differentiated by three factors:
1. Text complexity
2. The range of accuracy in expressing reading comprehension demonstrated in student responses; and
3. The quality of evidence cited from sources read
This is an innovative departure from how ELA/Literacy performance level descriptors have been written in the past, but reflective of the Common Core's emphasis on a student's ability to find text-based evidence for generalizations, conclusions, or inferences drawn. Writing Claim
For the writing claim, PLDs are written for the two sub-claims:
1. Written expression
2. Knowledge of language and conventions.
P a g e | 74
74
Factors differentiating the performance levels for writing include how consistently and fully students develop ideas, including when drawing evidence from one or more sources, how well they organize their writing, and their command of grammar and language usage. Below are links to each grade level descriptor:
PARCC Grade 3 Performance Level Descriptors
PARCC Grade 4 Performance Level Descriptors
PARCC Grade 5 Performance Level Descriptors
PARCC Grade 6 Performance Level Descriptors
PARCC Grade 7 Performance Level Descriptors
PARCC Grade 8 Performance Level Descriptors
PARCC Grade 9 Performance Level Descriptors
PARCC Grade 10 Performance Level Descriptors
Mathematics PLDs: Grades 3-8, Algebra I, Geometry, and Algebra II
Performance level descriptors (PLDs) describe what student performance looks like at four levels: partial command of the content; adequate command; strong command; and distinguished command.
In Mathematics, the performance levels at each grade level are written for each of four assessment sub-claims:
1. Major content
2. Additional and supporting content
3. Reasoning
4. Modeling
The performance levels within each claim area are differentiated by a number of factors consistent with the Common Core’s inclusion of standards for both mathematical content and mathematical practices.
Performance-Level Descriptors by Grade Band:
PARCC Mathematics Performance Level Descriptors: Grades 3-5
PARCC Mathematics Performance Level Descriptors: Grades 6-8
PARCC Mathematics Performance Level Descriptors: High School
P a g e | 75
75
APPENDIX C
Split-Level Schools for PARCC Reporting
Throughout this report, grades 3, 4, and 5 are generally classified as “elementary school” grades whereas grades 6, 7, and 8 are classified as “middle school” and grades 9, 10, and 11 as “high school.” In cases where a school spans more than one level of schooling (e.g. elementary and middle)—such as with schools that are K-12 -RIDE divided the grades within the school using the above classification rules or by using classifications set by the local education agency (LEA) for accountability purposes. Below is a list of the schools with grades that span more than one school level and how each was designated for the purposes of this report. Block Island School, New Shoreham Elementary Grades 3, 4, 5, 6, 7 High Grades 8, 9, 10, 11 Highlander Charter School Elementary Grades 3, 4, 5 Middle Grades 6, 7, 8 High Grades 9, 10, 11 Paul Cuffee Charter School Elementary Grades 3, 4, 5 Middle Grades 6, 7, 8 High Grades 9, 10, 11 Rhode Island School for the Deaf Elementary Grades 3, 4, 5 Middle Grades 6, 7, 8 High Grades 9, 10, 11 The RYSE School, Chariho High Grades 7, 8, 9, 10, 11
The Compass School Elementary Grades 3, 4, 5 Middle Grades 6, 7, 8
The Learning Community Charter School
Elementary Grades 3, 4, 5 Middle Grades 6, 7, 8 Times2 Academy, Providence Elementary Grades 3, 4, 5 Middle Grades 6, 7, 8 High Grades 9, 10, 11 Trinity Academy for the Performing Arts
Middle Grades 7, 8 High Grades 9, 10, 11
Wilbur and McMahon Schools, Little Compton Elementary Grades 3, 4, 5 Middle Grades 6, 7, 8

P a g e | 76
76
APPENDIX D
Calculating Standard Error (SE) to Determine Statistical Significance of Differences For the purposes of this report, Standard Error (SE) is defined as a measurement of either the standard error of a percentage (e.g., % Level 4 + Level 5) or the standard error of a mean (e.g., average scale scores). Mathematically, SE’s were calculated as follows:
(SE)percentage = √(𝑝𝑞
𝑁), where p is the percent of students who are Level 4 or above, q= (100-p) and N is the population or group size.
(SE)mean = (√2𝜎2
𝑁), where 𝜎 is the standard deviation of the scale score distribution, and N is the population or group size.
It is important to note that the derived SE is based on the size of the group being examined and its respective performance (read: % Level 4 or above) on the PARCC assessments. Standard errors can be used to create a confidence interval around the derived percentage or average scale score so that you can see the range in which the “true” (e.g., measured without error) value is located. To do so, you can take the SE and multiply it by 1.96 (for a 95% confidence interval). The resultant product is then added and subtracted from the percent Level 4 or above, p, for example, to create a range of values in which you can be 95% confident that the “true” value is located. For example, viewing the percent Level 4 or above (p) as the center point, if one adds the value of SE(1.96) to p and also subtracts this value from p, then the full confidence interval is created with both an upper and lower boundary. So, if p equals 70% and the SE equals .5, then the product of SE and 1.96 equals .5(1.96) or .965 Adding and subtracting this number from 70% creates the confidence interval, which ranges from 69.04% to 70.97%. This is the range in which one can be 95% confident that the “true” value exists. When comparing the performance of any two years or groups, we say that the difference in performance between the groups is statistically significant if the difference in performance between the two groups is larger than the sum of the SE’s of the two groups. In other words, if the sum of the two SE’s—each multiplied by 1.96 to get the 95% confidence interval—is larger than the value of the difference in performance between the two groups, then we say the difference is too small to be significant or meaningful because the difference doesn’t fall outside of the range of plausible “true” values. To illustrate this point, let’s say that 60% of 4th grade students at School X were Level 4 or above in math in 2016 and the following year in 2017, 66% of 4th grade students were Level 4 or above, thus resulting in an increase of +6 percentage points. If the sum of the 2016 SE(1.96) and the 2017 SE(1.96) is 6.5, then the change from 2016 to 2017 of +6 percentage points at School X is not large enough to be considered statistically significant. On the other hand, if 67% of 4th graders in 2016 were Level 4 or above, then the +7 percentage point increase in performance would be larger than the standard error of 6.5 and this difference would be statistically significant.
P a g e | 77
77
Rhode Island Department of Education
255 Westminster Street Providence, RI 02903 (401) 222-4600