Rhode Island Medicaid Managed Care Program - … RI Aggregate EQ… · Rhode Island Medicaid...
84
Rhode Island Medicaid Managed Care Program Annual External Quality Review Technical Report Reporting Year 2013 October 2014 Prepared on Behalf of The State of Rhode Island Executive Office of Health and Human Services Center for Child and Family Health
Transcript of Rhode Island Medicaid Managed Care Program - … RI Aggregate EQ… · Rhode Island Medicaid...

Rhode Island Medicaid Managed Care Program Annual External Quality Review Technical Report Reporting Year 2013 October 2014
Prepared on Behalf of
The State of Rhode Island Executive Office of Health and Human Services Center for Child and Family Health

RI EQR Technical Report 2013 – Aggregate Page 1 of ii
Table of Contents
I. EXECUTIVE SUMMARY ................................................................................................................1
II. INTRODUCTION ..........................................................................................................................6
III. METHODOLOGY .........................................................................................................................8
IV. CORPORATE PROFILES ................................................................................................................9
V. ACCREDITATION SUMMARIES AND HEALTH PLAN RANKINGS .................................................... 10
NCQA Health Plan Accreditation ....................................................................................................... 10 NCQA Health Plan Rankings............................................................................................................... 12
VI. ENROLLMENT ........................................................................................................................... 14
VII. PROVIDER NETWORK AND GEOACCESS ..................................................................................... 16
VIII. RHODE ISLAND MEDICAID’S PERFORMANCE GOAL PROGRAM ................................................... 20
Rhode Island Medicaid Managed Care Performance Goal Program Background ........................... 20 Changes in Methodology for the 2013 Performance Goal Program ................................................ 21 2013 Rhode Island Medicaid Managed Care Performance Goal Program Results .......................... 22 Monitoring Care and Service Provided to Special Enrollment Populations...................................... 35
IX. HEDIS® PERFORMANCE MEASURES ........................................................................................... 38
HEDIS® Effectiveness of Care Measures ............................................................................................ 38 HEDIS® Access to/Availability of Care Measures .............................................................................. 41 HEDIS® Use of Services Measures ...................................................................................................... 45
X. MEMBER SATISFACTION ........................................................................................................... 47
Adult CAHPS® 5.0H ............................................................................................................................. 47
XI. QUALITY IMPROVEMENT PROGRAMS ....................................................................................... 50
Quality Improvement Activities ......................................................................................................... 50
XII. CONCLUSIONS AND RECOMMENDATIONS ................................................................................ 52
Quality of Care .................................................................................................................................... 52 Access to/Timeliness of Care .............................................................................................................. 54 Quality Improvement Program .......................................................................................................... 55 EOHHS Responses and Follow-Up to Recommendations .................................................................. 55
XIII. REFERENCES ............................................................................................................................. 56
APPENDIX 1: RHODE ISLAND STRATEGY FOR ASSESSING AND IMPROVING THE QUALITY OF MANAGED CARE SERVICES – OCTOBER 2012 ................................................................ 59
APPENDIX 2: QUALITY IMPROVEMENT ACTIVITY FORM TEMPLATE ................................................... 76
RI EQR Technical Report 2013 – Aggregate Page 2 of ii
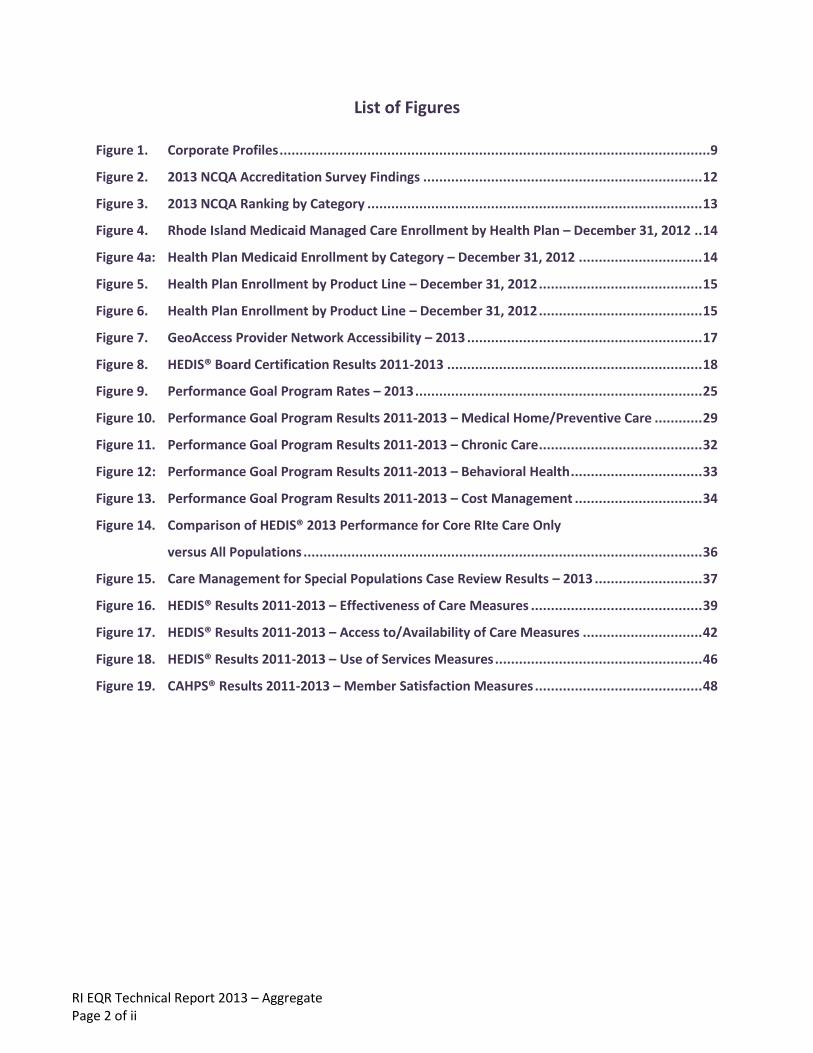
List of Figures
Figure 1. Corporate Profiles ............................................................................................................9
Figure 2. 2013 NCQA Accreditation Survey Findings ...................................................................... 12
Figure 3. 2013 NCQA Ranking by Category .................................................................................... 13
Figure 4. Rhode Island Medicaid Managed Care Enrollment by Health Plan – December 31, 2012 .. 14
Figure 4a: Health Plan Medicaid Enrollment by Category – December 31, 2012 ............................... 14
Figure 5. Health Plan Enrollment by Product Line – December 31, 2012 ......................................... 15
Figure 6. Health Plan Enrollment by Product Line – December 31, 2012 ......................................... 15
Figure 7. GeoAccess Provider Network Accessibility – 2013 ........................................................... 17
Figure 8. HEDIS® Board Certification Results 2011-2013 ................................................................ 18
Figure 9. Performance Goal Program Rates – 2013 ........................................................................ 25
Figure 10. Performance Goal Program Results 2011-2013 – Medical Home/Preventive Care ............ 29
Figure 11. Performance Goal Program Results 2011-2013 – Chronic Care ......................................... 32
Figure 12: Performance Goal Program Results 2011-2013 – Behavioral Health ................................. 33
Figure 13. Performance Goal Program Results 2011-2013 – Cost Management ................................ 34
Figure 14. Comparison of HEDIS® 2013 Performance for Core RIte Care Only
versus All Populations .................................................................................................... 36
Figure 15. Care Management for Special Populations Case Review Results – 2013 ........................... 37
Figure 16. HEDIS® Results 2011-2013 – Effectiveness of Care Measures ........................................... 39
Figure 17. HEDIS® Results 2011-2013 – Access to/Availability of Care Measures .............................. 42
Figure 18. HEDIS® Results 2011-2013 – Use of Services Measures .................................................... 46
Figure 19. CAHPS® Results 2011-2013 – Member Satisfaction Measures .......................................... 48
RI EQR Technical Report 2013 - Aggregate Page 1 of 81
I. EXECUTIVE SUMMARY
Introduction The Centers for Medicare and Medicaid Services (CMS) require that State agencies contract with an External Quality Review Organization (EQRO) to conduct an annual, external quality review (EQR) of the services provided by contracted Medicaid managed care organizations (MCOs). In order to comply with these requirements, the State of Rhode Island Executive Office of Health and Human Services (EOHHS) contracted with IPRO to assess and report the impact of its Medicaid managed care program and both of the participating Health Plans on the accessibility, timeliness and quality of services. It is important to note that the provision of health care services to each of the eligibility groups, including Core RIte Care, RIte Care for Children with Special Health Care Needs (CSHCN), RIte Care for Children in Substitute Care (SC)1 and Rhody Health Partners (RHP) is evaluated in this report. RHP is a managed care option for adult populations with disabilities. As members of the Health Plans, each of these populations is included in all measure calculations, where applicable. In addition to the Health Plan-specific Technical Reports that detail IPRO’s independent evaluation of the services provided by each of the two (2) Health Plans (Neighborhood Health Plan of Rhode Island (NHPRI) and UnitedHealthcare Community Plan of Rhode Island (UHCP-RI)), the EOHHS requested that IPRO prepare an aggregate report that evaluates the performance of the State’s Medicaid managed care program overall. Specifically, this report provides IPRO’s independent evaluation of the combined services provided by the two Medicaid managed care Health Plans for Reporting Year 2013, and compares and contrasts the individual performance of both Health Plans. For comparative purposes, results for 2011 and 2012 are displayed when available and appropriate. The framework for this assessment is based on the guidelines established by CMS, as well as State requirements. IPRO reviewed pertinent information from a variety of sources, including State managed care standards, accreditation survey findings, member satisfaction surveys, performance measures and State monitoring reports. The benchmarks and HEDIS®2 percentiles for Medicaid Health Plans cited in this Annual EQR Technical Report originated from the NCQA Quality Compass®3 2013 for Medicaid, with the exception of those shown for the 2013 Performance Goal Program (PGP). Scoring percentiles for the PGP were derived from Quality Compass® 2012 for Medicaid.
Corporate Profiles As indicated previously, in 2013 the Rhode Island Medicaid managed care program was comprised of two (2) Health Plans: NHPRI, which served the Medicaid population only, and UHCP-RI; which served Medicaid, Medicare and Commercial populations (refer to Figure 1 on page 9). Both Health Plans served the Core RIte Care, RIte Care for Children with Special Health Care Needs (CSHCN) and adults with disabilities/Rhody Health Partners (RHP) populations. Only NHPRI served the RIte Care for Children in Substitute Care (SC) population.
Accreditation Notably, NHPRI was awarded an Excellent accreditation rating for its Medicaid product line by the National Committee for Quality Assurance (NCQA) in 2013. UHCP-RI achieved a Commendable rating by the NCQA (refer to Figure 2 on page 12). Although UHCP-RI has historically earned an Excellent rating, modifications made to the NCQA’s Accreditation methodology affected the distribution of Health Plan ratings, with fewer Health Plans achieving an Excellent status. Although on-site accreditation occurs every three (3) years, ratings are
1
The RIte Care for Children in Substitute Care (SC) population is served by NHPRI only. 2
HEDIS®
(Healthcare Effectiveness Data and Information Set) is a registered trademark of the National Committee for Quality Assurance (NCQA).
3 Quality Compass
® is a registered trademark of the National Committee for Quality Assurance (NCQA).

RI EQR Technical Report 2013 - Aggregate Page 2 of 81
recalculated annually by NCQA based on the most recent Accreditation Survey findings and the latest HEDIS®
and CAHPS® results. As such, 2013 accreditation ratings are based on the results of the accreditation survey conducted in 2012 for UHCP-RI and in 2011 for NHPRI, while the HEDIS® and CAHPS®4 2013 results were used for both Health Plans. Among all Medicaid Health Plans ranked by the NCQA, NHPRI and UHCP-RI ranked 4th and 8th, respectively, based on accreditation standards, HEDIS® results and CAHPS® scores (refer to Figure 3 on page 13). Both Health Plans ranked within the top ten (10) of the two hundred fifty-eight (258) Health Plans evaluated by the NCQA. NHPRI has been ranked by the NCQA within the top ten (10) Medicaid Health Plans nationally for nine (9) consecutive years, while UHCP-RI demonstrated improvement in 2013 by achieving a top ten (10) ranking.
Enrollment The two Health Plans varied in the proportion of Medicaid membership served. According to Medicaid enrollment data for the period ending December 31, 2012, NHPRI comprised the majority (66%) of Rhode Island Medicaid managed care total enrollment with over 91,000 members, while UCHP-RI encompassed the remaining 34%, with over 47,000 members (refer to Figure 4 on page 14). Compared to year-end 2011, Medicaid enrollment remained stable for both Health Plans. UHCP-RI also reported enrollment data for its Medicare and Commercial product lines, which comprised 38% and 3% of its total enrollment, respectively, with the largest proportion of members enrolled in the Medicaid product line (59%) (refer to Figure 5 on page 15). UHCP-RI’s Commercial HMO population continued to decline, as the Health Plan has been re-enrolling members into the Commercial PPO product line.
Provider Network Accessibility and GeoAccess Both Health Plans received Excellent accreditation ratings on the Access and Service and Qualified Providers domains, and met or exceeded the Health Plan-established GeoAccess standards for all primary care and high-volume specialty types (refer to Figure 7 on page 17).
Rhode Island Medicaid’s Performance Goal Program5 Rhode Island’s Performance Goal Program (PGP) was established in 1998 to measure and reward performance in the areas of administration, access and clinical quality. Since then, the program has been steadily refined. In 2013, the Performance Goal Program (PGP) entered its fifteenth (15th) year. The PGP has been fully aligned with nationally recognized performance benchmarks through its performance categories, the majority of measures being HEDIS® and CAHPS® measures, and superior performance levels, which have been established as the basis for incentive awards. For the 2013 PGP, the assessment of performance on HEDIS® and CAHPS® 2013 is based upon comparisons to the Quality Compass® 2012 Medicaid benchmarks and percentiles. For the 2011, 2012 and 2013 Reporting Years, the following performance categories were used to evaluate Health Plan performance:
Member Services Medical Home/Preventive Care Women's Health Chronic Care Behavioral Health Resource Maximization Children with Special Health Care Needs (Added in 2010)
4
CAHPS®
(Consumer Assessment of Healthcare Providers and Services) is a registered trademark of the federal Agency for Health Research and Quality (AHRQ).
5 The rates for NHPRI and UHCP-RI for all measures in the PGP include CSHCN, SC and RHP members, where eligible
population criteria are met.

RI EQR Technical Report 2013 - Aggregate Page 3 of 81
Children in Substitute Care (Added in 2011)6 Rhody Health Partners (Added in 2011)
Within each of these categories is a series of measures, including a variety of standard HEDIS® and CAHPS®
measures, as well as State-specified measures, for areas of particular importance to the State and for which a national metric is not available (e.g., New Member Welcome Call Attempts, Grievances and Appeals Processing, Initial Health Screens for Special Populations and Notify EOHHS of Third Party Liability (TPL)). See Figure 9 on page 25 for the full results of the 2013 PGP.
Of the fifteen (15) state-specified measures, NHPRI met the Contract goal for nine (9) measures and UHCP-RI met the Contract goal for two (2) measures. It is important to note that because UHCP-RI does not serve the Children in Substitute Care population, the plan received an ‘N/A’ designation for three (3) measures specific to that population. Among the HEDIS® and CAHPS® measures, UHCP-RI met or exceeded a Quality Compass® 2012 benchmark (90th, 75th or 50th percentiles) and qualified for a full or partial incentive award for twenty-six of forty-four (26 of 44) measures with fourteen (14) measures ranking in the 90th percentile, seven (7) in the 75th percentile and five (5) measures at the 50th percentile. NHPRI met or exceeded a Quality Compass® 2012 benchmark (90th, 75th or 50th
percentiles) and qualified for a full or partial incentive award for thirty-three of forty-four (33 of 44) measures, with nineteen (19) measures ranking in the 90th percentile, thirteen (13) measures at the 75th percentile and one (1) in the 50th percentile. Nine (9) measures were ineligible for an incentive due to designation as a baseline measurement or inclusion in an aggregate measure.
Care Management for Special Enrollment Populations
In order to monitor access to and quality of care provided to special enrollment populations, specifically Children with Special Health Care Needs (CSHCN) and Rhody Health Partners (RHP) members, since 2010, EOHHS has required that the Health Plans annually submit HEDIS® data for Core RIte Care Only and for All Populations. The State analyzed the data to identify differences between the rates for the Core RIte Care Only group and those including All Populations. Performance was considered similar if both rates ranked in the same percentile band and dissimilar if the rates ranked in different percentile bands. For the current reporting period, HEDIS® 2013, when performance was compared for Core RIte Care Only and All Populations, the results were as follows: for NHPRI, rates were similar for forty-one (41) measures and varied for three (3) measures; for UHCP-RI, rates were similar for thirty-eight (38) measures, dissimilar for four (4) measures and were not applicable for two (2) measures7 (refer to Figure 14 on page 36). In addition, as part of the 2013 Performance Goal Program monitoring visit in May 2013, the State conducted a file review of special enrollment population case records. For each of the special populations enrolled in the Health Plans, PGP goals related to timely initial health screens upon enrollment, timely needs assessments and timely evaluation and update of active care management plans have been established (refer to Figure 15 on page 37).
6 The RIte Care for Children in Substitute Care (SC) population is served by NHPRI only.
7 Some measures were not reportable (NR) due to small eligible populations/denominators (< 30 members). Therefore,
these rates could not be compared and, as such, were considered not applicable (N/A).
RI EQR Technical Report 2013 - Aggregate Page 4 of 81
HEDIS® Performance Measures8 The assessment of performance on HEDIS® 2013 is based upon comparisons to the Quality Compass® 2013 Medicaid benchmarks and percentiles. Statewide rates are calculated by totaling numerators and denominators from each of the two (2) Health Plans. In the HEDIS® Effectiveness of Care domain, which assesses preventive care and care for chronic conditions, performance was strong for Cervical Cancer Screening, Childhood Immunizations: Combo 3, Follow-up After Hospitalization for Mental Illness (7 Days) and Follow-up After Hospitalization for Mental Illness (30 Days), with both Health Plans and the statewide rate achieving either the 75th or 90th percentile (refer to Figure 16 on page 39). The Access to/Availability of Care domain evaluates the proportions of members who access PCPs, ambulatory services and preventive care, as well as timely prenatal and postpartum care. Both Health Plans and the statewide rate ranked at the 75th or 90th percentiles for the following measures: Children’s Access to Primary Care (12-24 Months, 25 Months-6 Years, 7-11 Years and 12-19 Years) and Adults’ Access to Preventive/ Ambulatory Health Services (20-44 Years, 45-64 Years and 65+ Years). In addition, both Health Plans achieved the 75th or 90th percentile for the Timeliness of Prenatal Care measure (refer to Figure 17 on page 42).
Within the HEDIS® 2013 Use of Services measures, which assess members’ utilization of Health Plan services, both Health Plans and the statewide rate achieved the 90th percentile for the measures Well-Child Visits in the First 15 Months of Life: 6+ Visits and Adolescent Well-Care Visits. The statewide rate also achieved the 75th percentile for the Well-Child Visits in the 3rd, 4th, 5th & 6th Years of Life and Frequency of Ongoing Prenatal Care measures (refer to Figure 18 on page 46).
Member Satisfaction: CAHPS® 5.0H Overall performance on the 2013 Consumer Assessment of Healthcare Providers and Systems Medicaid Adult Survey (CAHPS® 5.0H) measures showed a generally high degree of member satisfaction statewide, with the statewide rate for all measures, except Customer Service, exceeding the 2013 Medicaid Mean. The statewide rate remained fairly stable over the three-year period for all measures, with the exception of Rating of Specialist, Getting Needed Care and Rating of All Health Care measures, which demonstrated an improvement in performance since 2012. NHPRI exceeded the Quality Compass® 2013 90th or 75th percentile for just two (2) measures, while UHCP-RI exceeded the 90th or 75th percentile for four (4) measures (refer to Figure 19 on page 48).
Conclusions and Recommendations IPRO’s external quality review concludes that the Rhode Island Medicaid managed care program and its participating Health Plans, NHPRI and UHCP-RI, have had an overall positive impact on the accessibility, timeliness and quality of services for Medicaid recipients. This is supported by the fact that both Health Plans ranked in the top ten (10) Medicaid Health Plans evaluated by the NCQA in 2013, with NHPRI ranking 4th and UHCP-RI ranking 8th. In addition, NHPRI continues to achieve an Excellent NCQA accreditation status. Overall strengths for both Health Plans include: strong performance on access to care and provision of well care and preventive screening services for children and adolescents, excellent access to ambulatory and preventive care for adults, and generally high levels of member satisfaction. Recommendations made in this report apply to both Health Plans, and as such, may be opportunities that EOHHS may wish to address. More specific data and recommendations are provided for both NHPRI and UHCP-
8 The rates for NHPRI and UHCP-RI for all HEDIS
® measures include CSHCN, SC (NHPRI only) and RHP members, where
eligible population criteria are met.

RI EQR Technical Report 2013 - Aggregate Page 5 of 81
RI in the Health Plan-specific EQR Technical Reports. To improve the provision of care and services to members, overall recommendations are made in the following areas: Quality of Care
Board Certification Member Services
o ID Cards Sent within 10 Days o Member Handbook Sent within 10 Days
Use of Imaging for Low Back Pain CAHPS® Rating of Personal Doctor CAHPS® How Well Doctors Communicate
Access to/Timeliness of Care
Initial Health Screening for Special Populations Rate of ED Visits for Ambulatory Care Sensitive Conditions Decreased by 5 Percentage Points
THIS SPACE INTENTIONALLY LEFT BLANK

RI EQR Technical Report 2013 - Aggregate Page 6 of 81
II. INTRODUCTION The Centers for Medicare and Medicaid Services (CMS) require that State agencies contract with an External Quality Review Organization (EQRO) to conduct an annual external quality review (EQR) of the services provided by contracted Medicaid managed care organizations (MCOs). This EQR must include an analysis and evaluation of aggregated information on quality, timeliness and access to the health care services that an MCO furnishes to Medicaid recipients. Quality is defined in 42 CFR §438.320 as “the degree to which an MCO or PIHP increases the likelihood of desired health outcomes of its enrollees through its structural and operational characteristics and through the provision of health services that are consistent with current professional knowledge.” In order to comply with these requirements, the State of Rhode Island Executive Office of Health and Human Services (EOHHS) contracted with IPRO to assess and report the impact of its Medicaid managed care program and each of the participating Health Plans on the accessibility, timeliness and quality of services. In addition to Health Plan-specific EQR Technical Reports that present IPRO’s independent evaluation of the services provided by each of the two Rhode Island Medicaid managed care Health Plans for the 2013 Reporting Year, EOHHS requested that IPRO prepare this aggregate report that evaluates, compares and contrasts both Health Plans’ performance, as well as overall Statewide performance. For comparative purposes, results for 2011-2012 are also displayed when available and appropriate. The framework for IPRO’s assessment is based on the guidelines and protocols established by CMS, as well as State requirements. RIte Care, Rhode Island’s Medicaid managed care program for children, families and pregnant women, began enrollment in August 1994 as a Section 1115 demonstration project with the following goals:
To increase access to and improve the quality of care for Medicaid families To expand access to health coverage to all eligible pregnant women and all eligible
uninsured children To control the rate of growth in the Medicaid budget for the eligible population
RIte Care operates as a component of the State’s Global Consumer Choice Compact Waiver Section 1115(a) demonstration project, which is approved until December 31, 20139. As is typical for Section 1115 waivers, CMS defines “Special Terms and Conditions” (STCs) for the demonstration. The STCs addressing quality assurance and improvement are as follows:
“The State shall keep in place existing quality systems for the waivers/demonstrations/programs that currently exist and will remain intact under the Global 1115 (RIte Care, Rhody Health, Connect Care, RIte Smiles and PACE).”
Because Federal EQR requirements apply to Medicaid Managed Care, initially, this EQR had been focused on RIte Care. Since Reporting Year (RY) 2010, the managed care organization (MCO) system for adults with disabilities, Rhody Health Partners, was incorporated10. As members of the Health Plan, the RHP population is included in all measure calculations, where applicable. This marks the fourth reporting period for which RHP
9 In December 2013, the renewal request submitted by EOHHS was approved by CMS, resulting in an extension of the
State’s Global Consumer Choice Compact Waiver Section 1115(a) through December 31, 2018. The Special Terms and Conditions (STCs) of the renewed Waiver include Rhody Health Options, in addition to the care delivery systems included in the 2008 Waiver.
10 The option to enroll in a managed care organization was extended to adult Medicaid beneficiaries with disabilities in
2008. At that time, adults with disabilities without third-party coverage were given the option to enroll in an MCO with the provision that they could choose to return to Fee-For-Service (FFS) Medicaid (“opt out”) at any time.

RI EQR Technical Report 2013 - Aggregate Page 7 of 81
members met enrollment criteria for inclusion in HEDIS®, CAHPS®, the Performance Goal Program and Quality Improvement Projects. Please see Appendix 1 for a description of the State’s approach to quality and evaluation for RIte Care and Rhody Health Partners.
THIS SPACE INTENTIONALLY LEFT BLANK

RI EQR Technical Report 2013 - Aggregate Page 8 of 81
III. METHODOLOGY
In order to assess the impact of the RIte Care and Rhody Health Partners Programs on access, timeliness and quality of services, IPRO reviewed pertinent information from a variety of sources including State managed care standards, Medicaid Managed Care Services Contract requirements, accreditation survey findings, member satisfaction surveys, performance measures and State monitoring reports.
The majority of measures reported herein are derived from HEDIS® or CAHPS®. For these measures, comparisons to national Medicaid benchmarks have been provided. The benchmarks utilized were the ones most currently available at the time of this writing. Unless otherwise noted, the benchmarks originate from the National Committee for Quality Assurance (NCQA) Quality Compass®11 2013 for Medicaid and represent the performance of all Health Plans that reported HEDIS® and CAHPS® data to the NCQA for HEDIS® 2013 (Measurement Year (MY) 2012). For comparative purposes, the results for 2011-2012 have also been displayed where available and appropriate. Unless otherwise noted, all statewide rates are true rates – calculated by combining numerators and denominators for both Health Plans. The exceptions are the State-specified Performance Goal Program (PGP) measures and CAHPS® rates, for which numerators or denominators were not uniformly available. Statewide rates for CAHPS® were calculated by averaging the individual ratings for both Health Plans. The methodology for calculating the PGP statewide rates differs by measure, and the relevant Figures have been annotated. It is important to note that this is the third EQR Aggregate Technical Report where statewide rates are calculated based on two (2) Health Plans’ performance, rather than three (3), since BCBSRI opted not to seek a renewal of its Medicaid Contract in 2010. For each key section, a description of the data, the methods used to monitor these requirements and key findings have been provided. The final section of the report provides summary conclusions, strengths and recommendations derived from this report, as well as each Health Plan’s individual report. Additionally, the final section describes the communication of the findings by EOHHS to the Health Plans for follow-up, as well as a brief description of the Health Plans’ progress related to the previous year’s Annual External Quality Review Technical Report recommendations.
11
Quality Compass is a registered trademark of the National Committee for Quality Assurance (NCQA).

RI EQR Technical Report 2013 - Aggregate Page 9 of 81
IV. CORPORATE PROFILES
Two (2) Health Plans comprised Rhode Island’s Medicaid managed care program during 2013:
Neighborhood Health Plan of Rhode Island, Inc. (NHPRI) is a local, not-for-profit HMO that served the Medicaid population only, including CSHCN, SC and RHP members.
UnitedHealthcare Community Plan - Rhode Island (UHCP-RI) is a not-for-profit HMO in Rhode Island, although it is part of a publicly traded company. It served Commercial, Medicare and Medicaid populations, including CSHCN and RHP members.
Figure 1 presents specific information for both Health Plans.
Figure 1. Corporate Profiles
Plan NHPRI UHCP-RI
Type of Organization HMO HMO
Tax Status Not-for-profit Not-for-profit
Model Type Network Mixed
Year Operational 1994 1979
Year Operational (Medicaid) 1994 1994
Product Line(s) Medicaid Commercial, Medicare, Medicaid
Total Enrollment as of 12/31/12 91,219 80,026
Total Medicaid Enrollment as of 12/31/12 91,219 47,422
NCQA Medicaid Accreditation Status Excellent Commendable(Medicaid)
NCQA National Medicaid ranking 4th 8th

RI EQR Technical Report 2013 - Aggregate Page 10 of 81
V. ACCREDITATION SUMMARIES AND HEALTH PLAN RANKINGS
CMS’ Final Rule 42 CFR §438.358, which defines mandatory activities related to the external quality review, requires a review to determine the Health Plan’s compliance with structure and operations standards established by the State, to be conducted within the previous three-year reporting period. To guide the review process, CMS further established a protocol for monitoring the Health Plans, which states must use or demonstrate a comparative validation process. In order to comply with these requirements, EOHHS uses a validation process comparable to the CMS protocol that is described in detail in the State’s October 2012 quality strategy, entitled Rhode Island Strategy for Assessing and Improving the Quality of Managed Care Services under RIte Care12. EOHHS relies on the NCQA Accreditation standards, review process and findings, in addition to other sources of information, to assure Health Plan compliance with many of the structure and operations standards. The State also conducts an annual monitoring review to assess Health Plan processes and gather data for the State’s Performance Goal Program metrics. In addition, EOHHS submitted a crosswalk to CMS, pertaining to NCQA’s comparability to the regulatory requirements for compliance review, in accordance with 42 CFR 438.360(b)(4). This strategy was approved by CMS in April 2005 and again in April 2013.
NCQA Health Plan Accreditation
The NCQA began accrediting Health Plans in 1991 to meet the demand for objective, standardized, plan performance information. The NCQA’s Health Plan Accreditation is considered the industry’s gold standard for assuring and improving quality care and patient experience. It reflects a commitment to quality that yields tangible, bottom-line value. It also ensures essential consumer protections, including fair marketing, sound coverage decisions, access to care and timely appeals. NCQA accreditation is recognized or required by the majority of State Medicaid agencies and is utilized to ensure regulatory compliance in many states. The accreditation process is a rigorous, comprehensive and transparent evaluation process through which the quality of key systems and processes that define a Health Plan are assessed. Additionally, accreditation includes an evaluation of the actual results that the Health Plan achieves on key dimensions of care, service and efficiency. Specifically, the NCQA reviews the Health Plans’ quality management and improvement, utilization management, provider credentialing and re-credentialing, members’ rights and responsibilities, standards for member connections and HEDIS®/CAHPS® performance measures. The NCQA accreditation provides an unbiased, third-party review to verify, score and publicly report results. The NCQA regularly revises and updates its standards to reflect clinical advances and evolving stakeholder needs and raises the bar, moves toward best practices and leads to continuous improvement13. The survey process consists of on-site and off-site evaluations conducted by survey teams composed of physicians and managed care experts who interview Health Plan staff and review materials such as case records and meeting minutes. The findings of these evaluations are analyzed by a national oversight committee of physicians, and an accreditation level is assigned based on a Health Plan's compliance with the NCQA's standards and its HEDIS®/CAHPS® performance. Compliance with standards accounts for approximately 55% of the Health Plan’s accreditation scores, while performance measurement accounts for the remainder.
12
Rhode Island‘s initial quality strategy was approved by CMS in April 2005. An updated version was submitted in October 2012 and approved by CMS in April 2013. The most recent revision of the quality strategy, prepared in June 2014, is pending approval by CMS.
13 Beginning in 2011, the NCQA initiated a 5-year modification in the accreditation scoring methodology that raises the
standards for NCQA Accreditation. Over 5 years (2011-2015), the NCQA will phase out the sampling variation scoring
adjustment, which was previously added to any HEDIS®
measures that were determined by sampling patient records.
This change comes as a result of overall improvement and reliability of HEDIS®
rates across all Health Plans. It is expected that this will modify the distribution of Health Plans among three levels (Excellent, Commendable, Accredited), with fewer plans achieving an Excellent rating.

RI EQR Technical Report 2013 - Aggregate Page 11 of 81
Health Plans are scored along five dimensions using ratings of between one and four stars (1 – lowest, 4 – highest)14:
Access and Service: An evaluation of Health Plan members’ access to needed care and good customer service: Are there enough primary care doctors and specialists to serve all Health Plan members? Do members report problems getting needed care? How well does the Health Plan follow-up on grievances?
Qualified Providers: An evaluation of Health Plan efforts to ensure that each doctor is licensed and trained to practice medicine and Health Plan members are happy with their doctors: Does the Health Plan check whether physicians have had sanctions or lawsuits against them? How do members rate their personal doctors?
Staying Healthy: An evaluation of Health Plan activities that help people maintain good health and avoid illness: Does the Health Plan give its doctors guidelines about how to provide appropriate preventive health services? Do members receive appropriate tests and screenings?
Getting Better: An evaluation of Health Plan activities that help people recover from illness: How does the Health Plan evaluate new medical procedures, drugs and devices to ensure that patients have access to the most up-to-date care? Do doctors in the Health Plan advise patients to quit smoking?
Living with Illness: An evaluation of Health Plan activities that help people manage chronic illness: Does the Health Plan have programs in place to help patients manage chronic conditions like asthma? Do diabetics, who are at risk for blindness, receive eye exams as needed?
Although the on-site accreditation occurs every three (3) years, ratings are recalculated annually by the NCQA based on the most recent Accreditation Survey findings and the latest HEDIS® and CAHPS® results. As such, 2011 accreditation ratings are based on the Accreditation Survey conducted in 2011 for NHPRI, and in 2012 for UHCP-RI, while the HEDIS®/CAHPS® 2013 results were used for both Health Plans.
The table below presents the most common overall NCQA accreditation outcomes, including the star ratings and definitions.
Accreditation Survey Key:
Excellent Organizations with programs for service and clinical quality that meet or exceed
rigorous requirements for consumer protection and quality improvement. HEDIS results are in the highest range of national performance.
Commendable Organizations with well-established programs for service and clinical quality that meet rigorous requirements for consumer protection and quality improvement.
Commendable Accredited Accredited
Organizations with programs for service and clinical quality that meet basic requirements for consumer protection and quality improvement. Organizations awarded this status must take further action to achieve a higher accreditation status.
Commendable Accredited Provisional
Organizations with programs for service and clinical quality that meet basic requirements for consumer protection and quality improvement. Organizations awarded this status must take significant action to achieve a higher accreditation status.
(No stars) Commendable Accredited Denied Organizations whose programs for service and clinical quality did not meet NCQA requirements during the Accreditation Survey.
14
www.ncqa.org

RI EQR Technical Report 2013 - Aggregate Page 12 of 81
Figure 2 depicts the NCQA Accreditation findings for NHPRI and UHCP-RI in 2013. Figure 2. 2013 NCQA Accreditation Survey Findings
Health Plan Access and
Service Qualified Providers
Staying Healthy
Getting Better
Living with Illness
Accreditation Outcome
Medicaid
NHPRI Excellent
UHCP-RI Commendable
NCQA Health Plan Rankings
Annually, the NCQA calculates rankings for Commercial, Medicare and Medicaid Health Plans, known as the Health Plan Rankings. In 2013, the NCQA evaluated 258 Medicaid Health Plans and ranked one-hundred thirty-one (131) of those based on clinical performance (HEDIS® results), member satisfaction (CAHPS® scores) and NCQA accreditation standards (quality, satisfaction, and systems and processes). To be eligible for ranking, Health Plans must authorize public release of their performance information and submit enough data for statistically valid analysis. The NCQA’s 2013-2014 Health Insurance Plan Rankings used the NCQA’s established rankings methodology, which has been used and widely recognized since 200515. The overall Health Plan score is comprised of satisfaction (Consumer Satisfaction) measures (25%), clinical (Prevention and Treatment) measures (60%) and NCQA Accreditation Standards scores (15%), defined below. These are then weighted and represented as a 0-100 score.
Consumer Satisfaction: Composite of CAHPS® measures for consumer experience with getting care, as well as satisfaction with Health Plan physicians and with Health Plan services.
Prevention: Composite of clinical HEDIS® measures for how often preventive services are provided (e.g., childhood and adolescent immunizations, women’s reproductive health, cancer screenings), as well as measures of access to primary care and other preventive visits.
Treatment: Composite of clinical HEDIS® measures for how well Health Plans care for people with conditions such as asthma, diabetes, heart disease, hypertension, osteoporosis, alcohol and drug dependence, and mental illness.
Since 2010, the NCQA has used a five-point numerical scale rating system, which compares the Health Plan’s score to the national average. The scale and the definition for each level are provided below:
NCQA Health Plan Rankings Key:
5 The top 10 percent of plans which are also statistically different from the mean. 4 Plans in the top one-third that are not in the top 10 percent of Health Plans and are statistically
different from the mean. 3 The middle one-third of plans, and plans that are not statistically different from the mean. 2 Plans in the bottom one-third that are not in the bottom 10 percent and are statistically different from
the mean.
1 The bottom 10 percent of plans, which are also statistically different from the mean.
15
www.ncqa.org

RI EQR Technical Report 2013 - Aggregate Page 13 of 81
The overall methodology is the same as was used for the 2013-2014 rankings, with the exception of minor changes to the list of HEDIS® and CAHPS® measures used for determination16. The Health Plan rankings are posted on the NCQA website and, since 2010, have been posted on the Consumer Reports’ website and published in the November issue of Consumer Reports magazine. NHPRI was ranked 4th nationally among Medicaid Health Plans ranked by the NCQA. NHPRI has consistently ranked among the top ten Medicaid Health Plans. UHCP-RI was ranked 8th nationally among Medicaid Health Plans ranked by the NCQA. This is within the top ten (10) Medicaid Health Plans evaluated by the NCQA, and a substantial improvement from the 2012 ranking at 18th. Figure 3 below presents the Health Plans’ total scores and ranks along with the performance ratings across the three categories:
Figure 3. 2013 NCQA Ranking by Category
Health Plan Consumer
Satisfaction Prevention Treatment 2013 Score National Rank
Medicaid
NHPRI 4 5 5 85.7 4th
UHCP-RI 4 5 4 85.2 8th
THIS SPACE INTENTIONALLY LEFT BLANK
16
Measure changes to the 2013-2014 methodology for Medicaid Health Plans included: Treatment: added Use of Appropriate Medications for People with Asthma (Total), Medication Management for People with Asthma – Medication Compliance 75% (Total), HbA1c Control (<8%), Antidepressant Medication Management – Acute Phase, Antidepressant Medication Management – Continuation Phase, Pharmacotherapy Management of COPD Exacerbation – Systemic Corticosteroid and Pharmacotherapy Management of COPD Exacerbation – Bronchodilator.

RI EQR Technical Report 2013 - Aggregate Page 14 of 81
VI. ENROLLMENT Figures 4, 4a, 5 and 6 depict Health Plan enrollment as of December 31, 2012 according to data reported to the State. Figure 4 presents Medicaid managed care enrollment for both Health Plans and the percentage total Medicaid managed care population enrolled in each. NHPRI’s (a Medicaid-only Health Plan) membership comprised the majority (66%) of the total enrollment, with UHCP-RI‘s membership accounting for the remaining 34% of the population. Figure 4. Rhode Island Medicaid Managed Care Enrollment by Health Plan – December 31, 2012
Health Plan
Medicaid Managed Care Enrollment
Percentage of Total Medicaid Managed Care Enrollment
NHPRI 91,219 66%
UHCP-RI 47,422 34%
Total 138,641 100%
Figure 4a provides additional detail, the enrollment by Medicaid eligibility category for NHPRI and UHCP-RI. For both Health Plans, the majority of members are Core RIte Care enrollees at 85% and 81%, respectively. Figure 4a. Health Plan Medicaid Enrollment by Category – December 31, 2012
Medicaid Managed Care Eligibility Group1
NHPRI2 UHCP-RI Total
N % N % N %
Core RIte Care 77,778 85% 38,515 81% 116,293 84%
RIte Care for CSHCN3 5,192 6% 1,522 3% 6,714 5%
RIte Care for Children in Substitute Care 2,024 2% N/A
4 N/A
4 2,024 1%
Rhody Health Partners 6,225 7% 7,385 16% 13,610 10%
Total Medicaid Enrollment 91,219 100%5 47,422 100%5 138,641 100%5
1 Refer to Appendix 1 for a description of how each of the eligibility groups is comprised.
2 In addition to the populations shown here, NHPRI began enrolling a new population in November 2013, Rhody Health Options (RHO), which serves those individual who are dual-eligible for Medicaid and Medicare. This marked the first phase of Rhode Island’s Integrated Care Initiative, which integrates the provision of primary care, acute care, behavioral health care, and long-term care services and supports through care management strategies focused on the person’s needs. Further information regarding NHPRI’s RHO population, including enrollment data and performance measures, will be made available in the Contract Year 2014 reporting cycle.
3 Children with Special Health Care Needs (CSHCN) were enrolled in RIte Care on a voluntary basis, effective 01/29/2003, because only one Health Plan was willing to enroll this population. As of 10/01/2008, managed care enrollment became mandatory for all RIte Care-eligible CSHCN who do not have another primary health insurance coverage. Both of the State’s current Medicaid-participating Health Plans serve CSHCN.
4 UHCP-RI does not serve the RIte Care for Children in Substitute Care (SC) population.
5 Total may not equal 100% due to rounding.

RI EQR Technical Report 2013 - Aggregate Page 15 of 81
Figure 5 presents the Health Plans’ enrollment by product line, including the proportion of total Health Plan membership. As noted previously, NHPRI serves only Medicaid populations. As of December 31, 2012, the majority of UHCP-RI’s membership was enrolled in the Medicaid product-line (59%), followed by Medicare (38%) and Commercial (3%). This information is represented graphically in Figure 6. Figure 5. Health Plan Enrollment by Product Line – December 31, 2012
Product Line
NHPRI UHCP-RI
N % N %
Medicaid 91,219 100% 47,422 59%
Medicare N/A1 N/A
1 30,238 38%
Commercial N/A1 N/A
1 2,366 3%
Total Health Plan Enrollment 91,219 100% 80,026 100% 1 NHPRI did not serve Medicare or Commercial members.
Figure 6 graphically illustrates the data presented in Figure 5. Figure 6. Health Plan Enrollment by Product Line – December 31, 2012
0
20,000
40,000
60,000
80,000
100,000
NHPRI UHCP-RI
91,219
47,422
30,238
2,366
Medicaid Medicare Commercial

RI EQR Technical Report 2013 - Aggregate Page 16 of 81
VII. PROVIDER NETWORK AND GEOACCESS
Health Plans must ensure that a sufficient number of primary and specialty care providers are available to members to allow a reasonable choice among providers. This is required by Federal Medicaid regulations, State licensure requirements, NCQA Accreditation Standards and the State Medicaid Managed Care Services Contract.
Both Health Plans monitor their provider networks for availability and network capability using the GeoAccess software program. This program assigns geographic coordinates to addresses so that the distance between provider locations and members’ homes can be assessed. It can then be determined whether members have adequate access to care within a reasonable distance from their homes.
It is important to note that the Medicaid Managed Care Services Contract has never had “reasonable distance” standards. Regarding the provider network, Section 2.08.01 of the State’s September 2010 Medicaid Managed Care Services Contract states: “Contractor will establish and maintain a geographic network designed to accomplish the
following goals: (1) offer an appropriate range of services, including access to preventive services, primary care services and specialty care services for the anticipated number of enrollees in the services area; (2) maintain providers in sufficient number, mix and geographic area and (3) make available all services in a timely manner.”
For primary care, Section 2.08.02.06 of the Contract states: “Contractor agrees to assign no more than fifteen hundred (1,500) Members to any single PCP in its
network. For PCP teams and PCP sites, Contractor agrees to assign no more than one thousand (1,000) Members per single primary care provider within the team or site, e.g., a PCP team with three (3) providers may be assigned up to 3,000 Members.”
With respect to access, the Contract has always contained service accessibility standards (e.g., days-to-appointment for non-emergency services) including a “travel time” standard in Section 2.09.02 of the State’s September 2010 Contract, which stated as follows:
“Contractor agrees to make available to every Member a PCP whose office is located within or adjacent to the Member’s local primary care area. Primary Care Areas for Rhode Island are available from the Department of Health, Division of Health Statistics. Members may, at their discretion, select PCPs located farther from their homes.”
Consequently, the standards against which reasonable distances are assessed are developed by each Health Plan, based upon Health Plan-specific criteria. For NHPRI, the standard was two (2) clinicians within ten (10) miles for both PCP and OB/GYN providers. NHPRI’s standard for high-volume specialists was one (1) within fifteen (15) miles. UHCP-RI’s GeoAccess survey differed from NHPRI’s in that its results were stratified based on whether members lived in urban, suburban or rural areas. In 2011, UHCP-RI revised its GeoAccess standards so that they were consistent across the three (3) geographic areas and, in 2013, began evaluating access by only one (1) standard. For primary care practitioners, pediatricians and OB/GYNs, the UHCP-RI standard for urban, suburban and rural members was two (2) providers within fifteen (15) miles. For high-volume specialists, the standard for urban, suburban and rural members was a single provider within thirty (30) miles. Figure 7 shows the percentage of members for whom the Health Plans’ respective geographic access standards were met for three (3) provider types: PCPs, OB/GYNs and high-volume specialists. The results of these surveys revealed that the Health Plan-specified standards were met or exceeded for both Health Plans for all provider

RI EQR Technical Report 2013 - Aggregate Page 17 of 81
types displayed; NHPRI met/exceeded its goal of 97% for all provider types, and UHCP-RI met/exceeded its standard of 100% for all provider types. Additional access indicators are described in each of the Health Plan specific Technical Reports.
Figure 7. GeoAccess Provider Network Accessibility – 2013
Provider Type Access Standard1 Percentage of Members
for Whom Access Standard was Met
NHPRI (as of 1/2013)
Primary Care Practitioners 2 within 10 miles 100%
OB/GYNs 2 within 10 miles 98%
High-volume Specialists2 1 within 15 miles 99%
UHCP-RI (as of 2/2013)
Primary Care Practitioners 2 within 15 miles (urban) 100%
2 within 15 miles (suburban) 100%
2 within 15 miles (rural) 100%
OB/GYNs 2 within 15 miles (urban) 100%
2 within 15 miles (suburban) 100%
2 within 15 miles (rural) 100%
High-volume Specialists3 1 within 30 miles (urban) 100%
1 within 30 miles (suburban) 100%
1 within 30 miles (rural) 100% 1
The Access Standard is measured by distance in miles to member. Both Health Plans established their respective GeoAccess standards, and all standards are compliant with the State Medicaid Managed Care Services Contract
requirements. 2
High-volume specialists for NHPRI are defined as Allergists, Dermatologists, Ophthalmologists, Optometrists, Orthopedists, Otolaryngologists and Urgent Care.
3 High-volume specialists for UHCP-RI are defined as OB/GYNs, Cardiologists, Dermatologists, ENTs, Gastroenterologists, General Surgeons, Ophthalmologists, Orthopedists, Rheumatologists and any others that generate more than 5% of total claims.
HEDIS® Board Certification rates illustrate the percentage of physicians in the provider network that are board certified. Figure 8 presents the results and ranking for both Health Plans for years 2011 through 2013. Of the six (6) practitioner types displayed (Pediatricians, Internal Medicine, Family Medicine, OB/GYNs, Geriatricians and Other Physician Specialists), the statewide rate and both Health Plans’ rates met or exceeded the Medicaid Mean for all provider types. In addition, although most statewide rates remained relatively stable over the reporting years shown below, the rate for one provider type, OB/GYNs, demonstrated improvement in 2013 by achieving the Quality Compass® 2013 90th Percentile benchmark. Conversely, the statewide Board Certification rate for Geriatricians declined from 2011 to 2013 by ten (10) percentage points.

RI EQR Technical Report 2013 - Aggregate Page 18 of 81
Figure 8. HEDIS® Board Certification Results 2011-2013
89.1% 81.7% 83.1% 88.5% 80.6% 82.2% 90.5% 82.5% 84.3% 70.0%
75.0%
80.0%
85.0%
90.0%
95.0%
NHPRI UHCP-RI Statewide
Internal Medicine
90.6% 80.4% 82.7% 89.9% 80.3% 82.7% 92.5% 80.7% 83.8% 70.0%
75.0%
80.0%
85.0%
90.0%
95.0%
NHPRI UHCP-RI Statewide
Family Medicine
87.7% 86.3% 86.5% 92.8% 82.7% 84.5% 93.5% 83.6% 85.5% 70.0%
75.0%
80.0%
85.0%
90.0%
95.0%
NHPRI UHCP-RI Statewide
Pediatricians
2011 2012 2013 HEDIS® 2013 Mean HEDIS® 2013 90th Percentile

RI EQR Technical Report 2013 - Aggregate Page 19 of 81
Figure 8. HEDIS® Board Certification Results 2011-2013 (continued)
83.6% 85.9% 85.5% 74.4% 86.6% 84.2% 82.6% 90.7% 89.1% 70.0%
75.0%
80.0%
85.0%
90.0%
95.0%
NHPRI UHCP-RI Statewide
OB/GYN Physicians
86.4% 82.6% 84.4% 86.4% 68.9% 74.6% 73.9% 74.4% 74.2% 60.0%
65.0%
70.0%
75.0%
80.0%
85.0%
90.0%
95.0%
100.0%
NHPRI UHCP-RI Statewide
Geriatricians
89.3% 75.7% 77.7% 89.2% 76.7% 79.0% 90.1% 79.6% 81.4% 65.0%
70.0%
75.0%
80.0%
85.0%
90.0%
95.0%
NHPRI UHCP-RI Statewide
Other Physician Specialists
2011 2012 2013 HEDIS® 2013 Mean HEDIS® 2013 90th Percentile
RI EQR Technical Report 2013 - Aggregate Page 20 of 81
VIII. RHODE ISLAND MEDICAID’S PERFORMANCE GOAL PROGRAM17 In order to measure the quality of care provided by each of the Health Plans, the State prepares and reviews a number of reports on a variety of quality indicators – both national metrics (HEDIS® and CAHPS®) and State-specified measures.
Rhode Island Medicaid Managed Care Performance Goal Program Background
In 1998 the State initiated the Performance Goal Program, an incentive program that established benchmark standards for quality and access performance measures. Rhode Island was the second state in the nation to implement a value-based purchasing initiative for its Medicaid program. In 2013, the Performance Goal Program entered its fifteenth (15th) year. The 2005 Reporting Year marked a particularly important transition for the Performance Goal Program, wherein the program was redesigned to be more fully aligned with nationally recognized performance benchmarks through the use of new performance categories and standardized HEDIS® and CAHPS® measures. In addition, superior performance levels were clearly established as the basis for incentive awards. Since the 2005 Reporting Year, six (6) of the following nine (9) performance categories have been used to evaluate Health Plan performance:
Member Services Medical Home/Preventive Care Women's Health Chronic Care Behavioral Health Resource Maximization Children With Special Health Care Needs (added in 2010) Children in Substitute Care18 (added in 2011) Rhody Health Partners (added in 2011)
Within these categories is a series of measures, including a variety of standard HEDIS® and CAHPS® measures, as well as State-specified measures for areas of particular importance to the State that do not have national metrics for comparison. Many of the measures are calculated through the Health Plan’s HEDIS® and CAHPS®
data submissions. Other measures are derived from data collected during the annual on-site Health Plan monitoring visits conducted by EOHHS, and others are calculated by EOHHS using encounter data submitted by the Health Plan to EOHHS. For the reference period of Calendar Year 2012, the evaluation was conducted by EOHHS in May 2013. Prior to 2005, the State specified performance goal standards in its contracts with Health Plans, and Health Plans received awards based on meeting or exceeding the specified targets. From 2005 to 2010, Rhode Island’s Medicaid-participating Health Plans were benchmarked against the Contract standards, as well as national Medicaid HEDIS® percentiles. Health Plans that met or exceeded the 90th percentile received a full award for those measures, and Health Plans that met or exceeded the 75th percentile received a partial award for those measures.
17
The rates for all PGP measures for NHPRI and UHCP-RI include all Medicaid members where eligible population criteria are met.
18 UHCP-RI does not serve the Children in Substitute Care population.

RI EQR Technical Report 2013 - Aggregate Page 21 of 81
As of 2011, only Quality Compass® benchmarks are used to assess performance for all HEDIS® and CAHPS®
measures, as directed in Attachment M of the State’s 2009/2010 Medicaid Managed Care Services Contract. PGP 2011 was the first year that several measure benchmarks were set at the 75th percentile (full award) and the 50th percentile (partial award). The following measures were included: HEDIS® Adult BMI Assessment, HEDIS® Weight Assessment and Counseling for Nutrition and Physical Activity for Children/Adolescents and HEDIS®
Antidepressant Medication Management. State-selected targets continued to be used for the State-specified measures, as no national benchmark data exists. In addition, modifications made to the Performance Goal Program in 2011 included a change in the allocation of full incentive award percentages. Available percentage points were reduced for the Member Services domain and increased for the Behavioral Health domain.
Changes in Methodology for the 2013 Performance Goal Program
The 2013 Performance Goal Program underwent few changes from the 2012 PGP. For 2013 PGP, the following measure was introduced: HEDIS® Members with Persistent Asthma Used Appropriate Meds (Total). This measure is an aggregate of the Members with Persistent Asthma Used Appropriate Meds age group stratified measures. Prior to the 2013 PGP, each age-stratified measures was eligible for the incentive award; however, only the total rate was used in calculation of the 2013 incentive. Although the age-stratified HEDIS® Members with Persistent Asthma Used Appropriate Meds measures were not individually eligible for inclusion in the incentive award, rates for these measures are presented. As in the past, any measure rate rotated by the Health Plans was not eligible for incentive awards.
THIS SPACE INTENTIONALLY LEFT BLANK

RI EQR Technical Report 2013 - Aggregate Page 22 of 81
2013 Rhode Island Medicaid Managed Care Performance Goal Program Results
This report evaluates both Health Plans’ results for the 2013 Performance Goal Program compared to HEDIS®
percentiles derived from the NCQA’s Quality Compass® 2012 for Medicaid. As such, these percentiles may differ from the Quality Compass® 2013 benchmark data displayed elsewhere in this report. The Member Services domain is comprised of four (4) State-specified measures regarding Health Plan processes related to new members and appeals and grievances, ID Cards Sent within 10 Days of Notification of Enrollment, Member Handbook Sent within 10 Days of Notification of Enrollment, Two Welcome Call Attempts within the First 30 Days of Enrollment and Grievances and Appeals Resolved within Federal (BBA) Timeframes. NHPRI met the State-selected goal for two of the four (2 of the 4) measures, Two Welcome Call Attempts within the First 30 Days of Enrollment and Grievances and Appeals Resolved within Federal (BBA) Timeframes, demonstrating an improvement from the 2012 PGP. UHCP-RI did not meet the Contract goal for any of the four (4) measures. This represents a decline in performance for UHCP-RI, as the Health Plan met the Contract goal for one of the four (1 of the 4) measures during the previous reporting period. An important consideration is that the specification for the measure related to New Member Welcome Calls was revised from Welcome Calls Completed within 30 Days of Enrollment to Two Welcome Call Attempts within the First 30 Days of Enrollment and the goal increased from 65% to 98%.
Overall, the Health Plans performed well and demonstrated improvement in the Medical Home/Preventive Care domain, with rates exceeding the Quality Compass® 2012 90th or 75th percentiles for many measures. Both Health Plans achieved the Quality Compass® 2012 90th or 75th percentile goal for each of the following HEDIS®/CAHPS® measures: CAHPS® Members Were Satisfied with Access to Urgent Care, CAHPS® Medical Assistance with Smoking/Tobacco Use Cessation, Adults’ Access to Preventive/Ambulatory Care (20-44 years and 45-64 years), Children’s Access to PCPs (12-24 Months, 25 Months-6 Years, 7-11 Years, 12-19 Years), Well-Child Visits in the First 15 Months of Life, Well-Child Visits in the Third, Fourth, Fifth and Sixth Years of Life, Adolescent Well-Care Visits, Adolescent Immunization Status, Childhood Immunization Status: Combo 3 and Combo 10, Lead Screening in Children, Pregnant Members Received Timely Prenatal Care and Frequency of Ongoing Prenatal Care (81% +). Both Health Plans exceeded the 50th or 75th percentile goal for all three (3) Weight Assessment & Counseling for Children and Adolescents (3-17 Years) measures: Weight Assessment and Counseling – Nutrition, Weight Assessment and Counseling – BMI Percentile and Weight Assessment and Counseling – Physical Activity. This demonstrated improvement for both NHPRI and UHCP-RI. Only UHCP-RI achieved a rate that met a Quality Compass® 2012 75th percentile goal for the following HEDIS®
measure: Timely Postpartum Care. In addition, neither Health Plan met the Quality Compass® benchmark goal for the HEDIS® Use of Imaging for Low Back Pain measure. In regard to the State-specified measure Five (5) Percentage Point Reduction In the Rate of Emergency Department (ED) Visits for Ambulatory Care Sensitive Conditions (ACSCs)19, the Rhode Island State Medicaid Program demonstrates an opportunity for improvement as neither Health Plan achieved the State-selected goals any of the four (4) applicable populations (Core RIte Care, CSHCN, SC and RHP)20. This represented a decline from the 2012 PGP when each Health Plan, NHPRI and UHCP-RI, met the State-selected goal for two (2) of the applicable populations.
19
The State’s Medicaid Managed Care Services Contract (09/01/2010) requires that all Health Plans establish and maintain a Communities of Care program to decrease non-emergent and avoidable ED utilization and costs through service coordination, defined member responsibilities and associated incentives and rewards.
20 UHCP-RI does not serve the Children in Substitute Care population.
RI EQR Technical Report 2013 - Aggregate Page 23 of 81
In the Medical Home/Preventive Care domain, five (5) measures were reported as baseline measurements: Monitoring of Persistent Medications – ACE/ARBs, Digoxin, Diuretics, Anticonvulsants and Total. In the Women’s Health domain, performance varied between the two (2) Health Plans. For the three measures included, Cervical Cancer Screening, Chlamydia Screening (16-20 Years) and Chlamydia Screening (21-24 Years), NHPRI maintained or improved its performance in the 2012 PGP by exceeding at least the Quality Compass®
2012 75th percentile goal for all measures. Conversely, UHCP-RI demonstrated an opportunity for improvement in this domain, as the Health Plan’s rates for all three Women’s Health measures failed to meet the 2012 Quality Compass® goal. Of the five (5) applicable measures in the Chronic Care domain, only NHPRI met or exceeded the Quality Compass® 2012 75th percentile for the following HEDIS® measures: Members with Persistent Asthma are Prescribed Appropriate Medications (Total), Members with Diabetes had HbA1c Testing and Controlling High Blood Pressure (<140/90). Both Health Plans exceeded the established goals for the Pharmacotherapy for Management of COPD Exacerbation – Systemic Corticosteroid and Pharmacotherapy for Management of COPD Exacerbation – Bronchodilator measures. The remaining four (4) measures in this domain, Members with Persistent Asthma are Prescribed Appropriate Medications (5-11 Years, 12-18 Years, 19-50 Years and 51-64 Years), were recorded but were not eligible for an incentive award.
The 2012 PGP included an expansion of the Behavioral Health domain, adding a fourth (4th) HEDIS® measure, Members 6 Years of Age and Older Get Follow-Up by 7 Days Post-Discharge. For the 2013 PGP, NHPRI performed well, achieving an incentive for all four (4) measures. NHPRI exceeded the Quality Compass® 2012 90th percentile for Members 6 Years of Age and Older Get Follow-Up by 7 Days Post Discharge, Members 6 Years of Age and Older Get Follow-Up by 30 Days Post Discharge and Follow-up Care for Children Prescribed Medication for ADHD: Initiation Phase. Both NHPRI and UHCP-RI achieved the 50th percentile benchmark for the Antidepressant Medication Management: Effective Acute Phase. In addition, UHCP-RI met the 75th percentile benchmark for Follow-up Care for Children Prescribed Medication for ADHD: Initiation Phase; however, failed to meet the Quality Compass® goal for the Members 6 Years of Age and Older Get Follow-Up by 7 Days Post-Discharge and 30 Days Post-Discharge measures. Both Health Plans continue to meet the sole measure in the Cost Management domain (formerly Resource Maximization), Notify the State of TPL (Third Party Liability) within Five (5) Days of Identification. Overall, NHPRI demonstrated better performance for the 2013 PGP than UHCP-RI. The Health Plan met a total of forty-two (42) of the fifty (50) applicable PGP measures21, nine (9) of fifteen (15) State-specified measures (including six (6) of nine (9) measures related to the Special Enrollment Populations) and thirty-three (33) of thirty-five (35) HEDIS®/CAHPS® measures. Comparatively, UHCP-RI’s PGP evaluation was comprised of a total of forty-seven (47) PGP measures, as three (3) of fifteen (15) State-specified measures were designated ‘N/A’ due to UHCP-RI’s lack of Children in Substitute Care (SC) population. This resulted in a total of forty-seven (47) total PGP measures, including twelve (12) State-specified measures. UHCPRI met a total of twenty-eight (28) of the forty-seven (47) applicable PGP measures, including two (2) of twelve (12) applicable State-specified measures and twenty-six (26) of thirty-five (35) HEDIS®/CAHPS® PGP measures.
21
For NHPRI, there were three (3) additional performance measures related to the special enrollment populations, as the Health Plan served SC enrollees, in addition to CSHCN and RHP enrollees. This resulted in NHPRI having at total of fifty (50) applicable PGP measures.

RI EQR Technical Report 2013 - Aggregate Page 24 of 81
Counts for both Health Plans excluded PGP measures designated as baseline and those that were not eligible for an incentive award. Figure 9 displays the Performance Goal Program scores for each of the Health Plans. It is important to note that a total of five (5) HEDIS®/CAHPS® PGP measures were baseline measurements and/or had no respective benchmark. In addition, four (4) measures related to Members with Persistent Asthma Received Appropriate Medication were noted as ‘N/A’ as these measures were not used for calculation of the incentive award. Graphs of select measures follow Figure 9. Figures 10, 11, 12 and 13 graphically depict Health Plan and statewide performance on measures not displayed elsewhere in this report, including CAHPS®, HEDIS® and State-specified measures in the Medical Home/Preventive Care (Figure 10), Chronic Care (Figure 11), Behavioral Health (Figure 12) and Cost Management (Figure 13) domains. Certain measures are not graphed due to insufficient data points (e.g., new PGP measures) or because the 2013 PGP measures were based on HEDIS® or CAHPS® measures exhibited elsewhere in this report. In addition, the measure, Members with Persistent Asthma Received Appropriate Medication (Total), was introduced for PGP 2013; therefore, there are insufficient data points to display the rates for this measure in Figure 10. The 2013 results for this measure are provided in Figure 9.
THIS SPACE INTENTIONALLY LEFT BLANK

RI EQR Technical Report 2013 - Aggregate Page 25 of 81
Figure 9. Performance Goal Program Rates – 20131, 2, 3
RI Medicaid Managed Care 2012 Performance Measures
NHPRI UHCP-RI
2013
Quality Compass
® 2012
90th
/75th
/50th
Percentile Met
3
2013
Quality Compass
® 2012
90th
/75th
/50th
Percentile Met
3 Member Services
ID Cards Sent within 10 Days of Notification of Enrollment4 NM NM
Member Handbook Sent within 10 Days of Notification of Enrollment4 NM NM
Two Welcome Call Attempts within the First 30 Days of Enrollment4 M/E NM
Grievances and Appeals Resolved within Federal (BBA) Timeframes4 M/E NM
Medical Home/Preventive Care
CAHPS® Members Were Satisfied with Access to Urgent Care 86.9% 90th
86.0% 75th
Reduce ED Visits for ACSCs by 5 Percentage Points – Core RC Members4,5 NM NM
Reduce ED Visits for ACSCs by 5 Percentage Points – RC for CSHCN4,5 NM NM
Reduce ED Visits for ACSCs by 5 Percentage Points – RC for SC4,5 ,6 NM N/A
Reduce ED Visits for ACSCs by 5 Percentage Points – RHP4,5 NM NM
CAHPS® Medical Assistance with Smoking /Tobacco Use Cessation7 81.0% 75th
84.4% 90th
HEDIS® Adults Had Ambulatory/Preventive Care Visit (20-44 Years) 88.9% 90th 88.6% 90
th
HEDIS® Adults Had Ambulatory/Preventive Care Visit (45-64 Years) 91.3% 90th 92.9% 90
th
HEDIS® Infants Had Well-Child Visits in First 15 Months of Life (6+ Visits) 81.2% 90th 83.1% 90
th
HEDIS® Children Had Well-Child Visits in 3rd, 4th, 5th & 6th Years of Life 83.1% 90th 81.2% 75
th
HEDIS® Children Received Immunizations by 2nd Birthday – Combination 3 80.3% 75th
83.0% 90th
HEDIS® Children Received Immunizations by 2nd Birthday – Combination 108 55.2% 90th 56.2% 90
th
HEDIS® Adolescents Received Immunizations by 13th Birthday 84.6% 90
th 84.0% 90th
HEDIS® Children Received Periodic PCP Visits (12-24 Months) 98.4% 90th 98.6% 90
th
HEDIS® Children Received Periodic PCP Visits (25 Months-6 Years) 94.4% 90th 95.3% 90
th
HEDIS® Children Received Periodic PCP Visits (7-11 Years) 96.7% 90th 97.2% 90
th
HEDIS® Children Received Periodic PCP Visits (12-19 Years) 95.0% 90th 96.5% 90
th
HEDIS® Lead Screening in Children 86.0% 75th
83.9% 75th
M/E = Met or Exceeded Contract goal NM = Did not meet Contract goal BM = Baseline measurement N/A = Not applicable for measurement

RI EQR Technical Report 2013 - Aggregate Page 26 of 81
Figure 9. Performance Goal Program Rates – 20131, 2, 3 (continued)
RI Medicaid Managed Care 2012 Performance Measures
NHPRI UHCP-RI
2013 Rate
Quality Compass
® 2012
90th
/75th
/50th
Percentile Met3
2013 Rate
Quality Compass
® 2012
90th
/75th
/50th
Percentile Met
3 Medical Home/Preventive Care (continued)
HEDIS® Pregnant Members Received Timely Prenatal Care 94.4% 90th
91.8% 75th
HEDIS® Postpartum Members Received Timely Postpartum Care 69.9% NM 72.0% 75th
HEDIS® Adolescent Well-Care Visits 66.7% 90th
66.5% 90th
HEDIS® Frequency of Ongoing Prenatal Care (> 81% of Expected Visits) 80.1% 75th 73.2% 75
th
HEDIS® Adult BMI Assessment (15-74 Years)9 76.1% 75th 67.2% 50
th
HEDIS® Weight Assessment /Counseling (3-17 Years) – BMI Percentile9 68.6% 75th 54.0% 50
th
HEDIS® Weight Assessment /Counseling (3-17 Years) – Nutrition9 71.3% 75th 65.9% 50
th
HEDIS® Weight Assessment /Counseling (3-17 Years) – Physical Activity9 56.5% 75th 55.7% 50
th
HEDIS® Monitoring of Persistent Medications – ACE/ARB10 84.7% BM 85.6% BM
HEDIS® Monitoring of Persistent Medications – Digoxin10 84.2% BM 80.0% BM
HEDIS® Monitoring of Persistent Medications – Diuretics10 84.2% BM 84.8% BM
HEDIS® Monitoring of Persistent Medications – Anticonvulsants10 69.5% BM 73.6% BM
HEDIS® Monitoring of Persistent Medications – TOTAL10 82.9% BM 83.7% BM
HEDIS® Use of Imaging for Low Back Pain11 72.0% NM 66.9% NM
Women’s Health
HEDIS® Women Received Cervical Cancer Screening (21-64 Years) 81.9% 90th
72.0% NM
HEDIS® Women Received Chlamydia Screening (16-20 Years) 64.2% 75th 59.2% NM
HEDIS® Women Received Chlamydia Screening (21-24 Years) 70.9% 75th 65.1% NM
Chronic Care
HEDIS® Members with Persistent Asthma Used Appropriate Meds (5-11 Years)11,12 92.9% N/A 92.9% N/A
HEDIS® Members with Persistent Asthma Used Appropriate Meds (12-18 Years)11,12 92.0% N/A 83.1% N/A HEDIS® Members with Persistent Asthma Used Appropriate Meds (19-50 Years)11,12
82.8% N/A 75.4% N/A HEDIS® Members with Persistent Asthma Used Appropriate Meds (51-64 Years)11,12
81.0% N/A 68.6% N/A HEDIS® Members with Persistent Asthma Used Appropriate Meds (Total)12,13 89.3% 75
th 81.3% NM
HEDIS® Members with Diabetes Had HbA1c Testing (18-75 Years) 88.8% 75th 83.7% NM
M/E = Met or Exceeded Contract goal NM = Did not meet Contract goal BM = Baseline measurement N/A = Not applicable for measurement

RI EQR Technical Report 2013 - Aggregate Page 27 of 81
Figure 9. Performance Goal Program Rates – 20131, 2, 3 (continued)
Rhode Island Medicaid Managed Care 2012 Performance Measures
NHPRI UHCP-RI
2013 Rate
Quality Compass
® 2012
90th
/75th
/50th
Percentile Met
3
2013 Rate
Quality Compass
® 2012
90th
/75th
/50th
Percentile Met3
Chronic Care (continued)
HEDIS® Controlling High Blood Pressure (< 140/90) (18-85 Years) 64.5% 75th
61.1% NM
HEDIS® Pharmacotherapy for Management of COPD Exacerbation – Bronchodilators 88.7% 90th 91.6% 90
th
HEDIS® Pharmacotherapy for Management of COPD Exacerbation – Systemic Corticosteroids11 83.2% 90
th 77.3% 90th
Behavioral Health
HEDIS® Members 6 Years of Age and Older Get Follow-up by 30 Days Post-Discharge 85.0% 90th 77.0% NM
HEDIS® Members 6 Years of Age and Older Get follow-up by 7 Days Post-Discharge 71.6% 90
th 55.8% NM
HEDIS® Antidepressant Medication Management: Effective Acute Phase9 51.2% 50th
52.0% 50th
HEDIS® Follow-up Care for Children Prescribed Medication for ADHD: Initiation Phase 59.1% 90th
48.5% 75th
Cost Management
Notify the State of TPL (third party liability) within 5 Days of Identification4 M/E M/E
Children With Special Health Care Needs (CSHCN)
Initial Health Screen Completed within 45 Days4,14 M/E NM
Active Care Management Plans Evaluated and Updated as Needed, But No Less Than Every 6 Months4, 14
M/E
N/A
Children in Substitute Care (Foster)6
Initial Health Screen Completed within 45 Days4,14 M/E N/A
Active Care Management Plans Evaluated and Updated as Needed, But No Less Than Every 6 Months4,14 M/E
N/A
Rhody Health Plan Partners (RHP)
Initial Health Screen Completed within 45 Days4,14 M/E NM
Active Care Management Plans Evaluated and Updated as Needed, But No Less Than Every 6 Months4,14
M/E M/E
M/E = Met or Exceeded Contract goal NM = Did not meet Contract goal BM = Baseline measurement N/A = Not applicable for measurement

RI EQR Technical Report 2013 - Aggregate Page 28 of 81
1 Performance Goal Program data are based on the previous Contract Year (i.e., 2013 rates are based on Contract Year 2012). Rates may differ slightly from other data published in this report, as this figure reflects preliminary HEDIS
® and CAHPS
® rates, while rates in all other figures reflect final data submitted to the NCQA. In
addition, it is important to note that, where applicable and eligible population criteria are met, all Medicaid members (Core, CSHCN, SC and RHP) are included in the rates, including State-specified measures, unless noted otherwise.
2 For State-specified measures, national benchmarks were not available. Incentive awards were determined using State-selected benchmarks. These are defined in the September 2010 Medicaid Managed Care Services Contract, Attachment M.
3 For HEDIS
®- and CAHPS
®-based measures, incentive awards were based, where applicable and available, on national Medicaid Quality Compass
® 2012 90
th, 75
th and
50th
percentile benchmarks (unless otherwise noted). 4
State-specified measure. 5
Reduction in Emergency Department (ED) Visits for Ambulatory Care-Sensitive Conditions (ACSCs) was reported by product line for the first time for the 2011 PGP. Previously, an aggregate rate was reported across Health Plan membership. The measure goal was a 5 percentage point reduction, year over year, in the rate calculated by the State for each of the applicable populations.
6 Children in Substitute Care (Foster) are served only by NHPRI.
7 Due to changes in HEDIS
® methodology, the CAHPS
® measure, Medical Assistance with Smoking/Tobacco Use Cessation, was not included in the Performance Goal
Program for 2010 or 2011. This measure was re-introduced in 2012. 8 The 2013 PGP was the first year that Health Plans’ findings for the following measures were eligible for incentive awards, as benchmarks were included for the first
time in Quality Compass®
2012 for Medicaid: Childhood Immunization: Combination 10. 9 The benchmarks for incentive awards were the 75
th percentile (full award) and the 50
th percentile (partial award) for the following measures: Adult BMI Assessment,
Weight Assessment and Counseling (3-17 Years) for BMI Percentile, Nutrition and Physical Activity and Antidepressant Medication Management: Effective Acute Phase.
10 Benchmarks were available in Quality Compass
® 2012 for Monitoring of Persistent Medications – ACE/ARB, Diuretics, Digoxin, Anticonvulsants and Total; however,
the rates continue to serve as a baseline for PGP 2013. 11
Rates for the following measures are presented for PGP 2013; however, they were not eligible for an incentive award: HEDIS®
Members with Persistent Asthma Used Appropriate Meds (5-11 years), HEDIS
® Members with Persistent Asthma Used Appropriate Meds (12-18 years), HEDIS
® Members with Persistent Asthma Used
Appropriate Meds (19-50 years) and HEDIS®
Members with Persistent Asthma Used Appropriate Meds (51-64 years). 12
Prior to PGP 2012, the HEDIS
® Members with Persistent Asthma Used Appropriate Meds reported a single rate for the age group 12-50 years old. For the 2012 PGP,
this age group was split, with rates reported separately for ages 5-11 years, 12-18 years, 19-50 years and 51-64 years. For PGP 2013, all age groups were reported, in addition to an aggregate measure, HEDIS
® Members with Persistent Asthma Used Appropriate Meds (Total); however, the incentive award calculation was based
solely on the total rate. 13
The following was a first-year measure for the 2013 PGP: HEDIS
® Members with Persistent Asthma Used Appropriate Meds (Total). This rate was not considered a
baseline measurement as this measure is an aggregate of previously reported PGP measures and Quality Compass®
2012 benchmarks were available. 14
The following State-specified measures were eligible for incentive awards: Initial Health Screens within 45 Days of Enrollment and Active Care Management Plans are Evaluated and Updated, as Needed, No Less than Every 6 Months for the CSHCN, Children in Substitute Care (NHPRI only) and RHP special enrollment populations. The 2013 PGP monitoring visits marked the third year in which new member engagement and care management files were reviewed for the RHP and RIte Care for Children in Substitute Care (NHPRI only) special enrollment populations.
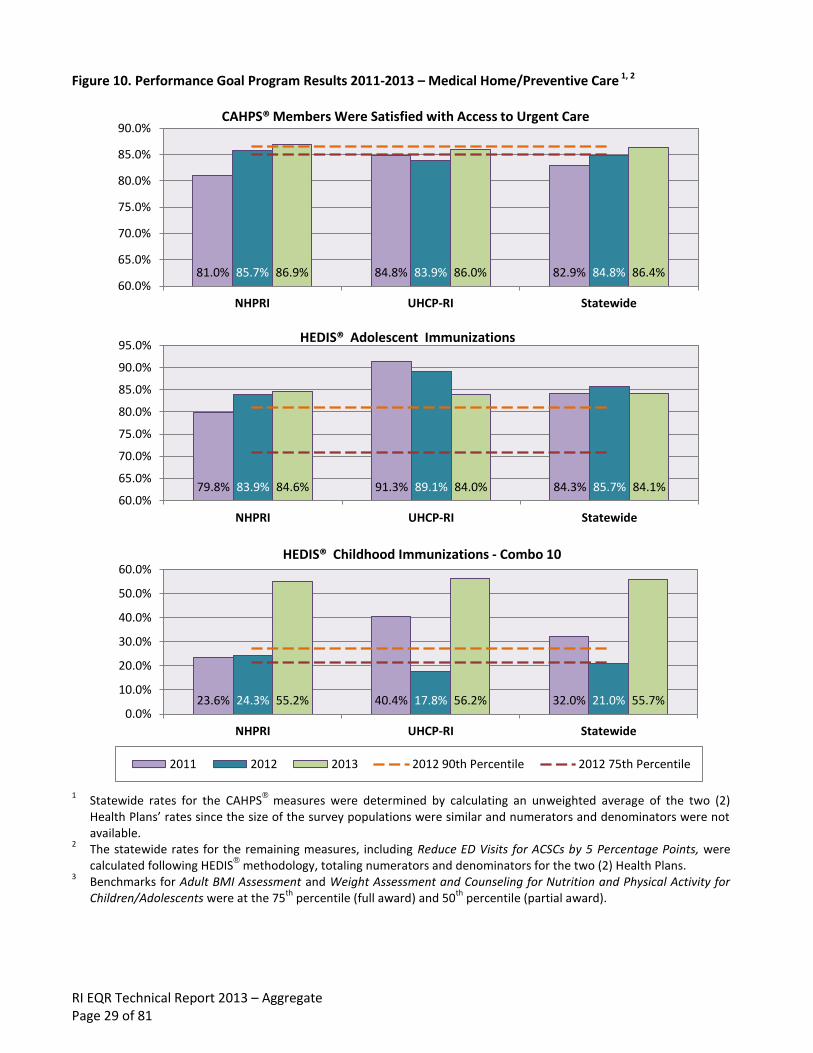
RI EQR Technical Report 2013 – Aggregate Page 29 of 81
Figure 10. Performance Goal Program Results 2011-2013 – Medical Home/Preventive Care 1, 2
1
Statewide rates for the CAHPS®
measures were determined by calculating an unweighted average of the two (2) Health Plans’ rates since the size of the survey populations were similar and numerators and denominators were not available.
2 The statewide rates for the remaining measures, including Reduce ED Visits for ACSCs by 5 Percentage Points, were calculated following HEDIS
® methodology, totaling numerators and denominators for the two (2) Health Plans.
3 Benchmarks for Adult BMI Assessment and Weight Assessment and Counseling for Nutrition and Physical Activity for
Children/Adolescents were at the 75th
percentile (full award) and 50th
percentile (partial award).
81.0% 84.8% 82.9% 85.7% 83.9% 84.8% 86.9% 86.0% 86.4% 60.0%
65.0%
70.0%
75.0%
80.0%
85.0%
90.0%
NHPRI UHCP-RI Statewide
CAHPS® Members Were Satisfied with Access to Urgent Care
79.8% 91.3% 84.3% 83.9% 89.1% 85.7% 84.6% 84.0% 84.1% 60.0%
65.0%
70.0%
75.0%
80.0%
85.0%
90.0%
95.0%
NHPRI UHCP-RI Statewide
HEDIS® Adolescent Immunizations
23.6% 40.4% 32.0% 24.3% 17.8% 21.0% 55.2% 56.2% 55.7% 0.0%
10.0%
20.0%
30.0%
40.0%
50.0%
60.0%
NHPRI UHCP-RI Statewide
HEDIS® Childhood Immunizations - Combo 10
2011 2012 2013 2012 90th Percentile 2012 75th Percentile

RI EQR Technical Report 2013 – Aggregate Page 30 of 81
Figure 10. Performance Goal Program Results 2011-2013 – Medical Home/Preventive Care 1, 2 (continued)
1
Statewide rates for the CAHPS®
measures were determined by calculating an unweighted average of the two (2) Health Plans’ rates since the size of the survey populations were similar and numerators and denominators were not available.
2 The statewide rates for the remaining measures, including Reduce ED Visits for ACSCs by 5 Percentage Points, were calculated following HEDIS
® methodology, totaling numerators and denominators for the two (2) Health Plans.
3 Benchmarks for Adult BMI Assessment and Weight Assessment and Counseling for Nutrition and Physical Activity for
Children/Adolescents were at the 75th
percentile (full award) and 50th
percentile (partial award).
79.8% 91.3% 84.3% 83.9% 89.1% 85.7% 84.6% 84.0% 84.1% 60.0%
70.0%
80.0%
90.0%
100.0%
NHPRI UHCP-RI Statewide
HEDIS® Lead Screening in Children
71.8% 64.9% 69.6% 72.7% 68.6% 71.3% 72.0% 66.9% 70.3% 50.0%
60.0%
70.0%
80.0%
90.0%
NHPRI UHCP-RI Statewide
HEDIS® Use of Imaging for Low Back Pain
2011 2012 2013 2012 90th Percentile 2012 75th Percentile
49.2% 32.9% 41.0% 56.2% 51.3% 53.8% 76.1% 67.2% 71.6% 0.0%
20.0%
40.0%
60.0%
80.0%
100.0%
NHPRI UHCP-RI Statewide
HEDIS® Adult BMI Assessment (15-74 Years)3
2011 2012 2013
2012 90th Percentile 2012 75th Percentile 2012 50th Percentile

RI EQR Technical Report 2013 – Aggregate Page 31 of 81
Figure 10. Performance Goal Program Results 2011-2013 – Medical Home/Preventive Care 1, 2 (continued)
1
Statewide rates for the CAHPS®
measures were determined by calculating an unweighted average of the two (2) Health Plans’ rates since the size of the survey populations were similar and numerators and denominators were not available.
2 The statewide rates for the remaining measures, including Reduce ED Visits for ACSCs by 5 Percentage Points, were calculated following HEDIS
® methodology, totaling numerators and denominators for the two (2) Health Plans.
3 Benchmarks for Adult BMI Assessment and Weight Assessment and Counseling for Nutrition and Physical Activity for
Children/Adolescents were at the 75th
percentile (full award) and 50th
percentile (partial award).
41.6% 25.3% 33.6% 52.8% 36.3% 44.5% 68.6% 54.0% 61.3% 0.0%
20.0%
40.0%
60.0%
80.0%
100.0%
NHPRI UHCP-RI Statewide
HEDIS® Weight Assessment & Counseling (3-17 Years) - BMI Percentile3
59.6% 62.3% 60.9% 66.2% 63.5% 64.8% 71.3% 65.9% 68.6% 0.0%
20.0%
40.0%
60.0%
80.0%
100.0%
NHPRI UHCP-RI Statewide
HEDIS® Weight Assessment & Counseling (3-17 Years) - Nutrition3
38.9% 54.7% 46.8% 46.5% 49.6% 48.1% 56.4% 55.7% 56.1% 0.0%
10.0%
20.0%
30.0%
40.0%
50.0%
60.0%
70.0%
NHPRI UHCP-RI Statewide
HEDIS® Weight Assessment & Counseling (3-17 Years) - Physical Activity3
2011 2012 2013
2012 90th Percentile 2012 75th Percentile 2012 50th Percentile

RI EQR Technical Report 2013 – Aggregate Page 32 of 81
Figure 11. Performance Goal Program Results 2011-2013 – Chronic Care1
1
Members with Persistent Asthma Used Appropriate Medications (Total) not shown as 2013 was the first year of the PGP which included this measure.
63.3% 59.8% 61.5% 68.0% 59.3% 67.0% 64.5% 61.1% 62.7% 50.0%
55.0%
60.0%
65.0%
70.0%
75.0%
NHPRI UHCP-RI Statewide
HEDIS® Controlling High Blood Pressure
89.3% 93.6% 92.2% 81.3% 82.9% 82.4% 88.7% 91.6% 90.2% 50.0%
60.0%
70.0%
80.0%
90.0%
100.0%
NHPRI UHCP-RI Statewide
HEDIS® COPD Exacerbation - Bronchodilator
76.8% 80.9% 79.5% 72.0% 79.1% 76.8% 83.2% 77.3% 80.0% 50.0%
55.0%
60.0%
65.0%
70.0%
75.0%
80.0%
85.0%
NHPRI UHCP-RI Statewide
HEDIS® COPD Exacerbation - Systemic Corticosteroid
2011 2012 2013 2012 90th Percentile 2012 75th Percentile

RI EQR Technical Report 2013 – Aggregate Page 33 of 81
Figure 12: Performance Goal Program Results 2011-2013 – Behavioral Health1, 2
1 For these bar charts, statewide rates were calculated by totaling numerators and denominators for the two Health
Plans. 2
Benchmarks for Antidepressant Medication Management: Effective Acute Phase were at the 75th percentile (full award) and 50th percentile (partial award).
52.2% 41.5% 49.1% 53.5% 41.8% 50.0% 59.1% 48.5% 56.1% 0.0%
10.0%
20.0%
30.0%
40.0%
50.0%
60.0%
70.0%
NHPRI UHCP-RI Statewide
HEDIS® Follow-up Care for Children Prescribed ADHD Medication - Initiation
46.6% 58.8% 51.0% 49.5% 45.2% 48.2% 51.2% 52.0% 51.5% 0.0%
10.0%
20.0%
30.0%
40.0%
50.0%
60.0%
70.0%
NHPRI UHCP-RI Statewide
HEDIS® Antidepressant Rx Management - Effective Acute Phase2
2011 2012 2013
2012 90th Percentile 2012 75th Percentile 2012 50th Percentile

RI EQR Technical Report 2013 – Aggregate Page 34 of 81
Figure 13. Performance Goal Program Results 2011-2013 – Cost Management
THIS SPACE INTENTIONALLY LEFT BLANK
88.0% 100% 94.0% 100% 100% 100% 100% 96.0% 98.0% 80.0%
85.0%
90.0%
95.0%
100.0%
NHPRI UHCP-RI Statewide
Notify EOHHS of TPL (third party liability) within 5 Days
2011 2012 2013 RI Managed Care Contract Standard

RI EQR Technical Report 2013 – Aggregate Page 35 of 81
Monitoring Care and Service Provided to Special Enrollment Populations
HEDIS® Performance for Core RIte Care versus All Populations The Quality Compass® 2012 for Medicaid percentile rankings were used to make comparisons between the HEDIS® and CAHPS® measure rates for Core RIte Care Only members and the rates for All Populations (Core RIte Care, RIte Care for CSHCN, RIte Care for SC (NHPRI only) and RHP members). Performance was considered similar if the rates ranked within the same percentile band and dissimilar if the rates ranked in different percentile bands. A comparison of NHPRI’s rates for the two (2) groups for HEDIS® 2013 demonstrated that performance was similar for forty-one (41) measures and dissimilar for three (3) measures, based on the Quality Compass® 2012 for Medicaid percentile rankings. Of the three (3) measures with dissimilar rates, the rates ranked higher comparatively for All Populations (i.e., with the special enrollment population members included) for two (2) measures and lower for one (1) measure. For the current reporting period, HEDIS® 2013, UHCP-RI’s performance was similar for thirty-eight (38) measures, dissimilar for four (4) measures and was not applicable for two (2) measures, based on the Quality Compass® 2012 for Medicaid percentile rankings. All four (4) measures with dissimilar ranking demonstrated lower rates for All Populations (i.e., with the special enrollment population members included) as compared to Core RIte Care Only. These findings are displayed in the table on the following page.
THIS SPACE INTENTIONALLY LEFT BLANK

RI EQR Technical Report 2013 – Aggregate Page 36 of 81
Figure 14. Comparison of HEDIS® 2013 Performance for Core RIte Care Only versus All Populations
HEDIS® Measure Name
HEDIS®
Measure Name
NHPRI HEDIS®
2012
UHCP-RI HEDIS®
2012
Adults Access to Preventive/Ambulatory Care (Ages 20-44 Years) S S Adults Access to Preventive/Ambulatory Care (Ages 45-64 Years) ▲ S Children’s and Adolescents’ Access to PCPs (Ages 12-24 Months) S S Children’s and Adolescents’ Access to PCPs (Ages 25 Months-6 Years) S S Children’s and Adolescents’ Access to PCPs (Ages 7-11 Years) S S Children’s and Adolescents’ Access to PCPs (Ages 12-19 Years) S S Well-Child Visits in the First 15 Months of Life – 6+ Visits S S Well-Child Visits in the Third, Fourth, Fifth and Sixth Years of Life S S Adolescent Well-Care Visits S S Childhood Immunization: Combo 3 S S Childhood Immunization: Combo 10 S S Lead Screening in Children S S Immunizations for Adolescents S S Prenatal and Postpartum Care – Timeliness of Prenatal Care S S Prenatal and Postpartum Care – Postpartum Care Visit within 21 – 56 Days S S Frequency of Ongoing Prenatal Care > 81+ Percent Expected Visits S S Cervical Cancer Screening in Women (Ages 21-64 Years) S ▼ Chlamydia Screening in Women (Ages 16-20 Years) S S Chlamydia Screening in Women (Ages 21-24 Years) S S Adult BMI Assessment S S Weight Assessment and Counseling for Children/Adolescents – BMI Percentile S S Weight Assessment and Counseling for Children/Adolescents – Physical Activity S S Weight Assessment and Counseling for Children/Adolescents – Nutrition S S Annual Monitoring for Patients on Persistent Medications – Digoxin S S Annual Monitoring for Patients on Persistent Medications – Diuretics S S Annual Monitoring for Patients on Persistent Medications – ACE/ARBs S S Annual Monitoring for Patients on Persistent Medications – Anticonvulsants S S Annual Monitoring for Patients on Persistent Medications – TOTAL S S Use of Appropriate Medications for People with Asthma (Ages 5-11 Years) S S Use of Appropriate Medications for People with Asthma (Ages 12-18 Years) S S Use of Appropriate Medications for People with Asthma (Ages 19-50 Years) S S Use of Appropriate Medications for People with Asthma (Ages 51-64 Years) ▼ ▼ Use of Appropriate Medications for People with Asthma (Total) S S Comprehensive Diabetes Care – HbA1c Testing S S Pharmacotherapy Management of COPD Exacerbation – Bronchodilators S S Pharmacotherapy Management of COPD Exacerbation – Systemic Corticosteroids S S Controlling High Blood Pressure < 140/90 S S Antidepressant Medication Management – Effective Acute Phase Treatment S S Follow-Up Care for Children Prescribed ADHD Medication – Initiation Phase S S Follow-Up Care for Hospitalization for Mental Illness – 30 Days S ▼ Follow-Up Care for Hospitalization for Mental Illness – 7 Days S ▼ Use of Imaging Studies for Low Back Pain
1 S S
CAHPS®
Urgent Care – Get care as soon as you thought you needed it? S N/A
CAHPS®
Medical Assistance with Smoking /Tobacco Use Cessation ▲ N/A 1 A lower rate is better for this measure S Similar (ranking within the same percentile band)
▲ Rate for All Populations (includes special enrollment populations) ranks in a higher percentile band ▼ Rate for All Populations (includes special enrollment populations) ranks in a lower percentile band N/A Not applicable due to population < 30 members or a rate is not available

RI EQR Technical Report 2013 – Aggregate Page 37 of 81
Initial Health Screens and Care Management for Special Enrollment Populations Beginning with the 2011 PGP, two measures, Initial Health Screens within 45 Days of Enrollment and Active Care Management Plans were Evaluated and Updated As Needed, but No Less than Every 6 Months, were examined for each of the three (3) member populations: CSHCN, SC (NHPRI only) and RHP. The State monitoring review was comprised of an assessment of policies and procedures, documentation tools and processes, tracking and follow-up, as well as a case review for a random sample of newly enrolled members of all three (3) populations. NHPRI met the State-selected goal of 95% compliance for conduct of timely initial health screens, for all applicable populations; however, UHCP-RI failed to meet the goal for both the CSHCN and RHP populations. Regarding care management plan updates, NHPRI achieved 100% compliance for all of its member populations (CSHCN, SC and RHP), while UHCP-RI met or exceeded the goal for the RHP population. The Level II Needs Review and Timely Care Plan Updates measures were not applicable for UHCP-RI’s CSHCN population either because no members in the random case file samples were in need of case management or the members’ care plans were not due for update during the review period. Figure 15. Care Management for Special Populations Case Review Results – 2013
Special Enrollment Population Cohort
Initial Health Screen
Level I Needs Review
Level II Needs Review
Timely Care Plan Update
Neighborhood Health Plan of Rhode Island (NHPRI)
Children with Special Health Care Needs (CSHCN) M/E M/E M/E M/E
Children in Substitute Care (SC) M/E M/E M/E M/E
Rhody Health Partners (RHP) M/E NM M/E M/E
UnitedHealthcare Community Plan – Rhode Island (UHCP-RI)
Children with Special Health Care Needs (CSHCN) NM M/E N/A1 N/A2
Rhody Health Partners (RHP) NM M/E M/E M/E
NM = Not Met M/E = Met/Exceeded N/A = Not Applicable 1
The ‘N/A’ designation for the Level II Needs Review measure for the CSHCN population indicates that none of the
members in the case review sample required a Level II Review. 2
The ‘N/A’ designation for the Active Care Management Plans are Evaluated and Updated as Needed, but No Less
Than Every 6 Months measure for the CSHCN population indicates that none of the members in the case review sample required care management services, or the members’ care plan did not require an update within the review period.

RI EQR Technical Report 2013 – Aggregate Page 38 of 81
IX. HEDIS® PERFORMANCE MEASURES
Since NCQA Accreditation is required for participation in Rhode Island’s Medicaid managed care program and HEDIS® performance is an accreditation domain, both of the Health Plans report HEDIS® annually to the NCQA and the State. The two (2) Health Plans’ HEDIS® measure calculations were audited by NCQA-certified audit firms, in conformity with the HEDIS® 2013 Compliance Audit: Standards, Policies and Procedures. Both Health Plans were found compliant with all HEDIS® IS (Information Systems) and HD (HEDIS® Measure Determination) standards. Both Health Plans passed the medical record review validation. As a result, all measures detailed in this report were deemed “Reportable”.
Graphs depicting Health Plan and statewide rates for HEDIS® Effectiveness of Care and Access and Availability measures for Reporting Years 2011 through 2013 and comparative national benchmarks are displayed on the following pages. Additionally, utilization of services was examined via selected HEDIS® Use of Services rates, while Health Plans’ provider networks were evaluated by examining the Board Certification measure rates. The benchmarks utilized are those reported in the NCQA’s Quality Compass® 2013 for Medicaid. Statewide rates were calculated by totaling numerator and denominator counts for both Health Plans.
HEDIS® Effectiveness of Care Measures
HEDIS® Effectiveness of Care measures evaluate how well a Health Plan provides preventive screenings and care for members with acute and chronic illnesses. Figure 16 displays selected Effectiveness of Care measure rates for HEDIS® 2011 through 2013, for each Health Plan and the statewide rate, compared to Quality Compass® 2013 national Medicaid benchmarks. For HEDIS® 2012, the upper age limit for the Use of Appropriate Asthma Medications measure was increased to 64 years of age. In previous years, the upper age limit was 50 years of age. Therefore, trending was not possible from HEDIS® 2011 to HEDIS® 2012/HEDIS® 2013 and, as such, the measure is not displayed in Figure 16.
Overall performance on the HEDIS® 2013 Effectiveness of Care measures was strong. Both Health Plans met or exceeded the Quality Compass® 2013 Medicaid Mean for all six (6) measures shown in Figure 16, (Use of Appropriate Asthma Medications excluded). Both Health Plans met either the 75th or 90th percentile for the following measures: Cervical Cancer Screening, Childhood Immunizations (Combo 3), Follow-up After Hospitalization for Mental Illness (30 Days) and Follow-up After Hospitalization for Mental Illness (7 Days). The statewide rates met or exceeded the Quality Compass® 2013 Medicaid Mean for all six (6) measures shown. All statewide rates remained relatively stable or improved from HEDIS® 2012 to HEDIS® 2013, with one (1) rate (Chlamydia Screening) demonstrating an increase of nearly four (4) percentage points.

RI EQR Technical Report 2013 – Aggregate Page 39 of 81
Figure 16. HEDIS® Results 2011-2013 – Effectiveness of Care Measures1
1 For these bar charts, statewide rates were calculated by totaling numerators and denominators for the two Health Plans.
78.9% 70.0% 73.6% 81.6% 74.3% 77.6% 81.9% 72.0% 76.4% 50.0%
55.0%
60.0%
65.0%
70.0%
75.0%
80.0%
85.0%
NHPRI UHCP-RI Statewide
Cervical Cancer Screening
62.0% 58.5% 61.1% 63.0% 58.5% 61.7% 67.2% 61.5% 65.5% 50.0%
55.0%
60.0%
65.0%
70.0%
NHPRI UHCP-RI Statewide
Chlamydia Screening (16-24 years)
77.1% 84.2% 80.7% 84.7% 82.5% 83.6% 80.3% 83.0% 81.6% 50.0%
60.0%
70.0%
80.0%
90.0%
NHPRI UHCP-RI Statewide
Childhood Immunizations: Combo 3
2011 2012 2013 HEDIS® 2013 Mean HEDIS® 2013 90th Percentile

RI EQR Technical Report 2013 – Aggregate Page 40 of 81
Figure 16. HEDIS® Results 2011-2013 – Effectiveness of Care Measures1 (continued)
1 For these bar charts, statewide rates were calculated by totaling numerators and denominators for the two Health Plans.
89.3% 81.5% 85.4% 92.5% 83.2% 87.8% 88.8% 83.7% 86.3% 50.0%
60.0%
70.0%
80.0%
90.0%
100.0%
NHPRI UHCP-RI Statewide
Diabetes: HbA1c Testing
86.8% 78.0% 83.3% 85.9% 80.2% 83.1% 85.0% 77.0% 81.3% 50.0%
60.0%
70.0%
80.0%
90.0%
NHPRI UHCP-RI Statewide
FUH Mental Illness: 30 days
68.3% 59.9% 64.9% 71.7% 60.1% 65.9% 71.6% 55.8% 64.3% 0.0%
10.0%
20.0%
30.0%
40.0%
50.0%
60.0%
70.0%
80.0%
NHPRI UHCP-RI Statewide
FUH Mental Illness: 7 days
2011 2012 2013 HEDIS® 2013 Mean HEDIS® 2013 90th Percentile

RI EQR Technical Report 2013 – Aggregate Page 41 of 81
HEDIS® Access to/Availability of Care Measures
The HEDIS® Access to/Availability of Care measures examine the percentages of Medicaid children/adolescents, child-bearing women and adults who receive PCP/preventive care services, ambulatory care (adults only) or receive timely prenatal and postpartum services. Children’s Access to Primary Care measures the percentage of children aged twelve (12) months through six (6) years who had one (1) or more visits with a Health Plan primary care practitioner during the Measurement Year and the percentage of children aged seven through nineteen (7 through 19) years who had one (1) or more visits with a Health Plan primary care practitioner during the Measurement Year or the year prior. Adults’ Access to Preventive/Ambulatory Health Services measures adults aged twenty (20) years and older who had one (1) or more ambulatory or preventive care visits during the Measurement Year. Prenatal and Postpartum Care measures the percentage of women who received a prenatal care visit in the first trimester or within forty-two (42) days of enrollment in the Health Plan and the percentage of women who had a postpartum visit on or between twenty-one and fifty-six (21 and 56) days after delivery. Figure 17 presents the Access to/Availability of Care Measure rates for the two (2) Health Plans and the statewide rate for HEDIS® 2011 through HEDIS® 2013 as compared to national Medicaid benchmarks. Both Health Plans and the statewide rates ranked at or above the Medicaid Mean rate for all nine (9) of the HEDIS® 2013 Access to/Availability of Care measures displayed in Figure 17. Statewide rates exceeded the Quality Compass® 2013 90th percentile for the following five (5) measures: Children’s Access to Primary Care measures (25 Months-6 Years; 7-11 Years; 12-19 Years) and Adults’ Access to Preventive/Ambulatory Health Services (20-44 Years and 45-64 Years). While all rates for the Children’s Access to Primary Care measure remained relatively stable for both Health Plans and the statewide rate, the rates for Adults’ Access to Preventive/Ambulatory Health Services (65+ Years) and Access to/Timeliness of Prenatal and Postpartum Care improved over the time period 2011-2013. The Prenatal and Postpartum care measures demonstrated improvement for the UHCP-RI and statewide rates; however, these rates declined for NHPRI from 2012 to 2013.
THIS SPACE INTENTIONALLY LEFT BLANK

RI EQR Technical Report 2013 – Aggregate Page 42 of 81
Figure 17. HEDIS® Results 2011-2013 – Access to/Availability of Care Measures1
1 For these bar charts, statewide rates were calculated by totaling numerators and denominators for the two Health
Plans.
98.8% 98.1% 98.7% 99.1% 98.6% 99.0% 98.4% 98.6% 98.4% 85.0%
90.0%
95.0%
100.0%
NHPRI UHCP-RI Statewide
Children's and Adolescents' Access to PCPs (12-24 Months)
95.3% 94.1% 95.0% 94.5% 93.1% 94.1% 94.3% 95.3% 94.6% 85.0%
90.0%
95.0%
100.0%
NHPRI UHCP-RI Statewide
Children's and Adolescents' Access to PCPs (25 Months - 6 Years)
96.4% 96.2% 96.4% 96.7% 96.3% 96.6% 96.7% 97.2% 96.8% 85.0%
90.0%
95.0%
100.0%
NHPRI UHCP-RI Statewide
Children's and Adolescents' Access to PCPs (7-11 Years)
93.7% 95.7% 94.2% 94.7% 96.2% 95.2% 95.0% 96.5% 95.5% 85.0%
90.0%
95.0%
100.0%
NHPRI UHCP-RI Statewide
Children's and Adolescents' Access to PCPs (12-19 Years)
2011 2012 2013 HEDIS® 2013 Mean HEDIS® 2013 90th Percentile

RI EQR Technical Report 2013 – Aggregate Page 43 of 81
Figure 17. HEDIS® Results 2011-2013 – Access to/Availability of Care Measures1 (continued)
1 For these bar charts, statewide rates were calculated by totaling numerators and denominators for the two Health
Plans.
88.4% 88.6% 88.7% 88.4% 87.7% 88.2% 88.9% 88.6% 88.8% 75.0%
80.0%
85.0%
90.0%
95.0%
NHPRI UHCP-RI Statewide
Adults' Access to Ambulatory/Preventive Care 20-44 Years
90.4% 92.4% 91.2% 91.3% 92.4% 91.8% 91.2% 92.9% 92.0% 75.0%
80.0%
85.0%
90.0%
95.0%
NHPRI UHCP-RI Statewide
Adults' Access to Ambulatory/Preventive Care 45-64 Years
87.7% 91.4% 88.9% 89.7% 94.6% 91.3% 92.4% 93.0% 92.6% 75.0%
80.0%
85.0%
90.0%
95.0%
100.0%
NHPRI UHCP-RI Statewide
Adults' Access to Ambulatory/Preventive Care 65+ Years
2011 2012 2013 HEDIS® 2013 Mean HEDIS® 2013 90th Percentile

RI EQR Technical Report 2013 – Aggregate Page 44 of 81
Figure 17. HEDIS® Results 2011-2013 – Access to/Availability of Care Measures1 (continued)
1 For these bar charts, statewide rates were calculated by totaling numerators and denominators for the two Health
Plans.
92.8% 88.5% 91.0% 95.2% 86.1% 90.3% 94.4% 91.8% 93.1% 75.0%
80.0%
85.0%
90.0%
95.0%
100.0%
NHPRI UHCP-RI Statewide
Prenatal
72.9% 60.9% 67.8% 74.6% 57.5% 65.3% 69.9% 72.0% 71.0% 50.0%
55.0%
60.0%
65.0%
70.0%
75.0%
80.0%
NHPRI UHCP-RI Statewide
Postpartum
2011 2012 2013 HEDIS® 2013 Mean HEDIS® 2013 90th Percentile

RI EQR Technical Report 2013 – Aggregate Page 45 of 81
HEDIS® Use of Services Measures
The HEDIS® Use of Services measures evaluate member utilization of Health Plan services. For this domain of measures, performance is assessed by comparison to Quality Compass® 2013 national Medicaid benchmarks. Figure 18 displays selected measure rates for HEDIS® 2011 through 2013, as well as comparisons to the national Medicaid Means and the Quality Compass® 2013 90th percentiles for Medicaid.
For HEDIS® 2013, both Health Plans and the statewide rate met or exceeded the Quality Compass® 2013 Medicaid Mean rate for all measures displayed: Frequency of Ongoing Prenatal Care (81%+) Expected Visits, Well-Child Visits 15 Months (6+ Visits), Well-Child Visits in the 3rd, 4th, 5th & 6th Years of Life and Adolescent Well-Care Visits. Both Health Plans and the statewide rate achieved the 90th percentile for the measures Well-Child Visits in the First 15 Months of Life: 6+ Visits and Adolescent Well-Care Visits. NHPRI’s rates for three of the four (3 of the 4) measures declined from HEDIS® 2012 to 2013; however, all rates continue to exceed the Quality Compass® 90th percentile. UHCP-RI demonstrated improvement in regard to two measures, Adolescent Well-Care Visit and Well-Child Visit in the First 15 Months of Life (6+ Visits). Overall, the statewide rates fluctuated for all measures between 2011 and 2013; however, all 2013 statewide rates exceeded at least the Quality Compass® 2013 75th percentile.
THIS SPACE INTENTIONALLY LEFT BLANK

RI EQR Technical Report 2013 – Aggregate Page 46 of 81
Figure 18. HEDIS® Results 2011-2013 – Use of Services Measures1
1 For these bar charts, statewide rates were calculated by totaling numerators and denominators for the two (2) Health
Plans.
65.6% 65.8% 65.7% 67.6% 62.0% 62.3% 66.7% 66.5% 66.6% 40.0%
50.0%
60.0%
70.0%
NHPRI UHCP-RI Statewide
Adolescent Well-Care
85.8% 78.6% 82.7% 86.3% 77.8% 81.5% 81.2% 83.1% 82.3% 50.0%
60.0%
70.0%
80.0%
90.0%
NHPRI UHCP-RI Statewide
Well-Child Visit in First 15 Months of Life (6+ Visits)
80.0% 83.5% 81.8% 81.9% 84.2% 82.9% 83.1% 81.2% 81.3% 50.0%
60.0%
70.0%
80.0%
90.0%
NHPRI UHCP-RI Statewide
Well-Child Visit in the 3rd, 4th, 5th and 6th Years of Life
81.8% 65.3% 72.9% 83.2% 75.4% 78.9% 80.1% 73.2% 76.6% 50.0%
60.0%
70.0%
80.0%
90.0%
NHPRI UHCP-RI Statewide
Frequency of Prenatal Care (81%+)
2011 2012 2013 HEDIS® 2013 Mean HEDIS® 2013 90th Percentile

RI EQR Technical Report 2013 – Aggregate Page 47 of 81
X. MEMBER SATISFACTION
Adult CAHPS® 5.0H22
The Rhode Island EOHHS requires, as part of its Medicaid Managed Care Services Contract, that each Health Plan collect member satisfaction data through an annual survey of a representative sample of its members. In 2013, the Consumer Assessment of Healthcare Providers and Services Health Plan Survey 5.0H (CAHPS®5.0H) for adult Medicaid members was conducted on behalf of each Health Plan by NCQA-certified survey vendors. Figure 19 presents the survey item/composite and each Health Plan’s 2013 statistical rating and the statewide rate compared to Quality Compass® 2013 Medicaid national benchmarks. The composite measure, Shared Decision Making, was new to the 2011 EQR Annual Technical reports. Further, the measure underwent changes in 2013 with the introduction of the CAHPS® 5.0H Survey23 and, therefore, was not included in Figure 19; however, rates for this measure for Reporting Years 2011-2013 were included in the individual Health Plan reports.
Performance for CAHPS® 2013 revealed a generally high degree of member satisfaction across both Health Plans and for statewide rates. Collectively, both Health Plans and the statewide rate exceeded the Quality Compass® 2013 Medicaid Mean rate for six (6) of the eight (8) measures displayed. NHPRI met or exceeded the Quality Compass® 2013 Medicaid Mean for seven (7) measures and met or exceeded the 75th or 90th percentiles for two (2) of eight (8) measures. Measures for which NHPRI did not perform well include: Rating of Specialist (50th percentile), Customer Service (10th percentile), Getting Care Quickly (50th percentile), Getting Needed Care (50th percentile), How Well Doctors Communicate (50th percentile) and Rating of Personal Doctor (50th percentile). UHCP-RI exceeded the Medicaid Mean for six (6) of seven (7) applicable measures. One measure, Customer Service, was not reported due to a small sample size. UHCP-RI achieved the 75th or 90th percentile for four (4) measures. Of the remaining measures, two (2) (How Well Doctors Communicate and Rating of Personal Doctor) ranked at the 50th percentile and one (1) measure, Rating of Health Plan, ranked at the 25th percentile. In addition to the Adult CAHPS® Survey, UHCP-RI elected to distribute and report the Child CAHPS® 5.0 Survey in 2013. The Child Member Satisfaction results are not displayed here as only one Health Plan conducted this survey and, therefore, no comparison can be made. Specific results of this survey can be found in the individual Plan Technical Report for UHCP-RI.
22
NHPRI and UHCP-RI ‘s rates for all Medicaid Adult CAHPS® measures include RHP members, as they were included in
the random survey sample of adult members. 23 With the introduction of the 2013 CAHPS 5.0H survey, the Shared Decision Making composite measure was
modified to include the following questions: Q9 - In the last 12 months, did you and a doctor or other health provider talk about starting or stopping a prescription medicine? Q10.a – When you talked about starting or stopping a prescription medicine, how much did a doctor or other health provider talk about the reasons you might want to take a medicine? Q10.b – When you talked about starting or stopping a prescription medicine, how much did a doctor or other health provider talk about the reasons you might not want to take a medicine? Q11 – When you talked about starting or stopping a prescription medicine, did a doctor or other health provider ask you what you thought was best for you?

RI EQR Technical Report 2013 – Aggregate Page 48 of 81
Figure 19. CAHPS® Results 2011-2013 – Member Satisfaction Measures1, 2
1 The statewide rate for each of these bar charts was determined by calculating an unweighted average of the Health Plans’ rates
since the size of the survey populations was similar and numerators and denominators were not available. 2
The measure, Shared Decision Making, was not displayed due changes in the measure specification, which prevent trending from 2012 to 2013.
82.2% 76.0% 79.1% 84.1% 75.7% 79.9% 83.5% 72.6% 78.0% 60.0%
70.0%
80.0%
90.0%
NHPRI UHCP-RI Statewide
CAHPS® Rating of Health Plan
81.0% 84.0% 82.5% 81.9% 83.9% 82.9% 83.1% 84.9% 84.0% 60.0%
70.0%
80.0%
90.0%
NHPRI UHCP-RI Statewide
CAHPS® Getting Care Quickly
85.2% 72.7% 79.0% 83.1% 77.1% 80.1% 83.1% N/A 83.1% 60.0%
70.0%
80.0%
90.0%
100.0%
NHPRI UHCP-RI Statewide
CAHPS® Customer Service
80.8% 77.7% 79.3% 80.5% 76.0% 78.3% 81.0% 85.7% 83.4% 60.0%
70.0%
80.0%
90.0%
NHPRI UHCP-RI Statewide
CAHPS® Getting Needed Care
2011 2012 2013 HEDIS® 2013 Mean HEDIS® 2013 90th Percentile

RI EQR Technical Report 2013 – Aggregate Page 49 of 81
Figure 19. CAHPS® Results 2011-2013 – Member Satisfaction Measures1, 2 (continued)
1 The statewide rate for each of these bar charts was determined by calculating an unweighted average of the Health Plans’ rates
since the size of the survey populations was similar and numerators and denominators were not available. 2
The measure, Shared Decision Making, was not displayed due changes in the measure specification, which prevent trending from 2012 to 2013.
89.4% 88.7% 89.1% 91.4% 90.7% 91.1% 90.0% 90.5% 90.3% 60.0%
70.0%
80.0%
90.0%
100.0%
NHPRI UHCP-RI Statewide
CAHPS® How Well Doctors Communicate
73.3% 74.5% 73.9% 73.9% 70.0% 72.0% 76.2% 74.1% 75.2% 60.0%
65.0%
70.0%
75.0%
80.0%
NHPRI UHCP-RI Statewide
CAHPS® Rating of Health Care
78.6% 81.3% 80.0% 78.8% 80.3% 79.6% 79.2% 79.7% 79.4% 60.0%
65.0%
70.0%
75.0%
80.0%
85.0%
NHPRI UHCP-RI Statewide
CAHPS® Rating of Personal Doctor
82.5% 81.3% 81.9% 76.6% 79.7% 78.2% 81.7% 83.3% 82.5% 60.0%
70.0%
80.0%
90.0%
NHPRI UHCP-RI Statewide
CAHPS® Rating of Specialist
2011 2012 2013 HEDIS® 2013 Mean HEDIS® 2013 90th Percentile
RI EQR Technical Report 2013 – Aggregate Page 50 of 81
XI. Quality Improvement Programs
The State of Rhode Island Executive Office of Health and Human Services requires that contracted Health Plans have a written quality assurance (QA) or quality management (QM) plan that monitors, assures and improves the quality of care delivered over a wide range of clinical and health service delivery areas, including all subcontractors. Emphasis shall be placed on, but need not be limited to, clinical areas relating to management of chronic diseases, mental health and substance abuse care, members with special needs and access to services for members. The QA/QM plan shall include:
Measurement of performance, using objective quality indicators Implementation of system interventions to achieve improvement in quality Evaluation of the effectiveness of interventions Planning and initiation of activities for increasing or sustaining improvement
The Quality Assurance Plan also shall:
Be developed and implemented by professionals with adequate and appropriate experience in QA Detect both under-utilization and over-utilization of services Assess the quality and appropriateness of care furnished to enrollees Provide for systematic data collection of performance and patient results Provide for interpretation of this data to practitioners Provide for making needed changes when problems are found
Full descriptions of each Health Plans’ Quality Improvement Program Structure can be found in the individual Plan Technical Reports.
Quality Improvement Activities
During the Reporting Year (RY) under study, Health Plans were required to perform at least four (4) quality improvement projects (QIPs) annually directed at the needs of the Medicaid-enrolled population, including Core RIte Care, Children with Special Health Care Needs (CSHCN), Children in Substitute Care (SC)24 and Rhody Health Partners (RHP), as well as for the Health Plan-established Communities of Care25 programs. All QIPs were to be documented on the NCQA Quality Improvement Activity (QIA) Form, as has been the case since 2008. The QIA Form can be found in Appendix 2. Topic selection guidelines were revised for 2010/2011. Starting in 2008, one (1) area of focus was chosen by the State and addressed by all Health Plans, another QIP topic was chosen by the State based on each Health Plan’s individual performance and the third QIP topic was of the Health Plan’s own choosing. For the period 2009/2010, two (2) QIP topics were chosen by the State to be addressed by all Health Plans; and one (1) QIP topic was of the Health Plan’s own choosing, with the State’s approval. Beginning in 2011 and for the most recent contract period, 2012/2013, three (3) QIP topics were chosen by the State that would address the quality improvement needs of both Health Plans. Of those, the State directed both Health Plans to conduct QIPs related to the following topics: Initial Health Screens for Special Enrollment Populations, HEDIS®
Chlamydia Screening in Women and the HEDIS® Follow-up Care for Children Prescribed ADHD Medication. The fourth QIP topic was of the Health Plan’s own choosing, with the State’s approval, from among State-
24
NHPRI is the sole Health Plan to provide services for the SC population. 25
The State’s Medicaid Managed Care Services Contract (09/01/2010) requires that all Health Plans establish and maintain a Communities of Care program to decrease non-emergent and avoidable ED utilization and costs through service coordination, defined member responsibilities and associated incentives and rewards.

RI EQR Technical Report 2013 – Aggregate Page 51 of 81
suggested topic areas for each Health Plan. For RY 2013, NHPRI elected to perform a QIP targeting the HEDIS®
Antidepressant Medication Management measure, and UHCP-RI elected to perform a QIP targeting the HEDIS®
Cervical Cancer Screening measure. In accordance with 42 CFR §438.358, IPRO conducted a review and validation of these quality improvement projects using methods consistent with the CMS protocol for validating performance improvement projects. Summaries of each of the QIPs conducted by the Health Plans can be found in Section XI of the individual Plan Technical Reports.
THIS SPACE INTENTIONALLY LEFT BLANK

RI EQR Technical Report 2013 – Aggregate Page 52 of 81
XII. CONCLUSIONS AND RECOMMENDATIONS
IPRO’s external quality review concludes that, in 2013, the Rhode Island Medicaid managed care program and both of the participating Health Plans have had a positive impact on the accessibility, timeliness and quality of services for Rhode Island Medicaid recipients. This is supported by the fact that both Health Plans were ranked in the top ten (10) of Medicaid Health Plans nationally by the NCQA based on HEDIS® results, CAHPS® scores and NCQA accreditation results, with NHPRI ranked at 4th and UHCP-RI ranked at 8th. In addition, NHPRI has consistently received an Excellent NCQA accreditation status.
With the exception of those shown for the Performance Goal Program (PGP), the Medicaid benchmarks and HEDIS® percentiles cited in this Annual EQR Technical Report originated from the NCQA’s Quality Compass®
2013. Scoring benchmarks for the 2013 Performance Goal Program were derived from Quality Compass®
2012. In addition to the overall conclusions of the State’s Medicaid managed care program, both Health Plans demonstrated various strengths and opportunities for improvement. Each Health Plan was also issued individual recommendations. These findings are described in detail in Section XII of each Health Plan’s individual Annual External Quality Review Technical Report.26
Quality of Care
This section provides a description of the strengths and opportunities for improvement exhibited by both Health Plans and the Medicaid managed care program overall, as well as recommendations in regard to the quality of care provided to Medicaid enrollees. In the domain of Quality, the Health Plans and the Medicaid managed care program demonstrated the following strengths:
As noted above, NHPRI achieved an Excellent NCQA accreditation status. Both received Excellent ratings for the NCQA accreditation domain related to Qualified Providers and received five of five (5 of 5) stars for the NCQA Health Plan Rankings category Prevention.
Overall, the Health Plans performed well in the Medical Home/Preventive Care domain of the 2013 PGP, with rates exceeding the Quality Compass® 2012 90th or 75th percentiles for most measures. Related to children’s and adolescents’ preventive care, both Health Plans achieved the 75th or 90th percentile for each of the following measures: Childhood Immunization Status: Combo 3, Childhood Immunization Status: Combo 10, Adolescent Immunization Status and Lead Screening in Children. Both Health Plans also exceeded either the 50th or 75th percentile goal for all three (3) of the Weight Assessment & Counseling for Children and Adolescents (ages 3-17 Years) numerators: BMI Percentile, Counseling for Nutrition, and Counseling for Physical Activity. In regard to Adult BMI Assessment, both Health Plans achieved the 50th or 75th percentile goal for the measure.
In regard to the Performance Goal Program Chronic Care domain, both Health Plans achieved the 90th percentile benchmark for the HEDIS® Pharmacotherapy for COPD Exacerbation – Bronchodilator and HEDIS® Pharmacotherapy for COPD Exacerbation – Systemic Corticosteroids measures. In addition, NHPRI achieved rates which met the Quality Compass® Contract goal for three (3) additional measures in this domain: Members with Persistent Asthma Used Appropriate Medications (Total), Members with Diabetes had Hba1C Testing and Controlling High Blood Pressure (<140/90).
Care Management for Special Populations demonstrated a strength as both Health Plans exceeded the State-specified Contract goal for the Level II Needs Review and Timely Care Plan Update measures for all population samples for which member(s) were in need of these services.
26
For further information, refer to each Health Plan’s Annual External Quality Review Technical Report.

RI EQR Technical Report 2013 – Aggregate Page 53 of 81
In the HEDIS® Effectiveness of Care domain, both Health Plans and the statewide rate met or exceeded the Quality Compass® 2013 75th percentile for the four (4) measures: Cervical Cancer Screening, Childhood Immunizations: Combo 3, Follow-up after Hospitalization for Mental Illness – 30 Days and Follow-up after Hospitalization for Mental Illness – 7 Days.
Performance on the Consumer Assessment of Healthcare Providers and Systems Survey (CAHPS® 5.0H) showed a generally high degree of member satisfaction in several areas between the two (2) Health Plans and statewide. The Health Plans’ and the statewide rates exceeded the Quality Compass® 2013 Medicaid Mean rate for six of eight (6 of 8) Adult measures. In addition, both Health Plans exceeded the Quality Compass® 2013 75th percentile for the Rating of All Healthcare measure.
Several areas are noted in which there are opportunities for improvement common to both Health Plans. Continued collaboration on QI initiatives may drive both individual and statewide successes. Through such collaborations, the Health Plans can share successful intervention strategies to be implemented statewide, as well as lessons learned. In the domain of Quality, the Health Plans and the Medicaid managed care program demonstrated the following opportunities for improvement:
In regard to the provider network, both Health Plans demonstrate an opportunity for improvement as rates for Geriatricians exceeded only the Quality Compass® 2013 50th percentile.
The Member Services domain of the 2013 PGP demonstrated an area for improvement for both Health Plans. Neither Health Plan met the State-specified goal for the Member Handbook Sent within 10 Days of Notification of Enrollment and ID Card Sent within 10 Days of Notification of Enrollment.
In the Medical Home/Preventive domain, neither Health Plan met the Contract goal for the Use of Imaging for Low Back Pain measure.
Member Satisfaction demonstrates an opportunity for improvement in several areas. For both Health Plans, several CAHPS® measures benchmarked at or below the Quality Compass® 2013 50th percentile.
The following recommendations are made: The Health Plans should routinely evaluate and expand upon interventions described in the Health
Plans’ response to the previous year’s recommendations that aim to improve PGP and HEDIS® rates that continuously fail to meet Contract goals and benchmark performance goals. The Health Plans should also continue the conduct of QIPs aimed at improving these areas of care.
As both Health Plans continue to report several CAHPS® rates below the Quality Compass® 2013 75th percentile, the Health Plans should routinely monitor Member Satisfaction, evaluate the effectiveness of the interventions described in the Health Plans’ responses to the previous year’s recommendations and modify these interventions as needed.
The “Use of Imaging for Low Back Pain” QIP was discontinued in 2013 as improvement was not achieved. RI should consider conducting a new QIP related to this area of care as both Health Plans continue to perform below the 75th percentile benchmark for the HEDIS® measure.
As both Health Plans achieved the 50th percentile benchmark for Board Certification rate for Geriatricians, the Health Plans, along with EOHHS, should develop a strategy to enhance its network of Geriatric providers available to Medicaid enrollees. As RI Medicaid Managed Care is expanding to include those individuals who are dual-eligible for Medicare and Medicaid, it is imperative that each Health Plan have adequate provider networks to serve its growing elderly population.

RI EQR Technical Report 2013 – Aggregate Page 54 of 81
Access to/Timeliness of Care
This section provides a description of the strengths and opportunities for improvement exhibited by both Health Plans and the Medicaid managed care program overall, as well as recommendations in regard to the access to/timeliness of care provided to Medicaid enrollees. In the domain of Access to/Timeliness of Care, the Health Plans and the Medicaid managed care program demonstrated the following strengths:
Both Health Plans received Excellent ratings for the NCQA accreditation domain related to Access and Service. In addition, both Health Plans met or exceeded their plan-specified, GeoAccess standards for all provider types.
Related to children’s and adolescents’ preventive care, both Health Plans achieved the Quality Compass® 2013 75th or 90th percentile for each of the following measures: Children’s Access to PCPs (12-24 Months, 25 Months-6 Years, 7-11 Years and 12-19 Years), Well-Child Visits in the First 15 Months of Life, Well-Child Visits in the 3rd, 4th, 5th and 6th Years of Life and Adolescent Well-Care Visits.
In regard to adults’ access to care, both Health Plans exceeded the Quality Compass® 2013 75th or 90th percentile for all age groups of the HEDIS® Adults’ Access to Preventive/Ambulatory Health Services measure.
Both Health Plans achieved rates at or above the Quality Compass® 2013 75th percentile benchmark for the Timeliness of Prenatal Care measure, as well as the Frequency of Ongoing Prenatal Care (81%+) measure.
Several areas are noted in which there are opportunities for improvement common to both Health Plans. Continued collaboration on QI initiatives may drive both individual and statewide successes. Through such collaborations, the Health Plans can share successful intervention strategies to be implemented statewide, as well as lessons learned. In the domain of Access to/Timeliness of Care, the Health Plans and the Medicaid managed care program demonstrated the following opportunities for improvement:
In regard to the Care Management for Special Populations Case Review, both Health Plans failed to meet the state-specified goal for at least one (1) measure. In addition, UHCP-RI received an ‘N/A’ for two measures as a result of the tracer methodology which is used to analyze the engagement of a randomized cohort of new enrollees with special needs.
Both of the Health Plans failed to meet the 2013 Contract goal for the State-specified PGP measure, Reduce ED Visits for ACSCs by 5 Percentage Points, for all applicable populations. This represented a decline in performance statewide, as each Health Plan met this goal for at least two (2) populations in the 2011 and 2012 Performance Goal Programs.
The following recommendations are made:
As the Health Plans continue to struggle with the State-specified Reduce ED Visit for ACSCs by 5 Percentage Points measure, the Health Plans should evaluate the effectiveness of the interventions previously implemented and modify them as needed. The Health Plans should also consider any barriers that may be specific to each of the special populations.
The Health Plans continue should work to improve PGP rates that failed to meet Contract goals. For measures that perform poorly over several measurement periods, the Health Plans should routinely evaluate the effectiveness of implemented interventions and modify them as needed.
As the methods used to sample the population remain unchanged from the previous year and the Health Plans continue to receive ‘N/A’ designations for categories of the Care Management for Special Populations Case Review due to use of a tracer methodology, EOHHS should consider modifying its sampling process to ensure that all review categories (Initial Health Screen, Level I, Level II and Timely Care Plan Update) are represented in the case files.
RI EQR Technical Report 2013 – Aggregate Page 55 of 81
Quality Improvement Program
The overall strengths of each of the Health Plans’ Quality Improvement Programs included a variety of staff resources and committees across all levels of the organizations. Full descriptions of the Health Plans’ Quality Improvement Programs can be found in Section XI of the Health Plan-specific Annual EQR Technical Reports. In addition, the Quality Improvement Activity Form template is included in Appendix 2 of the Health Plan-specific reports. In 2012/2013, each Health Plan undertook four (4) Quality Improvement Projects (QIPs). The four (4) contractually mandated QIPs comprised multi-faceted intervention strategies that targeted providers and member populations, as well as system-level changes to Health Plan processes. As a result of the 2012/2013 quality improvement activities, mixed results were achieved; some performance measures showed improvement, while others demonstrated decline. The Health Plans presented the results of each of the four (4) QIPs to EOHHS in December 2013. Summaries of the QIPs can be found in Section XI of the individual Health Plan Annual EQR Technical Reports.
EOHHS Responses and Follow-Up to Recommendations
As required by Federal regulations, the EQR must annually assess the degree to which the Health Plans effectively addressed the previous year's recommendations. In order to ensure that each had information required to achieve this, EOHHS provided feedback to the Health Plans regarding their HEDIS®
and CAHPS®
scores, PGP outcomes, State monitoring visit findings, as well as the EQR Technical Report. Information regarding these is detailed below. 2013 Performance Goal Program/On-site Monitoring Feedback EOHHS issued the results of the 2013 PGP to the Health Plans in October 2013 accompanied by a cover letter containing commendations for the Health Plans’ accomplishments and improvements and delineating opportunities for improvement, as well as the EOHHS expectation that the Health Plans develop an action plan to address the noted opportunities for improvement. The Health Plans’ progress related to improvement was a topic of discussion at the monthly Contract oversight meetings. Reporting Year (RY) 2012 EQR Technical Report Feedback Also during December 2013, a separate correspondence was sent by the State in conjunction with the transmittal of the EQR Technical Report, which focused on RY 2012. The report was accompanied by a cover letter providing commendations for the Health Plans’ accomplishments and improvements. In addition, the report outlined the Health Plans’ opportunities for improvement and included EOHHS’ expectation that the Health Plans develop an action plan to address the noted opportunities for improvement. As was done in the past, EOHHS indicated that its intent was to include the Health Plans’ performance as an agenda item in its Contract-oversight meetings. The Health Plans’ progress related to improvement was a topic of discussion at the monthly meetings. In addition, the Health Plans were required to make a presentation to EOHHS in December 2013 regarding the RY 2012 EQR Technical Report, as well as any recommendations issued by the EQRO. For Reporting Year 2012, an additional EQR activity was completed in order to comply with CMS requirements. For the first time, the State’s EQRO produced an evaluation of the Health Plans’ efforts in rectifying the identified opportunities for improvement issued in the RY 2012 Technical Report. This Addendum was issued to the Health Plans in March 2014. For those opportunities and recommendations for which the EQRO deemed Partially Addressed or Not Addressed, the Health Plans were asked to respond with additional information regarding their efforts.

RI EQR Technical Report 2013 – Aggregate Page 56 of 81
XIII. REFERENCES Introduction
Department of Health and Human Services, Centers for Medicare and Medicaid Services, Federal Register, Part II, 42 CFR Parts 433 and 438, Medicaid Program; External Quality Review of Medicaid Managed Care Organizations, Final Rule; §438.320, Page 3635.
Department of Health and Human Services, Centers for Medicare and Medicaid Services, Rhode Island Global Consumer Choice Compact Section 1115 Demonstration (Project No. 11-W-00242/1) Special Terms and Conditions, December 9, 2009.
Rhode Island Executive Office of Health and Human Services, Code of Rules, Medical Assistance, §0300 Medical Assistance Program Overview, §0348 RIte Care Program, §0374 Managed Care Program Options for Adults, https://www.policy.dhs.ri.gov/0300. (accessed June 18, 2012).
Rhode Island Executive Office of Health and Human Services, Medicaid Managed Care Services Contract, September 1, 2010.
Rhode Island Department of Human Services, Rhode Island’s Strategy for Quality Assessment and Performance Improvement, April 2005.
Rhode Island Executive Office of Health and Human Services, Rhode Island Strategy for Assessing and Improving the Quality of Managed Care Services, October 2012.
Corporate Profiles
NCQA, Health Insurance Plan Rankings 2013 – 2014, available at www.ncqa.org (accessed July 14, 2014). NHPRI Enrollment as of December 31, 2012, provided by RI EOHHS, June 11, 2014. UHCP-RI Enrollment as of December 31, 2012, provided by RI EOHHS, June 19, 2014.
Accreditation Summaries
NCQA, Health Insurance Plan Rankings 2013 – 2014, Medicaid Plans, NHPRI ranking data, available at: http://healthplanrankings.ncqa.org/default.aspx (accessed July 14, 2014).
NCQA Health Insurance Plan Rankings 2013-2014; Medicaid Plans Summary, June 30, 2013, available at: www.ncqa.org (accessed July 14, 2014).
NCQA, Health Insurance Plan Rankings 2013 – 2014, Methodology Overview, July 2013, available at: www.ncqa.org (accessed July 14, 2014).
NCQA, Health Plan Report Card, Rhode Island Medicaid, Neighborhood Health Plan of Rhode Island, available at: http://reportcard.ncqa.org/plan/external/PlanSummary.aspx?WipsPlanId=178 (accessed July 14, 2014).
NCQA, Health Plan Report Card, Rhode Island Medicaid, UnitedHealthcare of New England, available at: http://reportcard.ncqa.org/plan/external/PlanSummary.aspx?WipsPlanId=432 (accessed July 14, 2014).
NCQA, Quality Gains Spark Change to Accreditation Scoring, available at: http://www.ncqa.org/Portals/0/Programs/Accreditation/Accred_Scoring_Change-May_10_2011.pdf (accessed November 22, 2013).
Rhode Island Executive Office of Health and Human Services, Medicaid Managed Care Services Contract, September 1, 2010.
Enrollment and Provider Network
NCQA, HEDIS® 2011, 2012, 2013 Interactive Data Submission System – Medicaid, NHPRI. NCQA, HEDIS® 2011, 2012, 2013 Interactive Data Submission System – Medicaid, UHCP-RI. NCQA, HEDIS® 2013 Quality Compass® Measure Benchmarks for Medicaid. NHPRI, Operation & Service Improvement Committee – Assessment of Network Practitioner Availability,
Members’ Cultural, Ethnic, Racial and Linguistic Needs, August 22, 2013.
RI EQR Technical Report 2013 – Aggregate Page 57 of 81
UHCP-RI, Memorandum: GeoAccess Analysis – Summary Report CY 2012 for the Service Quality Improvement Subcommittee (SQIS), Casey, Elizabeth. February 22, 2013.
NHPRI Enrollment as of December 31, 2012, provided by RI EOHHS, June 11, 2014. UHCP-RI Enrollment as of December 31, 2012, provided by RI EOHHS, June 19, 2014.
Utilization
NCQA, HEDIS® 2011, 2012, 2013 Interactive Data Submission System – Medicaid, NHPRI. NCQA, HEDIS® 2011, 2012, 2013 Interactive Data Submission System – Medicaid, UHCP-RI. NCQA, HEDIS® 2013 Quality Compass® Measure Benchmarks for Medicaid.
Rhode Island Medicaid Managed Care Performance Goal Program
Attest Health Care Advisors, LLC, HEDIS® Compliance Audit™ Final Audit Report: HEDIS® 2013, Neighborhood Health Plan of Rhode Island, June 28, 2013.
Attest Health Care Advisors, LLC, NCQA Certified HEDIS® Compliance Audit™ of 2013 HEDIS® Reports, Final Audit Findings, UnitedHealthcare of New England, June 28, 2013.
Attest Health Care Advisors, LLC, HEDIS® 2013 Final Rates: Audit Review Table, Neighborhood Health Plan of Rhode Island, 2013.
Attest Health Care Advisors, LLC, HEDIS® 2013 Final Rates: Audit Review Table, UnitedHealthcare of New England, Medicaid Managed Care Operations, 2013.
NCQA, HEDIS® 2011, 2012, 2013 Interactive Data Submission System – Medicaid, NHPRI. NCQA, HEDIS® 2011, 2012, 2013 Interactive Data Submission System – Medicaid, UHCP-RI. NCQA, HEDIS® 2013 Quality Compass® Measure Benchmarks for Medicaid. NCQA, HEDIS® 2012 Quality Compass® Measure Benchmarks for Medicaid. Rhode Island Executive Office of Health and Human Services, Medicaid Managed Care Services Contract,
September 1, 2010. Rhode Island Executive Office of Health and Human Services, Rhode Island’s 2013 Performance Goal
Program, Summary of Findings for Calendar Year 2012: Neighborhood Health Plan of Rhode Island (NHPRI), Site Visit conducted, May 7, 2013 & May 8, 2013.
Rhode Island Executive Office of Health and Human Services, Rhode Island’s Medicaid Managed Care Performance Goal Program (2011 and 2012 Results).
Rhode Island Executive Office of Health and Human Services, Rhode Island’s 2013 Performance Goal Program, Preliminary HEDIS® and CAHPS® rates, Core RIte Care Only and All Populations NHPRI, June 2013.
Rhode Island Executive Office of Health and Human Services, Rhode Island’s Performance Goal Program, Summary of Findings for CSHCN and Substitute Care, Measurement Period Calendar Year 2012, Neighborhood Health Plan of Rhode Island.
Rhode Island Executive Office of Health and Human Services, Rhode Island’s Performance Goal Program, Summary of Findings for Rhody Health Partners, Measurement Period Calendar Year 2013, Neighborhood Health Plan of Rhode Island.
Rhode Island Executive Office of Health and Human Services, Rhode Island Medicaid Managed Care Performance Goal Program – 2013, Summary of Findings for Calendar Year 2012: UnitedHealthcare Community Plan – Rhode Island (UHCP-RI), Site Visit Conducted May 1, 2013 and May 2, 2013.
The Myers Group, Neighborhood Health Plan of Rhode Island 2013 Medicaid Adult CAHPS® Survey 5.0H Final Report, Project Number: 412989 & 412990, June 2, 2012.
UHCP-RI, Memorandum: UHCNE Community Plan 2013 Adult and Child CAHPS® Analysis for the Service Quality Improvement Subcommittee (SQIS), Willis-Gebhardt, Susan. July 16, 2013.

RI EQR Technical Report 2013 – Aggregate Page 58 of 81
Quality Improvement Program
Rhode Island Executive Office of Health and Human Services, Medicaid Managed Care Services Contract, September 1, 2010.
NHPRI, Neighborhood Health Plan of Rhode Island: 2012 Quality Improvement Annual Evaluation. Beacon Health Strategies, Quality Management and Improvement Program Evaluation, 2012. Beacon Health Strategies, Quality Management and Improvement Program Description, 2013. NHPRI, Quality Improvement Activity (QIA) Form: Quality Improvement Activity: Antidepressant
Medication Management: Acute Phase, December 2012. NHPRI, Quality Improvement Activity (QIA) Form: Quality Improvement Activity: Chlamydia Screening in
Women, December 2013. NHPRI, Quality Improvement Activity (QIA) Form: Quality Improvement Activity: Follow-up Care for
Children Prescribed ADHD Medication, December 2013. NHPRI, Quality Improvement Activity (QIA) Form: Quality Improvement Activity: Initial Health Screen for
Special Populations (CSN, SC, RHP), December 2013. NHPRI, Neighborhood Health Plan of Rhode Island: Quality Improvement Program Description 2013, May
9, 2013. UHCP-RI, UnitedHealthcare Community Plan – Rhode Island, Inc., Medicaid 2012 Quality Improvement
Program Evaluation, 2013. UHCP-RI, 2013 UnitedHealthcare Community Plan – Rhode Island, Quality Improvement Program
Description, Contract Period September 1, 2010 - June 30, 2014. UHCP-RI, UHCP-RI/Medicaid, Quality Improvement Activity (QIA) Summary: Initial Health Screens for
Special Population, December 2013. UHCP-RI, UHCP-RI/Medicaid, Quality Improvement Activity (QIA) Summary: Cervical Cancer Screening,
December 2013. UHCP-RI, UHCP-RI/Medicaid, Quality Improvement Activity (QIA) Summary: Chlamydia Screening in
Women, December 2013. UHCP-RI, UHCP-RI/Medicaid, Quality Improvement Activity (QIA) Summary: Follow-up Care for Children
Prescribed ADHD Medication, December 2013.
Conclusions and Recommendations
Rhode Island Executive Office of Health and Human Services, Medicaid Managed Care Services Contract, September 1, 2010.
IPRO, on behalf of the Rhode Island Executive Office of Health and Human Services, Annual External Quality Review Technical Report for Neighborhood Health Plan of Rhode Island (NHPRI), Reporting Years 2011-2012.
NHPRI, Neighborhood Health Plan of Rhode Island: 2012 Quality Improvement Annual Evaluation. NHPRI, Neighborhood Health Plan of Rhode Island: Quality Improvement Program Description 2013, May
9, 2013. IPRO, on behalf of the Rhode Island Executive Office of Health and Human Services, Annual External
Quality Review Technical Report for UnitedHealthcare of New England (UHCP-RI), Reporting Years 2011-2012.
UHCP-RI, UnitedHealthcare Community Plan, Inc., Medicaid 2012 Quality Improvement Program Evaluation, 2013.
UHCP-RI, 2013 UnitedHealthcare Community Plan – Rhode Island, Quality Improvement, Program Description, Contract Period September 1, 2010 - June 30, 2014.

RI EQR Technical Report 2013 – Aggregate Page 59 of 81
APPENDIX 1: Rhode Island Strategy for Assessing and Improving the Quality of Managed Care Services – October 20121
CHAPTER 1
OVERVIEW OF FEDERAL QUALITY ASSESSMENT AND PERFORMANCE IMPROVEMENT REQUIREMENTS
This chapter describes the various Federal quality assessment and performance improvement requirements applicable to RIte Care, including:
Medicaid Managed Care Final Regulations
Medicaid External Quality Review Final Regulations
Waivers and Special Terms and Conditions
Children’s Health Insurance Program (CHIP) Quality Requirements Each set of requirements is described in separate sections below. Detailed descriptions of these requirements are provided in Appendix A to this strategy document. 1.1 Medicaid Managed Care Final Regulations Except for those Federal legal requirements specifically waived in the approval letter for the demonstrations, the State must meet all other applicable, Federal legal requirements. Salient requirements include those contained in the June 14, 2002 Final Rule implementing the managed care provisions of the Balanced Budget Act of 1997 (BBA)2. States had until June 16, 2003 “to bring all aspects of their managed care programs (that is, contracts, waivers, State plan amendments and State operations) into compliance with the Final Rule provisions.”3 This strategy document is essentially a required element of the June 14, 2002 Final Rule. Specifically, Subpart D of the Final Rule “implements Section 1932(c)(1) of the Act and sets forth specifications for quality assessment and performance improvement strategies that States must implement to ensure the delivery of quality health.” It also establishes “standards” that States and Health Plans must meet. Section 438.204 of the Final Rule delineates the following minimum elements of the State’s quality strategy:
Health Plan “contract provisions that incorporate the standards specified in this subpart”
Procedures that: - Assess the quality and appropriateness of care and services furnished to all Medicaid
recipients enrolled in Health Plans - Identify the race, ethnicity, and primary language spoken of each enrollee - Monitor and evaluate Health Plan compliance with the standards regularly
Arrangements for annual, external independent reviews of the quality outcomes and timeliness of, and access to, the services covered under each Health Plan contract
Appropriate use of intermediate sanctions, at a minimum, to meet Subpart I of the June 14, 2002 Final Rule
1 The Quality Strategy included in this appendix was submitted by EOHHS in October 2012, and approved by CMS on
April 25, 2013. Chapters 1 – 4 of the approved Quality Strategy have been provided in Appendix 1. 2 Federal Register, 67(115), June 14, 2002, 41094-41116. The BBA also created the State Children’s Health Insurance
Program (SCHIP). 3 Ibid., 40989.

RI EQR Technical Report 2013 – Aggregate Page 60 of 81
An information system that supports initial and ongoing operation and review of the State’s quality strategy
Standards, at least as stringent as those in Subpart D, for access to care, structure and operations, and quality measurement and improvement
1.2 Medicaid External Quality Review Final Regulations On January 24, 2003, the Centers for Medicare and Medicaid Services (CMS) published an external quality review (EQR) Final Rule in the Federal Register to implement Section 4705 of the BBA.4 The effective date of this Final Rule is March 25, 2003 and provides5: “Provisions that must be implemented through contracts with MCOs, PIHPs, and external quality review organizations (EQROs) are effective with contracts entered into or revised on or after 60 days following the publication date. States have until March 25, 2004 to bring contracts into compliance with the Final Rule provisions.” The basic requirements of the January 24, 2003 Final Rule are as follows:
EQRO Must Perform an Annual EQR of Each Health Plan – The State must ensure that: “a qualified external quality review organization (EQRO) performs an annual EQR for each contracting MCO.”6
EQR Must Use Protocols – The January 24, 2003 Final Rule stipulates how the EQR must be performed. It should be noted that this includes the requirement7 that “information be obtained through methods consistent with the protocols established under §438.352.”
EQRO Must Produce a Detailed Technical Report – The January 24, 2003 Final Rule requires8 that the EQR produce a “detailed technical report” that “describes the manner in which the data from all activities conducted in accordance with §438.358 were aggregated and analyzed, and conclusions were drawn as to the quality, timeliness, and access to the care furnished by the MCO or PIHP.”
States Must Perform Mandatory EQR Activities – The January 24, 2003 Final Rule distinguishes between “mandatory” and “optional” EQR-related activities. Apart from the required “detailed technical report”, the “mandatory” activities include9:
- Validation of performance improvement projects - Validation of MCO performance measures reported - Review to determine the MCO’s compliance with standards
It would appear that, at a minimum, the “detailed technical report” must be prepared by an EQRO. Other “mandatory” EQR activities need not be performed by an EQRO, although enhanced FMAP is not available unless an EQRO performs them10. “Optional” activities11 include:
Validation of encounter data
Administration or validation of consumer or provider surveys of quality of care
4 Essentially Section 1932(c) of the Social Security Act.
5 Federal Register, 68(16), January 24, 2003, 3586.
6 42 CFR 438.350(a).
7 42 CFR 438.350(e).
8 42 CFR 438.364.
9 42 CFR 438.358(b).
10 Federal Register. Op. Cit., 3611.
11 42 CFR 438.358(c).

RI EQR Technical Report 2013 – Aggregate Page 61 of 81
Calculation of additional performance measures12
Conduct of additional quality improvement projects13
Conduct of studies that focus on a particular aspect of clinical or non-clinical services at a point in time
Table 1-1 shows these obligations in tabular form.
Table 1-1
EXTERNAL QUALITY REVIEW (EQR) ACTIVITIES
Activity Mandatory Activity14 Must Be Performed by EQRO15
Prepare detailed technical report Yes16 Yes
Validation of performance improvement projects
Yes No
Validation of MCO performance measures reported
Yes No
Review to determine MCO compliance with standards
Yes No
Validation of encounter data No No
Administration or validation of consumer or provider surveys of quality of care
No No
Calculation of additional performance measures
No No
Conduct of additional quality improvement projects
No No
Conduct of studies that focus on a particular aspect of clinical or non-clinical services at a point in time
No No
1.3 Waivers and Special Terms and Conditions The waivers approved by CMS, which have allowed the State to operate RIte Care (and now RIte Share), were actually waivers of specific provisions of the Social Security Act (SSA). These waivers include ones to permit the State to receive Federal funds “not otherwise matchable” except under the authority of Section 1115 of the Act. For Medicaid, this provides Federal matching for the expansion populations. For CHIP, this provided Federal matching for eligible parents and relative caretakers, as well as eligible pregnant women. The approval of these waivers and Federal matching was contingent upon the State’s compliance with Special Terms and Conditions (STCs). These STCs also delineated the “nature, character, and extent of anticipated Federal involvement” in the demonstration. Demonstration has been highlighted because RIte Care was a “demonstration project,” according to the DHHS approval letter17.
12
Any “additional” performance measures must be validated by an EQRO. 13
Any “additional” performance improvement projects must be validated by an EQRO. 14
Defined as “mandatory” under the January 24, 2003 Final Rule. 15
According to the provisions of the January 24, 2003 Final Rule. 16
Not listed in the Final Rule as a “mandatory” activity in 42 CFR 438.358(b) but “required” by 42 CFR 438.364. 17
The most recent version of the approval letter with both the waivers and the STCs explicated was June 18, 2008.
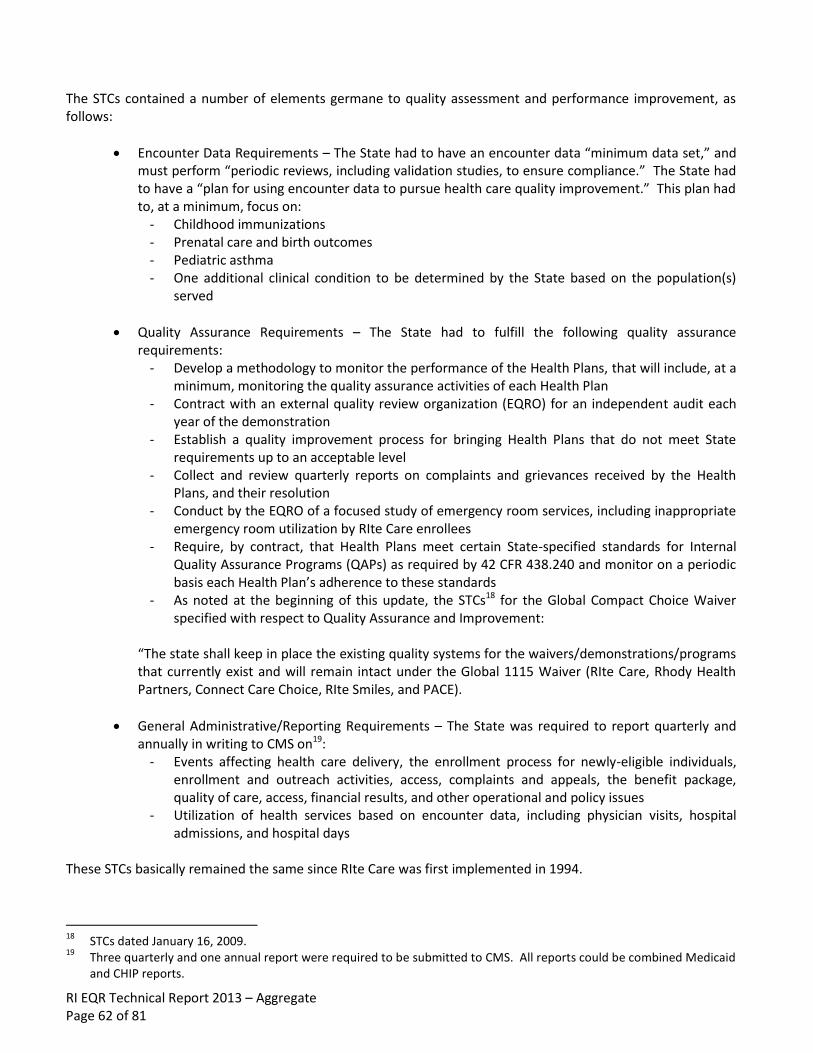
RI EQR Technical Report 2013 – Aggregate Page 62 of 81
The STCs contained a number of elements germane to quality assessment and performance improvement, as follows:
Encounter Data Requirements – The State had to have an encounter data “minimum data set,” and must perform “periodic reviews, including validation studies, to ensure compliance.” The State had to have a “plan for using encounter data to pursue health care quality improvement.” This plan had to, at a minimum, focus on:
- Childhood immunizations - Prenatal care and birth outcomes - Pediatric asthma - One additional clinical condition to be determined by the State based on the population(s)
served
Quality Assurance Requirements – The State had to fulfill the following quality assurance requirements:
- Develop a methodology to monitor the performance of the Health Plans, that will include, at a minimum, monitoring the quality assurance activities of each Health Plan
- Contract with an external quality review organization (EQRO) for an independent audit each year of the demonstration
- Establish a quality improvement process for bringing Health Plans that do not meet State requirements up to an acceptable level
- Collect and review quarterly reports on complaints and grievances received by the Health Plans, and their resolution
- Conduct by the EQRO of a focused study of emergency room services, including inappropriate emergency room utilization by RIte Care enrollees
- Require, by contract, that Health Plans meet certain State-specified standards for Internal Quality Assurance Programs (QAPs) as required by 42 CFR 438.240 and monitor on a periodic basis each Health Plan’s adherence to these standards
- As noted at the beginning of this update, the STCs18 for the Global Compact Choice Waiver specified with respect to Quality Assurance and Improvement:
“The state shall keep in place the existing quality systems for the waivers/demonstrations/programs that currently exist and will remain intact under the Global 1115 Waiver (RIte Care, Rhody Health Partners, Connect Care Choice, RIte Smiles, and PACE).
General Administrative/Reporting Requirements – The State was required to report quarterly and annually in writing to CMS on19:
- Events affecting health care delivery, the enrollment process for newly-eligible individuals, enrollment and outreach activities, access, complaints and appeals, the benefit package, quality of care, access, financial results, and other operational and policy issues
- Utilization of health services based on encounter data, including physician visits, hospital admissions, and hospital days
These STCs basically remained the same since RIte Care was first implemented in 1994.
18
STCs dated January 16, 2009. 19
Three quarterly and one annual report were required to be submitted to CMS. All reports could be combined Medicaid and CHIP reports.

RI EQR Technical Report 2013 – Aggregate Page 63 of 81
1.4 CHIP Quality Requirements CHIP, too, has quality requirements. Specifically, 42 CFR 457.495 addresses “access to care and procedures to assure quality and appropriateness of care20. The State CHIP Plan must describe how it will assure:
Access to well-baby care, well-child care, well-adolescent care, and childhood and adolescent immunizations
Access to covered services, including emergency services
Appropriate and timely procedures to monitor and treat enrollees with chronic, complex, or serious medical conditions, including access to an adequate number of visits to specialists experienced in treating the specific medical condition and access to out-of-network providers when the network is not adequate for the enrollee’s medical condition
Decisions related to the prior authorization of health services are completed in accordance with the medical needs of the patient, within 14 days after receipt of a request for services, with an extension possible under certain circumstances, and in accordance with State law21
THIS SPACE INTENTIONALLY LEFT BLANK
20
Federal Register, 66(8), January 11, 2002, 2666-2688. 21
Federal Register, 66(122), June 25, 2001, 33810-33824.

RI EQR Technical Report 2013 – Aggregate Page 64 of 81
CHAPTER 2
COMPONENTS OF RITE CARE’S QUALITY ASSESSMENT AND PERFORMANCE IMPROVEMENT STRATEGY
From the very beginning of RIte Care, the State has taken to heart the fact that it is a demonstration initiative. RI Medicaid developed a plan for monitoring RIte Care Health Plans early on. The plan included the following mechanisms for monitoring 13 areas of Health Plan operations:
Annual Site Visit Protocol
Disenrollment Grievance Log
Informal Complaints and Grievance and Appeals Log
Primary Care Provider (PCP) Survey
Enhanced Services Report
MMIS Special “Runs”
Member Satisfaction Survey
Self-Assessment Tool for Health Plan Internal Quality Assurance Plan Compliance with HCQIS
Access Study Format
PCP Open Practice Report
Other Provider Report
Financial Reporting Requirements
Third-Party Liability Report The State also crafted and has implemented an extensive research and evaluation program to determine how well RIte Care has done in accomplishing its goals. In fact, research began before RIte Care was actually implemented in order to have some baseline data for comparison with demonstration results. 2.1 Principles Forming the Foundation of RIte Care’s Quality Strategy As with the earlier monitoring plan, principles have been developed to frame the strategy as follows:
Principle 1: The strategy must embrace the unique feature of the program while fulfilling the Federal requirements – Chapter 2 described the Federal requirements applicable to the demonstration with respect to quality assessment and performance improvement. The strategy must incorporate all of the requirements in order to comply fully with the regulations and STCs. Yet, the strategy must make sense given the features of RIte Care22, what the State has been attempting to accomplish, and how it has been assessing accomplishments.
Principle 2: The strategy must build on, not duplicate or supplant, other requirements – The service delivery system for RIte Care does not exist in isolation. The State made a policy decision23 in the very beginning that only State-licensed health maintenance organizations (HMOs) would be allowed to participate in RIte Care. HMOs in the State are overseen by the Division of Facility
22
The focus here is RIte Care and not RIte Share, because RIte Care is the mandatory managed care program. RIte Share, while there is mandatory enrollment, does not have mandatory enrollment into a managed care plan.
23 When Blue Cross and Blue Shield of Rhode Island (BCBSRI) made a decision to give up its HMO license for CHIP effective
January 1, 2005, the State changed its requirements that non-HMO RIte Care Health Plans had to meet, including NCQA accreditation and certain HMO requirements that plans had to meet under Rhode Island Department of Health regulations. These requirements were incorporated into the RIte Care Health Plan Contract effective January 1, 2005. BCBSRI ceased participating in Medicaid managed care in December 2010, when it declined to bid on the State’s new Medicaid managed care procurement.

RI EQR Technical Report 2013 – Aggregate Page 65 of 81
Regulation (DFR) within the Rhode Island Department of Health (DOH) and by the Department of Business Regulation (DBR). In Rhode Island, this also means that the HMOs are accredited by the National Committee for Quality Assurance (NCQA), since this is a requirement of State law24. So, the strategy should build on, not duplicate or supplant these requirements.
Principle 3: The strategy must recognize and not interfere with the relationships between the Health Plans and their networks and between the networks and their patients – Failure to do so could undermine these relationships, thereby jeopardizing the Health Plans’ ability to maintain viable operations and RIte Care as a whole. Nonetheless, quality assessment needs to include these relationships to assure they are working well and meet all legal requirements.
Principle 4: The strategy must include, among other things, the requirements levied on the Health Plans through the contracts between the Health Plans and the State – Health Plans cannot be held accountable for operations or performance for which they are not contractually obligated (or obligated as a matter of law, ethics, or sound business practice) to meet.
2.2 The Components of Rhode Island’s Quality Strategy for Managed Care Using the above principles as a backdrop, the following will constitute the various components of the strategy for quality assessment and performance improvement. Table 2-1 shows the various components of RIte Care’s CMS-approved quality strategy. In order to track compliance with Federal requirements, the table is organized first according to those minimum elements delineated in the June 14, 2002 Final Rule and then according to the applicable STCs for the RIte Care waivers. In this update to the quality strategy, the State has set forth its quality design for Rhody Health Partners, Connect Care Choice, and RIte Smiles, building upon the core principles that have been previously approved by CMS for RIte Care. Table 4–1 delineates the components of the quality design for Rhody Health Partners, the State’s MCO-based Medicaid managed care program for disabled adults; Table 5-1 outlines the quality design for the State’s primary care case management program for disabled adults, Connect Care Choice25. The quality design for RIte Smiles, the State’s dental managed care program for Medicaid-enrolled children born on or after May 1, 2000, has been provided in Table 6-1.
24
All three MCOs that were participating in RIte Care during Reporting Year 2010 (the most recent EQR period) had full, three-year accreditation from NCQA. All three Health Plans – BCBSRI, Neighborhood Health Plan of Rhode Island (NHPRI), and United HealthCare of New England (UHCNE) – received an “excellent” designation from NCQA. Both BCBSRI and UHCNE had their Medicaid product lines accredited separately by NCQA and both were Medicare Advantage participating plans (and had their Medicare product lines separately accredited by NCQA).
25 Rhody Health Partners and Connect Care Choice serve disabled adults whose only source of health insurance coverage
is Rhode Island Medicaid.

RI EQR Technical Report 2013 – Aggregate Page 66 of 81
Table 2-1
COMPONENTS OF RITE CARE’S QUALITY ASSESSMENT AND PERFORMANCE IMPROVEMENT STRATEGY
QUALITY/PERFORMANCE IMPROVEMENT AREA
MECHANISM COMMENTS
1. Assess the quality and appropriateness of care and services to enrollees
Performance incentive program
Encounter Data System
NCQA information
Member Satisfaction Survey
Complaint, grievance, and appeals reporting
EQRO studies
Special studies
Contract compliance review
2. Identify the race, ethnicity, and primary language spoken of each enrollee
MMIS data
3. Arrange for annual, external independent reviews of the quality and timeliness of, and access to, the services covered under each Health Plan contract
Performance incentive program
Encounter Data System
NCQA information
Member Satisfaction Survey
Complaint, grievance, and appeals reporting
EQRO studies
Special studies
Contract compliance review
The State’s EQRO is responsible for preparing an annual, plan-specific detailed technical report that assesses the quality, timeliness, and access to the care furnished by each Health Plan.
4. Appropriate use of intermediate sanctions
Contract compliance review Provisions for levying intermediate sanctions have always been a part of the RIte Care Health Plan Contract. Contracts were amended to incorporate Subpart I of the June 14, 2002 Final Rule requirements.
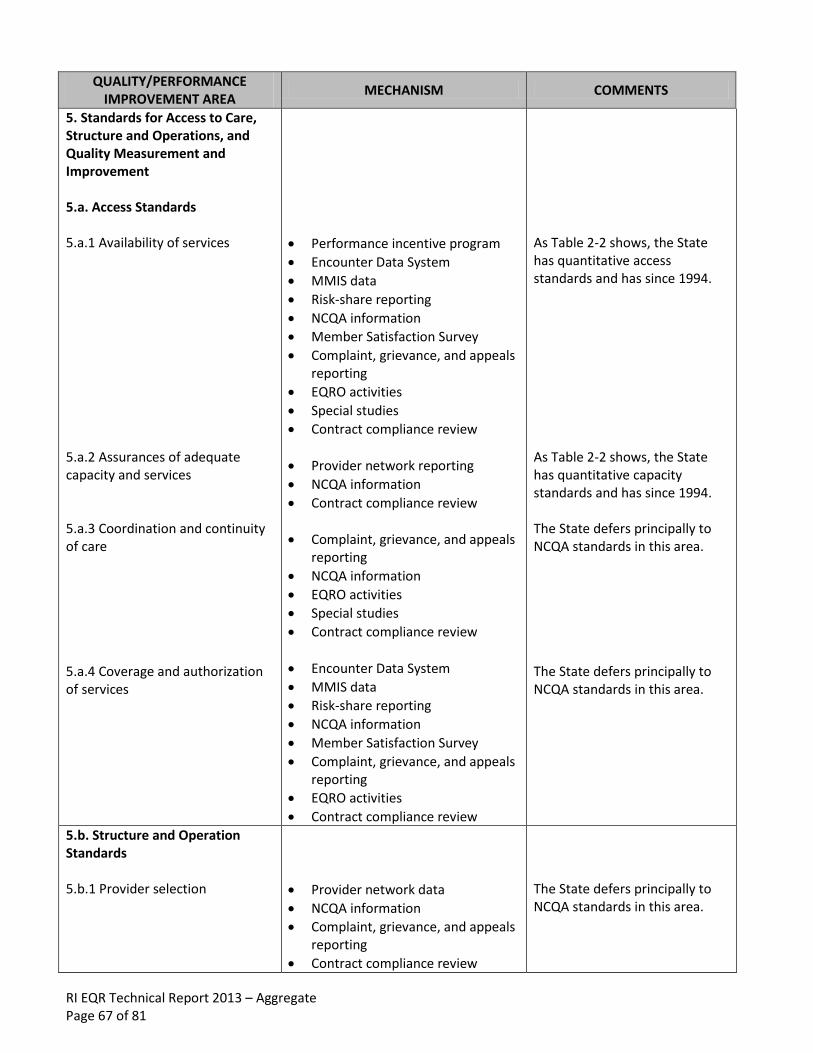
RI EQR Technical Report 2013 – Aggregate Page 67 of 81
QUALITY/PERFORMANCE IMPROVEMENT AREA
MECHANISM COMMENTS
5. Standards for Access to Care, Structure and Operations, and Quality Measurement and Improvement 5.a. Access Standards 5.a.1 Availability of services 5.a.2 Assurances of adequate capacity and services 5.a.3 Coordination and continuity of care 5.a.4 Coverage and authorization of services
Performance incentive program
Encounter Data System
MMIS data
Risk-share reporting
NCQA information
Member Satisfaction Survey
Complaint, grievance, and appeals reporting
EQRO activities
Special studies
Contract compliance review
Provider network reporting
NCQA information
Contract compliance review
Complaint, grievance, and appeals reporting
NCQA information
EQRO activities
Special studies
Contract compliance review
Encounter Data System
MMIS data
Risk-share reporting
NCQA information
Member Satisfaction Survey
Complaint, grievance, and appeals reporting
EQRO activities
Contract compliance review
As Table 2-2 shows, the State has quantitative access standards and has since 1994. As Table 2-2 shows, the State has quantitative capacity standards and has since 1994. The State defers principally to NCQA standards in this area. The State defers principally to NCQA standards in this area.
5.b. Structure and Operation Standards 5.b.1 Provider selection
Provider network data
NCQA information
Complaint, grievance, and appeals reporting
Contract compliance review
The State defers principally to NCQA standards in this area.

RI EQR Technical Report 2013 – Aggregate Page 68 of 81
QUALITY/PERFORMANCE IMPROVEMENT AREA
MECHANISM COMMENTS
5.b.2 Enrollee information 5.b.3 Confidentiality 5.b.4 Enrollment and disenrollment 5.b.5 Grievance systems 5.b.6 Subcontractual relationships and delegation
Performance incentive program
On-site reviews
NCQA information
Complaint, grievance, and appeals reporting
Special studies
Contract compliance review
NCQA information
Complaint, grievance, and appeals reporting
Contract compliance review
MMIS data
NCQA information
Complaint, grievance, and appeals reporting
Contract compliance review
NCQA information
Annual Member Satisfaction Survey
Complaint, grievance, and appeals reporting
Special studies
Contract compliance review
NCQA information
Complaint, grievance, and appeals reporting
Special studies
Contract compliance review
The State defers to NCQA standards in this area, except for certain State-specific requirements to be met in the contract. The State defers principally to NCQA standards in this area. State requirements must be met as specified in the contract. The State defers to NCQA standards in this area, except for certain requirements that must be met under State law. The State defers principally to NCQA standards in this area.
5.c. Quality Measurement and Improvement Standards 5.c.1 Practice guidelines 5.c.2 Quality assessment and performance improvement program
NCQA information
Special studies
Contract compliance review
Performance incentive program
Encounter Data System
Complaint, grievance, and appeals reporting
NCQA information
The State defers principally to NCQA standards in this area. The State defers to NCQA standards in this area, except for certain State-specific requirements to be met under the contract.

RI EQR Technical Report 2013 – Aggregate Page 69 of 81
QUALITY/PERFORMANCE IMPROVEMENT AREA
MECHANISM COMMENTS
5.c.3 Health information systems
Special studies
Contract compliance review
Encounter Data System
Risk-share reporting
NCQA information
EQRO activities
Special studies
Contract compliance review
The State defers to NCQA standards in this area, except for certain State-specific requirements to be met under the contract.
6. Encounter Data Requirements
Encounter Data System
EQRO activities
Special studies
Contract compliance review
The Encounter Data System has been used to produce reports since 1998. It is supplemented by EQRO studies and special studies in areas of access and clinical care interest.
7. Quality Assurance Requirements 7.a. Methodology to monitor performance 7.b. Contract with EQRO 7.c. Quarterly reports on complaints and grievances 7.d. EQRO focused study of emergency room services 7.e. Require that Health Plans meet certain quality assurance requirements
All mechanisms
EQRO activities
Complaint, grievance, and appeals reporting
Contract compliance review
EQRO study
NCQA information
Contract compliance review
Previously, the State had a Plan for Monitoring RIte Care Health Plans. That plan is superseded by this strategy document with respect to quality. The State’s EQRO contract was reprocured in 2003, 2006, and 201226. Complaint, grievance, and appeals reporting have been in place since 1994. Study report was submitted to CMS (HCFA) in 1998. Contracts were amended to conform to the Final Rule.
8. General Administrative/Reporting Requirements – quarterly and annual reports
All mechanisms
26
In 2012, Rhode Island issued its Request for Proposals (RFP) for the managed care EQR functions.
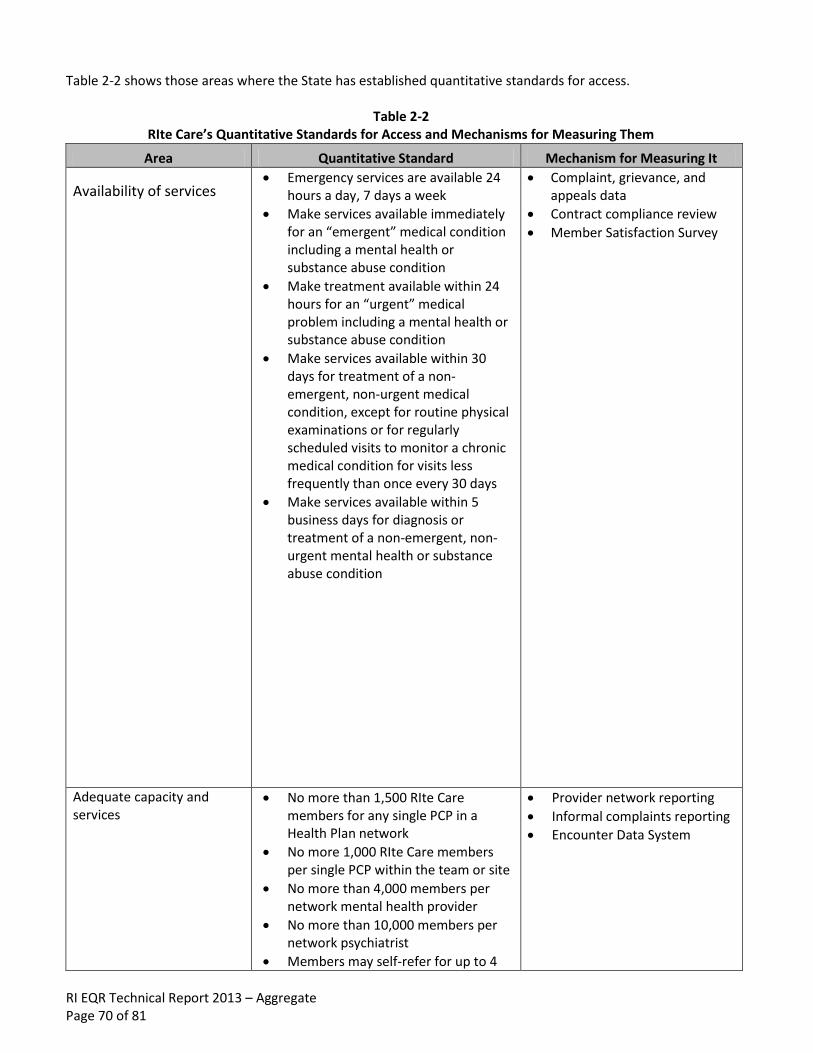
RI EQR Technical Report 2013 – Aggregate Page 70 of 81
Table 2-2 shows those areas where the State has established quantitative standards for access.
Table 2-2 RIte Care’s Quantitative Standards for Access and Mechanisms for Measuring Them
Area Quantitative Standard Mechanism for Measuring It
Availability of services Emergency services are available 24
hours a day, 7 days a week
Make services available immediately for an “emergent” medical condition including a mental health or substance abuse condition
Make treatment available within 24 hours for an “urgent” medical problem including a mental health or substance abuse condition
Make services available within 30 days for treatment of a non-emergent, non-urgent medical condition, except for routine physical examinations or for regularly scheduled visits to monitor a chronic medical condition for visits less frequently than once every 30 days
Make services available within 5 business days for diagnosis or treatment of a non-emergent, non-urgent mental health or substance abuse condition
Complaint, grievance, and appeals data
Contract compliance review
Member Satisfaction Survey
Adequate capacity and services
No more than 1,500 RIte Care members for any single PCP in a Health Plan network
No more 1,000 RIte Care members per single PCP within the team or site
No more than 4,000 members per network mental health provider
No more than 10,000 members per network psychiatrist
Members may self-refer for up to 4
Provider network reporting
Informal complaints reporting
Encounter Data System

RI EQR Technical Report 2013 – Aggregate Page 71 of 81
Area Quantitative Standard Mechanism for Measuring It
GYN/family planning (FP) visits annually or for FP services, without obtaining a referral from the PCP
Coverage and authorization of services
Assignment of a PCP within 20 days of enrollment, if none selected by the enrollee
For children with special health care needs, completion of an Initial Health Screen within 45 days of the effective date of enrollment
For children with special health care needs for whom it is applicable, completion of a Level I Needs Review and Short Term Care Management Plan within 30 days of the effective date of enrollment
Provide initial assessments of RIte Care members within 90 days of enrollment
Provide initial assessments of pregnant women and members with complex and serious medical conditions within 30 days of the date of identification
Allow women direct access to a women’s health care specialist within the Health Plan’s network for women’s routine and preventive services
Resolution of a standard appeal of an adverse decision within 14 days
Resolution of an expedited appeal of an adverse decision within 3 days
On-site review
Member Satisfaction Survey
Complaint, grievance, and appeals data
The State’s “standards” are “at least as stringent” as required by 42 CFR 438.204(g). As noted in Chapter 2, information gathering for EQR must be consistent with protocols established under 42 CFR 438.352. Table 2-3 describes the entity that will perform each EQRO activity and the protocol used/to be used to guide the activity.

RI EQR Technical Report 2013 – Aggregate Page 72 of 81
Table 2-3
Protocols Used/To Be Used for EQR
Activity Who Has, Will, or May Perform Protocol Used/To Be Used
Prepare detailed technical report EQRO No protocol specified by CMS
Validation of performance improvement projects
EQRO
Xerox State Healthcare, LLC
State staff
Methods consistent with CMS protocols
Validation of MCO performance measures reported
NCQA auditors
NCQA audit standards and protocols, which the State has
found to be consistent with CMS protocols
Review to determine MCO compliance with standards
State staff
Xerox State Healthcare, LLC
State-specific protocols consistent with CMS protocols
Validation of encounter data Xerox State Healthcare, LLC
May be the EQRO
Validate against bills and/or against medical records
Administration or validation of consumer or provider surveys of quality of care
Xerox State Healthcare, LLC
State staff
MCH Evaluation
State-specific consumer survey consistent with CMS protocols and
CAHPS® standards
Calculation of additional performance measures
Xerox State Healthcare, LLC
MCH Evaluation
Methods consistent with CMS protocols
Conduct of additional quality improvement projects
State staff
Xerox State Healthcare, LLC
MCH Evaluation
Methods consistent with CMS protocols
Conduct of studies that focus on a particular aspect of clinical or non-clinical services at a point in time
EQRO EQRO’s methods consistent with
CMS protocols
Xerox State Healthcare, LLC, (formerly ACS) is the State’s management assistance contractor. MCH Evaluation is the State’s research and evaluation contractor. IPRO, Incorporated is the State’s EQRO.

RI EQR Technical Report 2013 – Aggregate Page 73 of 81
CHAPTER 3
PROCESS FOR INVOLVING RECIPIENTS AND OTHER STAKEHOLDERS
To fulfill the requirements of 42 CFR 438.202(b) to “obtain the input of recipients and other stakeholders in the development of the strategy and make the strategy available for public comment before adopting it in final,” the State used the following process:
RI Medicaid posted the “final draft” on the RI Medicaid Website.
RI Medicaid put a notice in English and Spanish in The Providence Journal, the newspaper of widest circulation in the State, making the public aware that the “final draft” was available for review and how to obtain a copy of it. RI Medicaid had a 30-day comment period.
RI Medicaid put the “final draft” on the agenda of the Child and Family Health Consumer Advisory Council for discussion.
With there being no comments received from the public, the document was finalized and copies were forwarded to CMS Central and Regional Offices.
The State will review the Quality Strategy periodically with the EOHHS’ Consumer Advisory Committee (CAC) and the Global Waiver’s Quality and Evaluation Workgroup to assess the strategy’s effectiveness and to update it, as needed. In addition, Rhode Island will review its Quality Strategy whenever the following temporal events occur: a) new population groups are to be enrolled in managed care delivery systems; and b) Medicaid managed care re-procurement takes place.
THIS SPACE INTENTIONALLY LEFT BLANK

RI EQR Technical Report 2013 – Aggregate Page 74 of 81
CHAPTER 4
RHODY HEALTH PARTNERS
The option to enroll in a managed care organization (MCO)27 was extended to adult Medicaid beneficiaries with disabilities in 2008. At that time, adults with disabilities without third-party coverage were given the option to enroll in an MCO with the provision that they could choose to return to fee-for-service (FFS) Medicaid (“opt out”) at any time. Effective September 1, 2010, all adults residing in the community without third-party coverage were required to either enroll in a Health Plan (i.e., MCO) through Rhody Health Partners or in the State’s FFS programs, which are Connect Care Choice and Connect Care. The Connect Care Choice program is a primary care practice-based model that includes care coordination and nurse care management. Connect Care is not a focus of the quality strategy, given that it is not a managed care product. Eligibility for enrollment in Rhody Health Partners is based on State determination of Medicaid beneficiaries who meet the following criteria:
Age twenty-one (21) or older
Categorically eligible for Medicaid
Not covered by other third-party insurance, including Medicare
Residents of Rhode Island
Not residing in an institutional facility Beneficiaries have a choice of Health Plans in which to enroll. Following ninety (90) days after their initial enrollment into a Health Plan, beneficiaries are restricted to that Health Plan until the next open enrollment period or unless they are disenrolled by the State under certain conditions (e.g., placement in a nursing facility for more than 30 consecutive days). Rhody Health Partners members have the same comprehensive benefits package as RIte Care members, with the exception of Home Care Services. However, Rhody Health Partners members do have Home Health Services benefits. In addition, Rhody Health Partners have access to out-of-plan benefits covered prior to the Global Waiver by Section 1915 waivers including, for example, homemaker services, environmental modification, home-delivered meals, supportive living arrangements, adult companion services, respite services, and assisted living. As noted previously, the State’s former 1915(c) waiver services were integrated into Rhode Island’s Global Waiver. An important component of Rhody Health Partners is a Care Management program, for which the Health Plan must comply with the Rhode Island Department of Human Services Care Management Protocols for Adults Enrolled in Rhody Health Partners. Key elements of this program are:
Initial Adult Health Screen – completed within forty-five (45) days of enrollment in the Health Plan
Level I Needs Review – completed within thirty (30) days of completion of the Initial Health Screen
Level II Needs Review – completed within thirty (30) days of completion of the Initial Health Screen or Level I Review, including development of an Intensive Care Management Plan as needed
Short-Term Care Management – completed within thirty (30) days of completion of the Initial Health Screen
Intensive Care Management – as deemed necessary
27
Prior to the State’s Medicaid Managed Care Services re-procurement in September of 2010, NHPRI and UHCNE were the MCOs available to adults with disabilities in which to enroll; BCBSRI never made itself available to this population.

RI EQR Technical Report 2013 – Aggregate Page 75 of 81
As part of its Contract with the State, each Health Plan agrees to conduct at least one quality improvement project annually directed at Rhody Health Partners members. Table 4-1 shows the quality design for Rhody Health Partners.
Table 4-1
Rhody Health Partners Quality Design
Date Collection Method Type of Method Performed By
Administrative data and hybrid measures, as set forth annually by the NCQA
The HEDIS® methodology.
Medicaid-participating Health Plans serving Rhode Island's RHP enrollees
Quality Improvement Project (QIP)
NCQA's Quality Improvement Assessment (QIA) methodology that meets CMS protocol requirements.
Medicaid-participating Health Plans serving Rhode Island's RHP enrollees
Annual External Quality Review Elements as mandated by 42 CFR 438.350(a).
Rhode Island's designated External Quality Review Organization (IPRO)
Informal Complaints, Grievances, and Appeals
Informal complaint reports are submitted electronically in a spreadsheet template established by RI Medicaid.
Medicaid-participating Health Plans serving Rhode Island's RHP enrollees
Health Plan Member Satisfaction Survey
The CAHPS® 4.0 Survey Methodology for Adults in Medicaid.
NCQA-certified CAHPS® vendor
Care Management Report for RHP
Care management reports are submitted electronically in a spreadsheet template established by RI Medicaid.
Medicaid-participating Health Plans serving Rhode Island's RHP enrollees
Encounter Data Reporting and Analysis
The managed care encounter dataset is designed to identify services provided to an individual and track utilization over time and across service categories, provider types, and treatment facilities.
Medicaid-participating Health Plans serving Rhode Island's RHP enrollment population
Access to Health Care for Adults with Disabilities on Medicaid Survey
Telephone survey of a sample of Rhode Island's ABD (Aged, Blind, and Disabled) population, including RHP enrollees.
Independent Contractor

RI EQR Technical Report 2013 – Aggregate Page 76 of 81
APPENDIX 2: Quality Improvement Activity Form Template
QUALITY IMPROVEMENT FORM NCQA Quality Improvement Activity Form
Activity Name:
Section I: Activity Selection and Methodology
A. Rationale. Use objective information (data) to explain your rationale for why this activity is important to members or practitioners and why there is an opportunity for improvement.
B. Quantifiable Measures. List and define all quantifiable measures used in this activity. Include a goal or benchmark for each measure. If a goal was established, list it. If you list a benchmark, state the source. Add sections for additional quantifiable measures as needed.
Quantifiable Measure #1:
Numerator:
Denominator:
First measurement period dates:
Baseline Benchmark:
Source of benchmark:
Baseline goal:
Quantifiable Measure #2:
Numerator:
Denominator:
First measurement period dates:
Benchmark:
Source of benchmark:
Baseline goal:

RI EQR Technical Report 2013 – Aggregate Page 77 of 81
Quantifiable Measure #3:
Numerator:
Denominator:
First measurement period dates:
Benchmark:
Source of benchmark:
Baseline goal:
C. Baseline Methodology.
C.1 Data Sources.
[ ] Medical/treatment records [ ] Administrative data:
[ ] Claims/encounter data [ ] Complaints [ ] Appeals [ ] Telephone service data [ ] Appointment/access data [ ] Hybrid (medical/treatment records and administrative) [ ] Pharmacy data [ ] Survey data (attach the survey tool and the complete survey protocol) [ ] Other (list and describe):
The Plan also uses a local access database to track all pregnant members as part of our Healthy First Steps Program. Although this database was not used as an administrative database from NCQA perspective, it was used by local Plan team members to identify and outreach to pregnant members. In addition, we used this database to track number of members who participated in our Diaper Reward Program.__________________________________________________________________________________________________________________________
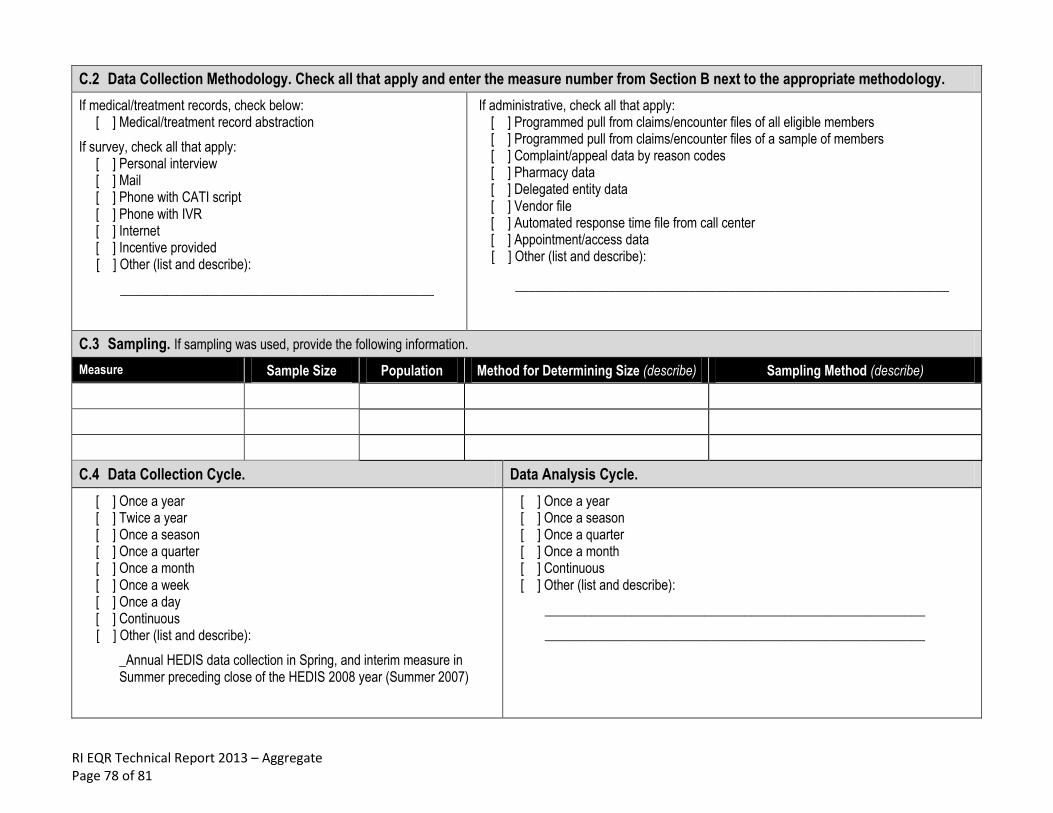
RI EQR Technical Report 2013 – Aggregate Page 78 of 81
C.2 Data Collection Methodology. Check all that apply and enter the measure number from Section B next to the appropriate methodology.
If medical/treatment records, check below: [ ] Medical/treatment record abstraction
If survey, check all that apply: [ ] Personal interview [ ] Mail [ ] Phone with CATI script [ ] Phone with IVR [ ] Internet [ ] Incentive provided [ ] Other (list and describe):
_______________________________________________
If administrative, check all that apply: [ ] Programmed pull from claims/encounter files of all eligible members [ ] Programmed pull from claims/encounter files of a sample of members [ ] Complaint/appeal data by reason codes [ ] Pharmacy data [ ] Delegated entity data [ ] Vendor file [ ] Automated response time file from call center [ ] Appointment/access data [ ] Other (list and describe):
_________________________________________________________________
C.3 Sampling. If sampling was used, provide the following information.
Measure Sample Size Population Method for Determining Size (describe) Sampling Method (describe)
C.4 Data Collection Cycle. Data Analysis Cycle.
[ ] Once a year [ ] Twice a year [ ] Once a season [ ] Once a quarter [ ] Once a month [ ] Once a week [ ] Once a day [ ] Continuous [ ] Other (list and describe):
_Annual HEDIS data collection in Spring, and interim measure in Summer preceding close of the HEDIS 2008 year (Summer 2007)
[ ] Once a year [ ] Once a season [ ] Once a quarter [ ] Once a month [ ] Continuous [ ] Other (list and describe):
_________________________________________________________
_________________________________________________________
RI EQR Technical Report 2013 – Aggregate Page 79 of 81
C.5 Other Pertinent Methodological Features. Complete only if needed.
D. Changes to Baseline Methodology. Describe any changes in methodology from measurement to measurement.
Include, as appropriate:
Measure and time period covered
Type of change
Rationale for change
Changes in sampling methodology, including changes in sample size, method for determining size, and sampling method
Any introduction of bias that could affect the results
Section II: Data/Results Table Complete for each quantifiable measure; add additional sections as needed.
#1 Quantifiable Measure:
Time Period Measurement Covers
Measurement
Numerator
Denominator Rate or Results
Comparison Benchmark
Comparison Goal
Statistical Test and
Significance*
Baseline:
#2 Quantifiable Measure:
Time Period Measurement Covers
Measurement
Numerator
Denominator Rate or Results
Comparison Benchmark
Comparison Goal
Statistical Test and
Significance*
Baseline:

RI EQR Technical Report 2013 – Aggregate Page 80 of 81
#3 Quantifiable Measure:
Time Period Measurement Covers
Measurement
Numerator
Denominator Rate or Results
Comparison Benchmark
Comparison Goal
Statistical Test and
Significance*
Baseline:
* If used, specify the test, p value, and specific measurements (e.g., baseline to remeasurement #1, remeasurement #1 to remeasurement #2, etc., or baseline to final remeasurement) included in the calculations. NCQA does not require statistical testing.
Section III: Analysis Cycle Complete this section for EACH analysis cycle presented.
A. Time Period and Measures That Analysis Covers.
B. Analysis and Identification of Opportunities for Improvement. Describe the analysis and include the points listed below.
B.1 For the quantitative analysis:
B.2 For the qualitative analysis: Opportunities identified through the analysis
Impact of interventions
Next steps

RI EQR Technical Report 2013 – Aggregate Page 81 of 81
Section IV: Interventions Table
Interventions Taken for Improvement as a Result of Analysis. List chronologically the interventions that have had the most impact on improving the measure.
Describe only the interventions and provide quantitative details whenever possible (e.g., “hired 4 UM nurses” as opposed to “hired UM nurses”). Do not include intervention planning activities.
Date Implemented
(MM / YY) Check if Ongoing
Interventions
Barriers That Interventions Address
Section V: Chart or Graph (Optional)
Attach a chart or graph for any activity having more than two measurement periods that shows the relationship between the timing of the intervention (cause) and the result of the remeasurements (effect). Present one graph for each measure unless the measures are closely correlated, such as average speed of answer and call abandonment rate. Control charts are not required, but are helpful in demonstrating the stability of the measure over time or after the implementation.