Rheology Study in Polyurethane Rigid Foams Library/a... · Rheology Study in Polyurethane Rigid...
12
1 Rheology Study in Polyurethane Rigid Foams Lifeng Wu, Janine Van Gemert, Rafael E. Camargo Huntsman Corporation 2190 Executive Hills Blvd. Auburn Hills, MI 48326 USA ABSTRACT The use of polyurethane (PU) rigid foam has been growing rapidly in many industries due to its excellent combination of energy conservation, good mechanical strength with lighter weight than other traditional materials. In this work, glass transition temperature was studied using rheology for a PU rigid foam model system. Some structure-property correlations have been established based on effects of crosslink density, aromaticity, plasticizer, and index. As demonstrated in some real examples, this understanding provides some guidelines in choosing the right ingredients to achieve certain properties, and therefore significantly accelerates the development of new PU rigid systems. In addition, rheology data also revealed an interaction between glass transition and the extent of curing for molded PU foams, indicating the significance of reactivity and processability to achieve desired end properties. INTRODUCTION The soaring price of crude oil has made energy conservation increasingly important. As the most efficient and practical thermal insulating materials, polyurethane (PU) rigid foams play a very important role in modern construction and other industrial applications. Besides its low thermal conductivity, which is mainly due to blowing agent and fine closed cell structure, PU rigid foam offers good adhesion to facing materials, good dimensional stability, and excellent mechanical strength at low densities [1]. These features are primarily derived from a highly crosslinked network structure in the PU matrix. The majority of PU rigid foams are prepared by mixing diphenylmethane diisocyanate (MDI) or its derivatives with a polyol blend which contains polyols, blowing agents, surfactants, catalysts, and other additives such as, flame retardants. Polymeric MDI is most commonly used to make PU rigid foams, while a very broad range of polyols can be selected to achieve different end properties. Therefore, understanding the fundamentals of structure-property relationships can greatly help formulators to identify and optimize combinations of various raw materials. This paper focuses on the effect of polymer structure on glass transition temperature (T g ) of PU rigid foams. As stated by Hiemenz and Lodge [2], the value of T g is the single most important characteristic in choosing a polymer for a given application . For instance, T g can be used to define the upper limit of service temperature for PU rigid foam. As illustrated in Figure 1, a typical PU foam can undergo a significant change in mechanical strength (i.e., flexural or shear modulus) as the temperature is increased to around T g , which indicates a transition from rigid to rubbery material. This behavior suggests that PU rigid foam should be applied below its T g in order to behave as a rigid material. Furthermore, the value of T g reflects the rigidity of polymer matrix, which impacts mechanical strength, dimensional stability, long term aging behavior, and other properties. Therefore, understanding the relationship between structure and T g can considerably accelerate the development of new systems. Unlike melting temperature, which is a thermodynamic property of solid material, T g is a dynamic property for amorphous polymers and it is related to relaxation behavior of local chain segments. As a result, T g depends on the following factors affecting the mobility of chain segments: crosslink density in the network structure, aromaticity (Ar, weight fraction of aromatic structures in the polymer matrix), polyisocyanurate (PIR) content, plasticizer concentration, and so on. Due to its dynamic attribute, for a given polymer, T g can adopt a range of values identified using various characterization techniques such as dilatometry, differential scanning calorimetry (DSC), and dynamic mechanical thermal analysis (DMTA). In this work, DMTA was used to locate T g using a typical shear rheometer. Details about DMTA parameters and their interpretation can be found elsewhere [3, 4]. Figure 1 showed that the glass transition induced a large change in rheological properties: precipitous drop in storage modulus (G ), a small peak of loss modulus (G ), and a sharp peak of loss tangent
Transcript of Rheology Study in Polyurethane Rigid Foams Library/a... · Rheology Study in Polyurethane Rigid...
1
Rheology Study in Polyurethane Rigid Foams
Lifeng Wu, Janine Van Gemert, Rafael E. Camargo Huntsman Corporation
2190 Executive Hills Blvd. Auburn Hills, MI 48326 USA
ABSTRACT
The use of polyurethane (PU) rigid foam has been growing rapidly in many industries due to its excellent combination of energy conservation, good mechanical strength with lighter weight than other traditional materials. In this work, glass transition temperature was studied using rheology for a PU rigid foam model system. Some structure-property correlations have been established based on effects of crosslink density, aromaticity, plasticizer, and index. As demonstrated in some real examples, this understanding provides some guidelines in choosing the right ingredients to achieve certain properties, and therefore significantly accelerates the development of new PU rigid systems. In addition, rheology data also revealed an interaction between glass transition and the extent of curing for molded PU foams, indicating the significance of reactivity and processability to achieve desired end properties.
INTRODUCTION
The soaring price of crude oil has made energy conservation increasingly important. As the most efficient and practical thermal insulating materials, polyurethane (PU) rigid foams play a very important role in modern construction and other industrial applications. Besides its low thermal conductivity, which is mainly due to blowing agent and fine closed cell structure, PU rigid foam offers good adhesion to facing materials, good dimensional stability, and excellent mechanical strength at low densities [1]. These features are primarily derived from a highly crosslinked network structure in the PU matrix. The majority of PU rigid foams are prepared by mixing diphenylmethane diisocyanate (MDI) or its derivatives with a polyol blend which contains polyols, blowing agents, surfactants, catalysts, and other additives such as, flame retardants. Polymeric MDI is most commonly used to make PU rigid foams, while a very broad range of polyols can be selected to achieve different end properties. Therefore, understanding the fundamentals of structure-property relationships can greatly help formulators to identify and optimize combinations of various raw materials.
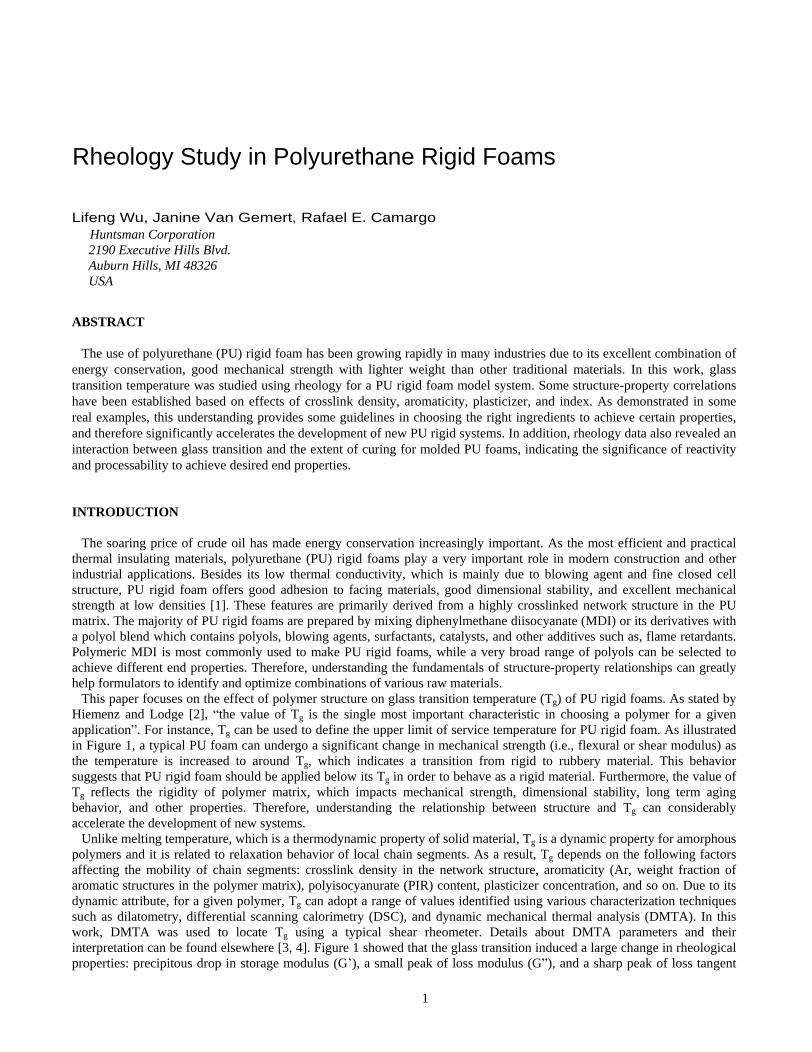
This paper focuses on the effect of polymer structure on glass transition temperature (Tg) of PU rigid foams. As stated by Hiemenz and Lodge [2], the value of Tg is the single most important characteristic in choosing a polymer for a given application . For instance, Tg can be used to define the upper limit of service temperature for PU rigid foam. As illustrated in Figure 1, a typical PU foam can undergo a significant change in mechanical strength (i.e., flexural or shear modulus) as the temperature is increased to around Tg, which indicates a transition from rigid to rubbery material. This behavior suggests that PU rigid foam should be applied below its Tg in order to behave as a rigid material. Furthermore, the value of Tg reflects the rigidity of polymer matrix, which impacts mechanical strength, dimensional stability, long term aging behavior, and other properties. Therefore, understanding the relationship between structure and Tg can considerably accelerate the development of new systems.
Unlike melting temperature, which is a thermodynamic property of solid material, Tg is a dynamic property for amorphous polymers and it is related to relaxation behavior of local chain segments. As a result, Tg depends on the following factors affecting the mobility of chain segments: crosslink density in the network structure, aromaticity (Ar, weight fraction of aromatic structures in the polymer matrix), polyisocyanurate (PIR) content, plasticizer concentration, and so on. Due to its dynamic attribute, for a given polymer, Tg can adopt a range of values identified using various characterization techniques such as dilatometry, differential scanning calorimetry (DSC), and dynamic mechanical thermal analysis (DMTA). In this work, DMTA was used to locate Tg using a typical shear rheometer. Details about DMTA parameters and their interpretation can be found elsewhere [3, 4]. Figure 1 showed that the glass transition induced a large change in rheological properties: precipitous drop in storage modulus (G ), a small peak of loss modulus (G ), and a sharp peak of loss tangent
2
(Tan( )). Although all these three features can be used to locate Tg, the peak of Tan( ) was used in this study because it is easier to identify with less error than using the other two parameters. Tg was investigated as a function of crosslink density, aromaticity, plasticizer concentration, PIR content, and processing conditions for a water-blown PU model system. Structure-property correlations were established for this model system and verified with some real examples.
1.0E+02
1.0E+03
1.0E+04
1.0E+05
1.0E+06
1.0E+07
1.0E+08
0 50 100 150 200T (°C)
G',
G"
(Pa)
0.0
0.2
0.4
0.6
0.8
1.0
1.2
Tan
()
G'G"Tan( )
G"
G'
Tan( )
Figure 1. Representative DMTA curves for a PU rigid foam.
EXPERIMENTAL
Materials
Seven blended polyols, A to G, were prepared from individual propylene oxide (PO) based Huntsman polyols to achieve certain average molecular weights (Mc) between crosslinks and aromatic contents (Ar). Two catalyst packages were applied: catalyst I yields balanced gel and blow reactions, while catalyst II can further catalyze the PIR reaction. All polyol blends were combined with RUBINATE® M polymeric MDI (NCOv = 31.2, Fn = 2.7) to make PU rigid foams. FYROL®
PCF (i.e., Tris(chloroisopropyl) phosphate, TCPP) was used as a plasticizer. It was obtained from Supresta. A standard rigid foam silicone surfactant was supplied by Evonik Degussa.
Foam preparation
100 grams of polyol blend was mixed with the required amount of RUBINATE® M isocyanate for 10 seconds at 2000 rpm. Then the mixture was poured into a 32oz paper cup to make a free rise foam. Foam density was measured from the foam in the cup by cutting the top off and comparing the weight to that of a water filled cup. Rectangular bar specimens (0.5cm 1.0cm 5.0cm) were cut near the center of foam for rheology measurement.
Rheology measurement
DMTA measurement was conducted on a stress-controlled AR-2000 rheometer (TA Instruments). Under dynamic mode, sinusoidal shear stress with a certain frequency was applied on a specimen by a motor, while the response strain was monitored by a displacement sensor. How a material responds to a dynamic stress depends on its own viscoelasticity [3, 4]. An elastic material shows a sinusoidal strain response without any phase lag compared to the applied stress curve, while a viscous material yields a strain response with 90
phase lag. For a typical viscoelastic material, the strain response has a phase lag between 0 and 90 . This phase lag is referred to as phase angle ( ). The response can be resolved into two components: one is elastic (or storage) component with 0 phase angle, the other is viscous (or loss) component with 90
phase angle. As a result, viscoelastic properties can be characterized by three variables: storage shear modulus (G ), loss shear modulus (G ), and phase angle ( ). In general, loss tangent Tan( ) is more commonly used due to the simple relationship of Tan( ) = G /G . All DMTA data were collected for foam specimens at a temperature ramp rate of 3 °C/min with 0.2% strain and 1 Hz frequency.
3
RESULTS AND DISCUSSION
1) Effect of crosslink density
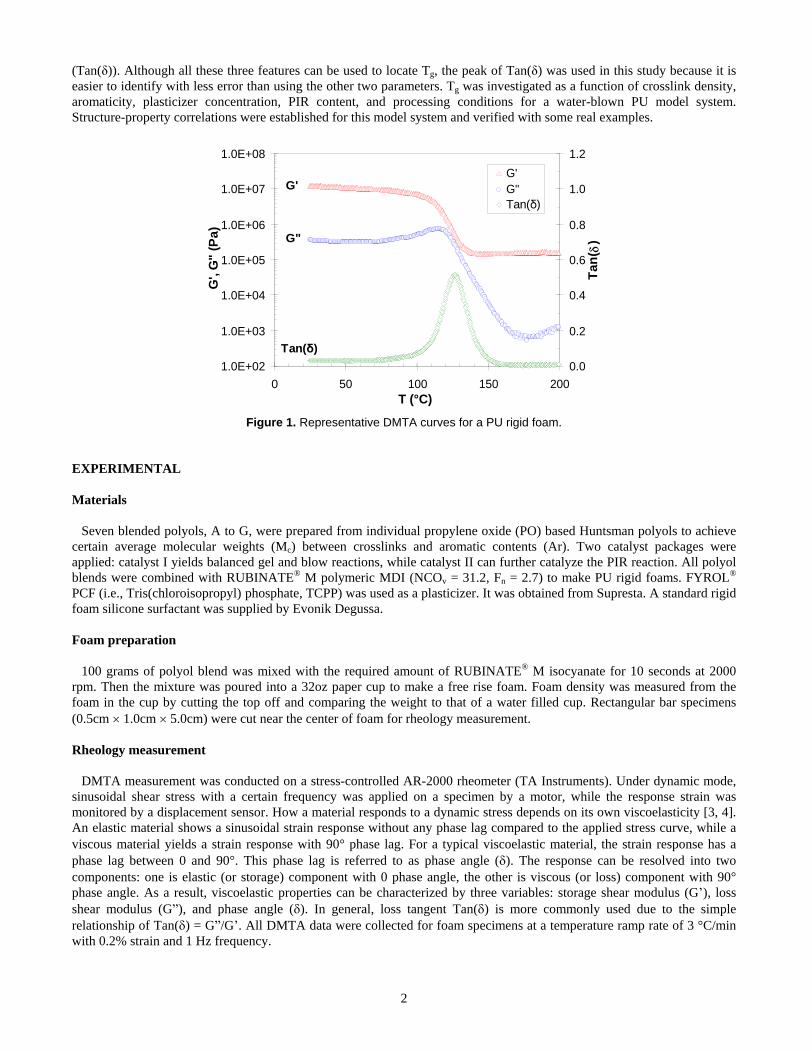
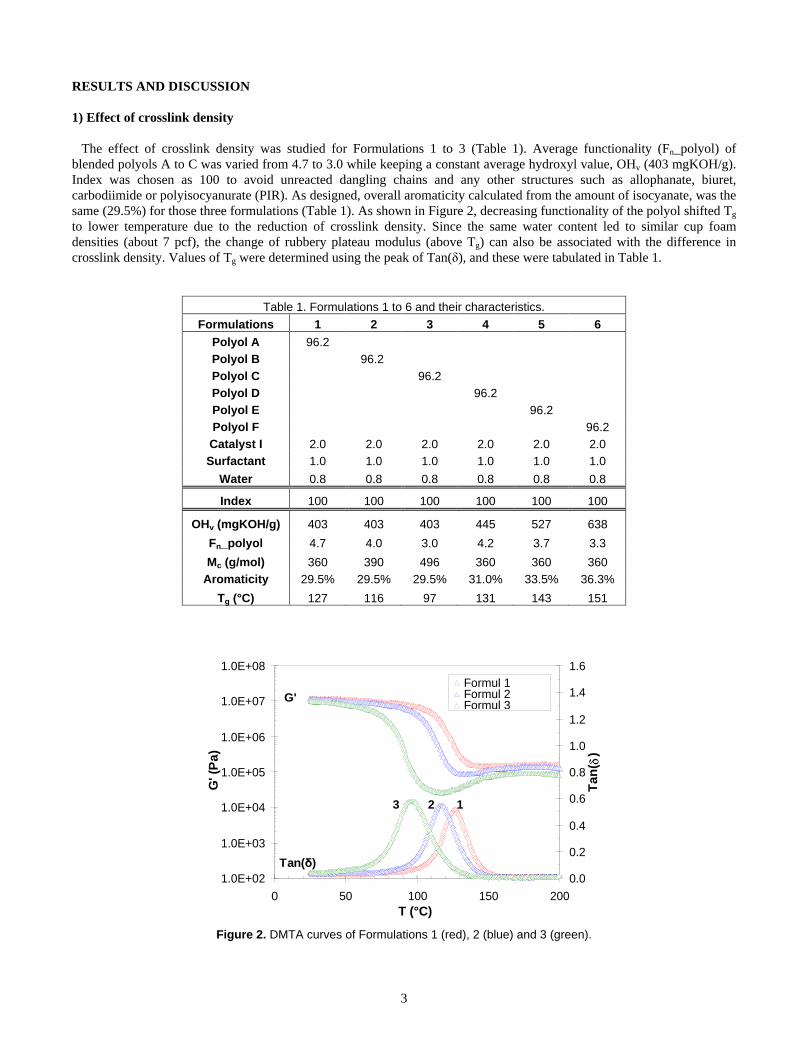
The effect of crosslink density was studied for Formulations 1 to 3 (Table 1). Average functionality (Fn_polyol) of blended polyols A to C was varied from 4.7 to 3.0 while keeping a constant average hydroxyl value, OHv (403 mgKOH/g). Index was chosen as 100 to avoid unreacted dangling chains and any other structures such as allophanate, biuret, carbodiimide or polyisocyanurate (PIR). As designed, overall aromaticity calculated from the amount of isocyanate, was the same (29.5%) for those three formulations (Table 1). As shown in Figure 2, decreasing functionality of the polyol shifted Tg
to lower temperature due to the reduction of crosslink density. Since the same water content led to similar cup foam densities (about 7 pcf), the change of rubbery plateau modulus (above Tg) can also be associated with the difference in crosslink density. Values of Tg were determined using the peak of Tan( ), and these were tabulated in Table 1.
Table 1. Formulations 1 to 6 and their characteristics.
Formulations 1 2 3 4 5 6 Polyol A 96.2
Polyol B
96.2
Polyol C
96.2
Polyol D
96.2
Polyol E
96.2
Polyol F
96.2 Catalyst I 2.0 2.0 2.0 2.0 2.0 2.0 Surfactant 1.0 1.0 1.0 1.0 1.0 1.0
Water 0.8 0.8 0.8 0.8 0.8 0.8
Index 100 100 100 100 100 100
OHv (mgKOH/g) 403 403 403 445 527 638
Fn_polyol 4.7 4.0 3.0 4.2 3.7 3.3
Mc (g/mol) 360 390 496 360 360 360 Aromaticity 29.5% 29.5% 29.5% 31.0% 33.5% 36.3%
Tg (°C) 127 116 97 131 143 151
1.0E+02
1.0E+03
1.0E+04
1.0E+05
1.0E+06
1.0E+07
1.0E+08
0 50 100 150 200T (°C)
G' (
Pa)
0.0
0.2
0.4
0.6
0.8
1.0
1.2
1.4
1.6
Tan
()
Formul 1Formul 2Formul 3
Tan( )
G'
123
Figure 2. DMTA curves of Formulations 1 (red), 2 (blue) and 3 (green).
4
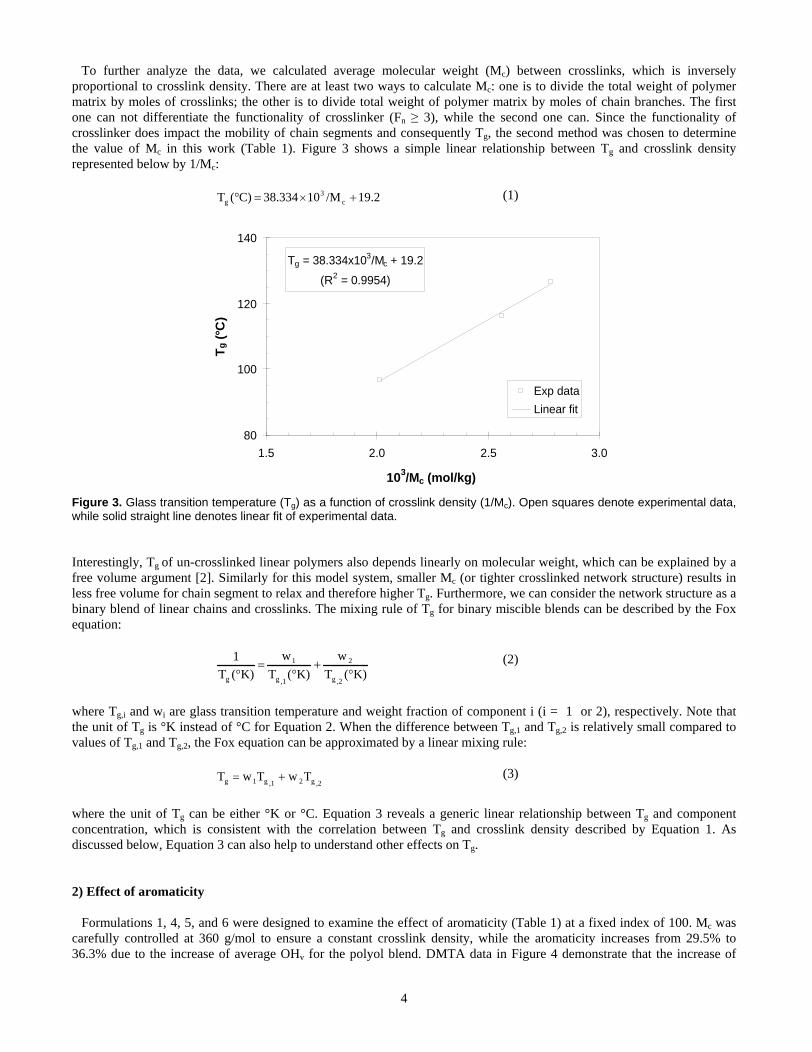
To further analyze the data, we calculated average molecular weight (Mc) between crosslinks, which is inversely
proportional to crosslink density. There are at least two ways to calculate Mc: one is to divide the total weight of polymer matrix by moles of crosslinks; the other is to divide total weight of polymer matrix by moles of chain branches. The first one can not differentiate the functionality of crosslinker (Fn 3), while the second one can. Since the functionality of crosslinker does impact the mobility of chain segments and consequently Tg, the second method was chosen to determine the value of Mc in this work (Table 1). Figure 3 shows a simple linear relationship between Tg and crosslink density represented below by 1/Mc:
19.2/M1038.334C)(T c3
g
(1)
Tg = 38.334x10³/Mc + 19.2
(R2 = 0.9954)
80
100
120
140
1.5 2.0 2.5 3.0
103/Mc (mol/kg)
Tg
(°C
)
Exp data
Linear fit
Figure 3. Glass transition temperature (Tg) as a function of crosslink density (1/Mc). Open squares denote experimental data, while solid straight line denotes linear fit of experimental data.
Interestingly, Tg of un-crosslinked linear polymers also depends linearly on molecular weight, which can be explained by a free volume argument [2]. Similarly for this model system, smaller Mc (or tighter crosslinked network structure) results in less free volume for chain segment to relax and therefore higher Tg. Furthermore, we can consider the network structure as a binary blend of linear chains and crosslinks. The mixing rule of Tg for binary miscible blends can be described by the Fox equation:
K)(T
w
K)(T
w
K)(T
1
,2g
2
,1g
1
g
(2)
where Tg,i and wi are glass transition temperature and weight fraction of component i (i = 1 or 2), respectively. Note that the unit of Tg is °K instead of °C for Equation 2. When the difference between Tg,1 and Tg,2 is relatively small compared to values of Tg,1 and Tg,2, the Fox equation can be approximated by a linear mixing rule:
,2g2,1g1g TwTwT
(3)
where the unit of Tg can be either °K or °C. Equation 3 reveals a generic linear relationship between Tg and component concentration, which is consistent with the correlation between Tg and crosslink density described by Equation 1. As discussed below, Equation 3 can also help to understand other effects on Tg.
2) Effect of aromaticity
Formulations 1, 4, 5, and 6 were designed to examine the effect of aromaticity (Table 1) at a fixed index of 100. Mc was carefully controlled at 360 g/mol to ensure a constant crosslink density, while the aromaticity increases from 29.5% to 36.3% due to the increase of average OHv for the polyol blend. DMTA data in Figure 4 demonstrate that the increase of
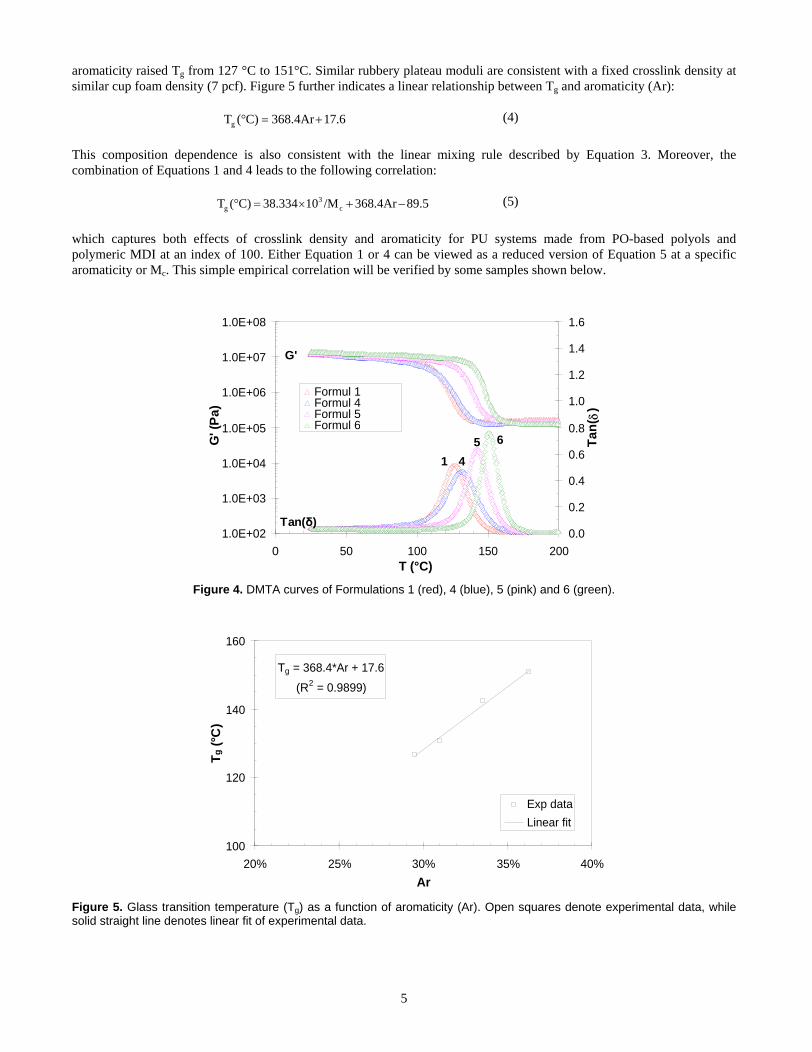
5
aromaticity raised Tg from 127 °C to 151°C. Similar rubbery plateau moduli are consistent with a fixed crosslink density at similar cup foam density (7 pcf). Figure 5 further indicates a linear relationship between Tg and aromaticity (Ar):
6.71368.4ArC)(Tg
(4)
This composition dependence is also consistent with the linear mixing rule described by Equation 3. Moreover, the combination of Equations 1 and 4 leads to the following correlation:
89.5368.4Ar/M1038.334C)(T c3
g
(5)
which captures both effects of crosslink density and aromaticity for PU systems made from PO-based polyols and polymeric MDI at an index of 100. Either Equation 1 or 4 can be viewed as a reduced version of Equation 5 at a specific aromaticity or Mc. This simple empirical correlation will be verified by some samples shown below.
1.0E+02
1.0E+03
1.0E+04
1.0E+05
1.0E+06
1.0E+07
1.0E+08
0 50 100 150 200T (°C)
G' (
Pa)
0.0
0.2
0.4
0.6
0.8
1.0
1.2
1.4
1.6
Tan
()
Formul 1Formul 4Formul 5Formul 6Tan( )_Formul 1
G'
Tan( )
65
41
Figure 4. DMTA curves of Formulations 1 (red), 4 (blue), 5 (pink) and 6 (green).
Tg = 368.4*Ar + 17.6
(R2 = 0.9899)
100
120
140
160
20% 25% 30% 35% 40%
Ar
Tg
(°C
)
Exp data
Linear fit
Figure 5. Glass transition temperature (Tg) as a function of aromaticity (Ar). Open squares denote experimental data, while solid straight line denotes linear fit of experimental data.
6
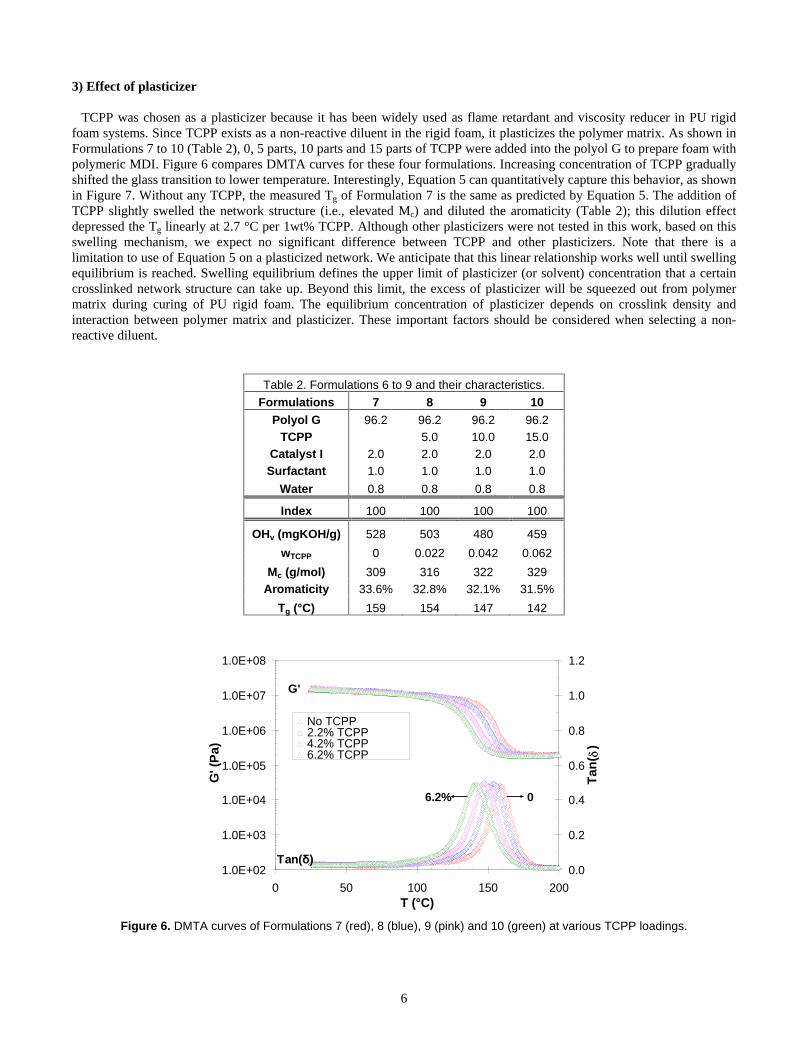
3) Effect of plasticizer
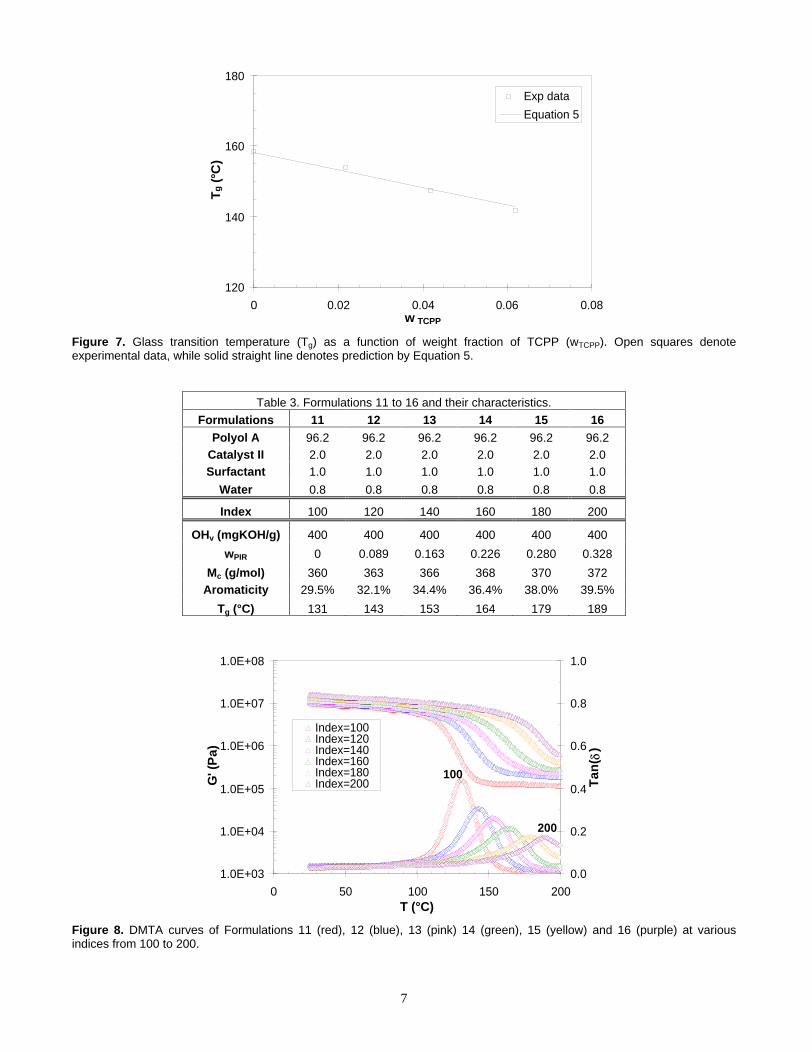
TCPP was chosen as a plasticizer because it has been widely used as flame retardant and viscosity reducer in PU rigid foam systems. Since TCPP exists as a non-reactive diluent in the rigid foam, it plasticizes the polymer matrix. As shown in Formulations 7 to 10 (Table 2), 0, 5 parts, 10 parts and 15 parts of TCPP were added into the polyol G to prepare foam with polymeric MDI. Figure 6 compares DMTA curves for these four formulations. Increasing concentration of TCPP gradually shifted the glass transition to lower temperature. Interestingly, Equation 5 can quantitatively capture this behavior, as shown in Figure 7. Without any TCPP, the measured Tg of Formulation 7 is the same as predicted by Equation 5. The addition of TCPP slightly swelled the network structure (i.e., elevated Mc) and diluted the aromaticity (Table 2); this dilution effect depressed the Tg linearly at 2.7 °C per 1wt% TCPP. Although other plasticizers were not tested in this work, based on this swelling mechanism, we expect no significant difference between TCPP and other plasticizers. Note that there is a limitation to use of Equation 5 on a plasticized network. We anticipate that this linear relationship works well until swelling equilibrium is reached. Swelling equilibrium defines the upper limit of plasticizer (or solvent) concentration that a certain crosslinked network structure can take up. Beyond this limit, the excess of plasticizer will be squeezed out from polymer matrix during curing of PU rigid foam. The equilibrium concentration of plasticizer depends on crosslink density and interaction between polymer matrix and plasticizer. These important factors should be considered when selecting a non-reactive diluent.
Table 2. Formulations 6 to 9 and their characteristics.
Formulations 7 8 9 10 Polyol G 96.2 96.2 96.2 96.2
TCPP
5.0 10.0 15.0 Catalyst I 2.0 2.0 2.0 2.0 Surfactant 1.0 1.0 1.0 1.0
Water 0.8 0.8 0.8 0.8
Index 100 100 100 100
OHv (mgKOH/g) 528 503 480 459
wTCPP 0 0.022 0.042 0.062
Mc (g/mol) 309 316 322 329 Aromaticity 33.6% 32.8% 32.1% 31.5%
Tg (°C) 159 154 147 142
1.0E+02
1.0E+03
1.0E+04
1.0E+05
1.0E+06
1.0E+07
1.0E+08
0 50 100 150 200T (°C)
G' (
Pa)
0.0
0.2
0.4
0.6
0.8
1.0
1.2
Tan
()
No TCPP2.2% TCPP4.2% TCPP6.2% TCPP
G'
Tan( )
06.2%
Figure 6. DMTA curves of Formulations 7 (red), 8 (blue), 9 (pink) and 10 (green) at various TCPP loadings.
7
120
140
160
180
0 0.02 0.04 0.06 0.08w TCPP
Tg
(°C
)
Exp data
Equation 5
Figure 7. Glass transition temperature (Tg) as a function of weight fraction of TCPP (wTCPP). Open squares denote experimental data, while solid straight line denotes prediction by Equation 5.
Table 3. Formulations 11 to 16 and their characteristics.
Formulations 11 12 13 14 15 16 Polyol A 96.2 96.2 96.2 96.2 96.2 96.2
Catalyst II 2.0 2.0 2.0 2.0 2.0 2.0 Surfactant 1.0 1.0 1.0 1.0 1.0 1.0
Water 0.8 0.8 0.8 0.8 0.8 0.8
Index 100 120 140 160 180 200
OHv (mgKOH/g) 400 400 400 400 400 400
wPIR 0 0.089 0.163 0.226 0.280 0.328
Mc (g/mol) 360 363 366 368 370 372 Aromaticity 29.5% 32.1% 34.4% 36.4% 38.0% 39.5%
Tg (°C) 131 143 153 164 179 189
1.0E+03
1.0E+04
1.0E+05
1.0E+06
1.0E+07
1.0E+08
0 50 100 150 200T (°C)
G' (
Pa)
0.0
0.2
0.4
0.6
0.8
1.0
Tan
()
Index=100Index=120Index=140Index=160Index=180Index=200Tan( )_1.0
100
200
Figure 8. DMTA curves of Formulations 11 (red), 12 (blue), 13 (pink) 14 (green), 15 (yellow) and 16 (purple) at various indices from 100 to 200.
8
4) Effect of index
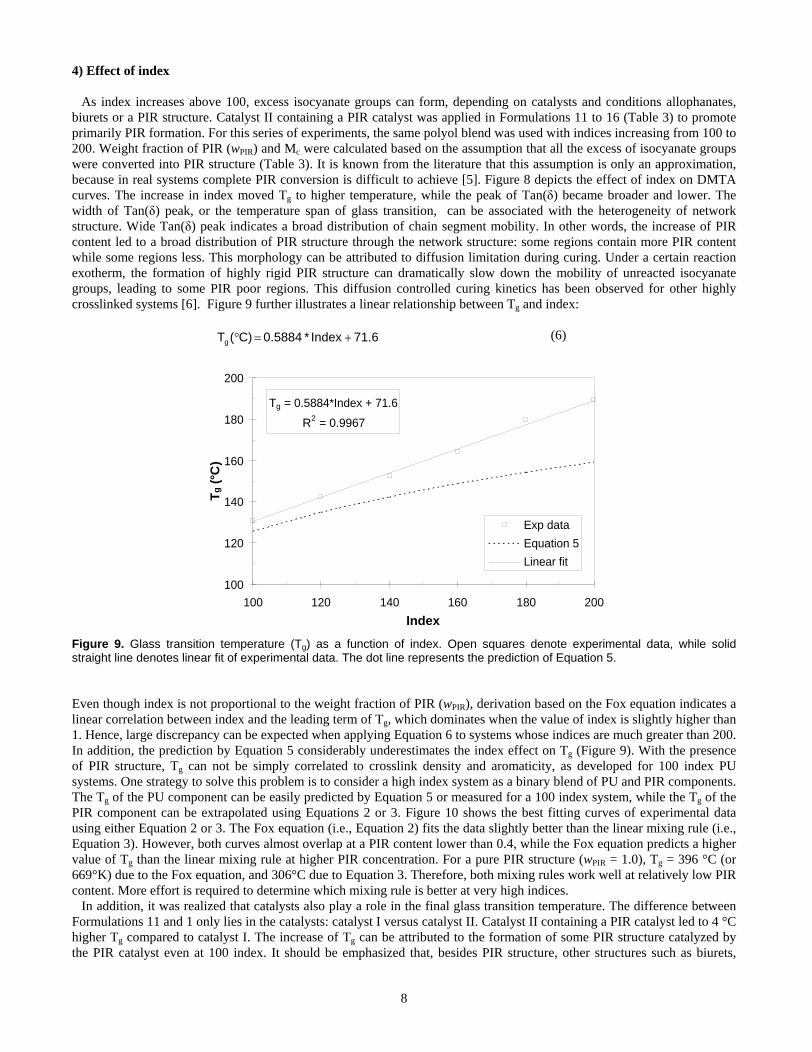
As index increases above 100, excess isocyanate groups can form, depending on catalysts and conditions allophanates, biurets or a PIR structure. Catalyst II containing a PIR catalyst was applied in Formulations 11 to 16 (Table 3) to promote primarily PIR formation. For this series of experiments, the same polyol blend was used with indices increasing from 100 to 200. Weight fraction of PIR (wPIR) and Mc were calculated based on the assumption that all the excess of isocyanate groups were converted into PIR structure (Table 3). It is known from the literature that this assumption is only an approximation, because in real systems complete PIR conversion is difficult to achieve [5]. Figure 8 depicts the effect of index on DMTA curves. The increase in index moved Tg to higher temperature, while the peak of Tan( ) became broader and lower. The width of Tan( ) peak, or the temperature span of glass transition, can be associated with the heterogeneity of network structure. Wide Tan( ) peak indicates a broad distribution of chain segment mobility. In other words, the increase of PIR content led to a broad distribution of PIR structure through the network structure: some regions contain more PIR content while some regions less. This morphology can be attributed to diffusion limitation during curing. Under a certain reaction exotherm, the formation of highly rigid PIR structure can dramatically slow down the mobility of unreacted isocyanate groups, leading to some PIR poor regions. This diffusion controlled curing kinetics has been observed for other highly crosslinked systems [6]. Figure 9 further illustrates a linear relationship between Tg and index:
71.6Index*0.5884C)(Tg
(6)
Tg = 0.5884*Index + 71.6
R2 = 0.9967
100
120
140
160
180
200
100 120 140 160 180 200
Index
Tg
(°C
)
Exp data
Equation 5
Linear fit
Figure 9. Glass transition temperature (Tg) as a function of index. Open squares denote experimental data, while solid straight line denotes linear fit of experimental data. The dot line represents the prediction of Equation 5.
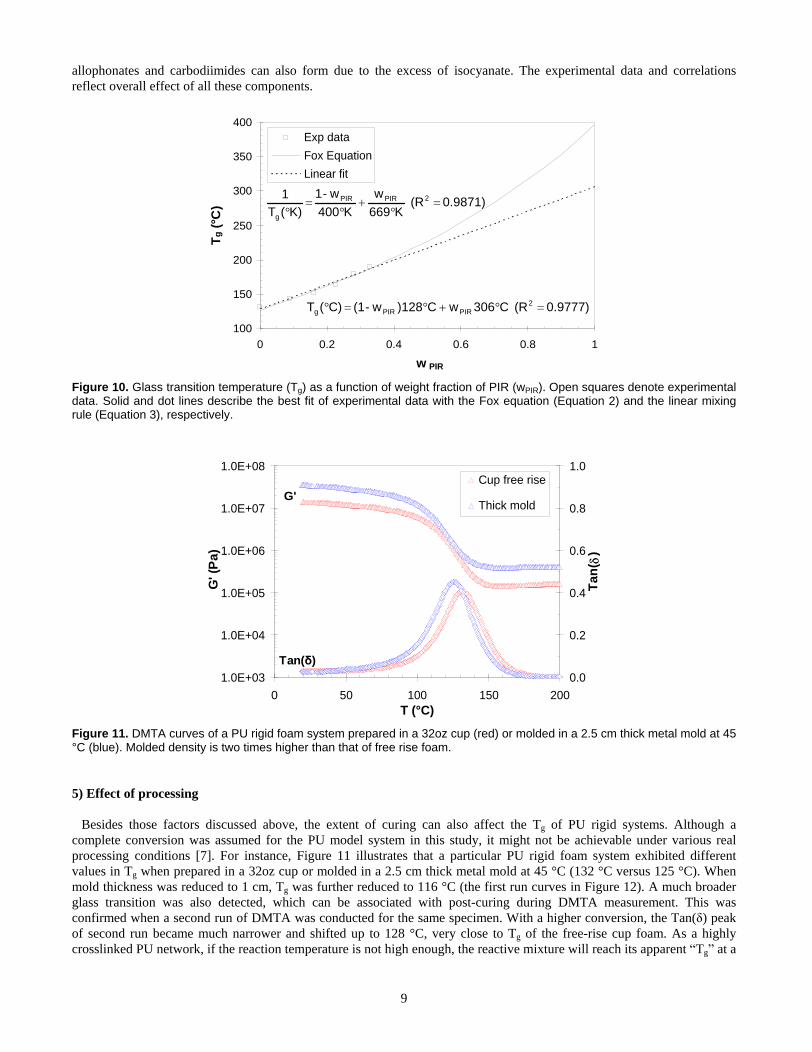
Even though index is not proportional to the weight fraction of PIR (wPIR), derivation based on the Fox equation indicates a linear correlation between index and the leading term of Tg, which dominates when the value of index is slightly higher than 1. Hence, large discrepancy can be expected when applying Equation 6 to systems whose indices are much greater than 200. In addition, the prediction by Equation 5 considerably underestimates the index effect on Tg (Figure 9). With the presence of PIR structure, Tg can not be simply correlated to crosslink density and aromaticity, as developed for 100 index PU systems. One strategy to solve this problem is to consider a high index system as a binary blend of PU and PIR components. The Tg of the PU component can be easily predicted by Equation 5 or measured for a 100 index system, while the Tg of the PIR component can be extrapolated using Equations 2 or 3. Figure 10 shows the best fitting curves of experimental data using either Equation 2 or 3. The Fox equation (i.e., Equation 2) fits the data slightly better than the linear mixing rule (i.e., Equation 3). However, both curves almost overlap at a PIR content lower than 0.4, while the Fox equation predicts a higher value of Tg than the linear mixing rule at higher PIR concentration. For a pure PIR structure (wPIR = 1.0), Tg = 396 °C (or 669°K) due to the Fox equation, and 306°C due to Equation 3. Therefore, both mixing rules work well at relatively low PIR content. More effort is required to determine which mixing rule is better at very high indices.
In addition, it was realized that catalysts also play a role in the final glass transition temperature. The difference between Formulations 11 and 1 only lies in the catalysts: catalyst I versus catalyst II. Catalyst II containing a PIR catalyst led to 4 °C higher Tg compared to catalyst I. The increase of Tg can be attributed to the formation of some PIR structure catalyzed by the PIR catalyst even at 100 index. It should be emphasized that, besides PIR structure, other structures such as biurets,
9
allophonates and carbodiimides can also form due to the excess of isocyanate. The experimental data and correlations reflect overall effect of all these components.
Figure 10. Glass transition temperature (Tg) as a function of weight fraction of PIR (wPIR). Open squares denote experimental data. Solid and dot lines describe the best fit of experimental data with the Fox equation (Equation 2) and the linear mixing rule (Equation 3), respectively.
1.0E+03
1.0E+04
1.0E+05
1.0E+06
1.0E+07
1.0E+08
0 50 100 150 200T (°C)
G' (
Pa)
0.0
0.2
0.4
0.6
0.8
1.0
Tan
()
Cup free rise
Thick moldG'
Tan( )
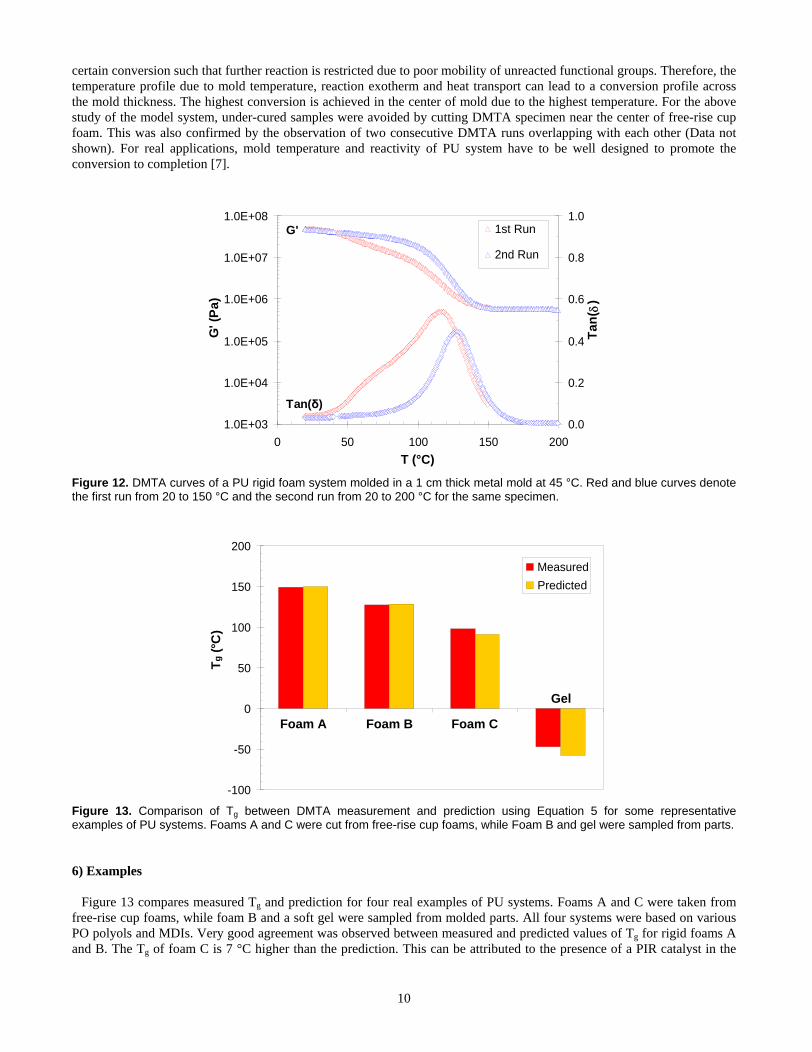
Figure 11. DMTA curves of a PU rigid foam system prepared in a 32oz cup (red) or molded in a 2.5 cm thick metal mold at 45 °C (blue). Molded density is two times higher than that of free rise foam.
5) Effect of processing
Besides those factors discussed above, the extent of curing can also affect the Tg of PU rigid systems. Although a complete conversion was assumed for the PU model system in this study, it might not be achievable under various real processing conditions [7]. For instance, Figure 11 illustrates that a particular PU rigid foam system exhibited different values in Tg when prepared in a 32oz cup or molded in a 2.5 cm thick metal mold at 45 °C (132 °C versus 125 °C). When mold thickness was reduced to 1 cm, Tg was further reduced to 116 °C (the first run curves in Figure 12). A much broader glass transition was also detected, which can be associated with post-curing during DMTA measurement. This was confirmed when a second run of DMTA was conducted for the same specimen. With a higher conversion, the Tan( ) peak of second run became much narrower and shifted up to 128 °C, very close to Tg of the free-rise cup foam. As a highly crosslinked PU network, if the reaction temperature is not high enough, the reactive mixture will reach its apparent Tg at a
100
150
200
250
300
350
400
0 0.2 0.4 0.6 0.8 1
w PIR
Tg
(°C
)
Exp data
Fox Equation
Linear fit
0.9871)(R K669
w
K400
w-1
K)(T1 2PIRPIR
g
0.9777)(R C306wC)128w-(1C)(T 2PIRPIRg
10
certain conversion such that further reaction is restricted due to poor mobility of unreacted functional groups. Therefore, the temperature profile due to mold temperature, reaction exotherm and heat transport can lead to a conversion profile across the mold thickness. The highest conversion is achieved in the center of mold due to the highest temperature. For the above study of the model system, under-cured samples were avoided by cutting DMTA specimen near the center of free-rise cup foam. This was also confirmed by the observation of two consecutive DMTA runs overlapping with each other (Data not shown). For real applications, mold temperature and reactivity of PU system have to be well designed to promote the conversion to completion [7].
1.0E+03
1.0E+04
1.0E+05
1.0E+06
1.0E+07
1.0E+08
0 50 100 150 200
T (°C)
G' (
Pa)
0.0
0.2
0.4
0.6
0.8
1.0
Tan
()
1st Run
2nd Run
G'
Tan( )
Figure 12. DMTA curves of a PU rigid foam system molded in a 1 cm thick metal mold at 45 °C. Red and blue curves denote the first run from 20 to 150 °C and the second run from 20 to 200 °C for the same specimen.
-100
-50
0
50
100
150
200
Foam A Foam B Foam C
Tg
(°C
)
Measured
Predicted
Gel
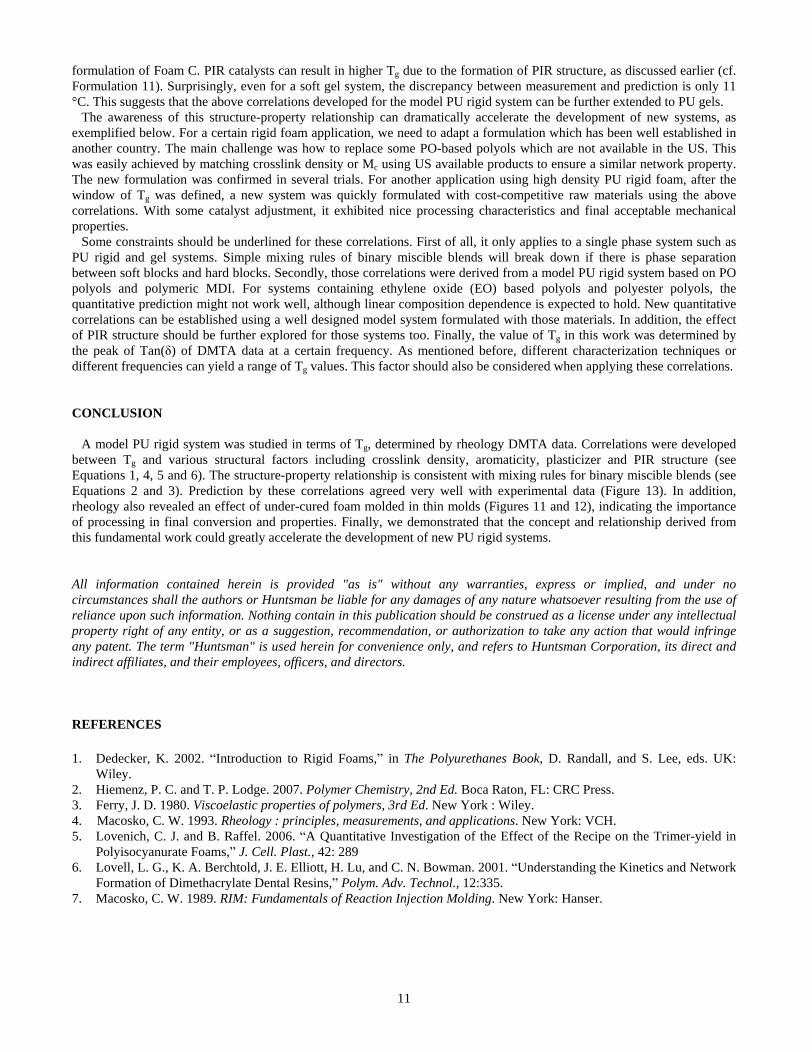
Figure 13. Comparison of Tg between DMTA measurement and prediction using Equation 5 for some representative examples of PU systems. Foams A and C were cut from free-rise cup foams, while Foam B and gel were sampled from parts.
6) Examples
Figure 13 compares measured Tg and prediction for four real examples of PU systems. Foams A and C were taken from free-rise cup foams, while foam B and a soft gel were sampled from molded parts. All four systems were based on various PO polyols and MDIs. Very good agreement was observed between measured and predicted values of Tg for rigid foams A and B. The Tg of foam C is 7 °C higher than the prediction. This can be attributed to the presence of a PIR catalyst in the
11
formulation of Foam C. PIR catalysts can result in higher Tg due to the formation of PIR structure, as discussed earlier (cf. Formulation 11). Surprisingly, even for a soft gel system, the discrepancy between measurement and prediction is only 11 °C. This suggests that the above correlations developed for the model PU rigid system can be further extended to PU gels.
The awareness of this structure-property relationship can dramatically accelerate the development of new systems, as exemplified below. For a certain rigid foam application, we need to adapt a formulation which has been well established in another country. The main challenge was how to replace some PO-based polyols which are not available in the US. This was easily achieved by matching crosslink density or Mc using US available products to ensure a similar network property. The new formulation was confirmed in several trials. For another application using high density PU rigid foam, after the window of Tg was defined, a new system was quickly formulated with cost-competitive raw materials using the above correlations. With some catalyst adjustment, it exhibited nice processing characteristics and final acceptable mechanical properties.
Some constraints should be underlined for these correlations. First of all, it only applies to a single phase system such as PU rigid and gel systems. Simple mixing rules of binary miscible blends will break down if there is phase separation between soft blocks and hard blocks. Secondly, those correlations were derived from a model PU rigid system based on PO polyols and polymeric MDI. For systems containing ethylene oxide (EO) based polyols and polyester polyols, the quantitative prediction might not work well, although linear composition dependence is expected to hold. New quantitative correlations can be established using a well designed model system formulated with those materials. In addition, the effect of PIR structure should be further explored for those systems too. Finally, the value of Tg in this work was determined by the peak of Tan( ) of DMTA data at a certain frequency. As mentioned before, different characterization techniques or different frequencies can yield a range of Tg values. This factor should also be considered when applying these correlations.
CONCLUSION
A model PU rigid system was studied in terms of Tg, determined by rheology DMTA data. Correlations were developed between Tg and various structural factors including crosslink density, aromaticity, plasticizer and PIR structure (see Equations 1, 4, 5 and 6). The structure-property relationship is consistent with mixing rules for binary miscible blends (see Equations 2 and 3). Prediction by these correlations agreed very well with experimental data (Figure 13). In addition, rheology also revealed an effect of under-cured foam molded in thin molds (Figures 11 and 12), indicating the importance of processing in final conversion and properties. Finally, we demonstrated that the concept and relationship derived from this fundamental work could greatly accelerate the development of new PU rigid systems.
All information contained herein is provided "as is" without any warranties, express or implied, and under no circumstances shall the authors or Huntsman be liable for any damages of any nature whatsoever resulting from the use of reliance upon such information. Nothing contain in this publication should be construed as a license under any intellectual property right of any entity, or as a suggestion, recommendation, or authorization to take any action that would infringe any patent. The term "Huntsman" is used herein for convenience only, and refers to Huntsman Corporation, its direct and indirect affiliates, and their employees, officers, and directors.
REFERENCES
1. Dedecker, K. 2002. Introduction to Rigid Foams, in The Polyurethanes Book, D. Randall, and S. Lee, eds. UK: Wiley.
2. Hiemenz, P. C. and T. P. Lodge. 2007. Polymer Chemistry, 2nd Ed. Boca Raton, FL: CRC Press. 3. Ferry, J. D. 1980. Viscoelastic properties of polymers, 3rd Ed. New York : Wiley. 4. Macosko, C. W. 1993. Rheology : principles, measurements, and applications. New York: VCH. 5. Lovenich, C. J. and B. Raffel. 2006. A Quantitative Investigation of the Effect of the Recipe on the Trimer-yield in
Polyisocyanurate Foams,
J. Cell. Plast., 42: 289 6. Lovell, L. G., K. A. Berchtold, J. E. Elliott, H. Lu, and C. N. Bowman. 2001. Understanding the Kinetics and Network
Formation of Dimethacrylate Dental Resins, Polym. Adv. Technol., 12:335. 7. Macosko, C. W. 1989. RIM: Fundamentals of Reaction Injection Molding. New York: Hanser.

12
BIOGRAPHIES
Lifeng Wu
Lifeng Wu is currently a Senior Technical Specialist in the Americas Business Development Team of Huntsman at Auburn Hills, Michigan. Since joining in 2005, he has been involved in various projects including TPU, PU cast elastomers and rigid foams. He received his Ph.D. in Chemical Engineering from University of Minnesota in Minneapolis, M.S. and B.E degrees in Chemical Engineering from Tsinghua University in Beijing.
Janine Van Gemert
Janine Van Gemert is currently a Development Chemist in the Americas Business Development Team in Auburn Hills, Michigan. She has been involved in the development of thermoplastic polyurethanes, polyurethane rigid foam, and rheological characterization. Janine is currently finishing her Bachelor of Science in chemistry at Eastern Michigan University in Ypsilanti, Michigan. She is experienced in polyurethane, analytical, and archaeological chemistry.
Rafael E. Camargo
Rafael E. Camargo is currently the Elastomers Development Manager for the Americas Business Development Team in Auburn Hills, Michigan. He is responsible for new developments in multiple areas of polyurethane elastomers and related technologies. Dr. Camargo has over 20 years of experience in numerous polyurethane applications. He has been part of the Polyurethanes business at Huntsman since 1987 and has held a number of commercial and technical positions. Dr. Camargo has a Chemical Engineering Diploma from Universidad Pontificia Bolivariana in Medellin, Colombia and a Ph.D. in Chemical Engineering and Materials Science from the University of Minnesota in Minneapolis.