Revisions to Guidelines for Assessing Marine Mammal Stocks … · · 2009-03-12Revisions to...
25
Revisions to Guidelines for Assessing Marine Mammal Stocks (GAMMS II) Suggested citation: NMFS. 2005. Revisions to Guidelines for Assessing Marine Mammal Stocks. 24 pp. Available at: http://www.nmfs.noaa.gov/pr/pdfs/sars/gamms2005.pdf The initial guidelines (Barlow et al., 1995 ) and first revision of the guidelines for assessing marine mammal stocks (Wade and Angliss, 1998 ) were each published as an appendix to a NOAA Technical Memorandum. In these two cases, the publications were reports of workshops convened to discuss guidance for preparing stock assessment reports. A similar workshop was convened for these revisions; however, no report was prepared describing the workshop. This revision originated in a meeting of NMFS and FWS scientists and managers, accompanied by representatives of the three regional Scientific Review Groups. The revised guidelines were subjected to review by NMFS scientists and managers and members of the Scientific Review Group. The revised guidelines were processed through NMFS and NOAA General Counsel clearance and approved by the Assistant Administrator for Fisheries to be released to the public for review and comment (69 FR 67541, November 18, 2004). NMFS updated the guidelines as needed in accordance with public comment, summarized comments received on these revised guidelines and responded to these summary comments. The final revised guidelines and summarized comments with responses received NMFS and NOAA General Counsel review and clearance prior to approval by the Assistant Administrator for Fisheries for use and release to the public (70 FR 35397, June 20, 2005). Accordingly, these revised guidelines represent a statement of NMFS policy for implementing provisions of section 117 of the Marine Mammal Protection Act.
Transcript of Revisions to Guidelines for Assessing Marine Mammal Stocks … · · 2009-03-12Revisions to...

Revisions to Guidelines for Assessing Marine Mammal Stocks (GAMMS II) Suggested citation: NMFS. 2005. Revisions to Guidelines for Assessing Marine Mammal Stocks. 24 pp.
Available at: http://www.nmfs.noaa.gov/pr/pdfs/sars/gamms2005.pdf The initial guidelines (Barlow et al., 1995) and first revision of the guidelines for assessing marine mammal stocks (Wade and Angliss, 1998) were each published as an appendix to a NOAA Technical Memorandum. In these two cases, the publications were reports of workshops convened to discuss guidance for preparing stock assessment reports. A similar workshop was convened for these revisions; however, no report was prepared describing the workshop. This revision originated in a meeting of NMFS and FWS scientists and managers, accompanied by representatives of the three regional Scientific Review Groups. The revised guidelines were subjected to review by NMFS scientists and managers and members of the Scientific Review Group. The revised guidelines were processed through NMFS and NOAA General Counsel clearance and approved by the Assistant Administrator for Fisheries to be released to the public for review and comment (69 FR 67541, November 18, 2004). NMFS updated the guidelines as needed in accordance with public comment, summarized comments received on these revised guidelines and responded to these summary comments. The final revised guidelines and summarized comments with responses received NMFS and NOAA General Counsel review and clearance prior to approval by the Assistant Administrator for Fisheries for use and release to the public (70 FR 35397, June 20, 2005). Accordingly, these revised guidelines represent a statement of NMFS policy for implementing provisions of section 117 of the Marine Mammal Protection Act.

SAR Guidelines, June 2005 Revisions, Page 1
Guidelines for Preparing Stock Assessment Reports Pursuant to Section 117 of the Marine Mammal Protection Act
1. General Guidelines
Introduction
Sec. 117 of the Marine Mammal Protection Act (MMPA) requires that the National MarineFisheries Service (NMFS) and the Fish and Wildlife Service (FWS) develop Stock AssessmentReports (Reports) for all marine mammal stocks in waters under U.S. jurisdiction (U.S. waters). These Reports are to be based upon the best scientific information available. Reports are notrequired for stocks that have a remote likelihood of occurring regularly in U.S. waters (e.g.,stocks for which only the margins of the range extends into U.S. waters or that enter U.S. watersonly during anomalous current or temperature shifts). The MMPA requires Reports to include, among other things, information on how stocks wereidentified, a calculation of Potential Biological Removal (PBR), and an assessment of whetherincidental fishery takes are "insignificant and approaching zero mortality and serious injury rate". These reports are to be reviewed annually for "strategic stocks" and for stocks for which newinformation is available, and at least once every three years for all other stocks. This documentprovides guidance for how these topics are to be addressed in the Reports.
The MMPA provides some general guidance for developing the Reports; more detailedguidelines were developed at the PBR Workshop in June 1994 and were used in writing theoriginal draft Reports. The guidelines for preparing SARs were initially drafted as the result of aworkshop in 1994. The draft guidelines and initial draft stock assessment reports were subjectedto public review and comment in August 1994. Final guidelines and reports were completed in1995 (Barlow et al. 1995). In 1996, representatives of NMFS, FWS, regional Scientific ReviewGroups, and the Marine Mammal Commission reviewed the guidelines, and NMFS proposedminor changes in 1996. The revised guidelines, after public review and comment, were madefinal in 1997 (Wade and Angliss 1997) and have been used since that time. In September 2003,NMFS again convened representatives of the review groups and agencies to review and, asappropriate, recommend revisions to the guidelines.
It is anticipated that the guidelines themselves will be reviewed and changed based on additionalscientific research and on experience gained in their application. In this regard, FWS and NMFSwill meet periodically to review and revise, as needed, the guidelines. When the agenciesrecommend revisions to the guidelines, these revisions will be made available for public reviewand comment prior to acceptance. Furthermore, the guidelines in this document do not have tobe followed rigidly; however, any departure from these guidelines must be discussed fully withinany affected Report.

SAR Guidelines, June 2005 Revisions, Page 2
The intent of these guidelines is to: (1) provide a uniform framework for the consistentapplication of the amended MMPA throughout the country; (2) ensure that PBR is calculated in amanner that ensures meeting the goals of the MMPA; (3) provide guidelines for evaluatingwhether fishery takes are insignificant and approaching a zero mortality and serious injury rate;and (4) make the Government's approach clear and open to the public. Where the guidelinesprovided here are not incorporated into a particular Report, it was agreed that justification for thedeparture will be provided within the Report. Similarly, the Reports will explain whendeviations are made from specific recommendations from the Scientific Review Groups.
FWS and NMFS interpret the primary intent of the 1994 MMPA amendments and the PBRguidelines developed pursuant to the Act as a mechanism to respond to the uncertainty associatedwith assessing and reducing marine mammal mortality from incidental fisheries takes.Accordingly, this mechanism is increasingly conservative under increasing degrees ofuncertainty. The MMPA requires the calculation of PBR for all stocks, including those that areconsidered endangered under the Endangered Species Act (ESA) and those which are managedunder other authorities, such as the International Whaling Commission. However, in some casesallowable takes under these other authorities may be less than the PBR calculated under theMMPA owing to the different degrees of "risk" associated with, and the treatment of, uncertaintyunder each authority. Where there is inconsistency between the MMPA and ESA regarding thetake of listed marine mammals, the more restrictive mortality requirement takes precedence. Nonetheless, PBR must still be calculated for these stocks, where possible, and discussed in thetext of the Reports. As mandated in the MMPA, the PBR is calculated as "...the maximumnumber of animals, not including natural mortalities, that may be removed from a marinemammal stock while allowing that stock to reach or maintain its optimum sustainablepopulation." Therefore, a PBR is an upper limit to removals that does not imply that the entireamount should be taken. Estimates of PBR, human-caused mortality, and classification as to whether a stock is "strategic"or "non-strategic" are required by Sec. 117 to be included in the Reports for all stocks of marinemammals in U.S. waters. However, it should be noted that the co-management, between theFederal government and Alaska Native organizations, of removals of marine mammals forsubsistence purposes between the Federal government and Alaska Native organizations isspecifically addressed in Sec. 119. In response to Sec. 119, NMFS and FWS have entered intocooperative agreements with Alaska Native organizations to conserve marine mammals andprovide co-management of subsistence use by Alaska Natives. FWS and NMFS believe that it isappropriate to develop management programs for stocks subject to subsistence harvests throughthe co-management process provided that commercial fisheries takes are not significant and thatthe process includes a sound research and management program to identify and addressuncertainties concerning the status of these stocks. Estimates of PBR and classification as towhether a stock is strategic will be determined from the analysis of scientific and other relevantinformation discussed during the co-management process.

SAR Guidelines, June 2005 Revisions, Page 3
Definition of "Stock"
“Population stock” is the fundamental unit of legally-mandated conservation. The MMPAdefines population stock as “a group of marine mammals of the same species or smaller taxa in acommon spatial arrangement, that interbreed when mature.” To fully interpret this definition, itis necessary to consider the objectives of the MMPA. In Sec. 2 (Findings and Declaration ofPolicy) of the MMPA it is stated that “...species and populations stocks of marinemammals...should not be permitted to diminish beyond the point at which they cease to be asignificant functioning element in the ecosystem of which they are a part, and, consistent withthis major objective, they should not be permitted to diminish below their optimum sustainablepopulation.” Further on in Sec. 2, it states “...the primary objective of their management shouldbe to maintain the health and stability of the marine ecosystem. Whenever consistent with thisprimary objective, it should be the goal to obtain an optimum sustainable population keeping inmind the carrying capacity of the habitat.” Therefore, stocks must be identified in a manner thatis consistent with these goals. For the purposes of management under the MMPA, a stock isrecognized as being a management unit that identifies a demographically isolated biologicalpopulation. It is recognized that in practice, identified stocks may fall short of this ideal becauseof a lack of information, or for other reasons.
Many types of information can be used to identify stocks of a species: e.g., distribution andmovements, population trends, morphological differences, differences in life history, geneticdifferences, contaminants and natural isotope loads, parasite differences, and oceanographichabitat differences. Different population responses (e.g., different trends in abundance) betweengeographic regions is also an indicator of stock structure, as populations with different trends arenot strongly linked demographically. When different types of evidence are available to identifystock structure, the report must discuss inferences made from the different types of evidence andhow these inferences were integrated to identify the stock.
Evidence of morphological or genetic differences in animals from different geographic regionsindicates that these populations are reproductively isolated. Reproductive isolation is proof ofdemographic isolation, and, thus, separate management is appropriate when such differences arefound. Demographic isolation means that the population dynamics of the affected group is morea consequence of births and deaths within the group (internal dynamics) rather than immigrationor emigration (external dynamics). Thus, the exchange of individuals between population stocksis not great enough to prevent the depletion of one of the populations as a result of increasedmortality or lower birth rates.
Failure to detect differences, however, does not mean that populations are not demographicallyor reproductively isolated. Dispersal rates, though sufficiently high to homogenizemorphological or genetic differences detectable between putative populations, may still beinsufficient to deliver enough recruits from an unexploited population (source) to an adjacentexploited population (sink) so that the latter remains a functioning element of its ecosystem.

SAR Guidelines, June 2005 Revisions, Page 4
Insufficient dispersal between populations where one bears the brunt of exploitation coupled withtheir inappropriate pooling for management could easily result in failure to meet MMPAobjectives. For example, it is common to have human-caused mortality restricted to a portion ofa species’ range. Such concentrated mortality (if of a large magnitude) could lead to populationfragmentation, a reduction in range, or even the loss of undetected populations, and would onlybe mitigated by high immigration rates from adjacent areas.
Therefore, careful consideration needs to be given to how stocks are identified. In particular,where mortality is greater than a PBR calculated from the abundance just within theoceanographic region where the human-caused mortality occurs, serious consideration should begiven to identifying an appropriate management unit in this region. In the absence of adequateinformation on stock structure and fisheries mortality, a species’ range within an ocean should bedivided into stocks that represent defensible management units. Examples of such managementunits include distinct oceanographic regions, semi-isolated habitat areas, and areas of higherdensity of the species that are separated by relatively lower density areas. Such areas have oftenbeen found to represent true biological stocks where sufficient information is available. In caseswhere there are large geographic areas from which data on stock structure of marine mammalsare lacking, stock structure from other parts of the species’ range may be used to draw inferencesas to the likely geographic size of stocks. There is no intent to identify stocks that are clearly toosmall to represent demographically isolated biological populations, but it is noted that for somespecies genetic and other biological information has confirmed the likely existence of stocks ofrelatively small spatial scale, such as within Puget Sound, WA, the Gulf of Maine, or Cook Inlet,AK.
In trans-boundary situations where a stock's range spans international boundaries or the boundaryof the U.S. Exclusive Economic Zone (EEZ), the best approach is to establish an internationalmanagement agreement for the species. In the interim, if a stock is migratory and it is reasonableto do so, the fraction of time in U.S. waters should be noted, and the PBR for U.S. fisheriesshould be apportioned from the total PBR based on this fraction. In a non-migratory situation,the PBR for U.S. fisheries should be calculated based on the abundance estimate of the stockresiding in U.S. waters. For situations where a species with a broad pelagic distribution whichextends into international waters experiences mortalities within the U.S. EEZ, PBR calculationsshould be based on the abundance in the EEZ. If there is evidence for movement of individualsbetween the EEZ and offshore pelagic areas and there are estimates of mortality from US andother sources throughout the stock’s range, then PBR calculations may be based upon arange-wide abundance estimate for the stock.
Prospective Stocks
When information becomes available that appears to justify a different stock structure or stockboundaries, it may be desirable to include the new structure or boundaries as “prospectivestocks” within the existing report. The descriptions of prospective stocks would include adescription of the evidence for the new stocks, calculations of the prospective PBR for each newstock, and estimates of human-caused mortality and serious injury, by source. The notice of

SAR Guidelines, June 2005 Revisions, Page 5
availability of draft reports with prospective stocks would include a request for public commentand additional scientific information specifically addressing the prospective stock structure. Prospective stocks would be expected to become separate stocks in a timely manner unlessadditional evidence were produced to contradict the prospective stock structure. Summaryinformation for prospective stocks should be included in the standard table in the SARs thatsummarizes Nmin, Rmax, etc. for each stock.
PBR Elements The 1994 amendments to the MMPA mandate that, as part of the Reports, PBR estimates mustbe developed for each marine mammal stock in U.S. waters. The PBR is defined as "themaximum number of animals, not including natural mortalities, that may be removed from amarine mammal stock while allowing that stock to reach or maintain its optimum sustainablepopulation." In addition, the MMPA states that PBR is calculated as the product of threeelements: the minimum population estimate (Nmin); half the maximum net productivity rate (0.5R max); and a recovery factor (Fr). The guidelines for defining and applying each of these threeelements are described below. Further specific guidance on the calculation of PBR is provided inpart 2 (Technical Details) of this document.
In unusual situations, the formula Congress added to the MMPA to calculate PBR(Nmin*0.5Rmax*Fr) results in a number that is not consistent with the narrative definition ofPBR (the maximum number of animals, not including natural mortality, that may be removedfrom a marine mammal stock while allowing that stock to reach or maintain its OSP). Anunderlying assumption in the application of the PBR equation is that marine mammal stockexhibit certain dynamics. Specifically, it is assumed that a depleted stock will naturally growtoward OSP and that some surplus growth may be removed while still allowing recovery. Such asituation arises when a stock is below its OSP and is declining or stable, yet human-causedmortality is a not a major factor in the population’s trend. Thus, for unknown reasons, thestock’s dynamics do not conform to the underlying model for calculating PBR.
For example, Hawaiian monk seals are endangered, declining, and below OSP (based upon theabundance prior to the 1970s), yet human-caused mortality is insufficient to account for thedecline or a failure to increase. A limited removal would not reduce the population’s ability notreach or maintain its OSP after the major factors affecting the stock have been identified andaddressed. Therefore, in these unusual situations, NMFS may report PBR as “undetermined”.
Minimum Population Estimate (Nmin)
Nmin is defined in the MMPA amendments as an estimate of the number of animals in a stockthat:
"(A) is based on the best available scientific information on abundance, incorporating the

SAR Guidelines, June 2005 Revisions, Page 6
precision and variability associated with such information; and,
(B) provides reasonable assurance that the stock size is equal to or greater than theestimate."
Consistent with these MMPA definitions, Nmin should be calculated such that a stock of unknownstatus would achieve and be maintained within OSP with 95% probability. Populationsimulations have demonstrated (Wade 1994) that this goal can be achieved by defining Nmin asthe 20th percentile of a log-normal distribution based on an estimate of the number of animals ina stock (which is equivalent to the lower limit of a 60% 2-tailed confidence interval):
Nmin = N/exp(0.842 * (ln(1+CV(N)2))½) (1)
where N is the abundance estimate and CV(N) is the coefficient of variation of the abundanceestimate. If abundance estimates are believed to be biased, appropriate correction factors shouldbe applied to obtain unbiased estimates of N. In such cases, the coefficient of variation for Nshould include uncertainty in the estimation of the correction factor. In cases where a directcount is available, such as for many pinniped stocks, this direct count could alternatively be usedas the estimate of Nmin. Other approaches could also be used to estimate Nmin if they provide thesame level of assurance that the stock size is equal to or greater than that estimate.
Clearly, projections of current abundance estimates become less dependable with time after asurvey has occurred. When abundance estimates become many years old, at some pointestimates will no longer meet the requirement that they provide reasonable assurance that thestock size is presently greater than or equal to that estimate. Therefore, unless compellingevidence indicates that a stock has not declined since the last census, the minimum populationestimate of the stock should be considered unknown if 8 years have transpired since the lastabundance survey of a stock. Eight years was chosen, in part, because a population that declinesat 10% per year from carrying capacity would be reduced to less than 50% of its originalabundance after 8 years. A 10% decline per year over at least 8 years represents the greatestdecline observed for a stock of marine mammals in U.S. waters. If Nmin is unknown, then PBRcannot be determined, but this is not equivalent to considering PBR equal to zero. If there isknown or suspected human-caused mortality of the stock, decisions about whether such stocksshould be declared strategic or not should be made on a case-by-case basis. Stocks for which Nmin
becomes unknown should not move from "strategic" to "not-strategic", or v.v., solely because ofan inability to estimate Nmin.
Maximum Rate of Increase (Rmax)
One-half Rmax is defined in the MMPA as "one-half of the maximum theoretical or estimated 'netproductivity rate' of the stock at a small population size", where the term “net productivity rate”means “the annual per capita rate of increase in a stock resulting from additions due toreproduction, less losses due to natural mortality."

SAR Guidelines, June 2005 Revisions, Page 7
Default values should be used for Rmax in the absence of stock-specific measured values. To beconsistent with a risk-averse approach, these default values should be near the lower range ofmeasured or theoretical values (or 0.12 for pinnipeds and sea otters and 0.04 for cetaceans andmanatees). Substitution of other values for these defaults should be made with caution, and onlywhen reliable stock-specific information is available on Rmax (e.g., estimates published in peer-reviewed articles or accepted by review groups such as the MMPA Scientific Review Groups orthe Scientific Committee of the International Whaling Commission).
Details on rounding and precision, and on averaging more than one estimate of abundance tocalculate Nmin, can be found in part 2 of this document.
Recovery Factor (Fr)
The MMPA defines the recovery factor, Fr , as being between 0.1 and 1.0. The intent ofCongress in adding Fr to the definition of PBR was to ensure the recovery of populations to theirOSP levels, and to ensure that the time necessary for populations listed as endangered,threatened, and depleted to recover was not significantly increased. The use of Fr less than 1.0allocates a proportion of expected net production towards population growth and compensatesfor uncertainties that might prevent population recovery, such as biases in the estimation of Nmin
and Rmax or errors in the determination of stock structure. Population simulation studiesdemonstrate that the default Fr for stocks of endangered species should be 0.1, and that thedefault Fr for depleted and threatened stocks and stocks of unknown status should be 0.5. Thedefault status should be considered as "unknown". Stocks known to be within OSP (e.g., asdetermined from quantitative methods such as dynamic response or back-calculation), or stocksof unknown status that are known to be increasing, or stocks that are not known to be decreasingtaken primarily by aboriginal subsistence hunters, could have higher Fr values, up to andincluding 1.0, provided that there have not been recent increases in the levels of takes. Recoveryfactors for listed stocks can be changed from their default values, but only after carefulconsideration and where available scientific evidence confirms that the stock is not in imminentdanger of extinction. Values other than the defaults for any stock should usually not be usedwithout the approval of the regional Scientific Review Group, and scientific justification for thechange should be provided in the Report.
The recovery factor can be adjusted to accommodate additional information and to allow formanagement discretion as appropriate and consistent with the goals of the MMPA. For example,if human-caused mortalities include more than 50% females, the recovery factor should bedecreased to compensate for the greater impact of this mortality on the population (or increased ifless than 50% female). Similarly, declining stocks, especially ones that are threatened ordepleted, should be given lower recovery factors, the value of which should depend on themagnitude and duration of the decline. The recovery factor of 0.5 for threatened or depletedstocks or stocks of unknown status was determined based on the assumption that the coefficientof variation of the mortality estimate is equal to or less than 0.3. If the CV is greater than 0.3, therecovery factor should be decreased to: 0.48 for CVs of 0.3 to 0.6; 0.45 for CVs of 0.6 to 0.8;

SAR Guidelines, June 2005 Revisions, Page 8
and 0.40 for CVs greater than 0.8.
Recovery factors could also be increased in some cases. If mortality estimates are known to berelatively unbiased because of high observer coverage, then it may be appropriate to increase therecovery factor to reflect the greater certainty in the estimates. Thus, in an instance where theobserver coverage was 100% and the observed fishery was responsible for virtually all fisherymortality on a particular stock, the recovery factor for a stock of unknown status might beincreased from 0.5 (reflecting less concern about bias in mortality, but continued concern aboutbiases in other PBR parameters and errors in determining stock structure). Recovery factors of1.0 for stocks of unknown status should be reserved for cases where there is assurance that Nmin,Rmax, and the kill are unbiased and where the stock structure is unequivocal.
Annual human-caused mortality and serious injury
The Reports should contain a complete description of what is known about current human-caused mortality and serious injury. Information about incidental fisheries mortality should beprovided, including sources such as observer programs, logbooks, fisher's reports, strandings, andother sources, where appropriate. It is expected that this section of the Reports will include allpertinent information that is subsequently used to categorize fisheries under Sect. 118. Therefore, any additional information that is anticipated to be used to categorize a fishery shouldbe provided here.
In general, the most recent appropriate information about annual human-caused mortality andserious injury ("annual mortality") should be used. If mortality estimates are available for morethan one year, a decision will have to be made about how many years of data should be used toestimate annual mortality. There is an obvious trade-off between using the most relevantinformation (the most recent data) versus using more precise information (pooling across anumber of years). It is recognized that it is inappropriate to give one specific rule defining whichyears of data should be used, as this depends upon the quality and quantity of data available ineach case. It is suggested that mortality estimates could be averaged over as many yearsnecessary to achieve a CV of less than or equal to 0.3, but should usually not be averaged over atime period of more than the most recent 5 years for which data have been analyzed. However,information that is more than 5 years old should not be ignored if it is the most appropriateinformation available in a particular case. Also, in some cases it may not be appropriate toaverage over as many as 5 years even if the CV of an estimate is greater than 0.3. For example, ifit is known that within the last 5 years the amount of total fishing effort has changedsubstantially, or the mortality rate per unit of fishing effort has changed substantially, it willprobably be most appropriate to use only the most recent relevant data to most accurately reflectthe current level of annual mortality. When mortality is averaged over years, it is recommendedthat an un-weighted average be used, as it is possible and likely that true mortality varies fromyear-to-year.
In some cases, mortality occurs in areas where more than one stock of marine mammals occurs.
SAR Guidelines, June 2005 Revisions, Page 9
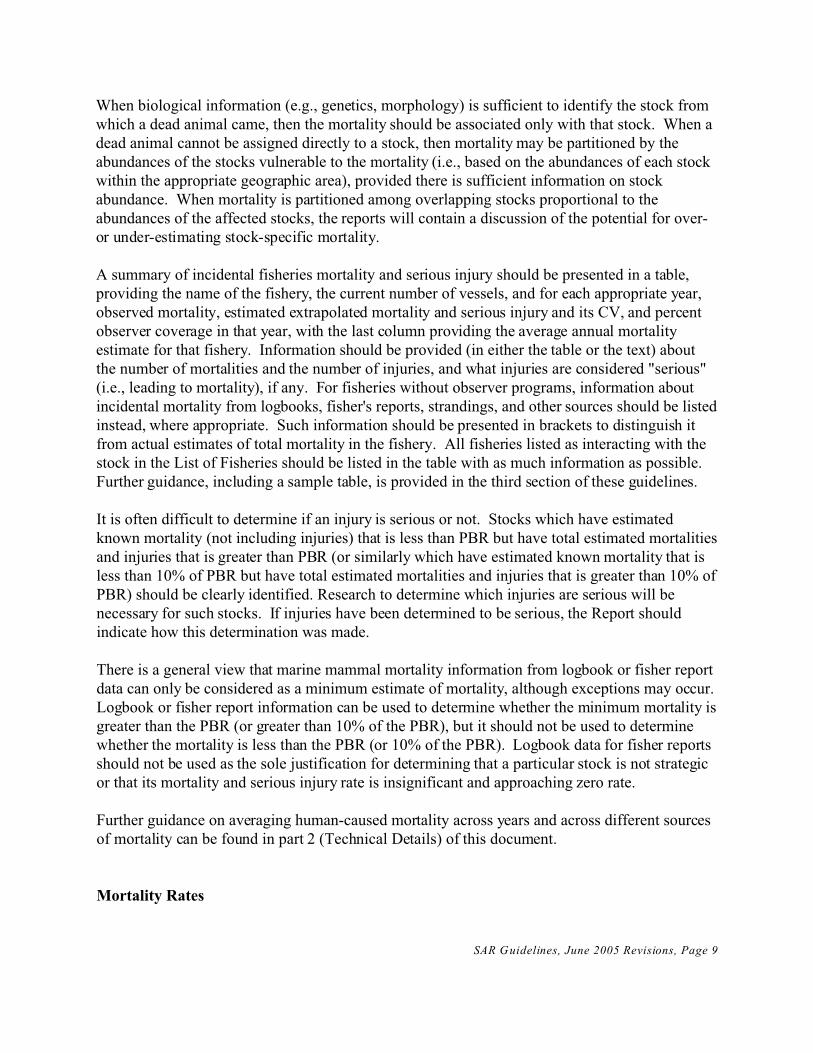
When biological information (e.g., genetics, morphology) is sufficient to identify the stock fromwhich a dead animal came, then the mortality should be associated only with that stock. When adead animal cannot be assigned directly to a stock, then mortality may be partitioned by theabundances of the stocks vulnerable to the mortality (i.e., based on the abundances of each stockwithin the appropriate geographic area), provided there is sufficient information on stockabundance. When mortality is partitioned among overlapping stocks proportional to theabundances of the affected stocks, the reports will contain a discussion of the potential for over-or under-estimating stock-specific mortality.
A summary of incidental fisheries mortality and serious injury should be presented in a table,providing the name of the fishery, the current number of vessels, and for each appropriate year,observed mortality, estimated extrapolated mortality and serious injury and its CV, and percent observer coverage in that year, with the last column providing the average annual mortalityestimate for that fishery. Information should be provided (in either the table or the text) aboutthe number of mortalities and the number of injuries, and what injuries are considered "serious"(i.e., leading to mortality), if any. For fisheries without observer programs, information aboutincidental mortality from logbooks, fisher's reports, strandings, and other sources should be listedinstead, where appropriate. Such information should be presented in brackets to distinguish itfrom actual estimates of total mortality in the fishery. All fisheries listed as interacting with thestock in the List of Fisheries should be listed in the table with as much information as possible.Further guidance, including a sample table, is provided in the third section of these guidelines.
It is often difficult to determine if an injury is serious or not. Stocks which have estimatedknown mortality (not including injuries) that is less than PBR but have total estimated mortalitiesand injuries that is greater than PBR (or similarly which have estimated known mortality that isless than 10% of PBR but have total estimated mortalities and injuries that is greater than 10% ofPBR) should be clearly identified. Research to determine which injuries are serious will benecessary for such stocks. If injuries have been determined to be serious, the Report shouldindicate how this determination was made.
There is a general view that marine mammal mortality information from logbook or fisher reportdata can only be considered as a minimum estimate of mortality, although exceptions may occur. Logbook or fisher report information can be used to determine whether the minimum mortality isgreater than the PBR (or greater than 10% of the PBR), but it should not be used to determinewhether the mortality is less than the PBR (or 10% of the PBR). Logbook data for fisher reportsshould not be used as the sole justification for determining that a particular stock is not strategicor that its mortality and serious injury rate is insignificant and approaching zero rate.
Further guidance on averaging human-caused mortality across years and across different sourcesof mortality can be found in part 2 (Technical Details) of this document.
Mortality Rates

SAR Guidelines, June 2005 Revisions, Page 10
Sec. 118 of the 1994 MMPA Amendments reaffirmed the goal set forth in the Act when it wasenacted in 1972 that the take of marine mammals in commercial fisheries is to be reduced toinsignificant levels approaching zero mortality and serious injury rate, and further requires thatthis goal be met within 7 years of enactment of the 1994 Amendments (April 30, 2001). Thisfisheries-specific goal is referred to as the "zero mortality rate goal" (ZMRG). The StockAssessment Reports are not the vehicle for publishing determinations as to whether a specificfishery has achieved the ZMRG. A review of progress towards the ZMRG for all fisheries isrequired to be submitted to Congress by April 30, 1998.
However, Sec. 117 of the amended MMPA does require that stock assessment reports includedescriptions of fisheries that interact with (i.e., kill or seriously injure) marine mammals, andthese descriptions must contain "an analysis stating whether such level is insignificant and isapproaching a zero mortality and serious injury rate." As a working definition for the Reports,this analysis should be based on whether the total mortality for a stock in all commercial fisherieswith which it interacts is less than 10% of the calculated PBR for that stock. The followingwording is recommended:
"The total fishery mortality and serious injury for this stock is (or is not) less than 10% of thecalculated PBR and, therefore, can (or cannot) be considered to be insignificant and approachinga zero mortality and serious injury rate."
Status of Stocks
This section of the Reports should present a summary of 4 types of "status": 1) current legaldesignation under the MMPA and ESA, 2) status relative to OSP (within OSP, depleted, orunknown), 3) designation of strategic or non-strategic, and 4) a summary of trends in abundanceand mortality.
The MMPA requires a determination of a stock's status as being either strategic or non-strategicand does not allow for a category of unknown. If abundance or human-related mortality levelsare truly unknown (or if the fishery-related mortality level is only available from logbook data),some judgement will be required to make this determination. If the human-caused mortality isbelieved to be small relative to the stock size based on the best scientific judgement, the stockcould be considered as non-strategic. If human-caused mortality is likely to be significantrelative to stock size (e.g., greater than the annual production increment) the stock could beconsidered as strategic. In the complete absence of any information on sources of mortality, andwithout guidance from the Scientific Review Groups, the precautionary principle should befollowed and the default stock status should be strategic until information is available todemonstrate otherwise.
The MMPA requires for strategic stocks a consideration of other factors that may be causing adecline or impeding recovery of the stock, including effects on marine mammal habitat and prey. Therefore, such issues should be summarized in the Status section for all strategic stocks. If

SAR Guidelines, June 2005 Revisions, Page 11
substantial issues regarding the habitat of the stock are important, a separate section titled"Habitat Issues" should be used. If data exist that indicate a problem, they should be summarizedand included in the Report. If there are no known habitat issues or other factors causing a declineor impeding recovery, this should be stated in the Status section.
References
Barlow, J., S.L. Swartz, T.C. Eagle, and P. R. Wade. 1995. U.S. Marine Mammal StockAssessments: Guidelines for Preparation, Background, and a Summary of the 1995Assessments. U.S. Dep. Commer., NOAA Tech. Memo. NMFS-OPR-6, 73 p.
Dizon, A. E., C. Lockyer, W. F. Perrin, D. P. DeMaster, and J. Sisson. 1992. Rethinking thestock concept: a phylogeographic approach. Conserv. Biol. 6(1):24-36.
Perrin, W. F., and R. L. Brownell, Jr. 1994. A brief review of stock identity in small marinecetaceans in relation to assessment of driftnet mortality in the North Pacific. Rep. Int.Whal. Comm. Spec. Iss. 15:393-401.
Wade, P.R. 1994. Managing populations under the Marine Mammal Protection Act of 1994: astrategy for selecting values for Nmin, the minimum abundance estimate, and Fr, therecovery factor. U.S. Dep. Commer., NOAA, Natl. Mar. Fish. Serv., Southwest Fish. Sci.Cent. Admin. Rep. LJ-94-19, 26 p.
Wade, P. R. and Angliss, R. 1997. Guidelines for Assessing Marine Mammal Stocks: Report ofthe GAMMS Workshop, April 3-5, 1996, Seattle, WA. In prep.

SAR Guidelines, June 2005 Revisions, Page 12
2. Technical Details
In this section, technical details are given for making appropriate calculations of PBR andmortality. The first section provides details on precision and rounding issues. The secondsection provides details for combining more than one abundance estimate for calculating NMIN. The third section contains details for calculating the estimate of annual human caused mortalityand its associated variance.
Precision and Rounding
The following rules on precision and rounding should be applied when calculating PBR andother values:
(a) N (the abundance estimate), CV(N), R max, and Fr should be reported in the Report towhatever precision is thought appropriate by the authors and involved scientists, so longas what is reported is exactly what the PBR calculation is based on.(b) PBR should be calculated from the values for (a) to full precision, and not becalculated from an intermediary rounded off Nmin. However, Nmin should be reported as arounded integer. (c) PBR and mortality should be reported with one decimal place if they are below 10. Otherwise, PBR and mortality should be reported as a rounded integer.(d) If PBR and mortality round to the same integer, the Report will report both values tothe precision necessary to determine which is larger. This would also be done if 10% ofPBR and mortality round to the same integer.
Computation of Average Abundance and its Variance
When estimates of abundance are available for more than one year or from more than one sourcein the same year, it may be appropriate to combine those estimates into an average abundance forthe time period in question. It was agreed that a weighted mean was probably the mostappropriate average to use, where the weights are equal to the inverse of the associated variance:
where:
The variance of a weighted mean of several abundance estimates is calculated as:

SAR Guidelines, June 2005 Revisions, Page 13
Finally, the variance is parameterized as a CV in the provided equation for calculating NMIN. TheCV is calculated as:
Computation of Average Human-Caused Mortality and its Variance
When estimates of human-caused mortality and serious injury (called here “mortality”) areavailable for more than one year and/or from more than one source, such as a fishery, it isnecessary to calculate an estimate of the mean annual mortality along with its associated variance(or CV). The following section provides guidelines for doing this. For convenience, the sectionrefers to averaging the incidental by-catch of fisheries, but the guidelines apply equally well toestimates of human-caused mortality from other sources.
Calculating the overall mean annual by-catchFirst, it was agreed that it was most appropriate for the bycatch estimates from a fishery to beaveraged UN-WEIGHTED across years, as the true bycatch might be different in each year, andthus is not stationary. This is just the simple average of the available estimates of by-catch. Ifestimates are available from more than one fishery, a mean annual by-catch from each fisheryshould be calculated first, and then the annual mean from each fishery should be summed tocalculate an overall estimate of the mean annual by-catch.
Calculating the coefficient of variation (CV) of the mean annual by-catch of a single fisheryThere are two potential methods for calculating the CV or variance of the mean annual by-catch of a single fishery. Method 1 involves using standard statistical formulas for combining thevariances of the individual yearly by-catch estimates (assuming they are available). Method 2involves estimating the variance empirically from the 2-5 years of point estimates of by-catch,which is done by calculating the standard deviation of the 2-5 mortality estimates and dividing itby the square root of n, where n is the number of years available. Both methods are valid. However, two points favor Method 1.
First, because the true bycatch might be different in each year, and thus is not stationary,estimating the variance using Method 2 above could over-estimate the true variance of theestimates of bycatch, and this positive bias would be related to how much the bycatch trulyvaried from year to year independent of observation error.
Second, Method 1 is likely to give a more precise estimate of the variance because it has moredegrees of freedom. Using Method 2 involves estimating the variance from a sample size of just2-5, and ignores the information that is known about the precision of each individual estimate.

SAR Guidelines, June 2005 Revisions, Page 14
Obviously, Method 2 is the only method that can be used if there are no estimates of the varianceof the bycatch estimates available. Method 1 is the recommended method if the estimates of by-catch in each year do have an estimated variance (or CV).
Method 1Table 1 outlines the computations needed for estimates of average by-catch mortality by ffisheries operating over n years. Table 2 gives an example computation for f=3 fisheriesoperating over a horizon of n=3 years and all of the estimates are non-zero. Most varianceestimators will provide an estimate of 0 for the variance when the estimated mortality is zero;however, the true variance is non-zero. In this case, a more realistic estimate of the variance canbe developed by averaging the variances for those years which have a positive variance. Thevariance computations in Table 1 are simply modified by dividing by the square of the number ofyears with a non-zero variance. The computation of the average is unaffected with the zeroincluded in the average (Table 3). In certain circumstances a fishery may have been operatingbut was not monitored for mortality. Missing estimates should be dropped both from thecalculation of the average and the variance (Table 4).
Method 2In Method 2 the only change is in how the variance is calculated for the estimate of average by-catch mortality for each fishery over n years. In Method 2 the variance of the average by-catch isestimated empirically from the several point estimates of by-catch available from different years.This is done by calculating the variance of those estimates and dividing it by n, where n is thenumber of years used in calculating the average:
The above formula would thus be substituted for the formula for var( )m1.) presented in Table 1.The second step of combining variances across fisheries is identical to Method 1.

Table 1. Computation table for average mortality for n years with f fisheries. The mortality estimate for fishery I during year j is me and the corresponding variance estimate is vv The estimated total mortality for yearj is rn. j , the sum of mortality estimates for each fishery and the variance is v, j , the sum of the variances. The average mortality for fishery I is n7, and its variance is vi, which is the sum of the variances for each year within the fishery divided by the number of years (n) squard
Fishery
1
2
f
Total
Year 1
~ I I var(m11)
m21 var(m,,)
% ~ 4 % )
Year 2 ... m12 var(m12)
m22 v a r ( a
nh ~4%)
Yearn
mln var(mIJ
-4%)
% v a r ( d
Average
n n
q.= x m I j l n van El.] = x van m 1 I n 2 j= 1 j= 1 l j
n n %.= xm , n 2 j v a r ~ = van mZj, n 2 ,= 1 j= 1
- n - n m f h = x m f j 1 n van m,.~ = v a r ~ m I I n 2
j= 1 j= 1 f j
- f f m = x mi. . . van iF I = x van iii I
i= 1 . . i= 1

SAR Guidelines, June 2005 Revisions, Page 16
Table 2. Example computation of average mortality and its variance for 3 fisheries over 3 years.
Year
Fishery 1 2 3 Average
1 m 10 3 19 10.67
v 4 2 8 1.56
2 m 2 13 6 7.00
v 2 14 4 2.22
3 m 6 33 5 14.67
v 8 23 4 3.89
Total m 32.33
v 7.67
Table 3. Example computation of average mortality and its variance for 3 fisheries over 3 years when some
estimates are zero.
Year
Fishery 1 2 3 Average
1 m 10 0 19 9.67
v 4 0 8 3.00
2 m 2 13 6 7.00
v 2 14 4 2.22
3 m 0 0 5 1.67
v 0 0 4 4.00
Total m 18.33
v 9.22
Table 4. Example computation of average mortality and its variance for 3 fisheries over 3 years when some
estimates are zero and others are missing.
Year
Fishery 1 2 3 Average
1 m 0 19 9.50
v 0 8 8.00
2 m 2 6 4.00
v 2 4 1.50
3 m 0 0 5 1.67
v 0 0 4 4.00
Total m 15.17
v 13.50

SAR Guidelines, June 2005 Revisions, Page 17
3. Descriptions of U.S. commercial fisheries
Fisheries table in each stock assessment report
Sample incidental fisheries mortality table to be included in stock assessment reports. Eachfishery noted as interacting with a stock should be included in the table, even if little informationis available. Information on the number of incidental injuries and which injuries should beconsidered serious should be provided in either the table or the text, if appropriate. Seediscussion in 5.2 of Wade and Angliss (1997).
Table 5. Summary of incidental mortality of stock ___ due to commercial fisheries from 1990 through 1994 and
calculation of the mean annual mortality rate. Mean annual mortality in brackets represents a minimum estimate
from logbooks or M MPA reports.
*Note -- numbers indicated with an asterisk are optional -- different preferences have been expressed in different
regions.
Fishery
Name 1
Years
Current
est. # of
vessels
Data
Type
Range of
Observer
Coverage
Observed
Mort. (in
given yrs.)
Estimated
Mort. (in
given yrs.)
Mean
Annual
Mort.
groundfish trawl fishery 1 90-94 490 obs
data
53-74% 13, 13, 15,
4, 9
13, 19, 21,
6, 11
14
(0.32)
groundfish trawl fishery 2 90-94 490 obs
data
33-55% 2, 0, 0 , 1, 1 4, 0, 0 , 3, 3 2
(0.24)
longline fishery 1 90-94 1064 obs
data
23-55% 1, 0, 0 , 1, 0 2, 0, 0 , 4, 1 1.4
(0.15)
drift gillnet fishery 1 90-91 509 obs
data
4-5% 0, 2 0, 29 14.5
(0.42)
Observer program total 31.9
(0.xx)
set gillnet fishery 1 90-93 120 log
book
n/a 0, 1, 1 , 1 n/a [$.75]*
set gillnet fishery 2 90-93 1187 log
book
n/a 0, 0, 0 , 2 n/a [$.5]*
longline fishery 2 94 213 mmpa
reports
n/a 1 n/a [$ 1]*
Minimum total annual
mortality
$ 34.2 *
1The name should be consistent with fishery names in the List of Fisheries.
General information about a fishery (not stock-specific)
SAR Guidelines, June 2005 Revisions, Page 18
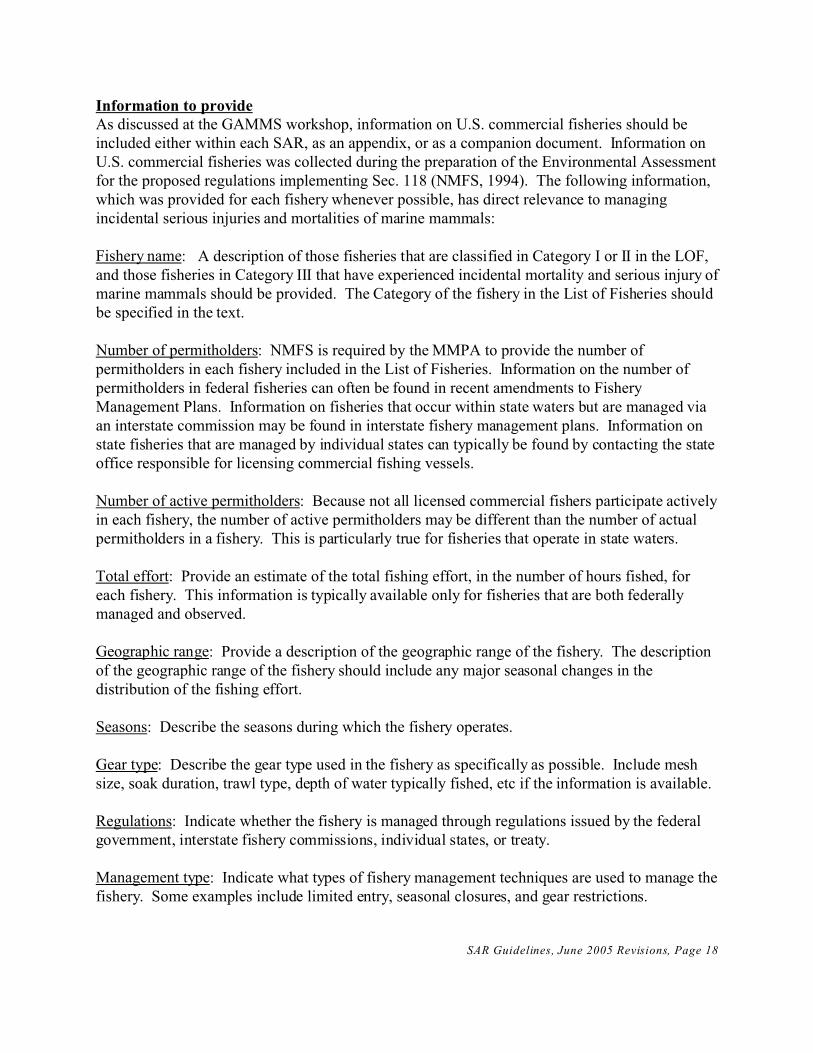
Information to provideAs discussed at the GAMMS workshop, information on U.S. commercial fisheries should beincluded either within each SAR, as an appendix, or as a companion document. Information onU.S. commercial fisheries was collected during the preparation of the Environmental Assessmentfor the proposed regulations implementing Sec. 118 (NMFS, 1994). The following information,which was provided for each fishery whenever possible, has direct relevance to managingincidental serious injuries and mortalities of marine mammals:
Fishery name: A description of those fisheries that are classified in Category I or II in the LOF,and those fisheries in Category III that have experienced incidental mortality and serious injury ofmarine mammals should be provided. The Category of the fishery in the List of Fisheries shouldbe specified in the text.
Number of permitholders: NMFS is required by the MMPA to provide the number ofpermitholders in each fishery included in the List of Fisheries. Information on the number ofpermitholders in federal fisheries can often be found in recent amendments to FisheryManagement Plans. Information on fisheries that occur within state waters but are managed viaan interstate commission may be found in interstate fishery management plans. Information onstate fisheries that are managed by individual states can typically be found by contacting the stateoffice responsible for licensing commercial fishing vessels.
Number of active permitholders: Because not all licensed commercial fishers participate activelyin each fishery, the number of active permitholders may be different than the number of actualpermitholders in a fishery. This is particularly true for fisheries that operate in state waters.
Total effort: Provide an estimate of the total fishing effort, in the number of hours fished, foreach fishery. This information is typically available only for fisheries that are both federallymanaged and observed.
Geographic range: Provide a description of the geographic range of the fishery. The descriptionof the geographic range of the fishery should include any major seasonal changes in thedistribution of the fishing effort.
Seasons: Describe the seasons during which the fishery operates.
Gear type: Describe the gear type used in the fishery as specifically as possible. Include meshsize, soak duration, trawl type, depth of water typically fished, etc if the information is available.
Regulations: Indicate whether the fishery is managed through regulations issued by the federalgovernment, interstate fishery commissions, individual states, or treaty.
Management type: Indicate what types of fishery management techniques are used to manage thefishery. Some examples include limited entry, seasonal closures, and gear restrictions.

SAR Guidelines, June 2005 Revisions, Page 19
Comments: Include any additional relevant information on the fishery.
Sources of information on U.S. commercial fisheries
The sources of information provided in the Environmental Assessment are listed in thebibliography and on page A21 and A22. In general, good sources of current information on aparticular fishery include recent amendments to federal Fishery Management Plans or interstatefishery management plans, and annual reports of Fishery Management Councils or interstatefishery management commissions. Some information may be found on federally managedfisheries in the recent issue of Our Living Oceans (NMFS, 1995). In addition, each FisheryManagement Plan has a individual who is the point of contact in the NMFS Regional Offices.
Much information on the geographic ranges of fisheries, seasonal changes in the distribution ofeffort, etc, was obtained by interviewing key state fishery management personnel. Telephonenumbers for Fishery Management Councils, various state Marine Fisheries Commissions, andvarious state Fish and Wildlife Commissioners can be found in the most recent ConservationDirectory published by the National Wildlife Federation (1-800-477-5560; cost per copy is$25.00 + $3.50 shipping and handling, please allow 3-6 weeks for delivery -- OR request a copyof the relevant pages from F/PR2).

SAR Guidelines, June 2005 Revisions, Page 20
4. Recommendations of the GAMMS Workshop
The following recommendations pertaining to the Stock Assessment Reports (SARs) were madeby the participants of the Guidelines for Assessing Marine Mammal Stocks (GAMMS) workshopheld 3-5 April, 1996. Where appropriate, these recommendations were explicitly incorporatedinto the current PBR guidelines. Numbers refer to the applicable section of the workshop report.
4.5 Discussion on the definition of stocks< Most of the currently defined stocks are appropriate. Some workshop participants expressedconcern about a few particular cases, such as having only one stock of harbor porpoise in Alaska.
< For MMPA management purposes, a stock is a management unit that in the best case delineatesa demographically isolated biological population. It is recognized that delineated stocks oftenfall short of that ideal because of a lack of information and for other reasons.
< The revised “definition of stocks” section drafted by a working group at the workshop is usefuland helps clarify the intent of stock structure decisions, and should be incorporated into the PBRguidelines.
4.7 Incomplete survey of a stock's range< The only way of resolving uncertainty in abundance when a stock's range has not beencompletely surveyed is to improve the abundance estimate by doing more extensive surveys. Extrapolations of observed densities of animals into areas not surveyed would be useful forsurvey planning, but should not be used for calculating PBRs. Similarly, it is unacceptable toassume that the point estimate of abundance (rather than the 20th percentile) from the surveyedarea can serve as a minimum abundance estimate for the entire stock.
< In some cases, because abundance is thought to be under-estimated, it would be useful tocalculate the minimum population size necessary to sustain the estimated level of fisheriesmortality. This information could optionally be included in the SARs.
< Each SAR should include a map showing the area within which the survey took place that ledto the estimate of abundance. This map could, if appropriate, also include the survey tracklines,sightings of the stock during the survey, and the distribution of the stock outside the survey area. It was recognized that some abundance methodologies are not dependent upon surveys of thestock's entire range, and therefore this recommendation may not be appropriate in all SARs. Forstocks for which transect surveys have not been done, it may be appropriate to includeinformation about the stock’s distribution from other sources, such as photo ID locations or othertypes of sighting information.
5.1 Definition of mortality and serious injury< NMFS should circulate the definition of injury that is included in the regulations. To addressthis, the following is the regulatory text defining "injury" and "serious injury". Injury is defined

SAR Guidelines, June 2005 Revisions, Page 21
specifically in the C.F.R. (final regulations for implementation of Section 118):
§229.2: "Injury means a wound or other physical harm. Signs of injury to a marine mammal include, but are not limited to, visible blood flow, loss of or damage toan appendage or jaw, inability to use one or more appendages, asymmetry in theshape of the body or body position, noticeable swelling or hemorrhage, laceration,puncture or rupture of eyeball, listless appearance or inability to defend itself,inability to swim or dive upon release from fishing gear, or signs of equilibriumimbalance. Any animal that ingests fishing gear, or any animal that is releasedwith fishing gear entangling, trailing, or perforating any part of the body will beconsidered injured regardless of the absence of any wound or other evidence of aninjury."
"Serious injury means any injury that will likely result in mortality."
< Direct research on the survival of animals injured in fisheries would likely be the best (or evenonly) way to adequately define the difference between a serious injury (one leading to mortality)and a non-serious injury.
< If animals are injured in a fishery, but a determination has not been made as to whether theinjuries are serious or not, then estimates of the number of animals injured should be presented inthe SARs along with the estimated mortality. This information could be provided in the fisheriestable (see below) or within the text of the SAR. Where such an estimate of injury, when added tothe estimate of mortality, is responsible for making the sum greater than PBR or 10% of PBR,this should be identified in the SAR.
5.2 Presentation of information about human-caused mortality in the SARs. < A new section should be added to the PBR guidelines which gives guidance about how topresent information about annual mortality and serious injury (previously, no guidance wasgiven).
< The PBR guidelines should explicitly state that the information in the SARs is expected toinclude all pertinent information about incidental mortality that will subsequently be used tocategorize fisheries in the List of Fisheries.
< A table summarizing incidental fisheries mortality and serious injury should be added to theSAR. Where "serious injury" is distinguished from "mortality" in a fishery, both numbers andtheir sum should be presented. All fisheries that are noted in the List of Fisheries as interactingwith each stock should be in the table.< A sample table for reporting information about incidental mortality and serious injury incommercial fisheries should be created and distributed to persons responsible for revising theSARs.

SAR Guidelines, June 2005 Revisions, Page 22
5.3 The description of fisheries in the SARs< Additional information describing the geographical description of fisheries was both of greatvalue and mandated by the MMPA. Where appropriate, an appendix or supplement should beadded to the SARs that includes maps showing the location of fisheries with incidental mortalityof concern. If possible, the maps should show where the fishery operates (i.e., the estimateddistribution of fishing effort). If the exact location of fishing effort is not known, a roughindication of fishing areas and ports used by the fishery would be useful. For observed fisheries,it would also be useful to have a map indicating where fishing activities were observed, and thelocation of observed marine mammal mortalities and injuries.
< It was recommended that the NMFS Office of Protected Resources circulate a list of whatfishery information would be useful to include, and to provide the text of the EnvironmentalAssessment if it would be helpful to those collecting fishery information.
6.0 Habitat issues< A statement about habitat issues should be included in the Status section of the SARs, or, ifneeded, in a separate section titled "Habitat issues". If data exist that indicate a problem, theyshould be summarized and included in the SARs. If there are no known habitat issues for astock, that this should be explicitly stated, as consideration of habitat issues are mandated by theact.
8.0 Calculation of PBRs< The current PBR guidelines on calculating PBR are adequate and sufficient in most areas. It is recommended that minor changes to some sections of the guidelines be made. These changes arecovered in the sections below.
8.1 Time period from which to use data on abundance and mortality< Confidence in the reliability of an abundance estimate declines with age. Therefore, estimatesolder that 8 years should not be used to calculate PBR. This is necessary to meet the requirementin the MMPA that Nmin represent a level for which there is reasonable assurance that the truepopulation is larger. The consequence of not being able to calculate a PBR for such stocks is thatPBR is unknown (not that PBR equals zero). A decision as to whether such stocks are strategicor not will be jointly decided case-by-case by NMFS or FWS and by the SRGs. Thisrecommendation replaces the guidelines stating that recovery factors were "ratcheted down" asabundance estimates became older than 5 yrs.
< An unweighted mean should be used when averaging mortality over more than one year.
< A section giving guidance on what mortality estimates to use was drafted and added to therevised PBR guidelines.
8.2 Combining estimates and Calculating CV of a product< A new section was drafted to be added as a technical supplement to the PBR guidelines.

SAR Guidelines, June 2005 Revisions, Page 23
8.3 Problems associated with species which are difficult to identify
< The collection of biopsy samples and voucher material is strongly encouraged, particularly forspecies without such materials and other hard to identify species. In particular, voucher materialis needed for these species of Mesoplodon beaked whales: M. carlhubbsi, M. ginkodens, M.densirostris, M. hectori, M. europaeus, M. mirus.
< National experts should be encouraged to revise a field guide to the identification of beakedwhales and Kogia spp.
8.5 Changing recovery factors from default values (particularly endangered whales)< Clarification should be added to the guidelines that flexibility exists to change default recoveryfactors (such as for endangered species) on a case-by-case basis with careful consideration of theinformation available for each stock. Such changes should be made in consultation with, andwhen appropriate should reflect the recommendations made by, the NMFS or FWS center(s) andregion(s) responsible for the SARs and the relevant Scientific Review Group. Such changesshould be justified by credible scientific evidence. It was acknowledged that this was a complexand difficult issue; therefore the evidence used to support any change to the recovery factor of anendangered species should be carefully documented in the SAR.
8.7 Correction factors for pinniped counts.< Caution should be used when considering the application of correction factors for abundanceestimates to stocks in other locations, or to other species. Additionally, caution should be used inapplying correction factors in different situations in the same location (e.g., tidal state, season,time of day, etc.). The use of estimated correction factors without associated variance estimatesis to be avoided. Where the use of such a correction factor is considered unavoidable, it issuggested that a default CV should be used that is greater than the 0.0 currently assumed forseveral stocks.
9.1 Review and Revision < A section would be added to the PBR guidelines to describe the annual review, revision, andpublication of the SARs.
< The review process leading to revision recommendations should be a joint consultationbetween the appropriate NMFS personnel (at both Centers and Regions) and the SRGs.
< The SARs should be revised whenever new information becomes available on abundance,mortality, Rmax, or stock structure. It is best to revise the SARs whenever new information isavailable, even if the new information does not affect whether the stock is strategic. Although itis anticipated that new estimates of mortality from a fishery observed for several years will oftennot change the classification of a stock, NMFS and FWS should still be encouraged to publish arevised SAR even if the only new information is a new estimate of mortality, in the interest ofkeeping the SARs as up to date as possible.

SAR Guidelines, June 2005 Revisions, Page 24
9.2 Annual schedule for revising and publishing the SARs< A target annual time line for the stock assessment process was agreed upon. It was agreed thatin 1996, NMFS will attempt to meet a deadline of October 1 for completing draft revisions ofSARs and making these draft SARs available for public comment.
9.3 Publication issues< The majority of the workshop participants agreed that all of the SARs should be publishedevery year. It was recognized as unfortunate that a certain amount of duplication and perhapsunnecessary waste of paper would take place, but any other scheme was thought to be potentiallyconfusing. It was further noted that new estimates of mortality would likely be available everyyear for a large percentage of the stocks, and thus it will likely be good practice to revise theSARs for those stocks. Finally, it was agreed that keeping the SARs as up to date as possiblewould best serve NMFS and FWS constituents. It was also recommended that a last date ofrevision be printed at the top of the first page of each SAR, so it would be clear when each waslast revised.
< NMFS and FWS should attempt to maintain the same schedule for reviewing, revising, andpublishing the SARs, and if possible, publish the SARs in joint regional documents.
9.4 Suggested forum for abundance and mortality estimate manuscripts< The methods and analyses that produce the estimates of abundance and mortality that are usedin the SARs should be published in peer-reviewed scientific journals, where possible, or in asimilar forum that is most appropriate, such as a NOAA Technical Memorandum.
10.0 List of Fisheries (Section 118)< It is useful and important to include as much relevant information as possible about fisheries inthe SARs. For fisheries without observer programs, information about the number of vessels,method of fishing, and area of operation are all important considerations in categorizing thesefisheries. It would be beneficial to have this information documented in the SARs so that itwould be subject to review by the centers, regions, and SRGs, as well as be readily availablewhen the SARs are finalized. Therefore, it was concluded that the SARs should document allimportant information used to categorize fisheries in the List of Fisheries.
< It was recognized that, ideally, the List of Fisheries would be based on the incidental mortalityinformation included in the SARs. However, if new sources of information become availablethat are not included in the SARs, this information may also be used.