REVISION OF PERFORMANCE MEASUREMENT TOOLS AND …
16
REVISION OF PERFORMANCE MEASUREMENT TOOLS AND METHODS ALLADYN ELMGASBI 1 Abstract JEL classificaon: G32 Keywords: Performance measurement, Balanced Scorecard, Tableau de bord de geson, Skandia Navigator, Business Excellence Model, Performance Prism, EFQM Received: 13.07.2018 Accepted: 10.05.2019 www.e-finanse.com University of Information Technology and Management in Rzeszów 20 Financial Internet Quarterly „e-Finanse” 2019, vol. 15 / no. 2, p. 20-35 DOI: 10.2478/fiqf-2019-0009 A changing economic environment and growing requirements of stakeholders have made it necessary to develop new achievement measurement methods. The arcle discusses and compares several performance measurement tools and methods, such as: theBalanced Scorecard, Tableau de bord, Skandia Navigator, Intangible Assets Monitor, German Scorecard, Business Excellence Model, Dutch system of performance management, Performance Prism and the EFQM Excellence Model. They are the most popular among both theorecians and praconers in this field. 1 Uniwersytet Łódzki, Wydział Ekonomiczno-Socjologiczny, Instytut Finansów, e-mail: [email protected], ORCID: hps://orcid.org/0000-0002- 6413-2163.
Transcript of REVISION OF PERFORMANCE MEASUREMENT TOOLS AND …

REVISION OF PERFORMANCE MEASUREMENT TOOLS AND METHODS
AllAdyn elmgAsbi1
Abstract
JEL classification: G32Keywords: Performance measurement, Balanced Scorecard, Tableau de bord de gestion, Skandia Navigator, Business Excellence Model, Performance Prism, EFQM
Received: 13.07.2018 Accepted: 10.05.2019
www.e-finanse.comUniversity of Information Technology and Management in Rzeszów 20
Financial internet Quarterly „e-Finanse” 2019, vol. 15 / no. 2, p. 20-35
DOI: 10.2478/fiqf-2019-0009
A changing economic environment and growing requirements of stakeholders have made it necessary to develop new achievement measurement methods. The article discusses and compares several performance measurement tools and methods, such as: theBalanced Scorecard, Tableau de bord, Skandia Navigator, Intangible Assets Monitor, German Scorecard, Business Excellence Model, Dutch system of performance management, Performance Prism and the EFQM Excellence Model. They are the most popular among both theoreticians and practitioners in this field.
1 Uniwersytet Łódzki, Wydział Ekonomiczno-Socjologiczny, Instytut Finansów, e-mail: [email protected], ORCID: https://orcid.org/0000-0002-6413-2163.

introduction
www.e-finanse.comUniversity of Information Technology and Management in Rzeszów21
Alladyn Elmgasbi „e-Finanse” 2019, vol. 15 / no. 2Revision of performance measurement tools and methods
The evolution of performance measurement is to a large extent related to the development of management accounting (Nita, 2008, p. 63).Management accounting development is widely described in literature. It can be split into three phases (Michalak, p. 77):
1) first phase - in which single financial indicators were applied,
2) second phase - in which financial indicators systems have been used,
3) third phase - multi-criteria performance measurements have been made using diversi-fied indices.
Companies which applied later concepts of performance measurement did not abandon the previous tools. On the contrary, these concepts began to co-exist. This dependence was no-ticed by N. Klingebiel and has been defined as a „deposition” of new concepts on the founda-tions of the earlier ones (as cited in Ibidem, p. 78). The essence of „deposition” is shown in Figure 1.
B. Nita also made an extensive analysis of achievements measuring stages. He distinguished three phases based on the intensity of shaping different methods and concepts of management accounting. In the first phase, which lasted until 1950, management accounting methods which are still used to this day were
Figure 1: Deposition of new performance measurement concepts
Source: Michalak, 2008, p. 79
created, including: turnover ratios, margins, total and unit cost calculations, and budgeting. The next phase proposed by the author lasted until the mid-1980s, in which development of new concepts stopped. Despite this stagnation, new methods based on information systems, market measures and non-financial indicators were created. The last phase is characterized by the dynamic development of value measurement methods. New concepts such as shareholder value, stakeholder value, and intellectual capital were also developed. During this phase new tools grew in popularity, such as multi-dimensional per-formance cards, value creation indicators and models of intellectual capital valuation.
The development of management accounting and a changing environment forced managers to implement new control mechanisms and resource management systems. In order to maintain a competitive position, they started to pay more attention to customer needs and expectations. All these factors together with the progressing process of globalization contributed to the growth of importance of measuring performance and managing it appropriately. From my own observations, I would also take into account the progress in computer science. Progress in this field also had a huge impact on the modern possibilities of measuring achievements.
The aim of this article is to present and discuss the most important concepts of performance measurement, which are: Balanced Scorecard, Tableau de bord de

www.e-finanse.comUniversity of Information Technology and Management in Rzeszów 22
gestion, Intangible Assets Monitor, Skandia Navigator, H.R. Friedag & W. Schmidt Scorecard, Kanji’s Business Excel-lence Model, Dutch system of performance management, Performance Prism and the EFQM excellence model. The purpose of the article, however, is not to present new concepts of measuring performance, but to draw attention to the existing ways. The summary of the article compares all the discussed concepts according to specific criteria, which are: balanced performance measurement, inclusion of key success factors, orientation on all stakeholders, link to strategy, focus on learning and continuous improvement, future orientation, Feedback and feed forward. This may, in some way, help organizations to choose the right measurement system for them, which should be translated into increased control and better understanding of their results.
perFormAnce meAsurement concepts
balanced scorecard
The Balanced Scorecard (BSC) is a strategic management system developed by R. Kaplan and D. Norton. The authors clearly stressed that all measures, both financial and non-financial, should be a part of the
information system for employees at all organizational levels in the company. Lower-level employees would be aware of the measurable impact of their work and their activities on the company’s financial performance. On the other hand, managers would have the knowledge of what exactly affects the long-term financial success (Kaplan & Norton, 2001, p. 29).R. Kaplan and D. Norton defined four perspectives answering specific strategic questions, which are important as far as effective management is concerned:
1) financial perspective - presents what the shareholders’ expectations are and what the financial success of the company should look like,
2) customer perspective - shows what the customers’ expectations are and how to satisfy them,
3) internal processes perspective - which internal processes should be perfected, so that both shareholders and customers are satisfied,
4) development and growth perspective - considers what improvements should be made in order to fulfill the company’s vision.
The perspectives presented above are the foundations of BSC (Ibidem, p. 27). For each area the authors formulated strategic goals that are necessary for the mission and
Source: Kaplan & Norton, 2001, p. 28
Figure 2: The perspectives of the Balanced Scorecard
Alladyn Elmgasbi „e-Finanse” 2019, vol. 15 / no. 2Revision of performance measurement tools and methods

www.e-finanse.comUniversity of Information Technology and Management in Rzeszów23
business strategy implementation, as well as indicators to measure the degree of the implementation of these objectives. The construction of the Balanced Scorecard is shown in Figure 2.
The financial perspective specifies whether the implementation of the strategy adopted by the company will contribute to the improvement of its financial results. Indicators should be directly related to the shareholders’ expectations (Kotłowska & Kowalak, 2016, p. 90).
In the customer perspective, it is crucial to determine who the target recipients are. The company should also define the segment in which it is going to compete, and it should also determine the form of competition, whether it will be the price or quality(Ibidem, p. 95).
The internal processes perspective should include the main activities that will be undertaken in order to achieve goals adopted in the financial and customer perspectives. It is recommend-ed to determine a full value stream, starting from the product design process, up to the after-sales service (Kaplan & Norton, 2001, p. 99).
The last perspective of BSC includes factors conditioning further development of the compa-ny. Goals in the development and growth perspective are the basis for implementation of the objectives included in the other perspectives. This perspective allows us to identify all resources that give the possibility of further development of the company. These resources will not only be traditional assets. The authors of the BSC have stressed the importance of investing in employee training, new technologies and IT systems (Ibidem, p. 122).
tableau de bord de gestion
The Tableau de Bord de Gestion (TBG) is the oldest instrument for measuring company per-formance. It was introduced in 1932and by many authors is considered to be the foundation for creation of the BSC by R. Kaplan and D. Norton (Chiapello & Lebas, 1996). TBG stands for a dashboard, which refers to an automobile’s dashboard,
Source: Epstein & Manzoni, 1997, p. 29
Figure 3: Cause and effect dependence in TBG
which points out the most im-portant measures, enabling a comprehensive assessment of the company’s performance (Kotłowska & Kowalak, 2016, p. 134). TBG was created for French companies that needed a tool to observe and evaluate the implementation of specific solutions. Initially, all measures were taken from engineering terminology. They were used to help understand the cause-and-effect relationship between individual activities and the results of processes (Epstein & Manzoni, 1997, p. 29). Accounting at that time was a secondary source of information (Lebas, 1994, p. 473).
Three stages are required to build a TBG. In the first stage, mission and vision are defined. Expectations regarding the company’s future and its position on the market are also estab-lished. Based on these assumptions the company formulates its strategic goals, upon which management will be accountable. Then, action plans are defined, bearing in mind that various actions will affect achievement of these goals. This form is to facilitate decision making and focus on key aspects of the company’s operations (Bourguignion et al., 2004).
The next step requires the identification of factors which may have a negative impact on achieving success. Factors that are non-significant and non-influencing are eliminated. At this stage, people who will be responsible for the implementation are given specific roles and tasks (Kotłowska & Kowalak, 2016, p. 136).
In the last stage, measures are determined. Key indicators are selected to allow management effective supervision over implementation of the adopted strategy. It is advisable to incorpo-rate indicators in a situation where the company has a multi-level structure (Ibidem).
The discussed stages of TBG creation show the existence of a cause-and-effect relationship, which starts from mission formulation, indication of strategic goals and ends with defining specific critical success factors (CSF) and key performance indicators (KPI).The scheme of this dependence is presented in Figure 3.
Main goals of the TBG are (Ibidem, p. 139):
1) supporting management in controlling areas that
Alladyn Elmgasbi „e-Finanse” 2019, vol. 15 / no. 2Revision of performance measurement tools and methods

www.e-finanse.comUniversity of Information Technology and Management in Rzeszów 24
they are responsible for,
2) controlling critical performance indicators and their reporting,
3) delegating duties that will support the management process,
4) creating a common information base for both management and lower-level employees.
Using TBG is rather intuitive. There is no structure specifying a properly prepared dashboard. This is due to the period in which the Tableau de bord was introduced. The creation of the TBG structure is a result of negotiations between particular levels in the company’s employee structure. This is the basic difference between TBG and BSC. The BSC authors proposed a developed management tool which supports a bonus system based on the achieved results. In the case of TBG, several people may be responsible for the same strategic goal, hence there are no such goals that would be controlled only by one person. Such division is not aimed at relieving responsibility for deviations from the objectives but is intended to provide relevant information to all people involved in a given process (Ibidem).
intangible Assets monitor
To keep up with the changing business environment, some companies have evolved into knowledge-based organizations. K. Sveiby, in response to these changes,
Source: Sveiby, 1998
Figure 4: Intangible Assets Monitor
proposed a new in-tellectual capital management model - Intangible Assets Monitor or Intellectual Assets Moni-tor (IAM). IAM was created to enable measurement of all intangible assets owned by the company using ratios which differ from the financial. Financial indicators show only a view of past events, while IAM allows us to see a full picture of the current situation. The essence of the IAM model is that with the proper management of employees, customers and investments, it is possible to significantly influence the financial success of the company (Marcinkowska, 2003, p. 372). In addition, this model recognizes the superiority of intangible assets (company’s reputation, knowledge) over material resources, because tangible resources are consumed andneed to be stored, unlikethe intangibles. IAM assumes that the market value of the company consists of (Sveiby, 1998):
1) net book value of tangible assets (difference between all tangible assets and liabilities),
2) value of intangible assets (intellectual capital).
Intangible assets are further divided into three subgroups: an external structure, an internal structure and individual competencies of employees. Within all subgroups, a number of measures were developed, which were divided into four types: growth, renewal, efficiency, stability and risk. The structure of the intangible asset monitor is shown in Figure 4.
The external structure includes relations with customers and suppliers, logos, trademarks, and reputation of the company. The internal structure consists of patents,
Alladyn Elmgasbi „e-Finanse” 2019, vol. 15 / no. 2Revision of performance measurement tools and methods

www.e-finanse.comUniversity of Information Technology and Management in Rzeszów25
concepts, models, com-puter and administrative systems together with support ensuring proper functioning. The composition of the internal structure depends, to a small extent, on migrations of employees, because the company is the owner of intangible assets, not employees. Individual competences include knowledge, education, skills and experience of the company’s employees. In exchange for their skills, employees receive remuneration. In contrast to the external and internal structure assets, individual competences are the exclusive property of employees. Employees with key competences and knowledge should be skillfully managed to keep them in the business (Sveiby, 1998).
skandia navigator
The Navigator is a comprehensive tool for managing intellectual capital developed at Skandia. Its beginnings date back to 1991, when Skandia created a new department of intellectual capi-tal whose task was to separate the intellectual capital of the company and further development of it. By creating a new department, the company wanted to connect its development with human resources and information technology. The end result was to be the creation of a new tool that would help in transferring knowledge within the organization (Edvinsson & Malone, 2001, p. 39).
The first step was to determine exactly what the company’s intellectual capital is. According to L. Edvinsson and M. Malone: „intellectual capital means
Figure 5: Skandia Navigator construction
Source: Edvinsson & Malone, 2001, p. 56
having knowledge, experience, organizational technology, relations with customers and professional skills that give Skandia a competitive advantage in the market”.
Skandia’s Navigator is a tool that collects information about the overall situation of the com-pany. E. Edvinsson and M. Malone have distinguished five important areas in business man-agement: financial, customers, processes, people and development, and have created some-thing in shape similar to a „home” (see Figure 5). The roof is the finance area which contains information about the company’s past performance. The walls are customers and processes areas that form a part of the structural capital and present the actual performance. The Naviga-tor’s foundation is the area of development. It presents the future of the company, which can be achieved through employees’ training and creation of new products. The area constituting the „heart” represents people. This area consists of skills and abilities of the employees hired by the company together with external support.
The intention of L. Edvinsson and M. Mallone was to develop a tool that would indicate the relationship between the company’s intellectual capital and its financial results. According to the authors, the process of intellectual capital management consists of four stages. The first stage indicates understanding how value is created and which part of the Navigator includes it. Then the previously recognized unused resources are exploited. In the next stage, a tool should be created, thanks to which all interested parties will be able to share knowledge that is needed to increase their efficiency. The last step assumes checking the process and if possible, correcting
Alladyn Elmgasbi „e-Finanse” 2019, vol. 15 / no. 2Revision of performance measurement tools and methods

www.e-finanse.comUniversity of Information Technology and Management in Rzeszów 26
or replacing elements until success is achieved (Edvinsson & Malone, 2001, p. 50).
Skandia Navigator, just like the BSC, presents an idea for value managing of a company. The central element of Navigator are the abilities and skills of employees that connect all other areas.
H.r. Friedag & W. schmidt scorecard
The H.R. Friedag and W. Schmidt Scorecard, also
Source: Friedag & Schmidt, 2004, p. 21
Figure 6: Construction of the German Scorecard
known as the German Scorecard, is a con-cept whose basis for creation was the BSC presented by R. Kaplan and D. Norton. The most important differences between the BSC and German Scorecard are:
1) the H. R. Friedag and W. Schmidt card doesn’t stress the balancing of goals and indi-cators, as opposed to the BSC,
2) two main areas are distinguished in the German Scorecard: management and reporting,
3) the H. R. Friedag and W. Schmidt card and BSC
Alladyn Elmgasbi „e-Finanse” 2019, vol. 15 / no. 2Revision of performance measurement tools and methods

www.e-finanse.comUniversity of Information Technology and Management in Rzeszów27
differ in the number of perspectives,
4) implementation of the BSC and the German Scorecard differs,
5) in the H. R. Friedag and W. Schmidt concept cause-and-effect relation is not presented by strategic maps.
In their proposal the authors did not see a need to balance the number of measures and indica-tors. They suggested that the card should assume the role of a strategic tool and goals included therein should also have strategic significance. The German Scorecard does not assume balancing goals at all levels of the company’s operation. It recommends considering objectives in two dimensions: strategic and operational. Strategic goals are to result in achieving and maintaining an advantage over competition in a long-term horizon. Operational goals are limited to the current operations of the company (Nita, 2008, p. 469).
H. R. Friedag and W. Schmidt were the first to notice the necessity of using an individual approach in the card construction and also selecting a number of its perspectives. Each com-pany should adapt this tool considering the specificity of its operations. They suggested in-cluding additional perspectives if needed, for example (Friedag & Schmidt, 2004, p. 21):
1) public - including e.g. country, city, etc.,
2) organic,
3) capital group,
Kanji’s business excellence model
Kanji’s Business Excellence Model, also called the British Scorecard, was developed by G.K. Kanji. It is an
Figure 7: Kanji’s Business Excellence Model structure
Source: Kanji, 1998, p. 260
4) external and internal communication,
5) lenders’,
6) competition,
7) organization.
H. R. Friedag and W. Schmidt also saw the possibility of considering prospects in terms of their specificity. That way they have included four views: humanistic, processes-oriented, external and internal. Construction of the German Scorecard is shown in Figure 6.
The implementation of the German Scorecard differs from BSC. The first step is the same - strategy, vision and goals need to be formulated. In the second phase, perspectives and “stra-tegic paths” are defined. The “strategic path” in this sense will be an approach that a company will undertake in order to achieve its goals. It is crucial to determine by what means the com-pany will be able to realize its goals. At this stage, the difference between the BSC and Ger-man Scorecard is noticeable. Strategic maps are used in the BSC to show the existence of the cause-and-effect relationship between indicators and the company’s goals. The German Scorecard authors suggested a different approach that will show all factors that can affect the achievement of success.
Alladyn Elmgasbi „e-Finanse” 2019, vol. 15 / no. 2Revision of performance measurement tools and methods

www.e-finanse.comUniversity of Information Technology and Management in Rzeszów 28
extensive version of the BSC. Kanji suggested paying more attention to stake-holders such as employees and suppliers, and also measuring business excellence. Business excellence should be understood as a series of goals that a company should strive to achieve. In his concept, the author considered the following goals (Kanji,1998, p. 634):
1) maximizing values for stakeholders,
2) improving the processes,
3) improving organizational learning,
4) maximizing the satisfaction of stakeholders.
The Business Excellence Model is based on the principles of the G.K. Kanji Pyramid, consist-ing of leadership (being the tip), four main principles (management by facts, customer satis-faction, employee-
Figure 8: G.K. Kanji’s Business Scorecard
oriented management, continuous improvement) and eight basic concepts (all work is a process; measurement; satisfaction of internal customers; satisfaction of external customers; cooperation; people create quality; continuous improvement cycle; prevention). The KBEM structure is shown in Figure 7.
Kanji’s performance scorecard complements the Business Excellence Model. The author adopted a similar structure to that in the pages of R. Kaplan and D. Norton. Kanji’s score card includes four perspectives and is a multidimensional instrument for measuring and managing the company’s results. The construction of the British Scorecard is presented in Figure 8.
In conclusion, G.K. Kanji concept is similar to the BSC. The differences include the accepted areas of
Source: Nita, 2008, p. 190
Alladyn Elmgasbi „e-Finanse” 2019, vol. 15 / no. 2Revision of performance measurement tools and methods

www.e-finanse.comUniversity of Information Technology and Management in Rzeszów29
Alladyn Elmgasbi „e-Finanse” 2019, vol. 15 / no. 2Revision of performance measurement tools and methods
dutch system of performance management
The Dutch performance management system is a coherent measurement system and assess-ment of a company’s achievements, where the main emphasis is placed on the study of the relationship between various indicators. The concept, authored by three Dutch researchers, S. Flapper, L. Fortu in and P. Stoop, was created in the early 1990s. As a starting point, the au-thors adopted commonly used typologic diagrams. They distinguished five groups of indica-tors commonly used in practice, as well as those listed in the literature of the subject (Flapper et al. 1996, p. 27-28):
1) financial and non-financial indicators,
2) local and global indicators,
3) internal and external indicators,
4) indicators related to the organizational structure of company,
5) indicators determined separately for individual departments.
The authors noticed that such a division did not reveal
Source: Flapper et al., 1996, p. 29
Figure 9: Three dimensions of measuring performances
much about the internal dimensions of these indicators, which are not dependent on where and by whom they are used. They pro-posed a completely innovative division taking into account three internal dimensions (Ibidem).This division is shown in Figure 19.
The first dimension focuses on the type of decision the indicators should help to make. The authors distinguished three types of decisions: strategic, operational, and tactical. If the indi-cator is related to a decision affecting issues with a time scale of several years (e.g. position on the market), it will be a strategic indicator. If the indicator measures the impact of daily decisions, then it is an operational indicator. All other indicators to assess effectiveness using a weekly or monthly scale will be tactical indicators (Ibidem, p. 30).
The second dimension includes the level of aggregation of achievement measurements. The authors identified two groups of indicators: general and specific. This division depends on the main recipient of the measured results. Management will be interested in the general picture of the company’s activities and its departments, hence the general indicators. Employees asso-ciated with a given production process will need detailed information about the performed activity (Ibidem).
The last dimension of the Dutch management system refers to the unit of measurement. (Ibidem).
The essence of the Dutch system of performance management is to use a set of performance indicators,
measurement, although they are similar. A company wishing to achieve business ex-cellence should maximize the value for stakeholders, take care of their satisfaction, improve processes and organizational learning (Nita, 2008, p. 191).

www.e-finanse.comUniversity of Information Technology and Management in Rzeszów 30
Alladyn Elmgasbi „e-Finanse” 2019, vol. 15 / no. 2Revision of performance measurement tools and methods
determine the relationship between them and specify values that will form the basis for the assessment of the measured results. The authors pointed out that the given division of measures is intended to replace classifications presented in literature, to support the creation of a consistent measurement system of achievements.
performance prism
The Performance Prism (PP) was created by C. Adams and A. Neely. The authors believed that the existing concepts were not able to fully reflect the requirements of all stakeholders but focused solely on the owners of the company. The second argument was the undermining of the prevailing conviction that indicators should directly result from the company’s strategy. The company’s strategy should only be formulated after all stakeholders have been identified and their needs examined. Based on their observations, they identified five interrelated areas that were graphically represented in a form of a triangular prism. These planes are (Neely et al., 2002, p. 160):
1) stakeholder satisfaction - it is the upper plane of the prism. Authors believed that without the proper identification of stakeholders’ expectations, the company will not be able to maintain its competitive advantage in the long run,
2) strategies - formulating strategies is necessary to meet the expectations of stakeholders. Therefore, the authors suggested the priority of these expectations,
3) processes - activities that are intended to support the company’s development, for ex-ample by implementing new products and services,
Figure 10: Performance Prism planes
Source: Neel & Adams, 2000, p. 3
4) strengths and resources (capabilities) - resources that will enable the company’s de-velopment,
5) contributions - are the basis for the Performance Prism. This area determines the entire contribution that is brought to the company by particular groups of stakeholders, e.g. investors bring capital, employees their qualifications and ideas, customers bring prof-its to the company.
The construction of the Performance Prism is shown in Figure 10.
A. Neely and C. Adams stressed that their concept is strongly oriented to identify the needs of all stakeholders and is a valuable tool in a crisis situation or a deterioration of the market. In both situations, managers concentrate solely on the financial results and make short-term de-cisions. The Performance Prism includes customer expectations and employee moods, which allows immediate response to the changing situation. According to the authors, PP is also an ideal tool in mergers and acquisitions, because it pays attention not only to the acquirer, but also includes the needs of the acquired entity (Neely & Adams, 2000, p. 19-23). However, it does not apply in the developed analysis of effectiveness (Ivanov & Avasilcai, 2014, p. 400).
the eFQm excellence model
The EFQM excellence model is a tool developed by the European Foundation for Quality Management. It provides the basis for assessing the company’s capabilities, so that it can achieve a lasting competitive advantage. The model was based on several basic concepts of excellence
www.e-finanse.comUniversity of Information Technology and Management in Rzeszów31
Alladyn Elmgasbi „e-Finanse” 2019, vol. 15 / no. 2Revision of performance measurement tools and methods
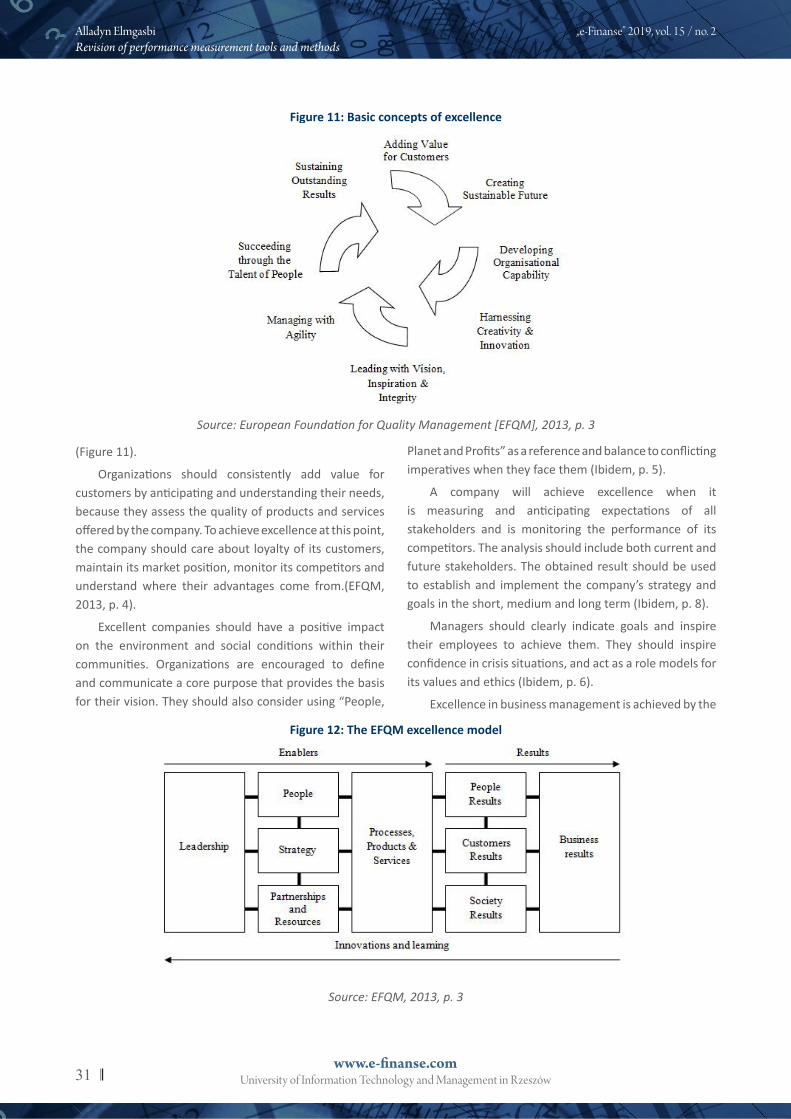
(Figure 11).
Organizations should consistently add value for customers by anticipating and understanding their needs, because they assess the quality of products and services offered by the company. To achieve excellence at this point, the company should care about loyalty of its customers, maintain its market position, monitor its competitors and understand where their advantages come from.(EFQM, 2013, p. 4).
Excellent companies should have a positive impact on the environment and social conditions within their communities. Organizations are encouraged to define and communicate a core purpose that provides the basis for their vision. They should also consider using “People,
Figure 11: Basic concepts of excellence
Source: European Foundation for Quality Management [EFQM], 2013, p. 3
Source: EFQM, 2013, p. 3
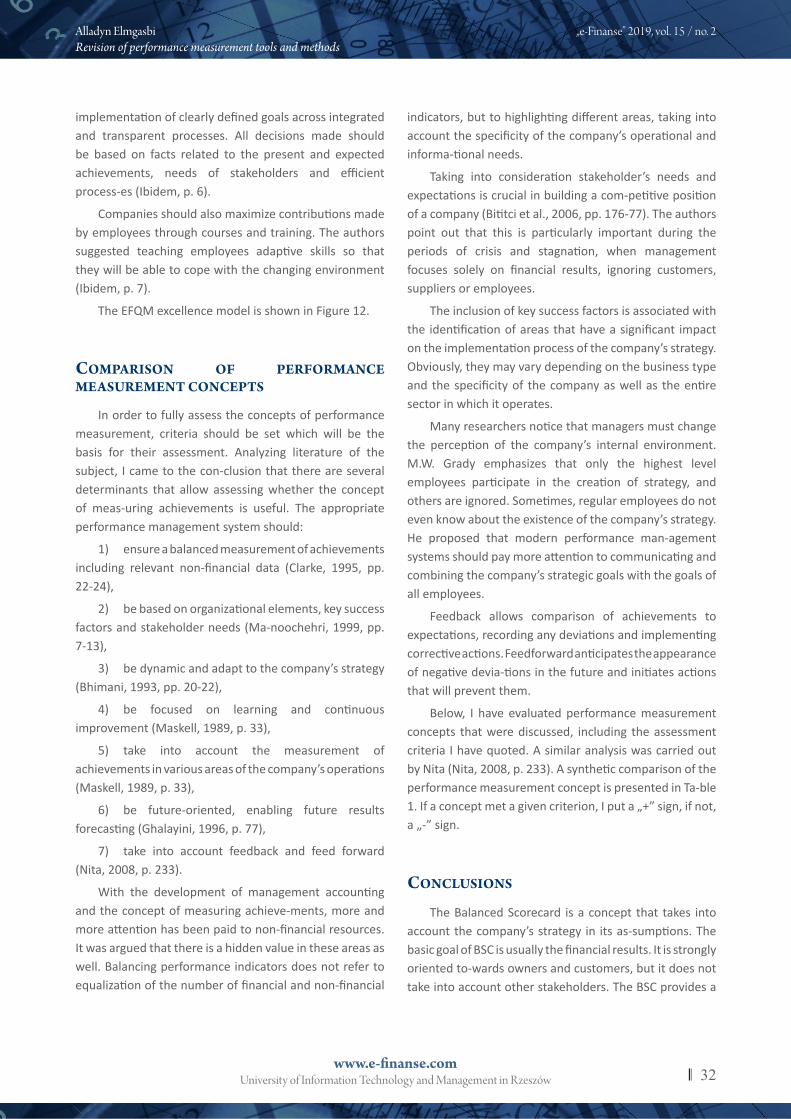
Figure 12: The EFQM excellence model
Planet and Profits” as a reference and balance to conflicting imperatives when they face them (Ibidem, p. 5).
A company will achieve excellence when it is measuring and anticipating expectations of all stakeholders and is monitoring the performance of its competitors. The analysis should include both current and future stakeholders. The obtained result should be used to establish and implement the company’s strategy and goals in the short, medium and long term (Ibidem, p. 8).
Managers should clearly indicate goals and inspire their employees to achieve them. They should inspire confidence in crisis situations, and act as a role models for its values and ethics (Ibidem, p. 6).
Excellence in business management is achieved by the
www.e-finanse.comUniversity of Information Technology and Management in Rzeszów 32
Alladyn Elmgasbi „e-Finanse” 2019, vol. 15 / no. 2Revision of performance measurement tools and methods
implementation of clearly defined goals across integrated and transparent processes. All decisions made should be based on facts related to the present and expected achievements, needs of stakeholders and efficient process-es (Ibidem, p. 6).
Companies should also maximize contributions made by employees through courses and training. The authors suggested teaching employees adaptive skills so that they will be able to cope with the changing environment (Ibidem, p. 7).
The EFQM excellence model is shown in Figure 12.
compArison oF perFormAnce meAsurement concepts
In order to fully assess the concepts of performance measurement, criteria should be set which will be the basis for their assessment. Analyzing literature of the subject, I came to the con-clusion that there are several determinants that allow assessing whether the concept of meas-uring achievements is useful. The appropriate performance management system should:
1) ensure a balanced measurement of achievements including relevant non-financial data (Clarke, 1995, pp. 22-24),
2) be based on organizational elements, key success factors and stakeholder needs (Ma-noochehri, 1999, pp. 7-13),
3) be dynamic and adapt to the company’s strategy (Bhimani, 1993, pp. 20-22),
4) be focused on learning and continuous improvement (Maskell, 1989, p. 33),
5) take into account the measurement of achievements in various areas of the company’s operations (Maskell, 1989, p. 33),
6) be future-oriented, enabling future results forecasting (Ghalayini, 1996, p. 77),
7) take into account feedback and feed forward (Nita, 2008, p. 233).
With the development of management accounting and the concept of measuring achieve-ments, more and more attention has been paid to non-financial resources. It was argued that there is a hidden value in these areas as well. Balancing performance indicators does not refer to equalization of the number of financial and non-financial
indicators, but to highlighting different areas, taking into account the specificity of the company’s operational and informa-tional needs.
Taking into consideration stakeholder’s needs and expectations is crucial in building a com-petitive position of a company (Bititci et al., 2006, pp. 176-77). The authors point out that this is particularly important during the periods of crisis and stagnation, when management focuses solely on financial results, ignoring customers, suppliers or employees.
The inclusion of key success factors is associated with the identification of areas that have a significant impact on the implementation process of the company’s strategy. Obviously, they may vary depending on the business type and the specificity of the company as well as the entire sector in which it operates.
Many researchers notice that managers must change the perception of the company’s internal environment. M.W. Grady emphasizes that only the highest level employees participate in the creation of strategy, and others are ignored. Sometimes, regular employees do not even know about the existence of the company’s strategy. He proposed that modern performance man-agement systems should pay more attention to communicating and combining the company’s strategic goals with the goals of all employees.
Feedback allows comparison of achievements to expectations, recording any deviations and implementing corrective actions. Feedforward anticipates the appearance of negative devia-tions in the future and initiates actions that will prevent them.
Below, I have evaluated performance measurement concepts that were discussed, including the assessment criteria I have quoted. A similar analysis was carried out by Nita (Nita, 2008, p. 233). A synthetic comparison of the performance measurement concept is presented in Ta-ble 1. If a concept met a given criterion, I put a „+” sign, if not, a „-” sign.
conclusions
The Balanced Scorecard is a concept that takes into account the company’s strategy in its as-sumptions. The basic goal of BSC is usually the financial results. It is strongly oriented to-wards owners and customers, but it does not take into account other stakeholders. The BSC provides a

www.e-finanse.comUniversity of Information Technology and Management in Rzeszów33
Alladyn Elmgasbi „e-Finanse” 2019, vol. 15 / no. 2Revision of performance measurement tools and methods
Table 1: Comparison of performance measurement concepts
Source: Own data
Balanced performance measurement
Key success factors
Orientation on all
stakeholders
Connection with strategy
Learning and continuous
improvement
Future-oriented
Feedback and feed forward
Balanced scorecard 1 + - + + + +
Tableau de bord + + - - - - -
Intangible Assets Monitor + + - - + + -
Skandia Navigator + + - - + + -
German Scorecard - + - + + + +
Kanji’s Business Excellence Model
+ + + + + + -
Dutch system of performance management
+ - - + + + +
Performance Prism + + + + + + -
The EFQM Excellence Model
+ + + + + - -
look at a company as a whole and enables recognition of the cause-and-effect rela-tionships between key factors of success and objectives. Authors have emphasized that the Balanced Scorecard is aimed at the continuous improvement of processes and learning. They have also underlined a link between BSC and intellectual capital.
Tableau de bord is the oldest concept of measuring achievements quoted in the paper. For this reason, it does not meet all the assessment criteria. It is not a strategic concept, because it pays attention solely to the company’s mission. It includes only financial measures that are com-pared with historical data. There are no references to the best practices and no orientations on all stakeholders. This tool only provides the depiction of the current situation of a company, without the possibility of looking into the future. Critics of this concept have also stressed the lack of communication between managers and employees, which causes limitation of organi-zational learning.
Skandia Navigator and the Intangible Assets Monitor are similar in the way they measure and manage the company’s performance. Both concepts emphasize the importance of intangible assets and employees. However,
the other stakeholders are omitted as well as the link to the company’s strategy.
The H.R. Friedag and W. Schmidt Scorecard is a much more extensive tool than the BSC. A number of perspectives proposed by the German researchers is greater. The authors of this concepts tressed the strategic nature of the card and they also distinguished its two functions: managerial and strategical.
The essence of the British scorecard concept is business excellence. G.K. Kanji’s model fo-cuses on all stakeholders, primarily customers, owners and employees. The author put a strong emphasis on organizational learning and the pursuit of processes excellence. This concept takes into account key success factors and balancing performance measurements. An important obstacle is the lack of feedback, i.e. communication between employees and management. It can have a key impact on improvement implementation.
The Dutch system of performance management assumes balancing financial and non-financial, global and local, as well as internal and external measures. The

www.e-finanse.comUniversity of Information Technology and Management in Rzeszów 34
Alladyn Elmgasbi „e-Finanse” 2019, vol. 15 / no. 2Revision of performance measurement tools and methods
authors suggested a separate evaluation of achievements at particular levels of organization. This concept does not include all stakeholders and feedback management.
The Performance Prism of C. Adams and A. Neely is the most advanced concept of perfor-mance management in terms of orientation on all stakeholders. The authors emphasized that the first step is to identify the expectations and needs of stakeholders, and then formulate the company’s strategy. This concept also assumes adjusting the strategy to the current situation.
The EFQM excellence model underlines the key success factors and balanced achievement measurement. It is strongly focused on identifying and taking into account the needs of all stakeholders and continuous improvement of processes. This model does not include feed-back, but with the current shape, nothing prevents it from successfully implementing this cri-terion.
Summing up the considerations of this paper, it can be concluded that there are many concepts related to the measurement and management of a company’s performance. The presented division does not fulfill the subject. I have presented each concept in an objective manner with an indication of the most important aspects. In comparison, I have made an assessment of the described concepts from a frequently occurring assessment criteria point of view. The most consistent approach in measuring achievements was presented by Harvard’s scientists R. Kaplan and D. Norton. The authors of the BSC are constantly developing their tool, to consti-tute a model system of measuring and managing achievements. It should be noted that according to the adopted evaluation criteria, there is no ideal performance measurement system. None of the concepts meets all the required criteria.
reFerences
Bhimani, A. (1993). Performance Measures in UK Manufacturing Companies: The State of Play. Management Accounting, 71(11).
Bititci, U.S., Neely, A., Turner, T. (2006). Integrated Performance Systems: Structure and Dynamics. In A. Neely (Ed.), Business Performance Measurement. Theory and Practice, Cambridge: Cambridge University Press.
Bourguignion, A. Malleret, V. Norreklit, H. (2004). The American Balanced Scorecard versus the French Tableau de Bord: The Ideological Dimension. Management Accounting Research.
Chiapello, E. Lebas, M. (1996). The Tableau de Bord, a French Approach to Management Information. Bergen: European Accounting Association Conference.
Clarke, P. (1995). Non-financial Measures of Performance in Management. Accountancy Ireland, 27(2).Edvinsson, L. Malone, M.S. (2001). Kapitał intelektualny. Poznaj prawdziwą wartość swego przedsiębiorstwa
odnajdując jego ukryte korzenie. Warszawa: Wydawnictwo Naukowe PWN.Epstein, M.J., Manzoni, J.F. (1997). Implementing Corporate Strategy. From Tableaux de Bord: Translating Strategy
into Action. Management Accounting.European Foundation for Quality Management (2013). The Fundamental Concepts of Excellence. Retrieved from:
http://www.efqm.org/efqm-model/fundamental-concepts.Flapper, Fortuin, Stoop, P. (1996). Towards Consistent Performance Management Systems. International Journal of
Operations & Production Management, 16(7).Friedag, W. Schmidt, W. (2004). My Balanced Scorecard. Moja Strategiczna Karta Wyników. Warszawa: C.H Beck.Ghalayini, A.M., Noble, J.S. (1996). The Changing Basis of Performance Measurement. International Journal of
Operations & Production Management, 16(8).Ivanov, C. Avasilcai, S. (2014). Performance Measurement Models: an Analysis for Measuring Innovation Processes
Performance. Social and Behavioral Sciences, 124.Kanji, K.G. (1998). Measurement of Business Excellence. Total Quality Management, 9(7).Kaplan, R.S. Norton, D.P. (2001). Strategiczna karta wyników. Jak przełożyć strategię na działanie. Warszawa:
Wydawnictwo Naukowe PWAN.Kotłowska, M. Kowalak, R. (2016). Kluczowe mierniki dokonań w zarządzaniu przedsiębiorstwem. Wrocław:
Wydawnictwo Uniwersytetu Ekonomicznego we Wrocławiu.

www.e-finanse.comUniversity of Information Technology and Management in Rzeszów35
Alladyn Elmgasbi „e-Finanse” 2019, vol. 15 / no. 2Revision of performance measurement tools and methods
Lebas, M. (1994). Managerial Accounting in France. Overview of Past Tradition and Current Practice. The European Accounting Review, 1994.
Manoochehri, G. (1999). The Road to Manufacturing Excellence: Using Performance Measures to Become World-Class. Industrial Management.
Marcinkowska, M. (2003). Wartość banku. Kreowanie wartości i pomiar wyników działalności banku. Łódź: Wydawnictwo Uniwersytetu Łódzkiego.
Maskell, B. (1989). Performance Measurement for World Class Manufacturing. Management Accounting, 67(5).Michalak, J. (2008). Pomiar dokonań od wyniku finansowego do Balanced Scorecard. Warszawa: Difin.Neely, A., Adams, C. (2000). The Performance Prism to Boost M&A Success. Measuring Business Excellence, 4(3).Neely, A., Adams, C. Kennerley, M. (2002). The Performance Prism: The Scorecard for Measuring and Managing Business
Success. Financial Times/Prentice Hall.Nita, B. (2008). Rola rachunkowości zarządczej we wspomaganiu zarządzania dokonaniami przedsiębiorstwa. Kraków:
Oficyna Wolters Kluwer business.Sveiby, K.E. (1998). Measuring Intangibles and Intellectual Capital-An Emerging First Standard. Internet Version. Retrieved
from: http://203.32.10.69/EmergingStandard.html.