Revision of European Ecolabel Criteria for Soaps, Shampoos ... analysis...LCA for each kind of...
134
PRELIMINARY RESULTS FROM THE TECHNICAL ANALYSIS Revision of European Ecolabel Criteria for Soaps, Shampoos and Hair Conditioners February 2012 DRAFT
Transcript of Revision of European Ecolabel Criteria for Soaps, Shampoos ... analysis...LCA for each kind of...

PRELIMINARY RESULTS
FROM THE TECHNICAL ANALYSIS
Revision of European EcolabelCriteria for Soaps, Shampoos and
Hair Conditioners
February 2012
DRAFT

2
Marta Escamilla, Albert Ferrer, Carme Hidalgo, Natalia Fuentes (LEITAT) Renata Kaps, Jiannis S. Kougoulis (JRC IPTS)
PRELIMINARY RESULTS
FROM THE TECHNICAL ANALYSIS
Revision of European Ecolabel Criteria for Soaps, Shampoos and Hair
Conditioners
DRAFT
condegi
Typewritten Text
condegi
Typewritten Text

CONTENTS:
INDEX OF TABLES .................................................................................................................................... 5 INDEX OF FIGURES .................................................................................................................................. 7 ABREVIATION LIST .................................................................................................................................. 8 1. Introduction..................................................................................................................................... 9 2. Methodology and information sources........................................................................................... 9 2.1. Methodology for LCA study..................................................................................................... 9 2.2. Information sources .............................................................................................................. 11
3. Goal definition............................................................................................................................... 12 4. Scope of the study......................................................................................................................... 12 5. Functional unit............................................................................................................................... 13 5.1. Reference flow ...................................................................................................................... 13 5.2. Unit reference for EU Ecolabel criteria ................................................................................. 15
6. Systems description and boundaries ............................................................................................ 16 7. Cut‐off rules and hypothesis used................................................................................................. 17 8. Life Cycle Inventory (LCI) ............................................................................................................... 19 8.1. Raw materials for liquid soaps .............................................................................................. 20 8.2. Raw materials for solid soaps................................................................................................ 20 8.3. Raw materials for shampoos................................................................................................. 21 8.4. Raw materials for hair conditioners ...................................................................................... 22 8.5. Raw materials considered for worst case scenario............................................................... 22 8.6. Manufacturing....................................................................................................................... 23 8.7. Packaging............................................................................................................................... 24 8.8. Distribution............................................................................................................................ 28 8.9. Use......................................................................................................................................... 28 8.10. Disposal ............................................................................................................................. 29
9. Identification and analysis of alternatives for hazardous substances .......................................... 30 9.1. Introduction........................................................................................................................... 30 9.2. Methodology and information sources................................................................................. 32 9.3. Information sources .............................................................................................................. 35 9.4. Identification of existing studies ........................................................................................... 35 9.5. Identification and analysis of alternatives for hazardous substances in liquid soaps........... 37 9.6. Identification and analysis of alternatives for hazardous substances in solid soaps ............ 52 9.7. Identification and analysis of alternatives for hazardous substances in shampoos ............. 59 9.8. Identification and analysis of alternatives for hazardous substances in hair conditioners .. 69 9.9. Identification and analysis of alternatives for hazardous substances in packaging.............. 78 9.10. Conclusions on identification and analysis of alternatives for hazardous substances ..... 80
10. Life Cycle Impact Assessment.................................................................................................... 86 10.1. General considerations on existing LCA studies................................................................ 86 10.2. Impact assessment method used...................................................................................... 86 10.3. General environmental profile of products ...................................................................... 88 10.4. Impact assessment for liquid soap ingredients................................................................. 95 10.5. Impact assessment for solid soap ingredients .................................................................. 97 10.6. Impact Assessment for shampoo ingredients ................................................................... 99 10.7. Impact Assessment for hair conditioners ingredients..................................................... 101 10.8. Comparative analysis of ingredients ............................................................................... 103 10.9. Environmental impact assessment of packaging ............................................................ 107 10.10. Conclusions on life cycle impact assessment .................................................................. 118
11. Bibliography and references ................................................................................................... 121 12. Annex I..................................................................................................................................... 122
DRAFT

4
13. Annex II.................................................................................................................................... 124 14. Annex III................................................................................................................................... 129
DRAFT
5
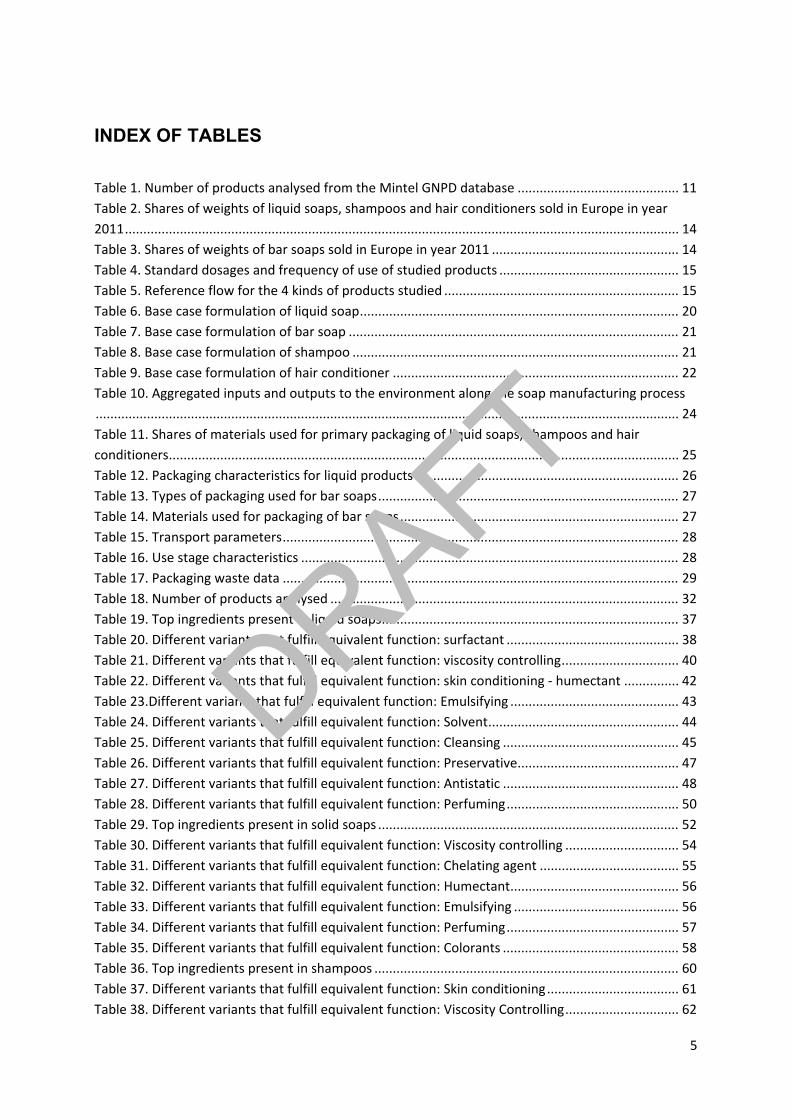
INDEX OF TABLES
Table 1. Number of products analysed from the Mintel GNPD database ............................................ 11 Table 2. Shares of weights of liquid soaps, shampoos and hair conditioners sold in Europe in year
2011....................................................................................................................................................... 14 Table 3. Shares of weights of bar soaps sold in Europe in year 2011 ................................................... 14 Table 4. Standard dosages and frequency of use of studied products ................................................. 15 Table 5. Reference flow for the 4 kinds of products studied ................................................................ 15 Table 6. Base case formulation of liquid soap....................................................................................... 20 Table 7. Base case formulation of bar soap .......................................................................................... 21 Table 8. Base case formulation of shampoo ......................................................................................... 21 Table 9. Base case formulation of hair conditioner .............................................................................. 22 Table 10. Aggregated inputs and outputs to the environment along the soap manufacturing process
............................................................................................................................................................... 24 Table 11. Shares of materials used for primary packaging of liquid soaps, shampoos and hair
conditioners........................................................................................................................................... 25 Table 12. Packaging characteristics for liquid products ........................................................................ 26 Table 13. Types of packaging used for bar soaps.................................................................................. 27 Table 14. Materials used for packaging of bar soaps............................................................................ 27 Table 15. Transport parameters............................................................................................................ 28 Table 16. Use stage characteristics ....................................................................................................... 28 Table 17. Packaging waste data ............................................................................................................ 29 Table 18. Number of products analysed ............................................................................................... 32 Table 19. Top ingredients present in liquid soaps................................................................................. 37 Table 20. Different variants that fulfill equivalent function: surfactant ............................................... 38 Table 21. Different variants that fulfill equivalent function: viscosity controlling................................ 40 Table 22. Different variants that fulfill equivalent function: skin conditioning ‐ humectant ............... 42 Table 23.Different variants that fulfill equivalent function: Emulsifying .............................................. 43 Table 24. Different variants that fulfill equivalent function: Solvent.................................................... 44 Table 25. Different variants that fulfill equivalent function: Cleansing ................................................ 45 Table 26. Different variants that fulfill equivalent function: Preservative............................................ 47 Table 27. Different variants that fulfill equivalent function: Antistatic ................................................ 48 Table 28. Different variants that fulfill equivalent function: Perfuming............................................... 50 Table 29. Top ingredients present in solid soaps .................................................................................. 52 Table 30. Different variants that fulfill equivalent function: Viscosity controlling ............................... 54 Table 31. Different variants that fulfill equivalent function: Chelating agent ...................................... 55 Table 32. Different variants that fulfill equivalent function: Humectant.............................................. 56 Table 33. Different variants that fulfill equivalent function: Emulsifying ............................................. 56 Table 34. Different variants that fulfill equivalent function: Perfuming............................................... 57 Table 35. Different variants that fulfill equivalent function: Colorants ................................................ 58 Table 36. Top ingredients present in shampoos ................................................................................... 60 Table 37. Different variants that fulfill equivalent function: Skin conditioning.................................... 61 Table 38. Different variants that fulfill equivalent function: Viscosity Controlling............................... 62
DRAFT
6
Table 39. Different variants that fulfill equivalent function: Surfactant............................................... 63 Table 40. Different variants that fulfill equivalent function: Perfuming............................................... 64 Table 41. Different variants that fulfill equivalent function: Masking .................................................. 64 Table 42. Different variants that fulfill equivalent function: Emuslifying ............................................. 65 Table 43. Different variants that fulfill equivalent function: Preservative............................................ 65 Table 44. Different variants that fulfill equivalent function: Antistatic ................................................ 66 Table 45. Different variants that fulfill equivalent function: Cleansing ................................................ 67 Table 46. Different variants that fulfil equivalent function: Hair conditioning..................................... 67 Table 47. Top ingredients present in hair conditioners ........................................................................ 69 Table 48. Different variants that fulfil equivalent function: Skin conditioning..................................... 70 Table 49. Different variants that fulfil equivalent function: Perfuming................................................ 71 Table 50. Different variants that fulfil equivalent function: Viscosity controlling ................................ 72 Table 51. Different variants that fulfil equivalent function: Preservatives........................................... 73 Table 52. Different variants that fulfil equivalent function: Antistatic ................................................. 74 Table 53. Different variants that fulfil equivalent function: Hair conditioning..................................... 75 Table 54. Different variants that fulfil equivalent function: Surfactant................................................ 76 Table 55. Different variants that fulfil equivalent function: Emulsifying .............................................. 76 Table 56. Different variants that fulfil equivalent function: Emulsifying Masking................................ 77 Table 57. Shares of materials used for primary packaging of liquid soaps, shampoos and hair
conditioners........................................................................................................................................... 78 Table 58. Substances included in the Candidate list used in plastic materials ..................................... 79 Table 59. Fragrances chemicals most frequently reported as contact allergens.................................. 82 Table 60. Substances subjected to authorization, Annex XIV of REACH regulation ............................. 83 Table 62. Midpoint categories used and link to damage category ....................................................... 87 Table 63. Impact category values for liquid soaps ................................................................................ 90 Table 64. Impact category values for solid soaps.................................................................................. 91 Table 65. Impact category values for hair conditioners........................................................................ 92 Table 66. Impact category values for shampoos................................................................................... 93 Table 67. Ingredients for base case and worst case comparison (liquid soap)..................................... 96 Table 68. Ingredients for base case and worst case comparison (solid soap) ...................................... 98 Table 69. Ingredients for base case and worst case comparison (shampoo) ..................................... 100 Table 70. Ingredients for base case and worst case comparison (hair conditioners)......................... 101 Table 71. Ecotoxicity factors for preservatives substances................................................................. 103 Table 72.Ecotoxicity factors for perfuming substances ...................................................................... 106 Table 73. Environmental comparison among different packaging materials ..................................... 108 Table 74. Materials used for packaging of studied products. ............................................................. 109 Table 75. Comparative environmental impact for PET, PE and PLA ................................................... 111 Table 76. Comparative inputs and outputs of PET and HDPE (EPD form Plastics Europe) ................. 112 Table 77. Outcomes of life cycle assessment and actions in Ecolabel – a general overview ............. 119
DRAFT
7
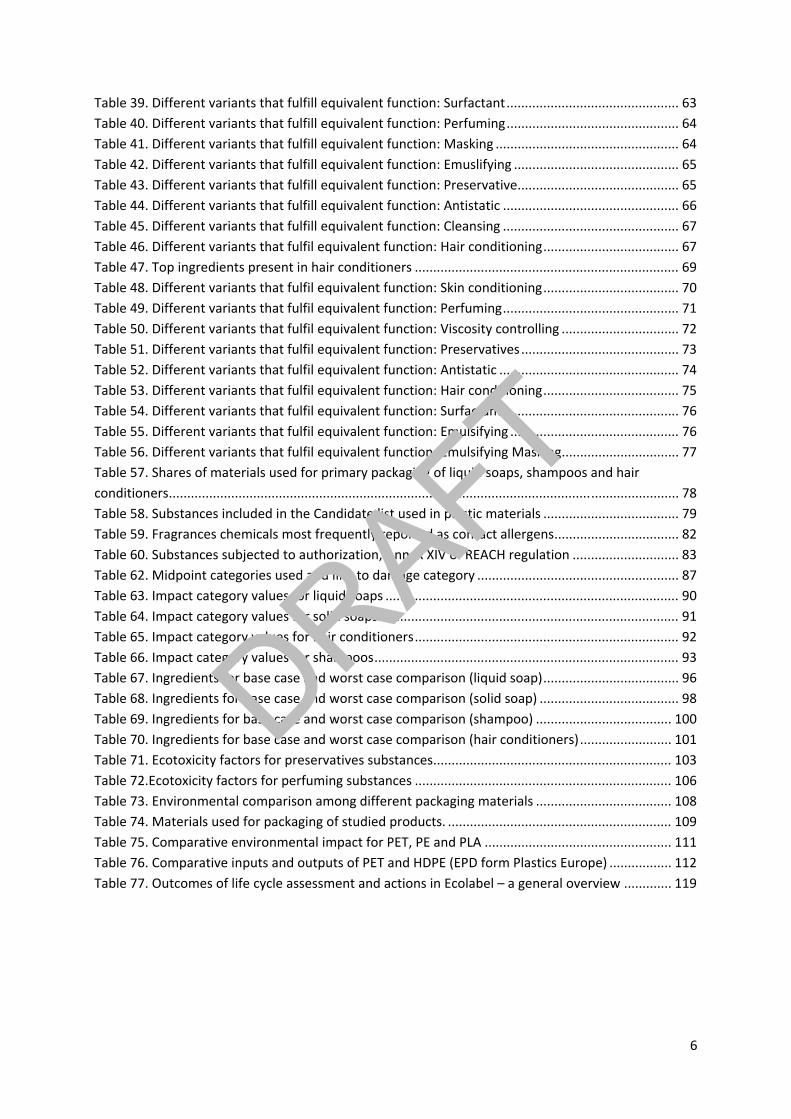
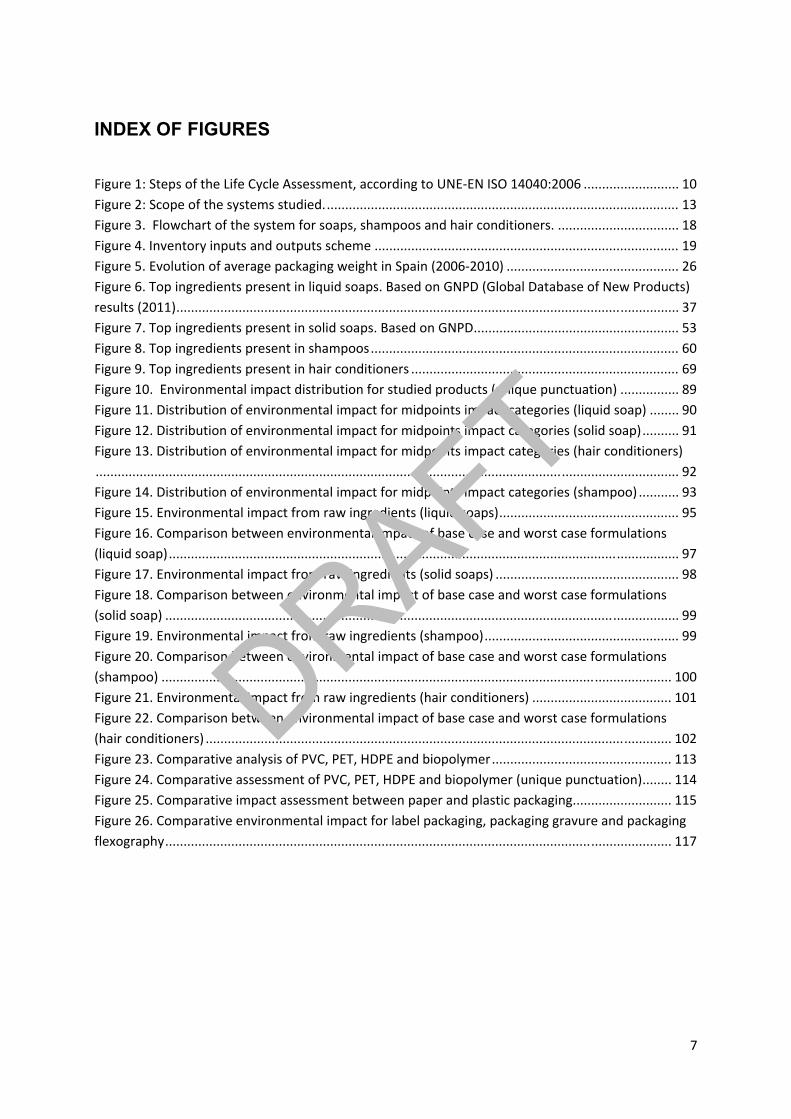
INDEX OF FIGURES
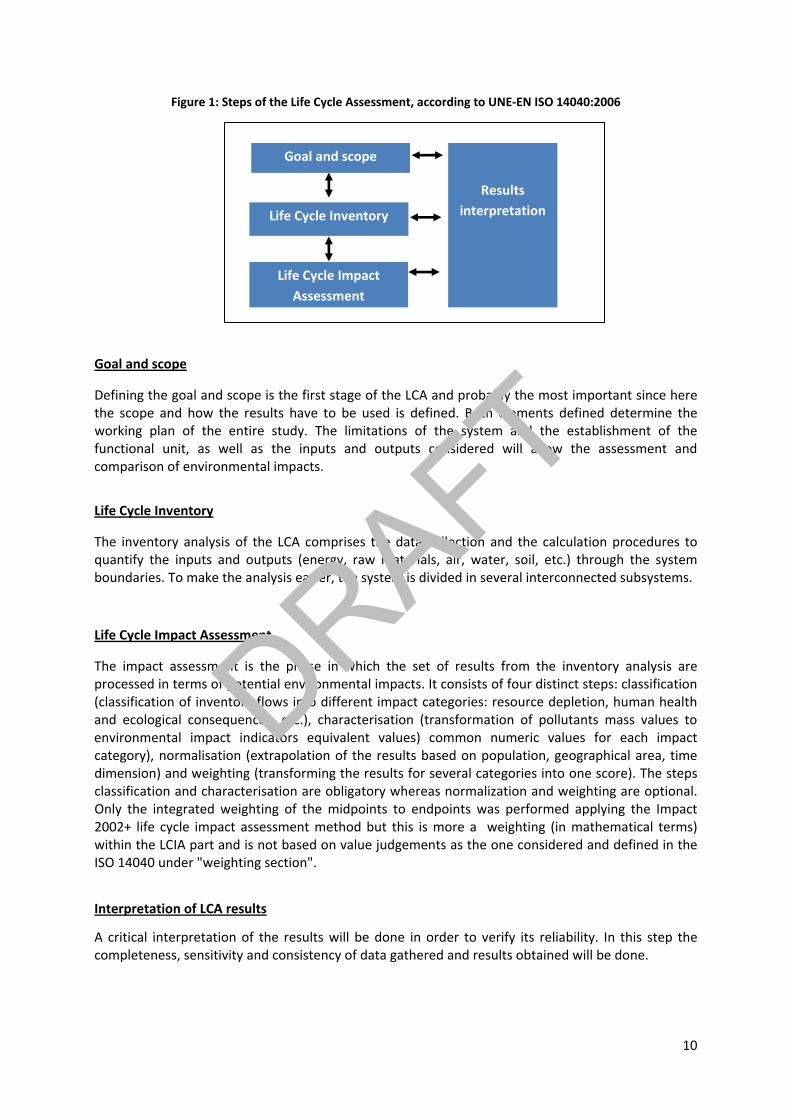
Figure 1: Steps of the Life Cycle Assessment, according to UNE‐EN ISO 14040:2006 .......................... 10
Figure 2: Scope of the systems studied................................................................................................. 13
Figure 3. Flowchart of the system for soaps, shampoos and hair conditioners. ................................. 18
Figure 4. Inventory inputs and outputs scheme ................................................................................... 19
Figure 5. Evolution of average packaging weight in Spain (2006‐2010) ............................................... 26
Figure 6. Top ingredients present in liquid soaps. Based on GNPD (Global Database of New Products)
results (2011)......................................................................................................................................... 37
Figure 7. Top ingredients present in solid soaps. Based on GNPD........................................................ 53
Figure 8. Top ingredients present in shampoos.................................................................................... 60
Figure 9. Top ingredients present in hair conditioners ......................................................................... 69
Figure 10. Environmental impact distribution for studied products (unique punctuation) ................ 89
Figure 11. Distribution of environmental impact for midpoints impact categories (liquid soap) ........ 90
Figure 12. Distribution of environmental impact for midpoints impact categories (solid soap).......... 91
Figure 13. Distribution of environmental impact for midpoints impact categories (hair conditioners)
............................................................................................................................................................... 92
Figure 14. Distribution of environmental impact for midpoints impact categories (shampoo) ........... 93
Figure 15. Environmental impact from raw ingredients (liquid soaps)................................................. 95
Figure 16. Comparison between environmental impact of base case and worst case formulations
(liquid soap)........................................................................................................................................... 97
Figure 17. Environmental impact from raw ingredients (solid soaps) .................................................. 98
Figure 18. Comparison between environmental impact of base case and worst case formulations
(solid soap) ............................................................................................................................................ 99
Figure 19. Environmental impact from raw ingredients (shampoo)..................................................... 99
Figure 20. Comparison between environmental impact of base case and worst case formulations
(shampoo) ........................................................................................................................................... 100
Figure 21. Environmental impact from raw ingredients (hair conditioners) ...................................... 101
Figure 22. Comparison between environmental impact of base case and worst case formulations
(hair conditioners) ............................................................................................................................... 102
Figure 23. Comparative analysis of PVC, PET, HDPE and biopolymer................................................. 113
Figure 24. Comparative assessment of PVC, PET, HDPE and biopolymer (unique punctuation)........ 114
Figure 25. Comparative impact assessment between paper and plastic packaging........................... 115
Figure 26. Comparative environmental impact for label packaging, packaging gravure and packaging
flexography.......................................................................................................................................... 117
DRAFT

8
ABREVIATION LIST
CDV – Critical Dilution Volume
C&L – Classification & Labelling
CLP – Regulation on classification, labelling and packaging of substances and mixtures
DALY – Disability‐adjusted life year
DID‐list – Detergent Ingredient Database
DSD – Dangerous substance directive 67/548/EC
DPD – Dangerous preparation directive 1999/45/EC
ECHA – European Chemicals Agency
EPD – Environmental Product Declaration
ESIS – European chemical substances information system
GHS – Globally Harmonised System
GNPD – Global database of new products
IPCC – Intergovernmental Panel on Climate Change
LCA – Life cycle assessment
PAF – Potentially Affected Fraction of species
PE – Polyethylene
PET – Polyethylene terephthalate
PP – Polypropylene
PVC – Polyvinyl chloride
SDS – Safety data sheet
SETAC – Society of Environmental Toxicology and Chemistry
SVHC – Substances of very high concern
vPvB – Very persistent and very bioaccumulative
DRAFT

9
1. Introduction
A technical analysis of the environmental performance of shampoos, soaps and hair conditioners along their life cycle has been carried out. This analysis has been done following a Life Cycle Assessment approach. The main objectives of this analysis are:
To conduct environmental assessment for every stage of soaps, shampoos and hair conditioners product life cycle.
To identify possible alternatives to hazardous substances and processes with high environmental impact.
These results will aid the revision of the EU Ecolabel criteria for the product category “Soaps, shampoos and hair conditioners”, since they allow to indentify the environmental hot spots of studied products and the impact of changes proposed in terms of criteria and restrictions.
2. Methodology and information sources
The technical analysis has been done using a Life Cycle Assessment approach. Different kinds of products included in the Ecolabel product category (soaps, shampoos and hair conditioners) have been studied along their life cycle.
For the environmental assessment, the analysis has been done based on ISO standards EN ISO 14040:20061 and EN ISO 14044:20062 and the Reference Life Cycle Data System (ILCD) Handbook3. The EU Draft document “Product Environmental Footprint. General Guide”4 has been also taken into account.
The products currently included in the Ecolabel category studied were pre‐analysed in order to determine if important differences exist among them, mostly in terms of formulation. As a result, a LCA for each kind of product included in the category has been performed: shampoo, liquid soap, solid soap and hair conditioner.
The LCAs allowed assessing the relative environmental load of each life cycle stage in order to have an overall profile of the products’ performance. Moreover, several comparative analyses and sensitivity analyses have been performed in terms of ingredients and packaging materials, in order to determine if relevant environmental improvements can be reached by regulating specific parameters through Ecolabel criteria.
2.1. Methodology for LCA study
The steps followed to perform the LCAs are those defined in the standard methodology of ISO UNE‐
EN ISO 14040:2006 and UNE‐EN ISO 14044:2006 (see Figure 1). These four steps have been carried
out in an iterative process.
1 EN‐ISO 14040:2006 Environmental management ‐‐ Life cycle assessment ‐‐ Principles and framework 2 EN ISO 14044:2006 Environmental management ‐‐ Life cycle assessment ‐‐ Requirements and guidelines 3 International Life Cycle Data System Handbook, European Commission, available online at: http://lct.jrc.ec.europa.eu/pdf‐directory/ILCD‐Handbook‐General‐guide‐for‐LCA‐DETAIL‐online‐12March2010.pdf. 4 “Product Environmental Footprint. General Guide”, European Commission, unpublished.
DRAFT
10
Figure 1: Steps of the Life Cycle Assessment, according to UNE‐EN ISO 14040:2006
Goal and scope
Defining the goal and scope is the first stage of the LCA and probably the most important since here the scope and how the results have to be used is defined. Both elements defined determine the working plan of the entire study. The limitations of the system and the establishment of the functional unit, as well as the inputs and outputs considered will allow the assessment and comparison of environmental impacts.
Life Cycle Inventory
The inventory analysis of the LCA comprises the data collection and the calculation procedures to quantify the inputs and outputs (energy, raw materials, air, water, soil, etc.) through the system boundaries. To make the analysis easier, the system is divided in several interconnected subsystems.
Life Cycle Impact Assessment
The impact assessment is the phase in which the set of results from the inventory analysis are processed in terms of potential environmental impacts. It consists of four distinct steps: classification (classification of inventory flows into different impact categories: resource depletion, human health and ecological consequences, etc.), characterisation (transformation of pollutants mass values to environmental impact indicators equivalent values) common numeric values for each impact category), normalisation (extrapolation of the results based on population, geographical area, time dimension) and weighting (transforming the results for several categories into one score). The steps classification and characterisation are obligatory whereas normalization and weighting are optional. Only the integrated weighting of the midpoints to endpoints was performed applying the Impact 2002+ life cycle impact assessment method but this is more a weighting (in mathematical terms) within the LCIA part and is not based on value judgements as the one considered and defined in the ISO 14040 under "weighting section".
Interpretation of LCA results
A critical interpretation of the results will be done in order to verify its reliability. In this step the completeness, sensitivity and consistency of data gathered and results obtained will be done.
Life Cycle Inventory
Life Cycle Impact
Assessment
Results
interpretation
Goal and scope
DRAFT
11
The interpretation of the results will help to define the most relevant environmental impacts and the stages where attention has to be paid in order to minimize the impact. These results will be the base for the revision of the Ecolabel criteria.
2.2. Information sources
Inventory data have been obtained mainly from existing studies and reports from the cosmetic data
bases as well as from LCA databases (Ecoinvent 2.2). Primary data has been used for formulations,
taking as case studies real formulation of each category of products (solid soap, liquid soap, shampoo
and hair conditioner). Real formulations have been taken into account and studies carried out by
LEITAT. In order to respect confidentiality average formulation has been defined based on these
formulations.
The main sources of information for both tasks – the LCA and the hazardous substances identification are:
Existing studies about similar products
A detailed search of published studies has been performed, in order to analyze and integrate data considered of value for the project. Existing LCA studies have been identified and studied. Moreover, a wide screening of other existing information related to the issue has been done, such as other scientific publications and literature (statistics, Ecolabels, etc.). This information was useful in order to fill the data gaps.
Studies used are referenced in the document as well as in the final section “Bibliography and References”.
Information from products Database
Information of the characteristics of different products existing in the market has been gathered in order to do a preliminary analysis of the most common substances used (both for content and packaging) and the most common formats.
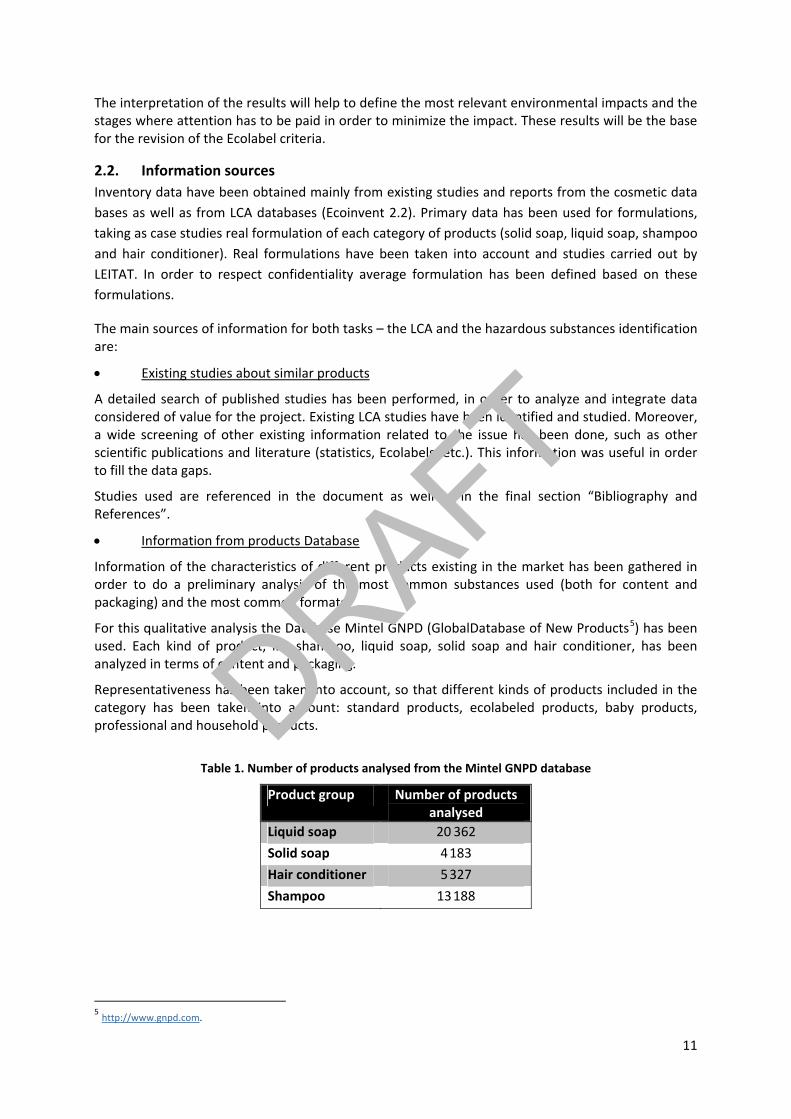
For this qualitative analysis the Database Mintel GNPD (GlobalDatabase of New Products5) has been used. Each kind of product, i.e. shampoo, liquid soap, solid soap and hair conditioner, has been analyzed in terms of content and packaging.
Representativeness has been taken into account, so that different kinds of products included in the category has been taken into account: standard products, ecolabeled products, baby products, professional and household products.
Table 1. Number of products analysed from the Mintel GNPD database
Product group Number of products analysed
Liquid soap 20 362
Solid soap 4 183
Hair conditioner 5 327
Shampoo 13 188
5 http://www.gnpd.com.
DRAFT

12
3. Goal definition Goal definition is the first step of a LCA study, and it defines the general context for the study. In the goal definition, parameters such as the intended application, the reasons for carrying out the study, the target audience, the limitations and assumptions have to be described.
In this case, the goal of this technical analysis is to quantify the potential environmental impacts of products included in the Ecolabel category “soaps, shampoos and hair conditioners” during all their life cycle phases. This analysis is not aimed to do a comparison among different products or brands. The main objective is to analyse the impact of each life stage and its contribution in relation to other stages and the global environmental load of the product. So that, although specific products will be taken as case studies for some stages, the study is aimed to analyse the performance of an average product manufactured in Europe. Consequently, in a first stage a general LCA has been done in order to have the complete environmental profile of each kind of product.
The results of this study will set the basis for discussions and proposals on the revision of Ecolabel criteria. Potential environmental improvements of Ecolabel criteria have been assessed by analysing different scenarios and sensitivity tests, for instance by changing substances compositions in order to see the effect of most hazardous substances substitution. As a result, a comparative analysis of standard products and products with more strict future criteria has been obtained. The goal of this comparison is to quantify the potential improvement of the environmental performance of these products by applying proposed Ecolabel criteria.
The target audience of this form the members of the European Board of EU Ecolabel and also the stakeholders involved in the revision process, including representatives of industry, industrial associations and NGOs.
4. Scope of the study The scope of the LCA study consists of describing the system to be analysed along with the associated considerations and specifications. In the study proposed, a life cycle assessment from cradle to grave is considered; that means that all stages of products life cycle are taken into account (see Figure 2).
In 2007, when Ecolabel criteria for soaps, shampoos and hair conditioners were defined, it was agreed not to include some aspects in the use phase such as the water consumption and the energy to heat water and that Ecolabel should focus on product characteristics. The reasons were that these processes consume much resource and have a huge impact that will alter the results, and moreover the environmental impacts concerned with associated activities, such as heating water, are difficult to reduce by ecolabelling of soaps and shampoos. Moreover, in general in the Ecolabel scheme it is considered that it is difficult to set requirements on the first life phases: Raw material extraction/refining and manufacture of ingredients. Experience has shown that ecolabelling is most efficient in reducing the environmental impact of soaps and shampoos after use and, to a lower extent, the health effects during use. This is done by regulating the inherent properties of the ingredients of the products and the packaging weight and material6.
Nevertheless, this analysis will consider relevant inputs needed for the use of the products in order to have a vision of the whole life cycle. Some stages such as the water consumption during use or distribution are not parameters likely to be regulated by Ecolabel, but it is important to consider them in a first stage in order to obtain a global environmental profile of a product, and to see the relative contribution of each stage to the global environmental impact.
6 Final report. EU Eco‐label for shampoo and soaps. Ecolabelling Norway. Eskeland,, M.B, Svanes, E. May 2006.
DRAFT

13
From the final results, a first classification will be done to propose which aspects are vey relevant and should be included in the Ecolabel criteria.
Figure 2: Scope of the systems studied
SYSTEMS STUDIED
LIFE CYCLE SUB‐SYSTEMS
5. Functional unit The functional unit describes qualitatively and quantitatively the function(s) or the service(s) provided by the product analysed. In this case, a common functional unit should be defined for the four kinds of products in order to increase the comparability of results. The main function of the products analyzed is to wash a part of the body and to provide aesthetic improvements.
The Functional unit for soaps, shampoos and hair conditioners:
A washing action of a part of the body with the main objective of provide hygienic results and/or aesthetic improvements
5.1. Reference flow
In order to obtain more comprehensive results from the LCA study, the reference flow for LCA analysis will be based on mass criteria of the whole product, taking as reference the average product unit sold. Being a bottle or package of personal care product that has as the main function washing a part of the body or bringing aesthetic properties to it and that is rinsed‐off after application.
So that, each product functional unit will depend on the most usual format and capacity of the
product (liquid soap’s bottle or bar soap). The reference flow studied will be the amount of product
contained in that bottle/package.
According to Mintel Database, the most usual capacity of liquid soaps, shampoo and hair conditioners bottles is 250 ml (43%), so a bottle of 250 ml has been considered as the standard product capacity (see other shares of bottle capacities in Table 2). Considering that these products
Shampoos
Liquid soaps
Solid soaps
Hair conditionners
DRAFT
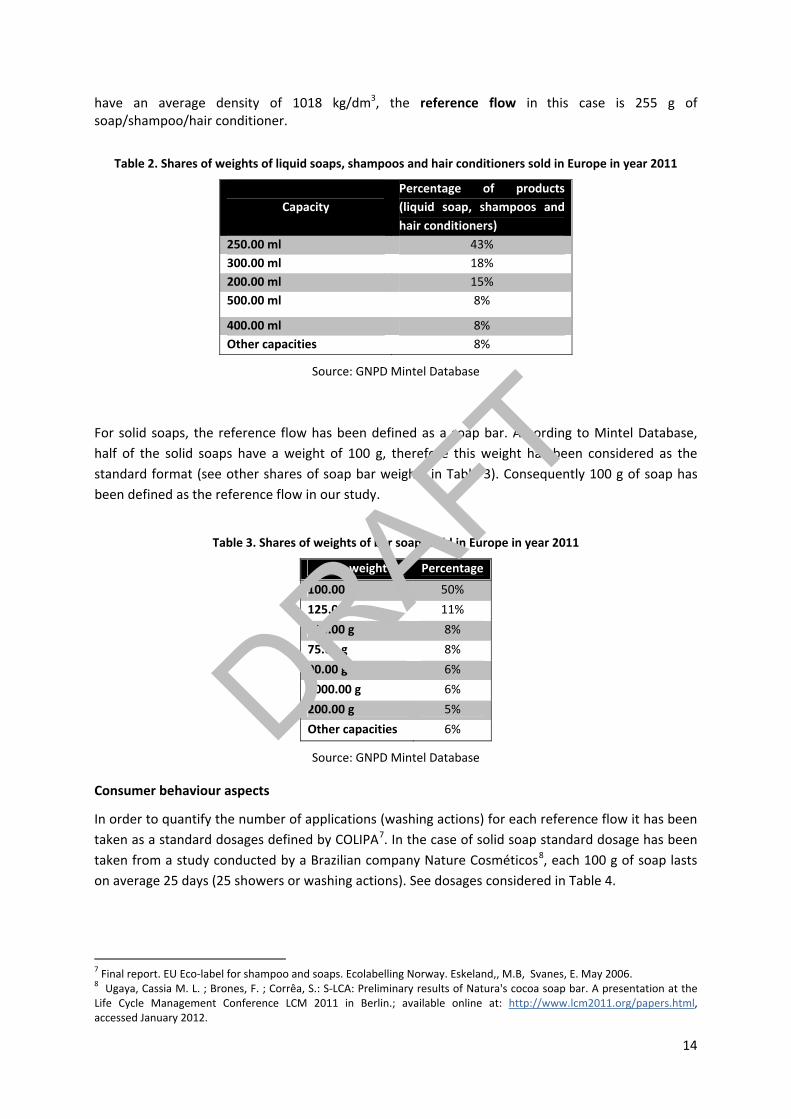
14
have an average density of 1018 kg/dm3, the reference flow in this case is 255 g of soap/shampoo/hair conditioner.
Table 2. Shares of weights of liquid soaps, shampoos and hair conditioners sold in Europe in year 2011
Capacity
Percentage of products
(liquid soap, shampoos and
hair conditioners)
250.00 ml 43%
300.00 ml 18%
200.00 ml 15%
500.00 ml 8%
400.00 ml 8%
Other capacities 8%
Source: GNPD Mintel Database
For solid soaps, the reference flow has been defined as a soap bar. According to Mintel Database,
half of the solid soaps have a weight of 100 g, therefore this weight has been considered as the
standard format (see other shares of soap bar weights in Table 3). Consequently 100 g of soap has
been defined as the reference flow in our study.
Table 3. Shares of weights of bar soaps sold in Europe in year 2011
Bar weight Percentage
100.00 g 50%
125.00 g 11%
150.00 g 8%
75.00 g 8%
90.00 g 6%
1000.00 g 6%
200.00 g 5%
Other capacities 6%
Source: GNPD Mintel Database
Consumer behaviour aspects
In order to quantify the number of applications (washing actions) for each reference flow it has been
taken as a standard dosages defined by COLIPA7. In the case of solid soap standard dosage has been
taken from a study conducted by a Brazilian company Nature Cosméticos8, each 100 g of soap lasts
on average 25 days (25 showers or washing actions). See dosages considered in Table 4.
7 Final report. EU Eco‐label for shampoo and soaps. Ecolabelling Norway. Eskeland,, M.B, Svanes, E. May 2006. 8 Ugaya, Cassia M. L. ; Brones, F. ; Corrêa, S.: S‐LCA: Preliminary results of Natura's cocoa soap bar. A presentation at the Life Cycle Management Conference LCM 2011 in Berlin.; available online at: http://www.lcm2011.org/papers.html, accessed January 2012.
DRAFT

Table 4. Standard dosages and frequency of use of studied products
Hair conditioner* Dosage 14 g per washing action
Shampoo* Dosage 8 g per washing action
Liquid soap (shower)* Dosage 5 g per washing action
Solid soap** Dosage 4g per washing action
*Source: Final report. EU Eco‐label for shampoo and soaps. Ecolabelling Norway9;
**Source: ‐LCA: Preliminary results of Natura's cocoa soap bar.Natura Cosméticos10
Considering these parameters (capacity of products and standard dosages), reference flow for each
kind of products studied is presented in Table 5 below:
Table 5. Reference flow for the 4 kinds of products studied
Product Reference flow
Liquid soap A bottle of 250 ml of liquid soap (containing 255 g of product), with the main
function of personal washing and personal care for 51 washing actions
Shampoo A bottle of 250 ml of shampoo (containing 255 g of product), with the main
function of personal washing and personal care for 32 washing actions
Hair conditioner A bottle of 250 ml of hair conditioner (containing 255 g of product), with the main
function of personal washing and personal care for 28 washing actions
Solid soap A solid bar soap of 100 g with the function of washing the body or a part of the
body for 25 washing actions
5.2. Unit reference for EU Ecolabel criteria
Independently of functional unit used for the LCA study, the proposal for the reference unit for the Ecolabel revised criteria is to maintain the criteria based on the active content (AC), being the reference unit for criteria: One gram of organic ingredients.
According to the background report from the EU Ecolabel criteria development for the product group under study11 as well as other Ecolabels such as e.g. Nordic Ecolabel for Cosmetic products12, using the active content as a base for the reference unit is the best unit in order to encourage the use of efficient ingredients and avoid dilution of products.
9 Final report. EU Eco‐label for shampoo and soaps. Ecolabelling Norway. Eskeland,, M.B, Svanes, E., 2006. 10 Ugaya, Cassia M. L. ; Brones, F. ; Corrêa, S.: S‐LCA: Preliminary results of Natura's cocoa soap bar. A presentation at the Life Cycle Management Conference LCM 2011 in Berlin.; available online at: http://www.lcm2011.org/papers.html, accessed January 2012. 11 Final report. EU Eco‐label for shampoo and soaps. Ecolabelling Norway. Eskeland,, M.B, Svanes, E., 2006. 12 Nordic Ecolabelling of cosmetic products Version 2.1 – Background document. 16 February 2011, available online at: www.nordic‐ecolabel.org/.
DRAFT

16
6. Systems description and boundaries The system boundary has been defined following general supply‐chain logic, including all phases from raw material extraction to the end‐of‐life treatment of the product, and according to the intended application of the study (See Figure 3).
In this case, the system of each of the four categories of products (shampoo, liquid soap, solid soap and hair conditioner) has been analysed. The system includes the following sub‐systems: raw materials (including raw materials extraction and ingredients manufacturing), manufacturing, packaging, distribution, use and final disposal.
The biggest differences among the four systems defined were found in phases such as raw materials and use phase. Nevertheless, for similar phases like distribution or manufacturing, common processes could be considered for all systems.
Raw materials
In this sub‐system raw materials and processing of ingredients are included. Composition and formulation of these products have been analyzed in order to gather these data. Some parameters taken into account are: Origin of substances (e.g. vegetal, petroleum), production processes (energy and resources used) of substances and the performance of substances (toxicity properties to assess potential environmental impacts). Transport processes have been not considered due to lack of data.
Formulations have been defined from COLIPA frame formulations13, where the main functions and substances used for each product are defined. Frame formulations described by COLIPA detail the type of ingredients and their maximum concentration for most cosmetic products on the European market. In order to fix more realistic percentages of each substance used, real formulations have been also considered (due to confidentiality reasons this data was respectively incorporated in an anonymous way). From these two sources average concentration of each ingredient has been estimated.
Manufacturing
Standard processes and technologies to manufacture the studied products have been analyzed. The use of energy and water during manufacturing is reported, together with waste generation, air emissions and water emissions.
Packaging
The primary and secondary packaging have been analyzed. Some relevant aspects are: weight of material, recycled origin of materials, recyclability and use of hazardous substances. A common packaging (a plastic bottle) has been considered for shampoo, liquid soaps and conditioners. Solid soaps have been studied separately.
Transport/Distribution
The average distribution of products in the European market has been analyzed, consisting in the transport from the plant to the final point of sale, including transport among intermediate storages. Storage processes in manufacturing plant and intermediary storage have not been included in the system.
13 COLIPA GUIDELINES. Cosmetic Frame Formulations. Guidelines realized in collaboration with the European Association of Poison Centres and Clinical Toxicologists (EAPCCT). January 2000.
DRAFT
Use
The use of products is the washing action done by the user. It includes, as input the product dosage and (cold14) water necessary to wash the body, hands or hair.
During use it is important to investigate whether a risk that the product may have a negative health impacts exists. The potential for negative health impacts could be reduced by increasing the health requirements on fragrances, preservatives and hazardous compounds15. Life cycle assessment results do not reflect these effects in the use phase (either due to generic use of data or because the inputs are "diluted" with the inclusion of all the LCA inputs), so these effects are deeper analysed in the section 9 on analysis of alternative substances.
Disposal
Two kinds of “waste” have been included in the system:
Disposal of the product into water after use phase. As products studied are rinsed‐off, it is considered that the whole product is released to wastewater after washing action. It is considered that wastewater produced is purified in a household sewage plant.
Disposal of the packaging. A scenario has been defined for each kind of packaging where a part is recycled and the other goes to disposal. Impacts from recycling have been included in a system but balanced with environmental benefits occurring due to avoidance of use of virgin materials (LCA processes pre‐defined products life cycles allocation rule). All impacts coming from waste disposal are included in the system.
7. Cut-off rules and hypothesis used As general cut‐off rule, chemical substances used as ingredients in products with a percentage of less
of 0.01% are not included.
For other materials (packaging), flows with a weight lower than 1% of the total flow may be not
included, if it is considered not being relevant in environmental impact terms.
14 Energy for water heating in not included. 15 Final report. EU Eco‐label for shampoo and soaps. Ecolabelling Norway. Eskeland,, M.B, Svanes, E. May 2006.
DRAFT

18
Figure 3. Flowchart of the system for soaps, shampoos and hair conditioners.
DRAFT

19
8. Life Cycle Inventory (LCI) Life‐cycle inventory (LCI) is a “cradle to grave” accounting of the environmentally significant inputs and outputs of the system. The inventory involves the compilation and quantification of the inputs (materials and resources) and outputs for the product system throughout its life cycle (See Figure 4). The environmental burdens measured in this case study include material input requirements, total energy consumed, air and water emissions released, and total solid wastes associated with the product’s life‐cycle. LCI data is normalized with respect to the study’s functional unit.
Figure 4. Inventory inputs and outputs scheme
For each sub‐system defined, inputs and outputs of the processes have been gathered and quantified. For the most important stages primary data (information gathered from products) has been used when possible. For secondary data other studies and existing databases (such as Ecoinvent) have been used. For a few stages which are not considered of high relevance, because they do not depend on the product characteristics, such as distribution or use phase, generic data from other studies was also used.
For each sub‐system, the information sources are the following:
Raw materials and ingredients manufacturing: Standard formulations defined by COLIPA16 have been used, which determine the most commonly used ingredients by function and maximum percentages. In order to fix more realistic percentages of each substance used, few real formulations (to which LEITAT has access confidentially) for each kind of producthave also been used. From these two sources average concentration of each ingredient has been estimated.
Manufacturing process: In this case, due to the lack of data from manufacturers, the manufacturing process outputs and inputs have been taken from Ecoinvent Database. Nevertheless, the stakeholders are invited to contribute to the improvement of this stage assessment by submitting us with data.
Packaging: Typologies of packaging and materials used have been defined based on Mintel GNDP Database.
Distribution: For the distribution phase, secondary and literature data have been used.
Use: In this stage, the input considered is the water consumed, since it is a necessary resource for the washing action. The amount of water is estimated based on available information from literature.
16 COLIPA GUIDELINES. Cosmetic Frame Formulations. Gudelines realized in collaboration with the European Association of
Poison Centres and Clinical Toxicologists (EAPCCT). January 2000.
DRAFT

20
Disposal phase: In this phase, the composition of the wastewater produced is directly related to the ingredients used in the product formulation. Waste packaging treatments are defined according to packaging typologies and European statistic data of waste treatment.
The different kinds of products studied differ mainly in terms of raw materials, so that this stage has been analysed separately for each product. Other life stages have been analysed jointly.
8.1. Raw materials for liquid soaps
Formulation of liquid soap has been defined taken as a basis frame formulations of COLIPA for liquid soaps. COLIPA frame formulations indicate the most common formulation and the maximum amount for each ingredient. In order to adjust quantities to more real formulations, real formulations of two products (one Ecolabelled and other one non‐Ecollabelled) have been used. The composition of a base case for a liquid soap is presented in Table 6.
Table 6. Base case formulation of liquid soap
Function Ingredient Substance used for LCA analysis
Percentage (%) Amount (g) in 255 g of product
Water Water Water 84.00 % 215.1
Sodium lauryl ether sulfate with 2 mole EO
Sodium sulphate, 6.87 % 17.53
Disodium Cocoamphodiacetate
Fatty alcohol, from coconut oil
2.55 % 6.503
Sodium Chloride Sodium Chloride 0.55 % 1.403
Cocamidopropyl Betaine Fatty alcohol, from coconut oil
1.05 % 2.678
Surfactants
C8‐16 fatty alcohol glucoside
Fatty alcohol, petrochemical
1.20 % 3.060
Emollients Polyol coconut fatty acid ester
Fatty alcohol, from coconut oil
0.50 % 1.275
pH adjustment
Citric acid monohydrated Polycarboxylates 0.50 % 1.275
Benzyl alcohol Benzyl alcohol 0.20 % 0.510
Sodium benzoate Benzoic‐compounds 0.19 % 0.501
Preservatives
Potassium sorbate Potassium hydroxide 0.03 % 0.085
Inorganic salt Sodium Chloride Sodium Chloride 2.00 % 5.100
Limitations and hypothesis done: Some substances are not available in LCA Databases used, in those cases similar or equivalent substances, which are presented in Table 6 (column Substances used for LCA analysis), have been used.
8.2. Raw materials for solid soaps
A base case of solid soap has been defined considering the COLIPA frame formulations for solid
soaps, with some adjustments made with real products formulations. The composition is given in
Table 7 below.
DRAFT

21
Table 7. Base case formulation of bar soap
Function Ingredient Substance used for LCA analysis
Percentage (%) Amount (g) in 100 g of product
Tallow Tallow 57
Coconut oil fatty acids Coconut oil fatty acids 92.0% 14
Saponified oils (92%)
Stearic acid Fatty acids, from vegetarian oil
14
Emulsifying / humectant
Glycerine Glycerine 6.0% 5.52
Perfuming Perfume ‐ 1.0% 1.38
Colorant Colorants ‐ 0,1% 0.092
Chelating agent EDTA EDTA 0,2% 0.184
Bleaching agent Titanium dioxide Titanium dioxide 0,1% 0.092
Water Water Water 8.0% 8
Limitations and hypothesis done: Some substances are not available in LCA Databases used, in those cases similar or equivalent substances, which are presented in Table 7 (column Substances used for LCA analysis), have been used.
8.3. Raw materials for shampoos
A base case of shampoo has been defined considering the COLIPA frame formulations for shampoos,
with some adjustments made with real products formulations. The composition is given in Table 8
below.
Table 8. Base case formulation of shampoo
Function Ingredient Substance used for LCA analysis
Percentage (%)
Amount (g) in 255 g of product
Anionic surfactants Sodium laureth sulfate Sodium sulphate 7.0 % 17.85
Amphoteric surfactant Cocoamidopropyl Betaine
Fatty alcohol, from coconut oil 2.5 %
6.375
Non ionic surfactants Fatty alkanolamides Fatty acids, from
vegetarian oil 0.5 % 1.275
Viscosity controlling agents Propylene glycol Propylene glycol 1.5 % 3.825
Sodium benzoate Benzoic‐compounds 0.1 %
0.127
Preservatives Benzyl alcohol Benzyl alcohol 0.1 % 0.127
PH adjustment Lactic acid Acetic acid 0.08 % 0.204
Water Water Water 11.8 % 225.22
Limitations and hypothesis done: Some substances are not available in LCA Databases used, in those cases similar or equivalent substances, which are presented in Table 8 (column Substances used for LCA analysis), have been used.
DRAFT

22
8.4. Raw materials for hair conditioners
A base case of hair conditioner has been defined considering the COLIPA frame formulations for hair
conditioner, with some adjustments made with real products formulations. The composition is given
in Table 9 below.
Table 9. Base case formulation of hair conditioner
Function Ingredient Substance used for LCA analysis
Percentage Amount (g) in 255 g of product
Cetyl stearyl alcohol Fatty alcohol, 3.3 % 8.42
2‐octyldocecaine Fatty acids, from vegetarian oil 0.3 %
0.77
Oils, waxes, silicones
Lanoline Slack wax 0.3 % 0.77
Provit B5 ‐ 0.4 % 1.02 Proteins
Nutrilan keratine ‐ 0.02 % 0.05
Dioactadecyl dimethyl ammonium chloride
Ammonium chloride 1.0 % 2.55 Cationic surfactants
Cetyl trimethyl ammonium chloride
Ammonium chloride 0.8 % 2.04
Emollient, humectants Propylene glycol Propylene glycol 2.0 % 5.10
Viscosity controlling agents
Methyl hydroxypropyl cellulose
Carboxymethyl cellulose 0.6 %
1.53
Polymers, resins Polyvinyl Polyvinyl 0.062 % 0.16
Perfume ‐ ‐ 0.2 % 0.51
Preservatives Parabens Benzoic‐compound 0.2 % 0.51
Water Water Water 90.82 % 231.59
Limitations and hypothesis done: Similarly like for other products, some substances are not available
in LCA Databases used, in those cases similar or equivalent substances, which are presented in Table
9 (column Substances used for LCA analysis), have been used.
8.5. Raw materials considered for worst case scenario
In the worst case formulation, some substances susceptible to be restricted by the new criteria of
eco‐label and which are currently present in some products under study (liquid soaps, shampoos,
hair conditioners) have been included in the formulations in order to assess its effect on the
environment (and to compare them with the defined base cases). Worst case scenarios are based on
the results of the Identification of hazardous substances (section 9), but the analysis has limited to
few substances due to limited availability of data in LCA Databases.
The substances added for liquid soaps, shampoos and hair conditioners are as follows:
PRESERVATIVES:
o formaldehyde (present in 0,2% of products)
o parabens (present in 14,70% of products)
o triclosan (present in 0,95% of products)
DRAFT

23
MASKING AGENT: BHT (present in 3,53% of products)
CHELATING AGENT: EDTA (present in 0,57% of products)
SILICONES D4 (octamethylcyclotetrasiloxane)
For solid soaps:
Emulsifying: Propylene glycol (7 % of products)
Perfume: Benzyl alcohol (1.7 % of products)
Exact formulation used for comparison between base case formulation and worst scenario are
detailed in sections 10.2, 10.3, 10.4 and 10.5.
8.6. Manufacturing
The manufacturing process done in plant for liquid soaps, shampoos and hair conditioners consist
basically of mixing and pumping the ingredients delivered into mixing vessels. Once the product is
fabricated, filling is the final step. A cleaning process is involved after each batch.17
Traditional bar soaps are made from fats and oils or their fatty acids which are reacted with inorganic
water‐soluble bases. The main sources of fats are beef and mutton tallow, while palm, coconut and
palm kernel oils are the principal oils used in soap‐making. Raw materials may be pre‐treated to
remove impurities and to achieve the colour, odour and performance features desired in the finished
bar. The main chemical processes for making soap, are saponification of fats and oils and
neutralization of fatty acids, usually done in continuous processes. The next processing step after
saponification or neutralization is drying. Vacuum spray drying is used to convert the neat soap into
dry soap pellets. The moisture content of the pellets varies depending on the desired properties of
the soap bar. In the final processing step, the dry soap pellets pass through a bar soap finishing line.
The first unit in the line is a mixer, in which the soap pellets are blended together with fragrances,
colourants and all remaining ingredients. The mixture is then homogenized and refined through
rolling mills and refining plodders to achieve thorough blending and a uniform texture. Finally, the
mixture is continuously extruded from the plodder, cut into bar‐size units and stamped into its final
shape in a soap press. Some of today's bar soaps are called "combo bars" because they get their
cleansing action from a combination of soap and synthetic surfactants. Others soaps, called "syndet
bars" have surfactants as the main cleansing ingredients. This kind of soaps has not been taken into
account, as they are not very common in the European market.
As for these manufacturing processes data from manufacturers was not available yet; therefore, the
soap production process from Ecoinvent database 2.2 has been used for both cases (see Table 10
below). This module contains energy input, production of waste and emissions for the production of
solid soap out of fatty acids from palm and coconut oil. Transports and infrastructure have been not
included. No water consumption has been included. Data is based on the ECOSOL study of the
European surfactant industry.18
17 Henkel ag & co. Kgaa. Case Study of shampoo undertaken within the PCF Pilot Project Germany. November 2008. 18 ECOSOL study of European Surfactant Industry. Common translation rules used, reported in Chemical report (Althaus et al. 2003).
DRAFT
24
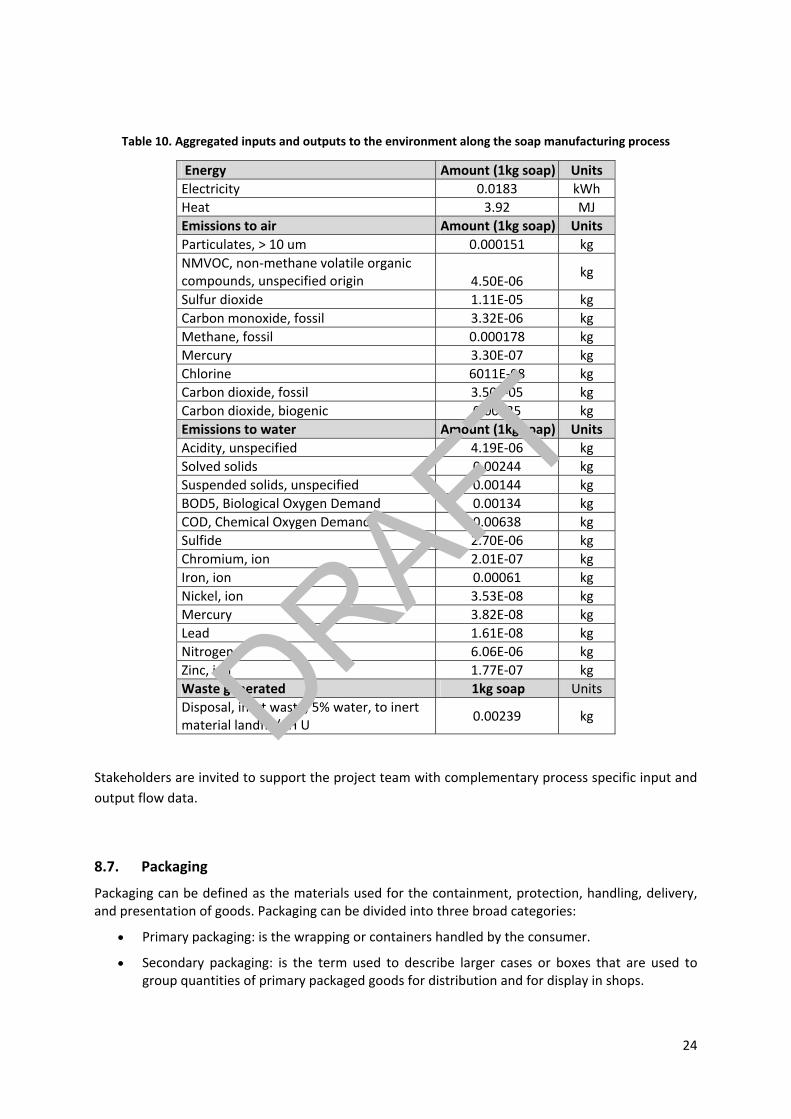
Table 10. Aggregated inputs and outputs to the environment along the soap manufacturing process
Energy Amount (1kg soap) Units
Electricity 0.0183 kWh
Heat 3.92 MJ
Emissions to air Amount (1kg soap) Units
Particulates, > 10 um 0.000151 kg
NMVOC, non‐methane volatile organic compounds, unspecified origin 4.50E‐06
kg
Sulfur dioxide 1.11E‐05 kg
Carbon monoxide, fossil 3.32E‐06 kg
Methane, fossil 0.000178 kg
Mercury 3.30E‐07 kg
Chlorine 6011E‐08 kg
Carbon dioxide, fossil 3.50E‐05 kg
Carbon dioxide, biogenic 0.00635 kg
Emissions to water Amount (1kg soap) Units
Acidity, unspecified 4.19E‐06 kg
Solved solids 0.00244 kg
Suspended solids, unspecified 0.00144 kg
BOD5, Biological Oxygen Demand 0.00134 kg
COD, Chemical Oxygen Demand 0.00638 kg
Sulfide 2.70E‐06 kg
Chromium, ion 2.01E‐07 kg
Iron, ion 0.00061 kg
Nickel, ion 3.53E‐08 kg
Mercury 3.82E‐08 kg
Lead 1.61E‐08 kg
Nitrogen 6.06E‐06 kg
Zinc, ion 1.77E‐07 kg
Waste generated 1kg soap Units
Disposal, inert waste, 5% water, to inert material landfill/CH U
0.00239 kg
Stakeholders are invited to support the project team with complementary process specific input and
output flow data.
8.7. Packaging
Packaging can be defined as the materials used for the containment, protection, handling, delivery, and presentation of goods. Packaging can be divided into three broad categories:
Primary packaging: is the wrapping or containers handled by the consumer.
Secondary packaging: is the term used to describe larger cases or boxes that are used to group quantities of primary packaged goods for distribution and for display in shops.
DRAFT

25
Transit packaging: refers to the wooden pallets, board and plastic wrapping and containers that are used to collate the groups into larger loads for transport, which facilitates loading and unloading of goods.
In this study, only primary has been included. Secondary packaging has been analysed but it has been not counted due to the low percentage of products having secondary packaging. Transit packaging has been excluded.
In the packaging stage, materials and package manufacturing have been taken into account. It is considered that plastic package manufacturing is made through injection. For different plastic materials, the same process of injection moulding for PVC, PE and PP mouldings have been considered, although there are little differences in the inputs required to produce 1 kg of moulded product of each material, e.g. amount of energy needed.
Liquid soaps, shampoos and hair conditioners
For the packaging a sample of 13 700 products has been analysed in GNPD Mintel Database to determine the most commonly used materials and formats of packaging. The most usual shape of the primary packaging is a bottle (83% of products). The shares of various materials used are presented in Table 11, where it can be seen that PE is the most used material (34.74%), followed by PET (25.38%) and PP (14.67%).
Table 11. Shares of materials used for primary packaging of liquid soaps, shampoos and hair conditioners
Material Percentage
PE plastic 34.74%
PET plastic 25.38%
PP plastic 14.67%
PVC plastic 1.18%
HDPE plastic 4.04%
Plastic (generic) 17.20%
Others materials 2.79%
Source: Mintel GNPD Database
For primary packaging of soaps a bottle of 250 ml of PE plastic has been considered. It was chosen to
calculate a real product in this case. However, for providing a reference for the environmental
performance of an average product a non‐realistic scenario could also been drafted based on the
shares given in Table 11 (To be considered in a later project stage).
The current limit in Ecolabel criteria regarding packaging weight is 0.3 g of packaging for one gram of
product, so that for a 250 ml bottle made of non‐recycled plastic and if no return or reusing
processes take place the maximum packaging weight according to current EU Ecolabel packaging
criteria is 76.5 g (0.3 x 255 g of product). Therefore, the weight for the LCA analyses is determined as
76.5 g.
It is considered that the average weight would be lower, nevertheless current data of average weight
of products packaging was not available. In 2006 the average ratio was determines as 0.05 – 0.1 g
DRAFT

26
packaging/g product19. According to Ecoembes, weight packaging (metallic and plastic) for all
products packaged in Spain decreased 6% from 2006 to 2010 (see Figure 5). Assuming that packaging
of soaps, shampoos and hair conditioners at European level also follows this trend, the current
average weight of products packaging would be lower than that determined in 2006.
Figure 5. Evolution of average packaging weight in Spain (2006‐2010)
Source: Elaboration from Ecoembes data20
For packaging manufacturing a process of injection has been considered, where the inputs of energy and waste have been included for the analysis.
Labelling: 28% of packaging bottles analysed have labels, usually auto‐adhesive labels made of plastic. 93% of bottles have some kind of printed decoration; 30% of printing method is serigraphy, 26% auto‐colour printing and 21% embossing printing.
Only 3% of products are sold with secondary packaging, according to the data available. This package is usually made of cardboard or flexible plastic. For the study it has been excluded, but it should be accounted in weight calculations of Ecolabel criteria.
In Table 12 characteristics considered for liquid products’ packaging are presented.
Table 12. Packaging characteristics for liquid products
Packaging (Bottle) Amount Observations
Capacity 250 ml
Weight bottle 76.5 g
Weigh of product contained 255 g
Manufacturing process ‐ Injection moulding process (Ecoinvent process)
Printing process Standard Ecoinvent processes
19 Final report. EU Eco‐label for shampoo and soaps. Ecolabelling Norway. Eskeland,, M.B, Svanes, E. May 2006. 20 www.ecoembes.com.
DRAFT

27
Bar soaps
In order to determine the most usual packaging for bar soaps, a sample of 4 224 products has been
analysed. As it can be seen in Table 13, the most common format is a flexible package (61%),
followed by cardboard package (36%).
Table 13. Types of packaging used for bar soaps
Package Percentage
Flexible 61%
Cardboard 36%
Rigid box 1%
Can 0.5%
Case /tray 1,0%
Cover 0.2%
The materials used for packaging of bar soaps are shown in Table 14 below:
Table 14. Materials used for packaging of bar soaps
Material Percentage
Plastic (non specified) 31%
Cardboard with white coating 23%
Plain paper 14%
Laminated paper 10%
PP plastic 8%
Solid white cardboard 8%
PE 2%
Unlined Cardboard 2%
Laminated cardboard 1%
Cardboard coated with brown kraft 1%
If these data is aggregated, we find that 59% of solid soaps are packaged in paper or cardboard,
whereas 41% are packaged with some kind of plastic. So as a base case a packaging made of
packaging paper with a weight of 15 g is considered.
Regarding the printing process, the main technologies are lithography (46%), rotogravure (23%) and
flexographic printing (20%).
From a sample of 4 234 products, only 401 soaps have secondary package, usually when a pack of
two or more bars are sold together. This secondary package is made of cardboard (65%), flexible
(27%) or rigid box (4%)21.
21 Mintel GNPD Database
DRAFT

28
8.8. Distribution
For the distribution phase, secondary and literature data has been used. It is assumed the same
distribution process for all products included in the analysis. Normally in the European market
products are distributed via lorry first to an intermediate storage, then to the storage facilities of
direct customers (retailer) and from there to the point of sale (e.g. supermarket). The average
distance from production site to the intermediate storage facility is approximately 420 km. It is
assumed that additional 500 km as sufficient to cover the following two transportation steps. In total
920 km transportation via lorry is implemented in the material flow network22 .Transport process
parameters considered (distance and mean of transport) are shown in Table 15.
Table 15. Transport parameters
INPUTS
Transport process Distance (km) Means of transport Manufacturing plant to intermediate storage 420 km Lorry From intermediate storage to sale point 500 km Lorry TOTAL 920 km Lorry
8.9. Use
In this stage, the inputs and outputs for the washing process have been gathered and are represented in Table 16. As input, water consumption will be accounted because it is a necessary resource for the washing. Other inputs, such as energy for heating the water and energy for drying hair will not be taken into account, as they are optional and not directly related to the product. The wastewater containing the product used will be considered in the disposal system.
Table 16. Use stage characteristics
Use description: Washing action
Liquid soap Solid soap Shampoo Hair condition.Dose product 5 g 4 g 8 g 14 g Reference flow (functional unit) 255 g 100 g 255 g 255 g Number of washings 51 25 32 28 Use phase inputs
Water consumption / shower23 22 l 22 l 22 l 22 l
Water consumption / functional unit 1122 l 550 l 701 l 401 l
22 Source: CASE STUDY SHAMPOO BY HENKEL AG & CO. KGAA. Case Study undertaken within the PCF Pilot Project Germany. 2008 (http://www.pcf‐projekt.de/files/1236586214/pcf_henkel_shampoo.pdf) 23 Water consumption of a shower is assumed to amount 45 l. It is considered that a shower usually includes washing the body and the hair, so half of consumption is assigned to each kind of product. Source: Bathroom Manufacturers Association (www. bathroom‐association.org)
DRAFT

29
8.10. Disposal
In this phase, we differentiate the release of the product to water and the waste packaging generation.
For the release of product to water, it is considered that the whole product is rinsed‐off, so 255 g of liquid soap/shampoo and hair conditioner or 100 g of solid soap are released to water. In this phase the treatment of residential wastewater (water consumed during washing) in plant is included.
For disposal of packaging waste, the percentage of recycling of each material for packaging use has been assumed based on statistical data of the report “Results of packaging recycling and recovery in the Member States and in the EU in 200824, where it is said that for plastic packaging a 30% of waste are recycled, 27% goes to recovery energy and 43% to disposal. For paper and cardboard packaging waste, 81% of waste is recycled, the 8% goes to recovery energy and only the 6% is disposed to landfill.
Data used for the assessment of the disposal phase are given in Table 17 below.
Table 17. Packaging waste data
2008 data Packaging generated (t) Recycled Recovery energy Disposal
Plastic packaging 14 960 705.30 30% 27% 43%
Paper / cardboard packaging 31 261 549 81% 8% 6%
24 Results of packaging recycling and recovery in the Member States and in the EU in 2008. European Commission
Environment.
DRAFT

30
9. Identification and analy sis of alternatives for hazardous substances
9.1. Introduction
Parallel to the LCA study, the analysis of possibilities of using alternatives for hazardous substances
with high environmental impact has been conducted. This technical analysis has specifically taken
into account the substances most commonly used that perform the same function and the
identification of chemicals of high concern. In particular, focus on substances of very high concern
(Annex XIV of REACH Regulation25) and the candidate list for authorisation as referred to REACH
Regulation was given.
Available data such as substitutions tools and previous work carried out by relevant entities (e.g.
ECHA – the European Chemicals Agency) have been used.
On 20 January 2009 the Regulation on classification, labelling and packaging of substances and
mixtures, CLP Regulation26, entered into force. It aligns existing EU legislation to the United Nations
Globally Harmonised System (GHS) 27. The CLP Regulation will, after a transitional period, replace the
current rules on classification, labelling and packaging of substances (Dangerous Substance Directive
67/548/EC28) and mixtures (Dangerous Preparations Directive 1999/45/EC29). The date from which
substance classification and labelling must be consistent with the new rules is 1 December 2010 and
1 June 2015 ‐ for mixtures. On 1 June 2015 the CLP Regulation will replace completely:
the Dangerous Substance Directive (67/548/EC),
the Dangerous Preparations Directive (1999/45/EC).
The classification criteria regarding CLP have changed in comparison with DSD, e.g. for many physical
hazards where the tests methods which determine the classification criteria are often different from
those of DSD30. For other hazards, the applicable concentration limits for taking into account the
classification of its constituents, additives and impurities have changed, e.g. for the irritation and
corrosive hazards. This means that in cases where there is no reliable test information on the
25 Regulation (EC) No 1907/2006 of the European Parliament and of the Council of 18 December 2006 concerning the
Registration, Evaluation, Authorisation and Restriction of Chemicals (REACH), establishing a European Chemicals Agency, amending Directive 1999/45/EC and repealing Council Regulation (EEC) No 793/93 and Commission Regulation (EC) No 1488/94 as well as Council Directive 76/769/EEC and Commission Directives 91/155/EEC, 93/67/EEC, 93/105/EC and 2000/21/EC; Official Journal of the European Union L 396 of 30 December 2006; available online at: http://eur‐lex.europa.eu/LexUriServ/LexUriServ.do?uri=OJ:L:2007:136:0003:0280:en:PDF. 26 Regulation (EC) No 1272/2008 of the European Parliament and of the Council of 16 December 2008 on classification, labelling and packaging of substances and mixtures, amending and repealing Directives 67/548/EEC and 1999/45/EC, and amending Regulation (EC) No 1907/2006, Official Journal of the European Union L353 of 31 December 2008, pp. 1–1355, available online at: http://eur‐lex.europa.eu/LexUriServ/LexUriServ.do?uri=OJ:L:2008:353:0001:1355:EN:PDF. 27 http://ec.europa.eu/enterprise/sectors/chemicals/documents/classification/. 28 Directive 67/548/EEC on the approximation of laws, regulations and administrative provisions relating to the classification, packaging and labelling of dangerous substances, Official Journal of the European Union L196, 16.8.1967, pp. 1–98, available online at: http://eur‐lex.europa.eu/LexUriServ/LexUriServ.do?uri=CELEX:31967L0548:EN:HTML. 29 Directive 1999/45/EC of the European Parliament and of the Council of 31 May 1999 concerning the approximation of
the laws, regulations and administrative provisions of the Member States relating to the classification, packaging and labelling of dangerous preparations, Official Journal of the European Union L200, 30.7.1999, p. 1‐68, available on line at: http://eur‐lex.europa.eu/LexUriServ/LexUriServ.do?uri=CELEX:31999L0045:en:NOT. 30 http://echa.europa.eu/web/guest/support/faqs/clp‐frequently‐asked‐questions.
DRAFT

31
substance and the bridging principles cannot be applied, use of the calculation rules apllying the
concentrations limits may lead to a classification under CLP, even though the same substance was
not classified under DSD.
Therefore, for the identification of hazardous substances we will focus on substances classified under
CLP regulation since if a substance does not meet the classification criteria under DSD it can be
classified under CLP.
The aim of the authorisation procedure under the REACH is to ensure good functioning of the
internal market while assuring that risks from substances of very high concern are properly
controlled and that these substances are progressively replaced by suitable alternative substances or
different technologies where these are economically and technically viable31. Authorisations apply to
substances of very high concern (SVHC) that are included in Annex XIV of REACH.
Obligations under REACH are determined by the company's role: manufacturer, importer,
downstream user or even distributor. Mainly, cosmetic product manufacturers are defined as
downstream users, because they use substances and/or preparations to formulate their products, or
importers, because they import substances and/or preparations from outside the EU. Based on this,
the highest REACH impact on cosmetic industry will be that if the cost of registration or authorization
for substances of high concern is too high for manufacturers and/or importers of raws materials,
certain ingredients will be not available and will disappear from the market.
On 17 February 2011, the European Commission named 6 chemicals as the first entrants on the
Authorization List (Annex XIV)32. Currently, there are 73 substances on the candidate list33 of
substances of very high concern for authorisation.
This technical analysis has considered the availability of alternatives and risks related to them.
The analysis of alternatives provides the basis to assess whether alternative substances are available
(with the information supplied by relevant tools34). It will be important to take all relevant aspects
into account including whether the transfer to alternatives would result in reduced overall risks to
the environment and human health taking into account the appropriateness and effectiveness of risk
management measures and the technical feasibility of alternatives.
This analysis intends to identify the pool of possible alternative substances. Though it has a high
detail level its output should not be regarded as a "white list" of better environmentally performing
substitutes. Based on the output of this preliminary analysis – the pool of potential alternative
substances should be further case by case investigated before substitution due to environmental
performance can be recommended.
31 Article 55, Regulation (EC) No 1907/2006 of the European Parliament and of the Council of 18 December 2006
concerning the Registration, Evaluation, Authorisation and Restriction of Chemicals (REACH), establishing a European Chemicals Agency, amending Directive 1999/45/EC and repealing Council Regulation (EEC) No 793/93 and Commission Regulation (EC) No 1488/94 as well as Council Directive 76/769/EEC and Commission Directives 91/155/EEC, 93/67/EEC, 93/105/EC and 2000/21/EC; Official Journal of the European Union L 396 of 30 December 2006; available online at: http://eur‐lex.europa.eu/LexUriServ/LexUriServ.do?uri=OJ:L:2007:136:0003:0280:en:PDF. 32 Commission Regulation No 143/2011 of 17 February 2011 amending Annex XIV to Regulation (EC) No 1907/2006 of the European Parliament and of the Council on the Registration, Evaluation, Authorisation and Restriction of Chemicals (‘REACH’); available online at: http://eur‐lex.europa.eu/LexUriServ/LexUriServ.do?uri=OJ:L:2011:044:0002:0006:EN:PDF. 33 http://echa.europa.eu/web/guest/candidate‐list‐table. 34 Global New Products Database: http://www.gnpd.com.
DRAFT

32
9.2. Methodology and information sources
The analysis follows the following stepwise approach:
Activity 1: Inventory of the formulation of products
Formulations have been defined from COLIPA frame formulations35, from where the main functions
for each product have been defined. In order to know more exact data (as frame formulations detail
the type of ingredients and their maximum concentration for most cosmetic products on the
European market), real formulations to which Leitat has access confidentially have been used and
average concentration of each ingredient has been estimated36.
Analysis of the most common chemical substances present in the products and their function has
been carried out.
Information from products database: Information of the characteristics of different products
existing on the market has been gathered in order to do a preliminary analysis of the most common
substances used (both for content and packaging). For this analysis the Database DID‐list37 and
GNPD38 (Global Database of New Products) have been used.
Representativeness has been taken into account, so that different kinds of products included in the
category has been studied: standard products, ecolabelled products, baby products, professional and
household products.
The number of products analyzed of each kind of product (liquid soap, solid soap, shampoo and hair
conditioner) is presented below:
Table 18. Number of products analysed
Product group Number of products analysed
Liquid soap 20 362
Solid soap 4 183
Shampoo 13 188
Hair conditioner 5 327
Activity 2: Obtaining information on composition (Safety Data Sheets)
The Safety Data Sheets (SDS) contain information which can be used for considerations of
substitution. Essential information includes chemical, physical and physicochemical data as well as
toxicological and ecotoxicological information. All information relevant to the prevention of damage
to human health and the environment must be included.
35 COLIPA GUIDELINES. Cosmetic Frame Formulations. January 2000.
36 For details see chapter 6 on raw materials.
37 http://ec.europa.eu/environment/ecolabel/ecolabelled_products/categories/did_list_en.htm.
38 http://www.gnpd.com.
DRAFT

33
The objective of the SDS is to ensure that manufacturers, importers and downstream users have
enough information to use chemical substances safely. The supplier must provide a SDS if the
substance or preparation is hazardous, PBT (persistent, bioaccumulative and toxic) or vPvB (very
persistent and very bioaccumulative) or is on the candidate list of substances of very high concern
(SHVC).
Exposure scenarios will be annexed to the SDS providing information to the users about the risk
management measures that have to be implemented or recommended by the manufacturers for
safe uses of the substance. The SDS must be updated if an authorisation is granted or refused, a
restriction is imposed or even new information on hazards becomes available.
As until now different classifications of the same substances appeared in the safety data sheets, we
chose to use a harmonized classification based on information from ESIS39 and ECHA40 and not Safety
Data Sheets from manufacturers. The Classification & Labelling (C&L) Inventory41 from ECHA is a
database that will contain basic classification and labelling information on notified and registered
substances received from manufacturers and importers. It will also contain the list of harmonized
classifications (Table 3.1 of Annex VI to CLP). However, the Classification & Labelling (C&L) Inventory
will not be available until early 2012. Classification of the different substances, therefore, is based on
ESIS: European Chemicals Substance Information System and ECHA information about registered
substances.
Activity 3: Describing the function
The process description comprises: the use of the process, limitations and quality specifications,
alternative processes or process designs, description of the equipment, safety precautions and
possible exposure of workers to hazards.
This will require an understanding of the exact use of the substance including a description and
outcome of the process where the use is applied. Understanding of the specific process conditions
for using the substance and of any conditions or requirements on possible end‐products resulting
from the process, may impose constraints under which the desired function must be performed and
thereby influence which alternatives may be used.
A detailed and specific knowledge of the exact function for a particular use will allow looking for
other ways of performing that function. This may be done using another substance or technology or
by changing the process or end product.
Analysis of the most common chemical substances present in the products that may possibly fulfil an
equivalent function to the uses applied for, has been carried out in the framework of this study.
39 European chemical substances information system: http://esis.jrc.ec.europa.eu/. 40 http://echa.europa.eu/web/guest/information‐on‐chemicals/registered‐substances. 41 http://echa.europa.eu/web/guest/regulations/clp/cl‐inventory.
DRAFT

34
Activity 4: Assessing the risk
Based on the information provided by ESIS and ECHA42, a priority list of hazardous substances which
are determined to pose the most significant potential threat to human health and environment has
been prepared.
It is important to remember that less dangerous chemicals are not necessarily harmless. Therefore,
risk management measures are still needed in many cases.
Some other sources of information such as literature and/or databases have been taken into
account, e.g. the hazardous substances database PRIO developed by KEMI43 (Swedish Chemicals
Agency).
Activity 5: Analysis of alternatives
The analysis of alternatives is the first step in the process of planning for substitution, where
assessment is made on the availability of suitable alternative substances, their risks for human health
and the environment and their technical feasibility. All relevant aspects must be taken into account,
including whether the transfer to the alternative would result in reduced overall risks to human
health and the environment bearing in mind risk management measures and the technical feasibility
of alternatives for replacement.
The analysis of alternatives will conclude whether there is a suitable alternative available when an
alternative substance or technology or their combination:
‐ Provide an equivalent function to that provided by the substance (a single alternative may
not be suitable for all different processes or uses for which the original substance was
suitable, thus the original substance could be substituted by more than one suitable
alternative).
‐ Will result in reduced overall risks to human health and the environment, taking into account
appropriateness of risk management measures,
‐ Are technically and economically feasible (for substitution in the uses applied for) and
available.
For this analysis the Database GNPD44 (Global Database of New Products) has been used. However
stakeholder and trade/sector organisations΄ knowledge is also crucial in providing information on
possible alternatives and evidence of (non)availability of (suitable) alternatives.
In this analysis the potential to substitute hazardous substances with safer components, whenever
technically feasible, in particular with regard to substances of very high concern (SVHC) as referred to
in Article 57 of the REACH Regulation (EC) No 1907/2006 has been taken into account.
42 Website of the European Chemical Agency regarding substances of concern: http://echa.europa.eu/web/guest/addressing‐chemicals‐of
concern/. 43 Web reference: http://www.kemi.se/. 44 http://www.gnpd.com.
DRAFT

35
9.3. Information sources
The main sources of information for the identification of hazardous substances and the analysis of
alternatives are:
Existing studies about similar products
An exhaustive search of published studies has been performed, in order to analyze and integrate data considered of value for the project. Existing risk assessments reports have been identified and integrated. Moreover, a wide screening of other existing ecolabel information related with the issue has been done. This information will be useful in order to complete the information gaps that may exist.
Information from products Database
Information of the characteristics of different products existing in the market has been gathered in order to do a preliminary analysis of the most common substances used (both for content and packaging).
For this qualitative analysis the Database Mintel GNPD (GlobalDatabase of New Products45) has been used. Each kind of product, i.e. liquid soap, solid soap, shampoos and hair conditioner has been analyzed in terms of content and packaging.
Alternative comparison tools have been taken into account:
Tool: P2Oasys Tool to Compare Materials. Developed by: TURI‐ Toxics Use Reduction
Institute (University of Massachussetts Lowell USA)46.
Tool: Column Model. Developed by: Berufsgenossenschaftliches Institut für Arbeitsschutz –
BGIA47.
Substitution experience Database: CatSub. Developed by: European Agency of Occupational
Safety and Health, Danish Working Environment Authority48.
9.4. Identification of existing studies
An analysis of existing studies, risk assessments studies, publications and data related to environmental and human health performance of soaps, shampoos and hair conditioners has been carried out.
Studies by Ecolabelling Norway (Ecolabel Criteria 2007)49
The following risk assessments studies were considered by Ecolabelling Norway to assess the Ecolabel criteria for soaps, shampoos and hair conditioners in 2007:
45 http://www.gnpd.com. 46 Web reference: http://www.turi.org/. 47 Web reference: http://www.hvbg.de/e/bia/. 48 Web reference: http://www.catsub.dk. 49 Final report. EU Eco‐label for shampoo and soaps. Ecolabelling Norway. Eskeland,, M.B, Svanes, E. May 2006.
DRAFT

36
Risk assessment for shampoo ingredients carried out by Chalmers University of Technology (1997). The findings of the report could not demonstrate environmental safety for the following 5 substances: Cocoamido propyl betaine, Formic acid, hexyl cinnamic aldehyde, Dipropylene glycol and 2‐bromo‐2‐nitropropane‐1,3‐diol.
Risk analysis of the Medical Products Agency on the environmental effects of cosmetic products and medicines on behalf of the Swedish Government (Medical Products Agency, 2004). The analysis concluded that Butyl metoxydibenzoylmethane, EDTA, Cocoamide DEA, Isoparaffines, Polyquaternium‐10, Resorcinol, Zink oxide and Zink Pyrithione were found to be environmentally harmful. Bronopol, sodium laureth sulphate and triclosan pose a high risk and cetrimonium salts a slight risk. Cocoamidopropyl betaine and Parabenes were found to pose little or no risk to the aquatic environment and sodium lauryl sulphate was not harmful to the environment.
Risk Analysis commissioned by the Swedish County Jönköping: “Environmental impact of hygiene products”. The report concluded that quaternary ammonium compounds, cocoamido propyl betaine, triclosan, sodium cocoamphoacetate, sodium lauryl ether sulphate and cocoamide DEA were found to be environmentally harmful. Parabenes were prioritised for risk assessment but could not be studied because of lack of information.
Analysis for the Swedish drinking water provider Stockholm Vatten. Kristina Johansson
(Stockholm Vatten, 2002) studied the environmental effects of hair care products, on behalf
of Stockholm Vatten. Environmentally harmful ingredients were: Ammonium hydroxide,
Behentrimonium chloride, cetrimonium chloride, diazolidinyl urea, diethyl dimonium
chloride, disodium laureth sulfosuccinate, distearyldimonium chloride, isothiazolinones (MIT
and CMI) and thymol. Carbomer, some polyquaternium‐compounds (2‐, 4‐, 6‐, 7, 10‐, 11‐, 30‐
and 37‐), quaternium‐52 and some silicone oils and some colours were suspected of being
harmful to the environment.
The Danish study on solid soaps by CETOX contains an assessment of environmental impact
by classification looking at the ingredients in relation to environmental risk phrases (1998).
Environmentally harmful ingredients were: cocamide MEA, Cocoamide DEA, Triclosan,
Imidazolidinyl urea and sodium olefin sulphonate.
The “Substitution of surface‐active compounds in cosmetic products” report commissioned
by the Danish EPA. The result of the study concludes that the commonly employed cationic
surfactant Cetrimonium Chloride can easily be substituted by the environmentally preferable
alternative Behenyl PG‐trimonium Chloride.
Environmental guidance document by the Danish EPA (1999). The most problematic
ingredients were those who are toxic to aquatic organisms, poorly biodegradable and prone
to bio‐concentrate. The study also concludes that since the products are rinse‐off products,
the exposure to the skin is low, but many people experience adverse health reactions,
probably due to exposure to fragrances and preservatives.
A Swedish Society for Conservation of Nature report on baby products (including soap and
shampoo) (May 2011). Requirements on health and environment were set up. Many
products failed because of perfume content, colouring agents, preservatives: Methyl
dibromo glutaronitrile, Quaternium‐15, imidazolidinyl urea, Cetrimonium chloride,
methylchloroisothiazolinone and methylisothiazoloinone. MEA and DEA are singled out
DRAFT

37
because of warnings from the American government agency FDA regarding possible
carcenogenic activity. Environmentally and/or healthy harmful ingredients were disodium
EDTA, Tetrasodium EDTA and Cocoamide DEA.
9.5. Identification and analysis of alternatives for hazardous substances in liquid soaps
For the category of liquid soap, the goal and scope of the identification and analysis of alternatives is
as defined in section 9.2, as they are common for all products included in this product category. 20
362 products (liquid soaps) have been found and analyzed.
Raw materials
The top ingredients present in liquid soaps are presented in Table 19:
Table 19. Top ingredients present in liquid soaps
FUNCTION NUMBER OF VARIANTS*
Surfactant 50.516
Viscosity controlling 45.910
Skin conditioning 40.936
Masking 39.362
Emulsifying 36.445
Solvent 36.052
Cleansing 35.582
Preservative 31.414
Antistatic 25.625
Perfuming 11.423
* Number of different substances that perform the same function
Source: Elaborated based on GNPD (Global Database of New Products) results for 2011
Figure 6. Top ingredients present in liquid soaps. Based on GNPD (Global Database of New Products) results (2011)
DRAFT

38
Identification of variants:
The substances most commonly used that perform the same function are indicated in the tables
below with the aim to identify hazardous substances and help manufacturers to find an
environmentally better alternative substance with a lower hazard level for a specific function. The
substances marked in tables with red colour are the hazardous substances.
Surfactant
Table 20. Different variants that fulfill equivalent function: surfactant
VARIANTS (Function Surfactant) Percentage of products
containing this variant
Cocamidopropyl Betaine 18,73%
Sodium Laureth Sulfate 18,36%
Coco‐glucoside 5,94%
PEG‐7 Glyceryl Cocoate 5,55%
PEG‐40 Hydrogenated Castor Oil 3,63%
Lauryl Glucoside 3,53%
Cocamide MEA 3,02%
Cocamide DEA 3,01%
Laureth‐4 2,40%
Polysorbate 20 2,20%
Decyl Glucoside 1,84%
Disodium Laureth Sulfosuccinate 1,55%
Xanthan Gum 1,44%
Sodium Cocoamphoacetate 1,36%
Sodium Lauryl Sulfate 1,25%
Sodium C12‐13 Pareth Sulfate 1,21%
Laureth‐2 0,99%
Ammonium Lauryl Sulfate 0,96%
Disodium Cocoamphodiacetate 0,87%
Disodium Cocoyl Glutamate 0,83%
Laureth‐10 0,82%
Lauramidopropyl Betaine 0,69%
Laureth‐3 0,66%
PEG‐150 Distearate 0,64%
Triethanolamine 0,63%
Sodium Cocoyl Glutamate 0,62%
Hexylene Glycol 0,62%
Sodium Lauroyl Glutamate 0,60%
Trideceth‐9 0,54%
Coco‐betaine 0,49%
Sodium Lauroamphoacetate 0,44%
Lauric Acid 0,42%
Cocamidopropylamine Oxide 0,40%
Hydrogenated Castor Oil 0,60%
Lauryl Betaine 0,35%
Poloxamer 124 0,35%
Hydroxypropyl Methylcellulose 0,34%
Glycol Stearate 0,33%
Sodium Lauroyl Sarcosinate 0,33%
Sodium Cocoyl Isethionate 0,33%
Sodium Lauryl Glucose Carboxylate 0,31%
Sodium Myreth Sulfate 0,31%
DRAFT

39
Sodium Lauryl Sulfoacetate 0,29%
TEA‐lauryl Sulfate 0,28%
Cocamidopropyl Hydroxysultaine 0,28%
Caprylyl/Capryl Glucoside 0,27%
Stearic Acid 0,25%
Cocamide MIPA 0,25%
Sodium Coco‐sulfate 0,24%
Trideceth‐7 0,22%
Ceteareth‐60 Myristyl Glycol 0,02%
Hydroxypropyl Guar 0,20%
Glycereth‐2 Cocoate 0,19%
Potassium Cocoate 0,18%
PPG‐5‐ceteth‐20 0,18%
Cetearyl Alcohol 0,17%
Sodium Palm Kernelate 0,17%
MIPA‐laureth Sulfate 0,16%
Isostearic Acid 0,16%
Stearyl Alcohol 0,16%
PEG‐60 Hydrogenated Castor Oil 0,16%
Linoleic Acid 0,16%
PEG‐80 Sorbitan Laurate 0,16%
Sodium Methyl Cocoyl Taurate 0,15%
Ceteareth‐6 0,14%
Sodium Stearate 0,13%
Sodium C14‐16 Olefin Sulfonate 0,13%
PPG‐1‐PEG‐9 Lauryl Glycol Ether 0,13%
Sodium Palmitate 0,12%
Magnesium Laureth Sulfate 0,11%
Sodium Lauroyl Isethionate 0,11%
Sodium Trideceth Sulfate 0,11%
Disodium Lauroamphodiacetate 0,10%
Sodium Coceth Sulfate 0,10%
Sodium Myristoyl Sarcosinate 0,10%
Potassium Olivate 0,10%
Potassium Oleate 0,09%
Lauramide DEA 0,08%
Ammonium Laureth Sulfate 0,08%
Beheneth‐10 0,08%
Polysorbate 60 0,08%
Polysorbate 80 0,08%
Cetyl Alcohol 0,08%
Sodium Laureth‐11 Carboxylate 0,08%
DATEM 0,08%
PEG‐75 Lanolin 0,08%
Sodium Lauroyl Oat Amino Acids 0,08%
PEG‐40 Sorbitan Peroleate 0,07%
Laureth‐11 Carboxylic Acid 0,07%
Disodium Lauryl Sulfosuccinate 0,07%
PEG‐100 Stearate 0,07%
Trisodium Sulfosuccinate 0,07%
Capryl/capramidopropyl Betaine 0,07%
Cetearyl Glucoside 0,07%
PEG‐5 Cocamide 0,07%
Poloxamer 101 0,06%
DRAFT

40
Benzalkonium Chloride 0,06%
Lauramide MEA 0,06%
Ceteareth‐20 0,06%
Sodium Olivamphoacetate 0,05%
Sodium Cocoate 0,05%
Sucrose Laurate 0,05%
TEA‐dodecylbenzenesulfonate 0,05%
Ceteth‐24 0,05%
Steareth‐4 0,05%
Steareth‐2 0,05%
Sodium Cocoyl Hydrolyzed Wheat Protein
0,05%
Oleamidopropyl Betaine 0,05%
Cocamide DIPA 0,05%
Cetrimonium Chloride 0,05%
Disodium PEG‐5 Laurylcitrate Sulfosuccinate
0,04%
PPG‐2 Hydroxyethyl Cocamide 0,04%
Zinc Coceth Sulfate 0,04%
Laureth‐7 Citrate 0,04%
Sodium Tallowate 0,04%
PEG‐35 Castor Oil 0,04%
Sodium Laureth‐13 Carboxylate 0,04%
Sodium Palmate 0,04%
Bis‐PEG/PPG‐20/20 Dimethicone 0,04%
Sodium Oleth Sulfate 0,04%
Sodium Babassuamphoacetate 0,03%
Capryloyl Glycine 0,03%
Sorbitan Sesquicaprylate 0,03%
Laureth‐11 0,03%
Magnesium Oleth Sulfate 0,03%
Oleth‐20 0,03%
Cocamidopropyl Betainamide MEA Chloride
0,03%
Sodium Cocoyl Amino Acids 0,03%
Shea Butteramidopropyl Betaine 0,03%
Ceteth‐20 0,03%
C11‐15 Pareth‐40 0,03%
Sodium Cetearyl Sulfate 0,03%
Sodium Coco‐glucoside Tartrate 0,03%
Magnesium Laureth‐8 Sulfate 0,03%
Sodium Laureth‐8 Sulfate 0,03%
Lauramide MIPA 0,03%
Laureth‐7 0,03%
Others < 0,03%
Viscosity controlling
Table 21. Different variants that fulfill equivalent function: viscosity controlling
VARIANTS (Function viscosity controlling)
Percentage of products containing this variant
Cocamidopropyl Betaine 20,61%
Sodium Chloride 20,01%
Propylene Glycol 8,00%
Disodium EDTA 6,13%
DRAFT

41
Glycol Distearate 4,23%
Benzyl Alcohol 3,52%
Cocamide MEA 3,33%
Cocamide DEA 3,31%
Acrylates Copolymer 2,39%
Magnesium Chloride 1,97%
Xanthan Gum 1,59%
Alcohol Denat. 1,59%
PEG‐120 Methyl Glucose Dioleate
1,51%
Guar Hydroxypropyltrimonium Chloride
1,49%
Butylene Glycol 1,13%
Alcohol 1,12%
Acrylates/C10‐30 Alkyl Acrylate Crosspolymer
0,86%
Lauramidopropyl Betaine 0,76%
PEG‐150 Distearate 0,71%
PEG‐55 Propylene Glycol Oleate 0,69%
Dipropylene Glycol
0,59%
Polyethylene 0,00%
Sodium Sulfate 0,59%
Coco‐betaine 0,56%
PEG‐4 Rapeseedamide 0,54%
Isopropyl Alcohol 0,48%
Betaine 0,48%
Carbomer 0,48%
Silica 0,47%
Hydrogenated Castor Oil 0,46%
Triethylene Glycol 0,44%
Sodium Styrene/acrylates Copolymer
0,41%
Hydroxypropyl Methylcellulose 0,39%
Butyrospermum Parkii Butter 0,37%
Sodium Lauroyl Sarcosinate 0,37%
Cocamidopropyl Hydroxysultaine
0,37%
Magnesium Sulfate 0,30%
Cocamide MIPA 0,30%
Lanolin Alcohol 0,27%
Tin Oxide 0,26%
Gelatin 0,23%
Potassium Chloride 0,23%
Hydroxypropyl Guar 0,22%
Hydroxyethylcellulose 0,22%
Cetearyl Alcohol 0,20%
Sodium Palm Kernelate 0,19%
Stearyl Alcohol 0,07%
Calcium Chloride 0,07%
PEG‐14M 0,07%
Tetrasodium Etidronate 0,07%
Cetyl Hydroxyethylcellulose 0,07%
Sodium Stearate 0,07%
Cellulose 0,07%
Alumina 0,07%
Hydroxypropyl Starch Phosphate
0,07%
Sodium Palmitate 0,07%
Isopentane 0,07%
DRAFT

42
Agar 0,07%
Disodium Lauroamphodiacetate 0,07%
Lauryl Alcohol 0,07%
Sodium Myristoyl Sarcosinate 0,07%
Microcrystalline Cellulose 0,07%
PEG‐120 Methyl Glucose Trioleate
0,07%
Glycol 0,07%
Oxidized Polyethylene 0,07%
Lauramide DEA 0,07%
Cetyl Alcohol 0,07%
Synthetic Wax 0,07%
Capryl/capramidopropyl Betaine
0,07%
Acrylates/steareth‐20 Methacrylate Copolymer
0,07%
Cera Microcristallina 0,07%
Lauramide MEA 0,07%
Cyamopsis Tetragonoloba Gum 0,07%
PEG/PPG‐120/10 Trimethylolpropane Trioleate
0,07%
Acrylates/palmeth‐25 Acrylate Copolymer
0,07%
Butylene/ethylene Copolymer 0,07%
Hydrated Silica 0,07%
Zea Mays Starch 0,07%
PEG‐90M 0,06%
Potassium Palm Kernelate 0,06%
Starch Hydroxypropyltrimonium Chloride
0,06%
Algin 0,05%
Cocamide DIPA 0,05%
Paraffin 0,05%
Others < 0,05%
Skin conditioning – Humectant
Table 22. Different variants that fulfill equivalent function: skin conditioning ‐ humectant
VARIANTS (Function Sking conditioning Humectant)
Percentage of products containing this variant
Propylene Glycol 45,31%
Lactic Acid 15,04%
Sorbitol 10,67%
Maris Sal 4,24%
Urea 4,01%
Betaine 2,70%
Lactose 2,60%
Sodium PCA 2,31%
TEA‐lactate 2,22%
Camellia Sinensis Leaf Extract 1,76%
Inulin 1,23%
Maris Aqua 0,80%
Mannitol 0,56%
Saccharomyces Lysate Extract 0,32%
Copper PCA 0,31%
Manganese PCA 0,22%
Hydrolyzed Wheat Starch 0,22%
Hydrolyzed Corn Starch 0,19%
DRAFT

43
Xylitol 0,17%
Magnesium P CA 0,14%
Camellia Sinensis Seed Oil 0,11%
Xylitylglucoside 0,10%
Anhydroxylitol 0,10%
Others < 0,10%
Emulsifying
Table 23.Different variants that fulfill equivalent function: Emulsifying
VARIANTS (Function emulsifying)
Percentage of products containing this variant
Sodium Laureth Sulfate 25,45%
PEG‐7 Glyceryl Cocoate 7,69%
Glyceryl Oleate 5,55%
Glycol Distearate 5,33%
PEG‐40 Hydrogenated Castor Oil 5,04%
Cocamide MEA 4,19%
Cocamide DEA 4,17%
Laureth‐4 3,32%
Polysorbate 20 3,05%
PEG‐200 Hydrogenated Glyceryl Palmate
2,28%
Xanthan Gum 2,00%
PEG‐120 Methyl Glucose Dioleate
1,90%
Sodium Lauryl Sulfate 1,73%
Sodium C12‐13 Pareth Sulfate 1,68%
Laureth‐2 1,37%
Laureth‐10 1,13%
Laureth‐3 0,92%
PEG‐150 Distearate 0,89%
Triethanolamine 0,88%
Hexylene Glycol 0,86%
PEG‐6 Caprylic/capric Glycerides 0,78%
PEG‐18 Glyceryl Oleate/cocoate 0,75%
Trideceth‐9 0,75%
Glyceryl Stearate 0,69%
Lauric Acid 0,59%
Hydrogenated Castor Oil 0,55%
PEG‐150 Pentaerythrityl Tetrastearate
0,53%
Lecithin 0,51%
Glyceryl Laurate 0,50%
Poloxamer 124 0,48%
Glycol Stearate 0,46%
Sodium Lauroyl Sarcosinate 0,46%
Sucrose Cocoate 0,44%
Sodium Myreth Sulfate 0,43%
TEA‐lauryl Sulfate 0,38%
Stearic Acid 0,35%
Cocamide MIPA 0,35%
Sodium Coco‐sulfate 0,33%
Lanolin Alcohol 0,32%
PEG‐3 Distearate 0,31%
Trideceth‐7 0,31%
Glyceryl Cocoate 0,31%
DRAFT

44
Ceteareth‐60 Myristyl Glycol 0,30%
Glycereth‐2 Cocoate 0,27%
Potassium Cocoate 0,25%
PPG‐5‐ceteth‐20 0,25%
Cetearyl Alcohol 0,24%
Sodium Palm Kernelate 0,23%
Isostearic Acid 0,23%
Stearyl Alcohol 0,22%
PEG‐60 Hydrogenated Castor Oil 0,22%
PEG‐60 Almond Glycerides 0,22%
Glyceryl Caprylate 0,22%
Ceteareth‐6 0,19%
Sodium Stearate 0,19%
PPG‐1‐PEG‐9 Lauryl Glycol Ether 0,18%
Sodium Palmitate 0,16%
Sodium Trideceth Sulfate 0,15%
PEG‐75 Shea Butter Glycerides 0,15%
Lauryl Alcohol 0,14%
Potassium Olivate 0,13%
Sodium PEG‐7 Olive Oil Carboxylate
0,13%
Glyceryl Stearate SE 0,13%
Potassium Oleate 0,12%
Others < 0,12%
Solvent
Table 24. Different variants that fulfill equivalent function: Solvent
VARIANTS (Function solvent) Percentage of products containing this variant
Aqua 33,97%
Glycerin 20,24%
Limonene 12,59%
Propylene Glycol 10,19%
Benzyl Alcohol 4,49%
PEG‐200 Hydrogenated Glyceryl Palmate
2,31%
Alcohol Denat. 2,02%
Butylene Glycol 1,44%
Alcohol 1,43%
Benzyl Benzoate 1,16%
Isopropyl Palmitate 1,05%
Hexylene Glycol 0,87%
Olea Europaea Fruit Oil 0,77%
Dipropylene Glycol 0,75%
Isopropyl Alcohol 0,61%
Triethylene Glycol 0,53%
Paraffinum Liquidum 0,50%
Cocos Nucifera Oil 0,47%
PEG‐8 0,36%
Pentylene Glycol 0,36%
Dicaprylyl Ether 0,34%
Caprylic/Capric Triglyceride 0,33%
Buteth‐3 0,31%
Tributyl Citrate 0,31%
PEG‐7 0,30%
PEG‐40 0,22%
DRAFT

45
Ricinus Communis Seed Oil 0,20%
Isopentane 0,17%
Isopropyl Myristate 0,16%
Farnesol 0,15%
PEG‐200 0,15%
Ethoxydiglycol 0,14%
Butyloctanol 0,14%
Glycol 0,12%
1,2‐hexanediol 0,12%
PEG‐6 0,11%
Octyldodecanol 0,09%
Methylpropanediol 0,07%
Gluconolactone 0,06%
PEG‐4 0,06%
Triethyl Citrate 0,06%
PPG‐2 Methyl Ether 0,05%
PEG‐150 0,05%
Glycereth‐26 0,05%
Phenoxyisopropanol 0,04%
PEG‐18 0,04%
Cyclomethicone 0,03%
Benzyl Acetate 0,03%
Others < 0,03%
Cleansing
Table 25. Different variants that fulfill equivalent function: Cleansing
VARIANTS (Function cleansing) Percentage of products containing this variant
Cocamidopropyl Betaine 26,63%
Sodium Laureth Sulfate 26,11%
Coco‐glucoside 8,45%
Lauryl Glucoside 5,02%
Decyl Glucoside 2,62%
PEG‐200 Hydrogenated Glyceryl Palmate
2,34%
Disodium Laureth Sulfosuccinate
2,20%
Sodium Cocoamphoacetate 1,93%
Sodium Lauryl Sulfate 1,78%
Sodium C12‐13 Pareth Sulfate 1,72%
Laureth‐2 1,40%
Ammonium Lauryl Sulfate 1,37%
Disodium Cocoamphodiacetate 1,24%
Disodium Cocoyl Glutamate 1,18%
Lauramidopropyl Betaine 0,98%
Sodium Cocoyl Glutamate 0,89%
Coco‐betaine 0,70%
Sodium Lauroamphoacetate 0,63%
Lauric Acid 0,60%
Cocamidopropylamine Oxide 0,57%
Lauryl Betaine 0,50%
Sodium Lauroyl Sarcosinate 0,47%
Sodium Cocoyl Isethionate 0,46%
Sodium Lauryl Glucose Carboxylate
0,44%
DRAFT

46
Sodium Myreth Sulfate 0,44%
Sodium Lauryl Sulfoacetate 0,41%
Cocamidopropyl Hydroxysultaine
0,39%
Caprylyl/Capryl Glucoside 0,39%
TEA‐lauryl Sulfate 0,39%
Stearic Acid 0,36%
PEG‐90 Glyceryl Isostearate 0,34%
Sodium Coco‐sulfate 0,34%
Sodium Palm Kernelate 0,24%
Sodium Isethionate 0,24%
MIPA‐laureth Sulfate 0,23%
Isostearic Acid 0,23%
Linoleic Acid 0,23%
Sodium Methyl Cocoyl Taurate 0,21%
Sodium Stearate 0,19%
Sodium C14‐16 Olefin Sulfonate 0,18%
Sodium Palmitate 0,17%
Magnesium Laureth Sulfate 0,16%
Sodium Trideceth Sulfate 0,15%
Sodium Lauroyl Isethionate 0,15%
Citrus Aurantifolia Oil 0,15%
Disodium Lauroamphodiacetate 0,15%
Sodium Coceth Sulfate 0,15%
Sodium Myristoyl Sarcosinate 0,14%
PEG‐120 Methyl Glucose Trioleate
0,13%
Ammonium Laureth Sulfate 0,12%
Sodium Laureth‐11 Carboxylate 0,11%
Sodium Lauroyl Oat Amino Acids
0,11%
Laureth‐11 Carboxylic Acid 0,10%
Disodium Lauryl Sulfosuccinate 0,10%
Capryl/capramidopropyl Betaine
0,10%
Sodium Cocoyl Glycinate 0,09%
Ceteareth‐20 0,08%
Centella Asiatica Extract 0,08%
Potassium Palm Kernelate 0,08%
Sodium Olivamphoacetate 0,08%
TEA‐dodecylbenzenesulfonate 0,08%
Citrus Aurantifolia Juice 0,08%
Sodium Cocoate 0,08%
Ceteth‐24 0,07%
Oleamidopropyl Betaine 0,06%
Myristic Acid 0,06%
Laureth‐7 Citrate 0,06%
Zinc Coceth Sulfate 0,06%
Sodium Tallowate 0,06%
Sodium Laureth‐13 Carboxylate 0,05%
Sodium Oleth Sulfate 0,05%
Sodium Palmate 0,05%
Betula Alba Leaf Extract 0,05%
Capryloyl Glycine 0,05%
Others <0,05%
DRAFT

47
Preservative
Table 26. Different variants that fulfill equivalent function: Preservative
VARIANTS (Function preservative)
Percentage of products
containing this variant
Sodium Benzoate 17,77%
Phenoxyethanol 9,63%
Methylparaben 8,68%
Methylisothiazolinone 8,66%
Methylchloroisothiazolinone 7,66%
Propylparaben 6,70%
Potassium Sorbate 5,52%
Benzyl Alcohol 5,14%
DMDM Hydantoin 3,90%
Ethylparaben 3,84%
Butylparaben 3,55%
Sodium Salicylate 2,82%
Isobutylparaben 2,62%
Benzoic Acid 2,51%
2‐bromo‐2‐nitropropane‐1,3‐diol
1,71%
Salicylic Acid 1,45%
Dehydroacetic Acid 0,90%
Imidazolidinyl Urea 0,86%
Sodium Methylparaben 0,84%
Sorbic Acid 0,74%
Triclosan 0,61%
Formic Acid 0,61%
Iodopropynyl Butylcarbamate 0,45%
Sodium Formate 0,36%
Diazolidinyl Urea 0,30%
Chlorphenesin 0,24%
Polyaminopropyl Biguanide 0,19%
Sodium Dehydroacetate 0,17%
Sodium Hydroxymethylglycinate
0,17%
Sodium Propylparaben 0,16%
Potassium Benzoate 0,13%
Formaldehyde 0,12%
Benzalkonium Chloride 0,10%
Piroctone Olamine 0,08%
Isopropylparaben 0,08%
Cetrimonium Chloride 0,07%
5‐bromo‐5‐nitro‐1,3‐dioxane 0,07%
Benzylhemiformal 0,07%
Chloroxylenol 0,06%
Chlorhexidine Digluconate 0,05%
Phenoxyisopropanol 0,05%
Sodium Metabisulfite 0,04%
Quaternium‐15 0,04%
Dimethyl Oxazolidine 0,04%
Sodium Ethylparaben 0,03%
Sodium Sulfite 0,03%
Isobutyl Benzoate 0,03%
Sodium Bisulfite 0,03%
Triclocarban 0,03%
DRAFT

48
Methyl Benzoate 0,02%
Undecylenic Acid 0,02%
O‐cymen‐5‐ol 0,02%
Dichlorobenzyl Alcohol 0,01%
Silver Chloride 0,01%
Behentrimonium Chloride 0,01%
Benzethonium Chloride 0,01%
Chloroacetamide 0,01%
Glutaral 0,01%
Climbazole 0,01%
Ortho‐phenylphenol 0,01%
Chlorhexidine 0,00%
Sodium Isobutylparaben 0,00%
TEA‐salicylate 0,00%
Sodium Butylparaben 0,00%
Zinc Pyrithione 0,00%
Others <0,00%
Antistatic
Table 27. Different variants that fulfill equivalent function: Antistatic
VARIANTS (Function antistatic) Percentage of products containing this variant
Cocamidopropyl Betaine 36,98%
Polyquaternium‐7 12,17%
Pantothenic Acid 5,05%
Panthenol 4,73%
Laureth‐4 4,40%
Polyquaternium‐10 4,40%
Acrylates Copolymer 4,30%
Guar Hydroxypropyltrimonium Chloride (682
2,66%
Hydroxypropyl Guar Hydroxypropyltrimonium Chloride
1,76%
Isopropyl Palmitate 1,47%
Lauramidopropyl Betaine 1,36%
Urea 1,27%
Sodium Lauroyl Glutamate 1,19%
Polyquaternium‐39 0,99%
Coco‐betaine 0,97%
Hydrolyzed Wheat Protein 0,89%
Betaine 0,86%
Sine Adipe Lac 0,84%
Serine 0,76%
Lecithin 0,73%
Sodium PCA 0,73%
Paraffinum Liquidum 0,71%
Lauryl Betaine 0,70%
Petrolatum 0,69%
Hydroxypropyl Methylcellulose 0,67%
Sodium Lauroyl Sarcosinate 0,66%
Niacin 0,65%
Sucrose Cocoate 0,62%
Cocamidopropyl Hydroxysultaine
0,54%
DRAFT

49
Hydrolyzed Milk Protein 0,47%
Lanolin Alcohol 0,46%
Hydroxypropyl Guar 0,40%
Hydrolyzed Silk 0,38%
Polyquaternium‐22 0,37%
Hydrolyzed Keratin 0,37%
Sodium Isethionate 0,33%
Glycine (82) 0,32%
Linoleic Acid 0,32%
Polyquaternium‐2 0,28%
Arginine 0,28%
Lauryl Aminopropylglycine 0,26%
Lauryl Methyl Gluceth‐10 Hydroxypropyldimonium
0,25%
Laurdimonium Hydroxypropyl Hydrolyzed Wheat Protein
0,23%
Sodium Lauroyl Isethionate 0,21%
Disodium Lauroamphodiacetate 0,21%
Inositol 0,21%
Lauryl Diethylenediaminoglycine
0,20%
Sodium Myristoyl Sarcosinate 0,19%
Cocamidopropyl PG‐dimonium Chloride Phosphate
0,18%
Lauramide DEA 0,16%
Sodium Lauroyl Oat Amino Acids
0,15%
Synthetic Wax 0,15%
Polyquaternium‐43 0,15%
Calcium Pantothenate 0,13%
Capryl/capramidopropyl Betaine
0,13%
Hydrolyzed Oat Protein 0,13%
Benzalkonium Chloride 0,12%
Lauramide MEA 0,12%
Hydroxycetyl Hydroxyethyl Dimonium Chloride
0,12%
Hydrolyzed Rice Protein 0,12%
Hydrolyzed Soy Protein 0,12%
Quaternium‐80 0,11%
Starch Hydroxypropyltrimonium Chloride
0,10%
Polyquaternium‐11 0,10%
Myristamidopropyl PG‐dimonium Chloride Phosphate
0,10%
Sodium Cocoyl Hydrolyzed Wheat Protein
0,09%
Lysine 0,09%
Oleamidopropyl Betaine 0,09%
Oryzanol 0,09%
Cetrimonium Chloride 0,09%
Hydrolyzed Sweet Almond Protein
0,09%
Polyquaternium‐44 0,09%
Alanine 0,07%
Hyaluronic Acid 0,07%
Polyquaternium‐67 0,07%
Sodium Cocoyl Amino Acids 0,06%
Valine 0,06%
Ricinoleamidopropyltrimonium Methosulfate
0,06%
Pyridoxine HCl 0,05%
Isostearamidopropyl Morpholine Lactate
0,05%
Lauramide MIPA 0,05%
Linoleamidopropyl PG‐dimonium Chloride Phosphate
0,05%
Sodium Caseinate 0,05%
DRAFT

50
Carnitine 0,05%
Hydrolyzed Collagen 0,05%
Cyclomethicone 0,05%
Glutamic Acid 0,05%
Others <0,05%
Perfuming
Table 28. Different variants that fulfill equivalent function: Perfuming
VARIANTS (Function perfuming) Percentage of products containing this variant
Linalool 10,41%
Limonene 9,87%
Butylphenyl Methylpropional 6,23%
Hexyl Cinnamal 6,03%
Propylparaben 4,61%
Glyceryl Oleate 4,42%
Citronellol 3,95%
Benzyl Alcohol 3,53%
Benzyl Salicylate 3,32%
Geraniol 3,03%
Alpha‐isomethyl Ionone 2,43%
Coumarin 2,29%
Quinoline 1,84%
Citral 1,44%
Hydroxyisohexyl 3‐cyclo hexene Carboxaldehyde
1,35%
Hydroxycitronellal 0,00%
Benzyl Benzoate 0,92%
Isopropyl Palmitate 0,91%
Hexylene Glycol 0,83%
Eugenol 0,67%
Dipropylene Glycol 0,63%
Isopropyl Alcohol 0,59%
Olea Europaea Fruit Oil 0,48%
L‐limonene 0,48%
Amyl Cinnamal 0,43%
Paraffinum Liquidum 0,43%
Caprylic/Capric Triglyceride 0,40%
Glycine Soja Oil 0,26%
Parfum 0,26%
Mentha Piperita Oil 0,22%
Olea Europaea Leaf Extract 0,18%
Cananga Odorata Flower Oil 0,16%
Calendula Officinalis Flower Extract
0,16%
D‐limonene 0,16%
Cinnamyl Alcohol 0,15%
Levulinic Acid 0,13%
Anthemis Nobilis Flower Extract 0,13%
Isopropyl Myristate 0,12%
Farnesol 0,12%
Cinnamal 0,12%
Ethoxydiglycol 0,11%
DRAFT

51
Cananga Odorata Flower extr. 0,11%
Melaleuca Alternifolia Leaf Oil 0,10%
Propyl Gallate 0,10%
Pogostemon Cablin Leaf Extract 0,09%
Zingiber Officinale Root Oil 0,08%
Cera Alba 0,07%
Octyldodecanol 0,07%
Vanilla Planifolia Bean Extract 0,07%
Isoeugenol 0,07%
Zingiber Officinale Root Extract 0,07%
Eucalyptus Globulus Leaf Oil 0,07%
Anthemis Nobilis Flower Oil 0,06%
Citronellyl Methylcrotonate25 0,05%
Myristic Acid 0,05%
2‐benzylheptanol 0,05%
Mentha Piperita Herb Oil 0,05%
Aniba Rosaeodora Wood Oil 0,05%
Jasminum Officinale Flower
Extract 0,05%
Anise Alcohol 0,05%
Litsea Cubeba Fruit Oil 0,05%
PPG‐2 Methyl Ether 0,04%
Pinus Sylvestris Twig Leaf Oil 0,04%
Ethyl Linoleate 0,04%
Aniba Rosaeodora Wood Extract 0,04%
Cymbopogon Citratus Leaf Oil 0,04%
Pelargonium Graveolens Oil 0,04%
Ethyl Oleate 0,04%
Calendula Officinalis Flower Oil 0,03%
Heliotropine 0,03%
Arnica Montana Flower Extract 0,03%
Evernia Prunastri Extract 0,03%
Humulus Lupulus Extract 0,03%
Guaiacum Officinale Wood
Extract 0,03%
Ionone 0,03%
Eucalyptus Globulus Leaf Extract 0,03%
Eugenia Caryophyllus Bud Oil 0,02%
Benzyl Acetate 0,02%
Linolenic Acid 0,02%
Others <0,02%
Identification of hazardous substances and analysis of alternatives
Based on the most commonly used substances that perform the same function in each category, the
identification of hazardous substances is based on ingredients inherent properties. The study is
focused on the effects of the ingredients on health and environment measured by the classification
status according to CLP regulation.
The main hazardous substances found in liquid soaps are highlighted in red colour. They are present
mainly in preservatives, solvent and perfuming.
DRAFT

52
Perfume ingredients are the most problematic ingredients regarding health (sensitizing
substances)50. Most frequently recognised allergens fund are: geraniol, coumarin, citral and amyl
cinnamal.
The different substances in the tables show that there are other environmentally preferable
alternatives. See paragraph 9.10 on conclusion for the justification about the hazardousness of the
substances.
9.6. Identification and analysis of alternatives for hazardous substances in solid soaps
For the category of solid soaps, the goal and scope of the analysis of alternatives are the defined in
section 9.2, as they are common for all products included in this product category. 4 183 products
has been found and analyzed.
Raw materials
The top ingredients present in solid soaps are given in Table 29:
Table 29. Top ingredients present in solid soaps
FUNCTION NUMBER OF VARIANTS*
Viscosity Controlling 7.621
Emulsifying 6.192
Cleansing 6.001
Surfactant 5.951
Solvent 5.580
Skin Conditioning 4.856
Masking 3.857
Cosmetic Colorant 3.193
Chelating 3.171
Perfuming 1.812
*Number of different substances that perform the same function
Source: Based on GNPD (Global Database of New Products) results from 2011
50 Nordic Ecolabelling of cosmetic products Version 2.1 • 12 October 2010 – 31 December 2014
DRAFT

53
Figure 7. Top ingredients present in solid soaps. Based on GNPD
Source: Based on GNPD (Global Database of New Products) results from 2011
Identification of variants:
The substances most commonly used that perform the same function are analyzed in the tables
below with the aim to identify hazardous substances and help manufacturers to find an
environmentally better alternative substance:
DRAFT
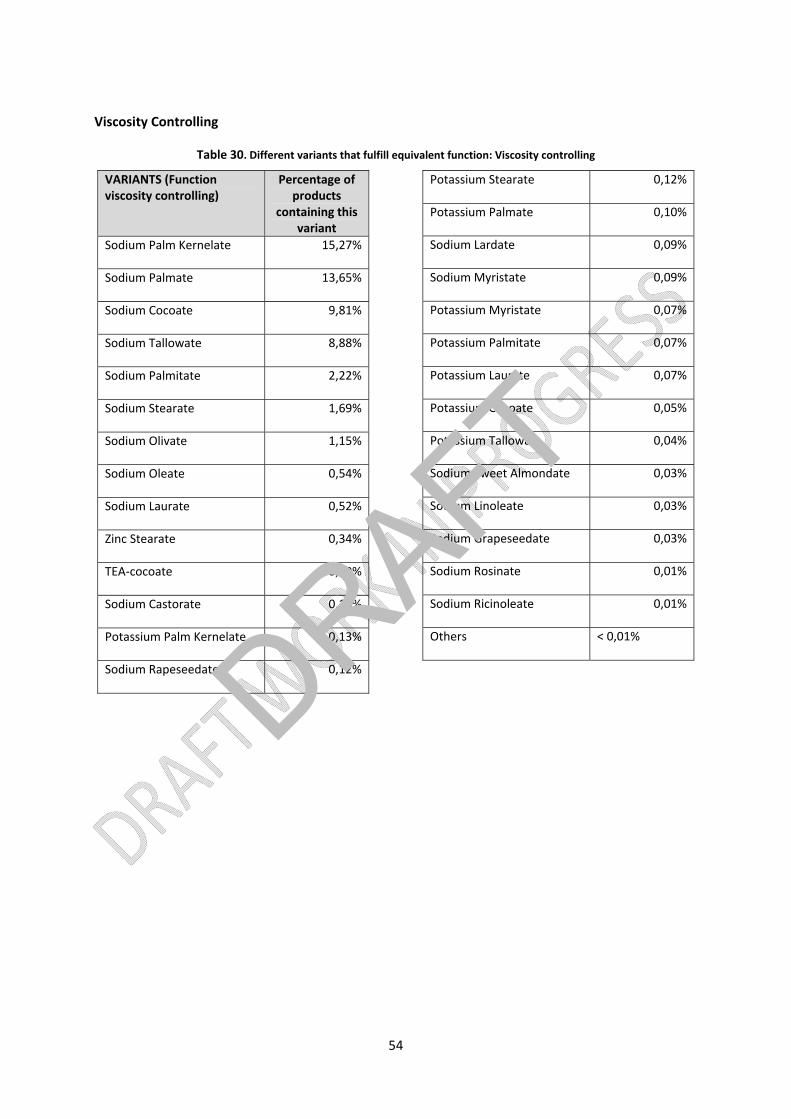
54
Viscosity Controlling
Table 30. Different variants that fulfill equivalent function: Viscosity controlling
VARIANTS (Function viscosity controlling)
Percentage of products
containing this variant
Sodium Palm Kernelate 15,27%
Sodium Palmate 13,65%
Sodium Cocoate 9,81%
Sodium Tallowate 8,88%
Sodium Palmitate 2,22%
Sodium Stearate 1,69%
Sodium Olivate 1,15%
Sodium Oleate 0,54%
Sodium Laurate 0,52%
Zinc Stearate 0,34%
TEA‐cocoate 0,29%
Sodium Castorate 0,13%
Potassium Palm Kernelate 0,13%
Sodium Rapeseedate 0,12%
Potassium Stearate 0,12%
Potassium Palmate 0,10%
Sodium Lardate 0,09%
Sodium Myristate 0,09%
Potassium Myristate 0,07%
Potassium Palmitate 0,07%
Potassium Laurate 0,07%
Potassium Cocoate 0,05%
Potassium Tallowate 0,04%
Sodium Sweet Almondate 0,03%
Sodium Linoleate 0,03%
Sodium Grapeseedate 0,03%
Sodium Rosinate 0,01%
Sodium Ricinoleate 0,01%
Others < 0,01%
DRAFT

55
Chelating agent
Table 31. Different variants that fulfill equivalent function: Chelating agent
VARIANTS (Function chelating agent) Percentage of
products containing
this variant
Tetrasodium EDTA 33,68%
Tetrasodium Etidronate 31,91%
Citric Acid 8,89%
Pentasodium Pentetate 7,73%
Etidronic Acid 7,00%
Sodium Citrate 1,77%
EDTA 1,55%
Disodium EDTA 1,51%
Disodium Etidronate 1,17%
Tetrasodium Glutamate Diacetate 1,07%
Phytic Acid 0,79%
Trisodium EDTA 0,66%
Sodium Gluconate 0,60%
Pentetic Acid 0,25%
Cyclodextrin 0,19%
Trisodium HEDTA 0,13%
Trisodium Etidronate 0,03%
Trisodium NTA 0,03%
Citrus Medica Vulgaris Fruit Extract 0,03%
Others < 0,03%
DRAFT

56
Humectant
Table 32. Different variants that fulfill equivalent function: Humectant
VARIANTS (Function Humectant)
Percentage of
products containing
this variant
Glycerin 31,78%
Propylene Glycol 6,20%
Sorbitol 4,06%
Sodium Lactate 1,57%
Sucrose 1,40%
Mel 1,17%
PEG‐8 0,89%
Butylene Glycol 0,74%
Lactic Acid 0,56%
Sodium PCA 0,47%
PEG‐9 0,41%
Camellia Sinensis Leaf Extract 0,39%
Aloe Barbadensis Leaf Extract 0,35%
PEG‐12 0,27%
Glucose 0,25%
Hydrolyzed Keratin 0,21%
Others < 0,21%
Emulsifying
Table 33. Different variants that fulfill equivalent function: Emulsifying
VARIANTS (Function Emulsifying)
Percentage of
products containing
this variant
Sodium Palm Kernelate 17,62%
Sodium Palmate 15,28%
Sodium Cocoate 10,66%
Sodium Tallowate 10,29%
Palm Kernel Acid 5,96%
Coconut Acid 3,31%
Palm Acid 2,92%
Stearic Acid 2,65%
Sodium Palmitate 2,52%
Sodium Stearate 1,92%
Sodium Laureth Sulfate 1,63%
Lauric Acid 1,07%
Tallow Acid 0,97%
Triethanolamine 0,89%
Lanolin 0,81%
Sodium Olivate 0,78%
Cetearyl Alcohol 0,60%
Sodium Laurate 0,55%
Sodium Lauryl Sulfate 0,48%
Lanolin Alcohol 0,48%
Sodium Oleate 0,47%
Palmitic Acid 0,42%
Cocamide DEA 0,42%
DRAFT
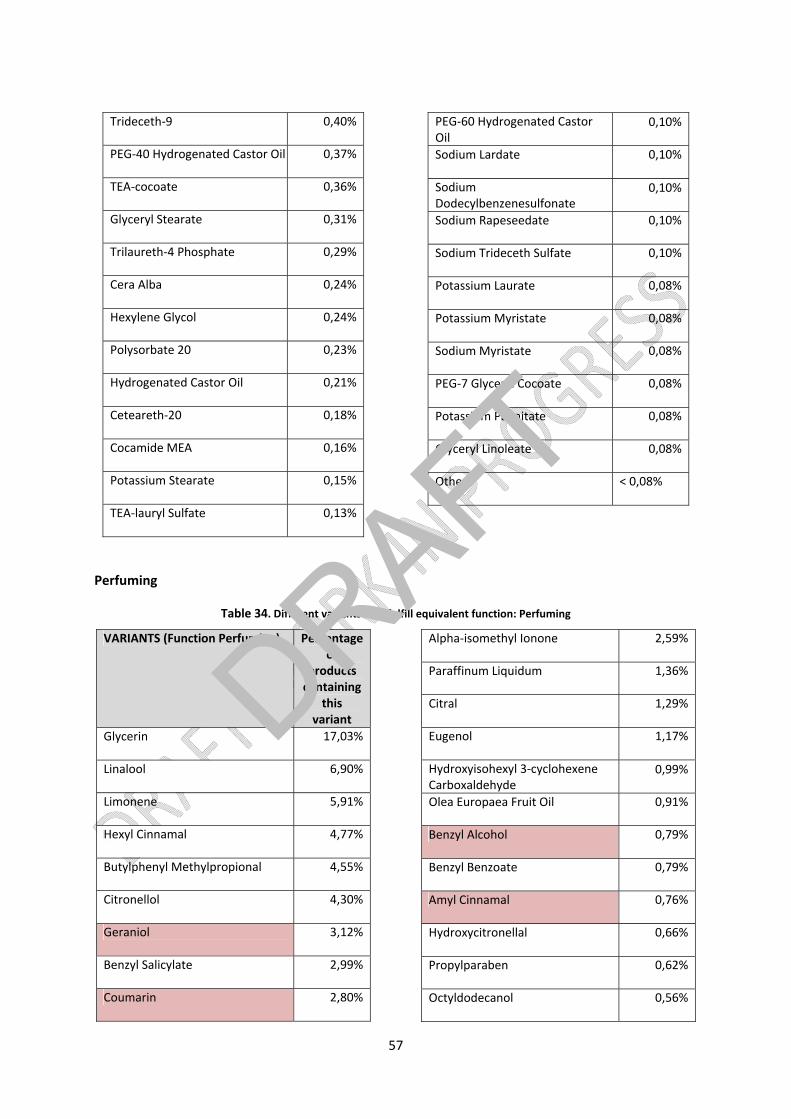
57
Trideceth‐9 0,40%
PEG‐40 Hydrogenated Castor Oil 0,37%
TEA‐cocoate 0,36%
Glyceryl Stearate 0,31%
Trilaureth‐4 Phosphate 0,29%
Cera Alba 0,24%
Hexylene Glycol 0,24%
Polysorbate 20 0,23%
Hydrogenated Castor Oil 0,21%
Ceteareth‐20 0,18%
Cocamide MEA 0,16%
Potassium Stearate 0,15%
TEA‐lauryl Sulfate 0,13%
PEG‐60 Hydrogenated Castor Oil
0,10%
Sodium Lardate 0,10%
Sodium Dodecylbenzenesulfonate
0,10%
Sodium Rapeseedate 0,10%
Sodium Trideceth Sulfate 0,10%
Potassium Laurate 0,08%
Potassium Myristate 0,08%
Sodium Myristate 0,08%
PEG‐7 Glyceryl Cocoate 0,08%
Potassium Palmitate 0,08%
Glyceryl Linoleate 0,08%
Others < 0,08%
Perfuming
Table 34. Different variants that fulfill equivalent function: Perfuming
VARIANTS (Function Perfuming) Percentage of
products containing
this variant
Glycerin 17,03%
Linalool 6,90%
Limonene 5,91%
Hexyl Cinnamal 4,77%
Butylphenyl Methylpropional 4,55%
Citronellol 4,30%
Geraniol 3,12%
Benzyl Salicylate 2,99%
Coumarin 2,80%
Alpha‐isomethyl Ionone 2,59%
Paraffinum Liquidum 1,36%
Citral 1,29%
Eugenol 1,17%
Hydroxyisohexyl 3‐cyclohexene Carboxaldehyde
0,99%
Olea Europaea Fruit Oil 0,91%
Benzyl Alcohol 0,79%
Benzyl Benzoate 0,79%
Amyl Cinnamal 0,76%
Hydroxycitronellal 0,66%
Propylparaben 0,62%
Octyldodecanol 0,56%
DRAFT

58
Glycine Soja Oil 0,56%
L‐limonene 0,44%
Cinnamyl Alcohol 0,40%
Dipropylene Glycol 0,34%
Isopropyl Myristate 0,34%
D‐limonene 0,18%
Cinnamal 0,18%
Cera Alba 0,17%
Isoeugenol 0,17%
Hexylene Glycol 0,17%
Pogostemon Cablin Leaf Extract 0,13%
Cananga Odorata Flower Extract 0,12%
Ethylhexyl Palmitate 0,12%
Paeonia Lactiflora Root Water 0,10%
Melaleuca Alternifolia Leaf Oil 0,10%
Methyl Benzoate 0,09%
Olea Europaea Leaf Extract 0,09%
Parfum 0,09%
Anthemis Nobilis Flower Extract 0,09%
Farnesol 0,08%
Mentha Piperita Oil 0,07%
TBHQ 0,06%
Cinnamomum Zeylanicum Leaf Extract
0,06%
Calendula Officinalis Flower Extract 0,04%
Zingiber Officinale Root Oil 0,04%
Citrus Aurantium Dulcis Peel Extrac 0,04%
Citrus Aurantifolia Peel Extract 0,04%
Others < 0,04%
Colorants
Table 35. Different variants that fulfill equivalent function: Colorants
VARIANTS (Function Perfuming)
Percentage of products containing this variant
CI 77891 35,52%
CI 11680 3,95%
CI 47005 3,79%
CI 19140 3,66%
CI 14700 3,54%
CI 77492 3,41%
CI 12490 3,38%
CI 17200 3,23%
CI 42090 3,10%
CI 77491 2,76%
CI 77499 2,54%
CI 77007 2,51%
CI 15510 2,22%
CI 74160 2,19%
CI 73360 2,10%
CI 74260 1,94%
Others < 1,94%
DRAFT
59
Identification of hazardous substances and analysis of alternatives
Based on the most commonly used substances that perform the same function in solid soaps, the
identification of hazardous substances is based on ingredients inherent properties. The study is
focused on the effects of the ingredients on health and environment. The environmental effects are
measured by the classification status according to CLP regulation.
The main hazardous substances found in solid soaps are highlighted in red colour and are mainly
found among ingredients fulfilling perfuming function. Generally, solid soaps were found to contain
fewer ingredients harmful to the health and the environment than liquid soaps.
Health assessment is focused on known problematic substances such as perfumes. Perfume
ingredients are the most problematic ingredients regarding health (allergies)51. The following most
frequently recognised allergens are: linalool, hexyl cinnamal, citronellol, geraniol, coumarin, amyl
cinnamal and farnesol.
One of the results of the study is that there are other environmentally preferable alternatives.
See paragraph 9.10 on conclusions for the justification about the hazardouness of the substances.
9.7. Identification and analysis of alternatives for hazardous substances in shampoos
For the category of shampoos, the goal and scope of the analysis of alternatives are the defined in
section 9.2, as they are common for all products included in this product category. 13 188 products
has been found and analyzed.
Raw materials
The top ingredients present in shampoos are given in Table 36:
51 Nordic Ecolabelling of cosmetic products Version 2.1 • 12 October 2010 – 31 December 2014
DRAFT

60
Table 36. Top ingredients present in shampoos
FUNCTION NUMBER OF VARIANTS
Skin Conditioning 46.621
Viscosity Controlling 39.183
Surfactant 38.600
Perfuming 35.378
Masking 30.283
Emulsifying 29.265
Preservative 27.426
Antistatic 26.116
Cleansing 24.275
Hair Conditioning 23.392 *Number of different substances that perform the same function
Source: Based on GNPD (Global Database of New Products) results from 2011
Figure 8. Top ingredients present in shampoos
Source: Based on GNPD (Global Database of New Products) results from 2011
Identification of variants:
The substances most commonly used in shampoos that perform the same function are analyzed in
the tables below with the aim to identify hazardous substances and help manufacturers to find an
environmentally better alternative substance with a lower hazard level for a specific function:
DRAFT
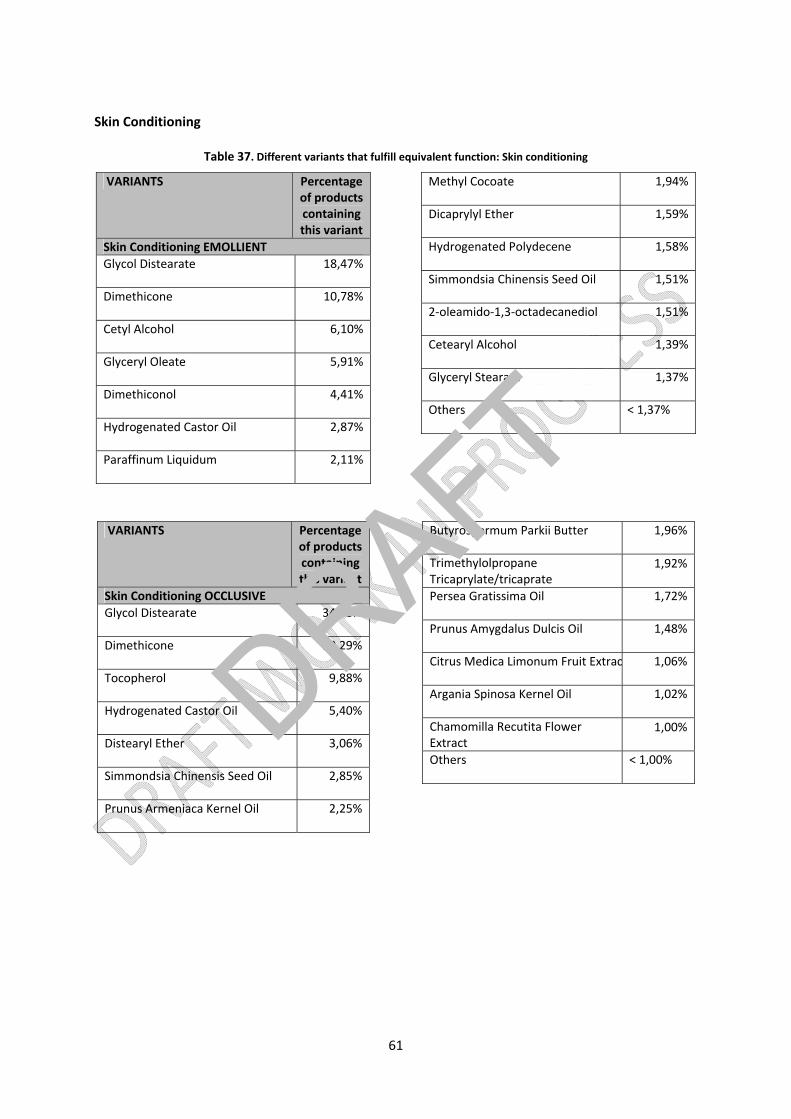
61
Skin Conditioning
Table 37. Different variants that fulfill equivalent function: Skin conditioning
VARIANTS Percentage of products containing this variant
Skin Conditioning EMOLLIENT
Glycol Distearate 18,47%
Dimethicone 10,78%
Cetyl Alcohol 6,10%
Glyceryl Oleate 5,91%
Dimethiconol 4,41%
Hydrogenated Castor Oil 2,87%
Paraffinum Liquidum 2,11%
Methyl Cocoate 1,94%
Dicaprylyl Ether 1,59%
Hydrogenated Polydecene 1,58%
Simmondsia Chinensis Seed Oil 1,51%
2‐oleamido‐1,3‐octadecanediol 1,51%
Cetearyl Alcohol 1,39%
Glyceryl Stearate 1,37%
Others < 1,37%
VARIANTS Percentage of products containing this variant
Skin Conditioning OCCLUSIVE
Glycol Distearate 34,78%
Dimethicone 20,29%
Tocopherol 9,88%
Hydrogenated Castor Oil 5,40%
Distearyl Ether 3,06%
Simmondsia Chinensis Seed Oil 2,85%
Prunus Armeniaca Kernel Oil 2,25%
Butyrospermum Parkii Butter 1,96%
Trimethylolpropane Tricaprylate/tricaprate
1,92%
Persea Gratissima Oil 1,72%
Prunus Amygdalus Dulcis Oil 1,48%
Citrus Medica Limonum Fruit Extrac 1,06%
Argania Spinosa Kernel Oil 1,02%
Chamomilla Recutita Flower Extract
1,00%
Others < 1,00% DRAFT
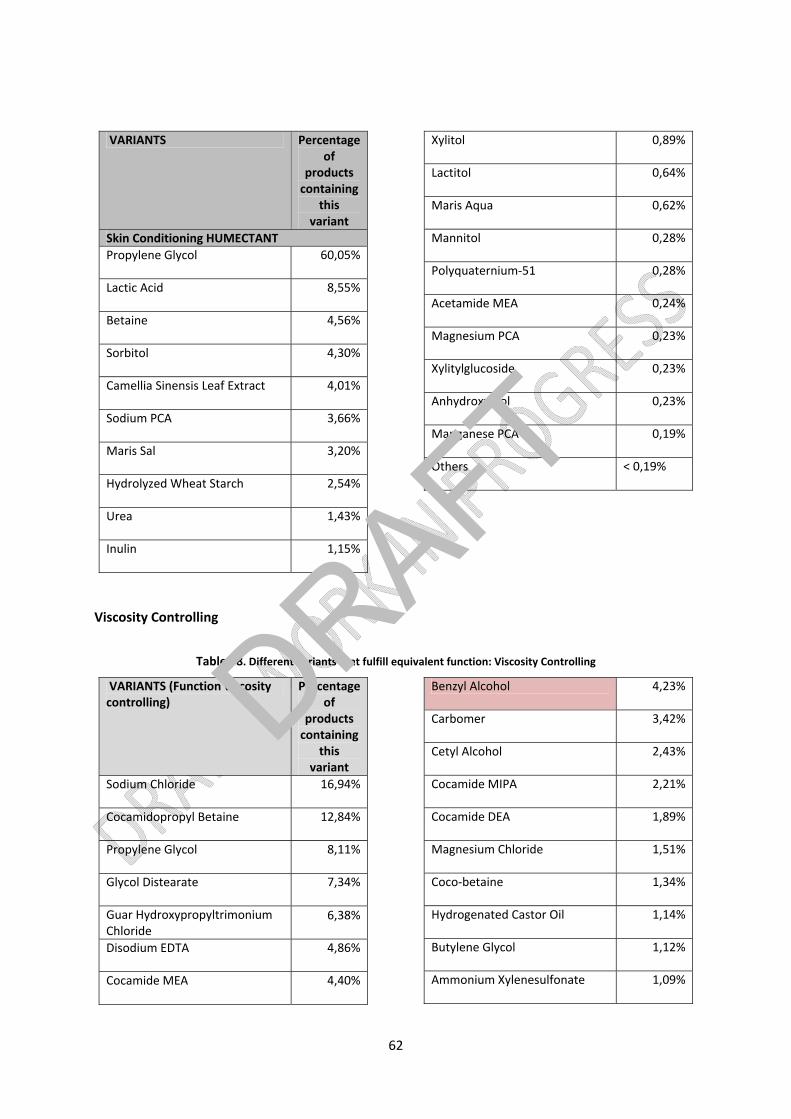
62
VARIANTS Percentage of
products containing
this variant
Skin Conditioning HUMECTANT
Propylene Glycol 60,05%
Lactic Acid 8,55%
Betaine 4,56%
Sorbitol 4,30%
Camellia Sinensis Leaf Extract 4,01%
Sodium PCA 3,66%
Maris Sal 3,20%
Hydrolyzed Wheat Starch 2,54%
Urea 1,43%
Inulin 1,15%
Xylitol 0,89%
Lactitol 0,64%
Maris Aqua 0,62%
Mannitol 0,28%
Polyquaternium‐51 0,28%
Acetamide MEA 0,24%
Magnesium PCA 0,23%
Xylitylglucoside 0,23%
Anhydroxylitol 0,23%
Manganese PCA 0,19%
Others < 0,19%
Viscosity Controlling
Table 38. Different variants that fulfill equivalent function: Viscosity Controlling
VARIANTS (Function viscosity controlling)
Percentage of
products containing
this variant
Sodium Chloride 16,94%
Cocamidopropyl Betaine 12,84%
Propylene Glycol 8,11%
Glycol Distearate 7,34%
Guar Hydroxypropyltrimonium Chloride
6,38%
Disodium EDTA 4,86%
Cocamide MEA 4,40%
Benzyl Alcohol 4,23%
Carbomer 3,42%
Cetyl Alcohol 2,43%
Cocamide MIPA 2,21%
Cocamide DEA 1,89%
Magnesium Chloride 1,51%
Coco‐betaine 1,34%
Hydrogenated Castor Oil 1,14%
Butylene Glycol 1,12%
Ammonium Xylenesulfonate 1,09%
DRAFT

63
PEG‐55 Propylene Glycol Oleate 1,09%
Alcohol Denat. 0,89%
Sodium Lauroyl Sarcosinate 0,65%
Xanthan Gum 0,64%
PEG‐120 Methyl Glucose Dioleate 0,63%
Betaine 0,62%
Dipropylene Glycol 0,56%
Cetearyl Alcohol 0,55%
Alcohol 0,54%
Acrylates Copolymer 0,54%
Magnesium Sulfate 0,51%
PEG‐14M 0,49%
Isopropyl Alcohol 0,46%
PEG‐150 Distearate 0,45%
PEG‐7M 0,43%
Behenyl Alcohol 0,43%
Magnesium Carbonate Hydroxide 0,42%
Butyrospermum Parkii Butter 0,41%
PEG‐4 Rapeseedamide 0,38%
Others < 0,38%
Surfactant
Table 39. Different variants that fulfill equivalent function: Surfactant
VARIANTS (Function surfactant) Percentage of
products containing
this variant
Sodium Laureth Sulfate 15,87%
Cocamidopropyl Betaine 13,03%
Cocamide MEA 4,47%
Coco‐glucoside 3,15%
PEG‐7 Glyceryl Cocoate 2,92%
Cetyl Alcohol 2,47%
Disodium Cocoamphodiacetate 2,40%
Ammonium Lauryl Sulfate 2,31%
Cocamide MIPA 2,25%
Laureth‐4 2,25%
PEG‐40 Hydrogenated Castor Oil 2,15%
Sodium Lauryl Sulfate 2,00%
Ammonium Laureth Sulfate 1,95%
Cocamide DEA 1,92%
Hexylene Glycol 1,85%
Laureth‐2 1,80%
TEA‐dodecylbenzenesulfonate 1,44%
PPG‐5‐ceteth‐20 1,39%
Coco‐betaine 1,36%
Sodium Cocoamphoacetate 1,28%
Polysorbate 20 1,26%
Decyl Glucoside 1,22%
Hydrogenated Castor Oil 1,16%
Disodium Laureth Sulfosuccinate 1,15%
Ammonium Xylenesulfonate 1,11%
Others < 1,11%
DRAFT

64
Perfuming
Table 40. Different variants that fulfill equivalent function: Perfuming
VARIANTS (Function perfuming)
Percentage of products containing this variant
Linalool 9,54%
L‐limonene 7,97%
Glycerin 7,92%
Hexyl Cinnamal 7,37%
Butylphenyl Methylpropional 7,02%
Benzyl Alcohol 4,69%
Benzyl Salicylate 4,17%
Citronellol 4,05%
Propylparaben 3,91%
Glyceryl Oleate 2,61%
Geraniol 2,43%
Alpha‐isomethyl Ionone 2,14%
Hexylene Glycol 2,02%
Hydroxyisohexyl 3‐cyclohexene Carboxaldehyde
1,41%
Coumarin 1,07%
Amyl Cinnamal 0,98%
Paraffinum Liquidum 0,93%
Hydroxycitronellal 0,75%
Benzyl Benzoate 0,74%
Dipropylene Glycol 0,62%
Isopropyl Alcohol 0,51%
Others < 0,51%
Masking
Table 41. Different variants that fulfill equivalent function: Masking
VARIANTS (Function masking) Percentage of products containing this variant
Sodium Chloride 21,92%
Citric Acid 20,30%
Sodium Benzoate 13,66%
Salicylic Acid 3,77%
Sodium Citrate 3,45%
Cetyl Alcohol 3,15%
Butylparaben 2,99%
Laureth‐4 2,86%
Tocopherol 2,69%
Benzoic Acid 1,57%
Butylene Glycol 1,45%
Alcohol Denat. 1,15%
BHT 1,02%
Triethanolamine 0,87%
Menthol 0,83%
Caramel 0,81%
Dipropylene Glycol 0,73%
Others < 0,73%
DRAFT
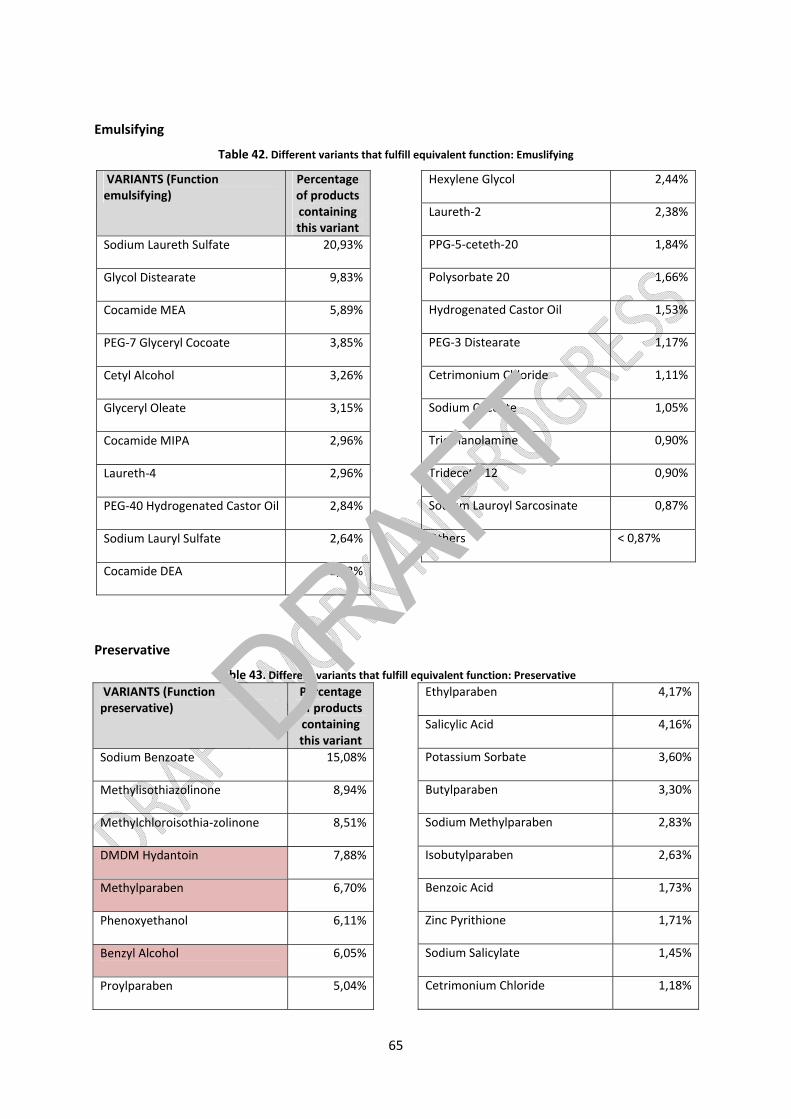
65
Emulsifying
Table 42. Different variants that fulfill equivalent function: Emuslifying
VARIANTS (Function emulsifying)
Percentage of products containing this variant
Sodium Laureth Sulfate 20,93%
Glycol Distearate 9,83%
Cocamide MEA 5,89%
PEG‐7 Glyceryl Cocoate 3,85%
Cetyl Alcohol 3,26%
Glyceryl Oleate 3,15%
Cocamide MIPA 2,96%
Laureth‐4 2,96%
PEG‐40 Hydrogenated Castor Oil 2,84%
Sodium Lauryl Sulfate 2,64%
Cocamide DEA 2,53%
Hexylene Glycol 2,44%
Laureth‐2 2,38%
PPG‐5‐ceteth‐20 1,84%
Polysorbate 20 1,66%
Hydrogenated Castor Oil 1,53%
PEG‐3 Distearate 1,17%
Cetrimonium Chloride 1,11%
Sodium Cocoate 1,05%
Triethanolamine 0,90%
Trideceth‐12 0,90%
Sodium Lauroyl Sarcosinate 0,87%
Others < 0,87%
Preservative
Table 43. Different variants that fulfill equivalent function: Preservative
VARIANTS (Function preservative)
Percentage of products containing this variant
Sodium Benzoate 15,08%
Methylisothiazolinone 8,94%
Methylchloroisothia‐zolinone 8,51%
DMDM Hydantoin 7,88%
Methylparaben 6,70%
Phenoxyethanol 6,11%
Benzyl Alcohol 6,05%
Proylparaben 5,04%
Ethylparaben 4,17%
Salicylic Acid 4,16%
Potassium Sorbate 3,60%
Butylparaben 3,30%
Sodium Methylparaben 2,83%
Isobutylparaben 2,63%
Benzoic Acid 1,73%
Zinc Pyrithione 1,71%
Sodium Salicylate 1,45%
Cetrimonium Chloride 1,18%
DRAFT
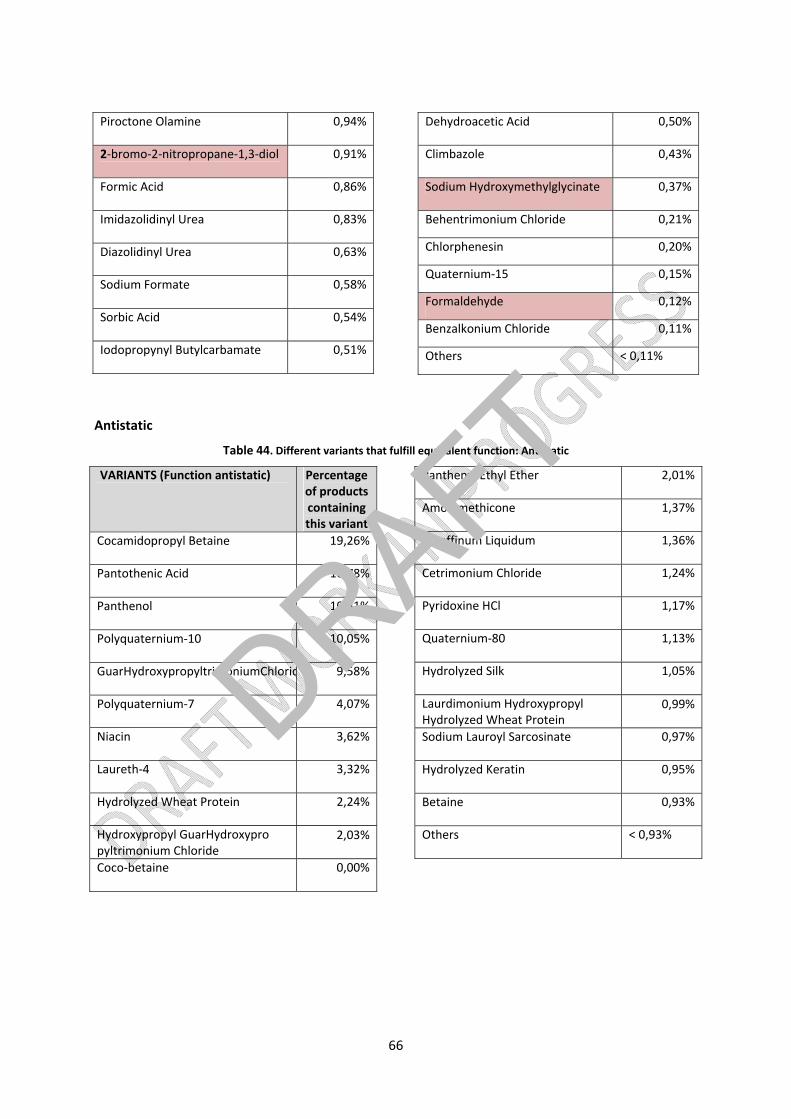
66
Piroctone Olamine 0,94%
2‐bromo‐2‐nitropropane‐1,3‐diol 0,91%
Formic Acid 0,86%
Imidazolidinyl Urea 0,83%
Diazolidinyl Urea 0,63%
Sodium Formate 0,58%
Sorbic Acid 0,54%
Iodopropynyl Butylcarbamate 0,51%
Dehydroacetic Acid 0,50%
Climbazole 0,43%
Sodium Hydroxymethylglycinate 0,37%
Behentrimonium Chloride 0,21%
Chlorphenesin 0,20%
Quaternium‐15 0,15%
Formaldehyde 0,12%
Benzalkonium Chloride 0,11%
Others < 0,11%
Antistatic
Table 44. Different variants that fulfill equivalent function: Antistatic
VARIANTS (Function antistatic) Percentage of products containing this variant
Cocamidopropyl Betaine 19,26%
Pantothenic Acid 10,78%
Panthenol 10,51%
Polyquaternium‐10 10,05%
GuarHydroxypropyltrimoniumChlorid 9,58%
Polyquaternium‐7 4,07%
Niacin 3,62%
Laureth‐4 3,32%
Hydrolyzed Wheat Protein 2,24%
Hydroxypropyl GuarHydroxypro pyltrimonium Chloride
2,03%
Coco‐betaine 0,00%
Panthenyl Ethyl Ether 2,01%
Amodimethicone 1,37%
Paraffinum Liquidum 1,36%
Cetrimonium Chloride 1,24%
Pyridoxine HCl 1,17%
Quaternium‐80 1,13%
Hydrolyzed Silk 1,05%
Laurdimonium Hydroxypropyl Hydrolyzed Wheat Protein
0,99%
Sodium Lauroyl Sarcosinate 0,97%
Hydrolyzed Keratin 0,95%
Betaine 0,93%
Others < 0,93%
DRAFT

67
Cleansing
Table 45. Different variants that fulfill equivalent function: Cleansing
VARIANTS (Function cleansing) Percentage of products containing this variant
Sodium Laureth Sulfate 25,23%
Cocamidopropyl Betaine 20,73%
Coco‐glucoside 5,01%
Disodium Cocoamphodiacetate 3,82%
Ammonium Lauryl Sulfate 3,67%
Sodium Lauryl Sulfate 3,18%
Ammonium Laureth Sulfate 3,09%
Laureth‐2 2,87%
TEA‐dodecylbenzenesulfonate 2,28%
Coco‐betaine 2,17%
Sodium Cocoamphoacetate 2,04%
Decyl Glucoside 1,94%
Disodium Laureth Sulfosuccinate 1,83%
Lauryl Glucoside 1,72%
Sodium Cocoate 1,26%
Sodium Lauroyl Sarcosinate 1,05%
PEG‐200 Hydrogenated Glyceryl Palmate
1,01%
Sodium C12‐13 Pareth Sulfate 0,80%
Laureth‐23 0,76%
Sodium Lauroamphoacetate 0,74%
Laureth‐5 Carboxylic Acid 0,67%
Sodium Cocoyl Glutamate 0,65%
Magnesium Laureth Sulfate 0,55%
Cocamidopropyl Hydroxysultaine 0,54%
Sodium Oleth Sulfate 0,47%
TEA‐lauryl Sulfate 0,47%
Sodium Methyl Cocoyl Taurate 0,44%
Sodium Cocoyl Isethionate 0,42%
Sodium Laureth‐8 Sulfate 0,42%
Magnesium Oleth Sulfate 0,42%
Disodium Cocoyl Glutamate 0,40%
Magnesium Laureth‐8 Sulfate 0,40%
Others < 0,40%
Hair Conditioning
Table 46. Different variants that fulfil equivalent function: Hair conditioning
VARIANTS (Function hair conditioning)
Percentage of products containing this variant
Cocamidopropyl Betaine 21,51%
Pantothenic Acid 12,04%
Panthenol 11,74%
Salicylic Acid 4,88%
Disodium Cocoamphodiacetate 3,96%
Hydrolyzed Wheat Protein 2,51%
Magnesium Nitrate 2,42%
HydroxypropylGuarHydroxypropyl Trimonium Chloride
2,27%
DRAFT

68
Coco‐betaine 0,00%
Sodium Cocoamphoacetate 2,25%
Zinc Pyrithione 2,12%
Panthenyl Ethyl Ether 2,00%
Amodimethicone 1,53%
PEG‐12 Dimethicone 1,52%
Pyridoxine HCl 1,31%
Quaternium‐80 1,27%
Hydrolyzed Silk 1,17%
Laurdimonium Hydroxypropyl HydrolyzedWheat Protein
1,11%
Sodium Lauroyl Sarcosinate 0,00%
Hydrolyzed Keratin 1,09%
Betaine 1,06%
Simmondsia Chinensis Seed Oil 1,03%
Glycine 1,00%
Magnesium Sulfate 0,96%
Sodium PCA 0,85%
Sodium Lauroamphoacetate 0,83%
Arginine 0,77%
Silk Amino Acids 0,76%
Panax Ginseng Extract 0,76%
Biotin 0,73%
Others 0,72%
Identification of hazardous substances and analysis of alternatives
Based on the most commonly used substances that perform the same function in shampoos, the
identification of hazardous substances is based on ingredients inherent properties. The study is
focused on the effects of the ingredients on health and environment. The environmental and human
health effects are measured by the classification status according to CLP regulation.
The main hazardous substances found in shampoos are highlighted in red colour. They are present
mainly in perfuming, masking and preservatives.
Perfume ingredients are the most problematic ingredients regarding health (sensitizing
substances)52. The following most frequently recognised allergens are: geraniol, coumarin and amyl
cinnamal.
The different substances in the tables show that there are other environmentally preferable
alternatives. See paragraph 9.10 on conclusions for the justification about the hazardousness of the
substances.
52 Nordic Ecolabelling of cosmetic products Version 2.1 • 12 October 2010 – 31 December 2014
DRAFT

69
9.8. Identification and analysis of alternatives for hazardous substances in hair conditioners
For the category of hair conditioners, the goal and scope of the analysis of alternatives are the
defined in section 9.2, as they are common for all products included in this product category. 5 327
products has been found and analyzed.
Raw materials
The top ingredients present in hair conditioners are below:
Table 47. Top ingredients present in hair conditioners
FUNCTION NUMBER OF SUBSTANCES*
Skin Conditioning 24.596
Perfuming 16.944
Viscosity Controlling 12.757
Preservative 12.608
Antistatic 12.151
Hair Conditioning 11.912
Solvent 11.510
Surfactant 11.423
Emulsifying 11.048
Masking 9.449 *Number of different substances that perform the same function
Source: Based on GNPD (Global Database of New Products) results from 2011
Figure 9. Top ingredients present in hair conditioners
Source: Based on GNPD (Global Database of New Products) results from 2011
DRAFT

70
Identification of variants:
The substances most commonly used that perform the same function are analyzed in the tables
below with the aim to identify hazardous substances and help manufacturers to find an
environmentally better alternative substance with a lower hazard level for a specific function:
Skin Conditioning
Table 48. Different variants that fulfil equivalent function: Skin conditioning
VARIANTS (Function skin conditioning emollient)
Percentage of
products containing
this variant
Skin Conditioning EMOLLIENT
Cetearyl Alcohol 16,91%
Cetyl Alcohol 9,74%
Dimethicone 7,12%
Stearyl Alcohol 6,08%
Glyceryl Stearate 4,91%
Dimethiconol 4,00%
Cyclopentasiloxane 3,49%
Cetyl Esters 2,82%
Isopropyl Myristate 2,46%
PPG‐1 Trideceth‐6 1,72%
Simmondsia Chinensis Seed Oil 1,70%
Paraffinum Liquidum 1,70%
Propylene Glycol Dicaprylate/dicaprate
1,45%
Cyclomethicone 1,15%
Myristyl Alcohol 1,14%
Helianthus Annuus Seed Oil 1,09%
Olea Europaea Fruit Oil 0,90%
Cyclohexasiloxane 0,86%
Others < 0,86%
VARIANTS (Function skin conditioning occlusive)
Percentage of
products containing
this variant
Skin Conditioning OCCLUSIVE
Dimethicone 29,21%
Tocopherol 11,02%
Simmondsia Chinensis Seed Oil 6,98%
Butyrospermum Parkii Butter 6,05%
Prunus Armeniaca Kernel Oil 4,57%
Persea Gratissima Oil 4,26%
Prunus Amygdalus Dulcis Oil 3,49%
Cocos Nucifera Oil 2,19%
Rosmarinus Officinalis Leaf Extract 2,07%
Glycine Soja Oil 2,07%
Triticum Vulgare Germ Oil 1,91%
Argania Spinosa Kernel Oil 1,88%
Glycol Distearate 1,85%
Caprylic/Capric Triglyceride 1,76%
DRAFT

71
Chamomilla Recutita Flower Extract
1,51%
Phenyl Trimethicone 1,39%
Citrus Medica Limonum Fruit Extract
1,39%
Camelina Sativa Seed Oil 1,33%
Cetyl Palmitate 1,11%
Sesamum Indicum Seed Oil 0,74%
Eucalyptus Globulus Leaf Extract 0,56%
Linum Usitatissimum Seed Oil 0,52%
Others < 0,52%
VARIANTS (Function skin conditioning humectant)
Percentage of
products containing
this variant
Skin Conditioning HUMECTANT
Propylene Glycol 53,45%
Lactic Acid 20,22%
Sorbitol 5,03%
Camellia Sinensis Leaf Extract 4,29%
Hydrolyzed Wheat Starch 4,17%
Sodium PCA 2,61%
Betaine 2,14%
Maris Sal 1,29%
Maris Aqua 0,82%
Urea 0,70%
Inulin 0,62%
Acetamide MEA 0,51%
Morus Alba Leaf Extract 0,19%
Lactose 0,19%
Mannitol 0,16%
Glycyrrhiza Glabra Root Extract 0,16%
Polyquaternium‐51 0,16%
Others < 0,16%
Perfuming
Table 49. Different variants that fulfil equivalent function: Perfuming
VARIANTS (Function perfuming) Percentage of
products containing
this variant
Linalool 9,30%
Hexyl Cinnamal 8,26%
Butylphenyl Methylpropional 7,64%
Glycerin 7,07%
Limonene 6,88%
Benzyl Alcohol 5,72%
Propylparaben 4,58%
Benzyl Salicylate 4,23%
Citronellol 3,39%
Isopropyl Alcohol 3,02%
Isopropyl Myristate 1,91%
DRAFT

72
Geraniol 1,84%
Alpha‐isomethyl Ionone 1,63%
Dipropylene Glycol 1,50%
Paraffinum Liquidum 1,32%
Coumarin 1,20%
Quinoline 1,19%
Hydroxyisohexyl 3‐cyclohexene Carboxaldehyde
1,16%
Hydroxycitronellal 0,97%
Amyl Cinnamal 0,86%
Benzyl Benzoate 0,73%
Olea Europaea Fruit Oil 0,70%
Citral 0,44%
Glyceryl Oleate 0,44%
Glycine Soja Oil 0,39%
Isopropyl Palmitate 0,38%
Caprylic/Capric Triglyceride 0,32%
Eugenol 0,31%
L‐limonene 0,30%
Octyldodecanol 0,27%
Hexylene Glycol 0,27%
Parfum 0,21%
Calendula Officinalis Flower Extract
0,19%
Levulinic Acid 0,12%
Zingiber Officinale Root Extract 0,12%
Others < 0,12%
Viscosity controlling
Table 50. Different variants that fulfil equivalent function: Viscosity controlling
VARIANTS (Function viscosity controlling)
Percentage of
products containing
this variant
Cetearyl Alcohol 17,43%
Propylene Glycol 10,69%
Cetyl Alcohol 10,03%
Benzyl Alcohol 7,60%
Stearyl Alcohol 6,28%
Hydroxyethylcellulose 5,27%
Disodium EDTA 4,78%
Magnesium Chloride 4,16%
Isopropyl Alcohol 4,01%
Sodium Chloride 3,65%
Dipropylene Glycol 2,00%
Butylene Glycol 1,72%
Guar Hydroxypropyltrimonium Chloride
1,58%
Butyrospermum Parkii Butter 1,52%
Cyclomethicone 1,19%
Myristyl Alcohol 1,16%
Oleyl Alcohol 0,85%
Hydrolyzed Wheat Starch 0,84%
Alcohol Denat. 0,82%
DRAFT

73
Dodecene 0,80%
Hydroxypropyl Guar 0,71%
Alcohol 0,65%
Cetyl Hydroxyethylcellulose 0,60%
Hydroxypropyl Methylcellulose 0,55%
Potassium Chloride 0,53%
Silica 0,51%
Xanthan Gum 0,50%
Glycol Distearate 0,47%
Cocamidopropyl Betaine 0,46%
Lauryl Alcohol 0,43%
PEG‐2m 0,43%
Betaine 0,42%
Coco‐betaine 0,38%
Sodium Sulfate 0,35%
PEG‐150 Distearate 0,35%
Cocamide MEA 0,34%
PVP 0,33%
Behenyl Alcohol 0,31%
Paraffin 0,31%
PEG‐14M 0,27%
Triethylene Glycol 0,24%
Potato Starch Modified 0,24%
Hydroxypropyl Starch Phosphate 0,23%
Sodium Polyacrylate 0,15%
Dextrin 0,14%
Others < 0,14%
Preservatives
Table 51. Different variants that fulfil equivalent function: Preservatives
VARIANTS (Function preservatives)
Percentage of
products containing
this variant
Cetrimonium Chloride 11,60%
Phenoxyethanol 10,46%
Methylparaben 9,98%
Behentrimonium Chloride 8,23%
Benzyl Alcohol 7,69%
Methylisothiazolinone 7,35%
Methylchloroisothiazolinone 6,96%
Propylparaben 6,15%
Sodium Benzoate 4,54%
Potassium Sorbate 3,62%
DMDM Hydantoin 3,29%
Ethylparaben 3,27%
Butylparaben 2,59%
Isobutylparaben 2,24%
Chlorhexidine Dihydrochloride 1,67%
Chlorhexidine Digluconate 1,03%
Sodium Methylparaben 1,03%
DRAFT

74
Imidazolidinyl Urea 1,02%
Diazolidinyl Urea 0,86%
Iodopropynyl Butylcarbamate 0,78%
Stearalkonium Chloride 0,75%
Benzoic Acid 0,64%
Salicylic Acid 0,48%
Zinc Pyrithione 0,48%
Sorbic Acid 0,44%
Dehydroacetic Acid 0,39%
2‐bromo‐2‐nitropropane‐1,3‐diol 0,36%
Steartrimonium Chloride 0,23%
Chlorphenesin 0,21%
Cetrimonium Bromide 0,20%
Piroctone Olamine 0,18%
Others < 0,18%
Antistatic Table 52. Different variants that fulfil equivalent function: Antistatic
VARIANTS (Function antistatic) Percentage of
products containing
this variant
Cetrimonium Chloride 12,15%
Pantothenic Acid 11,04%
Panthenol 10,79%
Behentrimonium Chloride 8,66%
Stearamidopropyl Dimethylamine 8,44%
Amodimethicone 5,32%
Niacin 3,12%
Distearoylethyl Hydroxyethylmonium Methosulfate
2,94%
Hydrolyzed Wheat Protein 2,58%
Polyquaternium‐37 2,43%
Glutamic Acid ( 2,15%
Paraffinum Liquidum 1,86%
Panthenyl Ethyl Ether 1,74%
DRAFT

75
Guar Hydroxypropyltrimonium Chloride
1,66%
Quaternium‐18 1,47%
Hydrolyzed Keratin 1,41%
Behentrimonium Methosulfate 1,32%
Quaternium‐80 1,28%
Cyclomethicone 1,26%
Others < 1,26%
Hair conditioning
Table 53. Different variants that fulfil equivalent function: Hair conditioning
VARIANTS (Function hair conditioning)
Percentage of
products containing
this variant
Pantothenic Acid 11,26%
Panthenol 11,01%
Behentrimonium Chloride 8,83%
Stearamidopropyl Dimethylamine 8,61%
Amodimethicone 5,42%
Magnesium Nitrate 4,52%
Cyclopentasiloxane 3,89%
Distearoylethyl HydroxyethylmoniumMethosulfate
3,00%
Hydrolyzed Wheat Protein 2,64%
Glutamic Acid 2,19%
Simmondsia Chinensis Seed Oil 1,90%
Panthenyl Ethyl Ether 1,78%
Bis‐aminopropyl Dimethicone 1,75%
Quaternium‐87 1,75%
Quaternium‐18 1,50%
Hydrolyzed Keratin 1,44%
Behentrimonium Methosulfate 1,34%
Quaternium‐80 1,30%
Others < 1,30%
DRAFT

76
Surfactant
Table 54. Different variants that fulfil equivalent function: Surfactant
VARIANTS (Function surfactant) Percentage of
products containing
this variant
Cetearyl Alcohol 19,65%
Cetrimonium Chloride 12,92%
Cetyl Alcohol 11,32%
Stearamidopropyl Dimethylamine 8,98%
Stearyl Alcohol 7,07%
Ceteareth‐20 4,48%
Trideceth‐12 2,43%
PPG‐1 Trideceth‐6 2,00%
Quaternium‐87 1,82%
Trideceth‐6 1,63%
Quaternium‐18 1,57%
Polysorbate 60 1,47%
TEA‐dodecylbenzenesulfonate 1,44%
Behentrimonium Methosulfate 1,40%
PEG‐40 Hydrogenated Castor Oil 1,06%
Poloxamer 407 0,91%
Trideceth‐10 0,87%
Stearalkonium Chloride 0,82%
Others < 0,82%
Emulsifying
Table 55. Different variants that fulfil equivalent function: Emulsifying
VARIANTS (Function emulsifying) Percentage of
products containing
this variant
Cetearyl Alcohol 20,32%
Cetrimonium Chloride 13,36%
Cetyl Alcohol 11,70%
Stearamidopropyl Dimethylamine 9,29%
Stearyl Alcohol 7,31%
Glyceryl Stearate 5,90%
Ceteareth‐20 4,63%
Trideceth‐12 2,52%
Trideceth‐6 1,68%
Polysorbate 60 1,52%
PEG‐40 Hydrogenated Castor Oil 1,10%
Oleyl Alcohol 0,99%
Poloxamer 407 0,94%
Lecithin 0,72%
Polysorbate 20 0,71%
Dicetyldimonium Chloride 0,71%
Glyceryl Oleate 0,70%
Behenamidopropyl Dimethylamine 0,70%
Xanthan Gum 0,58%
DRAFT
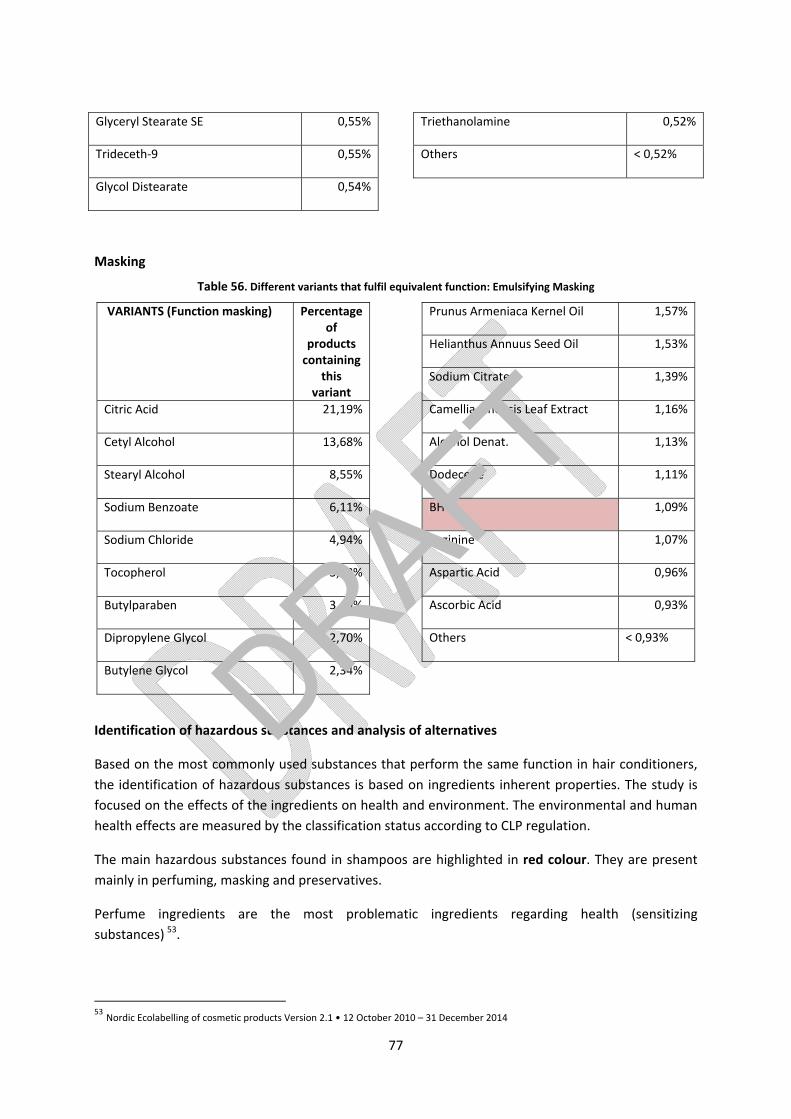
77
Glyceryl Stearate SE 0,55%
Trideceth‐9 0,55%
Glycol Distearate 0,54%
Triethanolamine 0,52%
Others < 0,52%
Masking
Table 56. Different variants that fulfil equivalent function: Emulsifying Masking
VARIANTS (Function masking) Percentage of
products containing
this variant
Citric Acid 21,19%
Cetyl Alcohol 13,68%
Stearyl Alcohol 8,55%
Sodium Benzoate 6,11%
Sodium Chloride 4,94%
Tocopherol 3,78%
Butylparaben 3,49%
Dipropylene Glycol 2,70%
Butylene Glycol 2,34%
Prunus Armeniaca Kernel Oil 1,57%
Helianthus Annuus Seed Oil 1,53%
Sodium Citrate 1,39%
Camellia Sinensis Leaf Extract 1,16%
Alcohol Denat. 1,13%
Dodecene 1,11%
BHT 1,09%
Arginine 1,07%
Aspartic Acid 0,96%
Ascorbic Acid 0,93%
Others < 0,93%
Identification of hazardous substances and analysis of alternatives
Based on the most commonly used substances that perform the same function in hair conditioners,
the identification of hazardous substances is based on ingredients inherent properties. The study is
focused on the effects of the ingredients on health and environment. The environmental and human
health effects are measured by the classification status according to CLP regulation.
The main hazardous substances found in shampoos are highlighted in red colour. They are present
mainly in perfuming, masking and preservatives.
Perfume ingredients are the most problematic ingredients regarding health (sensitizing
substances) 53.
53 Nordic Ecolabelling of cosmetic products Version 2.1 • 12 October 2010 – 31 December 2014
DRAFT

78
The different substances in the tables show that there are other environmentally preferable
alternatives. See paragraph 9.10 on conclusions for the justification about the hazardousness of the
substances.
9.9. Identification and analysis of alternatives for hazardous substances in packaging
For the packaging a sample of 13 700 products has been analysed in GNPD Mintel Database to
determine the most used materials and formats of packaging. The most usual shape of the primary
packaging is a bottle (83% of products). The shares of various materials used are presented in Table
58.
Related to materials used, the following data has been found:
Table 57. Shares of materials used for primary packaging of
liquid soaps, shampoos and hair conditioners
Material Percentage
PE plastic 34.74%
PET plastic 25.38%
PP plastic 14.67%
PVC plastic 1.18%
HDPE plastic 4.04%
Plastic (generic) 17.20%
Others materials 2.79%
For liquid soaps, shampoos and hair conditioners, packaging is made usually of different kinds of
plastics. Therefore, a comparative assessment of different materials: PVC54, PET55, PE56 , PP57 and
biopolymer has been done58. For solid soaps products, packaging is usually made of paper.
In accordance with the information given at the PlasticsEurope website the following substances
included in the Candidate list are used in plastic materials59:
54 PVC: Polyvinyl chloride 55 PET: Polyethylene terephthalate 56 PE: Polyethylene 57 PP: Polypropylene
58 See paragraph 10.9 of the document 59 http://www.plasticseurope.org/plastics‐sustainability/consumer‐protection/reach.aspx
DRAFT

79
Table 58. Substances included in the Candidate list used in plastic materials
Name of substance Plastics involved EC number CAS number
Reason for inclusion in Candidate List
2,4‐Dinitrotoluene Monomer 204‐450‐0 121‐14‐2 Carcinogenic (article 57a)
4,4'‐ Diaminodiphenylmethane (MDA)
Monomer 202‐974‐4 101‐77‐9 Carcinogenic (article 57a)
Acrylamide PA Monomer
201‐173‐7 79‐06‐1 Carcinogenic and mutagenic (articles 57 a and 57 b)
Alkanes, C10‐13, chloro (Short Chain Chlorinated Paraffins)
PVC 287‐476‐5 85535‐84‐8 PBT and vPvB (articles 57 d and 57 e)
Benzyl butyl phthalate (BBP) PVC PP catalysts
201‐622‐7 85‐68‐7 Toxic for reproduction (article 57c)
Bis (2‐ethylhexyl)phthalate (DEHP)
PVC PP catalysts
204‐211‐0 117‐81‐7 Toxic for reproduction (article 57c)
Chromium trioxide HDPE catalysts 215‐607‐8 1333‐82‐0 CMR
Dibutyl phthalate (DBP) PVC PP catalysts
201‐557‐4 84‐74‐2 Toxic for reproduction (article 57c)
Diisobutyl phthalate PVC PP catalysts
201‐553‐2 84‐69‐5 Toxic for reproduction (article 57c)
Hexabromocyclododecane (HBCDD) and all major diastereoisomers
Flame RetardantEPS, XPS
247‐148‐4 221‐695‐9
25637‐99‐4 PBT (article 57d)
Lead chromate Pigment 231‐846‐0 7758‐97‐6 Carcinogenic and toxic for reproduction (articles 57 a and 57 c)
Lead chromate molybdate sulphate red (C.I. Pigment Red 104)
Pigment 235‐759‐9 12656‐85‐8 Carcinogenic and toxic for reproduction (articles 57 a and 57 c)
Lead sulfochromate yellow (C.I. Pigment Yellow 34)
Pigment 215‐693‐7 1344‐37‐2 Carcinogenic and toxic for reproduction (articles 57 a and 57 c)
Tris(2‐chloroethyl)phosphate Flame Retardant, plasticiser
204‐118‐5 115‐96‐8 Toxic for reproduction (article 57c)
Based on this list, requirements regarding plastic materials used are as follows:
o Plastic packaging: shall not contain any substances included in the candidate list of
Substances of Very High Concern (SVHC) for authorization: benzyl butyl phthalate, bis (2‐
ethylhexyl)phthalate, Dibutyl phthalate and Diisobutyl phthalate, monomers such as: 2,4‐
Dinitrotoluene, 4,4'‐Diaminodiphenylmethane, Acrylamide, flame retardants:
Hexabromocyclododecane (HBCDD) and all major diastereoisomers, Tris(2‐
chloroethyl)phosphate, Short Chain Chlorinated Paraffins: Alkanes, C10‐13, chloro,
Chromium trioxide, pigments: Lead chromate, Lead chromate molybdate sulphate red (C.I.
Pigment Red 104) and Lead sulfochromate yellow (C.I. Pigment Yellow 34).
Stakeholders´feedback is asked to determine if some of these substance are used in the
packaging of the products under study.
Further, a requirement regarding paper packaging is given:
o Paper/carboard packaging: Chlorine should not be used to bleach.
Chlorine gas is classified as60 H400 (very toxic to aquatic life), H315 (causes skin irritation),
H319 (causes serious eye irritation), H331 (Toxic if inhaled) and H335 (may cause
60 http://apps.echa.europa.eu/registered/data/dossiers/DISS‐a6516d11‐7da2‐57f1‐e044‐00144f67d249/AGGR‐585ca394‐3912‐4434‐bd0f‐a9a1fddbe4e8_DISS‐a6516d11‐7da2‐57f1‐e044‐00144f67d249.html#section_1.1
DRAFT

80
respiratory irritation). Chlorine bleaching process produces highly toxic and persistent
organochlorines such as dioxin. Dioxins are recognized as a persistent environmental
pollutant, regulated internationally by the Stockholm Convention on Persistent Organic
Pollutants61.
9.10. Conclusions on identification and analysis of alternatives for hazardous substances
In this analysis information on some of the most commonly used substances in soaps, shampoos, hair
conditioners and packaging have been provided. Based on the information obtained from ESIS, ECHA,
CLP, scientific literature62 and other ecolabels, a priority list of hazardous substances which are
determined to pose the most significant potential threat to human health and environment has been
prepared.
The identification of hazardous substances is based on ingredients inherent properties. The
environmental and human health effects are measured by the classification status according to CLP
regulation.
In conclusion, the main hazardous substances that should be considered to be excluded from
ecolabelled products are:
Hazardous substances: According to the Article 6(6) of EU Ecolabel legislation EC/66/201063,
the product or any part of it thereof shall not contain substances or mixtures meeting the
criteria for classification as toxic, hazardous to the environment, carcinogenic, mutagenic or
toxic for reproduction (CMR), in accordance with CLP Regulation (EC) No 1272/2008, nor to
goods containing substances referred to in Article 57 of REACH Regulation.
Hazardous substances can be classified through the hazard statements provided in Annex I.
Substances considered PBT (persistent, bioaccumulativ and toxic) and vPvB (very persistent
and very bioaccumulativ) and/or those having endocrine disrupting properties according to
article 57 of REACH regulation should be prohibited.
Substances included in the candidate list64 of Substances of Very High Concern (SVHC) for
authorization should be prohibited. Currently there are 73 substances in the candidate list.
Some specific substances that should be restricted are:
Triclosan (5‐chloro‐2‐(2,4‐dichlorophenoxy)phenol ) ‐ Triclosan65 is a preservative added to
soaps, hair conditioners and shaving cream products. Triclosan is classified as an agent that
may cause adverse environmental effects66. Based on its classification67, triclosan should be
61 http://chm.pops.int/Convention/ThePOPs/ListingofPOPs/tabid/2509/Default.aspx. 62 Risk Assessments reports 63 http://eur‐lex.europa.eu/LexUriServ/LexUriServ.do?uri=OJ:L:2010:027:0001:0019:EN:PDF. 6473 substances in the Candidate List http://echa.europa.eu/chem_data/authorisation_process/candidate_list_table_en.asp#download. 65 http://ec.europa.eu/health/ph_risk/committees/04_sccp/docs/sccp_o_166.pdf. 66 http://vkm.no/dav/117573d6c4.pdf.
DRAFT

81
prohibited: H410: very toxic to aquatic life with long lasting effects, H315: causes skin
irritation and H319: causes serious eye irritation. Some other studies68 have shown that the
use of triclosan in cosmetic products from a toxicological point of view is also a matter of
concern.
Formaldehyde ‐ Formaldehyde is used as a preservative. Formaldehyde is a known sensitizer
and a known carcinogen, based on its classification69 should be prohibited: H351: suspected
of causing cancer, H301: toxic if swallowed, H311: toxic in contact with skin, H331: toxic if
inhaled; H314: causes severe skin burns and eye damage and H317: may cause an allergic
skin reaction.
Formaldehyde is already regulated and specifically excluded in Ecolabelling criteria for Thai
Green Label.
Formaldehyde releasers: Bronopol (2‐Bromo‐2‐Nitropropane‐1, 3‐Diol), 5‐bromo‐5‐nitro‐1,
3‐dioxane, sodium hydroxyl methyl glycinate, DMDM Hydantoin, Diazolidinyl Urea and
Imidazolidinyl Urea – Formaldehyde releasers are used as preservatives that decompose to
form formaldehyde upon degradation. The amount of formaldehyde released can be above
the classification limits for formaldehyde70. There are some studies that demonstrate that
people exposed to formaldehyde releasers may experience an allergic reaction71.
Fragrance ‐ Fragrance is a sensitizer and a known trigger of allergic reactions such as asthma
and contact dermatitis72. In 1999, the Scientific Commitee on Cosmetic Products and Non
Food products intended for consumers (SCCP) based on criteria restricted to dermatological
data reflecting the clinical experience73, identified a list with the 13 most frequently reported
contact allergens.
Sensitizing substances classified as H334 (R42): respiratory sensitization and/or H317 (R43):
skin sensitization or is one of the 13 fragances mentioned in the following table, are
proposed to be restricted to 0.01% (100 ppm) in rinse‐off products.
67 http://apps.echa.europa.eu/registered/data/dossiers/DISS‐9ea3b5cc‐80fb‐15ea‐e044‐00144f67d031/AGGR‐09e9b0f0‐bf29‐4975‐8fbe‐a3a2dd0ac2be_DISS‐9ea3b5cc‐80fb‐15ea‐e044‐00144f67d031.html#L‐137752f6‐fbea‐4638‐b8d8‐
acce5e212979. 68 http://vkm.no/dav/117573d6c4.pdf. 69 http://apps.echa.europa.eu/registered/data/dossiers/DISS‐9d8ad2a1‐0d51‐13f7‐e044‐00144f67d249/AGGR‐aa1957ab‐42e8‐43c6‐856d‐09b14245e171_DISS‐9d8ad2a1‐0d51‐13f7‐e044‐00144f67d249.html#L‐9cf4f64b‐5725‐4012‐aad3‐657063a4f5b6. 70 Final report. EU Eco‐label for shampoo and soaps. Ecolabelling Norway. Eskeland,, M.B, Svanes, E. May 2006. 71 http://share.eldoc.ub.rug.nl/FILES/root2/2010/Formretof/de_Groot_2010_Contact_Dermatitis.pdf 72 http://www.rivm.nl/bibliotheek/rapporten/320025001.pdf 73 http://ec.europa.eu/health/archive/ph_risk/committees/sccp/documents/out93_en.pdf.
DRAFT

82
Table 59. Fragrances chemicals most frequently reported as contact allergens
SUBSTANCES CAS No
Amyl cinnamal 122-40-7
Amylcinnamyl alcohol 101-85-9
Benzyl alcohol 100‐51‐6
Benzyl salicylate 118‐58‐1
Cinnamyl alcohol 104‐54‐1
Cinnamal 104‐55‐2
Citral 5392‐40‐5
Coumarin 91‐64‐5
Eugenol 97‐53‐0
Geraniol 106‐24‐1
Hydroxycitronellal 107‐75‐5
Hydroxymethylpentylcyclohexenecarboxaldehyde 31906‐04‐4
Isoeugenol 97‐54‐1
Nordic Swan74 restricts the use of multiple fragrances in their criteria for shampoo,
conditioners, body shampoo, liquid and solid soap.
Phthalates ‐ Some phthalates can be found in rinse‐off cosmetic formulations. It is assumed
that they are added in the perfume mix. Phthalates such as Bis(2‐methoxyethyl) phthalate,
diisobutyl phthalate, dibutyl phthalate (DBP), benzyl butyl phthalate (BBP) and bis (2‐
ethylhexyl)phthalate (DEHP), should be prohibited because they are classified as toxic for
reproduction and present in the candidate list of Substances of Very High Concern for
authorisation according to REACH regulation.
On February 17, 2011 the European Comission named 6 chemicals as the first entrants on the
Authorization list75, known as Annex XIV, which means that the next substances: dibutyl
phthalate (DBP), benzyl butyl phthalate (BBP) and bis (2‐ethylhexyl)phthalate (DEHP) were
moved from the candidate list to the authorisation list under the EU´s REACH regulation.
74 Nordic Ecolabelling of cosmetic products Version 2.1 • 12 October 2010 – 31 December 2014 75 COMMISSION REGULATION (EU) No 143/2011 of 17 February 2011 amending Annex XIV to Regulation (EC) No 1907/2006
of the European Parliament and of the Council on the Registration, Evaluation, Authorisation and Restriction of Chemicals
(‘REACH’) http://eur lex.europa.eu/LexUriServ/LexUriServ.do?uri=CONSLEG:2011R0143:20110221:EN:PDF
DRAFT

83
Table 60. Substances subjected to authorization, Annex XIV of REACH regulation
Substance name EC
Number
CAS
Number
Classification
Bis(2‐methoxyethyl)
phthalate76
204‐212‐6 117‐82‐8 Toxic for reproduction (article 57 c)
Diisobutyl phthalate77 201‐553‐2 84‐69‐5 Toxic for reproduction (article 57c)
Dibutyl phthalate (DBP)78 201‐557‐4 84‐74‐2 Toxic for reproduction (article 57c)
Benzyl butyl phthalate (BBP)79 201‐622‐7 85‐68‐7 Toxic for reproduction (article 57c)
Bis (2‐ethylhexyl)phthalate
(DEHP)80
204‐211‐0 117‐81‐7 Toxic for reproduction (article 57c)
Ethyl‐, methyl‐, propyl‐ and butyl‐Parabens ‐ Parabens are used as preservatives. In 1999,
the European Union adopted a Strategy on Endocrine Disrupters and committed significant
resources to develop and classifiy a priority list of suspected endocrine disrupting
chemicals81. A candidate list with 553 substances with evidence of endocrine disruption was
reviewed and classified in three categories: Category 1‐ evidence of endocrine disrupting
activity in at least one species using intact animals; Category 2 ‐ at least some in vitro
evidence of biological activity related to endocrine disruption; Category 3 ‐ no evidence of
endocrine disrupting activity or no data available. Ethyl‐, methyl‐, propyl‐ and butyl‐
parabens are all categorised as potential endocrine disrupters (Category 1) under the EU
strategy for endocrine disrupters. Safer alternatives to parabens exist82, and around 5,4% of
products are now marketed as “paraben‐free”.
76 Support document for identification of Bis(2‐methoxyethyl) phthalate as a substance of very high concern: http://echa.europa.eu/documents/10162/d60da5c8‐85de‐4cb2‐b95a‐fada9451373b 77 Support document for identification of Bis(2‐methoxyethyl) phthalate as a substance of very high concern: http://echa.europa.eu/documents/10162/d418f8b0‐ba93‐402a‐97fd‐1e340d22c541 78 Support document for identification of Bis(2‐methoxyethyl) phthalate as a substance of very high concern: http://echa.europa.eu/documents/10162/5196d655‐7b11‐41b2‐acba‐c8709064fac8 79 Support document for identification of Bis(2‐methoxyethyl) phthalate as a substance of very high concern: http://echa.europa.eu/documents/10162/19fd114d‐eb69‐4012‐a107‐8ceb97787733 80 Support document for identification of Bis(2‐methoxyethyl) phthalate as a substance of very high concern: http://echa.europa.eu/documents/10162/b8395d41‐b6d5‐427c‐8294‐d46997e8835d 81 http://ec.europa.eu/environment/endocrine/strategy/short_en.htm 82 See table with different variants that fulfil equivalent function: preservatives
DRAFT

84
Ethyl‐, methyl‐, propyl‐ and butyl‐ Parabens are proposed to be prohibited or restricted
based on precautionary principle.
D4 (octamethylcyclotetrasiloxane) CAS 556‐67‐2 is used as an emollient or solvent although
is not in the list of most commonly used substances. Based on its classification83 H413: may
cause long lasting harmful effects to aquatic life, H361: suspected of damaging fertility or the
unborn child and H226: flammable liquid and vapour, should be prohibited. It is prohibited
from Nordic Ecolabelled products since they are generally considered to be persistent in the
environment. In Canada, D4 has been added to “List of Toxic Substances in Schedule 1 of
CEPA 1999”, which means they are considered toxic and are subject to governmental
regulation.
Butylated Hydroxy Toluene (BHT, CAS 128‐37‐0) – Butylated Hydroxy Toluene (BHT) is used
as an antioxidant in cosmetic products. BHT is classified as H410 (R50/53) very toxic to
aquatic life with long lasting effects84.
Based on their classification, it should be prohibited.
Packaging requirements in function of the material used: plastic, metal, paper, cardboard
and related to the environmental performance of the material:
o Plastic: shall not contain the next substances included in the candidate list of
Substances of Very High Concern (SVHC) for authorization: phthalates: benzyl butyl
phthalate, bis (2‐ethylhexyl)phthalate, Dibutyl phthalate and Diisobutyl phthalate,
monomers such as: 2,4‐Dinitrotoluene, 4,4'‐Diaminodiphenylmethane, Acrylamide,
flame retardants: Hexabromocyclododecane (HBCDD) and all major
diastereoisomers, Tris(2‐chloroethyl)phosphate, Short Chain Chlorinated Paraffins:
Alkanes, C10‐13, chloro, Chromium trioxide, pigments: Lead chromate, Lead
chromate molybdate sulphate red (C.I. Pigment Red 104) and Lead sulfochromate
yellow (C.I. Pigment Yellow 34).
o Paper/carboard packaging: Chlorine shall not be used to bleach. Chlorine gas is
classified as85 H400 (very toxic to aquatic life), H315 (causes skin irritation), H319
(causes serious eye irritation), H331 (Toxic if inhaled) and H335 (may cause
respiratory irritation). Chlorine bleaching process produces highly toxic and
persistent organochlorines such as dioxin. Dioxins are recognized as a persistent
environmental pollutant, regulated internationally by the Stockholm Convention on
83 http://apps.echa.europa.eu/registered/data/dossiers/DISS‐9d9d2de7‐dd46‐653e‐e044‐00144f67d249/AGGR‐d50b7533‐2f91‐4049‐9110‐98ba0524a880_DISS‐9d9d2de7‐dd46‐653e‐e044‐00144f67d249.html#L‐03cd909b‐6f8e‐4aee‐9d90‐52aa86e337e2. 84 http://apps.echa.europa.eu/registered/data/dossiers/DISS‐9d82f461‐e7b6‐3a89‐e044‐00144f67d249/AGGR‐51b3c77a‐ec07‐4b3e‐a1e2‐870ae9e21d5e_DISS‐9d82f461‐e7b6‐3a89‐e044‐00144f67d249.html#L‐abb9496c‐aaa4‐455b‐8305‐187c411b237d.
85 http://apps.echa.europa.eu/registered/data/dossiers/DISS‐a6516d11‐7da2‐57f1‐e044‐00144f67d249/AGGR‐585ca394‐3912‐4434‐bd0f‐a9a1fddbe4e8_DISS‐a6516d11‐7da2‐57f1‐e044‐00144f67d249.html#section_1.1.
DRAFT

85
Persistent Organic Pollutants86. According to EU Ecolabel for tissue paper87 and for
copying and graphic paper88, chlorine gas shall not be use as a bleaching agent.
86 http://chm.pops.int/Convention/ThePOPs/ListingofPOPs/tabid/2509/Default.aspx. 87 http://eur‐lex.europa.eu/LexUriServ/LexUriServ.do?uri=OJ:L:2009:197:0087:0095:EN:PDF. 88 http://eur‐lex.europa.eu/LexUriServ/LexUriServ.do?uri=OJ:L:2011:149:0012:0024:EN:PDF.
DRAFT

86
10. Life Cycle Impact Assessment With data obtained in inventory stage and the analysis of alternatives of substances for different
product the life cycle impact assessment step has been conducted.
10.1. General considerations on existing LCA studies
In general terms, LCA studies consulted previously indicated that for all soap products included in this
category, the use phase together with packaging manufacturing and the elaboration of raw
chemicals were the stages with major environmental impacts in life cycle of these products.
Regarding the main environmental impact, results from studies consulted showed that fossil
feedstock, energy consumption and associated impacts are the most influencing in the life cycle
phases of all products89.
On the other hand results for ecotoxicity categories presented limitations in most existing LCA
studies since for most substances there are no characterisation factors allocated. This means that the
quantification of the environmental impact is not possible directly via the software tool but the LCA
practitioner should try manually to determine and integrate this. Hence, aquatic ecotoxicity values
are considered underestimated. This difficulty was also faced in the performed LCA. Therefore it was
considered for important to compliment the investigation on aquatic pollution with a more detailed
analysis. A similar approach was followed in the previous EU Ecolabel criteria development, in which
regarding environmental impact methods like CDVTox (Critical Dilution Volume toxicity) and the DPD
(former Dangerous Preparations Directive) to assess the aquatic pollution were used90.
10.2. Impact assessment method used
The impact assessment method used is the IMPACT 2002+91. The IMPACT 2002+ methodology
proposes a feasible implementation of a combined midpoint categories and damage approach,
linking all types of life cycle inventory results (elementary flows and other interventions) via midpoint
categories to four damage categories. This method has been chosen because it incorporates
advanced methodologies for assessment of human toxicity and ecotoxicity. Other midpoint
categories are adapted from existing characterizing methods (Eco‐indicator 99 and CML 2002 and
IPCC).
All midpoint scores are expressed in units of a reference substance and related to the four damage
categories human health, ecosystem quality, climate change, and resources. Normalization can be
performed either at midpoint or at damage level. The IMPACT 2002+ method provides
characterization factors for almost 1500 different LCI‐results.
Midpoints are used for a more specific and detailed analysis, whereas damage endpoints are useful
to communicate the results obtained to breader audience. The pre‐defined (mathematical) weighting
of the different midpoint score within the Impact 2002+ assessment method allow us to come to a
89 Comparing the Environmental Footprints of Home‐Care and Personal‐Hygiene Products: The Relevance of Different Life‐
Cycle Phases. Annette Koehler* and Caroline Wildbolz. ETH Zurich, Institute of Environmental Engineering, 8093 Zurich, Switzerland. Environ. Sci. Technol., 2009, 43 (22), pp 8643–8651. DOI: 10.1021/es901236. CASE STUDY SHAMPOO BY HENKEL AG & CO. KGAA. Case Study undertaken within the PCF Pilot Project Germany. Final report. EU Eco‐label for shampoo and soaps. Ecolabelling Norway. Eskeland,, M.B, Svanes, E. May 2006. 90 Colipa good sustainability practice (GSP) for the cosmetics industry. COLIPA – The European Cosmetic Association 91 http://www.sph.umich.edu/riskcenter/jolliet/impact2002+.htm.
DRAFT

87
single score. However, as previously mentioned, this should be used more for communication than
for analysis, as weighting is not standardised and it is generally considered more relevant for the
experts groups to hold discussions in greater detail – on midpoints level.
For the midpoints categories the environmental categories recommended by ILCD handbook
International Reference Life Cycle Data System have been selected 92. Human toxicity and ecotoxicity
categories have been included due to the necessity of access these impacts of soaps, shampoos and
hair conditioners, are they are in contact directly with human skin and they are release directly to
water after use.
Table 61. Midpoint categories used and link to damage category
Midpoint category Midpoint reference substance
Damage category
Damage unit
Human toxicity
(carcinogens + non‐carcinogens)
kgeq chloroethylene into air
Respiratory (inorganics) kgeq PM2.5 into air
Ozone layer depletion kgeq CFC‐11 into air
Human health
DALY
Photochemical oxidation kgeq ethylene into air
Aquatic ecotoxicity kgeq triethylene glycol into water
Terrestrial ecotoxicity kgeq triethylene glycol into water
Terrestrial acidification/nutrification
kgeq SO2 into air
Aquatic acidification kgeq SO2 into air
Aquatic eutrophication kgeq PO43– into water
Land occupation m2eq organic arable land∙year
Ecosystem quality
PDF * m2 * yr
Global warming kgeq CO2 into air
Climate change
(life support system)
(kgeq CO2 into air)
Non‐renewable energy MJ Total primary non‐renewable or kgeq crude oil (860 kg/m3)
Mineral extraction MJ additional energy or kgeq iron (in ore)
Resources
MJ
Source: Scheme of the IMPACT 2002+ framework, with midpoint categories used linked to damage categories. Based on Jolliet et al. (2003a)
92 European Commission‐Joint Research Centre ‐ Institute for Environment and Sustainability: International Reference Life Cycle Data System (ILCD) Handbook, unpublished.
DRAFT

88
10.3. General environmental profile of products
In Figure 10 it the general environmental impact of the four kinds of products studied: liquid soap,
solid soap, shampoo and hair conditioners, can be seen. Environmental impact is presented as a
single score, where all midpoints impact categories have been weighted and aggregated to a unique
valued, done with 2002+ impact method. It is useful to have a general vision of the contribution of
each life stage to the environmental impact of the whole product and to identify the hot spots. The
four products analysed show similar environmental profiles, with some differences which are
detailed in sections below.
Graphics below show that for all kind of products, the use phase (washing action) has a big impact,
counting for a 33% for liquid soaps, a 34% for solid soaps, a 27% for shampoos and a 17% for hair
conditioners. Hair conditioner has a lower percentage for the use phase because the dose is major,
and therefore for the same amount of product a lower number of washing actions are done. In use
phase, only water has been considered as an input, as energy used for heating waster was excluded
from the system. The input of products has been assessed as raw materials. Nevertheless, some
aspects, like e.g. hot water use, are difficult to be regulated by the Ecolabel criteria, as these are
more user bahevious and habits dependant. Nevertheless, it is important to remember it and i to
communicate it to the consumers.
Packaging manufacturing has also a relevant load, especially bottle packages have an important
contribution: 25% for liquid soaps, 6% for solid soaps, 32% for shampoos and 36% for hair
conditioners. The same packaging is considered for the three ilquid products, so differences in
percentage load respect global environmental impact are due to contribution of the rest of stages. It
has to be taken into account that the weight considered for packaging is quite high (taken from
current limit weight of EU Ecolabel criteria), and average weight of product may be lower. For solid
soaps, packaging have less importance because of a minor weight and because the material taken as
standard is packaging paper instead of plastic. Detailed analyses of packaging environmental impact
are showed in section 10.9.
Raw material extraction life cycle phase has also an impact, of 5% for liquid soaps, 24% for solid
soaps, 7% for shampoos and 19% for hair conditioners. The process of extraction of raw materials,
manufacturing of ingredients are included in this stages. Impacts are due to energy and resources
needed to sinthetize these substances and the potential toxicity impacts that these ingredient may
have if they are released to the environment. For solid soaps the impact coming from raw materials
is higher than in liquid products because the amount of water is significally lower, moreover the
relative contribution of other stages such packaging is lower than the rest of products. For hair
conditioners the environmental impact is higher than other liquid products due to substances such as
silicones or waxes. Environmental impacts for raw chemicals are further assessed in sections 10.4,
10.5, 10.6, 10.7 and 10.8. Other stages with a minor environmental impact are commented in detail
in the following sections.
Release of product to water stage has also relevant load in the general environmental impact of
products. In this stage the generation of wastewaster after use and the treatment of this wastewater
in a sewage treatment plant of household water have been considered. It is considered that rinse‐off
products are totally released to wastewater after use, so wastewater would contain all product
ingredients. This wastewater is treated so it is considered taht outputs of this stage are purified
DRAFT

89
water and the resulting sludges that go to final disposal. This analysis has been done considering and
average process for household wastewater conaining chemicals. Specific analysis of what occur to
substances of studied products in wastewater has not been done due to lack of data.
Waste derived from packaging has a minor impact, as it is considered that a part goes to recycling
processes, according to current European recycling rates (See inventory section). Impacts from
recycling have been included in a system but balanced with environmental benefits occurring due to
avoidance of use of virgin materials (LCA processes pre‐defined products life cycles allocation rule).
Recycling process has then low environmental impact. Most of the impacts coming from this stage
are due to the fraction of waste that goes to landfill disposal.
Figure 10. Environmental impact distribution for studied products (unique punctuation)
DRAFT

90
Contribution of life stages potentially regulated by Ecolabel
In order to see the impacts from stages potentially regulated by Ecolabel the stages of use and
distribution have been withdrawn. Relative contribution to environmental product impact for stages
potentially regulated by Ecolabel (raw materials, manufacturing, packaging, disposal to water and
waste packaging) are represented in Figures below. These impacts are shown distributied for impact
categories.
In figures 11, 12, 13 and 14 below it can be seen the contribution of each product stage disclosed in
different midpoint impact categories. This representation is done for each kind of product. In tables
63, 64, 65 and 66 numeric values for each category impact and life stage are represented for each
kind of product.
Environmental impacts for liquid soaps
Figure 11. Distribution of environmental impact for midpoints impact categories (liquid soap)
0%
10%
20%
30%
40%
50%
60%
70%
80%
90%
100%
Raw materials
Manufacturing
Packaging
Disposal water
Waste packaging
Table 62. Impact category values for liquid soaps
Impact category Units Total Raw materials Manufacturing Packaging Disposal to water
Waste packaging
Carcinogens kg C2H3Cl eq 0,041908 0,000613 0,000628 0,023944 0,011623 2,39E‐05
Non‐carcinogens kg C2H3Cl eq 0,020813 0,000322 0,000542 0,000991 0,010764 1,47E‐05
Respiratory inorganics kg PM2.5 eq 0,000783 2,9E‐05 3,51E‐05 0,000123 0,000266 3,97E‐06
Ozone layer depletion kg CFC‐11 eq 1,12E‐07 3,68E‐09 1,12E‐08 5,66E‐08 1,49E‐08 6,51E‐10
Respiratory organics kg C2H4 eq 0,000512 4,07E‐05 1,81E‐05 0,000226 0,000124 2,83E‐06
Aquatic ecotoxicity kg TEG water 5296,44 1,727884 4,295198 5,177123 39,06853 0,123174
Terrestrial ecotoxicity kg TEG soil 15,4376 0,494836 1,537403 0,771706 6,645243 0,046731
Terrestrial acid/nutri kg SO2 eq 0,015789 0,000553 0,000797 0,002703 0,004844 0,000106
Land occupation m2org.arable 0,142921 0,121979 0,000114 0,001165 0,004677 0,000113
Aquatic acidification kg SO2 eq 0,004324 0,00017 0,000265 0,000838 0,001127 1,61E‐05
Aquatic eutrophication kg PO4 P‐lim 9,03E‐05 7,81E‐06 3,85E‐05 3,71E‐06 2,36E‐05 1,82E‐07
Global warming kg CO2 eq 1,094416 0,03122 0,098739 0,222622 0,358561 0,002074
Non‐renewable energy MJ primary 21,58696 0,774052 1,660908 7,96485 4,208543 0,060533
Mineral extraction MJ surplus 0,059245 0,0009 9E‐05 0,000283 0,052065 1,75E‐05
DRAFT
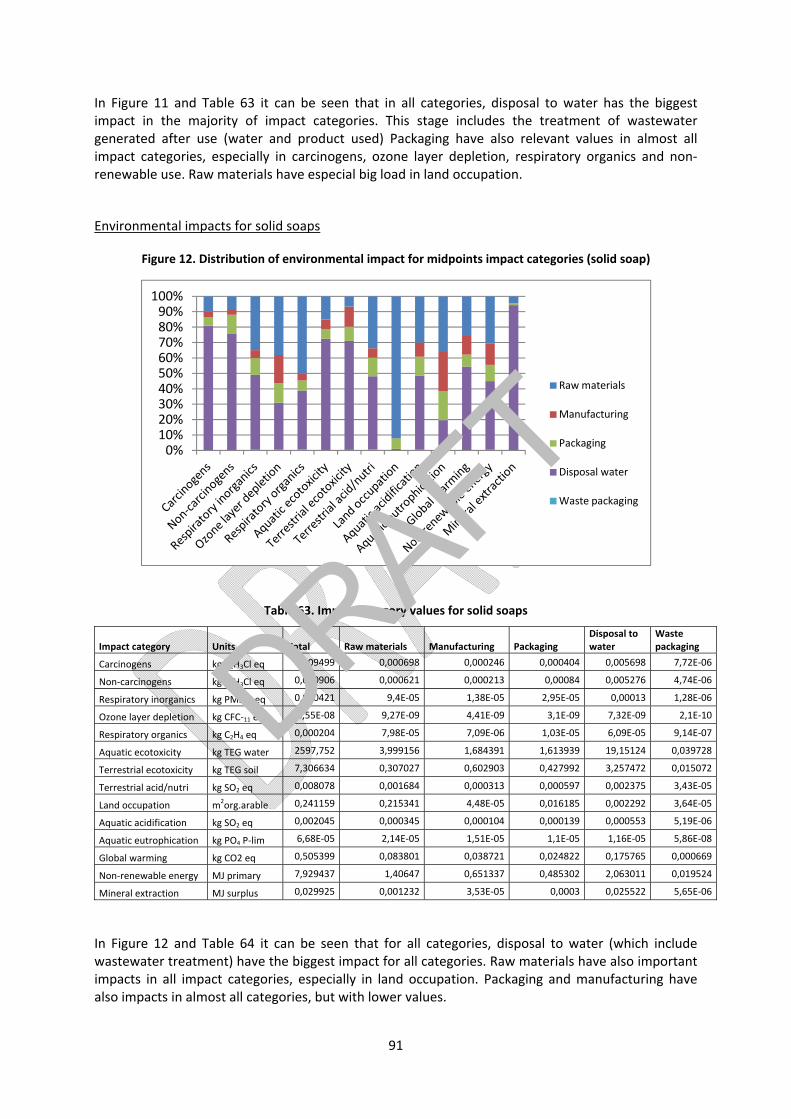
91
In Figure 11 and Table 63 it can be seen that in all categories, disposal to water has the biggest impact in the majority of impact categories. This stage includes the treatment of wastewater generated after use (water and product used) Packaging have also relevant values in almost all impact categories, especially in carcinogens, ozone layer depletion, respiratory organics and non‐renewable use. Raw materials have especial big load in land occupation.
Environmental impacts for solid soaps
Figure 12. Distribution of environmental impact for midpoints impact categories (solid soap)
0%10%20%30%40%50%60%70%80%90%
100%
Raw materials
Manufacturing
Packaging
Disposal water
Waste packaging
Table 63. Impact category values for solid soaps
Impact category Units Total Raw materials Manufacturing Packaging Disposal to water
Waste packaging
Carcinogens kg C2H3Cl eq 0,009499 0,000698 0,000246 0,000404 0,005698 7,72E‐06
Non‐carcinogens kg C2H3Cl eq 0,010906 0,000621 0,000213 0,00084 0,005276 4,74E‐06
Respiratory inorganics kg PM2.5 eq 0,000421 9,4E‐05 1,38E‐05 2,95E‐05 0,00013 1,28E‐06
Ozone layer depletion kg CFC‐11 eq 3,55E‐08 9,27E‐09 4,41E‐09 3,1E‐09 7,32E‐09 2,1E‐10
Respiratory organics kg C2H4 eq 0,000204 7,98E‐05 7,09E‐06 1,03E‐05 6,09E‐05 9,14E‐07
Aquatic ecotoxicity kg TEG water 2597,752 3,999156 1,684391 1,613939 19,15124 0,039728
Terrestrial ecotoxicity kg TEG soil 7,306634 0,307027 0,602903 0,427992 3,257472 0,015072
Terrestrial acid/nutri kg SO2 eq 0,008078 0,001684 0,000313 0,000597 0,002375 3,43E‐05
Land occupation m2org.arable 0,241159 0,215341 4,48E‐05 0,016185 0,002292 3,64E‐05
Aquatic acidification kg SO2 eq 0,002045 0,000345 0,000104 0,000139 0,000553 5,19E‐06
Aquatic eutrophication kg PO4 P‐lim 6,68E‐05 2,14E‐05 1,51E‐05 1,1E‐05 1,16E‐05 5,86E‐08
Global warming kg CO2 eq 0,505399 0,083801 0,038721 0,024822 0,175765 0,000669
Non‐renewable energy MJ primary 7,929437 1,40647 0,651337 0,485302 2,063011 0,019524
Mineral extraction MJ surplus 0,029925 0,001232 3,53E‐05 0,0003 0,025522 5,65E‐06
In Figure 12 and Table 64 it can be seen that for all categories, disposal to water (which include wastewater treatment) have the biggest impact for all categories. Raw materials have also important impacts in all impact categories, especially in land occupation. Packaging and manufacturing have also impacts in almost all categories, but with lower values.
DRAFT

92
Figure 13. Distribution of environmental impact for midpoints impact categories (hair conditioners)
Table 64. Impact category values for hair conditioners
Impact category Units Total Raw materials Manufacturing Packaging Disposal to water
Waste packaging
Carcinogens kg C2H3Cl eq 0,031161 0,000851 0,000628 0,023944 0,003688 2,39E-05
Non-carcinogens kg C2H3Cl eq 0,00922 0,000723 0,000542 0,000991 0,003747 1,47E-05
Respiratory inorganics kg PM2.5 eq 0,000715 0,000306 3,51E-05 0,000123 9,17E-05 3,97E-06
Ozone layer depletion kg CFC-11 eq 1E-07 1,37E-08 1,12E-08 5,66E-08 4,97E-09 6,51E-10
Respiratory organics kg C2H4 eq 0,000377 3,79E-05 1,81E-05 0,000226 3,57E-05 2,83E-06
Aquatic ecotoxicity kg TEG water 1904,184 5,270384 4,295198 5,177123 12,80607 0,123174
Terrestrial ecotoxicity kg TEG soil 8,798557 0,732227 1,537403 0,771706 2,564378 0,046731
Terrestrial acid/nutri kg SO2 eq 0,02102 0,012208 0,000797 0,002703 0,001557 0,000106
Land occupation m2org.arable 0,108546 0,099785 0,000114 0,001165 0,00183 0,000113
Aquatic acidification kg SO2 eq 0,004059 0,001698 0,000265 0,000838 0,000379 1,61E-05
Aquatic eutrophication kg PO4 P-lim 8,54E-05 2,64E-05 3,85E-05 3,71E-06 8,54E-06 1,82E-07
Global warming kg CO2 eq 0,649394 0,048962 0,098739 0,222622 0,115337 0,002074
Non-renewable energy MJ primary 15,01958 1,126745 1,660908 7,96485 1,292117 0,060533
Mineral extraction MJ surplus 0,026386 0,001125 9E-05 0,000283 0,022495 1,75E-05
In Figure 13 and Table 65 it can be seen that packaging has important loads in the majority of impact categories. Raw materials have important loads in categories of respiratory inorganics, terrestrial and aquatic acidification and land occupation.
DRAFT

93
Figure 14. Distribution of environmental impact for midpoints impact categories (shampoo)
Table 65. Impact category values for shampoos
Impact category Units Total Raw materials Manufacturing Packaging Disposal to water
Waste packaging
Carcinogens kg C2H3Cl eq 0,035354 0,001011 0,000628 0,023944 0,006446 2,39E-05
Non-carcinogens kg C2H3Cl eq 0,013788 0,000413 0,000542 0,000991 0,00655 1,47E-05
Respiratory inorganics kg PM2.5 eq 0,000585 3,51E-05 3,51E-05 0,000123 0,00016 3,97E-06
Ozone layer depletion kg CFC-11 eq 1,06E-07 1,08E-08 1,12E-08 5,66E-08 8,7E-09 6,51E-10
Respiratory organics kg C2H4 eq 0,000424 3,99E-05 1,81E-05 0,000226 6,24E-05 2,83E-06
Aquatic ecotoxicity kg TEG water 3312,605 2,055355 4,295198 5,177123 22,38667 0,123174
Terrestrial ecotoxicity kg TEG soil 11,68793 0,528722 1,537403 0,771706 4,482865 0,046731
Terrestrial acid/nutri kg SO2 eq 0,011972 0,000664 0,000797 0,002703 0,002723 0,000106
Land occupation m2org.arable 0,071681 0,05764 0,000114 0,001165 0,003199 0,000113
Aquatic acidification kg SO2 eq 0,003271 0,000187 0,000265 0,000838 0,000663 1,61E-05
Aquatic eutrophication kg PO4 P-lim 9,23E-05 2,34E-05 3,85E-05 3,71E-06 1,49E-05 1,82E-07
Global warming kg CO2 eq 0,818108 0,039545 0,098739 0,222622 0,201623 0,002074
Non-renewable energy MJ primary 17,52683 0,986965 1,660908 7,96485 2,258788 0,060533
Mineral extraction MJ surplus 0,044649 0,001091 9E-05 0,000283 0,039325 1,75E-05
In Figure 14 and Table 66 it can be seen that packaging has big load in the majority of impact
categories. Disposal to water has also important impacts in some categories such as mineral
occupation, non‐carcinogens, and ecotoxicity. It has to be highligted that raw materials have special
load in land occupation.
DRAFT

94
General discussion for all products studied:
Packaging has a high contribution in many impact categories, especially in some categories such as
carcinogens, non‐renewable energy and respiratory of organics. Therefore, it is important to regulate
the constituent materials and substances used as additives in soap packaging. Weight of packaging
will also have high importance, as the lower amount of material used the lower will be the impact
not only in productin but also in the transportation phase of the product. Sensitivity analyses done
with different kinds of plastics do not show big differences in the relative contribution of this stage in
the general product profile. Nevertheless, more specific analyses for packaging materials are shown
in 10.9
It can be seen that raw materials have a high contribution in most of categories, especially in
categories related to resources depletion such as mineral extraction and land occupation. Raw
materials also take into account the potential environmental impacts that they can cause if they are
released to the environment. These data show that it is important to work for more sustainable and
less dangerous substances in formulations, including their origin.
Release to water, which includes the sewage water treatment, has also important contribution in
most impact categories.
Manufacturing stage is also relevant in some categories, specially related to the energy used as heat
and electricity. Although primary data is not available to deeper analyse this stage, results show the
need of promoting energy efficiency in production processes.
Finally, waste treatment of packaging has a low impact. Impacts from recycling have been included
in a system but balanced with environmental benefits occurring due to avoidance of use of virgin
materials (LCA processes pre‐defined products life cycles allocation rule).Impacts of this stage are
mainly due to the fraction of waste that is considered to be disposed (70% according to European
statistics).
DRAFT

95
10.4. Impact assessment for liquid soap ingredients
As seen in the previous sector, raw materials have an important environmental load in the majority
of categories (average of 5% of total environmental impact) in liquid soap’s profile, in the
formulation for base case.
In Figure 15 the environmental impact distribution among different ingredients is analysed. It can be
seen that in general surfactants and preservatives are posing the biggest impacts. Oils and fatty
alcohols coming from vegetable have a high contribution in land occupation and energy
consumption. Nevertheless, some impacts related to human toxicity and ecotoxicity were not always
quantifiable and underestimation could be expected. Moreover, the availability of substances in LCA
databases is quite limited. However, whenever possible, an approximation of impacts of specific
substances could be modelled based on the characterisation factors of similar reference substances,
inline with the guidelines of ILCD Handbook and common LCA practice (see inventory section).
Figure 15. Environmental impact from raw ingredients (liquid soaps)
The sensitivity of the results related to changes to the ingredients was investigated. A comparative
analysis has also been conducted with a modelling of worse case formulation by varying some
ingredients (see Table 67), substances which are thought to cause more ecotoxicity and which are
available in LCA Databases. The purpose of this was to receive an indication how distanced is the
environmental performance between a considered well performing product for which the ecolabel
could be awarded compared to a product which could be found in the market and could be
perceived to be rather bad performing. It should be emphasized that the modelled worse cases were
drafted with the aim of the above mentioned camparison. An identification of the real, existing at
the market worse performing products and their composition needs a more detailed analysis, which
was not within the scope of the project and therefore the modelled worse cases should be handled
in the above described context. This is also valid for the similar section for each kind of product
investigated (solid soap, shampoo and hair conditioner, as described later).
DRAFT
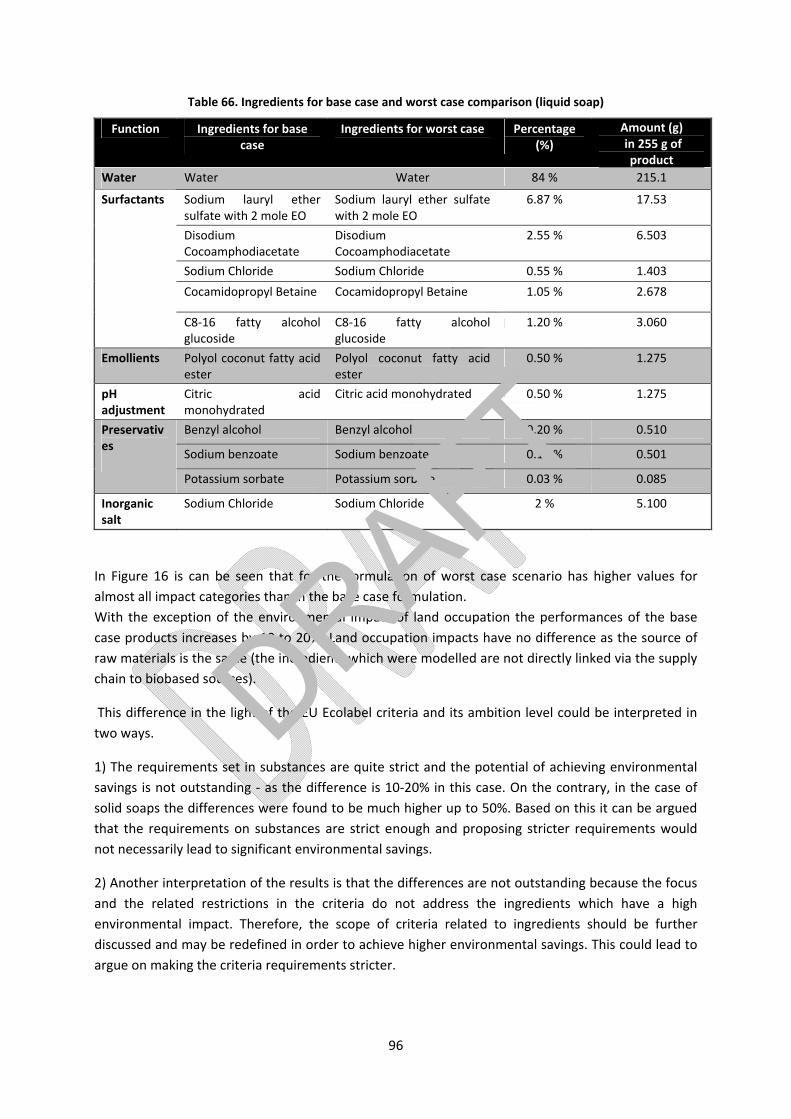
96
Table 66. Ingredients for base case and worst case comparison (liquid soap)
Function Ingredients for base case
Ingredients for worst case Percentage (%)
Amount (g) in 255 g of product
Water Water Water 84 % 215.1
Sodium lauryl ether sulfate with 2 mole EO
Sodium lauryl ether sulfate with 2 mole EO
6.87 % 17.53
Disodium Cocoamphodiacetate
Disodium Cocoamphodiacetate
2.55 % 6.503
Sodium Chloride Sodium Chloride 0.55 % 1.403
Cocamidopropyl Betaine Cocamidopropyl Betaine 1.05 % 2.678
Surfactants
C8‐16 fatty alcohol glucoside
C8‐16 fatty alcohol glucoside
1.20 % 3.060
Emollients Polyol coconut fatty acid ester
Polyol coconut fatty acid ester
0.50 % 1.275
pH adjustment
Citric acid monohydrated
Citric acid monohydrated 0.50 % 1.275
Benzyl alcohol Benzyl alcohol 0.20 % 0.510
Sodium benzoate Sodium benzoate 0.19 % 0.501
Preservatives
Potassium sorbate Potassium sorbate 0.03 % 0.085
Inorganic salt
Sodium Chloride Sodium Chloride 2 % 5.100
In Figure 16 is can be seen that for the formulation of worst case scenario has higher values for
almost all impact categories than in the base case formulation.
With the exception of the environmental impact of land occupation the performances of the base
case products increases by 10 to 20%. Land occupation impacts have no difference as the source of
raw materials is the same (the incredients which were modelled are not directly linked via the supply
chain to biobased sources).
This difference in the light of the EU Ecolabel criteria and its ambition level could be interpreted in
two ways.
1) The requirements set in substances are quite strict and the potential of achieving environmental
savings is not outstanding ‐ as the difference is 10‐20% in this case. On the contrary, in the case of
solid soaps the differences were found to be much higher up to 50%. Based on this it can be argued
that the requirements on substances are strict enough and proposing stricter requirements would
not necessarily lead to significant environmental savings.
2) Another interpretation of the results is that the differences are not outstanding because the focus
and the related restrictions in the criteria do not address the ingredients which have a high
environmental impact. Therefore, the scope of criteria related to ingredients should be further
discussed and may be redefined in order to achieve higher environmental savings. This could lead to
argue on making the criteria requirements stricter.
DRAFT

97
Comments from stakeholders on the above described points, which are also relevant for other
products kinds covered by the product group under study and their respective outcomes of the
sensitivity analyses, are welcome.
Figure 16. Comparison between environmental impact of base case and worst case formulations (liquid soap)
10.5. Impact assessment for solid soap ingredients
For solid soaps, raw chemicals used as ingredients have a relative impact of 24%. If impacts coming
from each ingredient are analysed, it can be seen in Figure 17 that major impacts are coming from
the ingredients with a higher percentage in the formulation, namely saponified oils. Glycerine has
also relevant impact, followed by EDTA and Titanium dioxide which are used in lower concentrations.
For all substances, land occupation, global warming and non‐renewable energy are the impact
categories with higher values.
For solid soaps, perfumes and colorants have been not included due to lack of data.
DRAFT

98
Figure 17. Environmental impact from raw ingredients (solid soaps)
A comparative analysis has been done with a worst case formulation by some ingredients (see Table 68), adding the substances which are thought to cause more ecotoxicity and which are available in LCADatabases.
Table 67. Ingredients for base case and worst case comparison (solid soap)
Function Ingredients for base case
Ingredients for worst case
Percentage (%)
Amount (g) in 100 g of product
Tallow Tallow 57
Coconut oil fatty acids Coconut oil fatty acids
92% 14
Saponified oils (92%)
Stearic acid Stearic acid 14
Emulsifying / humectant
Glycerine Propylene glycol 6%
5.52
Perfuming Perfume Benzyl alcohol 1% 1.38
Colorant Colorants Colorants 0,1% 0.092
Chelating agent EDTA EDTA 0,2% 0.184
Bleaching agent Titanium dioxide Titanium dioxide 0,1% 0.092
Water Water Water 8% 8
From results showed in Figure 18 it can be seen that worst scenario formulation poses a greatest impact in all categories (except in land occupation, as the use of land do not vary with the undertaken change of the ingredients content). In general, the environmental impact is significantly higher for worst scenario than for the base case (ranging from 20 to 55%).
This is very different for the first case of the liquid soap described above. The same discussion point as presented for this case should be considered (see section 10.4). The improvement savings as modelled in this investigation are considered to significant.
DRAFT

99
Figure 18. Comparison between environmental impact of base case and worst case formulations (solid soap)
10.6. Impact Assessment for shampoo ingredients
In Figure 19 it is represented envioronemntal impact (all impact categories aggregated) distribution
among ingredients. Ingredients with a major environmental load are surfactants such as
cocoamidopropyl betaine and fatty alkanolamides, and also the controlling viscosity agent (in this
case propylene glycol) and finally sodium benzoate and sodium laureth sulphate. For all substances,
global warming, non‐renewable energy and land occupation are the impact categories with higher
values. Respiratory inorganics have also relevant contribution of environmental impact for most
substances.
Figure 19. Environmental impact from raw ingredients (shampoo)
DRAFT
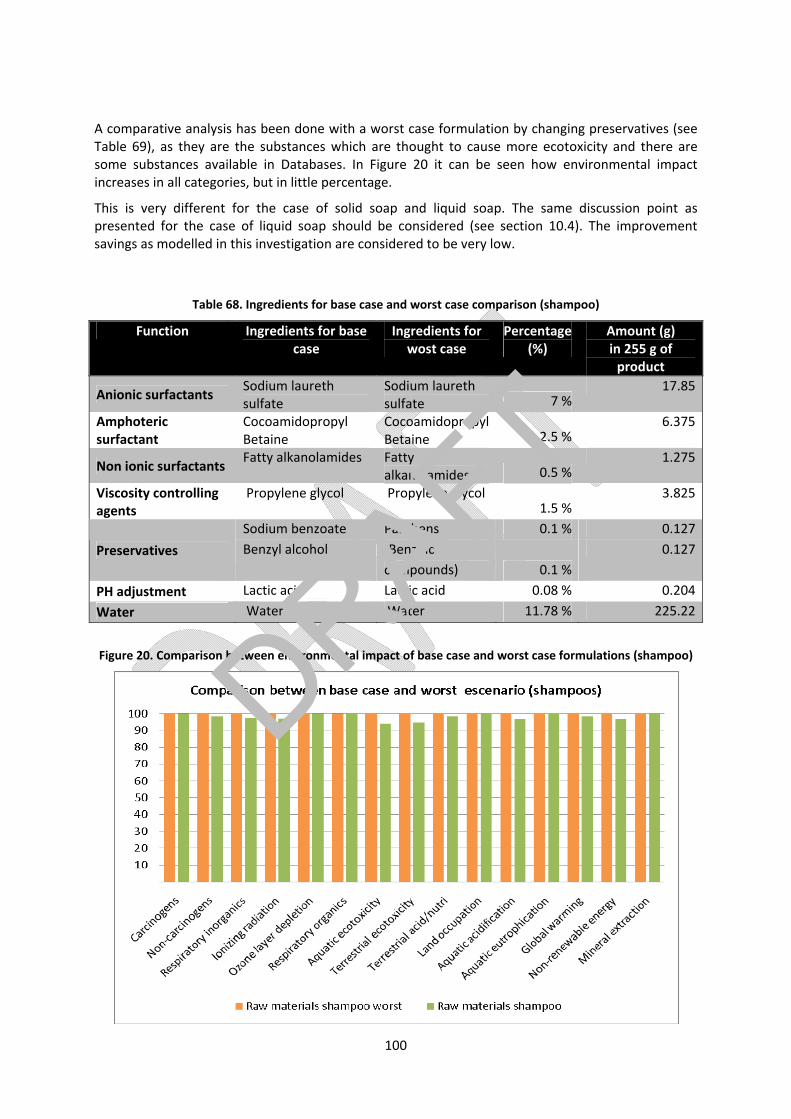
100
A comparative analysis has been done with a worst case formulation by changing preservatives (see Table 69), as they are the substances which are thought to cause more ecotoxicity and there are some substances available in Databases. In Figure 20 it can be seen how environmental impact increases in all categories, but in little percentage.
This is very different for the case of solid soap and liquid soap. The same discussion point as presented for the case of liquid soap should be considered (see section 10.4). The improvement savings as modelled in this investigation are considered to be very low.
Table 68. Ingredients for base case and worst case comparison (shampoo)
Function Ingredients for base case
Ingredients for wost case
Percentage (%)
Amount (g) in 255 g of product
Anionic surfactants Sodium laureth sulfate
Sodium laureth sulfate 7 %
17.85
Amphoteric surfactant
Cocoamidopropyl Betaine
Cocoamidopropyl Betaine 2.5 %
6.375
Non ionic surfactants Fatty alkanolamides Fatty
alkanolamides 0.5 % 1.275
Viscosity controlling agents
Propylene glycol Propylene glycol 1.5 %
3.825
Sodium benzoate 0.1 % 0.127
Preservatives Benzyl alcohol
Parabens
(Benzoic
compounds) 0.1 %
0.127
PH adjustment Lactic acid Lactic acid 0.08 % 0.204
Water Water Water 11.78 % 225.22
Figure 20. Comparison between environmental impact of base case and worst case formulations (shampoo)
DRAFT
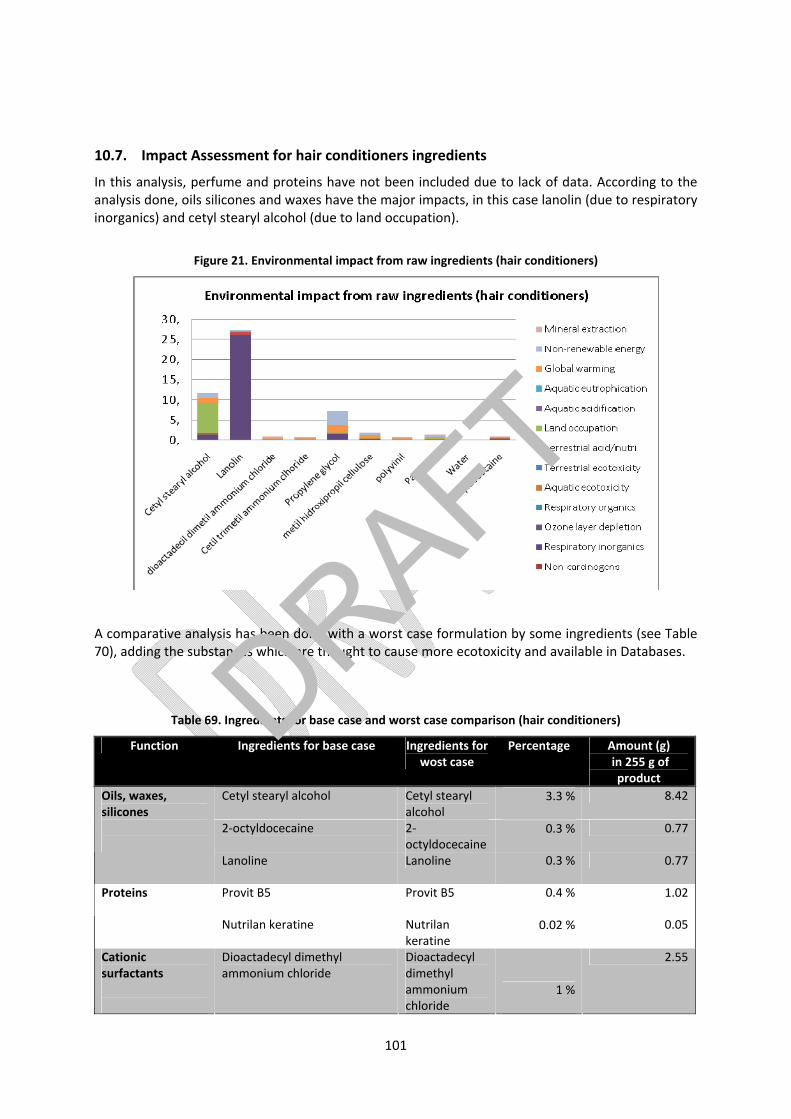
101
10.7. Impact Assessment for hair conditioners ingredients
In this analysis, perfume and proteins have not been included due to lack of data. According to the analysis done, oils silicones and waxes have the major impacts, in this case lanolin (due to respiratory inorganics) and cetyl stearyl alcohol (due to land occupation).
Figure 21. Environmental impact from raw ingredients (hair conditioners)
A comparative analysis has been done with a worst case formulation by some ingredients (see Table 70), adding the substances which are thought to cause more ecotoxicity and available in Databases.
Table 69. Ingredients for base case and worst case comparison (hair conditioners)
Function Ingredients for base case Ingredients for wost case
Percentage Amount (g) in 255 g of product
Cetyl stearyl alcohol Cetyl stearyl alcohol
3.3 % 8.42
2‐octyldocecaine 2‐octyldocecaine
0.3 % 0.77
Oils, waxes, silicones
Lanoline Lanoline 0.3 % 0.77
Provit B5 Provit B5 0.4 % 1.02 Proteins
Nutrilan keratine Nutrilan keratine
0.02 % 0.05
Cationic surfactants
Dioactadecyl dimethyl ammonium chloride
Dioactadecyl dimethyl ammonium chloride
1 %
2.55
DRAFT

102
Cetyl trimethyl ammonium chloride
Cetyl trimethyl ammonium chloride
0.8 %
2.04
Emollient, humectants
Propylene glycol Propylene glycol
2 % 5.10
Viscosity controlling agents
Methyl hydroxypropyl cellulose
Methyl hydroxypropyl cellulose
0.6 %
1.53
Polymers, resins Polyvinyl Polyvinyl 0.062 % 0.16
Perfume ‐ ‐ 0.2 % 0.51
Preservatives Parabens Parabens 0.2 % 0.51
Water Water Water 90.818 % 231.59
In figure 22 it can be seen that environmental impact for the worst case scenario is quite similar to base case, which already contains problematic preservatives, silicones and other substances.
This is very different for the case of solid soap and liquid soap, but similar to the case of shampoos. The same discussion point as presented for the case of liquid soap should be considered (see section 10.4). The improvement savings as modelled in this investigation are considered to be very low and action addressing the use of lanoline (see Figure 21) seems to be more relevant.
Figure 22. Comparison between environmental impact of base case and worst case formulations (hair
conditioners)
DRAFT
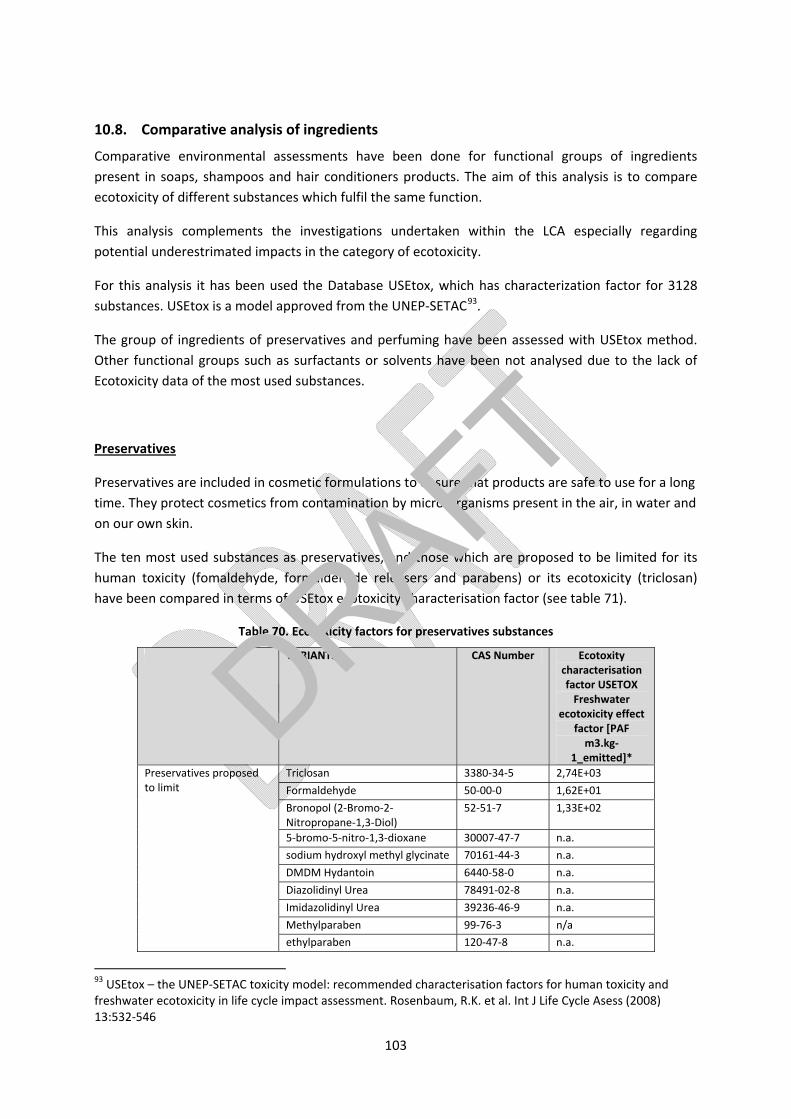
103
10.8. Comparative analysis of ingredients
Comparative environmental assessments have been done for functional groups of ingredients
present in soaps, shampoos and hair conditioners products. The aim of this analysis is to compare
ecotoxicity of different substances which fulfil the same function.
This analysis complements the investigations undertaken within the LCA especially regarding
potential underestrimated impacts in the category of ecotoxicity.
For this analysis it has been used the Database USEtox, which has characterization factor for 3128
substances. USEtox is a model approved from the UNEP‐SETAC93.
The group of ingredients of preservatives and perfuming have been assessed with USEtox method.
Other functional groups such as surfactants or solvents have been not analysed due to the lack of
Ecotoxicity data of the most used substances.
Preservatives
Preservatives are included in cosmetic formulations to ensure that products are safe to use for a long
time. They protect cosmetics from contamination by micro‐organisms present in the air, in water and
on our own skin.
The ten most used substances as preservatives, and those which are proposed to be limited for its
human toxicity (fomaldehyde, formaldehyde releasers and parabens) or its ecotoxicity (triclosan)
have been compared in terms of USEtox ecotoxicity characterisation factor (see table 71).
Table 70. Ecotoxicity factors for preservatives substances
VARIANTS CAS Number Ecotoxity characterisation factor USETOX Freshwater
ecotoxicity effect factor [PAF m3.kg‐
1_emitted]*
Triclosan 3380‐34‐5 2,74E+03
Formaldehyde 50‐00‐0 1,62E+01
Bronopol (2‐Bromo‐2‐Nitropropane‐1,3‐Diol)
52‐51‐7 1,33E+02
5‐bromo‐5‐nitro‐1,3‐dioxane 30007‐47‐7 n.a.
sodium hydroxyl methyl glycinate 70161‐44‐3 n.a. DMDM Hydantoin 6440‐58‐0 n.a. Diazolidinyl Urea 78491‐02‐8 n.a. Imidazolidinyl Urea 39236‐46‐9 n.a. Methylparaben 99‐76‐3 n/a
Preservatives proposed to limit
ethylparaben 120‐47‐8 n.a.
93 USEtox – the UNEP‐SETAC toxicity model: recommended characterisation factors for human toxicity and freshwater ecotoxicity in life cycle impact assessment. Rosenbaum, R.K. et al. Int J Life Cycle Asess (2008) 13:532‐546
DRAFT

104
butylparaben 94‐26‐8 n/a
Propylparaben 94‐13‐3 n.a.
Sodium Benzoate 532‐32‐1 7,74E+00
Phenoxyethanol 122‐99‐6 2,94E+00
Methylparaben 99‐76‐3 n/a
Methylisothiazolinone 2682‐20‐4 9,75E+03
Methylchloroisothiazolinone 26172‐55‐4 1,39E+03
Propylparaben 94‐13‐3 n.a. Potassium Sorbate 24634‐61‐5 n.a. Benzyl Alcohol 100‐51‐6 1,09E+01
DMDM Hydantoin 6440‐58‐0 n.a.
Most widely used preservatives in liquid soaps
Ethylparaben 120‐47‐8 n.a. Sodium Benzoate 532‐32‐1 7,74E+00
Methylisothiazolinone 2682‐20‐4 9,75E+03
Methylchloroisothia‐zolinone 26172‐55‐4 1,39E+03
DMDM Hydantoin 6440‐58‐0 n.a.
Methylparaben 99‐76‐3 n/a
Phenoxyethanol 122‐99‐6 2,94E+00
Benzyl Alcohol 100‐51‐6 1,09E+01
Proylparaben 94‐13‐3 n.a. Ethylparaben 120‐47‐8 n.a.
Most widely used preservatives in Shampoos
Salicylic Acid 69‐72‐7 8,49E+00
Cetrimonium Chloride 112‐02‐7 1,81E+03
Phenoxyethanol 122‐99‐6 2,94E+00
Methylparaben 99‐76‐3 n/a
Behentrimonium Chloride 17301‐53‐0 n.a.
Benzyl Alcohol 100‐51‐6 1,09E+01
Methylisothiazolinone 2682‐20‐4 9,75E+03
Methylchloroisothiazolinone 26172‐55‐4 1,39E+03
Propylparaben 94‐13‐3 n.a.
Sodium Benzoate 532‐32‐1 7,74E+00
Most widely used preservatives in HAIR CONDITIONER
Potassium Sorbate 24634‐61‐5 n.a.
* Potentially Affected Fraction of species (PAF), n.a = substance non available, n/a= ecotoxicity factor not available
From table 71 it can be said that Triclosan has the highest value for ecotoxicity comparing to most
other preservatives. Two preservatives which are widely used in all liquid products and which have
hight ecotoxicity are: Methylisothiazolinone (9,75E+03 PAF m3.kg‐1 emitted) and
Methylchloroisothiazolinone (1,39E+03 PAF m3.kg‐1 emitted)
Surfactants
Surfactants are a large group of surface active substances with a great number of (cleaning)
applications. Most surfactants have degreasing or wash active abilities. They reduce the surface
tension of the water so it can wet the fibres and surfaces, they loosen and encapsulate the dirt and in
that way ensure that the soiling will not re‐deposit on the surfaces.
Due to their surface active nature surfactants have toxic effects on some (aquatic) organisms. Most
surfactants are more or less toxic to aquatic organisms due to their surface activity which will react
with the biological membranes of the organisms. The biological degradability varies according to the
nature of the carbohydrate chain. Generally the linear chains are more readily degradable than
DRAFT
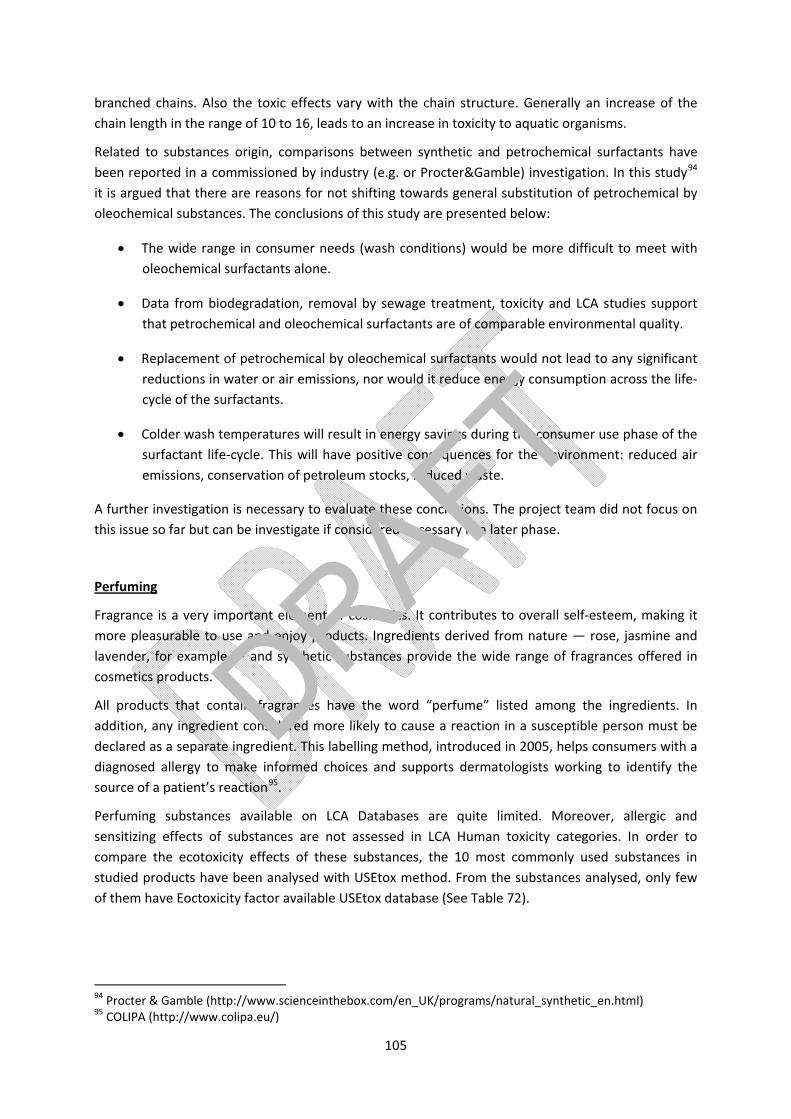
105
branched chains. Also the toxic effects vary with the chain structure. Generally an increase of the
chain length in the range of 10 to 16, leads to an increase in toxicity to aquatic organisms.
Related to substances origin, comparisons between synthetic and petrochemical surfactants have
been reported in a commissioned by industry (e.g. or Procter&Gamble) investigation. In this study94
it is argued that there are reasons for not shifting towards general substitution of petrochemical by
oleochemical substances. The conclusions of this study are presented below:
The wide range in consumer needs (wash conditions) would be more difficult to meet with
oleochemical surfactants alone.
Data from biodegradation, removal by sewage treatment, toxicity and LCA studies support
that petrochemical and oleochemical surfactants are of comparable environmental quality.
Replacement of petrochemical by oleochemical surfactants would not lead to any significant
reductions in water or air emissions, nor would it reduce energy consumption across the life‐
cycle of the surfactants.
Colder wash temperatures will result in energy savings during the consumer use phase of the
surfactant life‐cycle. This will have positive consequences for the environment: reduced air
emissions, conservation of petroleum stocks, reduced waste.
A further investigation is necessary to evaluate these conclusions. The project team did not focus on
this issue so far but can be investigate if considered necessary in a later phase.
Perfuming
Fragrance is a very important element of cosmetics. It contributes to overall self‐esteem, making it
more pleasurable to use and enjoy products. Ingredients derived from nature — rose, jasmine and
lavender, for example — and synthetic substances provide the wide range of fragrances offered in
cosmetics products.
All products that contain fragrances have the word “perfume” listed among the ingredients. In
addition, any ingredient considered more likely to cause a reaction in a susceptible person must be
declared as a separate ingredient. This labelling method, introduced in 2005, helps consumers with a
diagnosed allergy to make informed choices and supports dermatologists working to identify the
source of a patient’s reaction95.
Perfuming substances available on LCA Databases are quite limited. Moreover, allergic and
sensitizing effects of substances are not assessed in LCA Human toxicity categories. In order to
compare the ecotoxicity effects of these substances, the 10 most commonly used substances in
studied products have been analysed with USEtox method. From the substances analysed, only few
of them have Eoctoxicity factor available USEtox database (See Table 72).
94 Procter & Gamble (http://www.scienceinthebox.com/en_UK/programs/natural_synthetic_en.html) 95 COLIPA (http://www.colipa.eu/)
DRAFT

106
Table 71.Ecotoxicity factors for perfuming substances
VARIANTS (Function perfuming) Number of products containing this variant
CAS number Ecotoxity characterisation factor USETOX
Linalool 4758 78‐70‐6 2,45E+01
Limonene 4508 5989‐27‐5 6,90E+01
Butylphenyl Methylpropional 2847 80‐54‐6 n.a. Hexyl Cinnamal 2756 101‐86‐0 n.a. Propylparaben 2105 94‐13‐3 n.a. Glyceryl Oleate 2020 111‐03‐5 n.a. Citronellol 1803
106‐22‐9 n.a.
Benzyl Alcohol 1612 100‐51‐6 1,09E+01
Benzyl Salicylate 1515 118‐58‐1 Y n.a.
LIQUID SOAPS
Geraniol 1386 106‐24‐1 n.a. Glycerin 1.543 56‐81‐5 n.a. Linalool 625 78‐70‐6 n.a. Limonene 535 5989‐27‐5 n.a. Hexyl Cinnamal 432 101‐86‐0 n.a. Butylphenyl Methylpropional 412 80‐54‐6 n.a. Citronellol 390 106‐22‐9 n.a. Geraniol 283 106‐24‐1 2,71E+02
Benzyl Salicylate 271 118‐58‐1 n.a. Coumarin 254 91‐64‐5 n.a.
SOLID SOAPS
Alpha‐isomethyl Ionone 235 127‐51‐5 n.a. Linalool 3.374 78‐70‐6 n.a. L‐limonene 2.818 5989‐27‐5 n.a. Glycerin 2.801 56‐81‐5 1,86E‐02
Hexyl Cinnamal 2.609 101‐86‐0 n.a. Butylphenyl Methylpropional 2.484 80‐54‐6 n.a. Benzyl Alcohol 1.659 100‐51‐6 1,09E+01
Benzyl Salicylate 1.474 118‐58‐1 Y n.a. Citronellol 1.434
106‐22‐9 n.a.
Propylparaben 1.382 94‐13‐3 n.a.
SHAMPOOS
Glyceryl Oleate 922 111‐03‐5 n.a. Linalool 3.374 78‐70‐6 2,45E+01
L‐limonene 2.818 5989‐27‐5 6,90E+01
Glycerin 2.801 56‐81‐5 1,86E‐02
Hexyl Cinnamal 2.609 101‐86‐0 n.a. Butylphenyl Methylpropional 2.484 80‐54‐6 n.a. Benzyl Alcohol 1.659 100‐51‐6 1,09E+01
Benzyl Salicylate 1.474 118‐58‐1 Y n.a. Citronellol 1.434
106‐22‐9 n.a.
Propylparaben 1.382 94‐13‐3 n.a.
HAIR CONDITIONERS
Glyceryl Oleate 922 111‐03‐5 n.a. * Potentially Affected Fraction of species (PAF), n.a = substance non available, n/a= ecotoxicity factor not available
In Table 72 it can be seen Eocotoxicity factor of perfuming substances. Substances highlighted in red
have high ecotoxicity factors, substances highlighted in yellow have medium ecotocicity values
whereas substances highlighted in green have lower values. In table it can be seen that the
perfuming substance with the highest ecotoxicity value is Geraniol (2,71E+02 PAF m3.kg‐1 emitted),
DRAFT

107
which is one of the perfuming substances proposed to be restricted due to its sensitizing
characteristics.
10.9. Environmental impact assessment of packaging
Packaging has a relevant contribution to the general environmental impact of soaps, shampoos and hair conditioners, since an average of the 27% of products’ impact comes from packaging and waste packaging (according to Life cycle assessment carried out in the report, see section 10). This indicates that efforts have to be done in order to regulate this parameter in EU Ecolabel criteria.
In the first part of this section more detailed information gathered from available literature is presented. In the conducted LCA the focus was on the life cycle of the particular products hence impacts related to selecting different materials are addressed in a lower detail level.
A simplified LCA analysis has been performed by Leitat comparing different packaging materials as well as other packaging elements such as labelling. A comparative LCA of different packaging materials would principally need a separate LCA study only on packaging which goes beyond the scope of the criteria revision. Nonetheless, the following review allows us to obtain better insight related to packaging.
Packaging has to be assessed in a life cycle approach, not only in terms of material origin or w eight. Criteria such as raw materials origin, consumption of resources during manufacturing material, refilling systems or recyclability have to be taken into account. As only small difference exists on soaps, shampoos and hair conditioners packaging, this stage has been assessed commonly. Only solid soaps present relevant differences which have been treated separately.
The study “Life Cycle Assessment of PVC and of principal competing materials96 analysed different studies done for packaging materials and concluded that results of packaging LCA studies were dependent upon the intended function of the packaging (e.g. protective or decorative), the take‐back or disposal system available for the packaging and the content to be packaged.
According to the report “Life Cycle Assessment of PVC and of principal competing materials97 plastic as packaging material for non‐reusable applications is favourable to other materials such as glass, but there is no consensus in defining which plastic is preferable. Each material has individual strengths and weaknesses. There is consensus throughout the studies that for single‐use applications glass is the worst material.
Some conclusions related to the advantages and disadventages of different packaging materials, as presented in the study of Unilever98 based on WRAP data, follows in Table 73 in order to obtain a general overview.
96 Life Cycle Assessment of PVC and of principal competing materials. PE Europe GmbH, Institut für Kunststoffkunde und Kunststoffprüfung (IKP), Instituttet for Produktudvikling (IPU), DTU, RANDA GROUP. Commissioned by the European Commission, July 2004. 97 Life Cycle Assessment of PVC and of principal competing materials. PE Europe GmbH, Institut für Kunststoffkunde und Kunststoffprüfung (IKP), Instituttet for Produktudvikling (IPU), DTU, RANDA GROUP. Commissioned by the European Commission, July 2004. 98 Sustainable Packaging?” by Unilever (http://www.unilever.com/images/sd_Sustainable%20Packaging%20(2009)_tcm13‐212667.pdf)
DRAFT
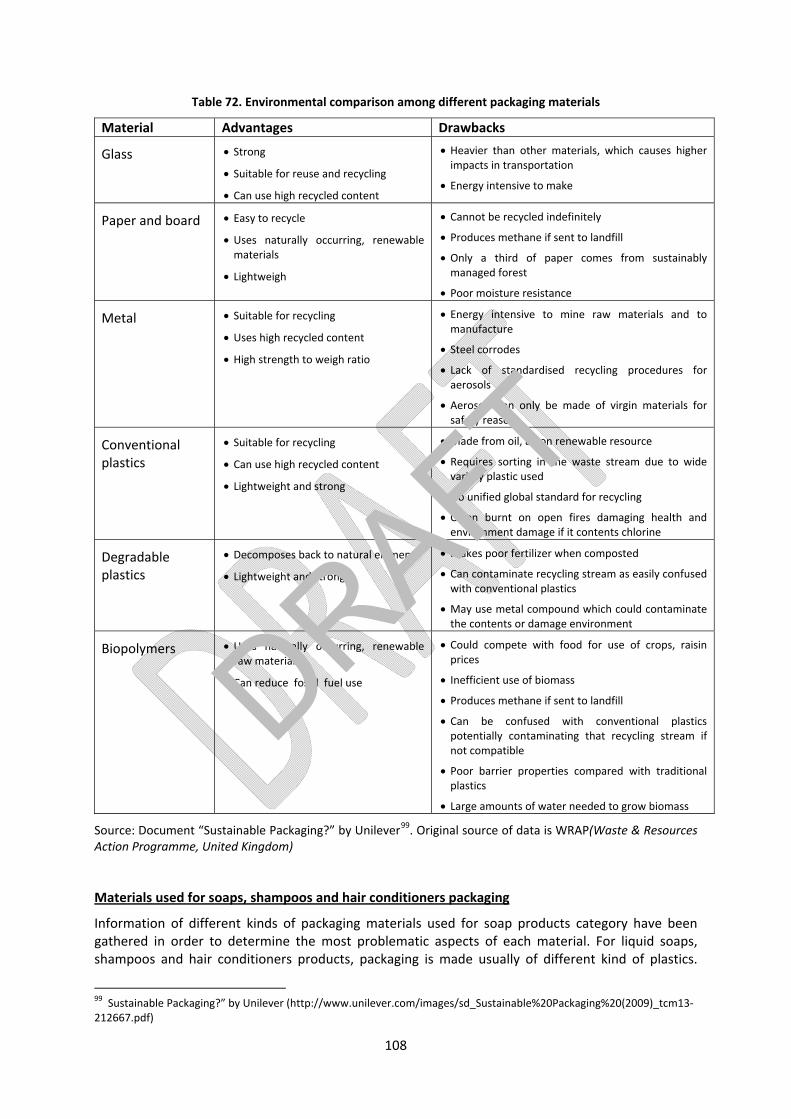
108
Table 72. Environmental comparison among different packaging materials
Material Advantages Drawbacks
Glass Strong
Suitable for reuse and recycling
Can use high recycled content
Heavier than other materials, which causes higher impacts in transportation
Energy intensive to make
Paper and board Easy to recycle
Uses naturally occurring, renewable materials
Lightweigh
Cannot be recycled indefinitely
Produces methane if sent to landfill
Only a third of paper comes from sustainably managed forest
Poor moisture resistance
Metal Suitable for recycling
Uses high recycled content
High strength to weigh ratio
Energy intensive to mine raw materials and to manufacture
Steel corrodes
Lack of standardised recycling procedures for aerosols
Aerosols can only be made of virgin materials for safety reasons
Conventional plastics
Suitable for recycling
Can use high recycled content
Lightweight and strong
Made from oil, a non renewable resource
Requires sorting in the waste stream due to wide variety plastic used
No unified global standard for recycling
Often burnt on open fires damaging health and environment damage if it contents chlorine
Degradable plastics
Decomposes back to natural elements
Lightweight and strong
Makes poor fertilizer when composted
Can contaminate recycling stream as easily confused with conventional plastics
May use metal compound which could contaminate the contents or damage environment
Biopolymers Uses naturally occurring, renewable raw material
Can reduce fossil fuel use
Could compete with food for use of crops, raisin prices
Inefficient use of biomass
Produces methane if sent to landfill
Can be confused with conventional plastics potentially contaminating that recycling stream if not compatible
Poor barrier properties compared with traditional plastics
Large amounts of water needed to grow biomass
Source: Document “Sustainable Packaging?” by Unilever99. Original source of data is WRAP(Waste & Resources Action Programme, United Kingdom)
Materials used for soaps, shampoos and hair conditioners packaging
Information of different kinds of packaging materials used for soap products category have been gathered in order to determine the most problematic aspects of each material. For liquid soaps, shampoos and hair conditioners products, packaging is made usually of different kind of plastics.
99 Sustainable Packaging?” by Unilever (http://www.unilever.com/images/sd_Sustainable%20Packaging%20(2009)_tcm13‐212667.pdf)
DRAFT

109
Therefore, a preliminary comparative assessment of different materials: PVC, PET, PE and PP and biopolymer is presented. For solid soaps, flexible plastic and packaging paper and cardboard are used as packaging materials.
In Table 74 it can be observed the most widely used materials for packaging of studied products. For liquid soaps, shampoos and hair conditioners bottles are normally made of PE plastic (34.74%), followed by PET plastic (25.38%) and PP plastic (14.67%). Other polymers like PVC are less used. It can be said that for some products, generic plastic is indicated as the material where the kind of plastic use is not available in Database. For solid soaps, packaging made of different types of cardboards and paper represent 59% of products.
Table 73. Materials used for packaging of studied products.
Source. Mintel GNPD Databases (liquid soaps, solid soaps, shampoos and hair conditioners, 2011)
The plastic materials used for packaging of the soaps, shampoos and hair conditioners are described
briefly below.
Polyvinyl chloride (PVC)
Polyvinyl chloride (PVC) is a synthetic polymer material (or resin), which is built up by the repetitive
addition of the monomer vinyl chloride (VCM). The chlorine in PVC represents 57% of the weight of
the pure polymer resin and 35% of chlorine ends up in PVC, which thus constitutes the largest single
use.
PVC has been at the centre of a controversial debate during much of the last two decades. A number
of diverging scientific, technical and economic opinions have been expressed on the question of PVC
and its effects on human health and the environment. Some Member States have recommended or
adopted measures related to specific aspects of the PVC life cycle. However, these measures vary
widely100. PVC is discussed in terms of environmental impact and health and environment issues
mainly due to the use of vinyl chloride monomer (VCM) and additives such as phthalates. In
packaging, though, PVC bottles are of minor importance. Hard PVC is more commonly used than soft
PVC for soaps packaging.
100 http://ec.europa.eu/environment/waste/pvc/index.htm
Liquid soaps, shampoos and conditioners packaging
Material Percentage
PE plastic 34.74%
PET plastic 25.38%
PP plastic 14.67%
PVC plastic 1.18%
HDPE plastic 4.04%
Plastic (generic) 17.20%
Others materials 2.79%
Solid soaps packaging Material Percentage
Plastic (non specified) 31%
Cardboard with white coating 23%
Plain paper 14%
Laminated paper 10%
PP plastic 8%
Solid white cardboard 8%
PE 2%
Unlined Cardboard 2%
Laminated cardboard 1%
Cardboard coated with brown kraft 1%
DRAFT
110
From a PVC life cycle perspective101, the production of intermediates, particularly the processes from
the resource extraction of crude oil and rock salt up to the VCM production, play a major role for the
environmental impacts. Most of the impacts are caused by emissions to air and water, especially by
hydrocarbons, nitrogen oxide and sulphur dioxide emissions to air.
We shall nevertheless .highlight that in this study are used data which is currently outdated and an
investigation on uncontrolled incineration which leads to dioxins formation is not included.
Production of stabilisers and plasticizers plays a significant role, whereas the production of pigments
offers a comparatively low optimisation potential, because of the small volumes involved. The most
commonly used plasticisers are phthalates, of which di‐2‐ethylhexyl phthalate (DEHP) has
traditionally accounted for 50% of European phthalate use. Others include diisononyl phthalate
(DINP), di‐isodecyl phthalate (DIDP), di‐butyl phthalate (DBP) and butylbenzyl phthalate (BBP). These
phthalates are classified as toxic for reproduction.
PVC is also difficult to recycle given the presence of additives including heavy metals such as lead and
cadmium; in fact it is considered a contaminant in other recycling streams. Currently only a small
amount of PVC post consumer waste is being recycled, whereas the 82% of PVC post‐consumer
waste is landfilled, and 15% is incinerated. Incineration, in conjunction with municipal waste disposal,
is a simple option that allows for the partial recovery of energy and substances, if state‐of‐the‐art
technology is applied. In case of uncontrolled incineration (or incineration under non‐BAT conditions)
concerns related to dioxins formation are raised. From an LCA point of view, PVC shows the obvious
disadvantages within a mixed waste fraction in the packaging sector. If mixed packaging waste
contains PVC, the usability of the waste is limited. Moderate recycling potentials can be attributed
PVC (25% rates) in mixed packaging wastes.102
Polyethylene‐Terephthalate (PET)
PET is made out of ethylene and paraxylene. Their derivatives (ethylene glycol and terephthalic acid)
are made to react at high temperature and high pressure to obtain amorphous PET. The resin is then
crystallized and polymerized to increase its molecular weight and its viscosity. PET is generally used
in packaging (e.g. bottles) and often contains additives such as UV stabilisers and flame retardants.
PET major impact has high energy demand, much higher that other plastics such as PP or PE. On the
other hand, PET mechanical recycling rates are high compared to other plastics103.
Polyolefins (PE and PP)
Polyolefins such as Polyethylene (PE) and Polypropylene (PP) are simpler polymer structures that do
not need plasticizers, although they do use additives such as UV and heat stabilizers, antioxidants
and in some applications flame retardants. The polyolefins pose fewer risks and have the highest
potential for mechanical recycling. Both PE and PP are versatile and cheap, and can be designed to
101 Life Cycle Assessment of PVC and of principal competing materials. PE Europe GmbH, Institut für Kunststoffkunde und Kunststoffprüfung (IKP), Instituttet for Produktudvikling (IPU), DTU, RANDA GROUP. Commissioned by the European Commission, July 2004. 102 Mechanical recyclening of PVC wastes. Study for DG XI of the European Commission (B4‐3040/98/000821/MAR/E3) in co‐operation with: Plastic Consult (Italy), COWI (Denmark).Eckhard Plinke (Prognos), Niklaus Wenk (Prognos), Gunther Wolff (Prognos), Diana Castiglione (Plastic Consult), Mogens Palmark (COWI), Basel/Milan/Lyngby, January 2000 103 LCA of one way PET bottles and recycled products. IFEU‐ Heidelberg. 2004
DRAFT

111
replace almost all PVC applications. PE can be made either hard, or very flexible, without the use of
plasticizers. PP is easy to mould and can also be used in a wide range of applications.
In comparison with PVC, PE and PP use fewer problematic additives, have reduced leaching potential
in landfills, reduced potential for dioxin formation during burning (provided that
brominated/chlorinated flame retardants are not used), and reduced technical problems and costs
during recycling.
Bio‐based Polymers
There are two possible categories of plastics that can be derived from renewable resources. One
option is the production of new monomers (such as polylactic acid) to make new, possibly
biodegradable, polymers (e.g. PLA). Here the commercial challenge is to compete with existing large
volume plastics in terms of production economics and adapting processing equipment. The other
route is to make high volume monomers such as ethylene (or other ethylene derivatives) from
ethanol derived from renewable sources. This can then be used in existing polymerisation plants
making the well known polyethylene grade ranges. In both cases the chemistry is proven, but a key
consideration will be the amount of non‐renewable energy used in the overall manufacturing chain.
Bio‐based plastics can be made out of products obtained from raw materials produced by a natural
living or growing systems, such as starch and cellulose. The advantage of bio‐polymers is that they
readily degrade and can be composted. Natural polymers include cellulose (from wood, cotton), horn
(hardened protein) and raw rubber. Converted natural polymers include vulcanized rubber,
vulcanized fibre, celluloid and casein protein.
Biodegradable plastics from renewable sources (bio‐based) are seen as a promising alternative for
plastic products which have a short life cycle or are impractical to recycle, such as food packaging,
agricultural plastics and other disposables.
Based on CEEI a comparative environmental impact for PET, PE and PLA is presented in Table 75
below. CEEI show the composite’s impact on the environment, taking into account the resources
used and the pollution generated during production, use, and disposal of the item. It can be seen
that PLA has the biggest environmental impact, followed by PET whereas PE is the polymer with
lower impact.
Table 74. Comparative environmental impact for PET, PE and PLA
Impact of 1kg of plastic
Overall impact (CEII): Depletion (DI) Pollution (PI) Entropy (EI))
PET (polyethylene terephthalate)
2051.28 109105.37 1080.13 0.00
Polyethylene 924.29 8962.51 852.15 0.20
Corn plastic (bioplastic, polylactic acid, PLA)
3375.20 83295.63 2652.03 2.18
Source: CEII: Composite Environmental Impact Index104
104 http://envimpact.org/
DRAFT

112
Eco‐Profiles information for PET and PE
Environmental Product Declaration (EPD) from Eco‐Profiles of Plastics Europe for PET and PE105 has
been consulted, in order to compare the two most commonly used polymers. A summary of the data
is listed in table 76 below. It can be seen that PET has a higher impact in the majority of indicators
related to energy and water use and also in category impact indicators than HDPE.
Table 75. Comparative inputs and outputs of PET and HDPE (EPD form Plastics Europe)
Input Parameters
Indicator Unit Value (PET) Value (HDPE)
Non‐renewable energy resources1
Fuel energy MJ 30–34 21.7
Feedstock energy MJ 35–39 54.3
Renewable energy resources (biomass)1
Fuel energy MJ 0.8 0.8
Feedstock energy MJ 0
Abiotic Depletion Potential
Elements kg Sb eq 0.030
Fossil fuels MJ 69.0
Minerals g 2.6
Fossil fuels g 1,595.7
Uranium g 0.006
Renewable materials (biomass) kg 0.001 8.704
Water use kg
For process kg 7.00 3.378
For cooling kg 53.00 ‐
Output Parameters
Indicator Unit Value (PET) Value (HDPE)
GWP kg CO2 eq 2.15 1.96
ODP g CFC‐11 eq 0.01 n/a3)
AP g SO2 eq 7.90 6.39
POCP (CML 2009) g Ethene eq 0.59 1.23
EP (CML 2009) g PO4 eq 0.81 0.43
Dust/particulate matter2) g PM10 6.92 0.64
Total particulate matter3) g 7.1 0.64
Waste (before treatment)
Non‐hazardous kg 0.57 0.032
Hazardous kg 0.0045 0.006
1) Calculated as upper heating value (UHV) 2) Including secondary PM10 3) Relevant LCI entries are below quantification limit.
Source: Plastic Europe PET Ecoprofile (2011‐05)106, Plastic Europe HDPE Ecoprofile (2008)107
105 http://www.plasticseurope.org/plastics‐sustainability/eco‐profiles.aspx 106 Environmental Product Declarations of the European Plastics Manufacturers. Polyethylene Terephthalate (PET) (Bottle Grade) Plastics Europe. May 2011
DRAFT

113
LCIA: Comparison of different packaging plastic materials
A comparative impact assessment has been done by LEITAT for different plastic packaging used for soaps category group. Analyses have been done in the framework of general LCA study and the same assumptions and method (2002+ impact assessment method) has been used. Materials have been taken from Ecoinvent Database. Results showed in figure 23 corroborate the results gathered from literature. In general, from the analysis done it could be said that PET is the material with major environmental impacts, as it consumes a high amount of energy and water to be produced. Also in categories related to human toxicity PET presents higher values, as well as in terrestrial ecotoxiciy and mineral resources extraction.
Biopolymers presents high environmental impacts in categories in aquatic toxicity and acidification, land occupation, global warming.
PVC seems to have lower impacts than PET and HDPE, but problematic additives in PVC and toxicity effect of chloride compounds may not be included and they should be taken into account.
In general terms, PVC bottles tend to have comparable impacts to those of PET bottles.
HDPE have lower impacts than its competitors, although it has high values in categories of respiratory organics and use of non‐renewable energy.
Figure 23. Comparative analysis of PVC, PET, HDPE and biopolymer
The same information represented in a unique punctuation aggregating all impact categories
(weighting) can be seen in Figure 24. PET has the highest environmental impact, mainly due to the
use of non‐renewable energy, global warming and carcinogens. The second polymer with higher
impact is Byopolymer, and environmental impacts come from the use of non‐renewable energy, 107 Environmental Product Declarations of the European Plastics Manufacturers. High density polyethylene (HDPE). 2008
DRAFT
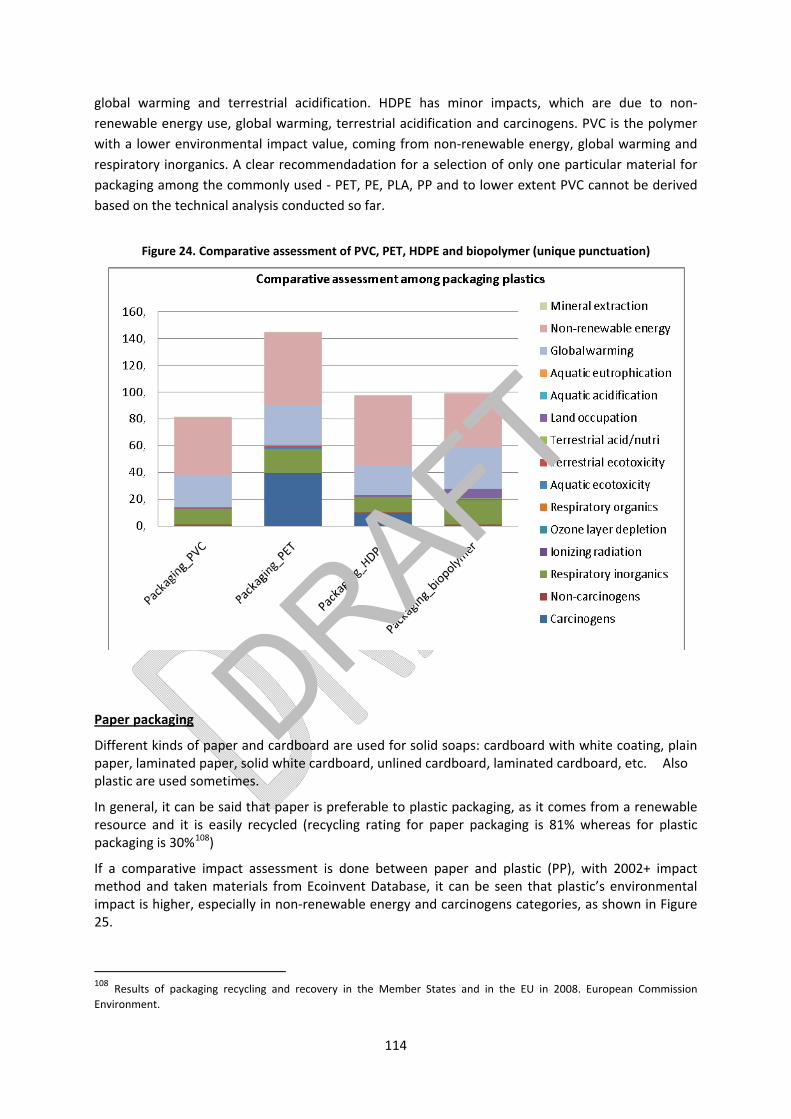
114
global warming and terrestrial acidification. HDPE has minor impacts, which are due to non‐
renewable energy use, global warming, terrestrial acidification and carcinogens. PVC is the polymer
with a lower environmental impact value, coming from non‐renewable energy, global warming and
respiratory inorganics. A clear recommendadation for a selection of only one particular material for
packaging among the commonly used ‐ PET, PE, PLA, PP and to lower extent PVC cannot be derived
based on the technical analysis conducted so far.
Figure 24. Comparative assessment of PVC, PET, HDPE and biopolymer (unique punctuation)
Paper packaging
Different kinds of paper and cardboard are used for solid soaps: cardboard with white coating, plain paper, laminated paper, solid white cardboard, unlined cardboard, laminated cardboard, etc. Also plastic are used sometimes.
In general, it can be said that paper is preferable to plastic packaging, as it comes from a renewable resource and it is easily recycled (recycling rating for paper packaging is 81% whereas for plastic packaging is 30%108)
If a comparative impact assessment is done between paper and plastic (PP), with 2002+ impact method and taken materials from Ecoinvent Database, it can be seen that plastic’s environmental impact is higher, especially in non‐renewable energy and carcinogens categories, as shown in Figure 25.
108 Results of packaging recycling and recovery in the Member States and in the EU in 2008. European Commission
Environment.
DRAFT

115
Figure 25. Comparative impact assessment between paper and plastic packaging.
Recycling and waste treatments of packaging materials
According to European statistics109 (see inventory section) paper and cardboard packaging is
recycled in 80% (much more than plastic packaging waste), although some kind of coated or
laminated paper, or if it is contaminated with the content, can be difficult to be recycled properly
and the share of real recycling can be lower.
Plastic packaging waste is partially sorted and recycled. Different kinds of plastic have different
recycling processes and recycling ratios.
PET is widely recycled as a material, making a large contribution to the recycling targets for
packaging plastics. PET can be recovered, and the material reused, by simple washing
processes or by chemical treatment to break down the PET into raw materials or
intermediates. A final option for PET that is unsuitable for material recycling is to use it as
energy source. When recycling is not undertaken, in landfills PET is stable and inert with no
leaching or groundwater risk (Ref.).
HDPE is also widely accepted at recycling centres, HDPE scrap is commonly recycled into new
products such as plastic lumber, tables, benches, stationary and other durable plastic
products. To return the highest value to recyclers, waste HDPE must be of one grade, one
colour, and be almost entirely free of contamination. The expense of sorting material into
different grades and colours can make its recovery uneconomic. Coloured HDPE, multi‐
109 Results of packaging recycling and recovery in the Member States and in the EU in 2008. European Commission
Environment.
DRAFT

116
layered package types, and packages with barrier coatings or containing barrier resins may
not be readily marketable. Package components such as the cap, the label, and the colouring
can reduce the value of the recovered material if not removed or designed with recycling in
mind.
PVC used for packaging pose the greatest problems to be recycled, but currently post‐use
PVC used for packaging and present in mixed packaging waste can be recycled although to
limited applications of the recycled material, as usually the amount of PVC in a typical waste
site is less than 1 per cent and the metal content will generally not be more than 2 per cent
of this amount110.
Biodegradable polymers can present advantages compared with long lasting polymers for
packaging uses. For conventional plastics waste, material valorisation implies some
limitations linked to the difficulties to find accurate and economically viable output for
recycled material, and energetic valorisation yields some toxic emissions (e.g., dioxin).
Biodegradation is an advantageous way of waste treatment, although some environmental
impacts can be produced due to eco‐toxicity for those by‐products generated during
biodegradation processes. The accumulation of contaminations with toxic residues and
chemical reactions of biodegradation can cause plant growth inhibition in these products,
which must serve as fertilizers”.111
In conclusion, it can be said that sorting and recycling of any type of plastic packaging waste is well
stidies and technical solutions are in general available but economic constraints are identified. Since
collecting and recycling systems have to be established, aiming for sorted plastics of a certain
(constant) mass stream and quality and are associated with costs. As materials extraction and
manufacturing have a huge environmental impact, recycling process is of high importance, in order
to use recycled material and avoid impacts coming from manufacturing new packaging material112.
Labelling and printing processes in packaging
Impact assessment of labels and different printing and gravure processes has been assessed and
compared. For liquid products, there are some bottles with labels, whereas in other products
information is directly printed on the plastic packaging materials. For bar soap packaging, package is
directly printed with different methods: lithography (46%), rotogravure (23%) and flexographic
printing (20%)113
From the assessment done, it has been obtained that only a 8‐5 % (depending on the label or printing
system used) of the whole environmental impact related to packaging comes from labelling or
printing process, whereas the rest of the environmental impact comes from packaging material and,
whith a minor percentage, the packaging manufacturing process.
In Figure 26 it is compared different kinds of decoration: labelling, gravure printing and flexography
printing. It can be seen that bottles with labels have bigger environmental impact than those which
110 http://www.pvc.org/en/ 111 “Biodegradable polymers (Biopolymers)” available at http://www.biodeg.net/biopolymer.html 112 The impact of plastics on life‐cycle energy consumpion and GHG emissions in Europe; Denkstatt GmbH, 2010 113 Mintel GNPD Database
DRAFT

117
0,
20,
40,
60,
80,
100,
120,
Packaging (label) Packaging (gravure) Packaging (flexography)
Environmental impact of packaging with different printing systems
Mineral extraction
Non ‐renewable energy
Global warming
Aquatic eutrophication
Aquatic acidification
Land occupation
Terrestrial acid/nutri
Terrestrial ecotoxicity
Aquatic ecotoxicity
Respiratory organics
Ozone layer depletion
Ionizing radiation
Respiratory inorganics
Non ‐carcinogens
Carcinogens
are directly printed, due to the material used for the label. Moreover, some kind of labelling can
complicate the recycling processes of packages. Metallised labels, for instance, do not separate well
from the flaked plastic, potentially making recovery of packages with these labels uneconomic. PVC
shrink labels are very difficult to remove and most do not have tolerance of PVC contamination.
Kinds of inks and substances present in these inks have been not analysed due to lack of data.
Figure 26. Comparative environmental impact for label packaging, packaging gravure and packaging flexography
Refilling – reusable packaging
Some soap products have the option of refilling or reusable package, where the refill package is usually lighter that the conventional package. It is quite usual in hand‐soaps where refilling package have a dispenser and refill package is a more simple bottle. Also other soap products with refill packaging such as body liquid soap exist. Among all liquid soaps products of European market, 10% have refilling systems114. For shampoos it seems that only 26 products exist with refilling system (0.02%), and 2 conditioners products (0.04%).
Refilling system can provide a packaging saving of the 79% of weight, which can be converted to a 79% of saving of environmental impact of packaging stage115, as it is mainly produced for the raw material and in material manufacturing, as the assessment done shows, environmental impact is directly proportional to weight. For instance in the case of liquid soaps, by using a refilling system, the packaging impact contribution can decrease from 34% to 12%, and the global environmental
114 Mintel GNPD Data Base. Category: liquid soaps. 2012. 115 Data obtained from direct calculation for a refilling product of liquid soap
DRAFT

118
impact of the product decrease by 27% with respect the original soap with non‐refill packaging. Therefore withing the Ecolabel scheme special focus should be given to this issue.
10.10. Conclusions on life cycle impact assessment
Introduction of good environmental practices and requirements in the Ecolabel criteria have been
analysed in order to estimate and measure the improvement potential and the resulting
environmental impact minimization. In the following table 77 a general overview regarding the
significant impacts found per life cycle phase and the corresponding action proposed for the Ecolabel
is outlined. The following four information elements and their interrelation are presented:
1. Outcomes of the environmental performance of the product group
2. Appropriateness and potential to regulate this area through the policy tool of Ecolabel
3. Ecolabel criterion that is taken or is now proposed per area of action.
4. The environmental savings and improvement that is expected from the Ecolabel criterion
DRAFT

119
Table 76. Outcomes of life cycle assessment and actions in Ecolabel – a general overview
STAGE Environmental
impact
Potential
regulation
by EU
Ecolabel
Good environmental
practices /restrictions
Improvement potential
Select for each functional
group of those substances
less pollutant (Ecotoxicity
factors, CLP, biodegradability)
‐ Improvement of the environmental performance of ingredients used, including during stages of manufacturing, use and release to water.
‐ Minimize potential ecotoxicity effects if products are released to different environmetnal compartments.
Chemicals 24% of the total
environmental
impact for solid
soaps,
19% for hair
conditioners,
7% for shampoo
,
5% for liquid
soaps
High
Select substances with less
energy and non‐renewable
consumption
‐ An important part of environmental impact of substances comes from energy and resources used during its manufacturing.
Manufacturi
ng
8% on average
of the total
environmental
impact
Moderate
/ Medium
Improvement in
manufacturing processes
efficiency, mainly in energy
use
‐ Reduction of impacts from manufacturing process, which come mainly from the use of non‐renewable energy for heating and electricity.
‐ Minimization of environmental impacts in categories of global warming, use of non‐renewable energy.
Minimize packaging weight ‐ 70% environmental impact of packaging is due to the material used (the rest is generated by manufacturing of packaging)
‐ Decreases in weight (amount of material) have direct decreases in environmental impacts.
Increase recycled material
sources
‐ 70% environmental impact of packaging is due to the material used
‐ Decrease of virgin material has environmental impact savings.
Materials selection:
‐ Use materials with a minor environmental impact
‐ 70% environmental impact of packaging is due to the material used (the rest is generated by manufacturing of packaging)
‐ Select plastic with low environmental impact along its life cycle (including production phase and recycling phase. Consider potential for reusability and recyclability
Labelling / information system ‐ Packaging without label has a 3% of less impact.
‐ Packaging without label is more easily recycled.
Refilling systems ‐ Refilling system can provide a packaging saving of the 79% of weight
Packaging
25% of the total
environmental
impact for liquid
soaps,
36% for hair
conditioners,
32% for
shampoo ,
6% for solid
soaps
High
Guarantee recyclability:
‐ Use recyclable materials
‐ Recycling of waste is in general environmentally preferable than other treatments (energy recovery or landfill),
DRAFT

120
‐ All parts separable or compatible
nevertheless it can differ for various materials. Recycling allows producing material which can enter again to the system enabling environmental impacts saving in first stages of life product.
Distribution Average of 5%
of total product
environmental
impact
Low Improve efficiency in logistic
and transport processes.
Decrease weight of packaging
(lower weight of transported
product)
‐ Environmental improvement due to saving of fossil fuel use.
Improvements in products
performance: dosage, more
easily rinse‐off.
‐ Reducing dose/washing action ‐ Reducing water consumed /washing action
Use 34‐17% of total
product
environmental
impact
depending on
each product
Low
Communication and
awareness messages to users
‐ Reducing product and water consumed /washing action
Release to
water
27‐13% of total
product
environmental
impact
depending on
each product
Impacts
from this
stage
depend on
raw
materials
and use
stage
Use substances which are not
toxic for the environment or
the humans.
‐ Environmental impact minimization coming from wastewater treatment..
Treatment
of
packaging
waste
0.5 % – 0.18 %
of the total
environmental
impact of
products
(depending on
each product)
Impacts
from this
stage
depend on
packaging
stage
Increase recycling rates in
packaging waste.
Reduce amount of waste
generated by packaging
(refilling systems, lower
packaging weight)
‐ In general, recycling of waste is
environmentally preferable than other
treatments (energy recovery or landfill),
nevertheless, differences among materials
exist in this respect.
DRAFT

121
11. Bibliography and references Note: to be completed with documents referenced in the report.
General reports and guidelines
Nordic Ecolabelling of Cosmetic products. Version 2.1. 12 October 2010 – 31 December 2014.
Final report. For the development of ecolabelling criteria. EU Eco‐label for shampoo and soaps. Ecolabelling Norway. Eskeland,, M.B, Svanes, E. May 2006.
COLIPA GUIDELINES. Cosmetic Frame Formulations. Guidelines realized in collaboration with the European Association of Poison Centres and Clinical Toxicologists (EAPCCT). January 2000.
Life cycle assessment studies on soaps, shampoos and hair conditioners.
Comparing the Environmental Footprints of Home‐Care and Personal‐Hygiene Products: The Relevance of Different Life‐Cycle Phases. Annette Koehler* and Caroline Wildbolz. ETH Zurich, Institute of Environmental Engineering, 8093 Zurich, Switzerland. Environ. Sci. Technol., 2009, 43 (22), pp 8643–8651. DOI: 10.1021/es901236
CASE STUDY SHAMPOO BY HENKEL AG & CO. KGAA. Case Study undertaken within the PCF Pilot Project Germany. 2008 (http://www.pcf‐projekt.de/files/1236586214/pcf_henkel_shampoo.pdf)
A life‐cycle inventory for the production of soap in Europe. POSTLETHWAITE D. Hanser ISSN: 0932‐3414 CODEN: TSDEES Tenside, surfactants, detergents Y. 1995, vol. 32, No. 2, [80, 157‐170 [14 p.]]
Studies on packaging and packaging materials
Life Cycle Assessment of PVC and of principal competing materials. Commissioned by the European Commission, July 2004.
Comparative LCA on Plastic Packaging. May 2005 Britta Lehmann, Francisco Vilaplana, Emma Strömberg , Widad Suliman, Laura Rodriguez Cerrato
Sustainable packaging. Unilever (www.unilever.com).
The impact of plastics on life cycle energy consumption and greenhouse gas emissions in Europe. Summary report. June 2010. Denkstatt. Plastics Europe.
Eco‐profiles of the European plastics industry. Association of Plastics Manufacturers in Europe (Plastics Europe), Brussels, Belgium.
Studies on chemicals and cosmetics environmental impacts
The relationship of the environmental effect of surfactants to their interfacial properties. Milton J. Rosen, Lin Fei, Yun‐Peng Zhu and Stephen W. Morrall. Journal of Surfactants and Detergents Volume 2, Number 3, 343‐347, DOI: 10.1007/s11743‐999‐0087‐2
Good Sustainability practice (GSP) for the cosmetics industry. Colipa.
DRAFT

122
12. Annex I Hazard statements according to CLP 1272/2008 for hazardous substances
Hazard statement according to CLP 1272/2008/EEC Associated risk phrases according to Directive 67/548/EEC
H300 Fatal if swallowed R28
H301 Toxic if swallowed R25
H304 May be fatal if swallowed and enters airways R65
H310 Fatal in contact with skin R65
H311 Toxic in contact with skin R65
H330 Fatal if inhaled R23; R26
H331 Toxic if inhaled R23
H340 May cause genetic defects R23
H341 Suspected of causing genetic defects R68
H350 May cause cancer R45
H350i May cause cancer by inhalation R49
H351 Suspected of causing cancer R40
H360F May damage fertility R60
H360D May damage the unborn child R61
H360FD May damage fertility. May damage the unborn child R60‐61
H360Fd May damage fertility. Suspected of damaging the unborn child R60‐63
H360Df May damage the unborn child. Suspected of damaging fertility R61‐62
H361f Suspected of damaging fertility R62
H361d Suspected of damaging the unborn child R63
H361fd Suspected of damaging fertility. Suspected of damaging the unborn child R62‐63
H362 May cause harm to breast‐fed children R64
H370 Causes damage to organs R39/23; R39/24; R39/25; R39/26; R39/27; R39/28
H371 May cause damage to organs R68/20; R68/21; R68/22
H372 Causes damage to organs through prolonged or repeated exposure R48/25; R48/24; R48/23
H373 May cause damage to organs through prolonged or repeated exposure R48/20; R48/21; R48/22
H400 Very toxic to aquatic life R50
H410 Very toxic to aquatic life with long‐lasting effects R50‐53
H411 Toxic to aquatic life with long‐lasting effects R51‐53
H412 Harmful to aquatic life with long‐lasting effects R52‐53
DRAFT

123
Hazard statement according to CLP 1272/2008/EEC Associated risk phrases according to Directive 67/548/EEC
H413 May cause long‐lasting harmful effects to aquatic life R53
EUH059 Hazardous to the ozone layer R59
EUH029 Contact with water liberates toxic gas R29
EUH031 Contact with acids liberates toxic gas R31
EUH032 Contact with acids liberates very toxic gas R32
EUH070 Toxic by eye contact R39‐41
H334 May cause allergy or asthma symptons or breathing difficulties if inhaled R42
H317 May cause allergic skin reaction R43
DRAFT

124
13. Annex II
Hazard statements according to the CLP Regulation
H200‐ SERIES: PHYSICAL HAZARDS
H200 Unstable explosive
H201 Explosive; mass explosion hazard
H202 Explosive; severe projection hazard
H203 Explosive; fire, blast or projection hazard
H204 Fire or projection hazard
H205 May mass explode in fire
H220 Extremely flammable gas
H221 Flammable gas
H222 Extremely flammable material
H223 Flammable material
H224 Extremely flammable liquid and vapour
H225 Highly flammable liquid and vapour
H226 Flammable liquid and vapour
H228 Flammable solid
H240 Heating may cause an explosion
H241 Heating may cause a fire or explosion
H242 Heating may cause a fire
H250 Catches fire spontaneously if exposed to air
DRAFT
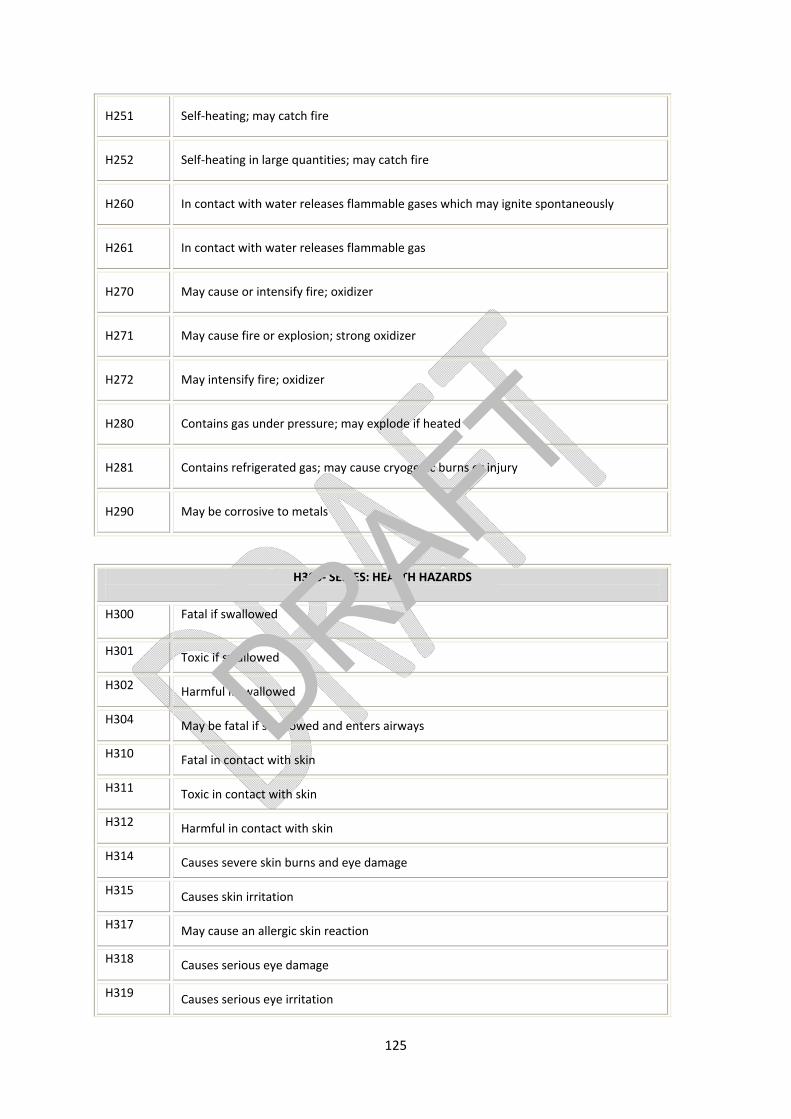
125
H251 Self‐heating; may catch fire
H252 Self‐heating in large quantities; may catch fire
H260 In contact with water releases flammable gases which may ignite spontaneously
H261 In contact with water releases flammable gas
H270 May cause or intensify fire; oxidizer
H271 May cause fire or explosion; strong oxidizer
H272 May intensify fire; oxidizer
H280 Contains gas under pressure; may explode if heated
H281 Contains refrigerated gas; may cause cryogenic burns or injury
H290 May be corrosive to metals
H300‐ SERIES: HEALTH HAZARDS
H300 Fatal if swallowed
H301 Toxic if swallowed
H302 Harmful if swallowed
H304 May be fatal if swallowed and enters airways
H310 Fatal in contact with skin
H311 Toxic in contact with skin
H312 Harmful in contact with skin
H314 Causes severe skin burns and eye damage
H315 Causes skin irritation
H317 May cause an allergic skin reaction
H318 Causes serious eye damage
H319 Causes serious eye irritation
DRAFT

126
H330 Fatal if inhaled
H331 Toxic if inhaled
H332 Harmful if inhaled
H334 May cause allergy or asthma symptoms of breathing difficulties if inhaled
H335 May cause respiratory irritation
H336 May cause drowsiness or dizziness
H340 May cause genetic defects, (state route of exposure if it is conclusively proven that no other routes of exposure cause the hazard)
H341 Suspected of causing genetic defects (state route of exposure if it is conclusively proven that no other routes of exposure cause the hazard)
H350 May cause cancer May cause cancer (state route of exposure if it is conclusively proven that no other routes of exposure cause the hazard)
H350i May cause cancer by inhalation
H351 Suspected of causing cancer (state route of exposure if it is conclusively proven that no other routes of exposure cause the hazard)
H360 May damage fertility or the unborn child (state specific effect if known)(state route of exposure if it is conclusively proven that no other routes of exposure cause the hazard)
H360F May damage fertility
H360D May damage the unborn child
H360FD May damage fertility. May damage the unborn child
H360Fd May damage fertility. Suspected of damaging the unborn child
H360Df May damage the unborn child. Suspected of damaging fertility
H361 Suspected of damaging fertility or the unborn child (state route of exposure if it is conclusively proven that no other routes of exposure cause the hazard)
H361f Suspected of damaging fertility.
H361d Suspected of damaging the unborn child.
H361fd Suspected of damaging fertility. Suspected of damaging the unborn child
H362 May cause harm to breast‐fed children
H370 Causes damage to organs (or state all organs affected, if known) (state route of exposure if it is conclusively proven that no other routes of exposure cause the hazard)
H371 May cause damage to organs (or state all organs affected, if known) (state route of exposure if it is conclusively proven that no other routes of exposure cause the hazard)
H372
Causes damage to organs through prolonged or repeated exposure (state all organs affected, if known) through prolonged or repeated exposure (state route of exposure if it is conclusively proven that no other routes of exposure cause the hazard)
DRAFT

127
H373 May cause damage to organs through prolonged or repeated exposure (state all organs affected, if known) through prolonged or repeated exposure (state route of exposure if it is conclusively proven that no other routes of exposure cause the hazard)
H400‐ SERIES: ENVIRONMENTAL HAZARDS
H400 Very toxic to aquatic life H410 Very toxic to aquatic life with long lasting effects H411 Toxic to aquatic life with long lasting effects H412 Harmful to aquatic life with long lasting effects H413 May cause long lasting harmful effects to aquatic life
EUH‐ STATEMENTS
EUH001 Explosive when dry.
EUH006 Explosive with or without contact with air.
EUH014 Reacts violently with water.
EUH018 In use may form flammable/explosive vapour‐air mixture.
EUH019 May form explosive peroxides.
EUH044 Risk of explosion if heated under confinement.
EUH029 Contact with water liberates toxic gas.
EUH031 Contact with acids liberates toxic gas.
EUH032 Contact with acids liberates very toxic gas.
EUH066 Repeated exposure may cause skin dryness or cracking.
EUH070 Toxic by eye contact.
EUH071 Corrosive to the respiratory tract.
EUH059 Hazardous to the ozone layer.
EUH201 Contains lead. Should not be used on surfaces liable to be chewed or sucked
EU H201A Warning! Contains lead.
EUH202
Cyanoacrylate. Danger. Bonds skin and eyes in seconds. Keep out of the reach of children.
EUH203 Contains chromium (VI). May produce an allergic reaction.
DRAFT
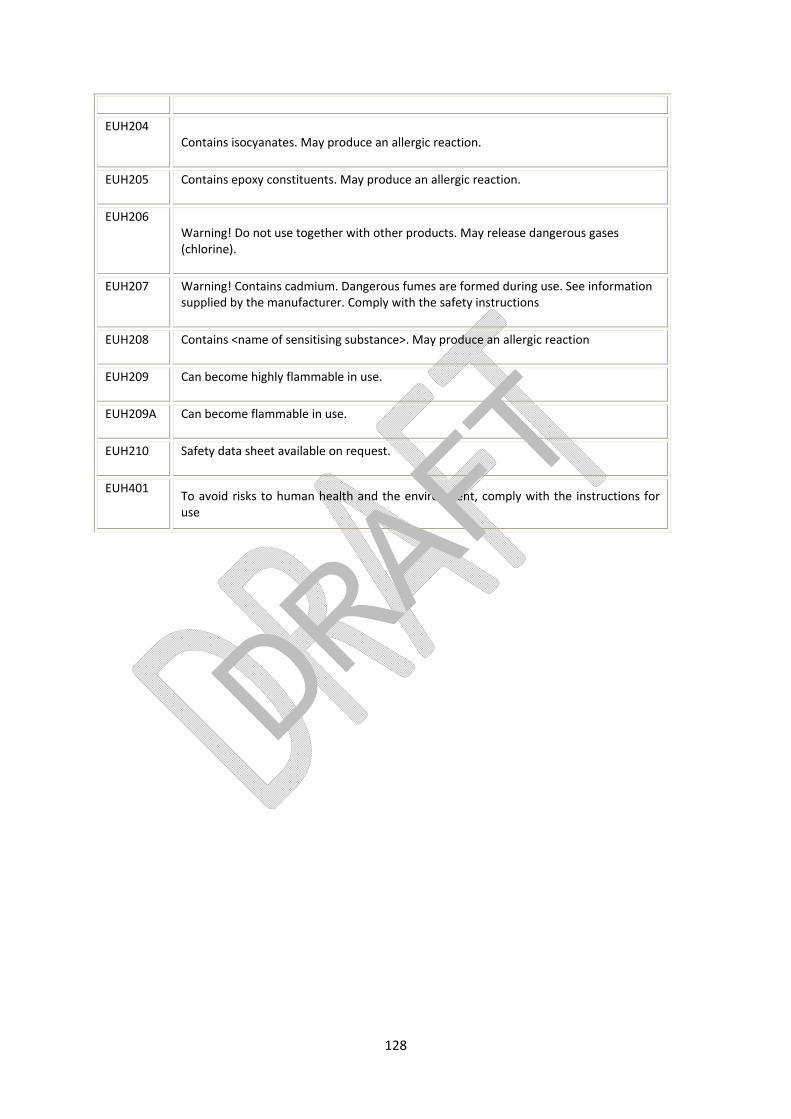
128
EUH204 Contains isocyanates. May produce an allergic reaction.
EUH205 Contains epoxy constituents. May produce an allergic reaction.
EUH206 Warning! Do not use together with other products. May release dangerous gases (chlorine).
EUH207 Warning! Contains cadmium. Dangerous fumes are formed during use. See information supplied by the manufacturer. Comply with the safety instructions
EUH208 Contains <name of sensitising substance>. May produce an allergic reaction
EUH209 Can become highly flammable in use.
EUH209A Can become flammable in use.
EUH210 Safety data sheet available on request.
EUH401 To avoid risks to human health and the environment, comply with the instructions for use
DRAFT

129
14. Annex III Risk phrases according to Directive 67/548/EEC
SINGLE RISK PHRASES
R1 Explosive when dry.
R2 Risk of explosion by shock, friction, fire or other sources of ignition.
R3 Extreme risk of explosion by shock, friction, fire or other sources of ignition.
R4 Forms very sensitive explosive metallic compounds.
R5 Heating may cause an explosion.
R6 Explosive with or without contact with air.
R7 May cause fire.
R8 Contact with combustible material may cause fire.
R9 Explosive when mixed with combustible material.
R10 Flammable.
R11 Highly flammable.
R12 Extremely flammable.
R13 Extremely flammable liquified gas. This code is no longer in use.
R14 Reacts violently with water.
R15 Contact with water liberates highly flammable gases.
R16 Explosive when mixed with oxidizing substances.
R17 Spontaneously flammable in air.
R18 In use, may form flammable/explosive vapour‐air mixture.
R19 May form explosive peroxides.
R20 Harmful by inhalation.
R21 Harmful in contact with skin.
R22 Harmful if swallowed.
R23 Toxic by inhalation.
R24 Toxic in contact with skin.
DRAFT

130
R25 Toxic if swallowed.
R26 Very toxic by inhalation.
R27 Very toxic in contact with skin.
R28 Very toxic if swallowed.
R29 Contact with water liberates toxic gases.
R30 Can become highly flammable in use.
R31 Contact with acids liberates toxic gas.
R32 Contact with acids liberates Very toxic gas.
R33 Danger of cumulative effects.
R34 Causes burns.
R35 Causes severe burns.
R36 Irritating to eyes.
R37 Irritating to respiratory system.
R38 Irritating to skin.
R39 Danger of very serious irreversible effects.
R40 Possible risks of irreversible effects.
R41 Risk of serious damage to eyes.
R42 May cause sensitization by inhalation.
R43 May cause sensitization by skin contact.
R44 Risk of explosion if heated under confinement.
R45 May cause cancer.
R46 May cause heritable genetic damage.
R47 May cause birth defects.
R48 Danger of serious damage to health by prolonged exposure.
R49 May cause cancer by inhalation.
R50 Very toxic to aquatic organisms.
R51 Toxic to aquatic organisms.
DRAFT
131
R52 Harmful to aquatic organisms.
R53 May cause long‐term adverse effects in the aquatic environment.
R54 Toxic to flora.
R55 Toxic to fauna.
R56 Toxic to soil organisms.
R57 Toxic to bees.
R58 May cause long‐term adverse effects in the environment.
R59 Dangerous for the ozone layer.
R60 May impair fertility.
R61 May cause harm to the unborn child.
R62 Possible risk of impaired fertility.
R63 Possible risk of harm to the unborn child.
R64 May cause harm to breastfed babies.
MULTIPLE RISK PHRASES
R14/15 Reacts violently with water liberating highly flammable gases.
R15/29 Contact with water liberates toxic, highly flammable gas.
R20/21 Harmful by inhalation and in contact with skin.
R20/22 Harmful by inhalation and if swallowed.
R20/21/22 Harmful by inhalation, in contact with skin and if swallowed.
R21/22 Harmful in contact with skin and if swallowed.
R23/24 Toxic by inhalation and in contact with skin.
R23/25 Toxic by inhalation and if swallowed.
R23/24/25 Toxic by inhalation, in contact with skin and if swallowed.
R24/25 Toxic in contact with skin and if swallowed.
DRAFT

132
R26/27 Very toxic by inhalation and in contact with skin.
R26/28 Very toxic by inhalation and if swallowed.
R26/27/28 Very toxic by inhalation, in contact with skin and if swallowed.
R27/28 Very toxic in contact with skin and if swallowed.
R36/37 Irritating to eyes and respiratory system.
R36/38 Irritating to eyes and skin.
R36/37/38 Irritating to eyes, respiratory system and skin.
R37/38 Irritating to respiratory system and skin.
R39/23 Toxic: danger of very serious irreversible effects through inhalation.
R39/24 Toxic: danger of very serious irreversible effects in contact with skin.
R39/25 Toxic: danger of very serious irreversible effects if swallowed.
R39/23/24 Toxic: danger of very serious irreversible effects through inhalation and in contact with skin.
R39/23/25 Toxic: danger of very serious irreversible effects through inhalation and if swallowed.
R39/24/25 Toxic: danger of very serious irreversible effects in contact with skin and if swallowed.
R39/23/24/25 Toxic: danger of very serious irreversible effects through inhalation, in contact with skin and if swallowed.
R39/26 Very toxic: danger of very serious irreversible effects through inhalation.
R39/27 Very toxic: danger of very serious irreversible effects in contact with skin.
R39/28 Very toxic: danger of very serious irreversible effects if swallowed.
R39/26/27 Very toxic: danger of very serious irreversible effects through inhalation and in contact with skin.
R39/26/28 Very toxic: danger of very serious irreversible effects through inhalation and if swallowed.
R39/27/28 Very toxic: danger of very serious irreversible effects in contact with skin and if swallowed.
R39/26/27/28 Very toxic: danger of very serious irreversible effects through inhalation, in contact with skin and if swallowed.
DRAFT

133
R40/20 Harmful: possible risk of irreversible effects through inhalation.
R40/21 Harmful: possible risk of irreversible effects in contact with skin.
R40/22 Harmful: possible risk of irreversible effects if swallowed.
R40/20/21 Harmful: possible risk of irreversible effects through inhalation and in contact with skin.
R40/20/22 Harmful: possible risk of irreversible effects through inhalation and if swallowed.
R40/21/22 Harmful: possible risk of irreversible effects in contact with skin and if swallowed.
R40/20/21/22 Harmful: possible risk of irreversible effects through inhalation, in contact with skin and if swallowed.
R42/43 May cause sensitization by inhalation and skin contact.
R48/20 Harmful: danger of serious damage to health by prolonged exposure through inhalation.
R48/21 Harmful: danger of serious damage to health by prolonged exposure in contact with skin.
R48/22 Harmful: danger of serious damage to health by prolonged exposure if swallowed.
R48/20/21 Harmful: danger of serious damage to health by prolonged exposure through inhalation and in contact with skin.
R48/20/22 Harmful: danger of serious damage to health by prolonged exposure through inhalation and if swallowed.
R48/21/22 Harmful: danger of serious damage to health by prolonged exposure in contact with skin and if swallowed.
R48/20/21/22 Harmful: danger of serious damage to health by prolonged exposure through inhalation, in contact with skin and if swallowed.
R48/23 Toxic: danger of serious damage to health by prolonged exposure through inhalation.
R48/24 Toxic: danger of serious damage to health by prolonged exposure in contact with skin.
R48/25 Toxic: danger of serious damage to health by prolonged exposure if swallowed.
R48/23/24 Toxic: danger of serious damage to health by prolonged exposure through inhalation and in contact with skin.
R48/23/25 Toxic: danger of serious damage to health by prolonged exposure through inhalation and if swallowed.
R48/24/25 Toxic: danger of serious damage to health by prolonged exposure in contact with skin and if swallowed.
DRAFT

134
R48/23/24/25 Toxic: danger of serious damage to health by prolonged exposure through inhalation, in contact with skin and if swallowed.
R50/53 Very toxic to aquatic organisms, may cause long‐term adverse effects in the aquatic environment.
R51/53 Toxic to aquatic organisms, may cause long‐term adverse effects in the aquatic environment.
R52/53 Harmful to aquatic organisms, may cause long‐term adverse effects in the aquatic environment.
DRAFT