Revised Drywall Emissions Health Consultation-04-15-14 ... Health... · providing health education...
39
Health Consultation POSSIBLE HEALTH IMPLICATIONS FROM EXPOSURE TO SULFUR GASES EMITTED FROM CHINESE-MANUFACTURED DRYWALL MAY 2, 2014 U.S. DEPARTMENT OF HEALTH AND HUMAN SERVICES Agency for Toxic Substances and Disease Registry Division of Community Health Investigations Atlanta, Georgia 30333
Transcript of Revised Drywall Emissions Health Consultation-04-15-14 ... Health... · providing health education...

Health Consultation POSSIBLE HEALTH IMPLICATIONS FROM EXPOSURE
TO SULFUR GASES EMITTED FROM
CHINESE-MANUFACTURED DRYWALL
MAY 2 2014
US DEPARTMENT OF HEALTH AND HUMAN SERVICES
Agency for Toxic Substances and Disease Registry
Division of Community Health Investigations
Atlanta Georgia 30333
Health Consultation A Note of Explanation
A health consultation is a verbal or written response from ATSDR or ATSDRrsquos
Cooperative Agreement Partners to a specific request for information about health risks
related to a specific site a chemical release or the presence of hazardous material In
order to prevent or mitigate exposures a consultation may lead to specific actions such
as restricting use of or replacing water supplies intensifying environmental sampling
restricting site access or removing the contaminated material
In addition consultations may recommend additional public health actions such as
conducting health surveillance activities to evaluate exposure or trends in adverse health
outcomes conducting biological indicators of exposure studies to assess exposure and
providing health education for health care providers and community members This
concludes the health consultation process for this site unless additional information is
obtained by ATSDR or ATSDRrsquos Cooperative Agreement Partner which in the
Agencyrsquos opinion indicates a need to revise or append the conclusions previously issued
You May Contact ATSDR Toll Free at
1-800-CDC-INFO
or
Visit our Home Page at httpwwwatsdrcdcgov
Prepared By
U S Department of Health and Human Services
Agency for Toxic Substances and Disease Registry
Division of Community Health Investigations
HEALTH C ONSULTATION
POSSIBLE HEALTH IMPLICATIONS FROM EXPOSURE
TO S ULFUR GASES EMITTED F ROM
CHINESE-MANUFACTURED D RYWALL
Contents
Executive Summary 3shy
Background and Statement of Issues 6shy
Laboratory Contaminant Emission Rate Tests7shy
Modeled Indoor Air Concentrations 8shy
Emission Rate Testing and Modeling Results 9shy
Sulfur Compound Emission Rates 9shy
GA Tech IH MOD Results9shy
GA Tech Regression Model Results (GA Tech Empirical Model) 10shyDiscussionmdashIndoor Air Concentration Results 12shy
Effect of time temperature and humidity on estimated contaminant concentrations 12shyLaboratory vs Typical Home Conditions 13shy
Copper Corrosion 13shy
Data Limitations 13shyDiscussionmdashHealth Evaluation 14shy
Selecting Contaminants for Further Evaluation 14shy
Non-cancer 14shyCancer 15shy
Individual ContaminantmdashScreening Results 15shy
Hydrogen Sulfide 15shyOther Reduced Sulfur Compounds 16shy
Sulfur Dioxide 16shy
Individual ContaminantsmdashHealth Effects Evaluation 16shyHydrogen Sulfide 16shy
Other Reduced Sulfur Compounds 17shy
Sulfur Dioxide 18shyChemical MixturesmdashHealth Effects Evaluation 19shy
Other Considerations 20shy
Odors and Quality of Life 20shySensitive populations 21shy
Conclusions 22shy
Recommendations 23shy
Additional Resources 23shy
References 24shy
Appendices 28shy
2
Executive Summaryshy
Background
Some US homes built between 2001 and 2008 contain problem drywall (see definition on page 6)
Beginning around 2008 some people living in these homes started reporting health issues and other
problems to their state health agencies Those living in affected homes reported a spectrum of
symptoms and health effects including recurrent headaches irritated and itchy eyes and skin difficulty
in breathing persistent cough runny noses sinus infections and congestion sore throats frequent
nosebleeds and asthma attacks Many of these residents reported that symptoms decreased or went
away entirely when they left their homes and then reappeared when they returned home Non health-
related problems included a strong sulfur smell and premature corrosion or deterioration of certain
metal components in their homes like air conditioner coils and wiring behind electrical outlets and
inside electrical panel boxes
Purpose
In early 2009 the US Consumer Product Safety Commission (CPSC) began investigating the
problem with support from the US Agency for Toxic Substances and Disease Registry (ATSDR)
the US Centers for Disease Control and Prevention (CDC) and other federal and state
agencies As part of the investigation to determine possible health risks CPSC contracted with
Lawrence Berkeley National Laboratory (LBNL) to measure chemical emissions from drywall
samples manufactured in China and in North America
In 2011 the CDCATSDR and the CPSC agreed that further evaluating LBNL results might
provide useful information on the possibility of adverse health effects from sulfur compound
exposures ATSDR agreed to model LBNLrsquos sulfur compound emission rates to estimate
concentrations in indoor air
The purpose of this health consultation is to determine if exposure to the estimatedshycontaminant concentrations could result in adverse symptoms or health effectsshy
Methods
In 2009 LBNL measured the chemical emission rates from 30 convenience drywall samples These
drywall samples were manufactured in China during 2005 2006 and 2009 and in North America during
2009 In 2010 LBNL retested the emissions from four of the drywall samples manufactured in China
and one of the samples manufactured in North America In 2012-2013 The Georgia Institute of
Technology (GA Tech) under a cooperative agreement with ATSDR modeled the LBNL data and
provided indoor concentration estimates for sulfur dioxide and the following reduced sulfur
compounds hydrogen sulfide carbonyl sulfide methyl mercaptan ethyl mercaptan dimethyl sulfide
and carbon disulfide ATSDR compared the estimated indoor air contaminant concentrations in the GA
Tech report with toxicological and epidemiological information to determine if exposures to the
estimated levels could result in adverse health effects for building occupants
3
Conclusions People who were exposed to hydrogen sulfide and other sulfur compounds emitted by some drywall
manufactured in China may have experienced adverse health effects or a reduced quality of life The
available data cannot be used to determine if people are still being exposed to levels that could cause
health effects or adversely affect quality of life
1shy For the drywall samples manufactured in China between 2005 and 2006
bull Based on the limited number of drywall samples tested exposures to the estimated levels of
hydrogen sulfide and sulfur dioxide from drywall samples manufactured in China between 2005
and 2006 were a public health concern Short-term exposures might result in effects seen in
both clinical and human epidemiologic studies These include exacerbation of pre-existing
respiratory conditions eye and nasal irritation headache changes in vision and weakness
Although less certain longer term exposures may have increased the risk of damage to nasal
tissue Exposure to the estimated contaminant concentrations could diminish a residentrsquos
quality of life by triggering irritant (eye nose and throat) and physical (respiratory
gastrointestinal) symptoms leading to negative mood states and altering daily activities
bull The estimated contaminant concentrations increased with increasing temperature andshyhumidityshy
bull Given the more than 90 reduction in hydrogen sulfide emission rates between the 2009 and
2010 laboratory testing estimated contaminant concentrations from drywall samples were
likely higher closer to their 2005-2006 date of manufacture
bull Estimated contaminant concentrations from the drywall samples tested are consistent with
levels resulting in the severe metal corrosion observed in homes
2shy For the drywall samples manufactured in China in 2009
bull Based on the limited number of drywall samples tested long-term exposures to the estimated
levels of hydrogen sulfide from drywall samples manufactured in China in 2009 may have posed
a public health concern for sensitive people (eg those with asthma)
3shy For the drywall samples manufactured in China in 2005 2006 and 2009
bull Current contaminant levels cannot be estimated with the data available for the drywall samples
manufactured in China in 2005 2006 and 2009 Therefore the potential hazard if any from
current exposures cannot be assessed based on the 2009-2010 laboratory data
4shy For the drywall samples manufactured in North America in 2009
bull Based on the limited number of drywall samples tested exposures to the estimated
contaminant levels from drywall samples manufactured in North America in 2009 were below
levels of public health concern It should be noted that these samples were not identified by
CPSC as problem drywall
NOTE Because of the small number of drywall samples tested these conclusions do not represent
the range of all possible sulfur c ompound concentrations and should not be generalized to all
drywall manufactured during the period of concern
4
5
Recommendations 1 ATSDR recommends that people with health symptoms or health effects they feel are associated
with living in a home with problem drywall provide this ATSDR health consultation report to their health care provider
2 ATSDR recommends that residents in homes with drywall that meet the CPSC problem drywall case definition follow the CPSCUS Department of Housing and Urban Development (HUD) remediation guidance This guidance is available at httpwwwcpscgovSafety-EducationSafety-Education-CentersDrywallTopicsInteragency-Drywall-Investigation
Additional Resources ATSDR is working with the Pediatric Environmental Health Specialty Units (PEHSUs) and the Association of Occupational Environmental Clinics to provide updated guidance to health care providers and the public This health consultation the updated PEHSU guidance the GA Tech modeling reports and other problem drywall resources will be available on the ATSDR drywall Web site (httpwwwatsdrcdcgovdrywall)
Background and Statement of Issues shy
Drywall manufactured in China was imported into the United States to address the shortage of
essential construction materials created by a national demand for new home construction and
rebuilding after the record-breaking 2004 and 2005 hurricane seasons In 2008 Florida homeowners
began reporting upper respiratory irritation and copper corrosion in their recently built homes (2001-
2008) to the Florida Department of Health (FLDOH) In January 2009 FLDOH initiated a preliminary
investigation into the use of problem drywall in newly constructed homes Residents reported
premature failures of central air conditioning system evaporator coils and intermittent failure of
appliances andor electronic devices [FLDOH 2010] Consumer Product Safety Commission (CSPC) staff
inspections noted corrosion of bare copper electrical wiring and the presence of sooty material on
electrical wires [CPSC 2009] State and federal investigators observed tarnishing and pitting of other
metallic surfaces in the affected homes in Florida and Louisiana As of February 2013 CPSC had
received over 4000 complaints from US residents in 44 states living in homes with these problems
[CPSC 2013]
Those living in affected homes reported a spectrum of symptoms and health effects including recurrent
headaches irritated and itchy eyes and skin difficulty breathing persistent cough runny nose sinus
infections and congestion sore throats frequent nosebleeds and asthma attacks Many of these
residents reported that symptoms lessened or went away entirely when they left their homes and then
reappeared when they returned home [CPSC 2009] In an Problem Drywall
Residents in h omes with p roblem
drywall report h aving health i ssues
like respiratory irritation and o ther
problems such a s copper corrosion
and sulfur odors
Not a ll of t he homes contain d rywall
manufactured i n China Some
problem homes contain d rywall
manufactured i n N orth A merica and
some have drywall with n o indication
of origin When A TSDR uses the
phrase ldquoproblem drywallrdquo in t his
document we are referring to all
homes with t he problem regardless
of t he drywallrsquos country of origin
CPSC did n ot select N orth American
drywall samples thought t o be
problem drywall The intent o f t he
LBNL analysis was to compare
problem drywall from China to typical
drywall manufactured in N orth
America
informal survey of more than 400 callers to the Louisiana
Department of Health and Hospitals the most common
complaint reported was the presence of sulfur-like or other
unusual odors [LDHH 2010]
In addition to the health issues listed above residents
reported the following problems to the Agency for Toxic
Substances and Disease Registry (ATSDR) extreme fatigue
weight loss burned corneas neurological issues (including
peripheral neuropathy) muscular pain vaginal burns
scarring of the esophagus scarred lungs blood pressure
problems kidney problems and worsening of chronic
obstructive pulmonary disease (COPD)
ATSDR and the Centers for Disease Control and Prevention
(CDC) recognize the concerns of people exposed to
contaminants from problem drywall Since 2009
CDCATSDR has provided public health expertise in support
of the CPSCrsquos leadership of the federal response to
concerns with problem drywall Other partners include the
US Environmental Protection Agency (EPA) the US
Department of Housing and Urban Development (HUD)
FLDOH the Louisiana Department of Health and Hospitals
the Virginia Department of Health other state and local
health and environmental agencies and the Association of
Occupational and Environmental Health Clinics (AOEC)
6
As part of the federal drywall investigation in 2009 CPSC funded the Lawrence Berkley National
Laboratory (LBNL) to measure volatile sulfur compound emission rates from a limited number of
drywall samples manufactured in China (Number= 17) and North America (Number= 13) LBNL test
results found the following reduced sulfur compounds (RSCs) hydrogen sulfide (H2S) carbon disulfide
methyl mercaptan dimethyl sulfide carbonyl sulfide and ethyl mercaptan Sulfur dioxide (SO2) was
also detected In 2012 under a Cooperative Agreement with ATSDR the Georgia Institute of
Technology (GA Tech) used the LBNL results to mathematically estimate indoor air concentrations of
these contaminants
ATSDR evaluated GA Tech modeling results to assess whether people may have been at risk for adverse
health effects To do this ATSDR reviewed and summarized the estimated indoor air concentrations of
individual RSCs SO2 and total RSCs (TRSCs) Then ATSDR compared the estimated contaminant
concentrations to health-based screening values (also referred to as comparison values) If screening
values were exceeded the concentrations were compared to those found in human and animal studies
to determine if exposures were at levels that might harm peoplersquos health Because LBNL testing
occurred in 2009 and 2010 data are not available to assess the health risk from current exposures
Laboratory Contaminant Emission Rate Tests
The CPSC provided 30 drywall samples to LBNL 17 were manufactured in China (9 during 2005-2006
and 8 during 2009) and 13 were manufactured in North America in 2009 CPSC collected the samples
from drywall manufacturers suppliers and warehouses1
These were convenience samples and were
not selected by manufacturer date of manufacture or possible sulfur compound emission rates The
LBNL researchers were blinded to country of origin Documentation on storage history of the drywall
samples was not available to LBNL researchers In order for contaminant emissions from samples to
reach a steady state at a constant temperature and humidity they were fully conditioned in chambers
for a period of several months The LBNL analyses were done in two phases and released in two
reports [LBNL 2010 LBNL 2011] Phase I (2009 analysis) studied SO2 and RSC emission rates for all 30
drywall samples under constant temperature and humidity Phase II (2010 analysis) retested five
drywall samples under varying temperature and relative humidity Table 1 displays the different
temperature and humidity conditions
Table 1 LBNL drywall sample temperature and relative humidity test conditions1
Temperature oC (
oF)
Percent Relative
Humidity
Phase I 25 (77) 50
Phase II
25 (77) 34 49 87
32 (896) 34 49 87
41 (1058) 34 49 87 1Phase 1- LBNL 2010 Phase II ndash LBNL 2011
An approximate 1 square foot section was cut from each board and individually heat sealed in inert (Tedlarreg) bags (by
CPSC) After opening LBNL maintained the samples under inert conditions prior to analysis and in between test years For
more information on sample storage and handling please see the ldquoLBNL Chamber Emissions Study October 2010rdquo and the
ldquoLBNL Problem Drywall Chamber Emissions Phase 2 Report and Staff Cover Memo September 15 2011rdquo at CPSCrsquos Web
site httpwwwcpscgovSafety-EducationSafety-Education-CentersDrywallTopicsInteragency-Drywall-Investigation
7
1
Modeled Indoor Air Concentrations
GA Tech estimated indoor air contaminant concentrations of drywall samples from China and North
America using both LBNL Phase I and II emission results using two different approaches the ldquoIH MODrdquo
model and a regression model [AIHA 2009 GA Tech 2013] ldquoIH MODrdquo is a box model and provides a
conservative (protective) health interpretation GA Tech developed an empirical model (regression
analysis) to estimate possible contaminant concentrations using mean temperature and humidity
values measured in the homes tested in two previous drywall investigations [GA Tech 2013]
These results represent only a ldquosnapshot in timerdquo estimation of concentrations because data for four
important variables were unavailable and could not be included in the models These four variables
include emission source degradation rates chemical reactions between these sulfur compounds
contaminant indoor half-life and deposition rates of contaminants on to surfaces (or sinks) in the
home An exponential decrease in emission rates of some volatile contaminants in household building
materials during the first year or two after installation has been reported [Park 2006] SO2 and RSCs
ldquoreactrdquo and degrade both in the air and on surfaces
Housing characteristics (drywall surface area air exchange rate temperature and humidity) that were
measured in two drywall investigations by CPSC and the EPAFLDOH (Table 2) were used as input into
the models as appropriate [EHHE 2010 CPSC 2009 ldquoTab Crdquo] House volume was calculated from the
drywall surface area measurements and it was assumed the entire house was one room with a 244-
meter wall height Drywall area and room volume calculations did not factor in windows or doorways
The average (mean) housing characteristic values were used to evaluate possible health implications of
living in a home under ldquotypicalrdquo temperature and humidity conditions The information from the two
drywall indoor air investigations was used to represent homes built with imported problem drywall It
reflects homes in the highest-affected states years built building materials used and similar energy
saving efficiencies
Using IH MOD GA Tech estimated contaminant concentrations using LBNL temperature and relative
humidity (RH) conditions
bull Phase I LBNL emission rates from samples run under 25oC and 50 RH
bull Phase II LBNL emission rates from samples run under 25oC and 49 RH to roughly estimateshy
contaminant concentration reductions between LBNL Phase I (2009) and Phase II (2010)shybull Phase II LBNL emission rates from samples run under remaining temperature and RH (see Table 1)
and
bull The average of drywall samplesrsquo estimated contaminant concentrations for drywall
manufactured in China This average was calculated using both LBNL Phase I and II contaminant
emission rates
For the regression analysis (GA Tech Empirical Model) GA Tech used Phase I emission rates and mean
temperature RH levels in homes measured in the 2009 CPSC and EPAFDOH investigations (Table 2)
[EHHE 2010 CPSC 2009]
Table 2 Housing characteristic variables used in the GA Tech empirical model1
Room Volume2
(m3)
Temperature oC (
oF)
Relative Humidity
()
Air Exchange Rate
(m3hour)
Mean 6261 254 (777) 60 022 1Source EHHE 2010 and CPSC 2009 ldquoTab Crdquo
2Calculated using drywall surface area data of housing characteristics from
EHHE 2010 and CPSC 2009 ldquoTab Crdquo
8shy
Emission Rate Testing and Modeling Results
Sulfur Compound Emission Rates
LBNLrsquos 2009 and 20102
analyses found sulfur dioxide (SO2) and the following reduced sulfur
compounds (RSCs) hydrogen sulfide (H2S) carbon disulfide methyl mercaptan dimethyl sulfide
carbonyl sulfide and ethyl mercaptan [LBNL 2010 LBNL 2011] These compounds were found in both
Chinese and North American drywall samples Overall emission rates in samples from China were
higher than those from North America
GA Tech IH MOD Results
Tables 3 and 4 summarize the estimated indoor air RSC and SO2 concentrations based on LBNL 2009
(Phase I) and 2010 (Phase II) results Table 3 presents results of the four highest emitting samples from
China the average of these samples the average of all samples manufactured in China in 2005 and
2006 the average of samples manufactured in 2009 and one 2009 North American sample that LBNL
reanalyzed in Phase II As LBNL did not retest all of the drywall samples in their Phase II analyses only
the average of four highest-emitting samples from China and the one North American sample can be
compared The other averaged values presented in Table 3 allow a comparison of estimated
concentrations by manufacture date
Table 3 Estimated (IHMOD Model) steady-state concentrations (microgm3) using 2009 LBNL (Phase I)
contaminant emission rates (25oC 50 relative humidity)
1
Origin-date2
Sample-
CPSC ID
H2S CS2 MM DMS OCS EM SO2
Cmdash2006 C3mdash7339 40367 990 617 262 NI3
NI 27449
Cmdash2006 C4mdash8357 60684 1344 681 216 561 NI 39652
Cmdash2006 C16mdash9672 22027 083 182 012 1212 NI 6833
Cmdash2005 C17mdash9673 65777 216 490 019 2741 031 31444
C-2005+2006 (n=4)4
Average 47213 658 500 127 1129 --- 26345
C-2005+2006 (n=9) 5
Average 27303 487 302 123 1162 031 15944
C-2009 (n=8)6
Average 2972 025 111 009 1122 019 3907
NAmdash2009 NA4mdash8037 NI 253 NI 108 NI NI NI 1Source GA Tech 2013 (Table 6A) and LBNL 2010
2China (C) North America (NA)
3Not Identified (NI) in LBNL analyses
4Average of four highest-emitting samples from China manufactured between 2005mdash2006 C3 4 16 and 17
5Average of
all nine samples from China manufactured between 2005mdash2006 6Average for all eight samples from China manufactured
in 2009 H2Smdashhydrogen sulfide CS2mdashcarbon disulfide MMmdashmethyl mercaptan DMSmdashdimethyl sulfide OCSmdashcarbonyl
sulfide EMmdashethyl mercaptan and SO2mdashsulfur dioxide
2 Note that in Phase II (LBNL 2011) LBNL only tested the four highest-emitting samples from China and one
sample from North America
9
Table 4 Estimated (IH MOD Model) steady-state concentrations (microgm3) using 2010 LBNL (Phase II)
contaminant emission rates (25oC 49 relative humidity)
1
Origin-date2
Sample-
CPSC ID
H2S CS2 MM DMS OCS EM SO2
Cmdash2006 C3mdash7339 2565 049 191 009 469 034 4119
Cmdash2006 C4mdash8357 1132 022 117 006 459 056 5948
Cmdash2006 C16mdash9672 1702 015 133 009 623 022 5155
Cmdash2005 C17mdash9673 2547 012 191 012 435 037 2232
C-2005+2006 (n=4)3
Average 1987 025 158 009 496 037 4364
NAmdash2009 NA4mdash8037 811 003 037 006 339 015 490 1Source GA Tech 2013 (Table 6B) and LBNL 2010
2China (C) North America (NA)
3Average of four highest-emitting
samples manufactured between 2005mdash2006 C3 4 16 and 17 H2Smdashhydrogen sulfide CS2mdashcarbon disulfide MMmdash
methyl mercaptan DMSmdashdimethyl sulfide OCSmdashcarbonyl sulfide EMmdashethyl mercaptan and SO2mdashsulfur dioxide
GA Tech Regression Model Results (GA Tech Empirical Model)
Table 5 displays GA Techrsquos estimated contaminant concentrations using regression analysis of the LBNL
Phase II emission rates and the mean temperature and humidity conditions (Table 2) measured in the
CPSC and EPAFLDOH investigations [EHHE 2010 CPSC 2009 ldquoTab Crdquo] Except for SO2 concentrations
were generally higher when the humidity increased from 49 (Table 4) to 60 (Table 5)
Table 5 Estimated (empirical model) steady-state concentrations (microgm3) using regression analysis and
2010 LBNL (Phase II) contaminant emission rates (254degC 60 relative humidity)1
Origin-date2
Sample-
CPSC ID
H2S CS2 MM DMS OCS EM SO2
Cmdash2006 C3mdash7339 2699 097 150 007 580 027 1303
Cmdash2006 C4mdash8357 2893 041 213 007 534 070 2429
Cmdash2006 C16mdash9672 2295 020 155 010 624 030 1452
Cmdash2005 C17mdash9673 2376 022 183 010 464 037 986
C-2005+2006 (n=4)3
Average 2554 036 173 008 547 038 1459
NAmdash2009 NA4mdash8037 828 004 054 006 308 018 661 1Source GA Tech 2013 (Table 8) and LBNL 2011
2China (C) North America (NA) year manufactured
3Average of four
highest-emitting samples manufactured between 2005mdash2006 C3 4 16 and 17 H2Smdashhydrogen sulfide CS2mdashcarbon
disulfide MMmdashmethyl mercaptan DMSmdashdimethyl sulfide OCSmdashcarbonyl sulfide EMmdashethyl mercaptan and SO2mdashsulfur
dioxide
In Phase II LBNL measured emission rates under three temperatures and humidities for four of the
highest-emitting samples from China and one sample from North America Table 6 displays estimated
RSC and SO2 concentrations for the highest H2S-emitting sample (in the 2009 analysis) the average of
the four highest-emitting samples and a North American drywall sample
Table 7 shows estimated indoor H2S concentrations under varying temperature and relative humidity
conditions for the four highest emitting samples the average and a North American sample Note
that the sample with the highest H2S emissions (C4-9673) measured in 2009 at room temperature and
humidity was not the highest emitter under all temperature and humidity conditions in the 2010 LBNL
testing The emission rates are not linear and varied by drywall sample
10shy
Table 6 Estimated (empirical model) contaminant concentrations (microgm3) from three drywall
samples as a function of temperature and humidity used in the 2010 LBNL chamber studies1
C17mdash96732
C ndashAverage3
NA4 ndash80374
H2S RH 34 RH 49 RH 87 RH 34 RH 49 RH 87 RH 34 RH 49 RH 87
Temp 25oC 191 2547 5402 927 1986 4665 361 811 543
Temp 32oC 3157 5192 5464 2504 4012 6317 216 1536 1822
Temp 41oC 8291 15682 16681 5754 10136 13964 623 1471 3611
CS2 RH 34 RH 49 RH 87 RH 34 RH 49 RH 87 RH 34 RH 49 RH 87
Temp 25oC 006 012 111 008 025 161 003 003 012
Temp 32oC 012 028 145 016 062 483 003 003 019
Temp 41oC 043 080 490 043 118 767 003 003 003
MM RH 34 RH 49 RH 87 RH 34 RH 49 RH 87 RH 34 RH 49 RH 87
Temp 25oC 056 191 876 146 158 717 025 037 077
Temp 32oC 102 182 537 096 298 590 062 102 271
Temp 41oC 299 743 1850 248 641 1793 019 154 598
DMS RH 34 RH 49 RH 87 RH 34 RH 49 RH 87 RH 34 RH 49 RH 87
Temp 25oC 009 012 049 006 009 027 003 006 012
Temp 32oC 009 009 019 009 022 025 006 009 019
Temp 41oC 034 040 093 025 040 077 006 009 025
OCS RH 34 RH 49 RH 87 RH 34 RH 49 RH 87 RH 34 RH 49 RH 87
Temp 25oC 339 435 1224 362 496 1240 093 339 1014
Temp 32oC 435 1221 780 580 983 1666 450 780 663
Temp 41oC 635 1659 4175 506 1377 3660 478 786 1412
EM RH 34 RH 49 RH 87 RH 34 RH 49 RH 87 RH 34 RH 49 RH 87
Temp 25oC 015 037 105 019 037 116 012 015 049
Temp 32oC 019 056 176 025 070 160 015 025 046
Temp 41oC 065 151 392 061 102 267 019 037 043
SO2 RH 34 RH 49 RH 87 RH 34 RH 49 RH 87 RH 34 RH 49 RH 87
Temp 25oC 404 2232 1289 795 4364 3640 429 490 820
Temp 32oC 4622 14853 4052 4942 7073 3603 685 2636 2541
Temp 41oC 22361 36057 23097 17590 29937 30549 336 2103 866
1Source LBNL 2011 and GA Tech 2013 (Table 10)
2C-9673 was the highest H2S-emitting sample in LBNL 2009
emission testing and approximately equal to the highest-emitting sample in LBNL 2010 testing 3Average of four
highest-emitting samples manufactured in China C3 4 16 and 17 4
North America (NA) H2Smdashhydrogen sulfide
CS2mdashcarbon disulfide MMmdashmethyl mercaptan DMSmdashdimethyl sulfide OCSmdashcarbonyl sulfide EMmdashethyl
mercaptan and SO2mdashsulfur dioxide RHmdashrelative humidity
11
Table 7 Estimated (empirical model) hydrogen sulfide (H2S) concentrations as a
function of temperature and humidity used in 2010 LBNL chamber studies1
H2S Concentration (microgm3)
Sample C3mdash7339 RH 34 RH 49 RH 87
Temp = 25oC 1631 2565 2479
Temp = 32oC 2365 4332 5189
Temp = 41oC 4761 7869 10320
Sample C4mdash8357 RH 34 RH 49 RH 87
Temp = 25oC 718 1132 7668
Temp = 32oC 2818 4233 8217
Temp = 41oC 5279 8843 15460
Sample C16mdash9672 RH 34 RH 49 RH 87
Temp = 25oC 1169 1702 3111
Temp = 32oC 1677 2291 6398
Temp = 41oC 4684 8149 13394
Sample C17mdash9673 RH 34 RH 49 RH 87
Temp = 25oC 191 2547 5402
Temp = 32oC 3157 5192 5464
Temp = 41oC 8291 15682 16681
C-Average2
RH 34 RH 49 RH 87
Temp = 25oC 927 1986 4665
Temp = 32oC 2504 4012 6317
Temp = 41oC 5754 10136 13964
Sample NA4mdash80373
RH 34 RH 49 RH 87
Temp = 25oC 361 811 543
Temp = 32oC 216 1536 1822
Temp = 41oC 623 1471 3611
1Source LBNL 2011 and GA Tech 2013 (Table 11)
2Average of four highest-emitting samples
manufactured in China C3 4 16 and 17 3
North America (NA) H2Smdashhydrogen sulfide RHmdashrelative
humidity
DiscussionmdashIndoor Air Concentration Results
Effect of time temperature and humidity on estimated contaminant concentrations
Estimated hydrogen sulfide (H2S) levels decreased more than 90 between 2009 and 2010 for the
2005-2006 drywall samples from China Sulfur dioxide (SO2) and carbon disulfide exhibited similar
trends (Tables 3 and 4) The remaining sulfur compound levels appear to have remained relatively
constant The data show higher contaminant levels in drywall from China compared to those
manufactured in North America among the limited number of samples tested
LBNL studies showed substantial emission rate decays over a 1-year period for drywall manufactured in
China in 2005 and 2006 [LBNL 2010 LBNL 2011] This suggests that higher indoor emission rates
would have been found if these samples were tested earlier Studies have shown decreases in emission
rates of some volatile contaminants in household building materials during the first year or two after
installation [Park 2006 Hodgson 2004]
12
As expected most of the estimated contaminant concentrations increased with increasing
temperature and humidity (Tables 6 and 7) Emission rates were most affected by temperature In
addition to RSC emission rate testing LBNL derived regression models to estimate the effect of
temperature and humidity on emission rates [LBNL 2011] The regression results predict that for every
10oC rise in temperature the H2S emission rate will approximately double Doubling the worst case H2S
concentration estimated by GA Tech (Table 3 C-17-9673 658 microgm3
at 25oC 50 RH) yielded an
estimated concentration of 1316 microgm3
(35oC 50 RH)
Laboratory vs Typical Home Conditions
Table 8 displays the temperature and humidity conditions during the LBNL testing as well as the mean
and range of these variables in two different drywall studies where in-house data were collected
Except for the highest temperature (41oC or 1058
oF) in LBNL test conditions others are within the
range of those measured in actual homes It is highly unlikely that indoor temperatures would reach
41oC however temperatures may have approached this value in the summer in a home with no air
conditioning Air conditioner failure due to copper corrosion was not uncommon in homes containing
problem drywall Except for the lowest RH value (34) humidity conditions during LBNL testing were
within the range of those measured in homes
Table 8 Comparison of Temperature and Humidity Conditions in Laboratory and Typical Residential
Settings
LBNL 2009 and 2010 testing1
Residential2
Temperature (oC) 25 32 41 208 ndash 312 (mean 254)
Relative Humidity () 34 4950 87 40 ndash 80 (mean 60) 1Source LBNL 2010 and LBNL 2011
2Source EHHE 2010 and CPSC 2009 ldquoTab Crdquo
Copper Corrosion
Moderate copper corrosion occurs in atmospheres with reactive sulfur compound concentrations at
and above 14 microgm3 Exposure to H2S can result in corrosion to sensitive electronics at 4 microgm
3 severe
corrosion occurs at 70 microgm3
[NDEQ 1997] GA Tech RSC modeling results of 2005-2006 and some
2009 samples from China support the extent of severe metal corrosion observed in homes
Data Limitations
These results represent only a small sample of drywall manufactured during the time periods in
question and therefore do not represent the range of possible reactive sulfur compound and SO2
concentrations
The following limitations of the drywall samples tested and estimated indoor contaminant
concentrations must be considered when interpreting the results
bull The small number and type of drywall samples tested are likely not representative of all drywall
manufactured
o The drywall analyzed only include samples manufactured in 2005 2006 and 2009
ATSDR did not estimate indoor contaminant concentrations for drywall manufactured in
other years
o Some homes contain drywall from China manufactured in different years and possibly
by different manufacturers
13shy
o Some homes have a mix of drywall manufactured in China and North America The
estimated indoor air concentrations were based on the assumption that only one kind
of drywall was used
bull The samples tested from China that were manufactured in 2005 and 2006 very likely had higher
emissions prior to LBNL analysis in 2009 Because data from earlier years are unavailable it is
impossible to determine how much higher the emissions would have been
bull Details about the warehouse storage conditions (temperature humidity etc) of each drywall
sample are not well documented Emission rates may have been lower during storage
compared to being installed in a building where more exposed surface area was available for
contaminant off gassing Alternatively contaminant emission rates could have been higher
from drywall stored in warehouses with high temperature and humidity than the same drywall
installed in an air-conditioned home
bull Contaminant concentration estimates represent only a ldquosnapshot in timerdquo because variables
such as emission source degradation rates chemical reactions between these sulfur
compounds contaminant indoor half-life and deposition rates of contaminants onto surfaces
(or sinks) in the home were not available and could not have been incorporated in the analyses
DiscussionmdashHealth Evaluation
In this section ATSDR compares contaminant concentrations to conservative health-based screening
values If contaminant concentrations exceeded the conservative health-based screening values the
contaminant concentrations are compared to those reported in human and animal studies to
determine if exposures were at levels that might cause adverse health effects
Reduced sulfur compounds (RSCs) include hydrogen sulfide (H2S) carbon disulfide methyl mercaptan
dimethyl sulfide and ethyl mercaptan The sum of these contaminant concentrations is referred to as
total RSCs (TRSCs) Their separate and combined toxicities may be generally similar to those of H2S
alone In this health evaluation when ATSDR describes the toxicology of H2S it applies to TRSC as well
Sulfur dioxide (SO2) is not an RSC It is an oxidized sulfur compound and its toxicological mechanisms
are different than RSCs
Selecting Contaminants for Further Evaluation
Non-cancer
Comparison Values (CVs) are non-cancer contaminant concentration guidelines with uncertainty
factors applied to ensure that they are below levels of health concern If a chemical concentration
exceeds its CV it does not mean adverse health effects will occur It means further assessment is
warranted The assessment includes estimating an individualrsquos contaminant dose (amount inhaled)
comparing the dose to the scientific literature and determining if exposures are at levels of health
concern ATSDR Minimal Risk Levels (MRLs) and EPA Reference Concentrations (RfCs) are used when
available3
If MRLs or RfCs are not available CVs developed by state health or environmental agencies
other federal agencies and information from the available literature might be used to screen the data
3 An MRL is an estimate of the daily human exposure to a hazardous substance that is likely to be without appreciable risk
of adverse non-cancer health effects over a specified duration of exposure even for sensitive populations MRLs are
derived for acute (1-14 days) intermediate (14-364 days) and chronic (365 days and longer) exposure durations RfCs are
estimates (with uncertainty spanning perhaps an order of magnitude) of an individualrsquos daily inhalation exposure (including
14
For example no MRL or RfC exists for methyl mercaptan so the Texas Commission of Environmental
Qualityrsquos Toxicology Division Effects Screening Level (ESL) was used ESLs are regulatory standards
developed for air permitting and used to evaluate the potential for effects to occur from exposure to
airborne contaminants ELSs are based on data concerning health effects odornuisance potential and
effects on vegetation Like MRLs if measured airborne levels of a constituent are below the ESL
adverse health effects are not expected If an ESL is exceeded it does not indicate a health problem a
more in-depth review is conducted
A hazard quotient (HQ) is the comparison of an estimated chemical intake (dose) to a CV An HQ is
calculated by dividing the estimated chemical dose by its CV An HQ of one or below means non-cancer
adverse health effects are unlikely If a HQ exceeds one a more in-depth review is conducted The HQ
cannot be translated to a probability that adverse health effects will occur and it is unlikely to be
proportional to risk
Cancer
The carcinogenicity of the sulfur compounds was not evaluated for the following reasons
bull Inadequate data are available
bull No evidence of carcinogenicity has been observed in limited epidemiological studies and
bull Long-term studies on carcinogenicity in experimental animals have not been reported
Individual ContaminantmdashScreening Results
Appendix 1 displays the comparison values for each contaminant and the scientific basis It also
presents odor thresholds for these contaminants Appendix 2 compares the estimated drywall
contaminant concentrations to each compoundrsquos acute and chronic CV (when available) and the
resulting HQ Except for carbon disulfide and dimethyl sulfide all other RSCs and S02 exceeded their
respective CVs in at least one drywall sample
Hydrogen Sulfide
A summary of which H2S CVs were exceeded and the HQmdashby drywall type manufacture date year
tested and temperature and RH test conditionsmdashis provided in Table 9 and Figures 1 and 2
bull 2009 LBNL Test Results Estimated H2S concentrations from the highest-emitting drywall
samples manufactured in China (2005-2006) exceeded acute CVs for H2S All samples from
China exceeded chronic CVs4
Acute and chronic HQ values range from 3-7 and 137-329
respectively The 2005-2006 and 2009-manufactured samples from China exceeded
intermediate CVs as well the highest HQ was 24 H2S was not identified in the North American
sample 2009 test results
bull 2010 LBNL Test Results Under 25oC and 50 RH test conditions chronic CVs were exceeded in
both the samples made in China (2005-2006) and the sample made in North America
Under worst-case temperature and RH test conditions estimated H2S concentrations exceeded
acute intermediate and chronic CVs in the samples made in China (2005-2006) and the chronic CV in
the North American sample
sensitive subgroups) likely to be without an appreciable risk of deleterious effects during a lifetime RfCs are derived fromshyNo Adverse Effect Levels (NOAELs) Lowest Observed Effect Levels (LOAELs) or Benchmark Doses (BMDs) and includeshyuncertainty factors to reflect limitations of the data usedshy4
Appendices 1 and 2 display CVs and HQs discussed in this sectionshy
15
As shown in Table 9 HQs are highest for the drywall samples manufactured in China between 2005
and 2006 (ldquoC 2005-2006rdquo) and tested in 2009 For these samples the chronic HQ was approximately 25
times lower (32913) after a 1-year time frame (2009 to 2010) Note the changes in CV exceedences
and HQ magnitude according to test date drywall manufacture date and origin and the temperature
and humidity test conditions
Table 9 H2S Comparison Value (CV) exceedences and Hazard Quotient (HQ) by drywall
typemanufacture date year tested and temperature and RH conditions during testing
Drywall Type
H2S CV Exceeded (Max HQ)
2009 Test Results 2010 Test Results 2010 Test Results mdashWorst Case
25oC 50 RH 25
oC 50 RH 41
oC 87 RH
C 2005-2006
Highest emitters
Acute1
(7)
Intermediate2
(24)
Chronic3
(329) Chronic (13)
Acute (2)
Intermediate (6)
Chronic (84)
C 2009 Chronic (15) NA4
NA
NA 2009 None Chronic (4) Chronic (6) 1Up to 2 weeks
2Between 2 weeks and 1 year
3More than 1 year
4Not available (samples from China
manufactured in 2009 were not analyzed by LBNL in 2010)
Other Red uced Sulfur Compounds
Although detected the estimated carbon disulfide and dimethyl sulfide concentrations did not exceed
their CVs and therefore are below levels of health concern Carbonyl sulfide exceeded a chronic CV
but was not likely of concern because HQs were 5 or less under worst-case conditions and 1 or less
under typical exposure conditions HQ values estimated for typical exposure conditions were similar in
drywall manufactured in China and North America The interim revised TCEQ ESL uncertainty factor of
3000 for carbonyl sulfide reflects the incompleteness of the database especially the sparseness of
human data [TCEQ 2008] The estimated TRSC concentration CVs mirrored those of H2S Appendix 2
provides more detailed results for TRSCs
Sulfur D ioxide
Based on LBNL 2009 sample analysis the highest-emitting samples from China manufactured in 2005-
2006 exceed acute SO2 CVs (HQs from 10-15) as did the average of all 2005-2006 samples (HQ=6) The
two highest samples analyzed in 2010 under worst-case temperature and humidity conditions had HQs
of 9 and 5 The North American SO2 HQs were not available from the 2009 analysis The SO2 HQ
calculated from LBNL 2010 analysis was the same (2) for samples made in North America and China
which were not of health concern
Individual ContaminantsmdashHealth Effects Evaluation
Hydrogen Sulfide
Hazard quotient results clearly show H2S as the primary RSC of concern Therefore an evaluation of
potential RSC health effects was performed on the basis of H2S toxicity Table 10 summarizes the
populations at increased risk based on length of exposure the drywall samplesrsquo origin manufacture
date and the laboratory temperature and RH test conditions People with asthma or asthma-like
conditions are identified as the ldquosensitive populationrdquo The general population includes all individuals
Acute exposure to the estimated levels of H2S from the Chinese drywall samples could result in effects
seen in clinical and epidemiological studiesmdashmost notably exacerbation of pre-existing respiratory
conditions eye and nasal irritation and nasal tract lesions There is some indication that changes in
16
vision might occur from exposure to the concentrations predicted Although less is known about
longer-term low-level exposure health effects such as fatigue and weakness are possible
Table 10 Populations at increased risk for health effects from H2S exposuremdashby drywall
typemanufacture date year tested and temperature and RH conditions during testing1
Drywall Type
2009 Test Results
25 oC 50 RH
2010 Test Results
25 oC 50 RH
2010 Worst Case Results
41 oC 87 RH
Population at Potential Risk by Exposure Duration
Acute2
Intermed3
Chronic4
Acute Intermed Chronic Acute Intermed Chronic
C 2005-2006
Highest emitters
All All All None None All Sensitive5
Sensitive All
C 2009 None None All NA NA
NA 2009 None None None None None None None None None 1Risks were determined based on the maximum estimated H2S concentrations displayed in Tables 3 4 and 7
2Up to 2 weeks
3 Between 2 weeks and 1 year
4More than 1 year
4 Not available (samples from China
manufactured in 2009 were not analyzed by LBNL in 2010) 5
Those with asthma or asthma-like conditions
The ATSDR acute MRL is based on a clinical lung function investigation of three adult male and seven
female asthmatics exposed to 2800 microgm3
H2S for 30 minutes [Jappinen 1990] These were not severe
asthmatics Although no statistically significant changes were found changes in airway resistance were
measured in two participants This finding suggests bronchial obstruction In addition three of the 10
subjects complained of headaches after the exposure period ended ATSDR applied a nine-fold
uncertainty factor to reach the 98 microgm3
MRL (3 for use of a Minimal LOAEL 3 for human variability
and 3 for database inadequacy) Supporting studies are included in Attachment 3
Olfactory neuron loss was identified by ATSDR as the critical sub-chronic (6 hours a day 7 days a week
for 10 weeks) effect from H2S exposure This study was the basis for the minimal risk level (MRL) for
intermediate exposures from 2 weeks to 1 year [ATSDR 2006 ATSDR 2012] as well as the EPA RfC
Both nasal tract lesions and neurologic effects occur in the same concentration range at relatively low
levels of H2S exposure (asymp 3 - 28 mgm3) Neurologic effects were termed ldquopossible indicatorsrdquo
(alterations in Purkinje neurons) observed during perinatal and postnatal rat exposures
No chronic MRL has been derived Chronic low level H2S exposure studies have not been conducted in
animals and epidemiological exposure studies are limited Continuous exposures have not been
characterized Previous reviews have stated that H2S is not likely a cumulative poison due to its rapid
oxidation and excretion although there is no consensus [Khan 1990 Savolainen et al 1980]
Other Red uced Sulfur Compounds
A review of effect levels from exposure to estimated levels of the other individual RSCs (carbon
disulfide methyl mercaptan dimethyl sulfide carbonyl sulfide and ethyl mercaptan) suggests that
modeled exposure levels were below those of health concern Most health effect levels in humans
resulted from short-term exposure in clinical tests occupational exposures or case studies Effect
levels in animals were determined in acute and sub-chronic studies as no chronic studies in animals
have been conducted See Appendix C for additional information But because RSCs have some of the
same target organs exposure to this mixture of compounds exacerbates the adverse effects of
exposure to H2S alone Additional discussion of RSC mixtures is located in the Chemical Mixturesmdash
Health Effects section
17
Figure 3 provides a visual summary of estimated indoor air H2S and TRSC concentrations in relationship
to comparison values and health effects seen in human and animal studies
Sulfur D ioxide
People with asthma children and older adults (65+ years) have been identified as groups susceptible
to the health problems associated with breathing SO2 [EPA 2010a] Clinical investigations and
epidemiological studies have provided strong evidence of a causal relationship between SO2 and
respiratory morbidity in people with asthma and more limited epidemiological studies have
consistently reported that children and older adults may be at increased risk for SO2-associated
adverse respiratory effects [EPA 2010b EPA 2009]
Table 11 summarizes the health effects by exposure concentration and study conditions Although HQs
were as high as 15 the highest estimated SO2 concentration 397 microgm3 from drywall emissions was
below those shown in clinical studies resulting in adverse effects in exercising asthmatics [Horstmann
1986 Boushey 1985] The lowest level where asymptomatic effects were measured was 520 microgm3
(eg mild constriction of bronchial passages) Sheppard et al [1981] measured asymptomatic effects
(bronchoconstriction) in exercising asthmatics exposed to 260 microgm3
SO2 by mouth only However
because nasal breathing acts as a scrubber or filter and reduces the amount of SO2 that enters the
lungs potential health effects are uncertain in sensitive populationsrsquo breathing levels below 520 microgm3
Note that asthmatic participants in the studies summarized in Table 11 had mild to moderate asthma
There is considerable uncertainty about concentrations that will affect severe asthmatics In addition
low temperatures and humidity have been reportedly induced effects at lower SO2 concentrations
Table 11 Short-term sulfur dioxide (SO2) levels associated health effects measured in clinical studies
Concentration
(microgm3)
Population Comment Exposure conditions
gt26001
General Lowest effect in non-sensitive populations Oronasal8
gt15601
Exercising asthmatics May require taking medication stopping
exercise or seeking medical attention
Oronasal
1040-15601
Exercising asthmatics Symptoms begin (cough wheeze chest
tightness)
Oronasal
520-65023
Exercising asthmatics Lowest asymptomatic effects begin
(bronchoconstriction)
Oronasal
6504
Exercising asthmatics Effects from exercise alone no SO2
exposure
Oronasal
2605
Exercising asthmatics Lowest asymptomatic effects using
mouthpiece
Oral only9
266
All Acute MRL7
Oronasal 1EPA 2008
2Horstmann et al 1986
3 Boushey et al 1985
4Horstmann et al 1988
5 Sheppard et al 1981
6ATSDR 1998
7ATSDR acute (up to 2 weeks) Minimal Risk Level
8free-breathing (nose and mouth)
9mouth only
All SO2 estimates from the drywall samples were below a level believed to result in adverse effects
(520 microgm3) [Horstmann 1986 Boushey 1985] However clinical investigations have limitations in
that participants in those peer-reviewed clinical investigations were healthy and were usually mild to
moderate asthmatics These investigations have not included participants such as those with severe
asthma children or the elderly As discussed in the next section exposure to the estimated S02
concentrations may add to the respiratory and irritation effects from exposure to TRSCs
18
Chemical MixturesmdashHealth Effects Evaluation
Exposure to multiple sulfur compounds emitted from drywall may be evaluated by considering the
chemicals as a mixture of total reduced sulfur compounds (TRSCs) or using a surrogate for the mixture
such as H2S [NDEQ 1997] The following epidemiological studies describing exposure to TRSCs support
using H2S as a surrogate for the similar effects of TRSCs The self-reported health effects from exposure
to the mixture of TRSCs suggest exacerbation of effects compared to H2S alone although effects may
be due to sparsely documented peak exposures The addition of SO2 to the TRSC mixture suggests SO2
may potentially exacerbate an exposure to TRSCs While the mixtures effect is unknown other
contaminants (ozone PM25) may also exacerbate co-exposures [EPA 2008]
Several epidemiological studies around paper mills in Finland (1990-1996) evaluated human health
effects to mixtures of sulfur compounds These studies report symptoms (eye and nasal irritation
cough headache respiratory symptoms) associated with exposure to very low levels of sulfur
compounds less than 10 microgm3
annual average H2S and less than 50 microgm3
daily averages for H2S and
methyl mercaptan One study reported the maximum 1-hour TRS (TRSC) concentration of 155 microgm3
during a 10-month period SO2 concentrations were very low (1 ltmicrogm3) [Partti-Pellinen et al 1996
Marttila et al 1995 Marttila et al 1994 Jaakkola et al 1990 Haahtela etal 1992] Symptoms
may have been associated with exposures to short-term peak contaminant concentrations collection
of which were limited in these studies
In the Jaakkola Finland study [1990] people exposed to H2S methyl mercaptan and methyl sulfides
while living in a community around a paper mill reported eye irritation 12 times more often than
people without exposure These effects were observed at mean annual H2S exposures estimated at 6
μgm3 However the ocular symptoms that were reported may have been due to exposure to peak
concentrations of H2S (daily peaks as high as 100 μgm3) and not annual mean concentrations or may
have been due to co-exposure to methyl mercaptan and methyl sulfides Methyl mercaptan is also an
eye irritant [NIOSH 2010] and was also present at an annual mean concentration of 2ndash5 μgm3
with
the highest daily average concentration being 50 μgm3
[Jaakkola et al 1990]
All of the South Karelia Finland air pollution studies found increases in the incidence of headaches or
migraines in polluted communities when compared to nonpolluted communities [Jaakkola et al 1990
Marttila et al 1994b 1995 Partti-Pellinen et al 1996] however only in the most recent study did
this finding achieve statistical significance Using a cross-sectional self-administered questionnaire
Partti-Pellinen et al [1996] evaluated the increased risk of headache or migraine in adults in a slightly
polluted and a reference community In the polluted community the mean annual TRSC
concentrations were 2ndash3 μgm3 the 24-hour concentrations varied between 0 and 56 μgm
3 and the
maximum 1-hour concentration was 155 μgm3 there were no TRSCs detected in the reference
community In the polluted community the SO2 annual mean concentration was 1 μgm3 the 24-hour
concentrations varied between 0 and 24 μgm3 the maximum 1-hour concentration was 152 μgm
3 In
the reference community the mean SO2 level was 1 μgm3 the maximum 1-hour concentration was 30
μgm3 The residents of the polluted community showed a significantly increased risk of headache both
during the previous 4-week period (OR=183 95 CI=106ndash315) and the preceding 12 months
(OR=170 95 CI=101ndash264) when compared to the residents of the reference community even after
adjusting for differences in age sex smoking history of allergic diseases education and marital status
between the two communities
19
Other Considerations
Odors and Quality o f Life
According to the World Health Organization (WHO) health is a state of complete physical mental and
social well-being and not merely the absence of disease or infirmity [WHO 1948] While the direct
health effect of odors on health is difficult to measure research has shown that exposure to noxious
odors such as RSCs adversely affects quality of life
Findings from Heaney et al [2011] suggest that H2S and other malodorous gases can trigger irritant
and physical symptoms Odor was strongly associated with reports of alteration of daily activities (odds
ratio (OR) 90 95 CI 35 235) negative mood states (OR 52 95 CI 28 96) mucosal irritation (OR
37 95 CI 20 71) and upper respiratory symptoms (OR 39 95 CI 22 70) but not positive mood
states (OR 06 95 CI 02 15) and gastrointestinal (GI) symptoms (OR 10 95 CI 04 26)
The odor threshold for the rotten-egg odor of H2S varies according to the individual the geometric
mean of available literature data is 11 microgm3 omitting extreme points and duplicate quotations the
standard error is 21 [Amoore amp Hautala 1983] To avoid odor annoyance WHO recommends that a
30-min average ambient air H2S concentration not exceed 7 microgm3
[WHO 2003]
California state regulators established an ambient air quality standard (AAQS) for H2S that is based on
the endpoint of odor annoyance [Collins 2000] This standard-003 ppm (42 microgm3) is based on a 1-
hour average This is approximately four times the population-mean odor threshold for H2S This
methodology assumes that on a population-average basis the annoyance threshold occurs at a fixed
multiple of the odor threshold at the level chosen approximately 40 of the population is expected to
be annoyed by H2S odors
Odor sensations occur when odorants interact with receptors in olfactory epithelium in the top of the
nasal cavity Signals from activated receptors are transmitted via the olfactory nerve to the olfactory
bulb and ultimately to the brain Odorants can also stimulate free nerve endings of four other cranial
nerves including the trigeminal and vagus nerves to induce sensations of irritation The same
compound can generate sensations of both odor and irritation but the concentration necessary to
illicit irritation is generally higher than that needed for odor with biological sulfur gases
Two types of nerve fibers in the trigeminal nerve conduct afferent pulses finely myelinated A-delta
fibers and un-myelinated C fibers Vasculature in the cranium is supplied by substance P-containing C
fibers of the trigeminal nerve (Substance P is a neurotransmitter associated with pain and
vasodilation) Thus inhaled irritants may induce headaches and migraines by increasing cortical blood
flow via the trigeminovascular system There is a temporal disparity between odor and irritant
sensations with odor sensations tending to precede the irritant sensations due in part because the
agent must migrate through the mucosa to activate free nerve endings of the trigeminal nerve
[Schiffman et al 2000 Shusterman1992]
The odor thresholds of sulfur compounds emitted from problem drywall are displayed in Appendix 1
Table 12 displays the contaminants whose estimated concentrations reached or exceeded their odor
threshold The estimated concentrations of H2S and methyl mercaptan exceeded odor threshold in
some drywall samples from China Therefore physical symptoms such as headache and fatigue can
occur and adversely affect the quality of life for those exposed
20
Table 12 Sulfur compounds at or above odor threshold by drywall typemanufacture date year
tested and temperature and humidity conditions during testing
Drywall Type
2009 Test Results 2010 Test Results
25oC 50 RH
ge Odor Threshold
2010 Test Results mdashWorst Case
41oC 87 RH
ge Odor Threshold
C 2005-2006
Ave- 4 highest
emitters
H2S methyl
mercaptan
H2S methyl
mercaptan
H2S methyl
mercaptan ethyl mercaptan
C 2009 Ave1
H2S NA2
NA
NA 2009 NI3
None None 1Average of all nine samples from China manufactured between 2009
2Not available (samples from
China manufactured in 2009 were not analyzed by LBNL in 2010) 3Not identified in LBNL analysis RHmdash
relative humidity
Sensitive p opulations
People with asthma are a sensitive population to airborne irritants Exposure to irritant gases
exacerbates asthma symptoms Epithelial damage and epithelial shedding occur in the airway passages
in asthma and other respiratory disorders Nerve endings are exposed by epithelial shedding allowing
irritant gases access to free nerve endings aggravating asthma and allergies [Schiffman et al 2000]
Preliminary results using nasal computational fluid dynamics modeling suggested that differences in
nasal anatomy and ventilation among adults and children do not significantly affect the H2S tissue dose
in the olfactory region [Schroeter et al 2010]
From an exposure perspective children may be more susceptible to TRSCs than are adults Compared
to adults their breathing rate is higher and they are shorter in stature (RSCs and SO2 are heavier than
air so their concentrations may be higher closer to the ground) ATSDR [Campagna et al 2004]
examined the possible relationship between ambient levels of TRSC and hospital visits among residents
of Dakota City and South Sioux City Nebraska Air monitoring data showed H2S as the primary
constituent of the TRSC in the area The primary sources were a beef slaughter facility and a leather
tanning facility Among children under 18 years of age positive associations were found between
unplanned hospital visits for asthma and the high H2S andor TRSC levels on the previous day The
same positive association was not found for adults A high TRSC or H2S level was defined as a 30-
minute rolling average of ge30 ppb (42 microgm3)
21
Conclusions shyPeople who were exposed to hydrogen sulfide and other sulfur compounds emitted by some drywall
manufactured in China may have experienced adverse health effects or a reduced quality of life The
available data cannot be used to determine if people are still being exposed to levels that could cause
health effects or adversely affect quality of life
1shy For the drywall samples manufactured in China between 2005 and 2006
bull Based on the limited number of drywall samples tested exposures to the estimated levels of
hydrogen sulfide and sulfur dioxide from drywall samples manufactured in China between 2005
and 2006 were a public health concern Short-term exposures might result in effects seen in
both clinical and human epidemiologic studies These effects include exacerbation of pre-
existing respiratory conditions eye and nasal irritation headache changes in vision and
weakness Although less certain longer-term exposures may have increased the risk of damage
to nasal tissue Exposure to estimated contaminant concentrations could diminish a residentrsquos
quality of life by triggering irritant (eye nose and throat) and physical (respiratory
gastrointestinal) symptoms leading to negative mood states and altering daily activities
bull The estimated contaminant concentrations increased with increasing temperature andshyhumidityshy
bull Given the more than 90 reduction in hydrogen sulfide emission rates between the 2009 and
2010 laboratory testing estimated contaminant concentrations from drywall samples were
likely higher closer to their 2005-2006 date of manufacture
bull Estimated contaminant concentrations from the drywall samples tested are consistent with
levels resulting in the severe metal corrosion observed in homes
2shy For the drywall samples manufactured in China in 2009
bull Based on the limited number of drywall samples tested long-term exposures to the estimated
levels of hydrogen sulfide from drywall samples manufactured in China in 2009 may have posed
a public health concern for sensitive individuals (eg those with asthma)
3shy For the drywall samples manufactured in China in 2005 2006 and 2009
bull Current contaminant levels cannot be estimated with the data available for the drywall samples
manufactured in China in 2005 2006 and 2009 Therefore the potential hazard if any from
current exposures cannot be assessed based on the 2009-2010 laboratory data
4shy For the drywall samples manufactured in North America in 2009
bull Based on the limited number of drywall samples tested exposures to the estimated
contaminant levels from drywall samples manufactured in North America in 2009 were below
levels of public health concern These samples were not identified by CPSC as problem drywall
NOTE Because of the small number of drywall samples tested these conclusions do not represent
the range of all possible sulfur compound concentrations and should not be generalized to all
drywall manufactured during the period of concern
22
23
Recommendations 1 ATSDR recommends that people with health symptoms or health effects they feel are associated
with living in a home with problem drywall provide this ATSDR health consultation report to their health care provider
2 ATSDR recommends that residents in homes with drywall that meet the CPSC problem drywall ldquocase definitionrdquo follow the CPSCUS Department of Housing and Urban Development (HUD) remediation guidance This guidance is available at httpwwwcpscgovSafety-EducationSafety-Education-CentersDrywallTopicsInteragency-Drywall-Investigation
Additional Resources ATSDR is working with the Pediatric Environmental Health Specialty Units (PEHSUs) and the Association of Occupational Environmental Clinics to provide updated guidance to health care providers and the public This health consultation the updated PEHSU guidance the GA Tech modeling reports and other problem drywall resources will be available on the ATSDR drywall Web site (httpwwwatsdrcdcgovdrywall)
References
AIHA (American Industrial Hygiene Association) 2009 Mathematical models for estimating
occupational exposures to chemicals IH MOD ISBN 978-1-935082-10-1
Amoore JE and Hautala E 1983 Odor as an aid to chemical safety odor thresholds compared with
threshold limit values and volatilities for 214 industrial chemicals in air and water dilution J Applied
Toxicology Dec 3(6) 272-290
ATSDR (US Agency for Toxic Substances and Disease Registry) 2006 Toxicological Profile for
Hydrogen Sulfide (Update) US Department of Health and Human Services Atlanta GA
ATSDR 2012 Addendum to the toxicological profile for hydrogen sulfide Available at
httpwwwatsdrcdcgovtoxprofileshydrogen_sulfide_addendumpdf
Boushey HA Bethel RA Sheppard D Geffroy B et al 1985 Effect of 025 ppm sulfur dioxide on airway
resistance in freely breathing heavily exercising asthmatic subjects Am Rev Respir Dis 131659-661
Campagna D Kathman S Pierson R etal 2004 Ambient hydrogen sulfide total reduced sulfur and
hospital visits for respiratory diseases in northeast Nebraska 1998-2000 J Exp Analy and Env Epid
14180-187
Collins J Lewis D 2000 Hydrogen sulfide evaluation of current California Air Quality Standards with
respect to protection of children Prepared for the California Resources Board California Office of
Environmental Hazard Assessment
CPSC (Consumer Product Safety Commission) 2009 CPSC Release of Initial Chinese Drywall Studies
Tab C Available at httpwwwcpscgovenSafety-EducationSafety-Education-
CentersDrywallTopicsInteragency-Drywall-Investigation (Under ldquoReports of Scientific Investigationrdquo
section)
CPSC 2013 Electronic mail communication between Lynn Wilder (ATSDR) and Joanna Matheson
(CPSC) February 20 2013
EHHE (Environmental Health and Engineering Inc) 2010 Final report on an indoor environmental
quality assessment of residences containing Chinese drywall Prepared for the US Consumer Product
Safety Committee
EPA (US Environmental Protection Agency) 2008 Integrated Science Assessment for Sulfur Oxides
September 2008 EPA600R-08047F)
EPA 2009 Part II Federal Register Vol 74 No 234 Tuesday December 8 2009 Proposed Rules Pp
64810-64881
24
EPA 2010a Fact Sheet Revisions to the primary NAAQS monitoring network and data reporting
requirements for sulfur dioxide Last accessed 6082010 Available at
httpwwwepagovairsulfurdioxideactionshtml
EPA 2010b Final Rule Primary NAAQS for sulfur Dioxide 40 CFR Parts 50 53and 58 EPA-HQ-OAR-
2007-0352 RIN 2060-A048 Last accessed 6082010 Available at
httpwwwepagovairsulfurdioxideactionshtml
FLDOH (Florida Department of Health) 2010 Department of Health timeline of events relating to
imported drywall Available at httpwwwfloridahealthgovhealthy-environmentsdrywalldrywall-
timelinehtml
GA Tech (Georgia Institute of Technology) 2013 Phase I analysis of Chinese Drywall EmissionsmdashA
deterministic approach
Haahtela T Marttila O Vilkka V Jappinen P Jouni J Jaakkola K 1992 The South Karelia Air Pollution
Study Acute Health Effects of Malodorous Sulfur Air Pollutants Released by a Pulp Mill American
Journal of Public Health 82(4) 603-605
Heaney CD et al 2011 Relation between malodor ambient hydrogen sulfide and health in a
community bordering a landfill Environ Res doi101016jenvres201105021
Hodgson AT Nabinger SJ Persily AK 2004 Volatile organic compound concentrations and emission
rates measured over one year in a new manufactured house Berkeley California Lawrence Berkeley
National Laboratory LBNL-56272
Horstmann DH Roger LJ Kehrl HR and Hazucha MJ 1986 Airway sensitivity of asthmatics to sulfur
dioxide Toxicol Ind Health 2298-298
Jaakkola JJ Vilkka V Marttila O Jappinen P Haahtela T 1990 The South Karelia Air Pollution Study
The effects of malodorous sulfur compounds form pulp mills on respiratory and other symptoms Am
Rev Respir Dis 142(6 Pt 1)1344-1350
Khan AA et al 1990 Effects of hydrogen sulfide exposure on lung mitochondrial respiratory chain
enzymes in rats Tox and Appl Pharm 103(3)482-490
LBNL (Lawrence Berkeley National Laboratory) Berkeley CA 2010 LBNL chamber emission study
Available at httpwwwcpscgovenSafety-EducationSafety-Education-
CentersDrywallTopicsInteragency-Drywall-Investigation
LBNL 2011 LBNL problem drywall chamber emissions phase 2 report and staff cover memo
September 15 2011 Available at httpwwwcpscgovenSafety-EducationSafety-Education-
CentersDrywallTopicsInteragency-Drywall-Investigation
LDHH (Louisiana Department of Health and Hospitals) 2010 Foreign Drywall Complaint
Questionnaires August 2010 Available at httpnewdhhlouisianagovindexcfmpage800
25
Marttila O Jaakkola JJK Vikka V Jappinen P Haahtela T 1994 The South Karelia Air Pollution Study
The Effects of Malodorous Sulfur Compounds from Pulp Mills on Respiratory and Other Symptoms in
Children Environmental Research 66(2) 152-159
Marttila O Jouni J Jaakkola K ParttimdashPellinen K Vilkka V Haahtela T 1995 South Karelia Air Pollution
Study Daily Symptom Intensity in Relation to Exposure Levels of Malodorous Sulfur Compounds from
Pulp Mills Environmental Research 71 122-127
NDEQ (Nebraska Department of Environmental Quality) 1997 Technical basis for a total reduced
sulfur ambient air quality standard Air Quality Section
NIOSH (National Institute for Occupational Safety and Health) 2010 Pocket Guide to Chemical
Hazards Last accessed 01142014 Last updated 2010 Available at
httpwwwcdcgovnioshnpgnpgd0425html
Park JS Ikeda K 2006 Variations of formaldehyde and VOC levels during 3 years in new and older
homes Indoor Air 16 129-135
Partti Pellinen K Marttila O Vilkka V Jouni J Jaakkola J et al 1996 The South Karelia Air Pollution
Study Effects of Low-Level Exposure to Malodorous Sulfur Compounds on Symptoms Archives of
Environmental Health 51(4) 315-320
Savolainen H R Tenhunen E Elovaara amp A Tossavainen 1980 Cumulative Biochemical Effects of
Repeated Subclinical Hydrogen Sulfide Intoxication in Mouse Brain Int ArchOccup Environ Health
46 87 - 92
Schroeter JD Garcia G Kimbell JS 2010 A computational fluid dynamics approach to assess
interhuman variability in hydrogen sulfide nasal dosimetry Inhalation Toxicol 22(4) 277-286
Schiffman SS Walker JM Dalton P Lorig TS Raymer JH et al 2000 Potential health effects of odor
from animal operations wastewater treatment and recycling of byproducts J of Agromedicine 7(1)
7-81
Sheppard D Saisho A Nadel JA and Boushey HA 1981 Exercise Increases Sulfur Dioxide-induced
Bronchoconstriction in Asthmatic Subjects Am Rev Respir Dis 123 486-491
Shusterman D 1992a Critical Review The health significance of environmental odor pollution Arch of
Environ Health 47(1) 76-8
Shusterman D 1992b Letter to the Editor Community Health and Odor Regulation American J of
Public Health November 1992 Vol 82 No 11
TCEQ (Texas Commission on Environmental Quality) 2008 Interoffice memorandum Interim Carbonyl
Sulfide Effects Screening Levels October 24 2008
26
WHO (World Health Organization) 1948 Preamble to the Constitution of the World Health
Organization as adopted by the International Health Conference New York 19-22 June 1946 signed
on 22 July 1946 by the representatives of 61 States (Official Records of the World Health Organization
no 2 p 100) and entered into force on 7 April 1948
WHO 2003 Hydrogen Sulfide Human Health Aspects Concise International Chemical Assessment
Document 53 World Health Organization Geneva
27
Appendicesshy
28
Appendix 1 Comparison Values (CVs) and Odor Thresholds for RSCs and SO2
Contaminant
Odor
Thresholds
microgm3
Acute Health-
based CV
microgm3
Chronic Health-
based CV
microgm3
CV Description
AcuteChronic
Hydrogen sulfide 111
982
23 ATSDR acute MRLEPA
Reference Concentration
Carbon disulfide 504
305
35
TCEQ ESL short-term health
2003TCEQ ESL long-term
health 2003
Methyl
mercaptan 2
5 10
6 1
5 ERPG-1TCEQ health-based
ESL 2012
Dimethyl sulfide 765
13006
255 ERPG-1TCEQ health-based
ESL 2011
Carbonyl sulfide 1357
45005
95
TCEQ health-based ESL(ReV)
2012TCEQ health-based ESL
(ReV) 2012
Ethyl mercaptan 085
25008
135 8-hr AEGL-1TCEQ health-
based ESL 2012
Total Reduced
Sulfur
Compounds
NA 982
23 Same CVs as hydrogen
sulfide
Sulfur dioxide 11759
269
NA ATSDR acute MRLNA
1shy WHO 2003 Hydrogen Sulfide Human Health Aspects Concise International Chemical Assessment Document 53
World Health Organization Geneva
2shy ATSDR 2006 Toxicological Profile for Hydrogen Sulfide US Department of Health and Human Services Atlanta
GA
3shy EPA Reference Concentration for Hydrogen Sulfide Available at
httpcfpubepagovnceairisindexcfmfuseaction=irisshowSubstanceListamplist_type=alphaampview=H Last
accessed 01152014
4shy ATSDR 1996 Toxicological Profile for Carbon Disulfide US Department of Health and Human Services Atlanta
GA
5shy TCEQ Texas Commission of Environmental Quality 2013 Effects Screening Levels Available at
httpwwwtceqtexasgovtoxicologyeslESLMainhtml Last accessed 01152014
6shy ERPG for methyl mercaptan and dimethyl sulfide 2013 ERPGWEEL Handbook Available at
httpswwwaihaorgget-
involvedAIHAGuidelineFoundationEmergencyResponsePlanningGuidelinesDocuments2013ERPGValuespdf Last
accessed 01162014
7shy NagataY 2003 Measurement of odor threshold by triangle odor bag method Odor Measurement Review Japan
Ministry of the Environment 118-127
8shy AEGL for Ethyl Mercaptan Acute Exposure Guideline Levels for Selected Airborne Chemicals Volume 15 2013
Available at httpwwwepagovopptaeglpubsaegl_vol_15_ethyl_20mercaptan_2pdf Last accessed
01162014
9shy ATSDR 1998 Toxicological Profile for Sulfur Dioxide US Department of Health and Human Services Atlanta GA
29shy
NA ndash not available No appropriate residential exposure health-based comparison value was located for these
contaminants
An ATSDR Minimal Risk Level (MRL) is an estimate of the daily human exposure to a hazardous substance that is likely to be
without appreciable risk of adverse non-cancer health effects over a specified duration of exposure They are derived for
acute (1-14 days) intermediate (gt14-364 days) and chronic (365 days and longer) exposure durations
EPA Reference Concentration (RfC) RfCs are estimates (with uncertainty spanning perhaps an order of magnitude) of an
individualrsquos daily inhalation exposure (including sensitive subgroups) likely to be without an appreciable risk of deleterious
effects during a lifetime
Effects Screening Levels (ESLs) are currently used by the TCEQ Toxicology Division for air permitting ESLs expressed in
terms of microgram per cubic meter (microgm3) or parts per billion by volume (ppbv) in air are used to evaluate potential for
effects to occur as a result of exposure to concentrations of constituents in the air ESLs are based on data concerning
health effects odornuisance potential and effects on vegetation They are not ambient air standards If predicted or
measured airborne levels of a constituent do not exceed the screening level adverse health or welfare would not be
expected to result If ambient levels of constituents in air exceed the screening level it does not necessarily indicate a
problem but a more in-depth review is conducted Short-term indicates a 1-hour average unless otherwise noted Long-
term denotes an annual average A reference value (ReV) is based on adverse health effects and is often used to derive an
ESL by multiplying the ReV with an HQ of 03 to account for multiple chemical exposures
ERPG-1 ndashThe Emergency Response Planning Guideline (ERPG) is the maximum concentration in air below which it is
believed nearly all individuals could be exposed for up to 1 hour without experiencing other than mild transient adverse
health effects or perceiving a clearly defined objectionable odor
AEGL-1 ndash The Acute Emergency Guideline Level (AEGL) is the airborne concentration of a substance above which it is
predicted that the general population including susceptible individuals could experience notable discomfort irritation or
certain asymptomatic nonsensory effects However the effects are not disabling and are transient and reversible upon
cessation of exposure
30
Appendix 2 Screening Level ComparisonmdashComparison Values (CVs) and Hazard Quotients (HQs)
Comparison Values
Chemical1
hydrogen
sulfide
carbon
disulfide
methyl
mercaptan
dimethyl
sulfide
carbonyl
sulfide
ethyl
mercaptan TRSC3
sulfur
dioxide
CV2
acute 98 30 10 1300 4500 2500 98 26
CV intermediate 28 28
CV chronic 2 3 1 25 9 13 2 NA
2009 Data Room Temperature (25oC)Relative Humidity (50)
hydrogen
sulfide
carbon
disulfide
methyl
mercaptan
dimethyl
sulfide
carbonyl
sulfide
ethyl
mercaptan TRSC
sulfur
dioxide
C17 9673 highest emitter1 658 2 5 02 27 03 693 314
HQ acute 7 7 12
HQ Intermediate 24 25
HQ chronic 329 5 3 347
C4 8357 second highest
emitter1
607 13 7 2 6 NA 635 397
HQ4
acute 6 6 15
HQ Intermediate 22 23
HQ chronic 304 4 7 318
Average - 4 highest
emitters1
472 6 5 1 15 499 265
HQ acute 5 5 10
HQ Intermediate 17 18
HQ chronic 236 2 5 2 250
Average - All 2009
manufacture1 30 03 1 01 11 02 43 39
HQ acute 2
HQ Intermediate 1 2
HQ chronic 15 1 1 22
Average - All 2005-2006
manufacture1 273 5 3 1 12 03 294 159
HQ acute 3 3 6
HQ Intermediate 10 11
HQ chronic 137 2 1 1 144
NA4 8037 - North America1 3 1
HQ acute
HQ Intermediate
HQ chronic 1
1 - all concentrations in microgm3
HQ ge 1
2 - Comparison Value
3 - Total Reduced Sulfur Compounds
4 - HQ = Hazard Quotient = ConcentrationCV
31shy
Appendix 2 Screening Level ComparisonmdashComparison Values (CVs) and Hazard Quotients (HQs)
Contrsquod
Comparison Values
Chemical1
hydrogen
sulfide
carbon
disulfide
methyl
mercaptan
dimethyl
sulfide
carbonyl
sulfide
ethyl
mercaptan TRSC3
sulfur
dioxide
CV2
acute 98 30 10 1300 4500 2500 98 26
CV intermediate 28 28
CV chronic 2 3 1 25 9 13 2 NA
2010 Data Highest Temperature (41oC)Relative Humidity (87)
hydrogen
sulfide
carbon
disulfide
methyl
mercaptan
dimethyl
sulfide
carbonyl
sulfide
ethyl
mercaptan TRSC
sulfur
dioxide
C17 9673 highest emitter1 167 5 19 1 42 4 238 231
HQ4
acute 2 2 2 9
HQ Intermediate 6 9
HQ chronic 84 2 19 5 3 119
Average - 4 highest
emitters1
140 8 18 1 37 3 207 306
HQ acute 1 2 2 12
HQ Intermediate 5 7
HQ chronic 70 3 18 4 2 104
NA4 8037 - North America1
36 003 6 03 12 04 55 9
HQ acute
HQ Intermediate 1 2
HQ chronic 18 6 1 1 28
2010 Data Room Temperature (25oC)Relative Humidity (50)
hydrogen
sulfide
carbon
disulfide
methyl
mercaptan
dimethyl
sulfide
carbonyl
sulfide
ethyl
mercaptan TRSC
sulfur
dioxide
C3 7339 - highest emitter1 26 05 2 01 5 03 34 41
HQ acute 2
HQ Intermediate 1
HQ chronic 13 2 17
Average - 4 highest
emitters1
20 03 2 01 5 04 28 44
HQ acute 2
HQ Intermediate 1
HQ chronic 10 2 14
NA4 8037 - North America1
8 003 04 006 3 02 12 44
HQ acute 2
HQ Intermediate
HQ chronic 4 6
1 - all concentrations in microgm3
HQ ge 1
2 - Comparison Value
3 - Total Reduced Sulfur Compounds
4 - HQ = Hazard Quotient = ConcentrationCV
32shy
Appendix 3 Basis for Comparison Values and Effect Levels
33
Att
ach
men
t 3 -
Ba
sis
for
Co
mp
ari
son
Va
lues
an
d E
ffect
Lev
els
fo
r H
yd
rog
en
Su
lfid
e a
nd
To
tal R
ed
uced
Su
lfu
r C
om
po
un
ds
3
H2 S
micromicro micromicrogm
(pp
b)
CV
s B
AS
IS f
or
CV
E
XP
OS
UR
E
3
2 (
14
ppb)
RfC
N
OA
EL
640
microgm
(H
EC
adj)
olf
acto
ry n
euro
n lo
ss R
ats
UF
300
(B
rennem
an
2000)
6hr
7dy1
0w
k
10
(8)
RE
L
NO
AE
L 5
4 p
pm
HE
C 850
ppb
UF
100 in
flam
mation
of
nasa
l m
ucosa
mic
e(
CII
T 1
983)
6hr
5dy9
0dy
14
(10)
LO
A
level of
dis
tinct
odor
aw
are
ness
aff
ecting
10
28
(20)
iMR
L
NO
AE
L 6
40
ugm
3 (
HE
Cadj)
olf
acto
ry n
euro
n lo
ss R
ats
U
F 3
0 (
Bre
nnem
an
2000)
6hr
7dy1
0w
k
98
(70)
aM
RL
L
OA
EL
(m
in)
28
mgm
3 headache
31
0 a
sthm
atics
21
0 3
0
Raw
Sgaw
U
F 3
x3x3
(Jappin
en
1990)
2 p
pm
30
min
460
(329)
AE
GL
-1
8 h
ours
H
eadache
ast
hm
atics
(Jappin
en
1990)
2 p
pm
30
min
700
(500)
TE
EL
-0
1400
(1000)
TW
A-A
CG
IH
Le
ve
ls o
f E
xp
osu
re
4 (
3)
-70
(50)
corr
osi
on
(R
apaport
1988)
Corr
osi
on
to
sensi
tive
ele
ctr
onic
s at
4 u
gm
3 se
vere
corr
osi
on
at
70
ugm
3
ann
mean
8 (
6)
epi
(Jaakkola
1990)
Eye
and
nasa
l sy
mpto
ms
and
cough
Hig
hest
daily
avg
100
ugm
3
12
month
s
2800
(2000)
min
LO
AE
L
(Jappin
en
1990)
ast
hm
atics
-headache
(31
0)
30
incr
resi
stance decr
conducta
nce
(21
0)
2 p
pm
30
min
2800
(2
000)
NO
AE
L
(Bham
bhani and
Sin
gh
1991)
card
io m
eta
b
30
min
7000
(5
000)
LO
AE
L
(Bham
bhani and
Sin
gh
1991)
meta
b (
incr
blo
od
lacta
te w
exerc
ise)
30
min
7000
(5
000)
NO
AE
L
(Bham
bhani 1994)
card
io re
sp
2 p
pm
30
min
7000
(5
000)
LO
AE
L
(Bham
bhani 1996)
musc
skel (d
ecr
citra
te s
ynth
ase
exerc
isin
g 5
0
max
aero
bic
pow
er)
2x30
min
14000
(1
0000)
NO
AE
L
(Bre
nnem
an
2000)
Rats
6hr
7dy1
0w
k
14000
(1
0000)
NO
AE
L
(Bham
bhani 1997)
hum
an card
io
2x30
min
14000
(1
0000)
LO
AE
L
(Bham
bhani 1997)
hum
an m
eta
b (
incr
blo
od
lacta
te decre
ase
O2
upta
ke
2x30
min
14000
(1
0000)
NO
AE
L
(Khan
1990)
cyto
chro
me
oxid
ase
activity
decre
ase
4
hours
28000
(2
0000)
min
LO
AE
L
(Haid
er
1980)
G P
ig
Eye
irri
tation
1 h
rdy1
1days
42000
(3
0000)
LO
AE
L
(Bre
nnem
an
2000)
Rats
Olf
acto
ry n
euro
n lo
ss
6hr
7dy1
0w
k
3
TR
SC
micromicro micromicrog
m(p
pb
) C
Vs
BA
SIS
fo
r C
V
EX
PO
SU
RE
7 (
5)
CV
N
ebra
ska
30-d
ay
rolli
ng
avera
ge
standard
B
ase
d o
n m
odera
te c
orr
osi
on
with
UF
of
2
For
are
as
with
RH
gt 6
0
30
days
14
(10)
CV
N
ebra
ska
30-d
ay
rolli
ng
avera
ge
standard
B
ase
d o
n m
odera
te c
orr
osi
on
For
are
as
with
RH
=lt
60
30
days
14
(10)
CV
O
nta
rio
chro
nic
exposu
re a
ir q
ualit
y s
tandard
24
hours
21
(15)
CV
acute
Onta
rio
CV
1
hour
140
(100)
ref
valu
e (B
ham
bhani and
Sin
gh 1991)
incre
ase
d b
loood
lacta
te levels
indic
ative
of
cyto
chro
me
oxid
ase
activity
inhib
itio
n
NO
AE
L 2
ppm
UF
20
gt
16
min
Le
ve
ls o
f E
xp
osu
re
ann
mean
2-3
(1-2
) epi
(Part
ti-P
elli
nen 1996)
Self
-report
ed
Excess
cough
and
headache
SO
2 2
ugm
3 (
07
ppb)
Max
daily
TR
S 5
6 u
gm
3
Peaks
12
month
s
10-3
0 (
7-2
1)
epi
(Mart
tila
1995)
incre
ase
d n
asa
l and
eye
irri
tation
Daily
mean
0-8
2
month
ly m
ean
3-1
9 u
gm
3
15
month
s
ann
mean
12
(9)
epi
(Jaakkola
1990)
Eye
and
nasa
l sy
mpto
ms
and
cough
Hig
hest
daily
avg
100
ugm
3 (
H2S
) 1
50
ugm
3 (
MM
)
12
month
s
14
(10)
corr
osi
on
M
odera
te c
opper
corr
osi
on
1 m
onth
22
(16)
epi
(Kill
burn
and
Wars
haw
1995)
Num
ero
us
neuro
behavio
ral com
pla
ints
in
form
er
refi
nery
work
ers
and
nearb
y r
esi
dents
S
O2
hi but
not
inclu
ded
gt30
(21)
epi
(Mart
til 1995)
incre
ase
d n
ause
a 15
month
s
42
(30)
rolli
ng
avg
epi
(Cam
pagna
2004)
posi
tive
ass
oc
hosp
ital vis
its
for
child
ren
for
resp
irato
ry d
isease
(in
clu
din
g a
sthm
a)
and
pre
vio
us
day
hig
h T
RS
30
min
daily
avg
gt 3
5 (
25)
epi
(Haahte
la 1992)
Eye
and
resp
irato
ry s
ym
pto
ms
Self
report
ed
24-h
our
avera
ges
were
35
ugm
3 (
25)
and
43
ugm
3 (
31)
SO
2 1
ugm
3
2 d
ays
daily
avg
98
(70)
epi
(Jaakkola
1990)
Eye
and
nasa
l sy
mpto
ms
and
cough
12
month
s
2800
(2000)
(Jappin
en 1990)
Bro
ncia
l obst
ruction
in a
sthm
atics
30
min
gt2800
(2000)
(Bham
bhani and
Sin
gh 1991)
incre
ase
d b
loood
lacta
te levels
indic
ative
of
cyto
chro
me
oxid
ase
activity
inhib
itio
n
Inhib
ited
enzy
me
activity
30
min
34
35shy
36shy
37
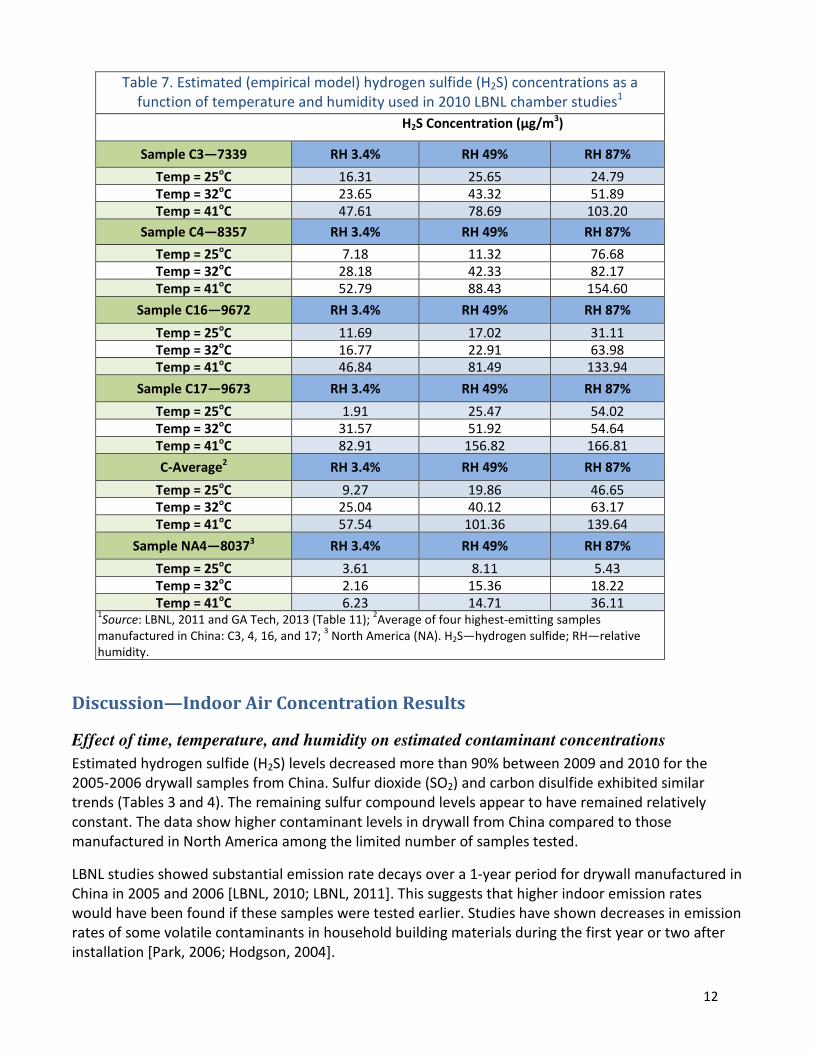
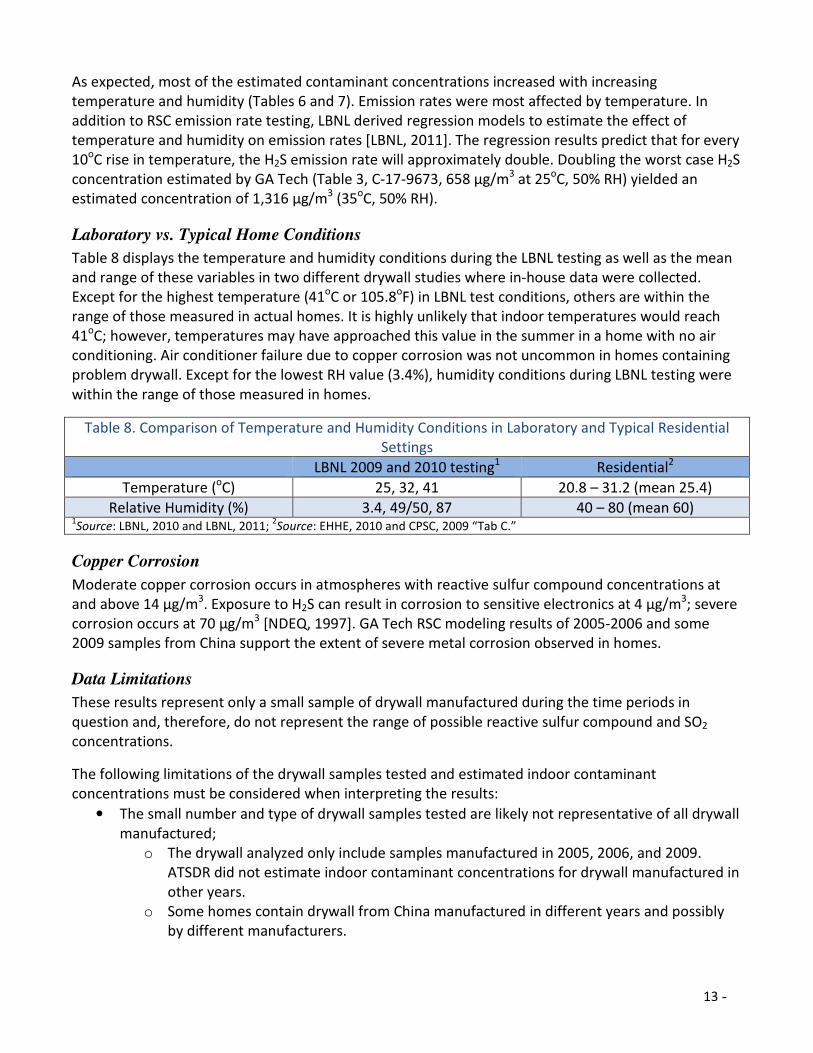

Appendix 2 Screening Level ComparisonmdashComparison Values (CVs) and Hazard Quotients (HQs)
Comparison Values
Chemical1
hydrogen
sulfide
carbon
disulfide
methyl
mercaptan
dimethyl
sulfide
carbonyl
sulfide
ethyl
mercaptan TRSC3
sulfur
dioxide
CV2
acute 98 30 10 1300 4500 2500 98 26
CV intermediate 28 28
CV chronic 2 3 1 25 9 13 2 NA
2009 Data Room Temperature (25oC)Relative Humidity (50)
hydrogen
sulfide
carbon
disulfide
methyl
mercaptan
dimethyl
sulfide
carbonyl
sulfide
ethyl
mercaptan TRSC
sulfur
dioxide
C17 9673 highest emitter1 658 2 5 02 27 03 693 314
HQ acute 7 7 12
HQ Intermediate 24 25
HQ chronic 329 5 3 347
C4 8357 second highest
emitter1
607 13 7 2 6 NA 635 397
HQ4
acute 6 6 15
HQ Intermediate 22 23
HQ chronic 304 4 7 318
Average - 4 highest
emitters1
472 6 5 1 15 499 265
HQ acute 5 5 10
HQ Intermediate 17 18
HQ chronic 236 2 5 2 250
Average - All 2009
manufacture1 30 03 1 01 11 02 43 39
HQ acute 2
HQ Intermediate 1 2
HQ chronic 15 1 1 22
Average - All 2005-2006
manufacture1 273 5 3 1 12 03 294 159
HQ acute 3 3 6
HQ Intermediate 10 11
HQ chronic 137 2 1 1 144
NA4 8037 - North America1 3 1
HQ acute
HQ Intermediate
HQ chronic 1
1 - all concentrations in microgm3
HQ ge 1
2 - Comparison Value
3 - Total Reduced Sulfur Compounds
4 - HQ = Hazard Quotient = ConcentrationCV
31shy
Appendix 2 Screening Level ComparisonmdashComparison Values (CVs) and Hazard Quotients (HQs)
Contrsquod
Comparison Values
Chemical1
hydrogen
sulfide
carbon
disulfide
methyl
mercaptan
dimethyl
sulfide
carbonyl
sulfide
ethyl
mercaptan TRSC3
sulfur
dioxide
CV2
acute 98 30 10 1300 4500 2500 98 26
CV intermediate 28 28
CV chronic 2 3 1 25 9 13 2 NA
2010 Data Highest Temperature (41oC)Relative Humidity (87)
hydrogen
sulfide
carbon
disulfide
methyl
mercaptan
dimethyl
sulfide
carbonyl
sulfide
ethyl
mercaptan TRSC
sulfur
dioxide
C17 9673 highest emitter1 167 5 19 1 42 4 238 231
HQ4
acute 2 2 2 9
HQ Intermediate 6 9
HQ chronic 84 2 19 5 3 119
Average - 4 highest
emitters1
140 8 18 1 37 3 207 306
HQ acute 1 2 2 12
HQ Intermediate 5 7
HQ chronic 70 3 18 4 2 104
NA4 8037 - North America1
36 003 6 03 12 04 55 9
HQ acute
HQ Intermediate 1 2
HQ chronic 18 6 1 1 28
2010 Data Room Temperature (25oC)Relative Humidity (50)
hydrogen
sulfide
carbon
disulfide
methyl
mercaptan
dimethyl
sulfide
carbonyl
sulfide
ethyl
mercaptan TRSC
sulfur
dioxide
C3 7339 - highest emitter1 26 05 2 01 5 03 34 41
HQ acute 2
HQ Intermediate 1
HQ chronic 13 2 17
Average - 4 highest
emitters1
20 03 2 01 5 04 28 44
HQ acute 2
HQ Intermediate 1
HQ chronic 10 2 14
NA4 8037 - North America1
8 003 04 006 3 02 12 44
HQ acute 2
HQ Intermediate
HQ chronic 4 6
1 - all concentrations in microgm3
HQ ge 1
2 - Comparison Value
3 - Total Reduced Sulfur Compounds
4 - HQ = Hazard Quotient = ConcentrationCV
32shy
Appendix 3 Basis for Comparison Values and Effect Levels
33
Att
ach
men
t 3 -
Ba
sis
for
Co
mp
ari
son
Va
lues
an
d E
ffect
Lev
els
fo
r H
yd
rog
en
Su
lfid
e a
nd
To
tal R
ed
uced
Su
lfu
r C
om
po
un
ds
3
H2 S
micromicro micromicrogm
(pp
b)
CV
s B
AS
IS f
or
CV
E
XP
OS
UR
E
3
2 (
14
ppb)
RfC
N
OA
EL
640
microgm
(H
EC
adj)
olf
acto
ry n
euro
n lo
ss R
ats
UF
300
(B
rennem
an
2000)
6hr
7dy1
0w
k
10
(8)
RE
L
NO
AE
L 5
4 p
pm
HE
C 850
ppb
UF
100 in
flam
mation
of
nasa
l m
ucosa
mic
e(
CII
T 1
983)
6hr
5dy9
0dy
14
(10)
LO
A
level of
dis
tinct
odor
aw
are
ness
aff
ecting
10
28
(20)
iMR
L
NO
AE
L 6
40
ugm
3 (
HE
Cadj)
olf
acto
ry n
euro
n lo
ss R
ats
U
F 3
0 (
Bre
nnem
an
2000)
6hr
7dy1
0w
k
98
(70)
aM
RL
L
OA
EL
(m
in)
28
mgm
3 headache
31
0 a
sthm
atics
21
0 3
0
Raw
Sgaw
U
F 3
x3x3
(Jappin
en
1990)
2 p
pm
30
min
460
(329)
AE
GL
-1
8 h
ours
H
eadache
ast
hm
atics
(Jappin
en
1990)
2 p
pm
30
min
700
(500)
TE
EL
-0
1400
(1000)
TW
A-A
CG
IH
Le
ve
ls o
f E
xp
osu
re
4 (
3)
-70
(50)
corr
osi
on
(R
apaport
1988)
Corr
osi
on
to
sensi
tive
ele
ctr
onic
s at
4 u
gm
3 se
vere
corr
osi
on
at
70
ugm
3
ann
mean
8 (
6)
epi
(Jaakkola
1990)
Eye
and
nasa
l sy
mpto
ms
and
cough
Hig
hest
daily
avg
100
ugm
3
12
month
s
2800
(2000)
min
LO
AE
L
(Jappin
en
1990)
ast
hm
atics
-headache
(31
0)
30
incr
resi
stance decr
conducta
nce
(21
0)
2 p
pm
30
min
2800
(2
000)
NO
AE
L
(Bham
bhani and
Sin
gh
1991)
card
io m
eta
b
30
min
7000
(5
000)
LO
AE
L
(Bham
bhani and
Sin
gh
1991)
meta
b (
incr
blo
od
lacta
te w
exerc
ise)
30
min
7000
(5
000)
NO
AE
L
(Bham
bhani 1994)
card
io re
sp
2 p
pm
30
min
7000
(5
000)
LO
AE
L
(Bham
bhani 1996)
musc
skel (d
ecr
citra
te s
ynth
ase
exerc
isin
g 5
0
max
aero
bic
pow
er)
2x30
min
14000
(1
0000)
NO
AE
L
(Bre
nnem
an
2000)
Rats
6hr
7dy1
0w
k
14000
(1
0000)
NO
AE
L
(Bham
bhani 1997)
hum
an card
io
2x30
min
14000
(1
0000)
LO
AE
L
(Bham
bhani 1997)
hum
an m
eta
b (
incr
blo
od
lacta
te decre
ase
O2
upta
ke
2x30
min
14000
(1
0000)
NO
AE
L
(Khan
1990)
cyto
chro
me
oxid
ase
activity
decre
ase
4
hours
28000
(2
0000)
min
LO
AE
L
(Haid
er
1980)
G P
ig
Eye
irri
tation
1 h
rdy1
1days
42000
(3
0000)
LO
AE
L
(Bre
nnem
an
2000)
Rats
Olf
acto
ry n
euro
n lo
ss
6hr
7dy1
0w
k
3
TR
SC
micromicro micromicrog
m(p
pb
) C
Vs
BA
SIS
fo
r C
V
EX
PO
SU
RE
7 (
5)
CV
N
ebra
ska
30-d
ay
rolli
ng
avera
ge
standard
B
ase
d o
n m
odera
te c
orr
osi
on
with
UF
of
2
For
are
as
with
RH
gt 6
0
30
days
14
(10)
CV
N
ebra
ska
30-d
ay
rolli
ng
avera
ge
standard
B
ase
d o
n m
odera
te c
orr
osi
on
For
are
as
with
RH
=lt
60
30
days
14
(10)
CV
O
nta
rio
chro
nic
exposu
re a
ir q
ualit
y s
tandard
24
hours
21
(15)
CV
acute
Onta
rio
CV
1
hour
140
(100)
ref
valu
e (B
ham
bhani and
Sin
gh 1991)
incre
ase
d b
loood
lacta
te levels
indic
ative
of
cyto
chro
me
oxid
ase
activity
inhib
itio
n
NO
AE
L 2
ppm
UF
20
gt
16
min
Le
ve
ls o
f E
xp
osu
re
ann
mean
2-3
(1-2
) epi
(Part
ti-P
elli
nen 1996)
Self
-report
ed
Excess
cough
and
headache
SO
2 2
ugm
3 (
07
ppb)
Max
daily
TR
S 5
6 u
gm
3
Peaks
12
month
s
10-3
0 (
7-2
1)
epi
(Mart
tila
1995)
incre
ase
d n
asa
l and
eye
irri
tation
Daily
mean
0-8
2
month
ly m
ean
3-1
9 u
gm
3
15
month
s
ann
mean
12
(9)
epi
(Jaakkola
1990)
Eye
and
nasa
l sy
mpto
ms
and
cough
Hig
hest
daily
avg
100
ugm
3 (
H2S
) 1
50
ugm
3 (
MM
)
12
month
s
14
(10)
corr
osi
on
M
odera
te c
opper
corr
osi
on
1 m
onth
22
(16)
epi
(Kill
burn
and
Wars
haw
1995)
Num
ero
us
neuro
behavio
ral com
pla
ints
in
form
er
refi
nery
work
ers
and
nearb
y r
esi
dents
S
O2
hi but
not
inclu
ded
gt30
(21)
epi
(Mart
til 1995)
incre
ase
d n
ause
a 15
month
s
42
(30)
rolli
ng
avg
epi
(Cam
pagna
2004)
posi
tive
ass
oc
hosp
ital vis
its
for
child
ren
for
resp
irato
ry d
isease
(in
clu
din
g a
sthm
a)
and
pre
vio
us
day
hig
h T
RS
30
min
daily
avg
gt 3
5 (
25)
epi
(Haahte
la 1992)
Eye
and
resp
irato
ry s
ym
pto
ms
Self
report
ed
24-h
our
avera
ges
were
35
ugm
3 (
25)
and
43
ugm
3 (
31)
SO
2 1
ugm
3
2 d
ays
daily
avg
98
(70)
epi
(Jaakkola
1990)
Eye
and
nasa
l sy
mpto
ms
and
cough
12
month
s
2800
(2000)
(Jappin
en 1990)
Bro
ncia
l obst
ruction
in a
sthm
atics
30
min
gt2800
(2000)
(Bham
bhani and
Sin
gh 1991)
incre
ase
d b
loood
lacta
te levels
indic
ative
of
cyto
chro
me
oxid
ase
activity
inhib
itio
n
Inhib
ited
enzy
me
activity
30
min
34
35shy
36shy
37
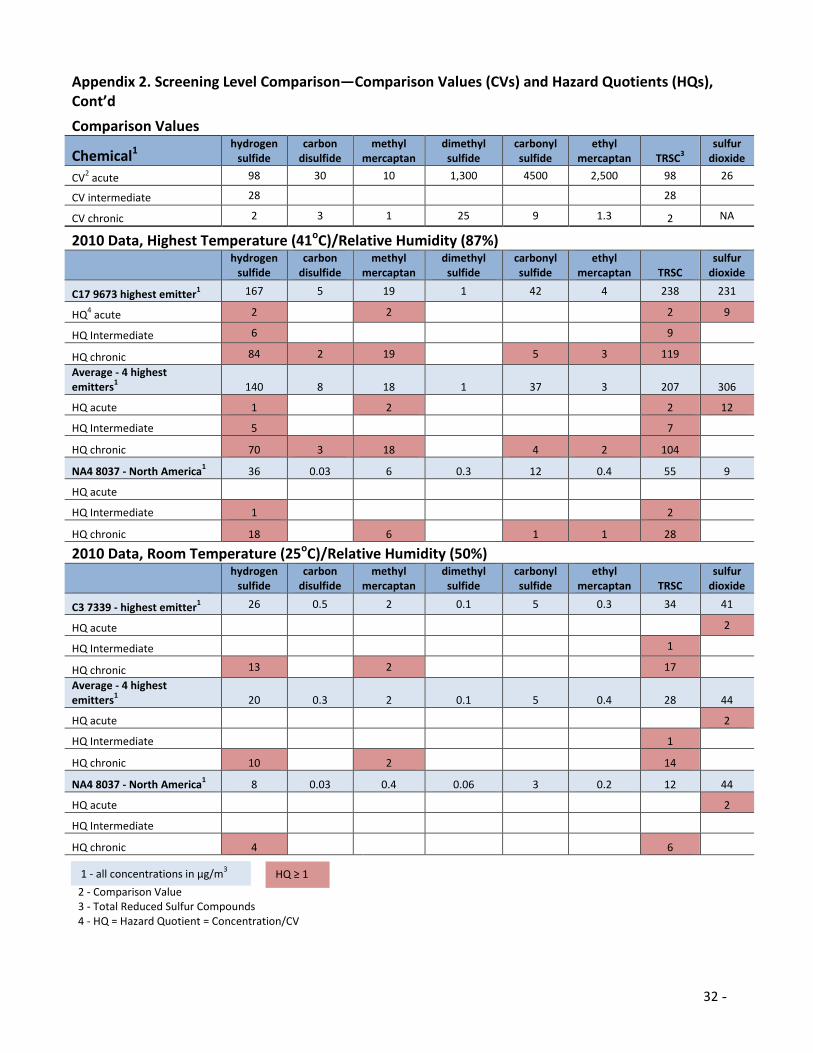
Appendix 2 Screening Level ComparisonmdashComparison Values (CVs) and Hazard Quotients (HQs)
Contrsquod
Comparison Values
Chemical1
hydrogen
sulfide
carbon
disulfide
methyl
mercaptan
dimethyl
sulfide
carbonyl
sulfide
ethyl
mercaptan TRSC3
sulfur
dioxide
CV2
acute 98 30 10 1300 4500 2500 98 26
CV intermediate 28 28
CV chronic 2 3 1 25 9 13 2 NA
2010 Data Highest Temperature (41oC)Relative Humidity (87)
hydrogen
sulfide
carbon
disulfide
methyl
mercaptan
dimethyl
sulfide
carbonyl
sulfide
ethyl
mercaptan TRSC
sulfur
dioxide
C17 9673 highest emitter1 167 5 19 1 42 4 238 231
HQ4
acute 2 2 2 9
HQ Intermediate 6 9
HQ chronic 84 2 19 5 3 119
Average - 4 highest
emitters1
140 8 18 1 37 3 207 306
HQ acute 1 2 2 12
HQ Intermediate 5 7
HQ chronic 70 3 18 4 2 104
NA4 8037 - North America1
36 003 6 03 12 04 55 9
HQ acute
HQ Intermediate 1 2
HQ chronic 18 6 1 1 28
2010 Data Room Temperature (25oC)Relative Humidity (50)
hydrogen
sulfide
carbon
disulfide
methyl
mercaptan
dimethyl
sulfide
carbonyl
sulfide
ethyl
mercaptan TRSC
sulfur
dioxide
C3 7339 - highest emitter1 26 05 2 01 5 03 34 41
HQ acute 2
HQ Intermediate 1
HQ chronic 13 2 17
Average - 4 highest
emitters1
20 03 2 01 5 04 28 44
HQ acute 2
HQ Intermediate 1
HQ chronic 10 2 14
NA4 8037 - North America1
8 003 04 006 3 02 12 44
HQ acute 2
HQ Intermediate
HQ chronic 4 6
1 - all concentrations in microgm3
HQ ge 1
2 - Comparison Value
3 - Total Reduced Sulfur Compounds
4 - HQ = Hazard Quotient = ConcentrationCV
32shy
Appendix 3 Basis for Comparison Values and Effect Levels
33
Att
ach
men
t 3 -
Ba
sis
for
Co
mp
ari
son
Va
lues
an
d E
ffect
Lev
els
fo
r H
yd
rog
en
Su
lfid
e a
nd
To
tal R
ed
uced
Su
lfu
r C
om
po
un
ds
3
H2 S
micromicro micromicrogm
(pp
b)
CV
s B
AS
IS f
or
CV
E
XP
OS
UR
E
3
2 (
14
ppb)
RfC
N
OA
EL
640
microgm
(H
EC
adj)
olf
acto
ry n
euro
n lo
ss R
ats
UF
300
(B
rennem
an
2000)
6hr
7dy1
0w
k
10
(8)
RE
L
NO
AE
L 5
4 p
pm
HE
C 850
ppb
UF
100 in
flam
mation
of
nasa
l m
ucosa
mic
e(
CII
T 1
983)
6hr
5dy9
0dy
14
(10)
LO
A
level of
dis
tinct
odor
aw
are
ness
aff
ecting
10
28
(20)
iMR
L
NO
AE
L 6
40
ugm
3 (
HE
Cadj)
olf
acto
ry n
euro
n lo
ss R
ats
U
F 3
0 (
Bre
nnem
an
2000)
6hr
7dy1
0w
k
98
(70)
aM
RL
L
OA
EL
(m
in)
28
mgm
3 headache
31
0 a
sthm
atics
21
0 3
0
Raw
Sgaw
U
F 3
x3x3
(Jappin
en
1990)
2 p
pm
30
min
460
(329)
AE
GL
-1
8 h
ours
H
eadache
ast
hm
atics
(Jappin
en
1990)
2 p
pm
30
min
700
(500)
TE
EL
-0
1400
(1000)
TW
A-A
CG
IH
Le
ve
ls o
f E
xp
osu
re
4 (
3)
-70
(50)
corr
osi
on
(R
apaport
1988)
Corr
osi
on
to
sensi
tive
ele
ctr
onic
s at
4 u
gm
3 se
vere
corr
osi
on
at
70
ugm
3
ann
mean
8 (
6)
epi
(Jaakkola
1990)
Eye
and
nasa
l sy
mpto
ms
and
cough
Hig
hest
daily
avg
100
ugm
3
12
month
s
2800
(2000)
min
LO
AE
L
(Jappin
en
1990)
ast
hm
atics
-headache
(31
0)
30
incr
resi
stance decr
conducta
nce
(21
0)
2 p
pm
30
min
2800
(2
000)
NO
AE
L
(Bham
bhani and
Sin
gh
1991)
card
io m
eta
b
30
min
7000
(5
000)
LO
AE
L
(Bham
bhani and
Sin
gh
1991)
meta
b (
incr
blo
od
lacta
te w
exerc
ise)
30
min
7000
(5
000)
NO
AE
L
(Bham
bhani 1994)
card
io re
sp
2 p
pm
30
min
7000
(5
000)
LO
AE
L
(Bham
bhani 1996)
musc
skel (d
ecr
citra
te s
ynth
ase
exerc
isin
g 5
0
max
aero
bic
pow
er)
2x30
min
14000
(1
0000)
NO
AE
L
(Bre
nnem
an
2000)
Rats
6hr
7dy1
0w
k
14000
(1
0000)
NO
AE
L
(Bham
bhani 1997)
hum
an card
io
2x30
min
14000
(1
0000)
LO
AE
L
(Bham
bhani 1997)
hum
an m
eta
b (
incr
blo
od
lacta
te decre
ase
O2
upta
ke
2x30
min
14000
(1
0000)
NO
AE
L
(Khan
1990)
cyto
chro
me
oxid
ase
activity
decre
ase
4
hours
28000
(2
0000)
min
LO
AE
L
(Haid
er
1980)
G P
ig
Eye
irri
tation
1 h
rdy1
1days
42000
(3
0000)
LO
AE
L
(Bre
nnem
an
2000)
Rats
Olf
acto
ry n
euro
n lo
ss
6hr
7dy1
0w
k
3
TR
SC
micromicro micromicrog
m(p
pb
) C
Vs
BA
SIS
fo
r C
V
EX
PO
SU
RE
7 (
5)
CV
N
ebra
ska
30-d
ay
rolli
ng
avera
ge
standard
B
ase
d o
n m
odera
te c
orr
osi
on
with
UF
of
2
For
are
as
with
RH
gt 6
0
30
days
14
(10)
CV
N
ebra
ska
30-d
ay
rolli
ng
avera
ge
standard
B
ase
d o
n m
odera
te c
orr
osi
on
For
are
as
with
RH
=lt
60
30
days
14
(10)
CV
O
nta
rio
chro
nic
exposu
re a
ir q
ualit
y s
tandard
24
hours
21
(15)
CV
acute
Onta
rio
CV
1
hour
140
(100)
ref
valu
e (B
ham
bhani and
Sin
gh 1991)
incre
ase
d b
loood
lacta
te levels
indic
ative
of
cyto
chro
me
oxid
ase
activity
inhib
itio
n
NO
AE
L 2
ppm
UF
20
gt
16
min
Le
ve
ls o
f E
xp
osu
re
ann
mean
2-3
(1-2
) epi
(Part
ti-P
elli
nen 1996)
Self
-report
ed
Excess
cough
and
headache
SO
2 2
ugm
3 (
07
ppb)
Max
daily
TR
S 5
6 u
gm
3
Peaks
12
month
s
10-3
0 (
7-2
1)
epi
(Mart
tila
1995)
incre
ase
d n
asa
l and
eye
irri
tation
Daily
mean
0-8
2
month
ly m
ean
3-1
9 u
gm
3
15
month
s
ann
mean
12
(9)
epi
(Jaakkola
1990)
Eye
and
nasa
l sy
mpto
ms
and
cough
Hig
hest
daily
avg
100
ugm
3 (
H2S
) 1
50
ugm
3 (
MM
)
12
month
s
14
(10)
corr
osi
on
M
odera
te c
opper
corr
osi
on
1 m
onth
22
(16)
epi
(Kill
burn
and
Wars
haw
1995)
Num
ero
us
neuro
behavio
ral com
pla
ints
in
form
er
refi
nery
work
ers
and
nearb
y r
esi
dents
S
O2
hi but
not
inclu
ded
gt30
(21)
epi
(Mart
til 1995)
incre
ase
d n
ause
a 15
month
s
42
(30)
rolli
ng
avg
epi
(Cam
pagna
2004)
posi
tive
ass
oc
hosp
ital vis
its
for
child
ren
for
resp
irato
ry d
isease
(in
clu
din
g a
sthm
a)
and
pre
vio
us
day
hig
h T
RS
30
min
daily
avg
gt 3
5 (
25)
epi
(Haahte
la 1992)
Eye
and
resp
irato
ry s
ym
pto
ms
Self
report
ed
24-h
our
avera
ges
were
35
ugm
3 (
25)
and
43
ugm
3 (
31)
SO
2 1
ugm
3
2 d
ays
daily
avg
98
(70)
epi
(Jaakkola
1990)
Eye
and
nasa
l sy
mpto
ms
and
cough
12
month
s
2800
(2000)
(Jappin
en 1990)
Bro
ncia
l obst
ruction
in a
sthm
atics
30
min
gt2800
(2000)
(Bham
bhani and
Sin
gh 1991)
incre
ase
d b
loood
lacta
te levels
indic
ative
of
cyto
chro
me
oxid
ase
activity
inhib
itio
n
Inhib
ited
enzy
me
activity
30
min
34
35shy
36shy
37
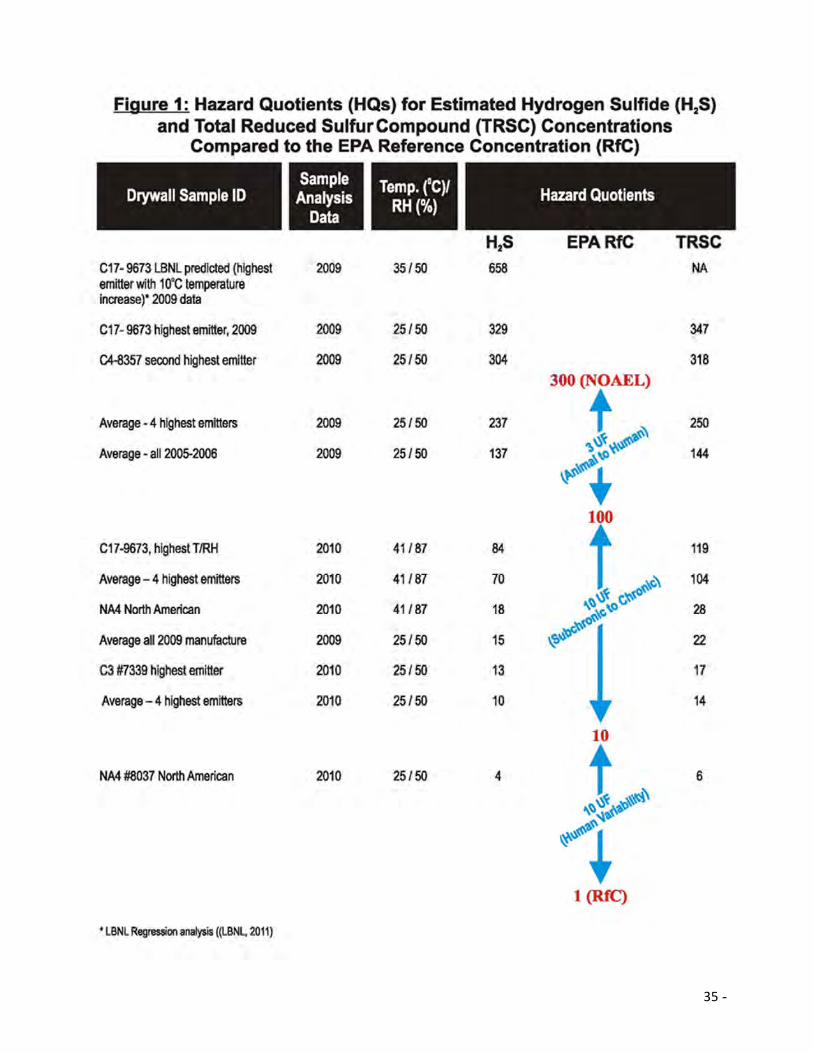
35shy
36shy
37

36shy
37

37


![M100 Shapes LED Recessed [L10/L1R] selux€¦ · After Drywall Flange Mounting (SF3) 1. Drywall/Drywall screw (Ref.) 2. Drywall/Drywall (Ref.) 3. 1/6” Plaster skimcoat (Ref.) 4.](https://static.fdocuments.net/doc/165x107/5f54633924da634fd0733121/m100-shapes-led-recessed-l10l1r-selux-after-drywall-flange-mounting-sf3-1.jpg)