
Reviewing Commonwealth Marine Bioregional Planning
30
Ian Cresswell, Nic Bax and Franzis Althaus CSIRO Wealth from Oceans Flagship & IMAS, University of Tasmania Reviewing Commonwealth Marine Bioregional Planning More than MPAs?
Transcript of Reviewing Commonwealth Marine Bioregional Planning
Ian Cresswell, Nic Bax and Franzis Althaus
CSIRO Wealth from Oceans Flagship &
IMAS, University of Tasmania
Reviewing Commonwealth Marine
Bioregional Planning
More than MPAs?
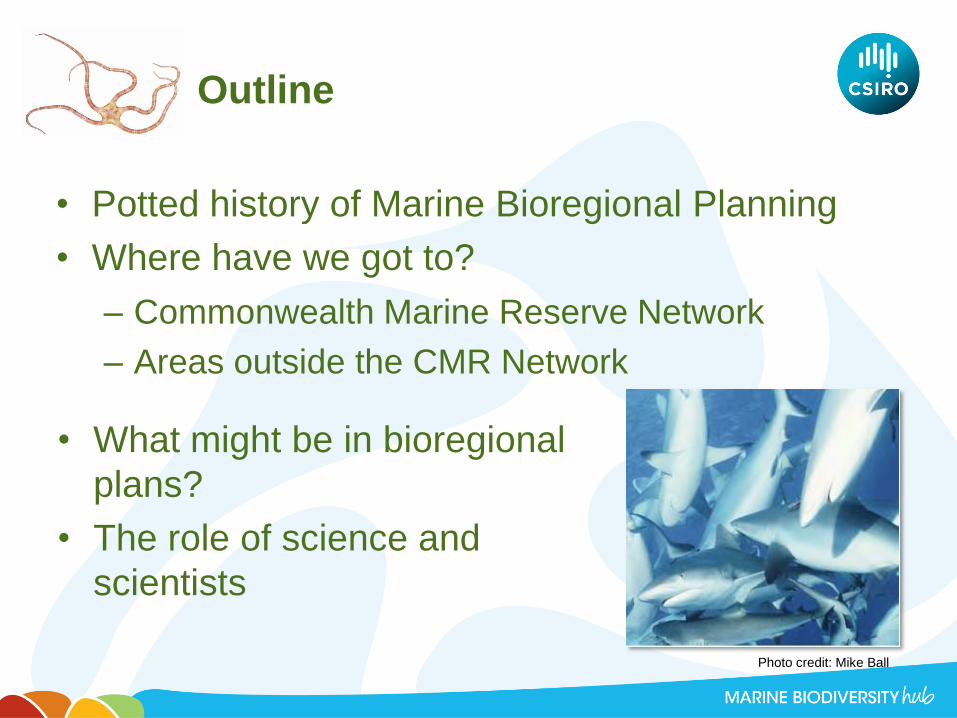
Outline
• Potted history of Marine Bioregional Planning
• Where have we got to?
– Commonwealth Marine Reserve Network
– Areas outside the CMR Network
Photo credit: Mike Ball
• What might be in bioregional
plans?
• The role of science and
scientists
History of marine planning in Australia
• 1992 Convention on Biological Diversity – MPAs
• 1992 Intergovernmental Agreement on the
Environment –value of representative system
• 1998 Australia’s Oceans Policy
• 1998 ANZECC national commitment rep system
(release of Guidelines for NRSMPA)
• 2002 WSSD – commitment to representative
system of MPAs by 2012
• 2007 Goals and Principles for CMR
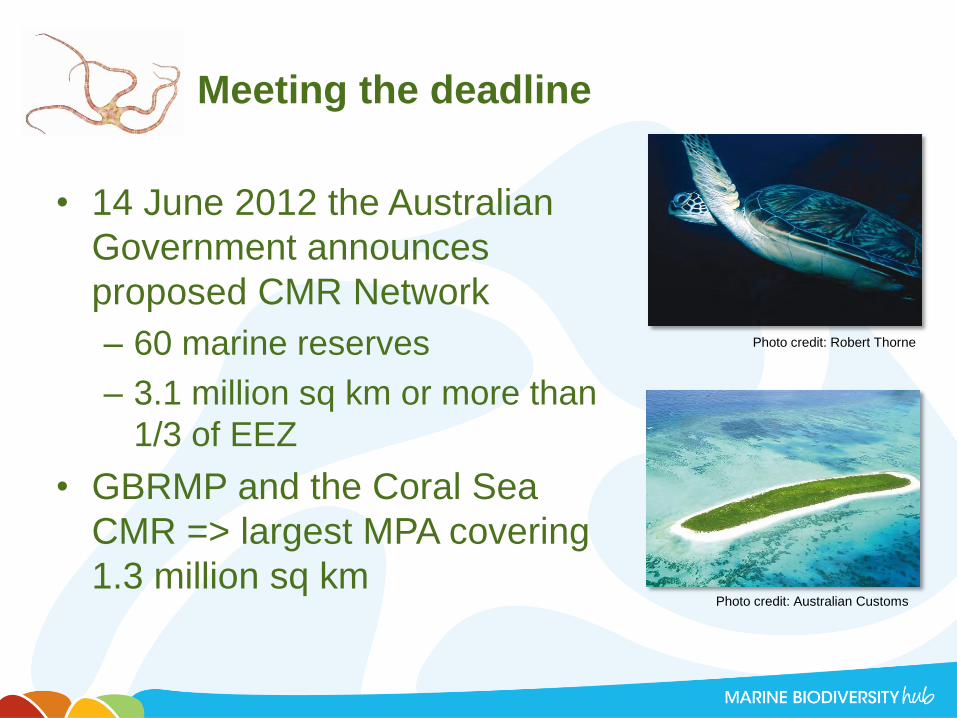
Meeting the deadline
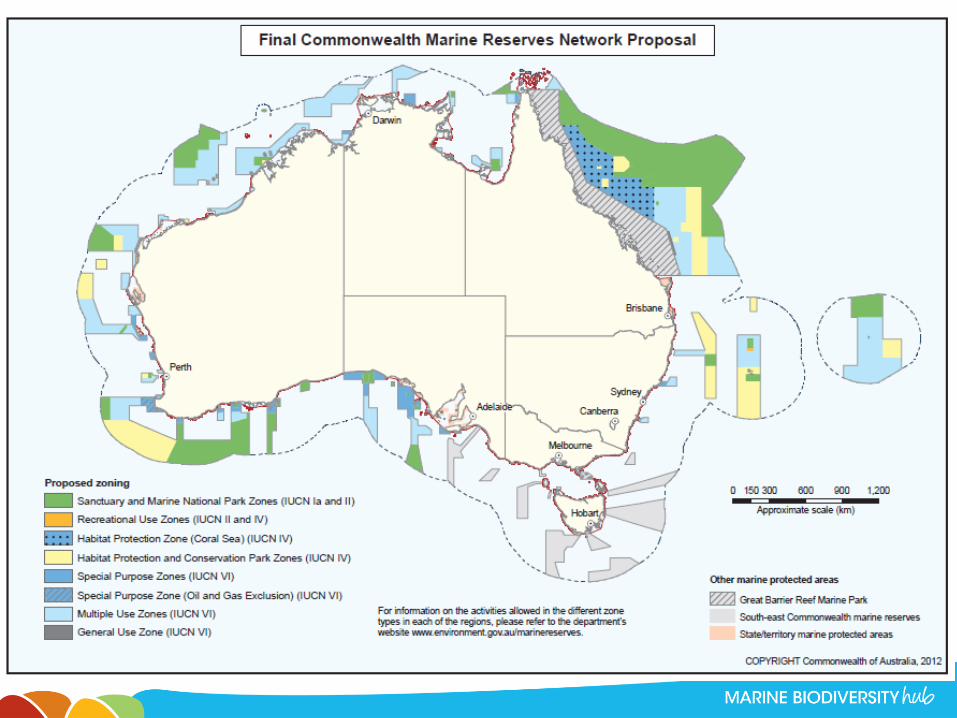
• 14 June 2012 the Australian
Government announces
proposed CMR Network
– 60 marine reserves
– 3.1 million sq km or more than
1/3 of EEZ
• GBRMP and the Coral Sea
CMR => largest MPA covering
1.3 million sq km
Photo credit: Robert Thorne
Photo credit: Australian Customs
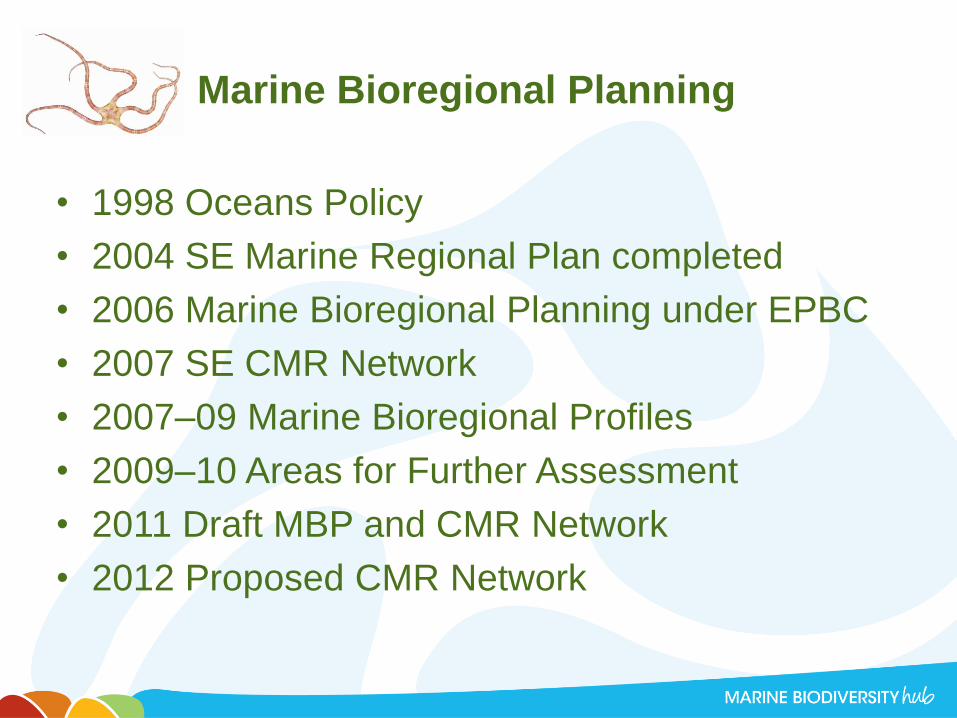
Marine Bioregional Planning
• 1998 Oceans Policy
• 2004 SE Marine Regional Plan completed
• 2006 Marine Bioregional Planning under EPBC
• 2007 SE CMR Network
• 2007–09 Marine Bioregional Profiles
• 2009–10 Areas for Further Assessment
• 2011 Draft MBP and CMR Network
• 2012 Proposed CMR Network
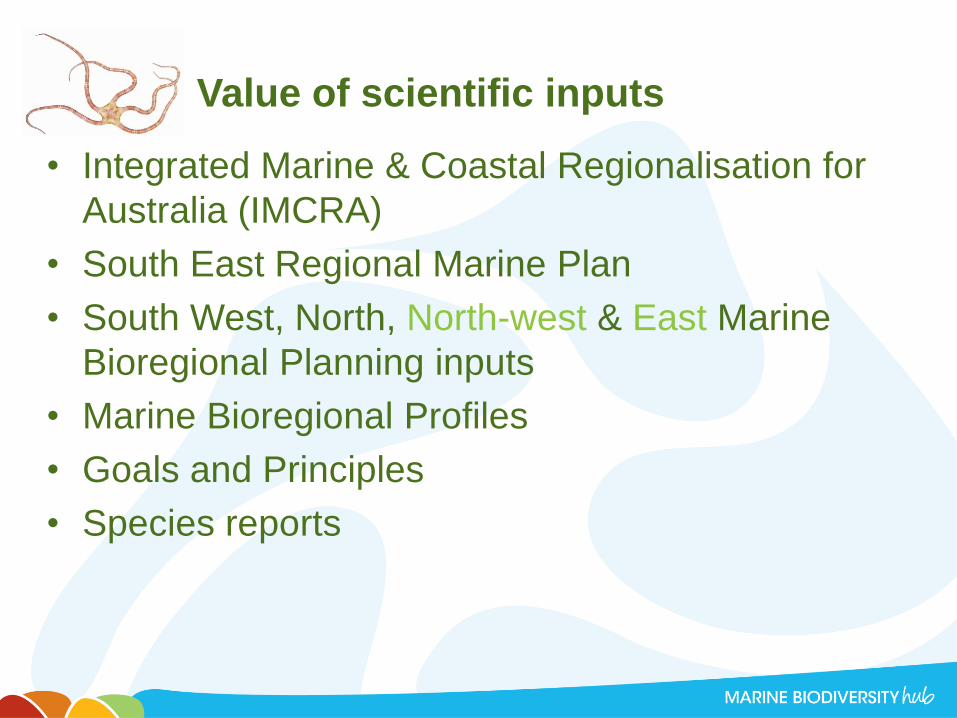
Value of scientific inputs
• Integrated Marine & Coastal Regionalisation for
Australia (IMCRA)
• South East Regional Marine Plan
• South West, North, North-west & East Marine
Bioregional Planning inputs
• Marine Bioregional Profiles
• Goals and Principles
• Species reports
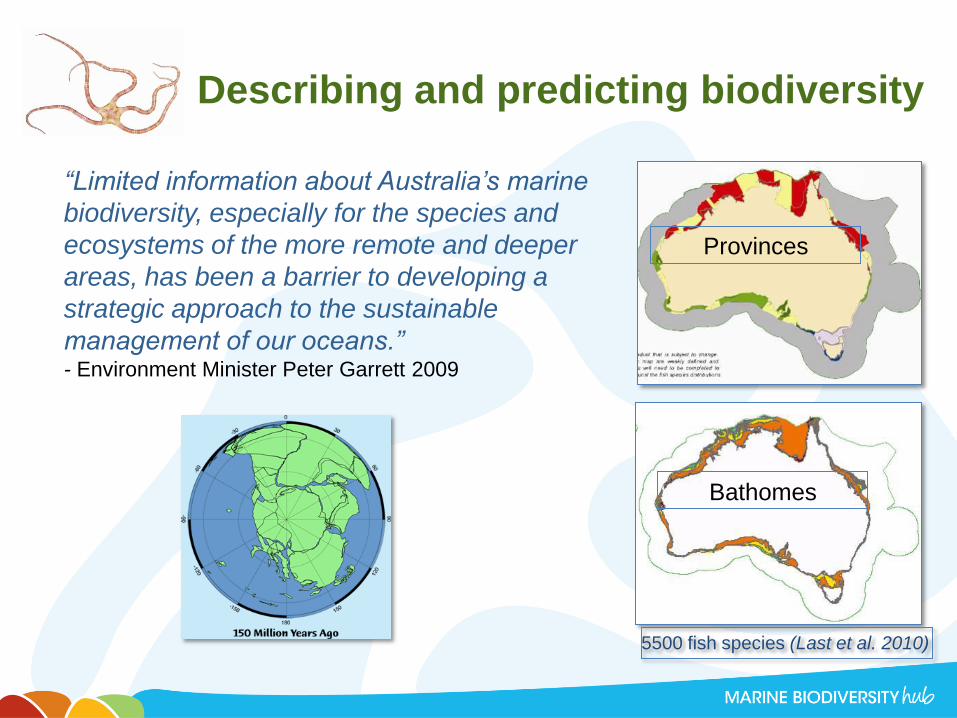
“Limited information about Australia’s marine
biodiversity, especially for the species and
ecosystems of the more remote and deeper
areas, has been a barrier to developing a
strategic approach to the sustainable
management of our oceans.” - Environment Minister Peter Garrett 2009
Bathomes
Provinces
5500 fish species (Last et al. 2010)
Describing and predicting biodiversity
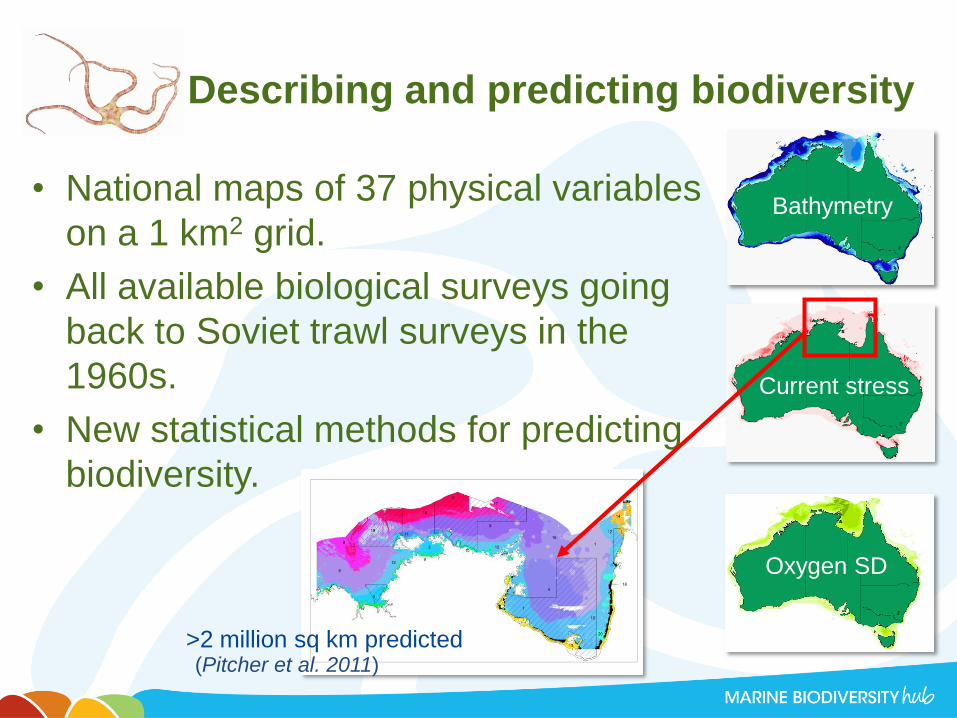
• National maps of 37 physical variables
on a 1 km2 grid.
• All available biological surveys going
back to Soviet trawl surveys in the
1960s.
• New statistical methods for predicting
biodiversity.
Bathymetry
Current stress
Oxygen SD
(Pitcher et al. 2011)
Describing and predicting biodiversity
>2 million sq km predicted
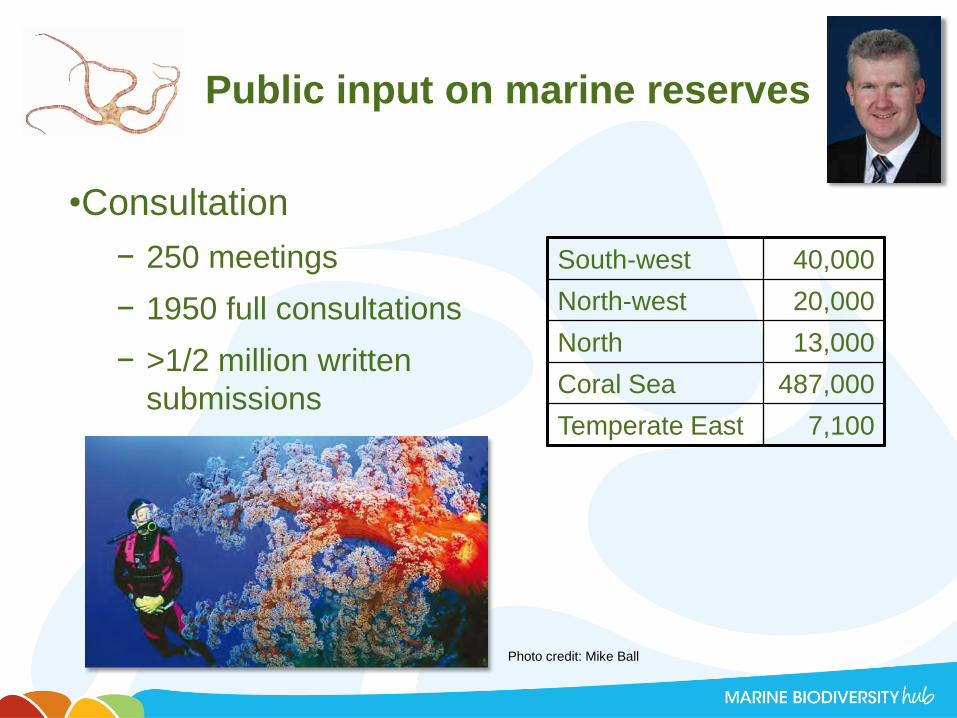
Public input on marine reserves
•Consultation
− 250 meetings
− 1950 full consultations
− >1/2 million written
submissions
South-west 40,000
North-west 20,000
North 13,000
Coral Sea 487,000
Temperate East 7,100
Photo credit: Mike Ball
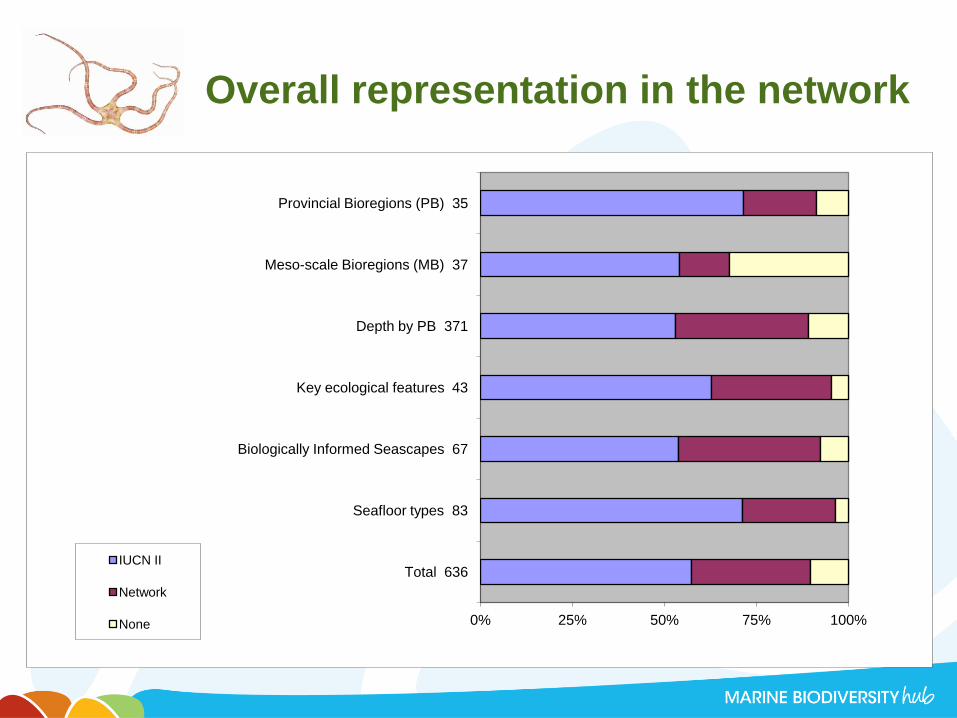
Overall representation in the network
0% 25% 50% 75% 100%
Provincial Bioregions (PB) 35
Meso-scale Bioregions (MB) 37
Depth by PB 371
Key ecological features 43
Biologically Informed Seascapes 67
Seafloor types 83
Total 636 IUCN II
Network
None
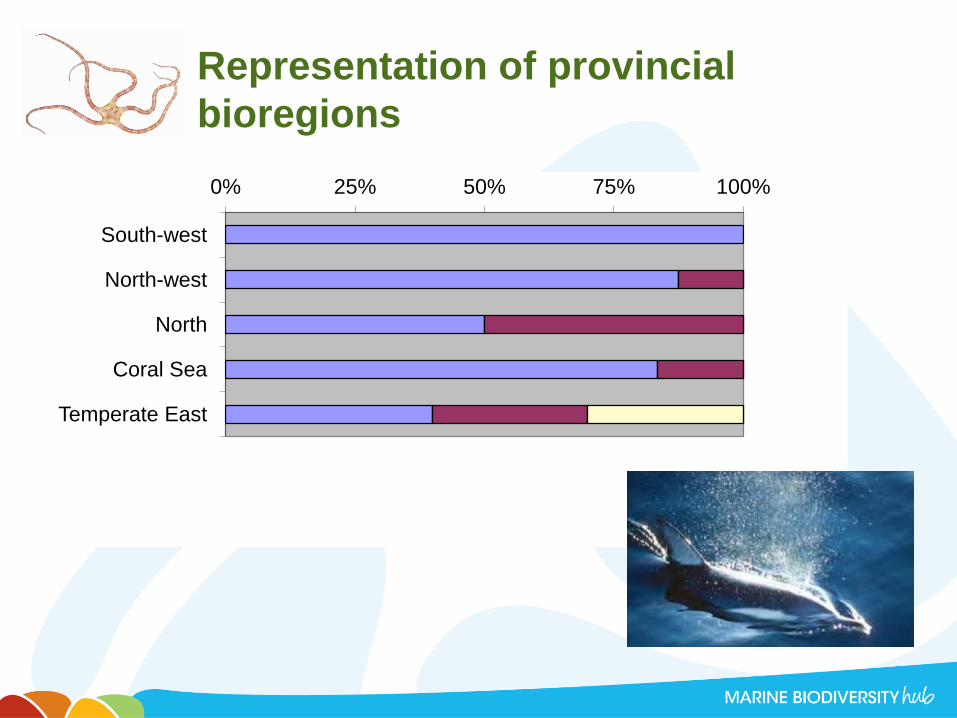
Representation of provincial
bioregions
0% 25% 50% 75% 100%
South-west
North-west
North
Coral Sea
Temperate East
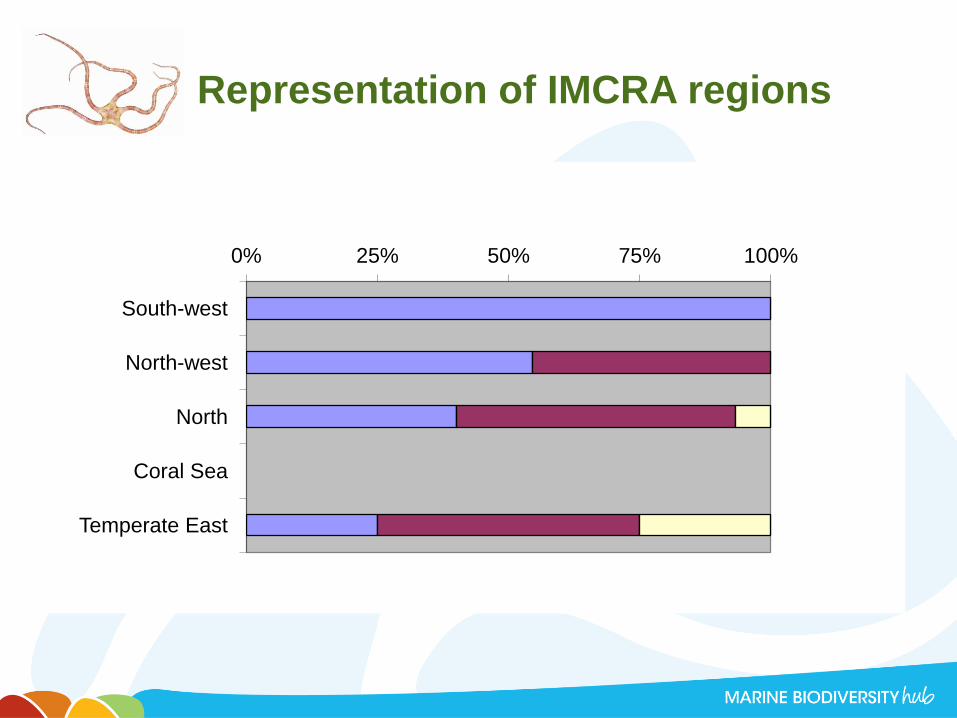
Representation of IMCRA regions
0% 25% 50% 75% 100%
South-west
North-west
North
Coral Sea
Temperate East
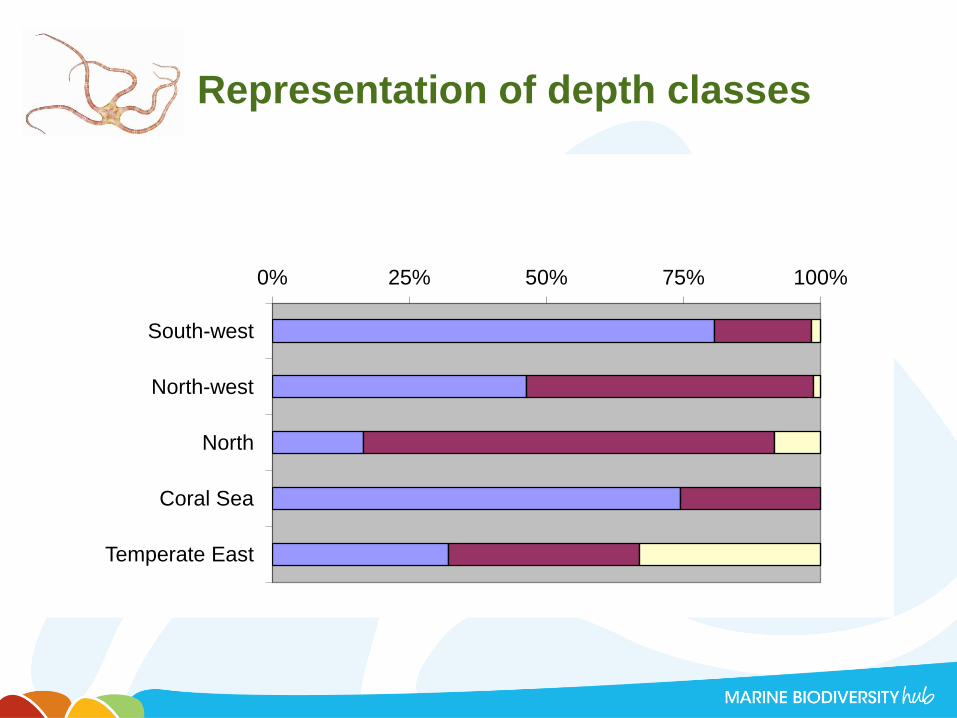
Representation of depth classes
0% 25% 50% 75% 100%
South-west
North-west
North
Coral Sea
Temperate East
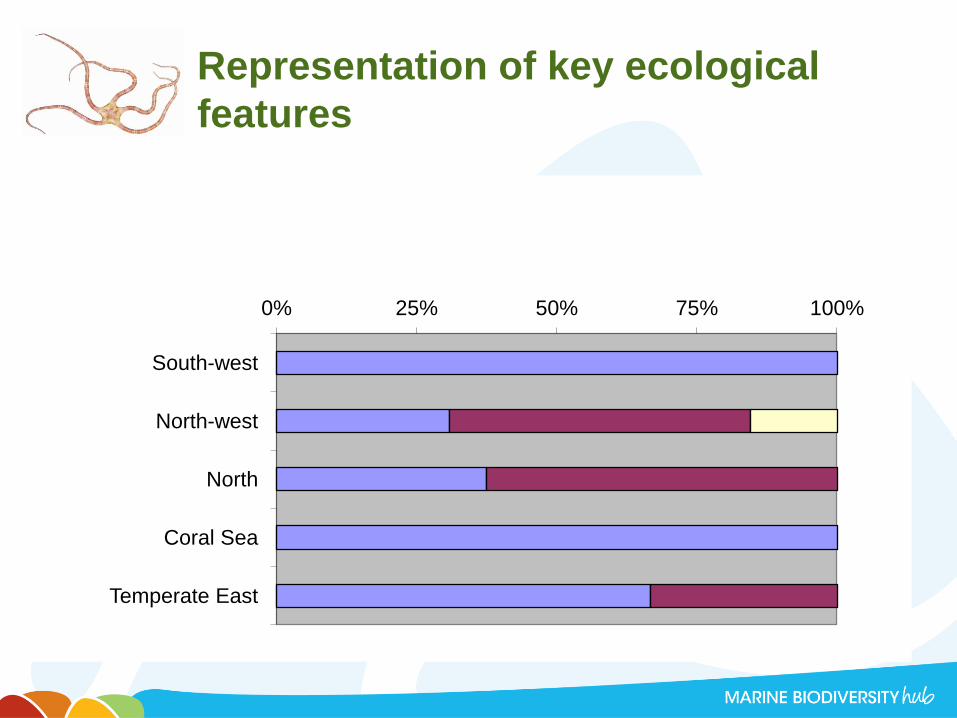
Representation of key ecological
features
0% 25% 50% 75% 100%
South-west
North-west
North
Coral Sea
Temperate East
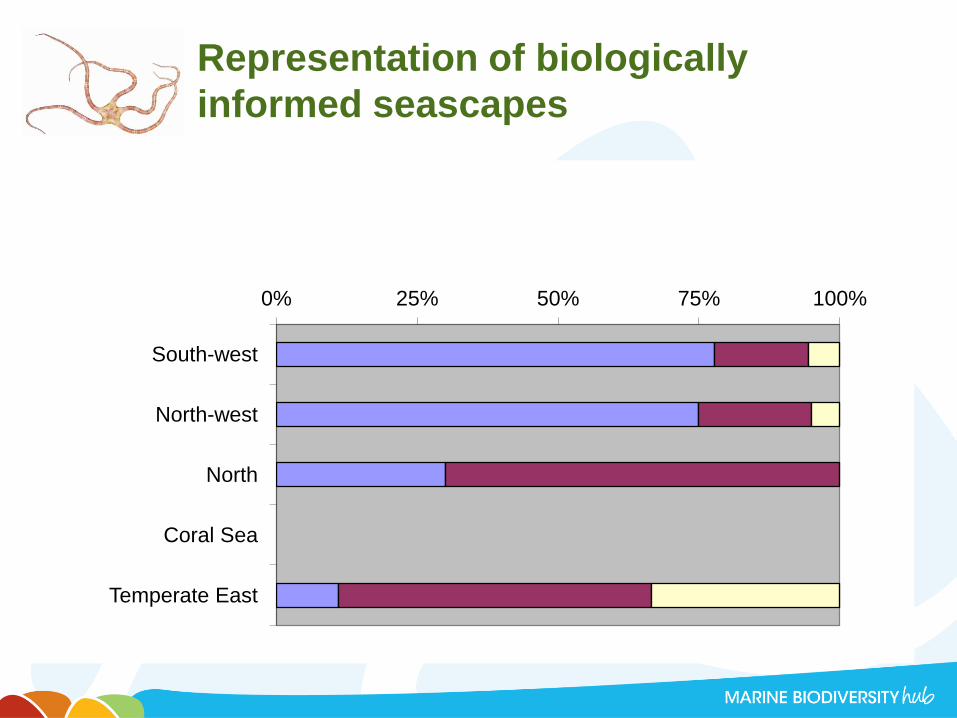
Representation of biologically
informed seascapes
0% 25% 50% 75% 100%
South-west
North-west
North
Coral Sea
Temperate East
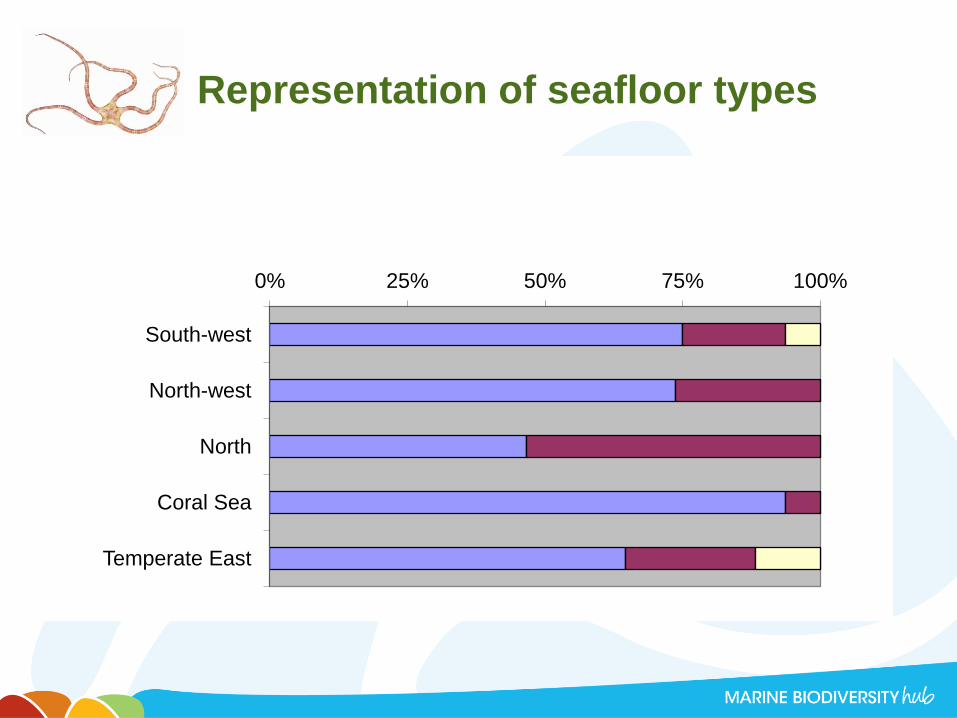
Representation of seafloor types
0% 25% 50% 75% 100%
South-west
North-west
North
Coral Sea
Temperate East
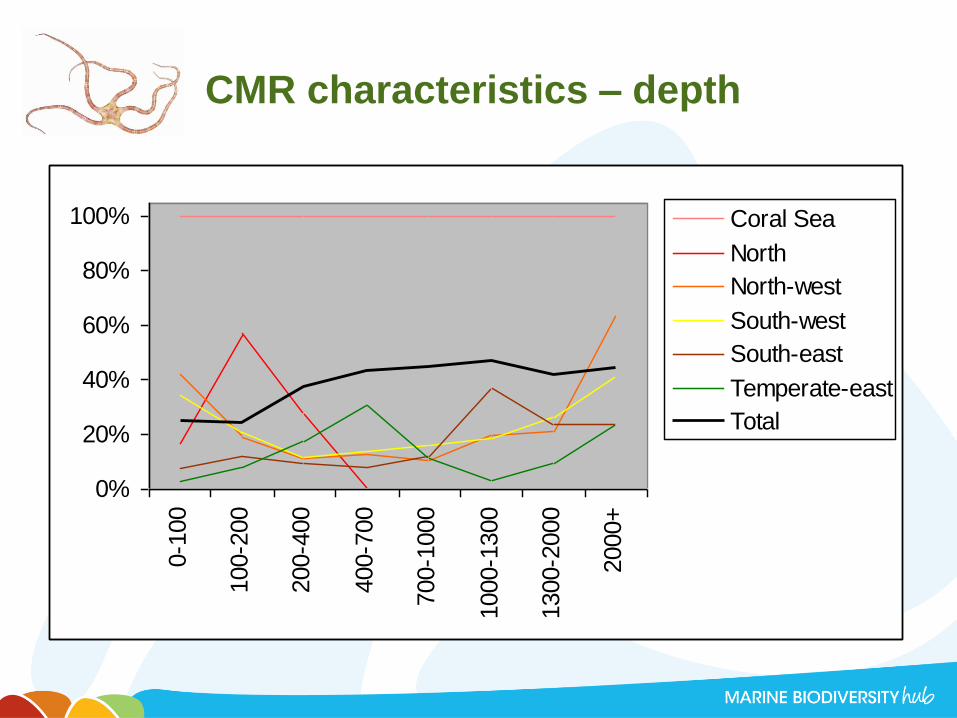
CMR characteristics – depth
0%
20%
40%
60%
80%
100%
0-1
00
100-2
00
200-4
00
400-7
00
700-1
000
1000-1
300
1300-2
000
2000+
Coral Sea
North
North-west
South-west
South-east
Temperate-east
Total
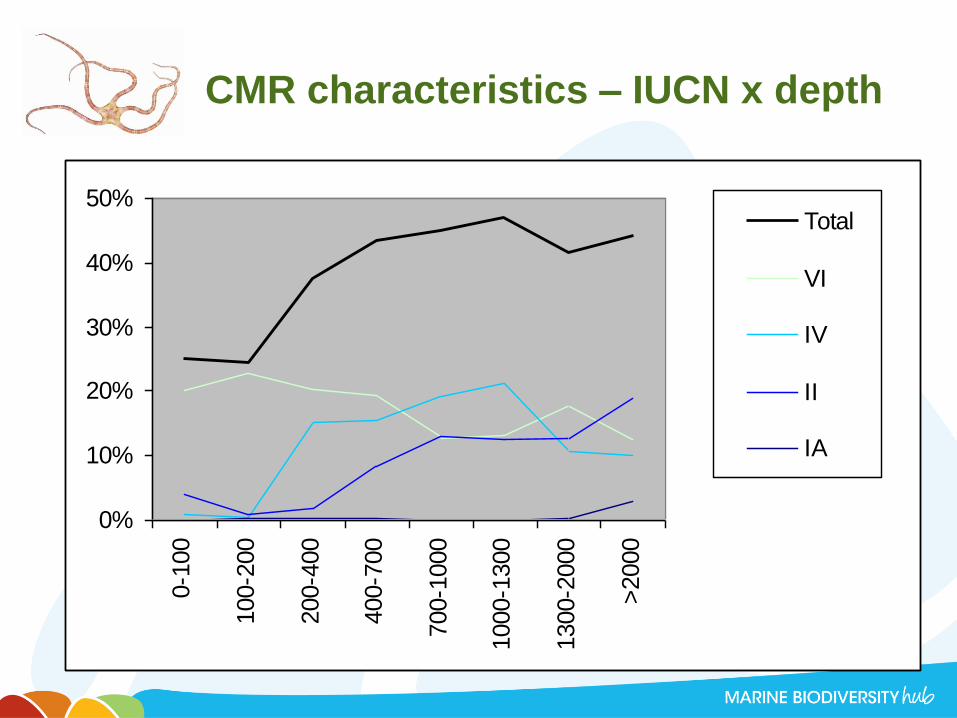
CMR characteristics – IUCN x depth
0%
10%
20%
30%
40%
50%0-1
00
100-2
00
200-4
00
400-7
00
700-1
000
1000-1
300
1300-2
000
>2000
Total
VI
IV
II
IA
What does the CMR achieve?
• A biodiversity focus on representative areas of the Australian EEZ
– Higher level of protection
– Onus of no significant damage
– Government to audit and report on progress
• Scientific reference areas
• Network is large but the proportions of continental shelf and shallow continental slope are small.
What about the
Marine Bioregional
Plans?
Photo credit: Mike Ball
Objectives – derived from EPBC Act
• Conserving biodiversity and maintaining
ecosystem health
• Ensuring the recovery and protection of
threatened species
• Improving understanding of the region’s
biodiversity and ecosystems and the pressures
they face.
Contents of MBPs
• List of conservation values
• Regional conservation priorities
• Pressures on conservation values deemed to be
of concern or potential concern (Schedule 1)
• Specific advice on matters of national
environmental significance (Schedule 2)
• Report cards
• Strategies and Actions
Draft strategies and actions
• Increase collaboration with research organisations
• Establish CMR as part of the NRSMPA
• Provide evidence-based information to support decision
making on developmental proposals under the EPBC Act
• Increase collaboration with fisheries management agencies
• Develop partnerships with relevant industries to gather
information
• Develop programs to coordinate species recovery
• Improve monitoring, evaluation and reporting on ecosystem
health
• Participate in international efforts to manage conservation
values
What could be strengthened?
• Current focus on improved understanding and collaboration.
• Need to set goals to reduce pressures or increase
conservation values.
• Mitigation and offset options should be identified where
goals are not achievable.
• Actions monitored and assessed against clear targets.
• Specific objectives, indicators, reference points, and
performance measures needed to monitor progress against
the objectives.
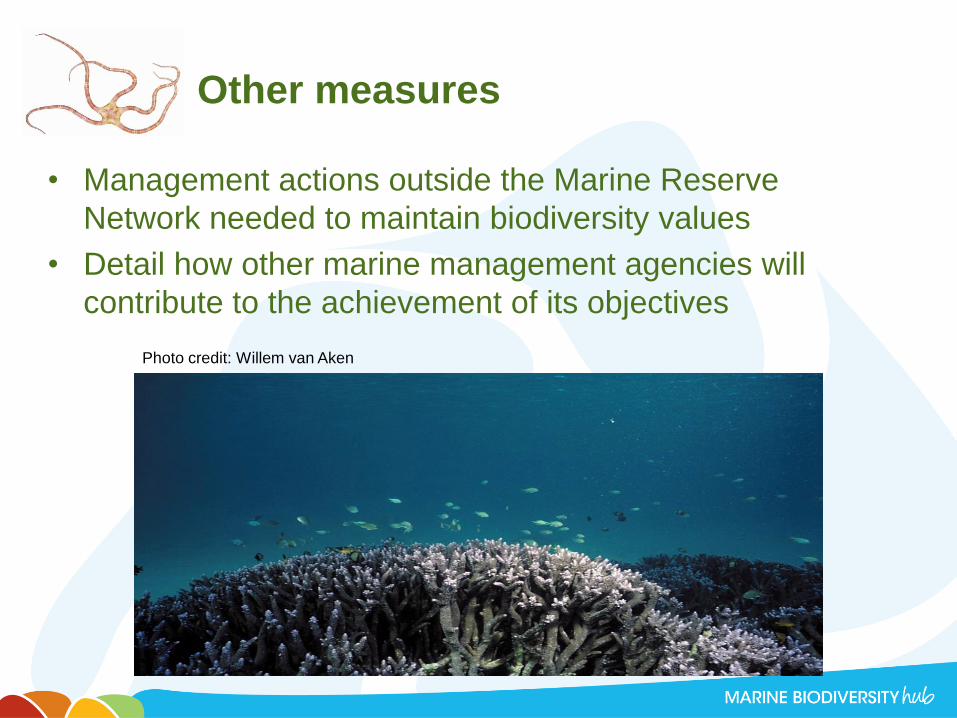
Other measures
• Management actions outside the Marine Reserve
Network needed to maintain biodiversity values
• Detail how other marine management agencies will
contribute to the achievement of its objectives
Photo credit: Willem van Aken
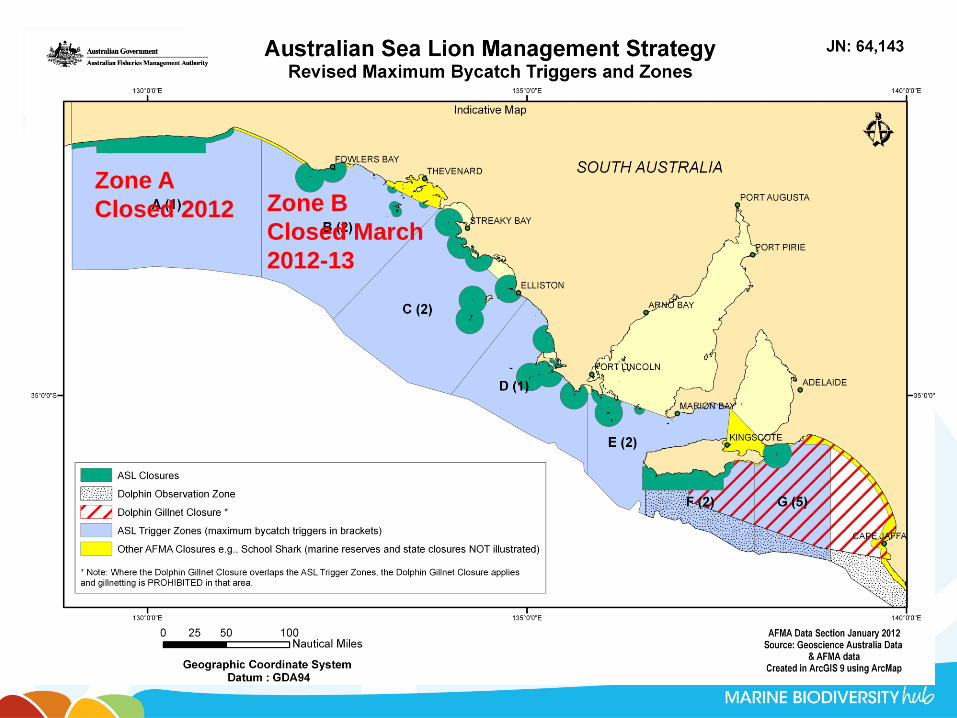
Zone A
Closed 2012 Zone B
Closed March
2012-13
The role of science and scientists
• Policy lead, science informed process
• Advocacy versus Advisory
• Strength lies in peer-reviewed publications
• Objective impartial advice
• Broad support for role in a ‘balanced outcome’
• Science critical in ongoing improvement / refinement