Review: Science Practice 1 - EDHSGreenSea.Netedhsgreensea.net/APBiology/APBpdfs/Science Practice...
17
Name: Date: Hour: AP Biology: Review Page: 1 AP Biology: Science Practice 1 Review: Science Practice 1 The student can use representations and models to communicate scientific phenomena and solve scientific problems. Visual representations and models are indispensable tools for learning and exploring scientific concepts and ideas. The student is able to create representations and models using verbal or written explanations that describe biological processes. The student also can use representations and models to illustrate biological processes and concepts; communicate information; make predictions; and describe systems to promote and document understanding. Illustrative examples of representations and models are diagrams describing the relationship between photosynthesis and cellular respiration; the structure and functional relationships of membranes; and diagrams that illustrate chromosome movement in mitosis and meiosis. Using model kits, the student can build three-dimensional representations of organic functional groups, carbohydrates, lipids, proteins and nucleic acids. The student is able to demonstrate how chemical structures, such as the Watson and Crick model for DNA, link structure to function at the molecular level and can relate key elements of a process or structure across multiple representations, such as a schematic two-dimensional diagram and a space-filling model of DNA. The student can refine and/or revise visual representations of biological processes, including energy flow through ecosystems; immunological processes; movement of molecules in and out of cells; and graphs or other visual data representations of experimental results. The student can use/apply representations and models to make predictions and address scientific questions as well as interpret and create graphs drawn from experimental data.
Transcript of Review: Science Practice 1 - EDHSGreenSea.Netedhsgreensea.net/APBiology/APBpdfs/Science Practice...

Name: Date: Hour:
AP Biology: Review
Page: 1
AP
Bio
log
y:
Sc
ien
ce
Pr
ac
tic
e 1
Review: Science Practice 1
The student can use representations and models to communicate scientific phenomena and solve scientific problems. Visual representations and models are indispensable tools for learning and exploring scientific concepts and ideas. The student is able to create representations and models using verbal or written explanations that describe biological processes. The student also can use representations and models to illustrate biological processes and concepts; communicate information; make predictions; and describe systems to promote and document understanding. Illustrative examples of representations and models are diagrams describing the relationship between photosynthesis and cellular respiration; the structure and functional relationships of membranes; and diagrams that illustrate chromosome movement in mitosis and meiosis. Using model kits, the student can build three-dimensional representations of organic functional groups, carbohydrates, lipids, proteins and nucleic acids. The student is able to demonstrate how chemical structures, such as the Watson and Crick model for DNA, link structure to function at the molecular level and can relate key elements of a process or structure across multiple representations, such as a schematic two-dimensional diagram and a space-filling model of DNA. The student can refine and/or revise visual representations of biological processes, including energy flow through ecosystems; immunological processes; movement of molecules in and out of cells; and graphs or other visual data representations of experimental results. The student can use/apply representations and models to make predictions and address scientific questions as well as interpret and create graphs drawn from experimental data.

Page 2
AP
Bio
log
y:
Sc
ien
ce
Pr
ac
tic
e 1
Create: Sample Problems 1. After an enzyme is mixed with its substrate, the amount of product formed is
determined at 10-second intervals for 1 minute. Data from this experiment are shown below.
Time (sec) 0 10 20 30 40 50 60 Product formed (mg) 0.00 0.25 0.50 0.70 0.80 0.85 0.85 Draw a graph of these data and answer the following questions.

Name: Date: Hour:
AP Biology: Review
Page: 3
AP
Bio
log
y:
Sc
ien
ce
Pr
ac
tic
e 1
2. Five different sucrose solutions were placed in dialysis tubing bags and massed. The bags were then placed in distilled water for 24-hours and massed again. The researcher used six trials for each solution and calculated the mean percent change in mass, standard deviation (SD), and standard error of the mean (SE). His data is below.
Solution Mean % Change in
Mass Standard Deviation
Standard Error of the Mean
1 4.0 1.0 0.5
2 5.0 1.0 0.4
3 9.0 2.0 0.7
4 9.0 2.0 0.8
5 10.0 4.0 1.5
Create a bar graph of the means with error bars representing the standard error. Be sure to follow proper graphing procedures.

Page 4
AP
Bio
log
y:
Sc
ien
ce
Pr
ac
tic
e 1
Use: Sample Problems 3. Water potential in potato cells was determined in the following manner. The initial
masses of six groups of potato cores were measured. The potato cores were placed in sucrose solutions of various molarities. The masses of the cores were measured again after 24 hours. Percent changes in mass were calculated. The results are graphed below.
From your graph, find the apparent molar concentration (osmolarity) of the potato core cells. 4. Refer to the pedigree diagrammed at the right. What inheritance pattern can best explain the allele(s) that are represented in the pedigree at the right? Based on your decision about inheritance pattern, what can you conclude about the grandmother at the top of the pedigree for this trait?

Name: Date: Hour:
AP Biology: Review
Page: 5
AP
Bio
log
y:
Sc
ien
ce
Pr
ac
tic
e 1
5. According to fossil record and recent published observations, two species of leaf-eating beetles (species A and B) have existed on an isolated island in the Pacific Ocean for over 100,000 years. In 1964 a third species of leaf-eating beetle (species C) was accidentally introduced on the island. The population size of each species has been regularly monitored as shown in the graph below.
(a) Propose an explanation for the pattern of population density observed in species C.
(b) Describe the effect that the introduction of beetle species C has had on the population density of species A and species B. Propose an explanation for the patterns of population density observed in species A and in species B.
6. A scientist conducts an experiment with
penicillin-sensitive bacteria in which he adds a plasmid containing a gene that confers penicillin resistance. Following a protocol that elicits normal growth and uptake of the plasmid DNA, the scientist then adds bacteria to four new plates as shown at the right.
What type of protocol did the scientist likely use to encourage the uptake of the plasmid DNA?
Describe the growth patterns the scientist should expect to see on the plates.

Page 6
AP
Bio
log
y:
Sc
ien
ce
Pr
ac
tic
e 1
Questions 7 - 9 refer to the information below A scientist studying the ecology of cities found that in developed landscapes, plant roots were not colonized by mycorrhizal fungi to the same degree that they were in a nearby nature preserve. In addition, she found that rates of photosynthesis and root respiration were much higher in plants in the preserve than for plants in city landscapes. She conducted a controlled greenhouse experiment to see what effects mycorrhizal colonization had on plant photosynthesis and respiration. Her experimental design involved growing 10 plants in soil rich in mycorrhizal fungal elements and 10 in the same soil that had been sterilized to remove the fungi. She made periodic measurements of plant photosynthesis and root respiration and calculated the mean rates for each experimental treatment. Her results are shown below.
7. What conclusion can be drawn from the data?
(A) Presence of mycorrhizae increased both photosynthesis and respiration rates significantly.
(B) Presence of mycorrhizae increased photosynthesis but not respiration. (C) Presence of mycorrhizae increased respiration but not photosynthesis. (D) Presence of mycorrhizae had no effect on photosynthesis or respiration.
8. Why might mycorrhizae influence photosynthesis and/or respiration?
(A) Mycorrhizae are important plant pathogens. (B) Mycorrhizae are important plant parasites. (C) Mycorrhizae are important plant predators. (D) Mycorrhizae are important plant symbionts.

Name: Date: Hour:
AP Biology: Review
Page: 7
AP
Bio
log
y:
Sc
ien
ce
Pr
ac
tic
e 1
9. Assuming that further experimentation showed conclusively that plants in cities had reduced rates of photosynthesis and respiration due to lack of colonization by mycorrhizae, what important biogeochemical cycle of an ecosystem would be most affected?
(A) The nitrogen cycle (B) The water cycle (C) The hydrological cycle (D) The carbon cycle
Questions 10 - 13 refer to the graph at the right. The top curve and the bottom curve represent alternate pathways for the same reaction. One pathway is enzyme catalyzed. 10. Represents the energy state of the
reactants of the enzyme-catalyzed pathway
11. Represents the net energy change of the reaction
12. Represents the activation energy of the non-catalyzed reaction
13. Represents the energy state of the products of the enzyme-catalyzed pathway
Questions 14 - 15 refer to the plant cell figure shown at the right. Match each term with the correct diagram label. 14. Chloroplast
15. Central vacuole
Page 8
AP
Bio
log
y:
Sc
ien
ce
Pr
ac
tic
e 1
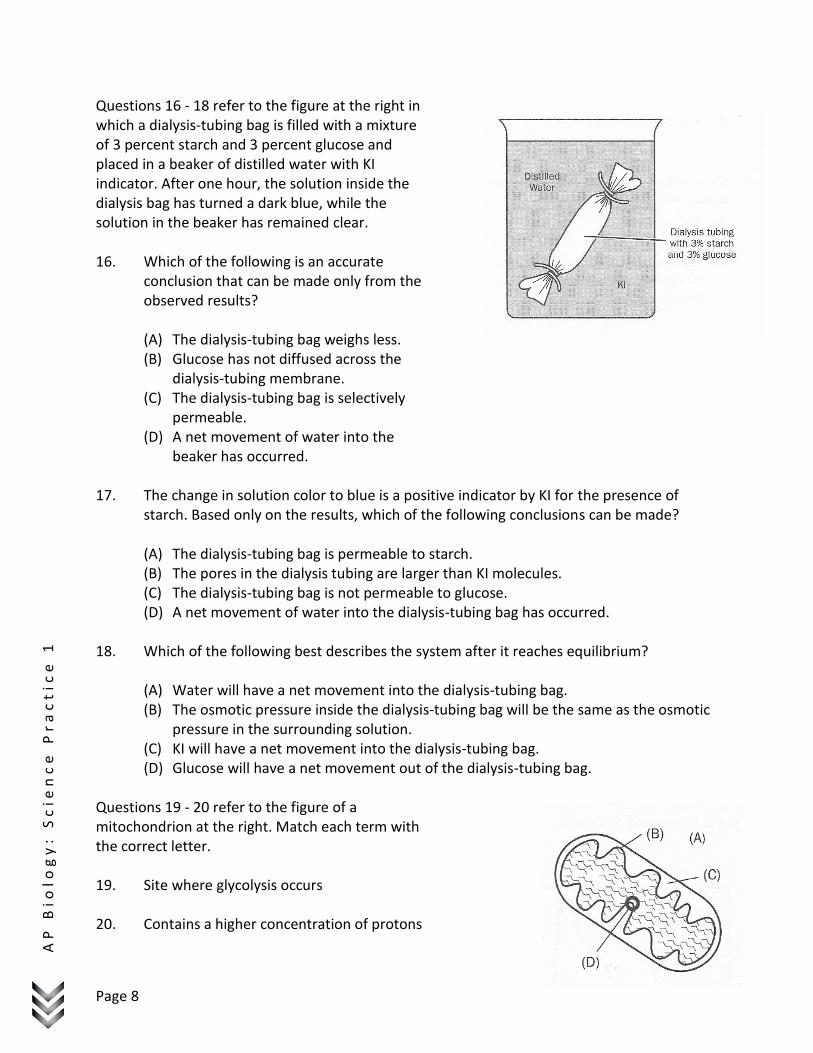
Questions 16 - 18 refer to the figure at the right in which a dialysis-tubing bag is filled with a mixture of 3 percent starch and 3 percent glucose and placed in a beaker of distilled water with KI indicator. After one hour, the solution inside the dialysis bag has turned a dark blue, while the solution in the beaker has remained clear. 16. Which of the following is an accurate
conclusion that can be made only from the observed results?
(A) The dialysis-tubing bag weighs less. (B) Glucose has not diffused across the
dialysis-tubing membrane. (C) The dialysis-tubing bag is selectively
permeable. (D) A net movement of water into the
beaker has occurred. 17. The change in solution color to blue is a positive indicator by KI for the presence of
starch. Based only on the results, which of the following conclusions can be made?
(A) The dialysis-tubing bag is permeable to starch. (B) The pores in the dialysis tubing are larger than KI molecules. (C) The dialysis-tubing bag is not permeable to glucose. (D) A net movement of water into the dialysis-tubing bag has occurred.
18. Which of the following best describes the system after it reaches equilibrium?
(A) Water will have a net movement into the dialysis-tubing bag. (B) The osmotic pressure inside the dialysis-tubing bag will be the same as the osmotic
pressure in the surrounding solution. (C) KI will have a net movement into the dialysis-tubing bag. (D) Glucose will have a net movement out of the dialysis-tubing bag.
Questions 19 - 20 refer to the figure of a mitochondrion at the right. Match each term with the correct letter. 19. Site where glycolysis occurs
20. Contains a higher concentration of protons

Name: Date: Hour:
AP Biology: Review
Page: 9
AP
Bio
log
y:
Sc
ien
ce
Pr
ac
tic
e 1
21. The diagram at the right shows the results of a gel electrophoresis of several fragments of DNA obtained from a restriction enzyme digestion. What can be concluded from the diagram?
(A) The DNA in wells 1, 2, 3, and 4 are likely from
the same organisms. (B) The DNA in wells 1 and 2 are likely from the
same organism. (C) The DNA in wells 1 and 3 are likely from the
same organism. (D) The DNA in wells 1 and 4 are likely from the
same organism. Questions 22 - 24. Use the diagram of the food web at the right to identify the placement of each of the following trophic levels. Each letter corresponds to a species in the food web. 22. Primary producer
23. Omnivore
24. Decomposer
25. Based on the table above, which site has the greatest species diversity?
(A) Bluewater Swamp (B) Papago Buttes (C) Beaver's Bend (D) Sherwood Forest

Page 10
AP
Bio
log
y:
Sc
ien
ce
Pr
ac
tic
e 1
26. The phylogenic analysis shown at the right suggests that
(A) animals are descended from fungi. (B) fungi are more similar to animals than
to plants. (C) protists are a monophyletic group. (D) the first organisms were eukaryotes.
Questions 27 - 30 The diagram at the right shows energy transformations within a cell. Each form of energy is represented by the symbols E I - E IV. Two cellular organelles are represented by the letters A and B. Answer the following questions about the various processes depicted in the diagram and about the cell in which they are occurring. 27. What form of energy is represented by E II?
(A) Radiant energy in the form of photons (B) Chemical energy being stored in the
bonds of glucose (C) Chemical energy in the form of ATP (D) Chemical energy released by glycolysis
28. If the transformation depicted in organelle B requires oxygen, what form of energy is
represented by E IV?
(A) Radiant energy in the form of photons (B) Chemical energy being stored as glycogen (C) Chemical energy in the form of ATP (D) Chemical energy released by glycolysis
29. What cellular organelles are represented as A and B, respectively?
(A) The nucleus and the ribosome (B) The mitochondrion and the chloroplast (C) The mitochondrion and the ribosome (D) The chloroplast and the mitochondrion

Name: Date: Hour:
AP Biology: Review
Page: 11
AP
Bio
log
y:
Sc
ien
ce
Pr
ac
tic
e 1
30. What kind of organism could the cell shown belong to?
(A) A photosynthetic bacteria (B) A photosynthetic protist (C) A heterotroph (D) A fungi
Questions 31 - 33 refer to the diagram at the below. 31. Which most accurately describes age-structures A and B?
I. A is the population with a higher fertility rate II. B is the population with the higher fertility rate III. A represents a structure commonly observed for countries in North America and Western Europe IV. B represents a structure commonly observed for countries in North America and Western Europe.
(A) II and III (B) I and IV (C) II and IV (D) I and III

Page 12
AP
Bio
log
y:
Sc
ien
ce
Pr
ac
tic
e 1
32. Which social issue would you most expect to see in a country with an age-structure like A?
(A) High unemployment for working-age people (B) Delayed retirement (C) Increased child mortality rate (D) Decreased work-related injury rate
33. Would a population structured like A or B be more likely to contribute to the global
problems of overpopulation and overconsumption of resources?
(A) A would contribute to overpopulation and B to overconsumption. (B) A would contribute to overconsumption and B to overpopulation. (C) A and B would contribute equally to overpopulation. (D) A and B would contribute equally to overconsumption.
Questions 34 - 36 refer to the graph at the right. 34. The region indicated by letter "A" in this
figure depicts
(A) the variability of sizes in the population.
(B) the mean size of the population. (C) the phenotypes that were successful in
the given environmental conditions. (D) the phenotypes that did poorly in
recent environmental conditions. 35. What type of selection does this figure depict?
(A) Disruptive (B) Directional (C) Stabilizing (D) Forceful

Name: Date: Hour:
AP Biology: Review
Page: 13
AP
Bio
log
y:
Sc
ien
ce
Pr
ac
tic
e 1
36. Starting with the current population distribution, what would you expect to happen if, over the next several generations, the smallest and largest individuals had lower reproductive rates that moderately sized individuals? What would the new population curve look like?
(A) The curve would resemble the "original population" curve in shape and location. (B) The curve would be shifted to the left of the current one. (C) The curve would have two peaks, one at the smaller sizes and another at the larger
sizes. (D) The curve would be more narrow and higher than the current one; the mean size
would remain the same.

Page 14
AP
Bio
log
y:
Sc
ien
ce
Pr
ac
tic
e 1
Predict: Sample Problems 37. A group of students designed an experiment to measure transpiration rates in a
particular species of herbaceous plant. Plants were divided into four groups and were exposed to the following conditions.
Group I --- Room conditions (light, low humidity, 20oC, and little air movement) Group II --- Room conditions with increased humidity Group III --- Room conditions with increased air movement (fan) Group IV --- Room conditions with additional light
The cumulative water loss due to transpiration of water from each plant was measured at 10-minute intervals for 30 minutes. Water loss was expressed as milliliters of water per square centimeter of leaf surface area. The data for all plants in Group I (room conditions) were averaged. The average cumulative water loss is graphed below. Using the same set of axes, draw and label three additional lines representing the results that you would predict for Groups II, III, and IV. Be sure to label the lines.

Name: Date: Hour:
AP Biology: Review
Page: 15
AP
Bio
log
y:
Sc
ien
ce
Pr
ac
tic
e 1
38. An experiment was conducted to measure the reaction rate of the human salivary enzyme α-amylase. The mL of a concentrated starch solution and 1.0 mL of α-amylase solution were placed in a test tube. The test tube was inverted several times to mix the solution and then incubated at 25 oC. The amount of product (maltose) present was measured every 10 minutes for an hour. The results are graphed below.
(a) Explain why a change in the reaction rate was observed after 30 minutes. (b) Draw and label another line on the graph to predict the results if the
concentration of α-amylase was doubled. Explain your predicted results. (c) Draw and label another line on the graph to predict the results if the
temperature were decreased to 10 oC. Explain your predicted results.
Page 16
AP
Bio
log
y:
Sc
ien
ce
Pr
ac
tic
e 1
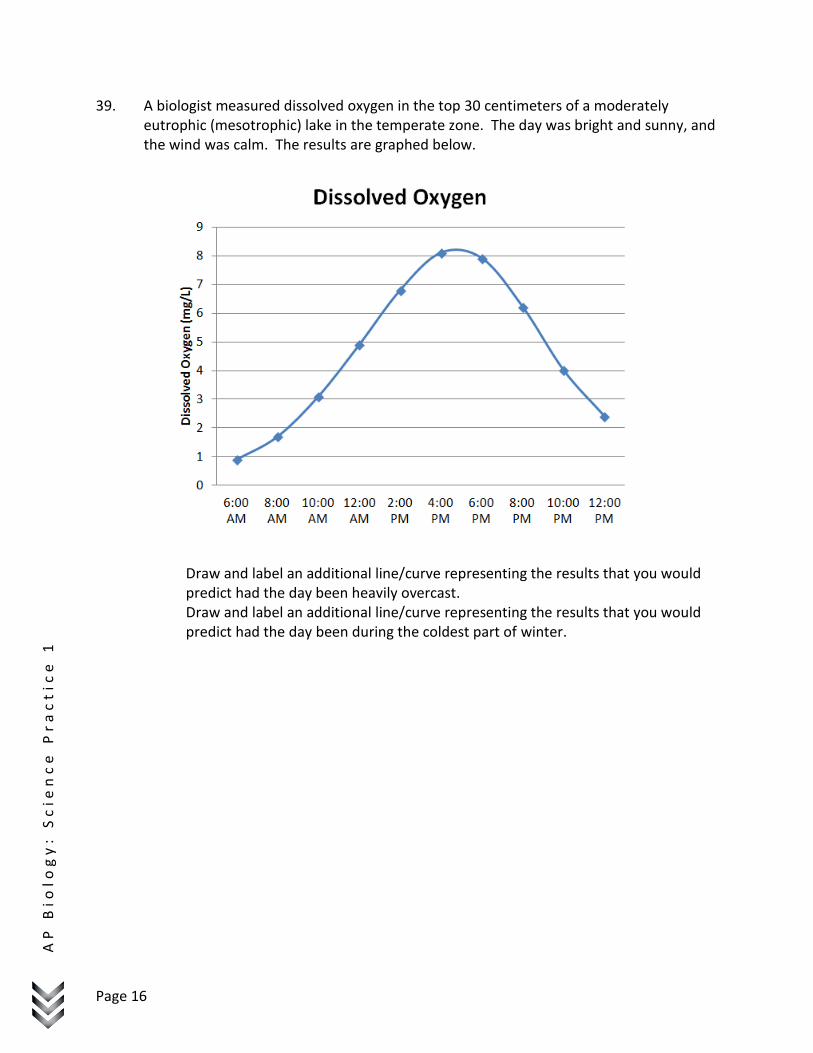
39. A biologist measured dissolved oxygen in the top 30 centimeters of a moderately eutrophic (mesotrophic) lake in the temperate zone. The day was bright and sunny, and the wind was calm. The results are graphed below.
Draw and label an additional line/curve representing the results that you would predict had the day been heavily overcast. Draw and label an additional line/curve representing the results that you would predict had the day been during the coldest part of winter.

Name: Date: Hour:
AP Biology: Review
Page: 17
AP
Bio
log
y:
Sc
ien
ce
Pr
ac
tic
e 1
40. The following experiment was designed to test whether different concentration gradients affect the rate of diffusion. In this experiment, four solutions (0% NaCl, 1% NaCl, 5% NaCl, and 10% NaCl) were tested under identical conditions. Fifteen milliliters (mL) of 0% NaCl were put into a bag formed of dialysis tubing that is permeable to Na+, Cl-, and water. The same was done for each NaCl solution. Each bag was submerged in a separate beaker containing 300 mL of distilled water. The concentration of NaCl in mg/L in the water outside each bag was measured at 40-second intervals. The results from the 5% bag are graphed below.
Using the same set of axes, draw and label three additional lines representing the results that you would predict for the 0% NaCl, 1% NaCl, and 10% NaCl solutions. Explain your predictions.