Review: Safety of Tenofovir PrEP in Pregnant and ... in Pregnancy Review...Review: Safety of...
53
Review: Safety of Tenofovir PrEP in Pregnant and Breastfeeding HIV-Uninfected Women and Their Infants Lynne M. Mofenson, M.D. for the World Health Organization REVISED 08/21/2016
Transcript of Review: Safety of Tenofovir PrEP in Pregnant and ... in Pregnancy Review...Review: Safety of...
Review:Safety of Tenofovir PrEP in Pregnant and Breastfeeding
HIV-Uninfected Womenand Their Infants
Lynne M. Mofenson, M.D.for the World Health Organization
REVISED 08/21/2016
Several Systematic Reviews Have Evaluated TDF Safety in Pregnant Women with Chronic Hepatitis B (HBV)
Brown RS et al. Hepatology 2016;63:319-33: search to 11/2014 in women with chronic HBV receiving antiviral therapy; 26 studies, only 3 included TDF (141 pt, 1 RCT, 2 observational).– “TDF showed improvement in HBV DNA suppression at
delivery; no significant differences in PP hemorrhage, CS or elevated creatinine kinase.”
WHO Systematic Review for HBV 2015 Guidelines (Appendix): search to 2/2014 on most effective antiviral therapy during 3rd
trimester to reduce HBV MTCT; 35 studies, only 1 included TDF (observational, also included in Brown):– “Conclusions should be drawn with extreme caution on the
efficacy of TDF as only 1 observational study was identified and the quality of the evidence was low.”
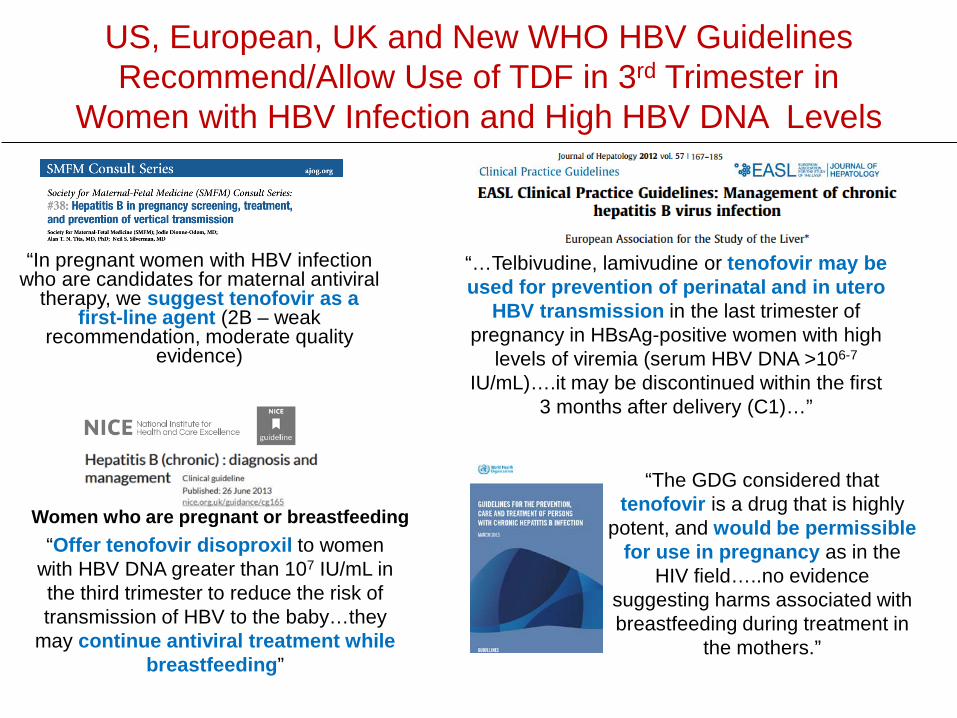
US, European, UK and New WHO HBV Guidelines Recommend/Allow Use of TDF in 3rd Trimester in
Women with HBV Infection and High HBV DNA Levels
“In pregnant women with HBV infection who are candidates for maternal antiviral
therapy, we suggest tenofovir as a first-line agent (2B – weak
recommendation, moderate quality evidence)
“…Telbivudine, lamivudine or tenofovir may be used for prevention of perinatal and in utero
HBV transmission in the last trimester of pregnancy in HBsAg-positive women with high
levels of viremia (serum HBV DNA >106-7
IU/mL)….it may be discontinued within the first 3 months after delivery (C1)…”
“Offer tenofovir disoproxil to women with HBV DNA greater than 107 IU/mL in the third trimester to reduce the risk of transmission of HBV to the baby…they
may continue antiviral treatment while breastfeeding”
Women who are pregnant or breastfeeding
“The GDG considered that tenofovir is a drug that is highly
potent, and would be permissible for use in pregnancy as in the
HIV field…..no evidence suggesting harms associated with breastfeeding during treatment in
the mothers.”
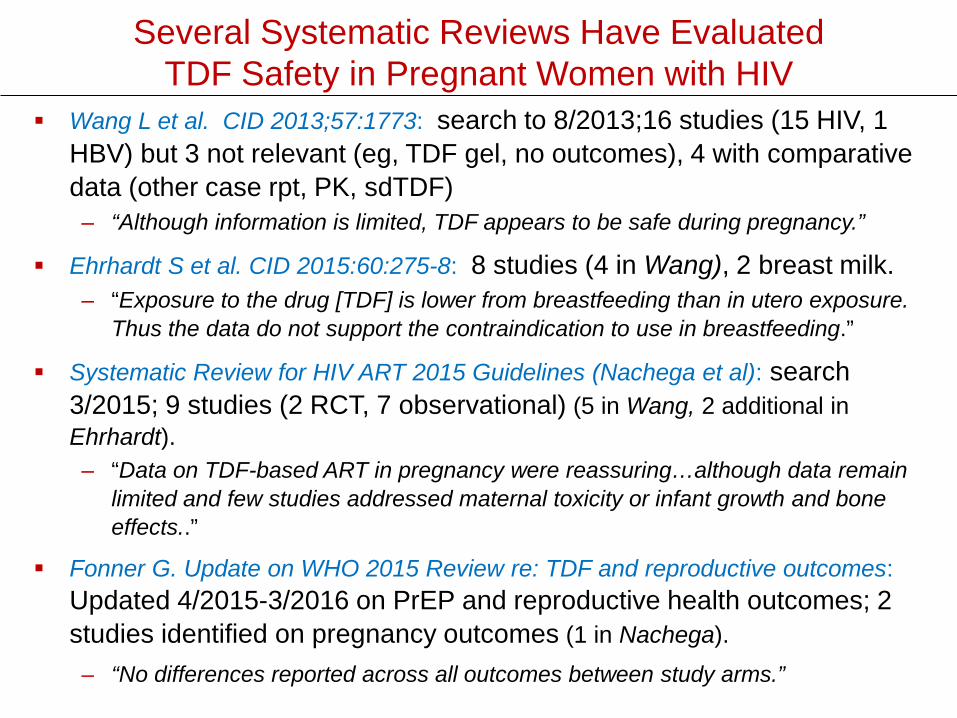
Several Systematic Reviews Have Evaluated TDF Safety in Pregnant Women with HIV
Wang L et al. CID 2013;57:1773: search to 8/2013;16 studies (15 HIV, 1 HBV) but 3 not relevant (eg, TDF gel, no outcomes), 4 with comparative data (other case rpt, PK, sdTDF) – “Although information is limited, TDF appears to be safe during pregnancy.”
Ehrhardt S et al. CID 2015:60:275-8: 8 studies (4 in Wang), 2 breast milk.– “Exposure to the drug [TDF] is lower from breastfeeding than in utero exposure.
Thus the data do not support the contraindication to use in breastfeeding.”
Systematic Review for HIV ART 2015 Guidelines (Nachega et al): search 3/2015; 9 studies (2 RCT, 7 observational) (5 in Wang, 2 additional in Ehrhardt).– “Data on TDF-based ART in pregnancy were reassuring…although data remain
limited and few studies addressed maternal toxicity or infant growth and bone effects..”
Fonner G. Update on WHO 2015 Review re: TDF and reproductive outcomes: Updated 4/2015-3/2016 on PrEP and reproductive health outcomes; 2 studies identified on pregnancy outcomes (1 in Nachega). – “No differences reported across all outcomes between study arms.”
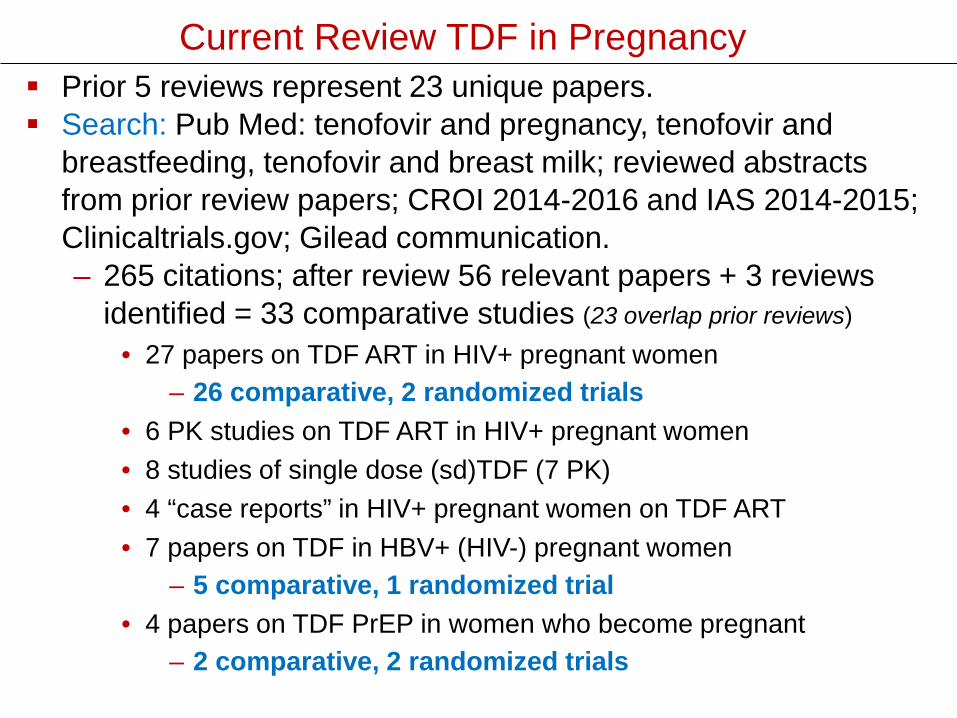
Current Review TDF in Pregnancy Prior 5 reviews represent 23 unique papers. Search: Pub Med: tenofovir and pregnancy, tenofovir and
breastfeeding, tenofovir and breast milk; reviewed abstracts from prior review papers; CROI 2014-2016 and IAS 2014-2015; Clinicaltrials.gov; Gilead communication.– 265 citations; after review 56 relevant papers + 3 reviews
identified = 33 comparative studies (23 overlap prior reviews)• 27 papers on TDF ART in HIV+ pregnant women
– 26 comparative, 2 randomized trials• 6 PK studies on TDF ART in HIV+ pregnant women• 8 studies of single dose (sd)TDF (7 PK)• 4 “case reports” in HIV+ pregnant women on TDF ART• 7 papers on TDF in HBV+ (HIV-) pregnant women
– 5 comparative, 1 randomized trial• 4 papers on TDF PrEP in women who become pregnant
– 2 comparative, 2 randomized trials
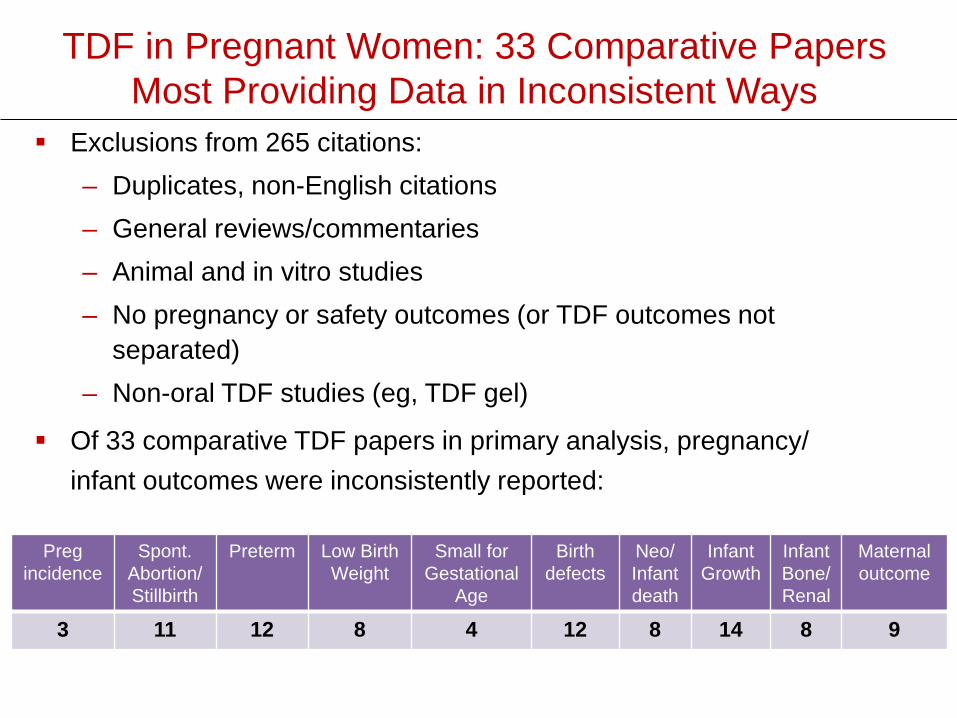
TDF in Pregnant Women: 33 Comparative PapersMost Providing Data in Inconsistent Ways
Exclusions from 265 citations:– Duplicates, non-English citations– General reviews/commentaries– Animal and in vitro studies– No pregnancy or safety outcomes (or TDF outcomes not
separated) – Non-oral TDF studies (eg, TDF gel)
Pregincidence
Spont.Abortion/Stillbirth
Preterm Low Birth Weight
Small for Gestational
Age
Birth defects
Neo/ Infant death
InfantGrowth
Infant Bone/Renal
Maternal outcome
3 11 12 8 4 12 8 14 8 9
Of 33 comparative TDF papers in primary analysis, pregnancy/ infant outcomes were inconsistently reported:
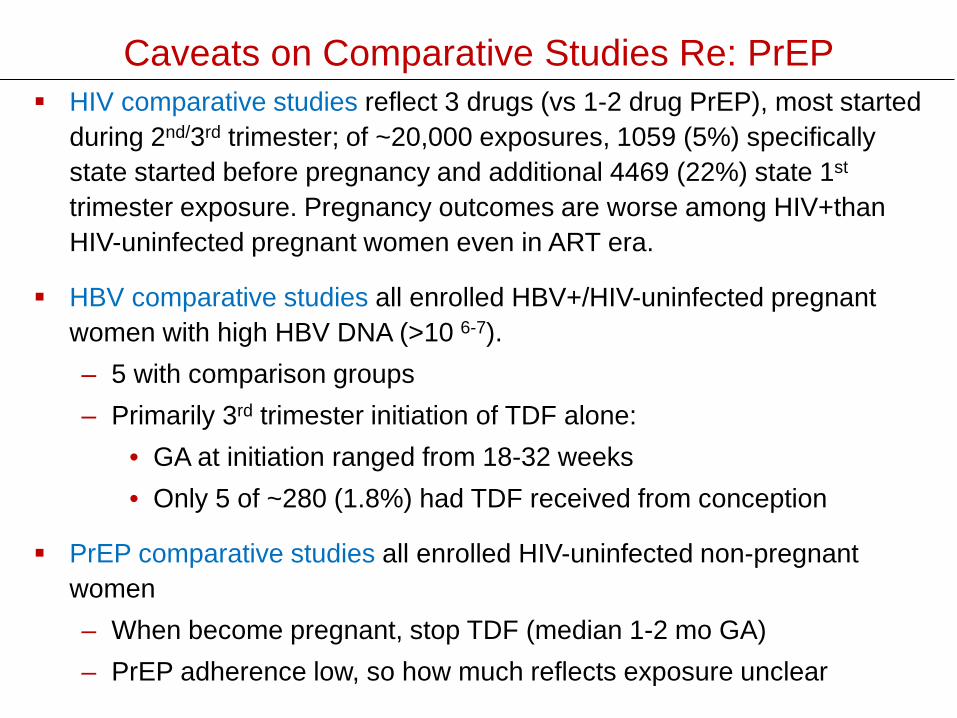
Caveats on Comparative Studies Re: PrEP HIV comparative studies reflect 3 drugs (vs 1-2 drug PrEP), most started
during 2nd/3rd trimester; of ~20,000 exposures, 1059 (5%) specifically state started before pregnancy and additional 4469 (22%) state 1st
trimester exposure. Pregnancy outcomes are worse among HIV+thanHIV-uninfected pregnant women even in ART era.
HBV comparative studies all enrolled HBV+/HIV-uninfected pregnant women with high HBV DNA (>10 6-7).– 5 with comparison groups– Primarily 3rd trimester initiation of TDF alone:
• GA at initiation ranged from 18-32 weeks• Only 5 of ~280 (1.8%) had TDF received from conception
PrEP comparative studies all enrolled HIV-uninfected non-pregnant women– When become pregnant, stop TDF (median 1-2 mo GA)– PrEP adherence low, so how much reflects exposure unclear

What Do Pharmacokinetic StudiesDemonstrate?
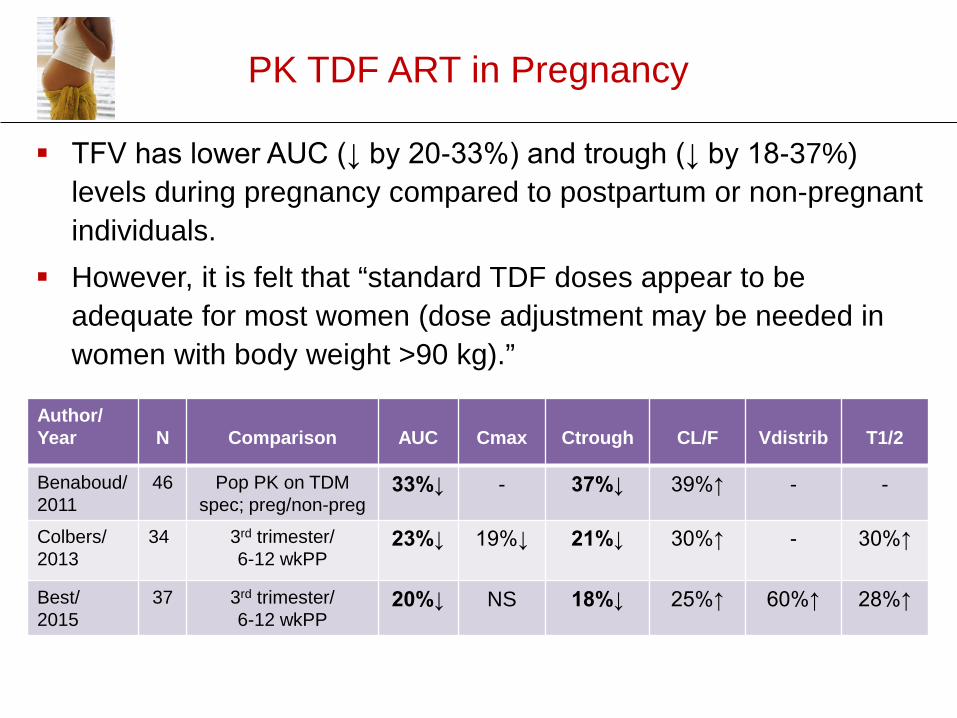
PK TDF ART in Pregnancy
Author/Year N Comparison AUC Cmax Ctrough CL/F Vdistrib T1/2
Benaboud/ 2011
46 Pop PK on TDMspec; preg/non-preg
33%↓ - 37%↓ 39%↑ - -
Colbers/ 2013
34 3rd trimester/6-12 wkPP
23%↓ 19%↓ 21%↓ 30%↑ - 30%↑
Best/2015
37 3rd trimester/6-12 wkPP
20%↓ NS 18%↓ 25%↑ 60%↑ 28%↑
TFV has lower AUC (↓ by 20-33%) and trough (↓ by 18-37%) levels during pregnancy compared to postpartum or non-pregnant individuals.
However, it is felt that “standard TDF doses appear to be adequate for most women (dose adjustment may be needed in women with body weight >90 kg).”
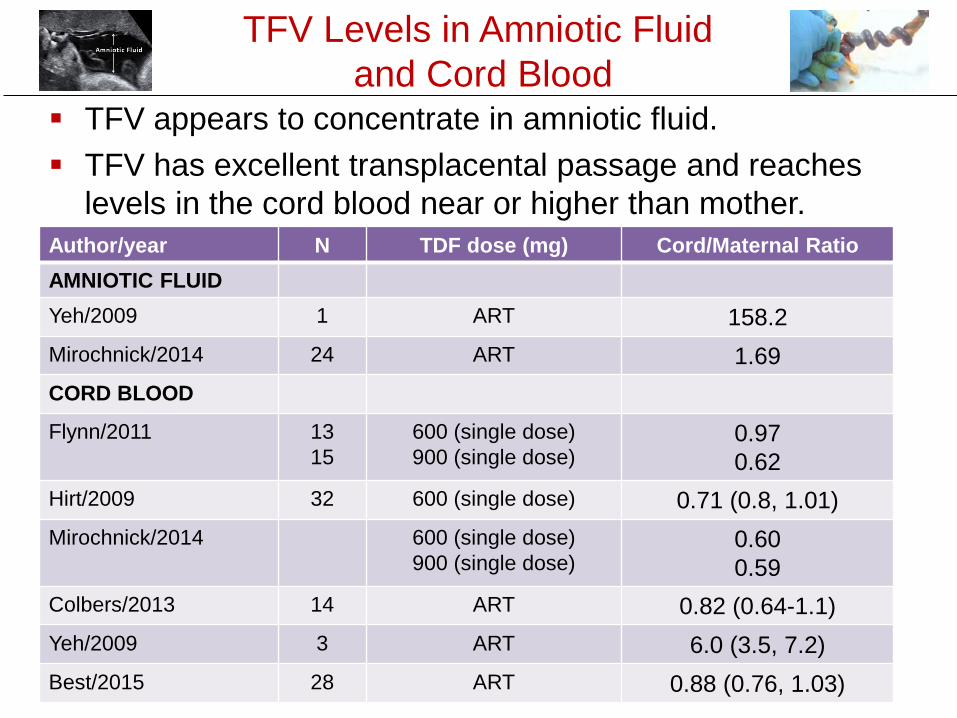
TFV Levels in Amniotic Fluidand Cord Blood
Author/year N TDF dose (mg) Cord/Maternal RatioAMNIOTIC FLUIDYeh/2009 1 ART 158.2Mirochnick/2014 24 ART 1.69CORD BLOOD
Flynn/2011 1315
600 (single dose)900 (single dose)
0.970.62
Hirt/2009 32 600 (single dose) 0.71 (0.8, 1.01)Mirochnick/2014 600 (single dose)
900 (single dose)0.600.59
Colbers/2013 14 ART 0.82 (0.64-1.1)Yeh/2009 3 ART 6.0 (3.5, 7.2)Best/2015 28 ART 0.88 (0.76, 1.03)
TFV appears to concentrate in amniotic fluid. TFV has excellent transplacental passage and reaches
levels in the cord blood near or higher than mother.
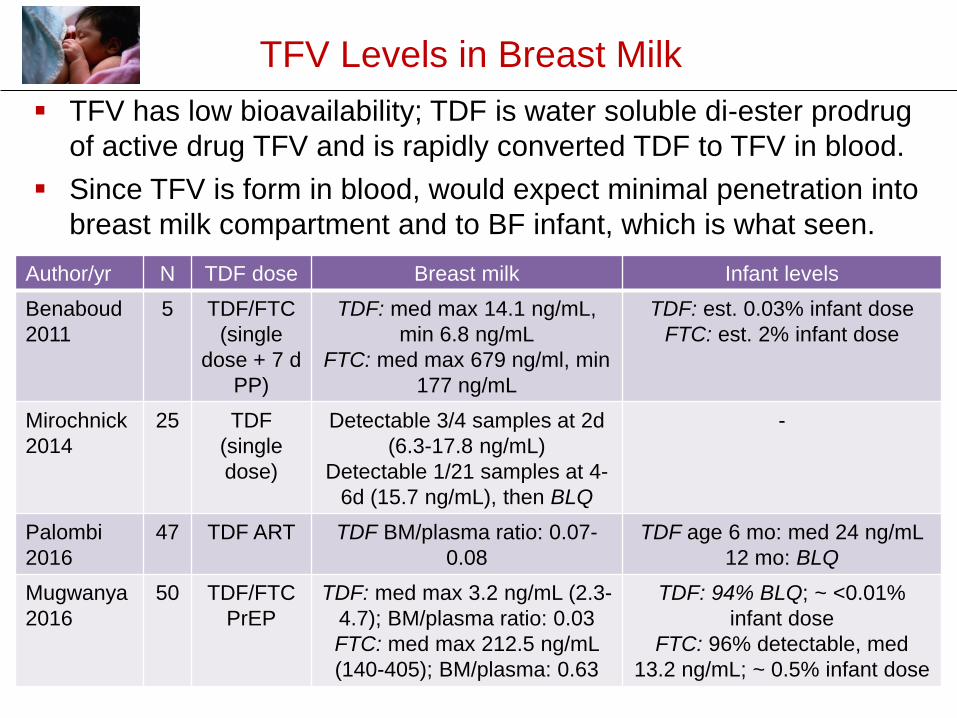
TFV Levels in Breast Milk
Author/yr N TDF dose Breast milk Infant levelsBenaboud2011
5 TDF/FTC(single
dose + 7 d PP)
TDF: med max 14.1 ng/mL, min 6.8 ng/mL
FTC: med max 679 ng/ml, min 177 ng/mL
TDF: est. 0.03% infant doseFTC: est. 2% infant dose
Mirochnick2014
25 TDF (single dose)
Detectable 3/4 samples at 2d (6.3-17.8 ng/mL)
Detectable 1/21 samples at 4-6d (15.7 ng/mL), then BLQ
-
Palombi2016
47 TDF ART TDF BM/plasma ratio: 0.07-0.08
TDF age 6 mo: med 24 ng/mL12 mo: BLQ
Mugwanya2016
50 TDF/FTC PrEP
TDF: med max 3.2 ng/mL (2.3-4.7); BM/plasma ratio: 0.03 FTC: med max 212.5 ng/mL (140-405); BM/plasma: 0.63
TDF: 94% BLQ; ~ <0.01% infant dose
FTC: 96% detectable, med 13.2 ng/mL; ~ 0.5% infant dose
TFV has low bioavailability; TDF is water soluble di-ester prodrug of active drug TFV and is rapidly converted TDF to TFV in blood.
Since TFV is form in blood, would expect minimal penetration into breast milk compartment and to BF infant, which is what seen.
Comparative Studies of Pregnancy Outcome
and Infant Growth
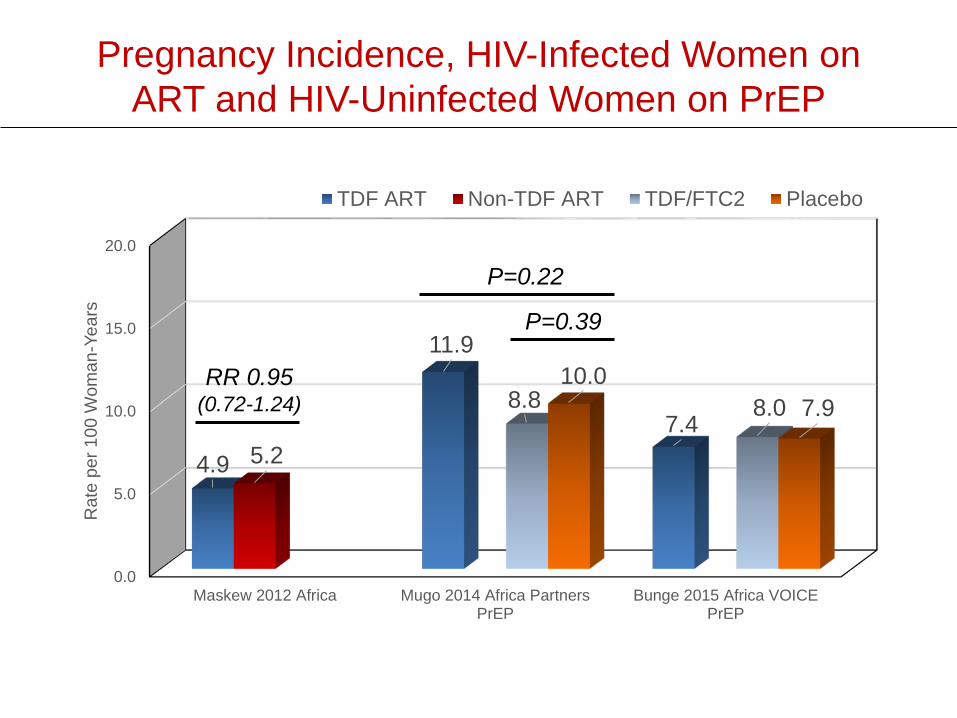
Pregnancy Incidence, HIV-Infected Women on ART and HIV-Uninfected Women on PrEP
0.0
5.0
10.0
15.0
20.0
Maskew 2012 Africa Mugo 2014 Africa PartnersPrEP
Bunge 2015 Africa VOICEPrEP
4.9
11.9
7.45.2
8.8 8.010.0
7.9
Rat
e pe
r 100
Wom
an-Y
ears
TDF ART Non-TDF ART TDF/FTC2 Placebo
P=0.22
P=0.39
RR 0.95(0.72-1.24)
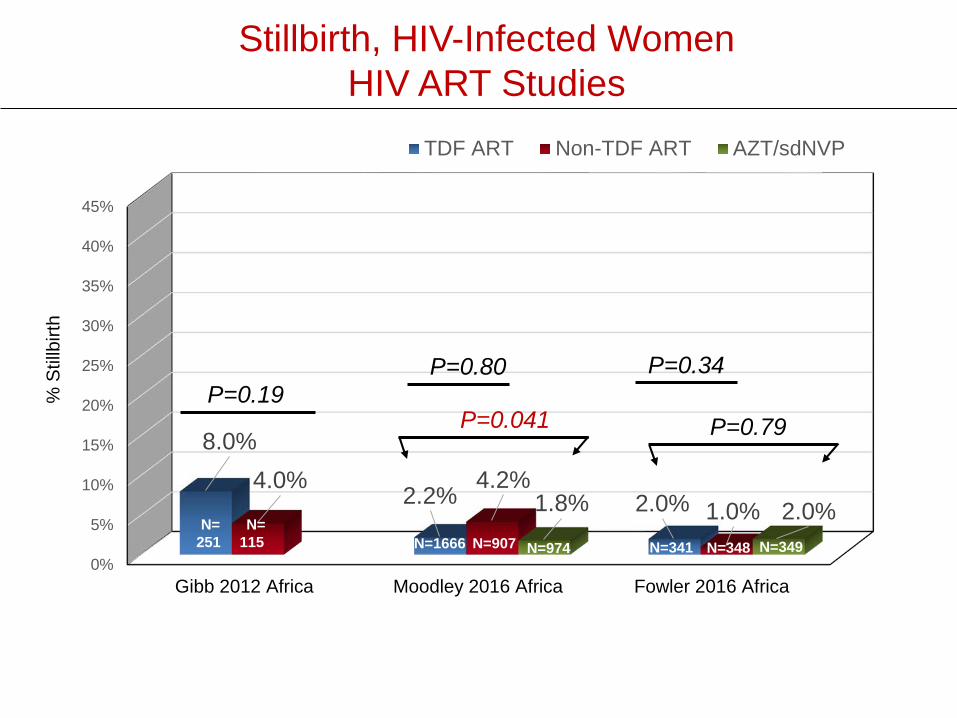
Stillbirth, HIV-Infected WomenHIV ART Studies
0%
5%
10%
15%
20%
25%
30%
35%
40%
45%
Gibb 2012 Africa Moodley 2016 Africa Fowler 2016 Africa
8.0%
2.2% 2.0%4.0% 4.2%
1.0%1.8% 2.0%
TDF ART Non-TDF ART AZT/sdNVP
P=0.19P=0.80
P=0.041
% S
tillb
irth
N=251
N=115 N=1666 N=907 N=974 N=341 N=348 N=349
P=0.34
P=0.79
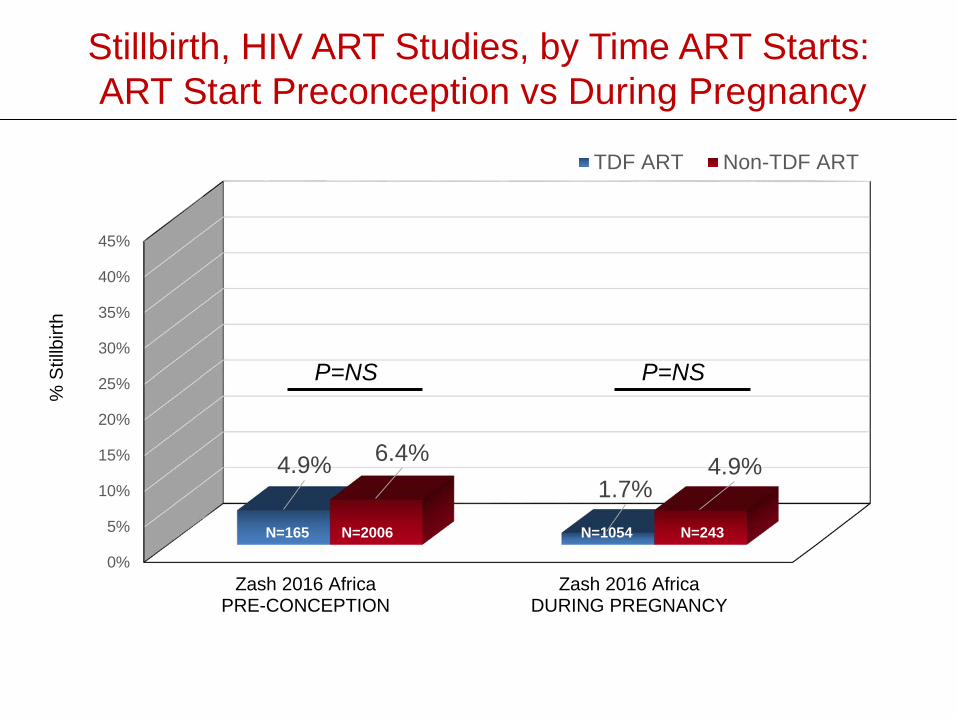
Stillbirth, HIV ART Studies, by Time ART Starts:ART Start Preconception vs During Pregnancy
0%
5%
10%
15%
20%
25%
30%
35%
40%
45%
Zash 2016 AfricaPRE-CONCEPTION
Zash 2016 AfricaDURING PREGNANCY
4.9%1.7%
6.4% 4.9%
TDF ART Non-TDF ART
P=NS P=NS
% S
tillb
irth
N=165 N=2006 N=1054 N=243
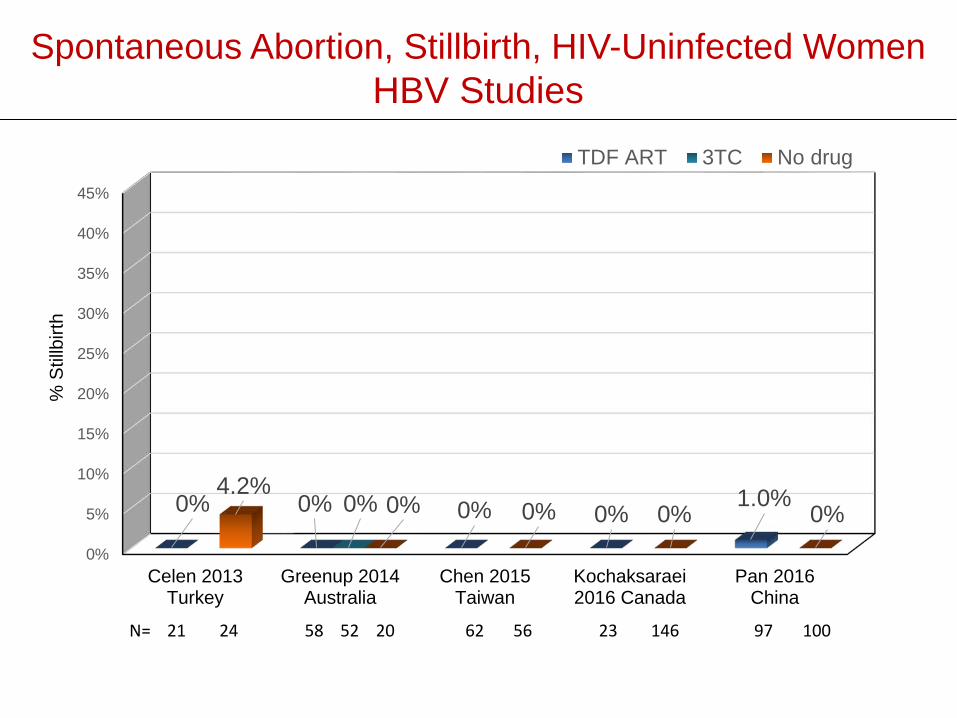
Spontaneous Abortion, Stillbirth, HIV-Uninfected Women HBV Studies
0%
5%
10%
15%
20%
25%
30%
35%
40%
45%
Celen 2013Turkey
Greenup 2014Australia
Chen 2015Taiwan
Kochaksaraei2016 Canada
Pan 2016China
0% 0% 0% 0% 1.0%0%4.2%
0% 0% 0% 0%
TDF ART 3TC No drug
% S
tillb
irth
N= 21 24 58 52 20 62 56 23 146 97 100
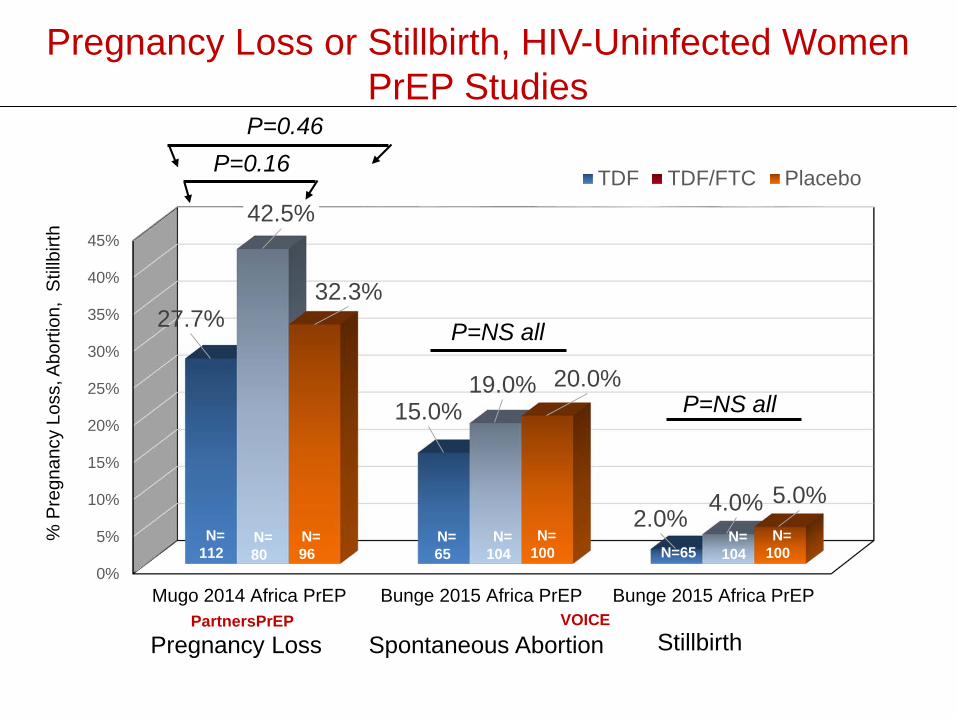
Pregnancy Loss or Stillbirth, HIV-Uninfected Women PrEP Studies
0%
5%
10%
15%
20%
25%
30%
35%
40%
45%
Mugo 2014 Africa PrEP Bunge 2015 Africa PrEP Bunge 2015 Africa PrEP
27.7%
15.0%
2.0%
42.5%
19.0%
4.0%
32.3%
20.0%
5.0%
TDF TDF/FTC PlaceboP=0.16P=0.46
Pregnancy Loss StillbirthSpontaneous Abortion
% P
regn
ancy
Los
s, A
borti
on,
Stillb
irth
N=112
N=80
N=96
N=65
N=104
N=100 N=65
N=104
N=100
PartnersPrEP VOICE
P=NS all
P=NS all
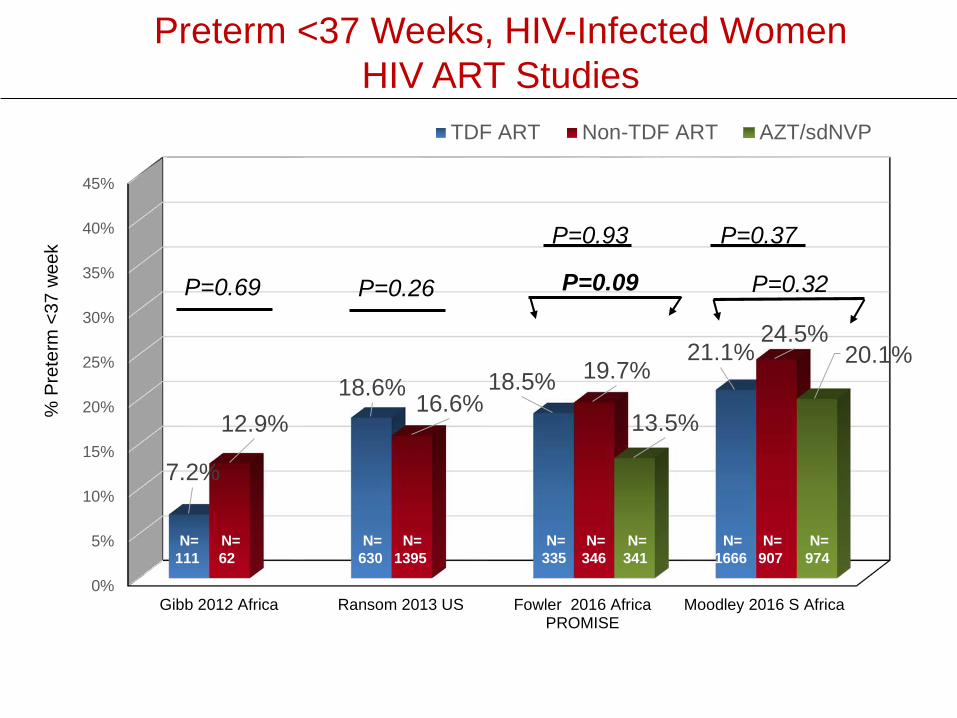
Preterm <37 Weeks, HIV-Infected WomenHIV ART Studies
0%
5%
10%
15%
20%
25%
30%
35%
40%
45%
Gibb 2012 Africa Ransom 2013 US Fowler 2016 AfricaPROMISE
Moodley 2016 S Africa
7.2%
18.6% 18.5%21.1%
12.9%16.6%
19.7%24.5%
13.5%
20.1%
% P
rete
rm <
37 w
eek
TDF ART Non-TDF ART AZT/sdNVP
P=0.69 P=0.26
P=0.93 P=0.37
P=0.32P=0.09
N=111
N=62
N=630
N=1395
N=335
N=346
N=974
N=341
N=1666
N=907
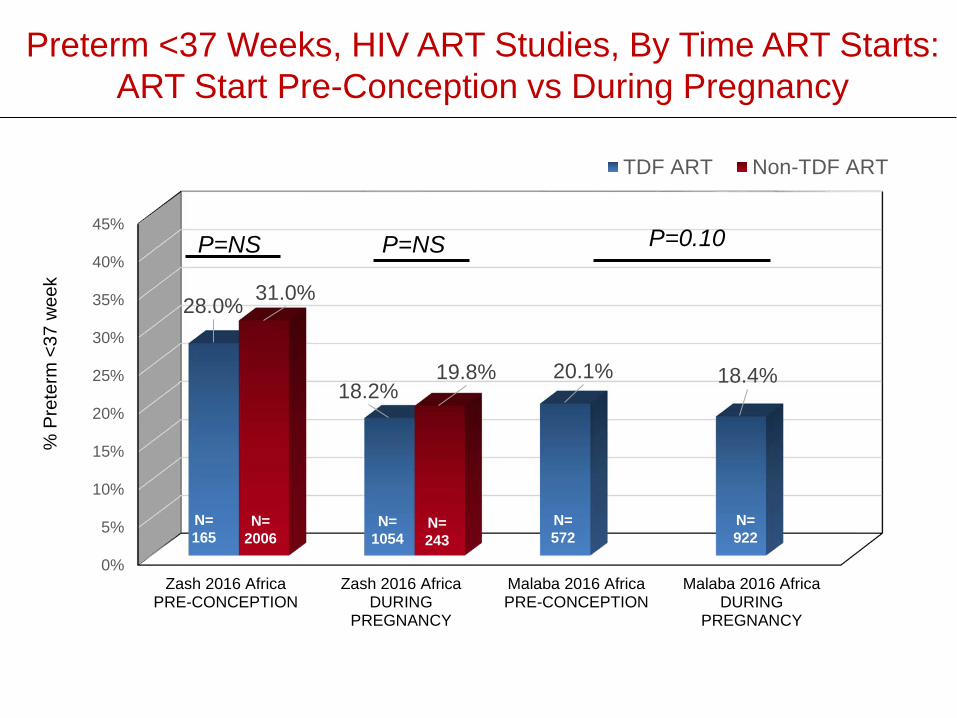
Preterm <37 Weeks, HIV ART Studies, By Time ART Starts: ART Start Pre-Conception vs During Pregnancy
0%
5%
10%
15%
20%
25%
30%
35%
40%
45%
Zash 2016 AfricaPRE-CONCEPTION
Zash 2016 AfricaDURING
PREGNANCY
Malaba 2016 AfricaPRE-CONCEPTION
Malaba 2016 AfricaDURING
PREGNANCY
28.0%
18.2%20.1% 18.4%
31.0%
19.8%
% P
rete
rm <
37 w
eek
TDF ART Non-TDF ART
P=NS P=NS P=0.10
N=922
N=572
N=243
N=1054
N=165
N=2006
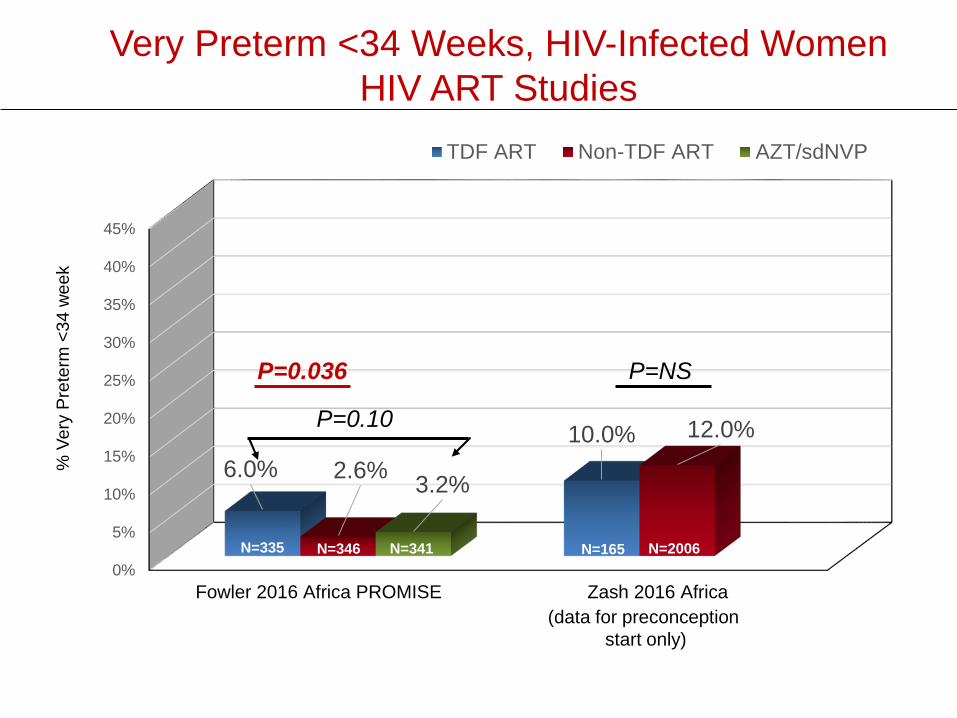
Very Preterm <34 Weeks, HIV-Infected WomenHIV ART Studies
0%
5%
10%
15%
20%
25%
30%
35%
40%
45%
Fowler 2016 Africa PROMISE Zash 2016 Africa
6.0%10.0%
2.6%
12.0%
3.2%
% V
ery
Pret
erm
<34
wee
k
TDF ART Non-TDF ART AZT/sdNVP
P=0.10
P=0.036 P=NS
N=165 N=2006N=335 N=346 N=341
(data for preconception start only)
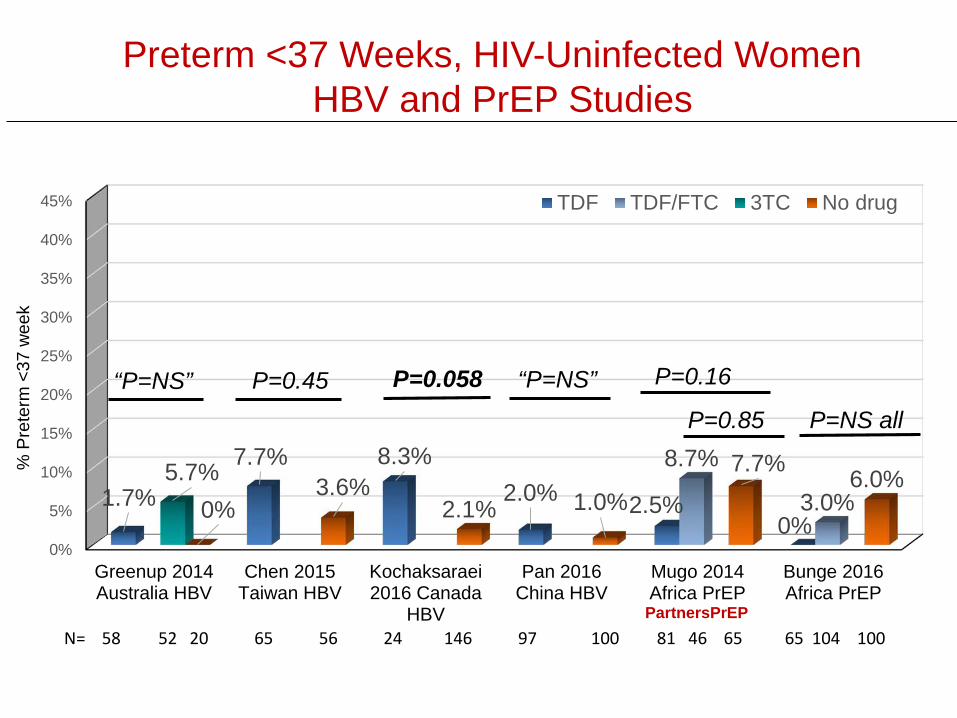
Preterm <37 Weeks, HIV-Uninfected WomenHBV and PrEP Studies
0%
5%
10%
15%
20%
25%
30%
35%
40%
45%
Greenup 2014Australia HBV
Chen 2015Taiwan HBV
Kochaksaraei2016 Canada
HBV
Pan 2016China HBV
Mugo 2014Africa PrEP
Bunge 2016Africa PrEP
1.7%
7.7% 8.3%2.0% 2.5%
0%
8.7%
3.0%5.7%
0%3.6%
2.1% 1.0%7.7% 6.0%
% P
rete
rm <
37 w
eek
TDF TDF/FTC 3TC No drug
PartnersPrEPN= 58 52 20 65 56 24 146 97 100 81 46 65 65 104 100
“P=NS” P=0.45 P=0.058 “P=NS” P=0.16
P=0.85 P=NS all
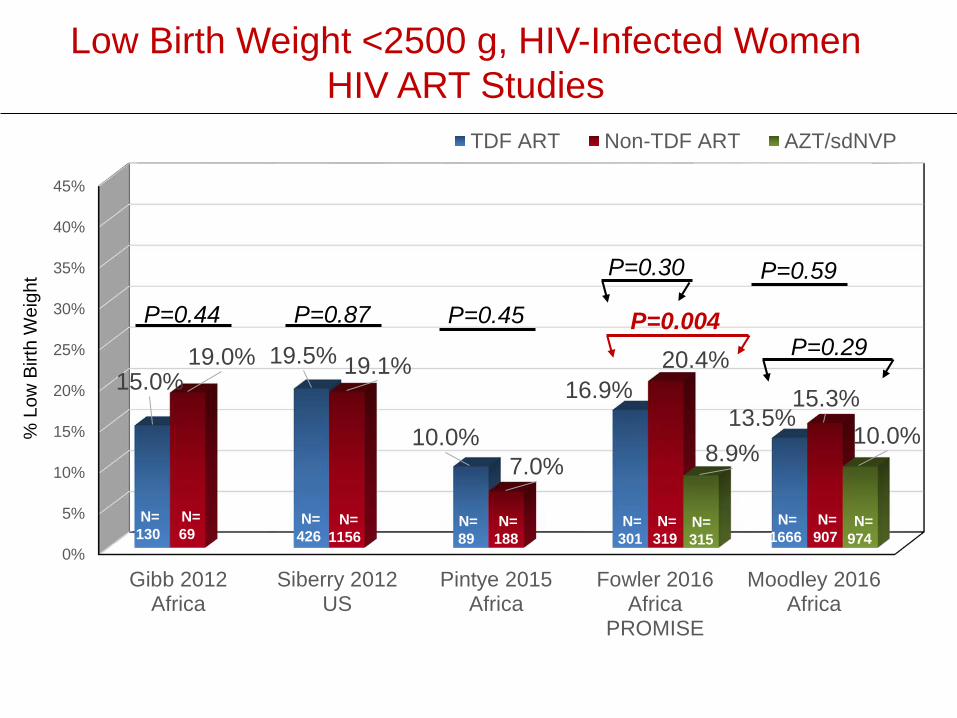
Low Birth Weight <2500 g, HIV-Infected WomenHIV ART Studies
0%
5%
10%
15%
20%
25%
30%
35%
40%
45%
Gibb 2012Africa
Siberry 2012US
Pintye 2015Africa
Fowler 2016Africa
PROMISE
Moodley 2016Africa
15.0%19.5%
10.0%
16.9%13.5%
19.0% 19.1%
7.0%
20.4%15.3%
8.9%10.0%
TDF ART Non-TDF ART AZT/sdNVP
P=0.44 P=0.87 P=0.45
P=0.59
P=0.004P=0.29
% L
ow B
irth
Wei
ght
N=130
N=69
N=426
N=1156
N=89
N=974
N=188
N=301
N=319
N= 315
N=907
N=1666
P=0.30
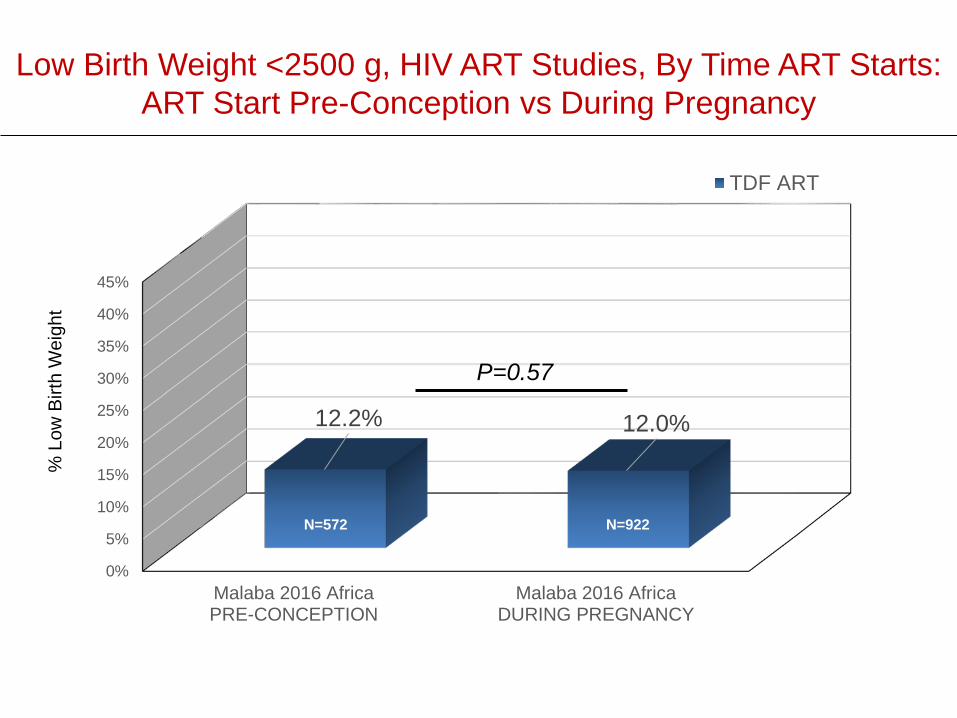
Low Birth Weight <2500 g, HIV ART Studies, By Time ART Starts:ART Start Pre-Conception vs During Pregnancy
0%
5%
10%
15%
20%
25%
30%
35%
40%
45%
Malaba 2016 AfricaPRE-CONCEPTION
Malaba 2016 AfricaDURING PREGNANCY
12.2% 12.0%
TDF ART
P=0.57
% L
ow B
irth
Wei
ght
N=572 N=922
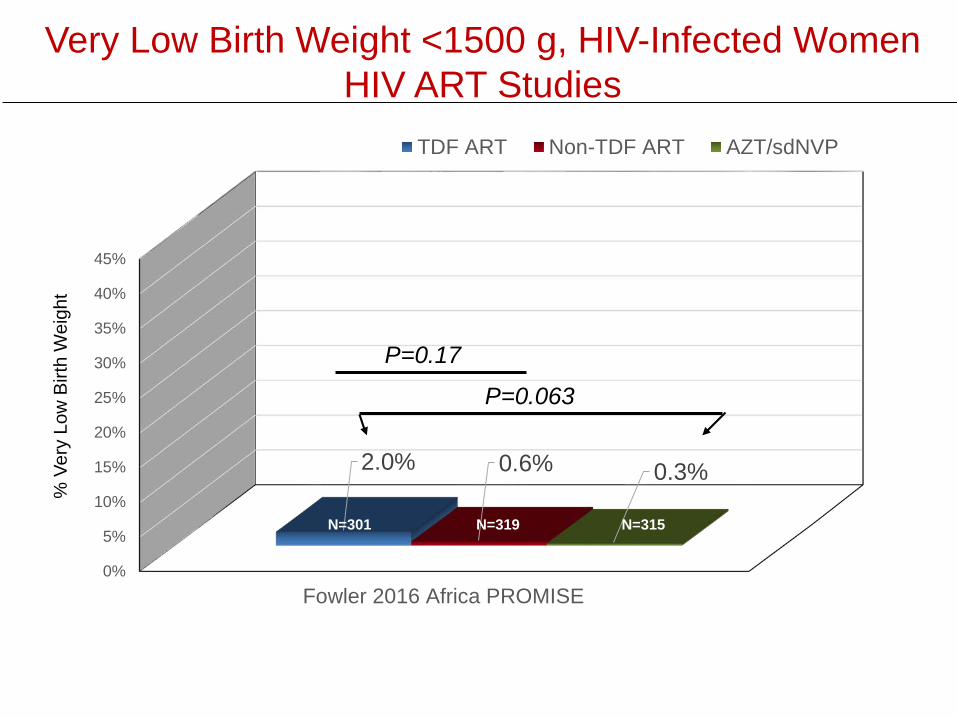
Very Low Birth Weight <1500 g, HIV-Infected WomenHIV ART Studies
0%
5%
10%
15%
20%
25%
30%
35%
40%
45%
Fowler 2016 Africa PROMISE
2.0% 0.6% 0.3%
TDF ART Non-TDF ART AZT/sdNVP
P=0.17
P=0.063
% V
ery
Low
Birt
h W
eigh
t
N=301 N=319 N=315
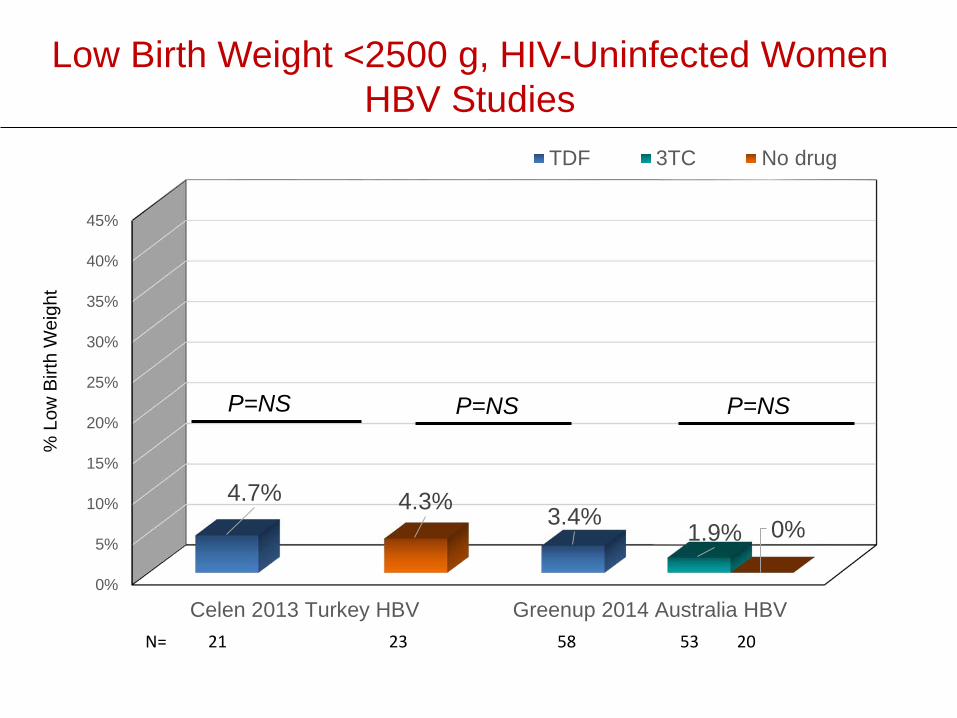
Low Birth Weight <2500 g, HIV-Uninfected Women HBV Studies
0%
5%
10%
15%
20%
25%
30%
35%
40%
45%
Celen 2013 Turkey HBV Greenup 2014 Australia HBV
4.7%3.4% 1.9%
4.3%0%
TDF 3TC No drug
P=NS P=NS P=NS
% L
ow B
irth
Wei
ght
N= 21 23 58 53 20
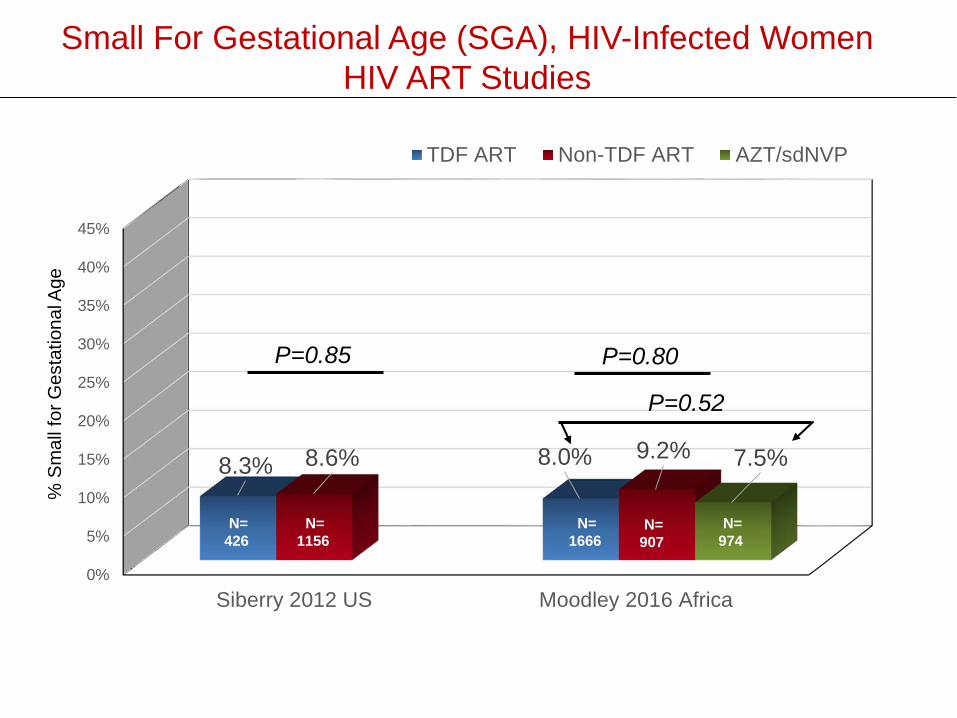
Small For Gestational Age (SGA), HIV-Infected WomenHIV ART Studies
0%
5%
10%
15%
20%
25%
30%
35%
40%
45%
Siberry 2012 US Moodley 2016 Africa
8.3% 8.0%8.6% 9.2% 7.5%
TDF ART Non-TDF ART AZT/sdNVP
P=0.85 P=0.80
P=0.52
% S
mal
l for
Ges
tatio
nal A
ge
N=1666
N=907
N=974
N=426
N=1156
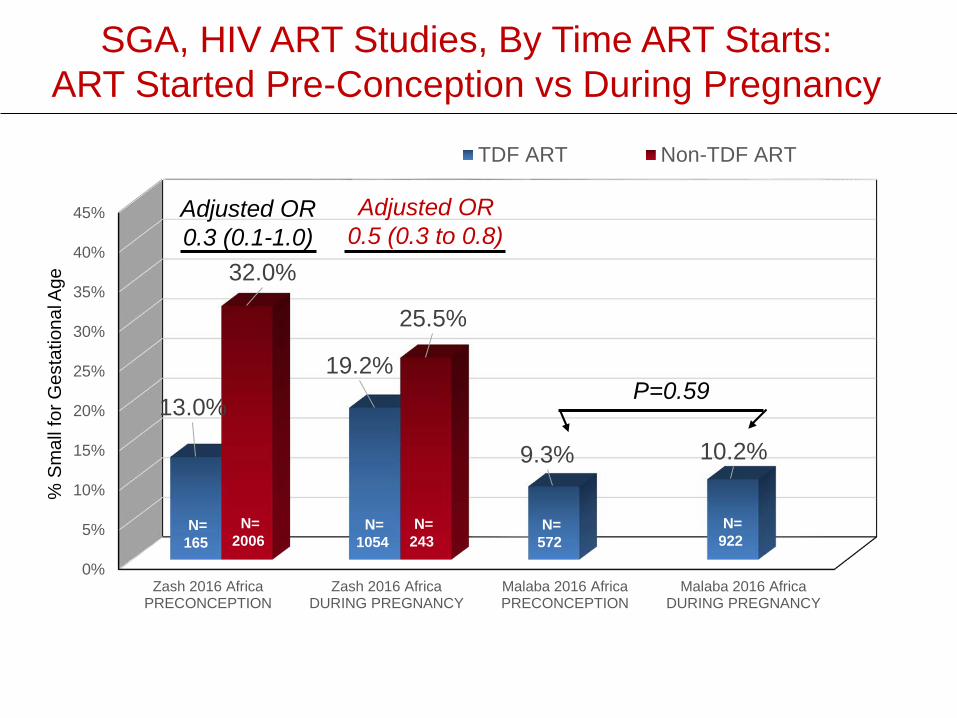
SGA, HIV ART Studies, By Time ART Starts:ART Started Pre-Conception vs During Pregnancy
0%
5%
10%
15%
20%
25%
30%
35%
40%
45%
Zash 2016 AfricaPRECONCEPTION
Zash 2016 AfricaDURING PREGNANCY
Malaba 2016 AfricaPRECONCEPTION
Malaba 2016 AfricaDURING PREGNANCY
13.0%
19.2%
9.3% 10.2%
32.0%
25.5%
TDF ART Non-TDF ART
P=0.59
% S
mal
l for
Ges
tatio
nal A
ge
N=1054
N=243
N=922
N=165
N=2006
N=572
Adjusted OR0.5 (0.3 to 0.8)
Adjusted OR0.3 (0.1-1.0)
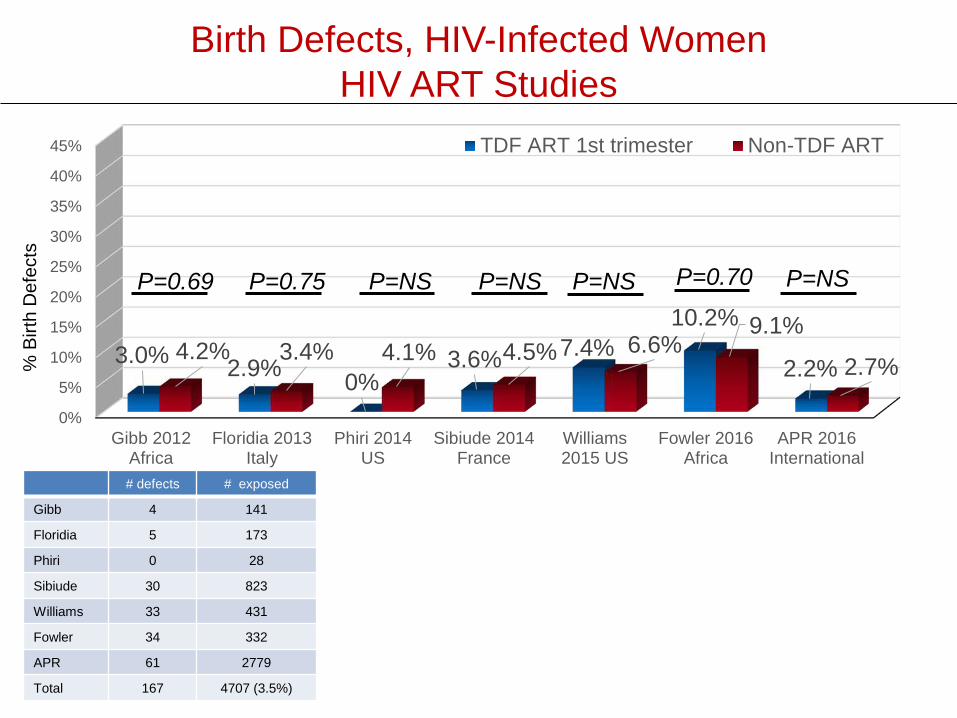
Birth Defects, HIV-Infected WomenHIV ART Studies
0%
5%
10%
15%
20%
25%
30%
35%
40%
45%
Gibb 2012Africa
Floridia 2013Italy
Phiri 2014US
Sibiude 2014France
Williams2015 US
Fowler 2016Africa
APR 2016International
3.0% 2.9% 0%3.6% 7.4%
10.2%
2.2%4.2% 3.4% 4.1% 4.5% 6.6%
9.1%
2.7%
TDF ART 1st trimester Non-TDF ART
# defects # exposed
Gibb 4 141
Floridia 5 173
Phiri 0 28
Sibiude 30 823
Williams 33 431
Fowler 34 332
APR 61 2779
Total 167 4707 (3.5%)
% B
irth
Def
ects
P=0.75 P=NSP=0.69 P=NS P=NS P=NSP=0.70
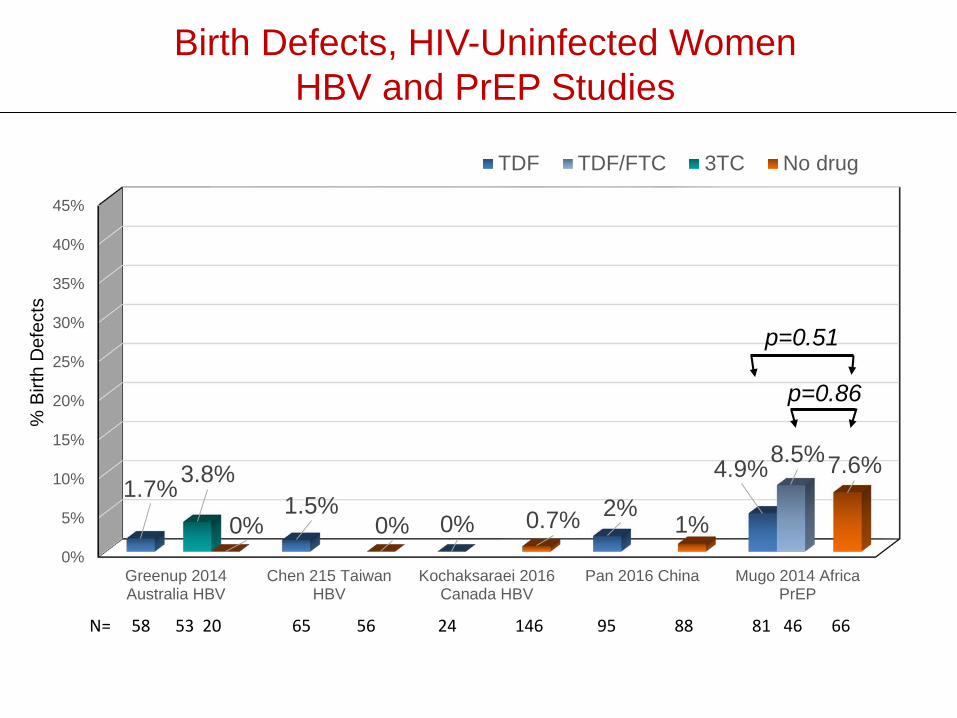
Birth Defects, HIV-Uninfected Women HBV and PrEP Studies
0%
5%
10%
15%
20%
25%
30%
35%
40%
45%
Greenup 2014Australia HBV
Chen 215 TaiwanHBV
Kochaksaraei 2016Canada HBV
Pan 2016 China Mugo 2014 AfricaPrEP
1.7%1.5%
0% 2%4.9%8.5%
3.8%
0% 0% 0.7% 1%
7.6%
TDF TDF/FTC 3TC No drug
p=0.86
p=0.51
% B
irth
Def
ects
N= 58 53 20 65 56 24 146 95 88 81 46 66
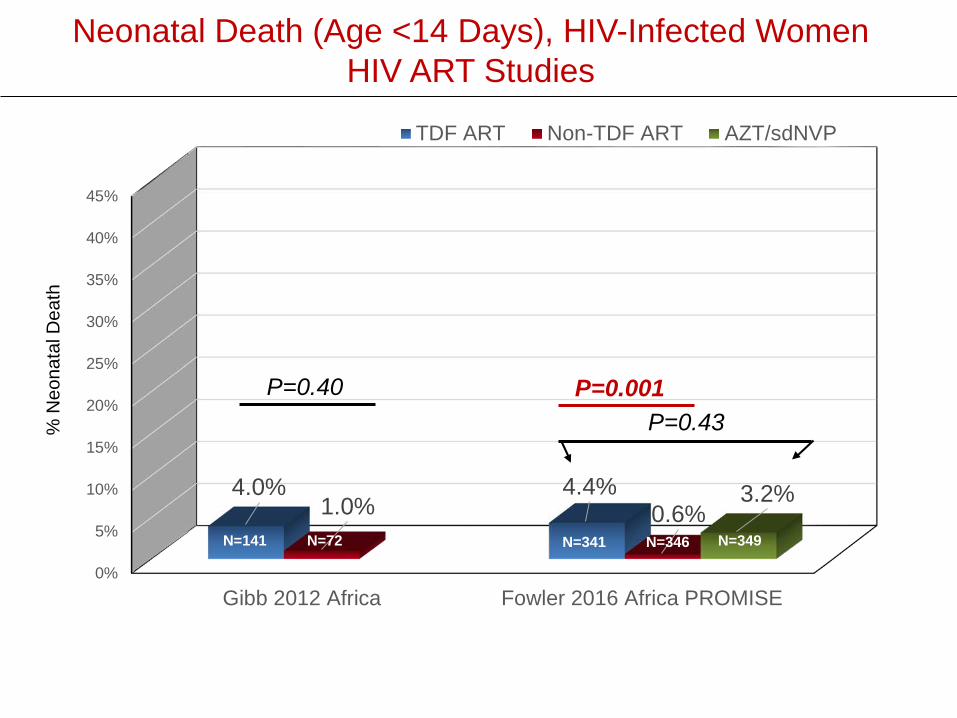
Neonatal Death (Age <14 Days), HIV-Infected WomenHIV ART Studies
0%
5%
10%
15%
20%
25%
30%
35%
40%
45%
Gibb 2012 Africa Fowler 2016 Africa PROMISE
4.0% 4.4%1.0% 0.6%
3.2%
TDF ART Non-TDF ART AZT/sdNVP
P=0.40 P=0.001P=0.43%
Neo
nata
l Dea
th
N=141 N=72 N=341 N=346 N=349
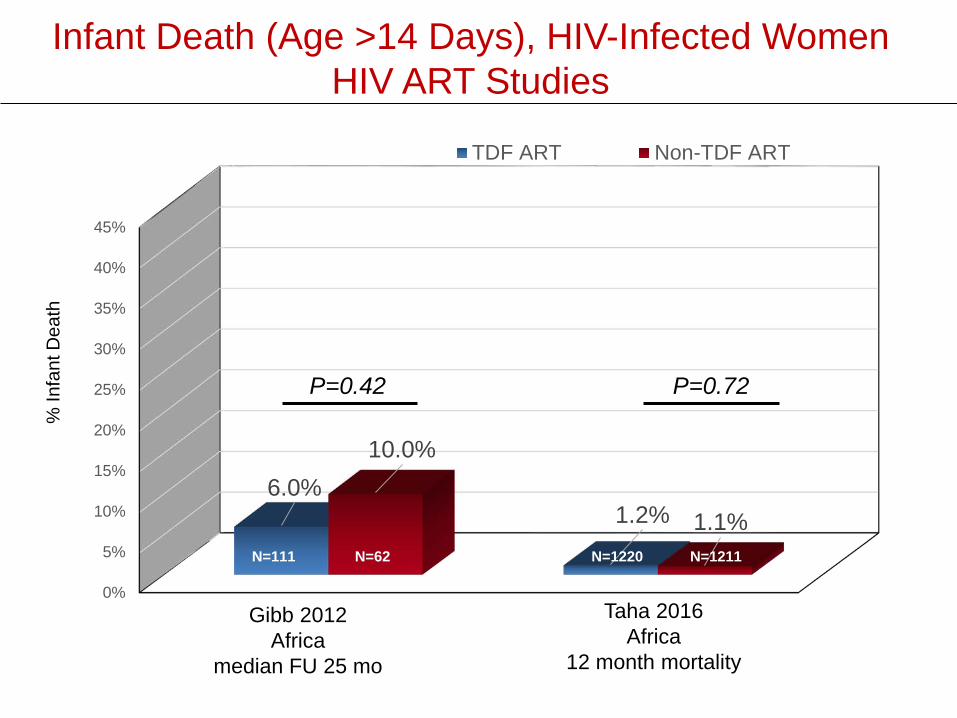
Infant Death (Age >14 Days), HIV-Infected WomenHIV ART Studies
0%
5%
10%
15%
20%
25%
30%
35%
40%
45%
6.0%1.2%
10.0%
1.1%
TDF ART Non-TDF ART
P=0.42
% In
fant
Dea
th
N=111 N=62 N=1220 N=1211
Gibb 2012Africa
median FU 25 mo
Taha 2016Africa
12 month mortality
P=0.72
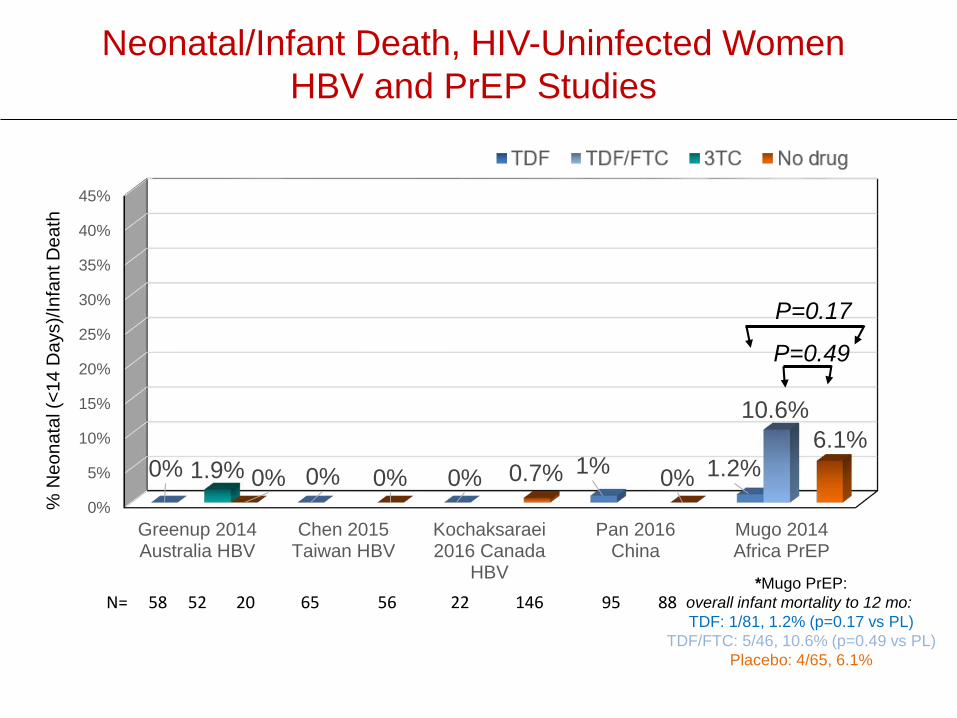
Neonatal/Infant Death, HIV-Uninfected Women HBV and PrEP Studies
0%
5%
10%
15%
20%
25%
30%
35%
40%
45%
Greenup 2014Australia HBV
Chen 2015Taiwan HBV
Kochaksaraei2016 Canada
HBV
Pan 2016China
Mugo 2014Africa PrEP
0% 0% 0% 1% 1.2%
10.6%
1.9% 0% 0% 0.7% 0%6.1%
P=0.49
P=0.17
% N
eona
tal (
<14
Day
s)/In
fant
Dea
th
N= 58 52 20 65 56 22 146 95 88 *Mugo PrEP:
overall infant mortality to 12 mo: TDF: 1/81, 1.2% (p=0.17 vs PL)
TDF/FTC: 5/46, 10.6% (p=0.49 vs PL)Placebo: 4/65, 6.1%
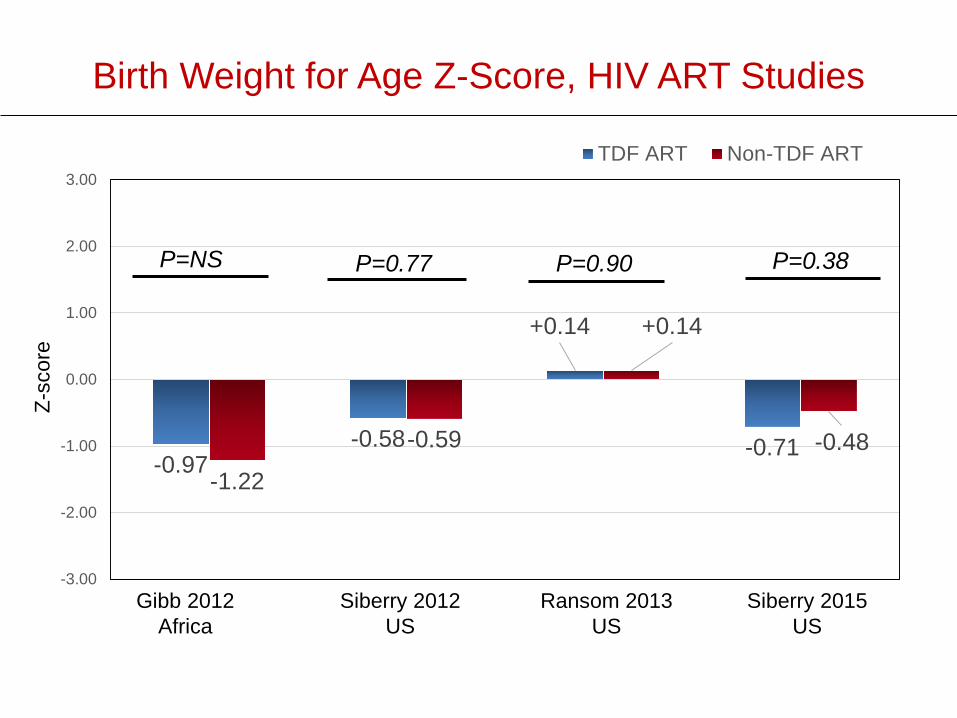
Birth Weight for Age Z-Score, HIV ART Studies
-0.97-0.58
+0.14
-0.71-1.22
-0.59
+0.14
-0.48
-3.00
-2.00
-1.00
0.00
1.00
2.00
3.00TDF ART Non-TDF ART
Gibb 2012Africa
Siberry 2012US
Ransom 2013US
Siberry 2015US
P=NS P=0.77 P=0.90 P=0.38
Z-sc
ore
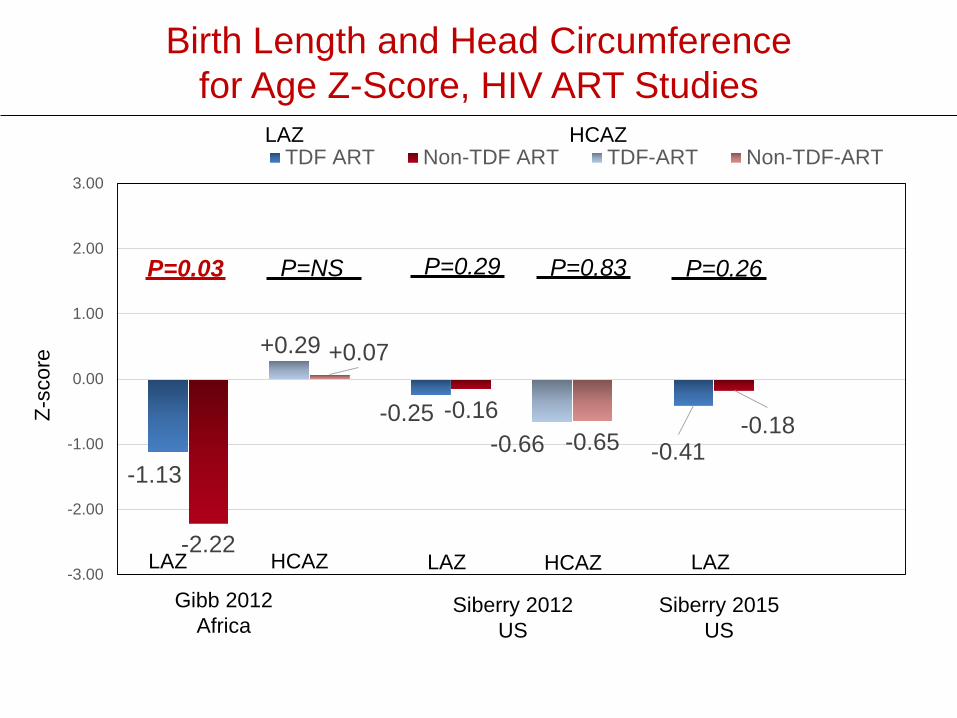
Birth Length and Head Circumference for Age Z-Score, HIV ART Studies
-1.13
-0.25-0.41
-2.22
-0.16 -0.18
+0.29
-0.66
+0.07
-0.65
-3.00
-2.00
-1.00
0.00
1.00
2.00
3.00TDF ART Non-TDF ART TDF-ART Non-TDF-ART
Gibb 2012Africa
Siberry 2012US
Siberry 2015US
LAZ LAZ LAZHCAZ HCAZ
P=0.03 P=NS P=0.83 P=0.26P=0.29
Z-sc
ore
LAZ HCAZ
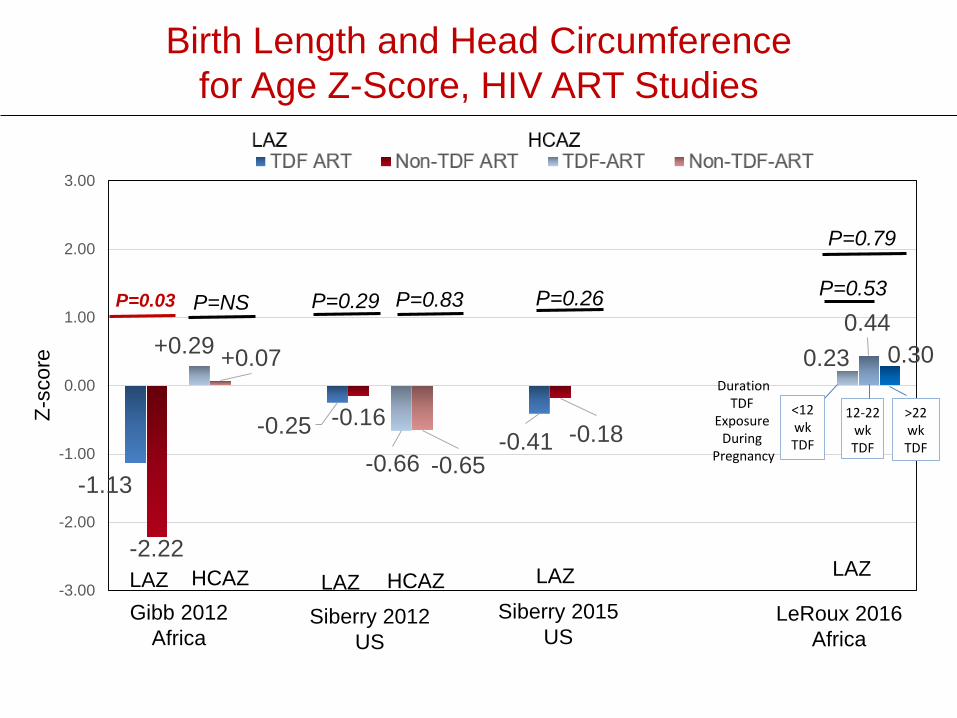
Birth Length and Head Circumference for Age Z-Score, HIV ART Studies
-1.13
-0.25 -0.41
-2.22
-0.16-0.18
+0.29
-0.66
+0.07
-0.65
0.230.44
0.30
-3.00
-2.00
-1.00
0.00
1.00
2.00
3.00
DurationTDF
Exposure During
Pregnancy
<12wkTDF
12-22wkTDF
>22wkTDF
Gibb 2012Africa
Siberry 2012US
Siberry 2015US
LAZ LAZ LAZHCAZ HCAZ
Z-sc
ore
LAZ HCAZ
LAZ
P=0.03 P=NS P=0.83 P=0.26P=0.29
LeRoux 2016Africa
P=0.53
P=0.79
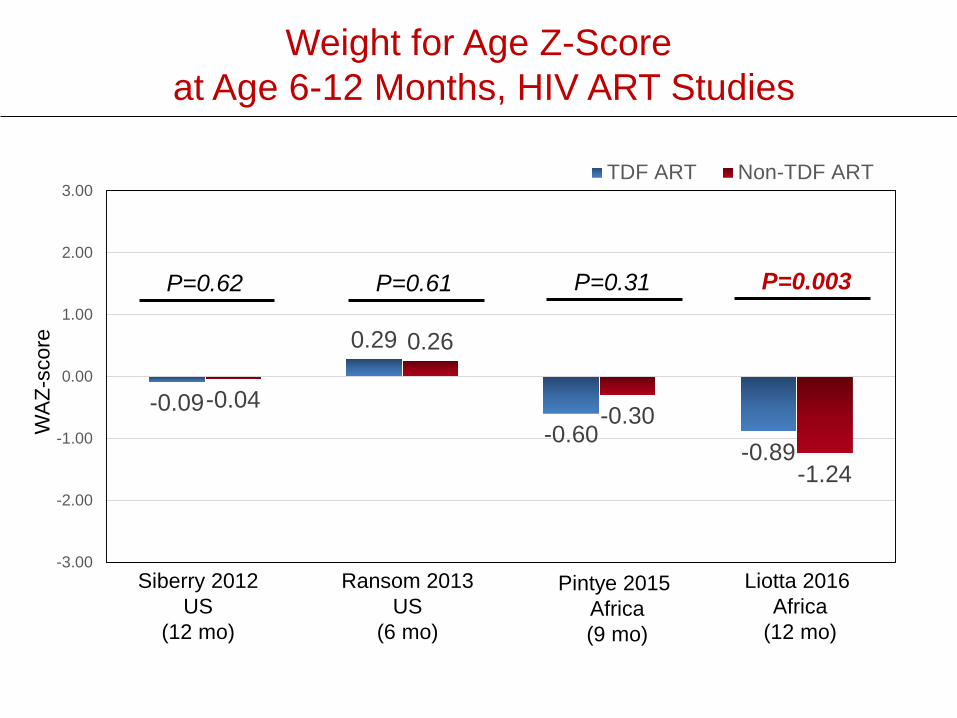
Weight for Age Z-Scoreat Age 6-12 Months, HIV ART Studies
-0.09
0.29
-0.60-0.89
-0.04
0.26
-0.30
-1.24
-3.00
-2.00
-1.00
0.00
1.00
2.00
3.00TDF ART Non-TDF ART
Siberry 2012US
(12 mo)
Ransom 2013US
(6 mo)
Pintye 2015 Africa(9 mo)
P=0.62 P=0.61 P=0.31
WAZ
-sco
re
Liotta 2016 Africa
(12 mo)
P=0.003

Length and Head Circumference for Age Z-Score at Age 9-12 Months, HIV ART Studies
-0.17
-1.10 -1.30
-0.03
-1.00-1.78
0.17
-0.40
0.42
-0.30
-3.00
-2.00
-1.00
0.00
1.00
2.00
3.00
TDF ART Non-TDF ART TDF ART Non-TDF ART
Siberry 2012US
(12 mo)
Pintye 2015 Africa(9 mo)
Z-sc
ore
P=0.04 P=0.02 P=0.80 P=0.87 P<0.001
Liotta 2016Africa
(12 mo)
LAZ LAZ LAZHCAZ HCAZ
LAZ HCAZ
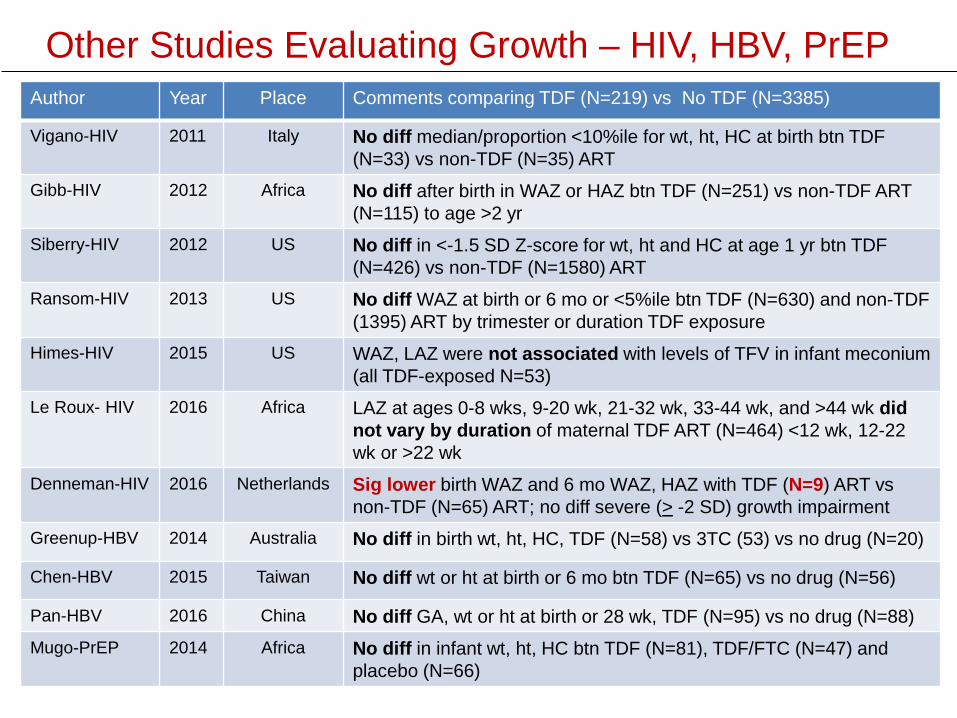
Other Studies Evaluating Growth – HIV, HBV, PrEPAuthor Year Place Comments comparing TDF (N=219) vs No TDF (N=3385)
Vigano-HIV 2011 Italy No diff median/proportion <10%ile for wt, ht, HC at birth btn TDF (N=33) vs non-TDF (N=35) ART
Gibb-HIV 2012 Africa No diff after birth in WAZ or HAZ btn TDF (N=251) vs non-TDF ART (N=115) to age >2 yr
Siberry-HIV 2012 US No diff in <-1.5 SD Z-score for wt, ht and HC at age 1 yr btn TDF (N=426) vs non-TDF (N=1580) ART
Ransom-HIV 2013 US No diff WAZ at birth or 6 mo or <5%ile btn TDF (N=630) and non-TDF (1395) ART by trimester or duration TDF exposure
Himes-HIV 2015 US WAZ, LAZ were not associated with levels of TFV in infant meconium (all TDF-exposed N=53)
Le Roux- HIV 2016 Africa LAZ at ages 0-8 wks, 9-20 wk, 21-32 wk, 33-44 wk, and >44 wk did not vary by duration of maternal TDF ART (N=464) <12 wk, 12-22 wk or >22 wk
Denneman-HIV 2016 Netherlands Sig lower birth WAZ and 6 mo WAZ, HAZ with TDF (N=9) ART vs non-TDF (N=65) ART; no diff severe (> -2 SD) growth impairment
Greenup-HBV 2014 Australia No diff in birth wt, ht, HC, TDF (N=58) vs 3TC (53) vs no drug (N=20)
Chen-HBV 2015 Taiwan No diff wt or ht at birth or 6 mo btn TDF (N=65) vs no drug (N=56)
Pan-HBV 2016 China No diff GA, wt or ht at birth or 28 wk, TDF (N=95) vs no drug (N=88) Mugo-PrEP 2014 Africa No diff in infant wt, ht, HC btn TDF (N=81), TDF/FTC (N=47) and
placebo (N=66)
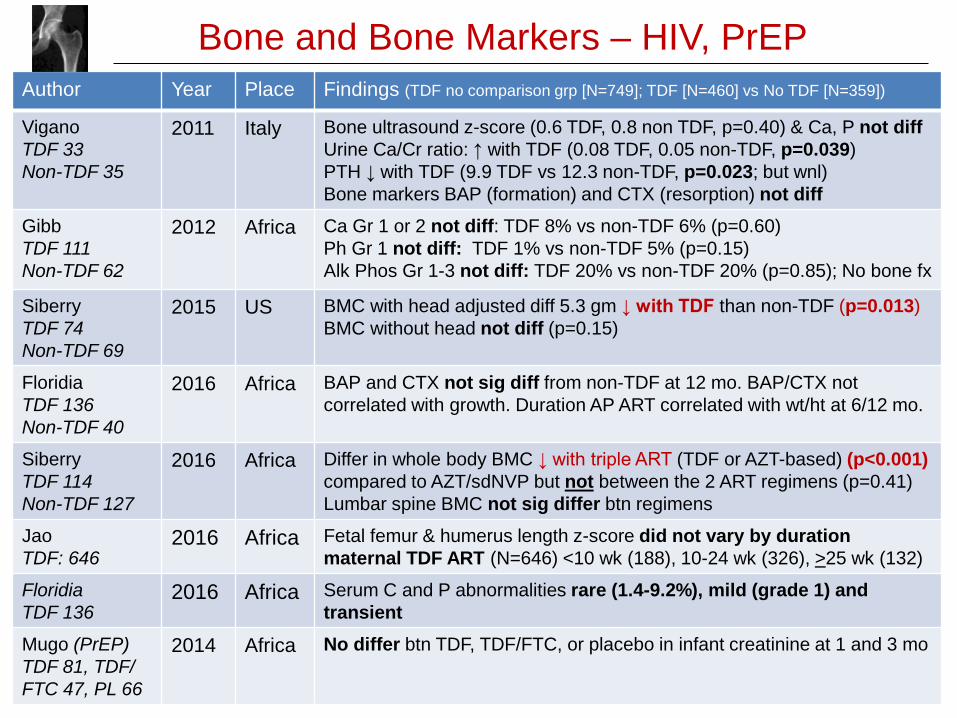
Bone and Bone Markers – HIV, PrEPAuthor Year Place Findings (TDF no comparison grp [N=749]; TDF [N=460] vs No TDF [N=359])
ViganoTDF 33Non-TDF 35
2011 Italy Bone ultrasound z-score (0.6 TDF, 0.8 non TDF, p=0.40) & Ca, P not diffUrine Ca/Cr ratio: ↑ with TDF (0.08 TDF, 0.05 non-TDF, p=0.039)PTH ↓ with TDF (9.9 TDF vs 12.3 non-TDF, p=0.023; but wnl)Bone markers BAP (formation) and CTX (resorption) not diff
Gibb TDF 111Non-TDF 62
2012 Africa Ca Gr 1 or 2 not diff: TDF 8% vs non-TDF 6% (p=0.60)Ph Gr 1 not diff: TDF 1% vs non-TDF 5% (p=0.15)Alk Phos Gr 1-3 not diff: TDF 20% vs non-TDF 20% (p=0.85); No bone fx
SiberryTDF 74Non-TDF 69
2015 US BMC with head adjusted diff 5.3 gm ↓ with TDF than non-TDF (p=0.013)BMC without head not diff (p=0.15)
FloridiaTDF 136Non-TDF 40
2016 Africa BAP and CTX not sig diff from non-TDF at 12 mo. BAP/CTX not correlated with growth. Duration AP ART correlated with wt/ht at 6/12 mo.
SiberryTDF 114Non-TDF 127
2016 Africa Differ in whole body BMC ↓ with triple ART (TDF or AZT-based) (p<0.001) compared to AZT/sdNVP but not between the 2 ART regimens (p=0.41)Lumbar spine BMC not sig differ btn regimens
JaoTDF: 646
2016 Africa Fetal femur & humerus length z-score did not vary by duration maternal TDF ART (N=646) <10 wk (188), 10-24 wk (326), >25 wk (132)
FloridiaTDF 136
2016 Africa Serum C and P abnormalities rare (1.4-9.2%), mild (grade 1) and transient
Mugo (PrEP)TDF 81, TDF/FTC 47, PL 66
2014 Africa No differ btn TDF, TDF/FTC, or placebo in infant creatinine at 1 and 3 mo
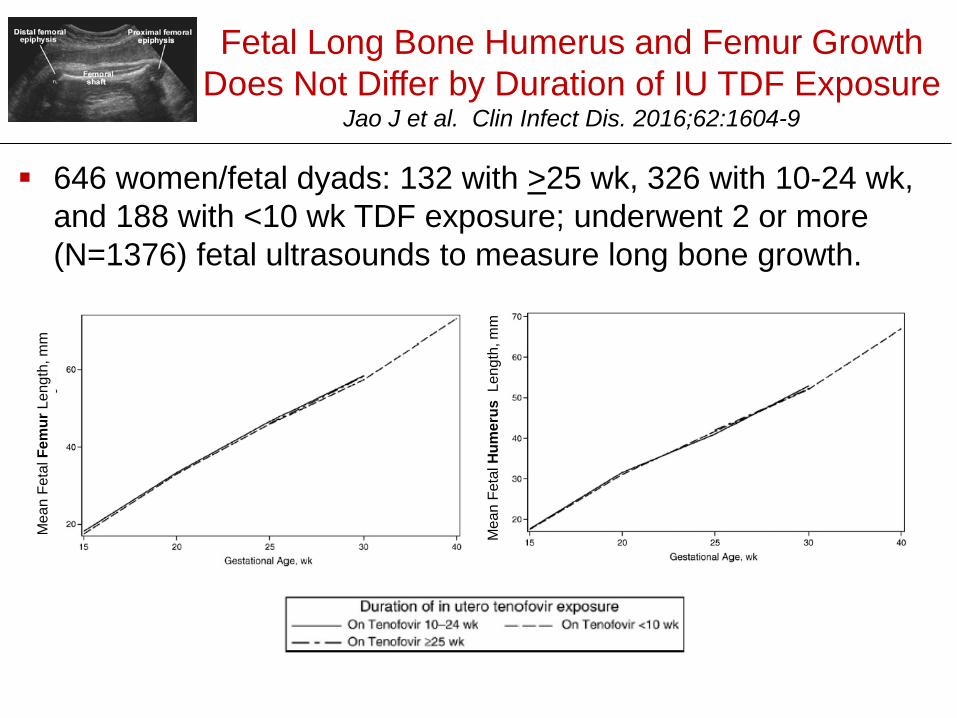
Fetal Long Bone Humerus and Femur Growth Does Not Differ by Duration of IU TDF Exposure
Jao J et al. Clin Infect Dis. 2016;62:1604-9
646 women/fetal dyads: 132 with >25 wk, 326 with 10-24 wk, and 188 with <10 wk TDF exposure; underwent 2 or more (N=1376) fetal ultrasounds to measure long bone growth.
Mea
n Fe
tal F
emur
Leng
th, m
m
Mea
n Fe
tal H
umer
usLe
ngth
, mm
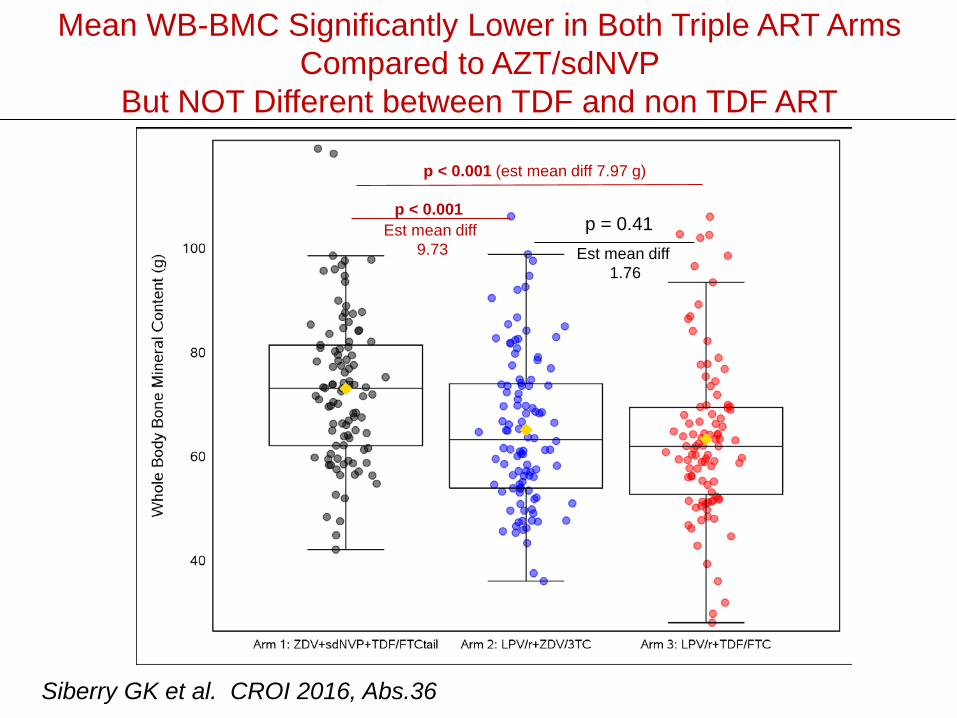
Mean WB-BMC Significantly Lower in Both Triple ART Arms Compared to AZT/sdNVP
But NOT Different between TDF and non TDF ART
p < 0.001 (est mean diff 7.97 g)
p < 0.001Est mean diff
9.73p = 0.41
Est mean diff 1.76
Siberry GK et al. CROI 2016, Abs.36
Maternal Adverse Events
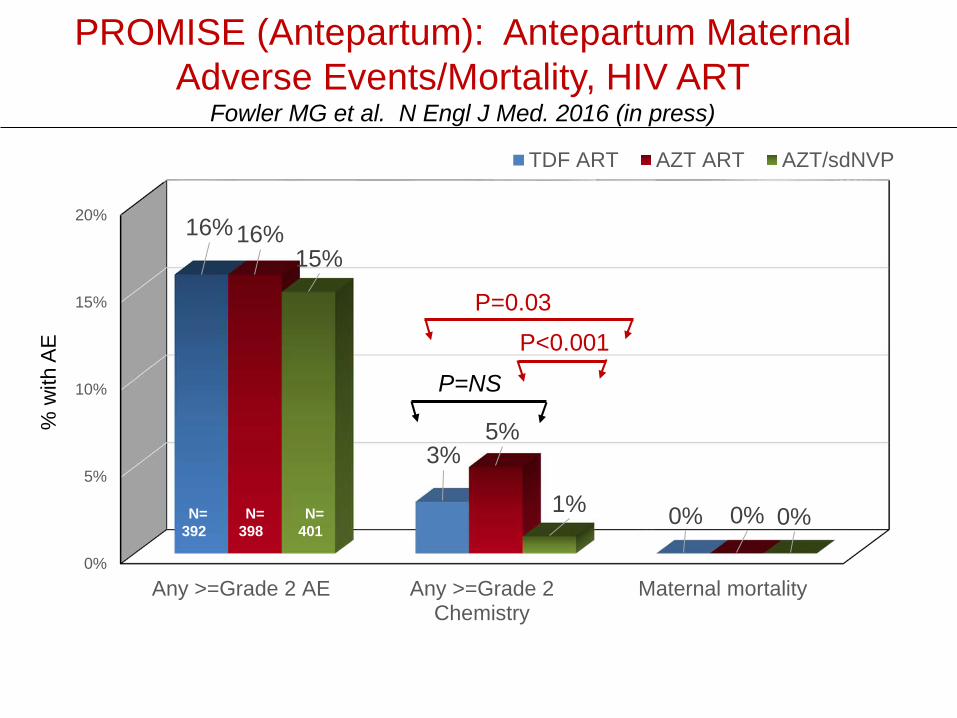
PROMISE (Antepartum): Antepartum Maternal Adverse Events/Mortality, HIV ART
Fowler MG et al. N Engl J Med. 2016 (in press)
0%
5%
10%
15%
20%
Any >=Grade 2 AE Any >=Grade 2Chemistry
Maternal mortality
16%
3%
0%
16%
5%
0%
15%
1% 0%
TDF ART AZT ART AZT/sdNVP
P=NS
P=0.03P<0.001
% w
ith A
E
N=398
N=401
N=392
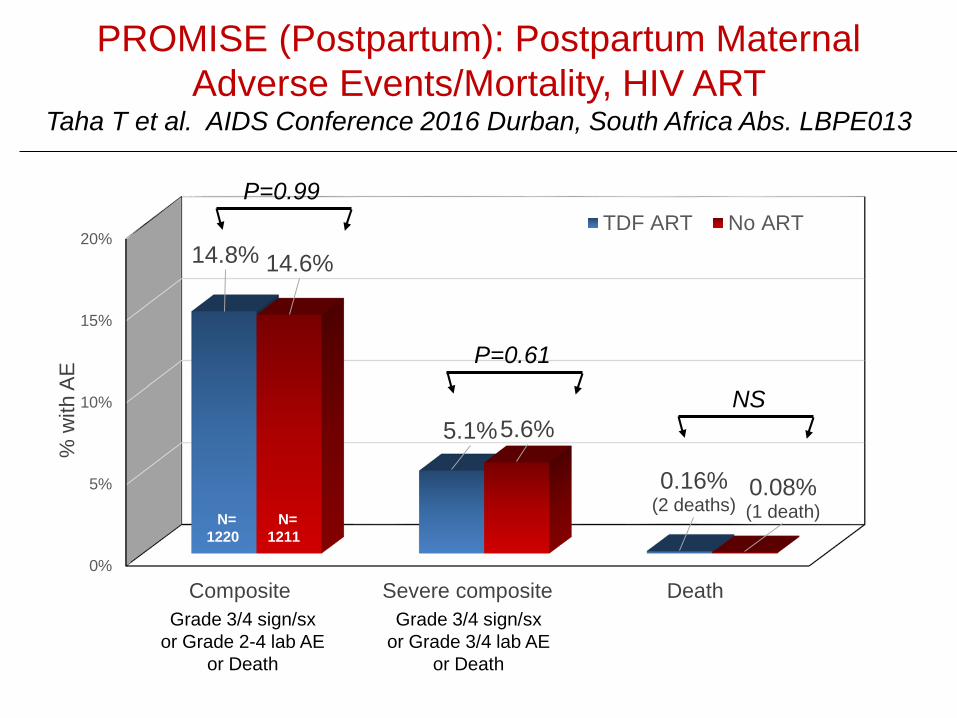
PROMISE (Postpartum): Postpartum Maternal Adverse Events/Mortality, HIV ART
Taha T et al. AIDS Conference 2016 Durban, South Africa Abs. LBPE013
0%
5%
10%
15%
20%
Composite Severe composite Death
14.8%
5.1%
0.16%(2 deaths)
14.6%
5.6%
0.08%(1 death)
% w
ith A
E
TDF ART No ART
Grade 3/4 sign/sxor Grade 2-4 lab AE
or Death
Grade 3/4 sign/sxor Grade 3/4 lab AE
or Death
N=1220
N=1211
P=0.99
P=0.61
NS
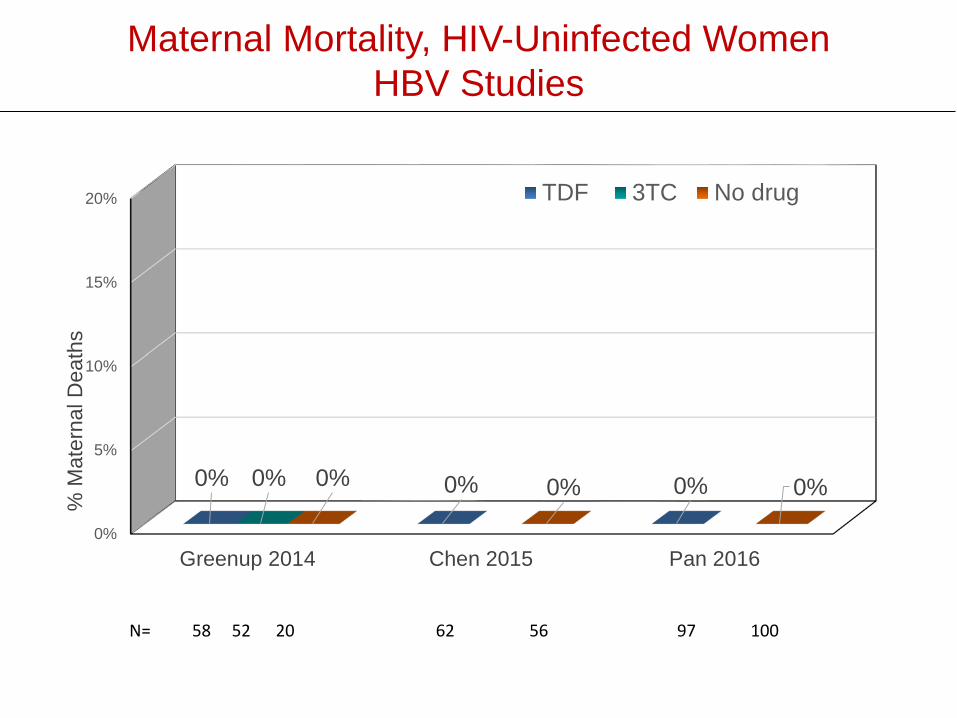
Maternal Mortality, HIV-Uninfected WomenHBV Studies
0%
5%
10%
15%
20%
Greenup 2014 Chen 2015 Pan 2016
0% 0% 0%0% 0% 0% 0%
% M
ater
nal D
eath
s
TDF 3TC No drug
N= 58 52 20 62 56 97 100
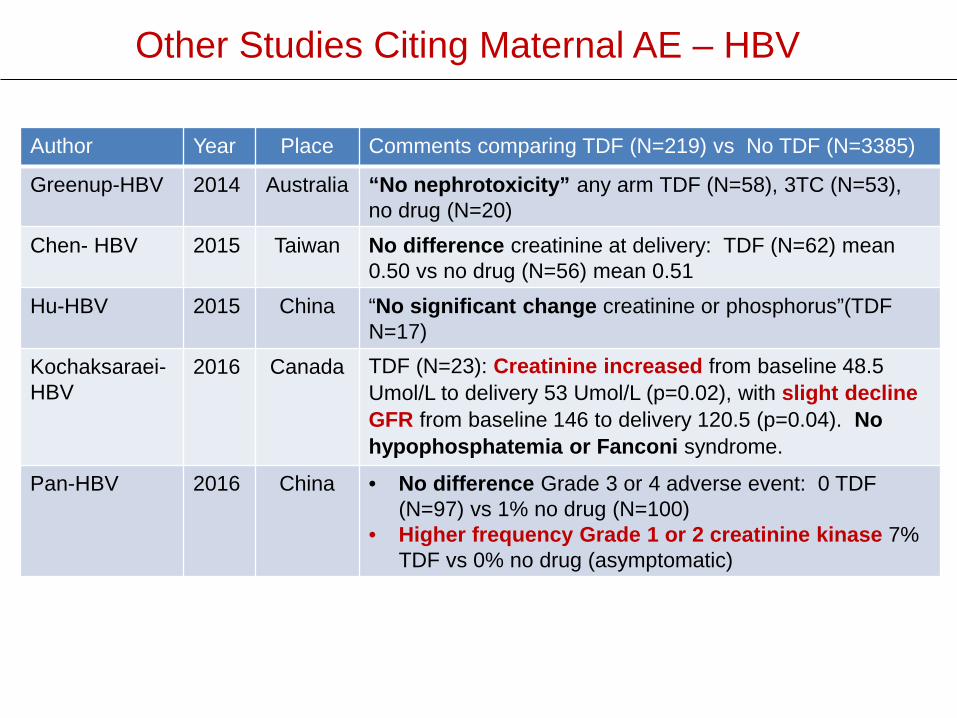
Other Studies Citing Maternal AE – HBV
Author Year Place Comments comparing TDF (N=219) vs No TDF (N=3385)
Greenup-HBV 2014 Australia “No nephrotoxicity” any arm TDF (N=58), 3TC (N=53), no drug (N=20)
Chen- HBV 2015 Taiwan No difference creatinine at delivery: TDF (N=62) mean 0.50 vs no drug (N=56) mean 0.51
Hu-HBV 2015 China “No significant change creatinine or phosphorus”(TDF N=17)
Kochaksaraei-HBV
2016 Canada TDF (N=23): Creatinine increased from baseline 48.5 Umol/L to delivery 53 Umol/L (p=0.02), with slight decline GFR from baseline 146 to delivery 120.5 (p=0.04). No hypophosphatemia or Fanconi syndrome.
Pan-HBV 2016 China • No difference Grade 3 or 4 adverse event: 0 TDF (N=97) vs 1% no drug (N=100)
• Higher frequency Grade 1 or 2 creatinine kinase 7% TDF vs 0% no drug (asymptomatic)
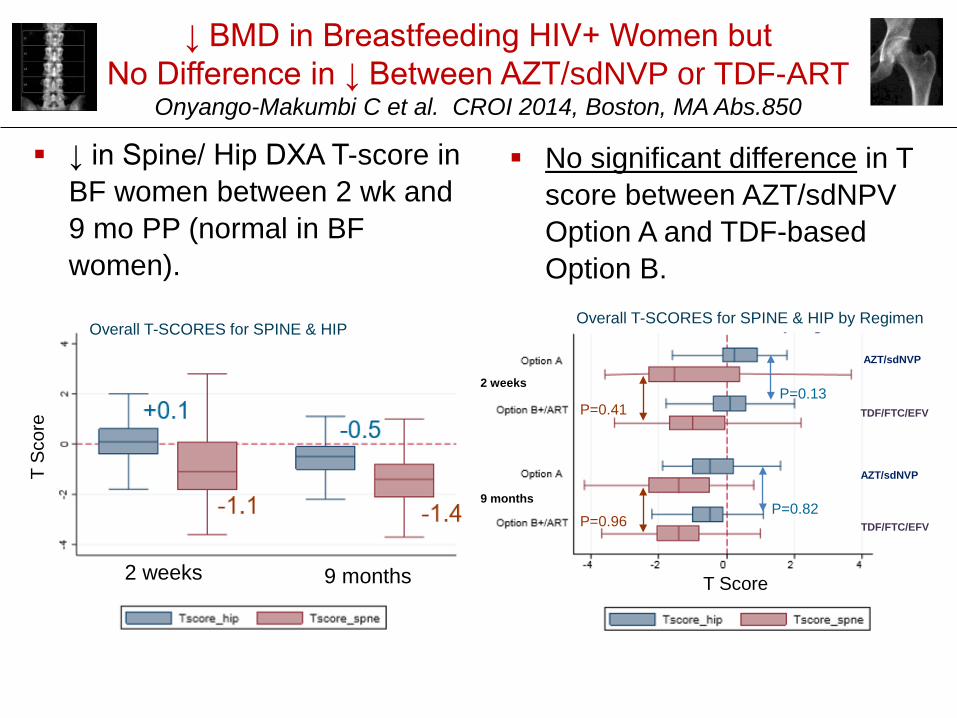
↓ BMD in Breastfeeding HIV+ Women but No Difference in ↓ Between AZT/sdNVP or TDF-ART
Onyango-Makumbi C et al. CROI 2014, Boston, MA Abs.850
↓ in Spine/ Hip DXA T-score in BF women between 2 wk and 9 mo PP (normal in BF women).
No significant difference in T score between AZT/sdNPVOption A and TDF-based Option B.
2 weeks 9 months
T Sc
ore
Overall T-SCORES for SPINE & HIP
T Score
2 weeks
9 months
TDF/FTC/EFV
AZT/sdNVP
TDF/FTC/EFV
AZT/sdNVP
Overall T-SCORES for SPINE & HIP by Regimen
P=0.41
P=0.96
P=0.13
P=0.82
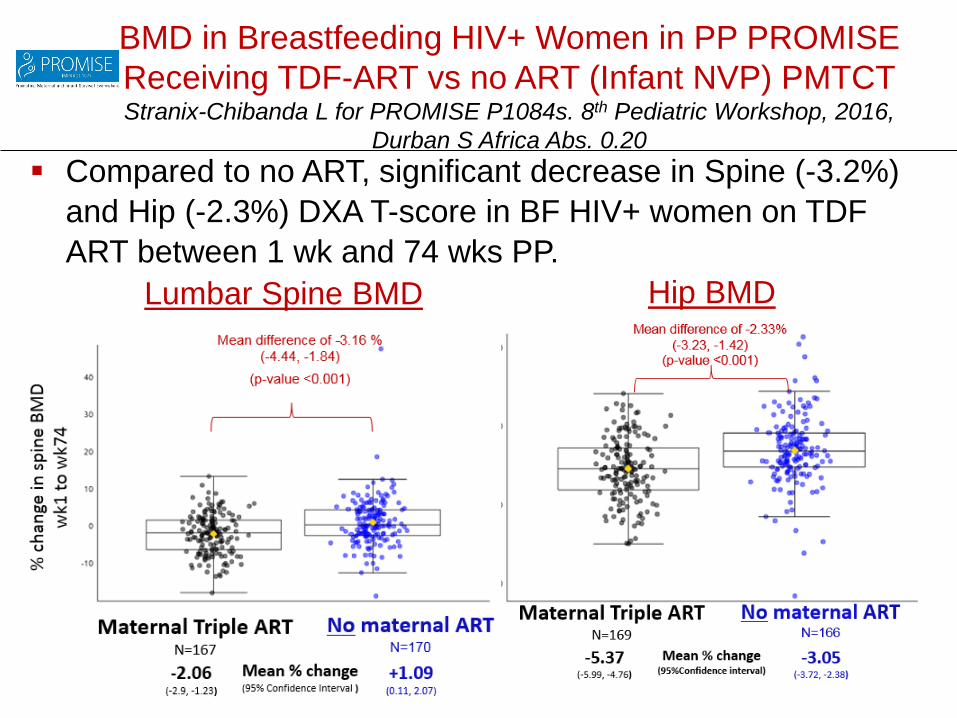
BMD in Breastfeeding HIV+ Women in PP PROMISE Receiving TDF-ART vs no ART (Infant NVP) PMTCTStranix-Chibanda L for PROMISE P1084s. 8th Pediatric Workshop, 2016,
Durban S Africa Abs. 0.20
Lumbar Spine BMD Hip BMD
Compared to no ART, significant decrease in Spine (-3.2%) and Hip (-2.3%) DXA T-score in BF HIV+ women on TDF ART between 1 wk and 74 wks PP.

Case Reports: No Similarities in AnomaliesNo Conclusions Can be Drawn
Sabbatini 2007 2 cases of congenital pyelectasis (detected by ultrasound, not present in 1 at 8 mos; confirmed in 1 at 1mo)
Kinai 2012 Fetal growth “significantly blunted” after switch to TDF (ABC/LPVr/TDF) at GA 35 wk (had been on ABC/LPV/r/RAL 1st 33 wk); delivered at 38 wk; infant BW, BL <-2SD; birth Ca 7.4 (LLN 8.6); birth alk P 560 (ULN 316); urine beta-2 microglobulin 1780 ug/L; plasma TDF 24 hr after delivery 102 ng/L
Jibril 2013 2 cases spina bifida on TDF/FTC/NVP prior to conception
Fasunla 2014 2 cases cleft palate in infants exposed to TDF/3TC/EFV at conception to 2-3 mo GA (1 additional case in infant exposed to AZT/3TC/NVP)
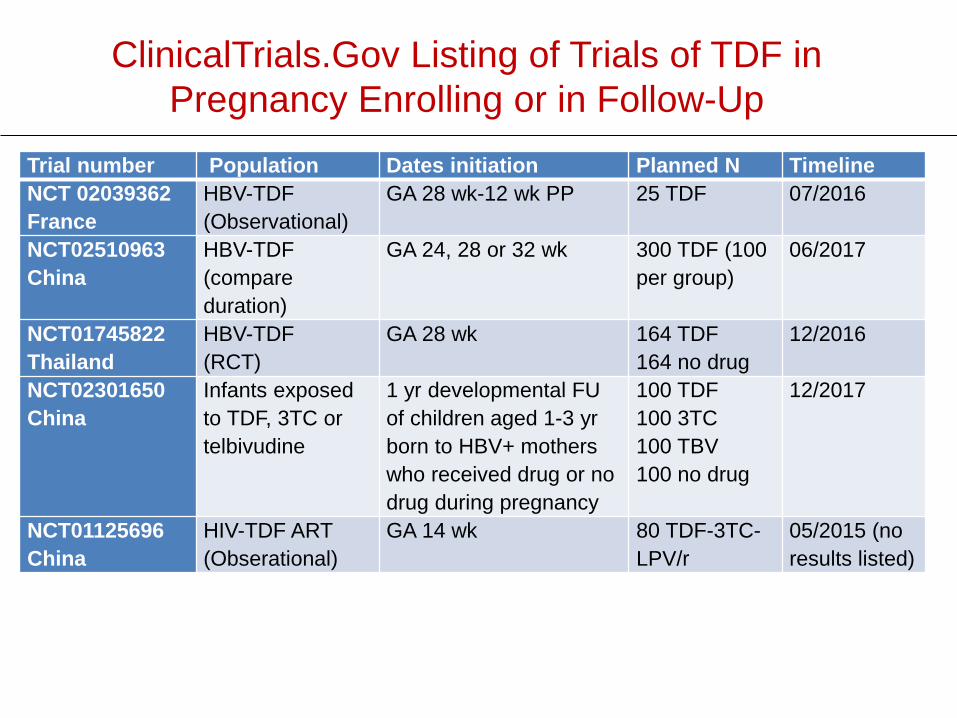
ClinicalTrials.Gov Listing of Trials of TDF in Pregnancy Enrolling or in Follow-Up
Trial number Population Dates initiation Planned N TimelineNCT 02039362France
HBV-TDF(Observational)
GA 28 wk-12 wk PP 25 TDF 07/2016
NCT02510963China
HBV-TDF(compare duration)
GA 24, 28 or 32 wk 300 TDF (100 per group)
06/2017
NCT01745822Thailand
HBV-TDF (RCT)
GA 28 wk 164 TDF164 no drug
12/2016
NCT02301650China
Infants exposed to TDF, 3TC or telbivudine
1 yr developmental FU of children aged 1-3 yr born to HBV+ mothers who received drug or no drug during pregnancy
100 TDF100 3TC100 TBV100 no drug
12/2017
NCT01125696China
HIV-TDF ART(Obserational)
GA 14 wk 80 TDF-3TC-LPV/r
05/2015 (no results listed)
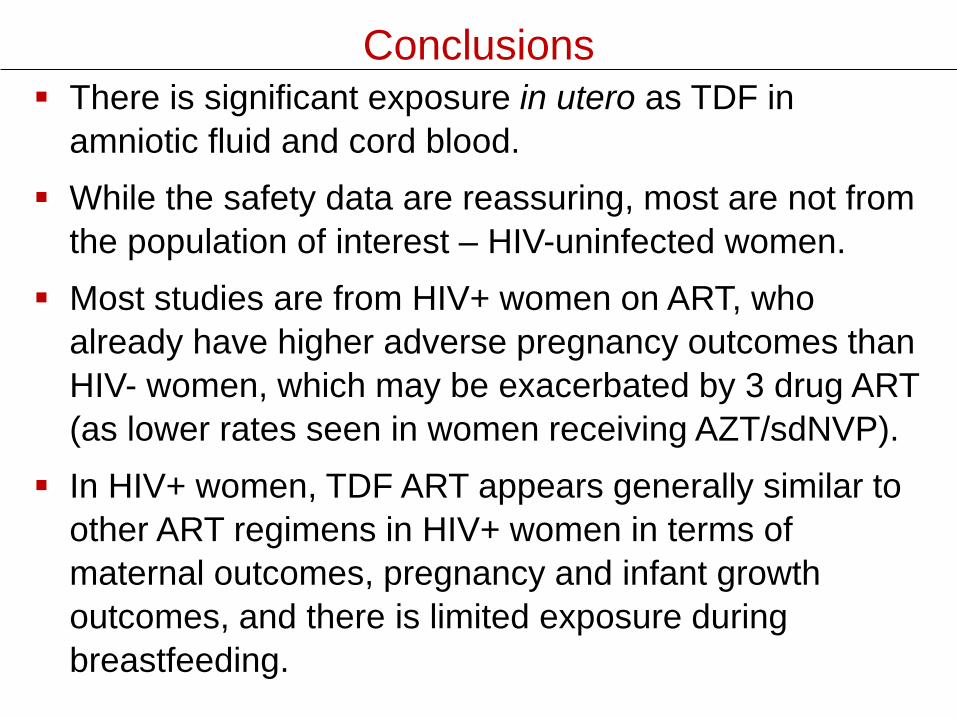
Conclusions There is significant exposure in utero as TDF in
amniotic fluid and cord blood. While the safety data are reassuring, most are not from
the population of interest – HIV-uninfected women. Most studies are from HIV+ women on ART, who
already have higher adverse pregnancy outcomes than HIV- women, which may be exacerbated by 3 drug ART (as lower rates seen in women receiving AZT/sdNVP).
In HIV+ women, TDF ART appears generally similar to other ART regimens in HIV+ women in terms of maternal outcomes, pregnancy and infant growth outcomes, and there is limited exposure during breastfeeding.
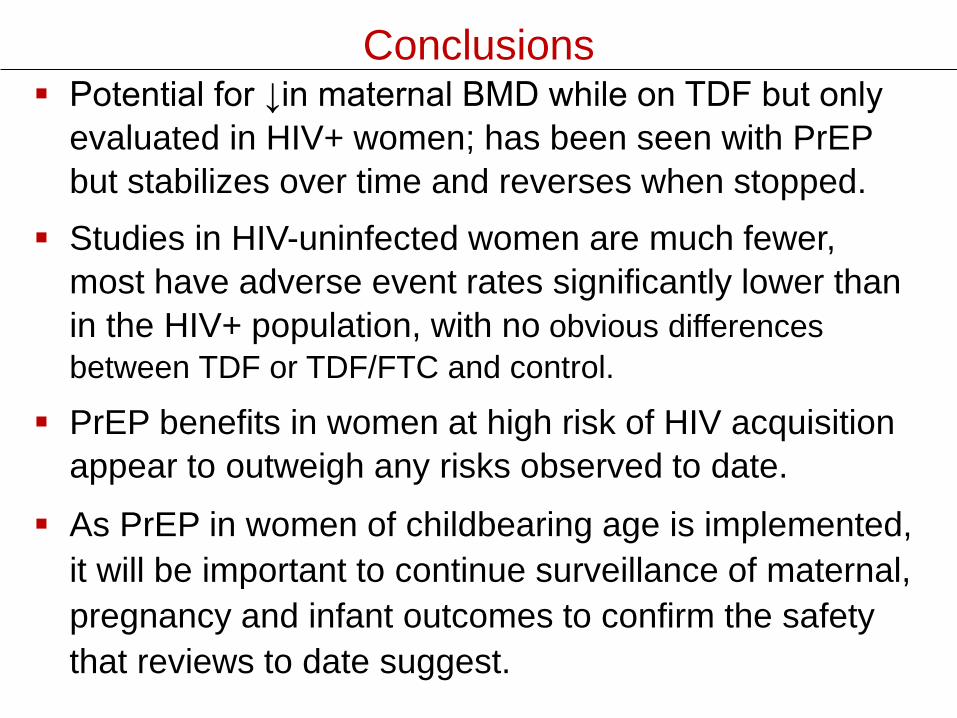
Conclusions Potential for ↓in maternal BMD while on TDF but only
evaluated in HIV+ women; has been seen with PrEP but stabilizes over time and reverses when stopped.
Studies in HIV-uninfected women are much fewer, most have adverse event rates significantly lower than in the HIV+ population, with no obvious differences between TDF or TDF/FTC and control.
PrEP benefits in women at high risk of HIV acquisition appear to outweigh any risks observed to date.
As PrEP in women of childbearing age is implemented, it will be important to continue surveillance of maternal, pregnancy and infant outcomes to confirm the safety that reviews to date suggest.
Thanks For Your Attention!