Review Phenotypic plasticity and experimental evolution
19
2344 Introduction Natural selection tends to act most strongly on aspects of the phenotype (traits) at relatively high levels of biological organization because they are the most strongly correlated with Darwinian fitness (e.g. lifetime reproductive success). Components of life history, behaviors and aspects of organismal performance (for reviews, see Ketterson and Nolan, Jr, 1999; Irschick and Garland, Jr, 2001; Kingsolver and Huey, 2003; Costa and Sinervo, 2004) are ‘complex traits’ in that they are composed of many subordinate traits at lower levels of biological organization (Swallow and Garland, Jr, 2005) (Fig.·1). Thus, the evolutionary response to selection on such complex traits necessarily entails associated changes in aspects of morphology, physiology and biochemical pathways (Ghalambor et al., 2003; Sinervo and Calsbeek, 2003). In addition, complex patterns of trade-offs and constraints are expected to occur, and the genetic architecture underlying these may itself evolve in response to selection (e.g. Chippindale et al., 2003; Rose et al., 2005). Regardless of position in the biological hierarchy, most if Natural or artificial selection that favors higher values of a particular trait within a given population should engender an evolutionary response that increases the mean value of the trait. For this prediction to hold, the phenotypic variance of the trait must be caused in part by additive effects of alleles segregating in the population, and also the trait must not be too strongly genetically correlated with other traits that are under selection. Another prediction, rarely discussed in the literature, is that directional selection should favor alleles that increase phenotypic plasticity in the direction of selection, where phenotypic plasticity is defined as the ability of one genotype to produce more than one phenotype when exposed to different environments. This prediction has received relatively little empirical attention. Nonetheless, many laboratory experiments impose selection regimes that could allow for the evolution of enhanced plasticity (e.g. desiccation trials with Drosophila that last for several hours or days). We review one example that involved culturing of Drosophila on lemon for multiple generations and then tested for enhanced plasticity of detoxifying enzymes. We also review an example with vertebrates that involves selective breeding for high voluntary activity levels in house mice, targeting wheel-running behavior on days 5+6 of a 6-day wheel exposure. This selection regime allows for the possibility of wheel running itself or subordinate traits that support such running to increase in plasticity over days 1–4 of wheel access. Indeed, some traits, such as the concentration of the glucose transporter GLUT4 in gastrocnemius muscle, do show enhanced plasticity in the selected lines over a 5–6 day period. In several experiments we have housed mice from both the Selected (S) and Control (C) lines with or without wheel access for several weeks to test for differences in plasticity (training effects). A variety of patterns were observed, including no training effects in either S or C mice, similar changes in both the S and C lines, greater changes in the S lines but in the same direction in the C lines, and even opposite directions of change in the S and C lines. For some of the traits that show a greater training effect in the S lines, but in the same direction as in C lines, the greater effect can be explained statistically by the greater wheel running exhibited by S lines (‘more pain, more gain’). For others, however, the differences seem to reflect inherently greater plasticity in the S lines (i.e. for a given amount of stimulus, such as wheel running/day, individuals in the S lines show a greater response as compared with individuals in the C lines). We suggest that any selection experiment in which the selective event is more than instantaneous should explore whether plasticity in the appropriate (adaptive) direction has increased as a component of the response to selection. Key words: adaptive plasticity, artificial selection, complex traits, environment, exercise, genotype, locomotion, mouse. Summary The Journal of Experimental Biology 209, 2344-2361 Published by The Company of Biologists 2006 doi:10.1242/jeb.02244 Review Phenotypic plasticity and experimental evolution Theodore Garland, Jr* and Scott A. Kelly Department of Biology, University of California, Riverside, Riverside, CA 92521, USA *Author for correspondence (e-mail: [email protected]) Accepted 29 March 2006 THE JOURNAL OF EXPERIMENTAL BIOLOGY
Transcript of Review Phenotypic plasticity and experimental evolution

2344
IntroductionNatural selection tends to act most strongly on aspects of the
phenotype (traits) at relatively high levels of biologicalorganization because they are the most strongly correlatedwith Darwinian fitness (e.g. lifetime reproductive success).Components of life history, behaviors and aspects oforganismal performance (for reviews, see Ketterson andNolan, Jr, 1999; Irschick and Garland, Jr, 2001; Kingsolver andHuey, 2003; Costa and Sinervo, 2004) are ‘complex traits’ inthat they are composed of many subordinate traits at lower
levels of biological organization (Swallow and Garland, Jr,2005) (Fig.·1). Thus, the evolutionary response to selection onsuch complex traits necessarily entails associated changes inaspects of morphology, physiology and biochemical pathways(Ghalambor et al., 2003; Sinervo and Calsbeek, 2003). Inaddition, complex patterns of trade-offs and constraints areexpected to occur, and the genetic architecture underlyingthese may itself evolve in response to selection (e.g.Chippindale et al., 2003; Rose et al., 2005).
Regardless of position in the biological hierarchy, most if
Natural or artificial selection that favors higher valuesof a particular trait within a given population shouldengender an evolutionary response that increases themean value of the trait. For this prediction to hold, thephenotypic variance of the trait must be caused in part byadditive effects of alleles segregating in the population,and also the trait must not be too strongly geneticallycorrelated with other traits that are under selection.Another prediction, rarely discussed in the literature, isthat directional selection should favor alleles that increasephenotypic plasticity in the direction of selection, wherephenotypic plasticity is defined as the ability of onegenotype to produce more than one phenotype whenexposed to different environments. This prediction hasreceived relatively little empirical attention. Nonetheless,many laboratory experiments impose selection regimesthat could allow for the evolution of enhanced plasticity(e.g. desiccation trials with Drosophila that last for severalhours or days). We review one example that involvedculturing of Drosophila on lemon for multiple generationsand then tested for enhanced plasticity of detoxifyingenzymes. We also review an example with vertebrates thatinvolves selective breeding for high voluntary activitylevels in house mice, targeting wheel-running behavior ondays 5+6 of a 6-day wheel exposure. This selection regimeallows for the possibility of wheel running itself orsubordinate traits that support such running to increase inplasticity over days 1–4 of wheel access. Indeed, some
traits, such as the concentration of the glucose transporterGLUT4 in gastrocnemius muscle, do show enhancedplasticity in the selected lines over a 5–6 day period. Inseveral experiments we have housed mice from both theSelected (S) and Control (C) lines with or without wheelaccess for several weeks to test for differences in plasticity(training effects). A variety of patterns were observed,including no training effects in either S or C mice, similarchanges in both the S and C lines, greater changes in the Slines but in the same direction in the C lines, and evenopposite directions of change in the S and C lines. Forsome of the traits that show a greater training effect in theS lines, but in the same direction as in C lines, the greatereffect can be explained statistically by the greater wheelrunning exhibited by S lines (‘more pain, more gain’). Forothers, however, the differences seem to reflect inherentlygreater plasticity in the S lines (i.e. for a given amount ofstimulus, such as wheel running/day, individuals in theS lines show a greater response as compared withindividuals in the C lines). We suggest that any selectionexperiment in which the selective event is more thaninstantaneous should explore whether plasticity in theappropriate (adaptive) direction has increased as acomponent of the response to selection.
Key words: adaptive plasticity, artificial selection, complex traits,environment, exercise, genotype, locomotion, mouse.
Summary
The Journal of Experimental Biology 209, 2344-2361Published by The Company of Biologists 2006doi:10.1242/jeb.02244
Review
Phenotypic plasticity and experimental evolution
Theodore Garland, Jr* and Scott A. KellyDepartment of Biology, University of California, Riverside, Riverside, CA 92521, USA
*Author for correspondence (e-mail: [email protected])
Accepted 29 March 2006
THE JOURNAL OF EXPERIMENTAL BIOLOGY

2345Phenotypic plasticity and experimental evolution
not all traits are affected by alleles segregating in thepopulation at many loci, whose expression is affected bynumerous environmental factors, including both abiotic(e.g. temperature) and biotic (e.g. social interactions).Environmental factors can influence development by acting atany time after formation of the zygote, or in some cases evenbefore (e.g. maternal effects acting on the unfertilized egg).Moreover, organisms often exert some level of choice withrespect to environmental conditions that may affect their owndevelopment, such as through selection of habitat or diet (e.g.Geiser et al., 1997; Kupferberg, 1997). Whenever they act, theconsequences of environmental effects are often termeddevelopmental or phenotypic plasticity.
Directional natural selection is predicted to have variouseffects, some fairly obvious but others less so. If naturalselection in a given population favors individuals with highervalues of a particular trait, then the population mean value ofthat trait is predicted to increase from generation to generation(Fig.·2A), assuming that some additive genetic variance existsand that the trait is not too strongly genetically correlated withother traits under selection. Evolutionary biology is repletewith empirical examples illustrating the validity of thisprediction (Endler, 1986). Moving from phenotype togenotype, a second prediction is that alleles with ‘appropriate’pleiotropic effects will be favored, which would facilitate thecoordinated evolution of components of complex phenotypes.For example, if selection were to favor individuals that foraged
widely to find food, then alleles that increased motivation forhigh locomotor activity might be favored most directly, and thesubset of those alleles that also tended to increase ability forhigh activity would be particularly favored. This sort ofprocess, in which the genetic architecture of the traits involved(especially the additive genetic variance–covariance matrix)evolves to become more consistent with the prevailing patternof multivariate selection, could facilitate further evolution andadaptive radiation (e.g. Garland, 1994; Schluter, 1996). Asomewhat more subtle genetic prediction is that directionalselection should tend to favor alleles that exhibit phenotypicdominance in the direction of selection, and this has alsoreceived empirical support (e.g. Broadhurst and Jinks, 1974;Henderson, 1981; Hewitt et al., 1981; Mather and Jinks, 1982;Falconer, 1989; Garland et al., 1990; Lynch, 1994; Lynch andWalsh, 1998). For example, under a selective regime thatfavored high activity levels, alleles that promoted high activityand were dominant to alleles with neutral or negative effectson activity would be the most favored among the spectrum of‘high-activity alleles’.
A fourth hypothesis, not mutually exclusive with theprevious three, is that the average plasticity of the populationshould also evolve if the selective agent imposes more thaninstantaneous ‘stress’ (sensu Harshman et al., 1999; Wilsonand Franklin, 2002; Gabriel, 2005) on the population. Morespecifically, plasticity of the trait under selection or ofsubordinate traits that contribute to that trait should increase inthe direction that would be adaptive (tend to confer higherorganismal performance and/or higher Darwinian fitness)under the prevailing selective regime (Fig.·2B). To clarify thishypothesis, we need to distinguish between selective agentsthat (1) impose selective events that are virtually instantaneousrelative to the time course of possible plastic responses and (2)impose relatively prolonged selective events. As an exampleof an ‘instantaneous’ selective event, a cheetah (selectiveagent) chases an antelope (selective event) and the outcome(life or death for the antelope) occurs so quickly (a matter ofseconds) that the exercise physiology of the antelope has nochance to ‘train’. In addition to its own behavior, themotivation and abilities of the cheetah, and some element ofchance (e.g. tripping over a rock), what determines theoutcome of the selective event are the ‘innate’ (constitutive orintrinsic) exercise abilities of the antelope at the instant thecheetah began its pursuit. As an example of a ‘prolonged’selective event, global warming trends that occur over yearswould allow long-lived organisms to acclimatize to the highertemperatures in a way that might be beneficial (e.g.upregulation of heat-shock proteins). Thus, the Darwinianfitness of individuals in a crocodilian population experiencingenvironmental warming might depend on both innate andinduced components of heat tolerance. Of course, thedistinction between instantaneous and prolonged selectiveevents is not always clean. For example, an antelope mightlearn from a failed close encounter with a cheetah and becamebetter at avoiding capture in subsequent encounters by alteringits own behavior. The classic selective event of an ice storm
DNAProteins, etc.
OrganellesCells
TissuesOrgans
Organsystems
Organismalperformance
Behavior
Strength ofnatural or sexual
selection
Fig.·1. Complex traits, such as behavior, are composed of numerouslower-level (subordinate) traits, themselves interrelated in a stronglyhierarchical fashion. In general, natural and sexual selection will tendto act more strongly at higher levels of biological organization, asindicated by the relative thickness of the black arrows. As typicallyviewed by organismal and evolutionary biologists, selection acts onphenotypic variation (which reflects variation in gene expression), butdoes not generally act directly on genetic variation (e.g. at the levelof DNA sequences). Exceptions to this point can occur via suchphenomena as genomic conflict (e.g. Stearns and Hoekstra, 2005).
THE JOURNAL OF EXPERIMENTAL BIOLOGY
2346
that killed some (but not all) sparrows in a fortuitouslycollected sample (Bumpus, 1899; Lande and Arnold, 1983;Endler, 1986) lasted overnight, such that individual sparrowsmay have varied in thermal tolerance because of both innate
T. Garland, Jr and S. A. Kelly
and induced individual variation in components of heattolerance.
The actual mechanisms for the evolution of increasedplasticity could be several, of which we will mention two. First,
Distribution of trait inoriginal population = G1
Distribution in nextgeneration = G2
Distribution in nextgeneration = G3
Distribution in nextgeneration = G4
Distribution in nextgeneration = G5
Distribution of survivors = S1
Distribution of survivors = S2
Distribution of survivors = S3
Distribution of survivors = S4
Trait under selection
A BPlastic response of trait under
selection or of a subordinate trait
0
0
0
0
0
Fig.·2. Hypothetical example of the effects of positive directional selection favoring individuals with higher values for a particular trait on themean value of that trait (A) and on the plasticity of that trait or of a subordinate trait (B). (A) The standard expectation for the effects of positivedirectional selection on the distribution of a trait (for example, heat tolerance) across several generations. During generation one, a selectiveevent – high temperature lasting for several days – kills a majority of the individuals in the population (G1) before they can breed. The survivors(S1) of this selective event then breed and the mean heat tolerance in their offspring (G2) is somewhat higher than for their parents (G1). Thedifference in population mean phenotype between generations one (G1) and two (G2) indicates that evolution has occurred (assuming that theenvironment in which the organisms are living has not changed in a way that causes the altered phenotypes via direct environmental effects).This process continues for several generations such that the mean value of the trait in generation five (G5) is substantially higher than in generationone. (B) A hypothesis regarding the correlated evolution of the plasticity of heat tolerance or of a subordinate trait that supports heat tolerance(e.g. expression of heat shock proteins). In the original population, exposure to high temperatures for a few hours or days causes some individualsto increase in heat tolerance (which would probably be adaptive if the high temperatures continued) while an equal number of other individualsactually exhibit a decrease in heat tolerance, which would be maladaptive (inappropriate) if high temperatures persisted. For the population asa whole, the average plastic response is zero. Following a selective event and subsequent breeding of the survivors (S1), which produces thenext generation (G2), the average plastic response in this new generation tends to be an increase in heat tolerance. Thus, natural selection hascaused an evolutionary increase in both the average ‘innate’ (or ‘constitutive’ or ‘intrinsic’) heat tolerance (A) and a shift in the average plasticityof individuals (B) such that, on average, they become more heat tolerant when exposed (acutely) to high temperatures. This constitutes theevolution of adaptive plasticity. See text for discussion of possible genetic mechanisms of such a correlated response to selection.
THE JOURNAL OF EXPERIMENTAL BIOLOGY

2347Phenotypic plasticity and experimental evolution
referring to Fig.·2A, in addition to individuals whosephenotypes are intrinsically high, individuals that exhibitplasticity in the direction favored by selection will tend to beamong the ‘survivors’ each generation; thus, appropriatelyplastic individuals will be favored by phenotypic selection [seep. 67 (Falconer, 1990)]. If plasticity is heritable, then it willevolve in response to such selection (assuming geneticcorrelations with other traits under selection are not toostrong). Second, the genes that affect the constitutive value ofthe phenotype might also have pleiotropic effects (in theappropriate direction) on the plastic response of that phenotypewhen the organism experiences chronic (more thaninstantaneous) exposure to the selective agent (e.g. gradualwarming, repeated encounters with predators). The genetics ofplasticity are discussed further elsewhere (Scheiner, 1993;Pigliucci, 2005). Here it is also worth noting that the evolutionof plasticity is related to the concept of genetic assimilation, aprocess in which environmentally induced phenotypicvariation that is favored by selection (natural or artificial)gradually (across many generations) comes to be constitutivelyproduced [reviewed elsewhere in this issue (Pigliucci et al.,2006)].
The foregoing ideas about evolutionary processes wouldseem to be implied by the ‘beneficial acclimation hypothesis’(see below), but to our knowledge they have not been discussedso explicitly in the literature. In any case, we hypothesize thatthe mean plasticity of a population under directional selection(Fig.·2A) should evolve from being neutral (or possiblydeleterious) to being beneficial or adaptive (Fig.·2B). Thisevolutionary hypothesis has received little direct empiricalattention (but see Falconer, 1990; Scheiner, 2002).Nonetheless, as discussed below, many laboratory experimentsimpose selective regimes that could allow for the evolution ofenhanced plasticity (e.g. desiccation trials with Drosophila thatlast for several days), and the few that have tested forevolutionary changes in plasticity have found some evidencefor it.
When behavioral performance traits are the subject ofdirectional selection, the role of phenotypic plasticity inevolutionary response may be particularly interesting [otherperspectives on the importance of behavior have beendiscussed elsewhere (Huey et al., 2003; Price et al., 2003;Price, 2006)]. The term ‘self-induced adaptive plasticity’ wasproposed (Swallow et al., 2005) for situations in which abehavior induces plastic changes in morphological orphysiological traits that in turn enhance the ability to performthe behavior. For example, animals that migrate altitudinallymight make ‘trial runs’ that would cause cardiovascular,pulmonary or metabolic changes that would improve theirability to function at high altitude. Similarly, animals that beginfeeding on a new type of food may experience changesin digestive enzymes that increase efficiency of nutrientextraction and/or detoxification [examples of related effects ofdiet are reported elsewhere, including references therein(Geiser et al., 1997; Kupferberg, 1997)].
The first purpose of this paper is to provide a brief
introduction to phenotypic plasticity from an ecological andevolutionary perspective [see also elsewhere in this issue(Fordyce, 2006; Pigliucci et al., 2006; Price, 2006)]. Second,we discuss how the evolution of plasticity can be studied, withan emphasis on the experimental evolution approach. Finally,we review some results from a study on the experimentalevolution of high voluntary activity levels in house mice,including examples of self-induced adaptive plasticity.
Defining phenotypic plasticityFrom the perspective of evolutionary biology, classic and
dramatic examples of phenotypic plasticity in animals includewing polymorphisms in some insects, the timing ofmetamorphosis in amphibians, and alternative reproductivetactics in male vertebrates – all of which exhibit complexneuro-endocrine control mechanisms that are sensitive tovarious environmental factors (Ketterson and Nolan, Jr, 1999;Sinervo and Calsbeek, 2003; Boorse and Denver, 2004; Knapp,2004; Zera, 2004). From the biomedical perspective, well-known examples of plasticity include effects of intentionalphysical conditioning (exercise training) (Flück, 2006) such asweight lifting, on human morphology and physiology. Variousbiomedical subfields use additional terminology, such as‘metabolic plasticity’ or ‘cardiac remodeling’, and themolecular mechanisms underlying such processes as muscularand neuronal plasticity are the subject of intensive study [forreviews, see other articles in this issue (Flück, 2006; Hood etal., 2006; Johnston, 2006; Magistretti, 2006; Swynghedauw,2006)]. (Many environmental insults, e.g. excessive alcoholconsumption, smoking, inhalation of coal dust, can lead to‘plastic’ changes in organs and organ systems, but when suchchanges are clearly pathological they are not typically includedunder the rubric of phenotypic plasticity.) In plants, basicgrowth form is notoriously plastic, and many readers will befamiliar with the differences between dandelions growing inshade versus sun [although genetic differences among clonesmay also be involved (Collier and Rogstad, 2004)].
As with the term ‘adaptation’ (see below), phenotypicplasticity can refer both to a process and to the outcome of thatprocess. Phenotypic plasticity can be defined formally as theability of one genotype to produce more than one phenotypewhen exposed to different environments, as the modificationof developmental events by the environment, or as the abilityof an individual organism to alter its phenotype in response tochanges in environmental conditions (Gordon, 1992; Scheiner,1993; Via et al., 1995; Futuyma, 1998; Freeman and Herron,2004; Pigliucci, 2005; Rezende et al., 2005; Stearns andHoekstra, 2005; Pigliucci et al., 2006). The range ofphenotypes that a given genotype (possessed by an individualorganism or by an entire clone or inbred line) may producewhen exposed to a range of environmental conditions is termedits norm of reaction, and non-parallel reaction norms ofdifferent genotypes indicate the presence of genotype-by-environment interaction.
The sequence of events involved in phenotypic plasticity
THE JOURNAL OF EXPERIMENTAL BIOLOGY

2348
often includes the following components: (1) something in theenvironment changes; (2) the organism senses that change; (3)the organism alters gene expression; and (4), usually, thealtered gene expression yields additional observablephenotypes [e.g. see fig.·8 in Flück’s paper in this issue (Flück,2006)]. Several aspects of this scenario require amplification.With respect to (1), we may attempt to draw a distinctionbetween environmental factors that are external or internal toan organism. Changes in ambient temperature, humidity oroxygen concentration would constitute external environmentalfactors, and many organisms respond to these with phenotypicplasticity that involves multiple organ systems and multiplelevels of biological organization. Mechanical overload of theheart is an example of an environmental change that occurswithin an organism, and it leads mainly to organ-specificchanges that necessarily involve fewer levels of biologicalorganization (Swynghedauw, 2006). Of course, externalenvironmental ‘stresses’ can also lead to tissue-specificresponses (e.g. Cossins et al., 2006). Nonetheless, we maypredict that, in general, external environmental changes willlead to more and more pervasive plastic responses as comparedwith internal changes. With respect to (2), some changes mayoccur without any formal sensing by the organism, e.g. as aresult of direct (and possibly differential) effects oftemperature on the rates of ongoing biochemical andphysiological processes. With respect to (3), it is important tonote that some plastic responses need not involve changes ingene expression (transcription) but instead could occur viaphosphorylation of existing proteins, changes in protein levelscaused by variation in protein ubiquitination, or stimulation ofexisting microRNAs (Nelson et al., 2003; Schratt et al., 2006).For point (4) we emphasize the word ‘usually’ because it ispossible that lower level traits might change in offsetting wayssuch that higher level traits could show little or no apparentchange. For example, it would be theoretically possible(though perhaps unlikely) for exercise training to cause anincrease in maximal heart rate but a reduction in stroke volumesuch that cardiac output was unchanged.
Acclimation and acclimatization (Wilson and Franklin,2002), as well as learning and memory (e.g. Magistretti, 2006),are encompassed by the most inclusive definitions ofphenotypic plasticity. Therefore, environmentally inducedchanges may or may not be reversible, depending on theorganism, trait, and when in the lifecycle and for how long theenvironmental exposure occurs (Hatle, 2004; Johnston, 2006).If the capacity for change is more-or-less fully reversible, thenit may be termed phenotypic flexibility (Piersma andLindstrom, 1997).
Whether reversible or not, it is generally assumed thatenvironmentally induced modifications are adaptive in thesense that they improve organismal function and/or enhanceDarwinian fitness of the individual organisms that exhibit sucheffects (Nunney and Cheung, 1997). In fact, this may or maynot be true, and the claim that such changes will aid theorganism has been termed the beneficial acclimationhypothesis (Leroi et al., 1994; Huey and Berrigan, 1996; Huey
T. Garland, Jr and S. A. Kelly
et al., 1999; Wilson and Franklin, 2002). In some cases,behavioral plasticity can shield lower level traits from selection(Huey et al., 2003; Price et al., 2003). At the population level,phenotypic plasticity in behavior and other traits can facilitateinvasions of new habitats (Price et al., 2003; Price, 2006;Pigliucci et al., 2006). As reviewed elsewhere in this issue(Fordyce, 2006), many ecological (cross-species) interactionsare mediated by the phenotypically plastic responses of one ormore species involved in the interaction. Some of theseecological interactions can be quite complex and difficult topredict, as when an herbivore induces a plant phenotype thatin turn affects the performance of other herbivores (Fordyce,2006)
At this point it is worth remembering that the wordadaptation has numerous meanings in biology (Garland andCarter, 1994; Bennett, 1997). Most generally, we should keepin mind the distinction between what is often called‘physiological adaptation’ (environmentally induced changesthat occur within individual organisms during their lifetimes,including acclimation and acclimatization) and ‘evolutionaryadaptation’ (cross-generational changes in the geneticcomposition of a population in response to natural selection).Physiological adaptation is one type of phenotypic plasticity,but the ability to be plastic for any particular trait may also bean evolutionary adaptation whose details vary amongorganisms.
As noted above, although biologists have usually assumedthat physiological adaptation is adaptive in the evolutionarysense, this is not always a safe assumption because somechanges will be simply the result of activation of controlsystems designed to do something else, and they can even bemaladaptive, including various human pathologies (Nesse,2005; Swynghedauw, 2006). In general, non-adaptiveplasticity might be expected to occur any time that an organismis exposed to environmental conditions with which it is‘unfamiliar’ in terms of its evolutionary history. This followsfrom the general evolutionary principle that organismsgradually lose abilities and traits that are no longer underpositive selection, well-illustrated by things like blind cave fishor flightless birds on islands that lack predators (Diamond,1986). Thus, imagine a species that has inhabited low-elevationenvironments for millions of years, adapting evolutionarily tofunction (reasonably) well in ‘normal’ levels of atmosphericoxygen (~21%). If one were to expose individuals of thisspecies to high altitude, then they might be expected to exhibitinappropriate physiological responses to reduced atmosphericoxygen. The literature on human physiological responses tohigh altitude, both acute and chronic, is interesting in thiscontext because it offers conflicting views on whether and towhat extent various changes are adaptive versus maladaptive,and whether long-term, high-altitude native populationsexhibit evolutionary adaptations to hypoxia (e.g. Winslow etal., 1989; Beall, 2001; Brutsaert et al., 2005; Norcliffe et al.,2005; Wu et al., 2005). More generally, it is worth notingthat the environment that many human beings experience(including aspects of nutrition, sanitation, medicine and the so-
THE JOURNAL OF EXPERIMENTAL BIOLOGY
2349Phenotypic plasticity and experimental evolution
called built environment) has changed very rapidly relative toour generation time. Concomitantly, average lifespan hasincreased in many countries and diseases associated with aginghave become much more common (e.g. Swynghedauw, 2006).Therefore, it may be expected that at least some aspects of ourphenotypic plasticity may not be adaptive.
To be or not to be: when should plasticity evolve?Intuitively, plasticity might be good or bad, depending on
the amount of spatial heterogeneity in the environment, thespeed of temporal environmental changes, the predictability ofspatial and temporal heterogeneity, and the size or duration ofheterogeneity relative to an organism’s mobility and lifespan.From a formal theoretical perspective, the evolution ofplasticity has been studied with optimality models, quantitativegenetic models, and gametic models (Scheiner, 1993).Generally, all of these models suggest that adaptive plasticitywill evolve when environmental heterogeneity exists,environmental cues about that heterogeneity are somewhatreliable, plastic responses confer a net fitness benefit, and thepopulation contains some additive genetic variance for theplastic response (Berrigan and Scheiner, 2004). With regard tospatial variability, optimality, quantitative genetic and gameticmodels all predict further that plasticity is most favored when(1) inter-habitat variability is high, (2) all habitats are equallyregular, (3) selection acts equally strongly across habitats, (4)the environmental cue-dependent phenotype is correlated withthe environment of selection, (5) habitat selection is correlatedwith trait plasticity [for specific references, see elsewhere(Scheiner, 1993)].
Phenotypic plasticity is typically induced by environmentalheterogeneity or environmental stress (Harshman et al., 1999;Wilson and Franklin, 2002; Berrigan and Scheiner, 2004;Gabriel, 2005). In this context, ‘stress’ is generally taken tomean anything that threatens physiological homeostasis(e.g. Sapolsky, 2005) and/or reduces Darwinian fitness.Environmental stress can be categorized into biotic (e.g.predator presence) versus abiotic (e.g. ambient temperature),and either type may cause changes in behavior, morphology,and/or physiology (Gabriel, 2005). If the mean fitness ofindividuals with plastic strategies exceeds the mean fitness ofthose with fixed strategies, then phenotypic plasticity orflexibility will tend to evolve (Scheiner, 1993; Berrigan andScheiner, 2004; Gabriel, 2005). Environment tolerance curveshave been defined as ‘the response of a genotype’s total fitnessover an environmental gradient’ (Lynch and Gabriel, 1987),distinguishing this as a special case of the norm of reaction,and using them to predict when irreversible plasticity will tendto evolve.
However, as noted elsewhere, ‘If stress periods are shortcompared to the life-time of an organism, then irreversiblephenotypic plasticity is unlikely to be a favorable response’(Gabriel, 2005). Therefore, Gabriel proposed modelspredicting the selective advantage of reversible plasticity(phenotypic flexibility) (Gabriel, 1999; Gabriel, 2005). He
concluded (Gabriel, 2005) that ‘... reversible phenotypicplasticity would be expected for all organisms under thefollowing conditions: they are exposed to stress periods thatlast shorter than life span; stress appears in the long run withsome regularity so that natural selection can shape non-induced and induced values of adaptive plastic traits.’ In thesemodels, he assumed that plasticity was not costly, with therationale that ‘Plasticity costs would usually enter as constantfactors that do not alter the optimal values of mode andbreadth’ [see p. 875 (Gabriel, 2005)]. He added the caveat that‘if plasticity costs depend significantly on the amount ofperformed phenotypic change, then costs might become afunction of the environmental state during stress in a way thatthe optimal values of mode and breadth are affected’ (p. 875),but concluded by arguing that ‘given the predicted huge fitnessadvantages, the cost of plasticity would have to beunexpectedly high in order to counteract selection forreversible phenotypic plasticity’ (pp. 880–881). Thus, it isimportant to remember Pigliucci’s point on p. 483 (Pigliucci,2005) that ‘Research of costs of plasticity is still in its infancy,but is both theoretically important and empiricallychallenging, and should become a major area of futureinquiry.’
Studying the evolution of plasticityAs discussed above, natural selection ought to affect
plasticity, and organisms ought to vary in plasticity. How canwe test such theoretical predictions? In general, the same waythat we may seek to study adaptation in any sort of trait. Fourgeneral approaches to studying adaptation are commonly usedby evolutionary biologists (e.g. see Huey and Kingsolver,1993; Garland and Carter, 1994; Bennett, 1997; Futuyma,1998; Schlichting and Pigliucci, 1998; Feder et al., 2000;Orzack and Sober, 2001; Pigliucci, 2001; Freeman and Herron,2004; Stearns and Hoekstra, 2005). First, as outlined in theprevious section, real organisms can be compared withpredictions of theoretical models, such as those based onoptimality (e.g. Garland, 1998; Orzack and Sober, 2001).Second, examinations of the biology of natural populations candetermine what sorts of traits vary, are heritable, and arecurrently under sexual or natural selection (e.g. Young et al.,2004). Experimental manipulations of putatively adaptivetraits are often employed in such studies (e.g. Sinervo andBasolo, 1996; Ketterson and Nolan, Jr, 1999) and pp. 224-229(Costa and Sinervo, 2004). Although several studies haveattempted to quantify how natural selection acts on plasticityin the field (e.g. Trussell, 1997; Donohue et al., 2000; Nusseyet al., 2005), this area of investigation will not be covered here.Third, one can compare species (or populations) that vary withrespect to ecological factors that might cause variation in howselection ‘views’ plasticity [overviews of studying adaptationvia ‘the comparative method’ and with a phylogeneticperspective have been published previously (Garland andAdolph, 1994; Garland et al., 2005)]. In the followingsubsection, we provide a brief summary of some comparative
THE JOURNAL OF EXPERIMENTAL BIOLOGY

2350
studies of plasticity. Finally, selection experiments (Bennett,2003; Garland, 2003; Swallow and Garland, 2005) can beused to study adaptation, and this is our main focus, withemphasis on those that would qualify as ‘experimentalevolution’ (e.g. Rose et al., 1996; Rose et al., 2004; Ebert,1998; Bennett, 2002; Bennett, 2003; Swallow and Garland,2005) (http://en.wikipedia.org/wiki/Experimental_evolution).
Comparative studies
Vertebrate morphology and physiology provide dramaticexamples of both inter-specific and inter-trait variation inplasticity [plasticity of the water barrier in vertebrateintegument is reviewed elsewhere (Lillywhite, 2004)]. Withrespect to variation among traits, vertebrate skeletal muscle(Flück, 2006) and the gastrointestinal tract (Secor, 2005) arevery responsive to use and disuse (‘training’ and ‘detraining’effects). Bone size, shape and architecture also change inresponse to variation in loading conditions, but to a muchsmaller extent than for muscle [for example, compare (Houle-Leroy et al., 2000) with (Kelly et al., 2006)]. Adult vertebratelung also seems to have relatively low plasticity (e.g. Hoppeleret al., 1995; Weibel, 2000; Hsia, 2001; Henderson et al., 2002).In plants, one study shows that aspects of gas exchange maybe more plastic than structural traits (Valladares et al., 2000).
Interspecific variation in plasticity has also beendocumented. In vertebrates, for example, attempts at aerobicexercise training (to improve cardiopulmonary and/ormuscular function) of lizards have generally not beensuccessful, even when patterned after those that cause largechanges in mammals (Garland and Else, 1987; Conley et al.,1995) (A. Szucsik, personal communication). In amphibiansand squamates, species differences in gut plasticity seem to berelated to their feeding ecology, in particular the frequencyand/or regularity of feeding (Secor, 2005). In Burmesepythons, ventricular mass can increase 40% within 48·h afterfeeding, a change that is fully reversible (Andersen et al.,2005). Among species of fishes, carp and goldfish seem to beespecially plastic (Cossins et al., 2006; Johnston, 2006). Inplants, a common-garden study of 16 shrubs in the genusPsychotria showed that species found in the understory, wherelight is less variable, showed less plasticity for a variety oftraits as compared with species that generally occur in forestgaps, where light is more variable (Valladares et al., 2000).Population differences in plasticity have also receivedconsiderable attention in plants, with several studies suggestingthat the they are indeed adaptive (e.g. Cook and Johnson, 1968;Donohue et al., 2000).
Selection experiments and experimental evolution
Selection experiments have provided valuable insights intocentral questions surrounding the evolution of phenotypicplasticity (see Scheiner, 2002). At their most basic, they havedemonstrated that the plasticity of a trait is often heritable,capable of responding rapidly to selection, and determined bymultiple genetic loci. [A genetic basis for the response toaerobic exercise training has also been demonstrated in human
T. Garland, Jr and S. A. Kelly
twin studies (references in Koch et al., 2005).] In addition,selection experiments have shown that plasticity(environmental sensitivity) of a given trait can evolveindependently of the population mean value for that trait. Morespecifically, experiments with plants and invertebrates haveshown plasticity to evolve in response to selection (1) directlyon the reaction norm, (2) on a single trait in one environment,and (3) on a single trait across multiple environments. Withrespect to vertebrates, although many selection experimentshave been performed, very few have focused on phenotypicplasticity as a component of the response to selection(Falconer, 1990; Scheiner, 2002).
The reaction norm has been directly selected upon inDrosophila melanogaster, the butterfly Bicyclus anynana, andthe tobacco plant Nicotina rustica (Scheiner, 2002). We willonly highlight the experiment performed by Scheiner andLyman (Scheiner and Lyman, 1991), as it appears to be themost comprehensive and has also been reviewed in detail(Scheiner, 2002).
The stated purpose in Scheiner and Lyman’s experiment(Scheiner and Lyman, 1991) was to determine if plasticitycould respond to selection that was imposed under controlledand reproducible conditions. They began by capturing 301individual D. melanogaster from the wild. These flies foundeda stock that was maintained in the laboratory by mass cultureat 21°C for 2–3 months (several generations), thus establishinga genetically heterogeneous base population. They then used50 randomly chosen pairs to establish each of 14 separateexperimental lines, which comprised two replicates of each ofsix selection regimes (increased thorax size at 19°C, decreasedthorax size at 19°C, increased thorax size at 25°C, decreasedthorax size at 25°C, increased plasticity, decreased plasticity)plus a control line that was not intentionally selected. Toimpose selection, plasticity was defined as the difference inaverage thorax length for sets of full-sibs raised at 19°C and25°C. Plasticity did indeed respond to selection, but with arather low realized heritability of 0.088±0.027 (mean ± s.e.m.).The authors concluded that the plasticity was not the resultof overdominance, but rather a genetic interaction amongmultiple loci.
As noted above, the evolution of phenotypic plasticity hasalso been examined as a correlated response to selection on aspecific trait in a single environment. For example, Harshmanet al. (Harshman et al., 1991) studied detoxification enzymesin D. melanogaster. After establishing a base population fromwild-caught flies, three Control (C) lines were reared onstandard medium and three Selected (S) lines on lemon for 20generations. For the lemon-cultured lines, the selection processwas as follows: (1) flies were placed in bottles with freshly cutlemon (10·g, pesticide free) at room temperature for 7–10 days;(2) approximately 50% mortality occurred; (3) survivors wereplaced into a new bottle of freshly cut lemon (30·g) andvermiculite to produce the next generation. According toHarshman et al., the 50% mortality (during the lemon selectionepisodes) may have been caused by natural insecticide activityin lemons, or by toxins produced by bacteria growing on the
THE JOURNAL OF EXPERIMENTAL BIOLOGY
2351Phenotypic plasticity and experimental evolution
fruit (Harshman et al., 1991). Flies (35–70) were randomlymated to produce the subsequent generation in all six lines. Inthe Control lines, flies were transferred to fresh medium formating.
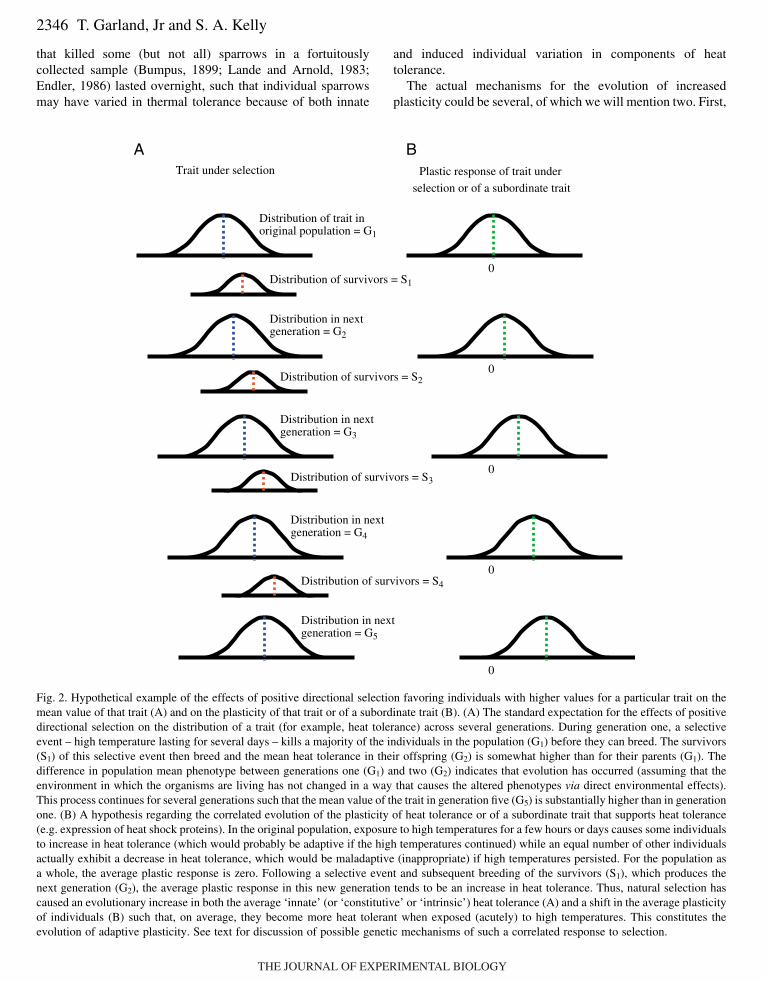
After 20 generations, all flies to be tested were rearedon ordinary medium for one generation to standardizeenvironmental conditions. They were then transferred toeither lemon (which may induce the expression ofdetoxification enzymes) or fresh medium (to allowdetermination of enzyme activities under baseline conditions)for 24·h prior to sacrifice. Activities of epoxide hydrolasesand glutathione S-tranferase (GST) were then measured. ForGST measured using trans-stilbene oxide (TSO) as asubstrate, S and C lines showed no significant difference forthe sample exposed to fresh medium for 24·h, but the S linesshowed substantially higher enzyme activities than C lineswhen lemon-exposed for 24·h (Fig.·3). Harshman et al.concluded (Harshman et al., 1991): ‘After 20 generationson lemon there was a pronounced change inenvironment-dependent expression... The response appearedindependently in all three lines on lemon.’ They also notedthat: ‘In the present study the culturing regime used wasostensibly continuous, unless the process of lemon rottingevery generation constitutes temporal variation. Normally,one would anticipate selection for change in environment-dependent enzyme expression to occur in variableenvironments but the results of the present study suggest it
can evolve in a relatively constant regime.’ Harshman et al.give additional examples in which the plasticity of an enzymeactivity seems to have evolved as a correlated response(Harshman et al., 1999).
In numerous other selection experiments where plasticitycould potentially evolve (because the selection regime is morethan instantaneous), plasticity of the selected trait or ofpotentially related or subordinate traits does not appear tohave been examined. In one such example (Bubliy andLoeschcke, 2005), correlated responses to selection for stressresistance and longevity in a laboratory population of D.melanogaster were examined. Several selection regimes wereimposed in this experiment: cold-shock resistance selection,heat-shock resistance selection, heat knockdown resistanceselection, desiccation resistance selection, starvationresistance selection and longevity selection. Here we discussthe cold-shock resistance selection line, for which selectionwas imposed for 21 generations. The selection regime was asfollows. Flies were maintained on standard medium for 5 daysat 11°C for acclimation, then placed in empty vials andexposed to 0.5°C for 27–50·h with relative humidity near100%. Surviving flies were allowed to recover for 24·h at25°C in vials with standard medium, then allowed toreproduce. We would argue that plasticity of traits that maysupport cold resistance in D. melanogaster could potentiallybe altered during the acclimation phase of this selectionprotocol. Furthermore, plasticity of traits that may supportcold resistance may be evolving across generations. Althoughphenotypic plasticity apparently has not been investigated inthese flies, we contend that selection experiments of this typeshould explore whether plasticity has increased as acomponent of the response to selection. In the followingsection, we discuss an ongoing experiment with house micethat has begun to examine plasticity in various traits as apotential correlated response to artificial selection for highvoluntary wheel running, as expressed during days 5 and 6 ofa 6-day exposure to wheels.
Selective breeding for high voluntary wheel running inhouse mice
Since 1993 our laboratory has been conducting a replicatedselection experiment for high voluntary wheel-runningbehavior on days 5+6 of a 6-day wheel exposure. By housingmice from each of the four replicate S lines and from each ofthe four replicate C lines with or without wheel access forseveral days or weeks, we can test for differences in plasticity(training effects) in various traits. As outlined in the remainderof this section, we have found several traits that show greaterdifferences between S and C lines when they are housed withwheel access than when they are housed without wheel access(or, in some cases, housed with access to wheels that are lockedto prevent rotation). For some of these traits, the greaterdifferences can be explained statistically by the greater wheelrunning exhibited by mice from S lines. For others, however,the differences seem to reflect greater plasticity in the S lines
Fig.·3. Example of a selection experiment (20 generations) withDrosophila melanogaster (Harshman et al., 1991) in which plasticityevolved to be higher in the Selected lines (S; N=3) as compared withthe Control lines (C; N=3). C flies (left) were exposed to eitherstandard medium or lemon for 24·h prior to sacrifice for measurementof a detoxification enzyme, and S flies (right) were similarly treated.Values are means ± s.d. For C lines, the magnitude of the inductioncaused by lemon exposure, as indicated by glutathionase S-transferaseactivity on lemon divided by the value on standard medium, was 1.16,whereas for S lines the value was 2.58. The greater induction causedby lemon exposure in the S lines relative to the C lines is an exampleof a genotype-by-environment interaction. TSO, trans-stilbene oxide.See text for further details.
800
700Cytosolic preparations, using TSO
600
500
400
300
200
100
Glu
tath
ione
S-t
rans
fera
se a
ctiv
ity(p
mol
min
–1 m
g–1 p
rote
in)
C, Med
ium
C, Lem
on
S, Med
ium
S, Lem
on0
THE JOURNAL OF EXPERIMENTAL BIOLOGY

2352
[i.e. for a given amount of stimulus (wheel running/day),individuals in the S lines show a greater response than in theC lines].
Animals and experimental protocol
The original progenitors (founding population) wereoutbred, genetically variable house mice (Mus domesticus) ofthe Hsd:ICR strain (Harlan-Sprague-Dawley, Indianapolis, IN,USA). After purchase from HSD, mice were randomly matedfor two generations, paired, and then assigned randomly toeight closed lines (10 pairs in each). Four of these lines havebeen designated to experience selective breeding for highvoluntary activity (lab designation, lines 3, 6, 7, 8) and fourserve as controls (lines 1, 2, 4, 5).
The selection protocol has been described in detail elsewhere(Swallow et al., 1998a). In brief, when each generation of miceare 6–8 weeks old, they are housed individually with access torunning wheels (circumference=1.12·m) for 6 days. Dailywheel-running activity is monitored with photocell counterslinked to a computer-automated system. Wheel activity isrecorded in 1-min bins for 23–24·h of each of the 6 days of wheelaccess. For purposes of selection, wheel running is quantified asthe total number of revolutions on days 5 and 6 of the 6-day test.After accounting statistically for any variation related tomeasurement block, age, wheel resistance, and sex, breeders arechosen. In the four S lines, the highest running male and femaleare chosen from each family as breeders to propagate the linesof the next generation. Within-family selection is performed toincrease the effective population size (Ne), while reducingmaternal and environmental variances, including effects ofgenotype-environment interactions (Henderson, 1989). In thefour C lines, breeders are randomly chosen from each family.Within all lines, sibling matings are disallowed.
By generation 16, the high-activity lines exhibited a 170%increase in total revolutions/day as compared with the C lines.This was caused primarily by S mice running faster rather thanfor more minutes each day, but the relative importance of thetwo components differs between the sexes, with females fromthe S lines typically showing little or no increase in amount oftime running whereas males do show an increase in timerunning (Swallow et al., 1998a; Koteja et al., 1999a; Koteja etal., 1999b; Rhodes et al., 2000; Girard et al., 2001). Thisincrease in wheel running greatly exceeds that of wild housemice born and raised under the same conditions (Dohm et al.,1994), and comes close to spanning the range of variation thathas been reported among 13 species of wild murid rodents(Garland, 2003). Therefore, it seems that we have anevolutionarily ‘important’ amount of divergence in wheelrunning between the S and C mice. Additionally, based onhigh-speed video analyses, estimates of instantaneous runningspeeds have shown that S line females run twice as fast as Cline females, as well as more intermittently (Girard et al.,2001). However, since approximately generation 16, thedifferential in wheel-running distances has remained relativelyconstant, indicating that a selection limit or plateau may havebeen attained.
T. Garland, Jr and S. A. Kelly
Plasticity of wheel runningBecause our wheel-testing protocol is prolonged (6 days)
rather than instantaneous (e.g. a few minutes), it is possible thatthe S lines may have evolved greater plasticity in this behavior.In other words, as compared with the C lines, mice from S linesmight now exhibit a greater increase in wheel running across
Fig.·4. Hypothetical trajectories for the amount of voluntary wheelrunning across a 6-day test period, as implemented in the selectivebreeding experiment with house mice. (A,B) Examples of greaterplasticity in the Selected lines (S; black circles) than in the Controllines (C; gray squares). (C) Similar relative increases in wheel runningon a day-to-day basis, but greater absolute increases in the S lines.See text for discussion.
0
2000
4000
6000
8000
10 000
12 000
14 000
16 000
0
2000
4000
6000
8000
10 000
12 000
14 000
16 000
0
2000
4000
6000
8000
10 000
12 000
14 000
16 000
A
S/C:
No.
of
revo
lutio
ns
B
S/C:
Day
0 1 2 3 4 5 6
C
S/C: 3 3 3 3 3 3
1 1 1 1 3 3
2 3 4 5 6 7
THE JOURNAL OF EXPERIMENTAL BIOLOGY

2353Phenotypic plasticity and experimental evolution
the 6 days of wheel access, given that only their performanceon days 5+6 affects their probability of reproducing. Fig.·4shows some hypothetical examples of how plasticity might begreater in the S lines. In Fig.·4A, Control lines show constancyof wheel running, whereas S lines increase monotonicallyacross days 1–6; clearly, plasticity is greater in S lines. InFig.·4B, wheel running is identical and increases gradually inboth S and C lines over the first four days of testing. Selectedlines then show a much greater increase between days 4 and5, thus indicating greater plasticity during this time period. Inthese two cases, the greater plasticity of S as compared with Clines is reflected in the ratio of S/C (see Fig.·4A,B).
In the case of Fig.·4C, the interpretation is morecomplicated. Both S and C lines increase monotonically acrossdays 1–6. On an absolute basis, S lines increase more (2000)than C lines (667) on each day. Relative to their own startingvalues, however, S and C lines increase by the same percentageeach day, although this increase becomes smaller each day (40,29, 22, 18 and 15%, respectively). As a result, the S/C ratio isa constant. Thus, whether one considers the S and C lines todiffer in plasticity depends on whether absolute or relativevalues are considered.
Fig.·5 shows example data from our selection experiment,and the pattern resembles the one shown in Fig.·4C. Asreported elsewhere (Belter et al., 2004), 48 female mice fromgeneration 23 were studied. As shown in Table·1, S lines ransignificantly more than C on every day. A repeated-measuresANOVA (SAS Proc Mixed with autoregressive error structure)indicated highly significant effects of day (P<0.0001) and linetype (P=0.0001), but no significant day-by-line type interaction(P=0.7184). The foregoing results suggest that S lines do notexhibit a greater plasticity in wheel running.
On the other hand, the difference between total revolutionson day 6 and day 1 was considerably higher, on average, for S
lines (5658) than for C lines (2112). This greater absoluteincrease in wheel running across 6 days is not statisticallysignificant (P=0.1047), but becomes significant (P=0.0325)when one outlier is removed. This was an S individual whosewheel running declined anomalously from 14·375 on day 1 to7603 on day 6, the greatest decline for any mouse in the sampleof 48. This may represent a real phenomenon, or it mightindicate a problem with the wheel on day 6. We intend toexplore the plasticity of wheel running more in future studies,with larger sample sizes. In any case, we believe that thegreater increase in wheel running across the 6-day trial maywell have biological significance, and may well have requiredcoadaptational changes in one or more subordinate traits thatsupport wheel running.
Fig.·5. Wheel running of 48 female mice from generation 23 (Belteret al., 2004), with Selected lines (S) depicted by black circles andControl lines (C) as gray squares. Values are least-squares (adjusted)means from ANOVA, as shown in Table·1. Compare with Fig.·4C.
Table·1. Total revolutions during 6 days of wheel access for Control and Selected female mice from generation 23 (Belter et al.,2004)
Total no. of revolutions
Trait Control Selected S/C Ratio P
Day 1 3071±822 8509±746 2.77 0.0017Day 2 4965±1234 12128±1153 2.44 0.0041Day 3 3822±800 11379±678 2.98 0.0001Day 4 4752±1219 13063±1074 2.75 0.0012Day 5 5105±994 13277±819 2.60 0.0003Day 6 5153±1031 14141±878 2.74 0.0002Day 6–Day 1 2112±1506 5658±1365 2.68 0.1047*log10 (Day 6/Day 1) 0.2525±0.0723 0.2236±0.0649 0.7541
Values are least-squares (adjusted) means ± s.e.m. (N=48).P-values are for two-tailed tests comparing Control and Selected lines.Data were analyzed by mixed-model nested ANCOVA in SAS Proc Mixed version 8. The effect of line type (selected vs control) was tested
over replicate lines nested within line types (d.f.=1,6), and replicate lines were considered a random factor nested within line type. Age wasentered as a covariate and ‘mini-muscle’ was entered as an additional factor in all analyses; neither was ever statistically significant (allP>0.05).
*If one statistical outlier is removed, the line type effect becomes significant (P=0.0325).
S/C: 2.77 2.44 2.98 2.75 2.60 2.74
0
2000
4000
6000
8000
10 000
12 000
14 000
16 000
No.
of
revo
lutio
ns
Day
0 1 2 3 4 5 6
THE JOURNAL OF EXPERIMENTAL BIOLOGY

2354
Apparent exercise adaptations in the high-activity linesA main goal of the selection experiment was to identify traits
that have evolved in concert with increased activity levels andthat may be necessary for them, i.e. evolutionary adaptationsfor the high wheel running. Several considerations make thisgoal non-trivial. First, exercise physiology is complicated, andwe have not examined all possible subordinate traits that couldbe key in terms of allowing high wheel running. Second, ofthose traits that have been examined, not all have beenexamined in the same generation. Some adaptations may haveoccurred in earlier generations and others in later ones, andindeed those occurring in later generations may even havesupplanted some that occurred earlier. Third, adaptations mayonly exist, or at least be more developed, around the age atwhich wheel testing normally occurs, which is 6–8 weeks ofage. Fourth, adaptations may only exist on days 5 and 6 ofwheel testing, i.e. they require some days of wheel access todevelop. Fifth, adaptations may to some extent be sex-specific,especially given that females in the S lines have increased totalactivity almost entirely by running faster, whereas males alsoshow an increase in amount of time spent running. Given thatwe have not studied both sexes, at all ages, under all possiblehousing conditions (e.g. with or without wheel access), letalone in every generation, we may well have missed some keyadaptations. With those cautions in mind, we have discovereda number of traits that seem to represent adaptations for highwheel running in the S lines. We review the motivational basisfor high wheel running elsewhere (Rhodes et al., 2005).
Mice from the selected lines have higher maximal oxygenconsumption during forced treadmill exercise (VO2max),especially in males (Swallow et al., 1998b; Rezende et al.,2006a; Rezende et al., 2006b) and higher insulin-stimulatedglucose uptake in the extensor digitorum longus muscle[located in the hindlimb (Dumke et al., 2001)]. Mice from Slines have larger femoral heads and more symmetricalhindlimb bone lengths (Garland and Freeman, 2005; Kelly etal., 2006). Interestingly, S lines exhibit reduced hindlimbmuscle mass, especially in two lines that contain a Mendelianrecessive allele that halves hindlimb muscle mass whileincreasing mass-specific aerobic capacity and having a varietyof other pleiotropic effects (Garland et al., 2002; Houle-Leroyet al., 2003; Swallow et al., 2005; Syme et al., 2005; Kelly etal., 2006). The S and C lines differ with respect to many othertraits as well, such as higher plasma corticosterone levels(Girard and Garland, 2002) and reduced body fat in S lines(Swallow et al., 2001; Dumke et al., 2001). We are currentlyattempting to determine which of these are adaptations thatenhance wheel-running ability, as opposed to non-adaptive(and possibly even maladaptive) correlated responses.
Plasticity of exercise-related traits
Many traits (e.g. heart mass, VO2max) that one might expectto evolve as a correlated response to selection for high activitylevels are also known to respond to the amount of exercise thatan individual organism exhibits. Indeed, the literature onmammalian training effects is immense, in part because of our
T. Garland, Jr and S. A. Kelly
interest in competitive athletics but also because manyexercise-related traits are known or thought to be important inpromoting physical and/or psychological health (Booth et al.,2002; Castaneda et al., 2005) (Health Activity Center:www.cvm.missouri.edu/hac/index.html). Given that mice fromthe S lines run more than C when given wheel access, theymight also be expected to exhibit greater training responses(physical conditioning) over a given period of time, such asseveral weeks.
Imagine that groups of both S and C mice were housed either
Fig.·6. Hypothetical relations between a phenotypic trait and theamount of running exhibited during the final week of a multi-weekexposure to wheels. In both A and B, it is assumed that mice housedwithout wheels (not shown) would have values of the phenotypelower than or equal to (about 24) those exhibited by Control micehoused with wheels. (A) The greater phenotypic values for theSelected lines (S; black circles) as compared with Control lines (C;gray squares) are explainable statistically by their greater amount ofrunning (‘more pain, more gain’). A real example of this patterninvolves the level of brain-derived neurotrophic factor (BDNF) in thehippocampus of S and C mice after 1 week of access to runningwheels [see fig.·2 (Johnson et al., 2003)]. (B) There is no relationbetween the amount of running and phenotype within either group andfor a given amount of running the increase in phenotype (relative tothe values when mice do not have wheel access) is greater for selectedlines than for C lines. Hence, S lines exhibit a greater plastic response.See text for further explanation.
18
20
22
24
26
28
30
32
34
0 5000 10 000 15 000 20 000
0 5000 10 000 15 000 20 000
Higher values for Selectedlines explainable by theirgreater running
Selected linesnot more plastic
A
18
20
22
24
26
28
30
32
34 Selected linesare more plastic
Higher values for Selectedlines not explainable bytheir greater runningB
Hyp
othe
tical
phe
noty
pe
Running during final week (revs day–1)
THE JOURNAL OF EXPERIMENTAL BIOLOGY

2355Phenotypic plasticity and experimental evolution
without (sedentary group) or with (active group) access to arunning wheel for 8 weeks (e.g. Swallow et al., 2005). Imaginefurther that for mice housed without wheels, we observed nodifference in some phenotype, such as hematocrit. For themice housed with running wheels, consider a hypotheticalphenotype for which values are higher in the S lines (Fig.·6A);this can be explained, statistically at least, by their higherwheel running: a single regression line adequately describesthe relation. In this case, we would interpret the data asindicating that mice from S and C lines are equally plastic: itseems to be a simple case of ‘more pain, more gain.’ One realexample of this pattern involves the level of brain-derivedneurotrophic factor (BDNF) in the hippocampus of S and Cmice after one week of access to running wheels [see fig.·2(Johnson et al., 2003)].
Fig.·6B shows a different situation. When housed withwheel access, mice from S lines again have higher values forthe phenotype, but we see no relation with the amount ofrunning within either group. If we imagine further that S andC mice housed without wheels showed no difference (or atleast values similar to those of C mice housed with wheels),then the S mice seem to be more responsive to wheel exposure,i.e. they are more plastic. For a given amount of exercise(wheel running), S mice experience a greater training response.Remember also that phenotypic differences between genotypes(e.g. S versus C mice) that appear only in some environmentsare termed genotype-by-environment interactions.
As in the hypothetical scenarios just discussed, we havepublished several papers that involved groups of both S and Cmice housed with or without access to functional wheels forseveral weeks. We have studied various traits, including bodymass, VO2max, organ masses, bone properties and enzymeactivities (Swallow et al., 1999; Houle-Leroy et al., 2000;Thomson et al., 2002; Belter et al., 2004; Swallow et al., 2005;Kelly et al., 2006). We found a variety of responses in thesephenotypes, including some that differ between the sexes.Some traits do not differ between S and C mice regardless ofhousing conditions [e.g. tail length, adjusted for variation inbody mass, in both sexes (Swallow et al., 2005)]. Some traitswere found to differ between S and C mice regardless ofhousing conditions [e.g. S mice are smaller in body mass buthave relatively larger kidneys (Swallow et al., 2001; Swallowet al., 2005; Kelly et al., 2006)]. Others showed a differencebetween S and C lines when housed with wheels but not whenhoused without [e.g. hematocrit and blood hemoglobin content(Swallow et al., 2005)].
For traits that differ more between S and C lines when theyare housed with wheel access, we can examine statisticallywhich of the competing patterns shown in Fig.·6A,B betterdescribes the data (see also Swallow et al., 2005). The generalstrategy is as follows. First, we identify a trait that shows astatistical interaction between the effects of line type (Sversus C lines) and wheel access (the environmental factor).For these analyses, we use SAS Proc Mixed to implementa mixed-model, nested ANOVA (or ANCOVA if suchcovariates as age or body mass are included in the model), in
which replicate line is a random effect nested within line type(S or C). Degrees of freedom for testing the effect of linetype, the effect of wheel access, and the line type � wheelaccess interaction are all 1 and 6. With this type of analysis,one trait that showed a statistically significant interaction ishematocrit in a sample of 81 female mice housed with orwithout wheels for 8 weeks (Swallow et al., 2005), asrepeated here in Table·2.
Second, we examine the mean values for the four subgroups.In the case of hematocrit in females, adjusted means (SAS ProcMixed) were 48.51, 48.76, 48.66, and 50.90 for ControlSedentary, Control Active, Selected Sedentary and SelectedActive, respectively [see table·3 (Swallow et al., 2005)]. Thus,the line type effect is greater when mice are housed with wheelaccess. Indeed, separate ANCOVAs reveal no significant effectof line type (P=0.8502) for sedentary mice but a significanteffect (P=0.0472) for the active group. Third, within the activegroup (Fig.·7), we can ask whether the data are better fit by amodel that does or does not include the amount of wheelrunning as an additional covariate. For hematocrit in females,Table·2 shows that the ln likelihood of the nested ANCOVAmodel without wheel running (–75.7) is larger (less negative,in this case) than for the model with wheel running (–83.7). Asthe latter model contains one additional parameter (estimatingthe effect of wheel running), twice the difference in lnlikelihoods (16.0, in this case) can be compared with a �2
distribution with one degree of freedom, for which the criticalvalue for P=0.05 is 3.841. Therefore, the model with wheelrunning as an additional covariate yields a significantly worsefit to the data, and we conclude that the difference in hematocritbetween S and C mice when housed with wheel access is notbest explained as a simple function of the greater running by
Fig.·7. Hematocrit of female mice from a study reported elsewhere(Swallow et al., 2005). Mice were given wheel access for 8 weeksbeginning at weaning. Additional mice (not shown) were housedwithout access to running wheels, and they showed no Selected (S)versus Control (C) difference in hematocrit. Thus, S mice are moreresponsive (more plastic) when granted wheel access, but not byvirtue of a simple linear relation with amount of running that appliesto all animals. Compare with Fig.·6B.
45
47
49
51
53
55
57
Hem
atoc
rit (
%)
Females
0 5000 10 000 15 000 20 000
Running during final week (revs day–1)
THE JOURNAL OF EXPERIMENTAL BIOLOGY
2356
S mice. Instead, the greater training effect experienced by Smice seems to indicate that they have greater plasticity for thistrait when given wheel access. Results are similar for bloodhemoglobin content.
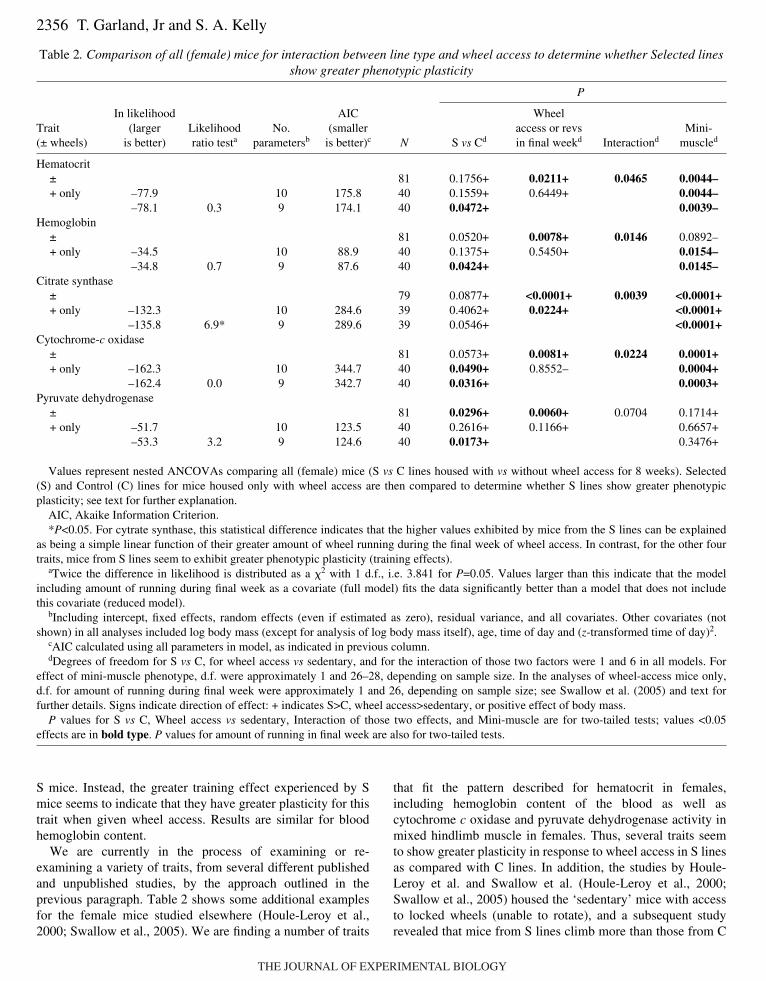
We are currently in the process of examining or re-examining a variety of traits, from several different publishedand unpublished studies, by the approach outlined in theprevious paragraph. Table·2 shows some additional examplesfor the female mice studied elsewhere (Houle-Leroy et al.,2000; Swallow et al., 2005). We are finding a number of traits
T. Garland, Jr and S. A. Kelly
that fit the pattern described for hematocrit in females,including hemoglobin content of the blood as well ascytochrome c oxidase and pyruvate dehydrogenase activity inmixed hindlimb muscle in females. Thus, several traits seemto show greater plasticity in response to wheel access in S linesas compared with C lines. In addition, the studies by Houle-Leroy et al. and Swallow et al. (Houle-Leroy et al., 2000;Swallow et al., 2005) housed the ‘sedentary’ mice with accessto locked wheels (unable to rotate), and a subsequent studyrevealed that mice from S lines climb more than those from C
Table·2. Comparison of all (female) mice for interaction between line type and wheel access to determine whether Selected linesshow greater phenotypic plasticity
P
In likelihood AIC WheelTrait (larger Likelihood No. (smaller access or revs Mini-(± wheels) is better) ratio testa parametersb is better)c N S vs Cd in final weekd Interactiond muscled
Hematocrit± 81 0.1756+ 0.0211+ 0.0465 0.0044–+ only –77.9 10 175.8 40 0.1559+ 0.6449+ 0.0044–
–78.1 0.3 9 174.1 40 0.0472+ 0.0039–Hemoglobin
± 81 0.0520+ 0.0078+ 0.0146 0.0892–+ only –34.5 10 88.9 40 0.1375+ 0.5450+ 0.0154–
–34.8 0.7 9 87.6 40 0.0424+ 0.0145–Citrate synthase
± 79 0.0877+ <0.0001+ 0.0039 <0.0001++ only –132.3 10 284.6 39 0.4062+ 0.0224+ <0.0001+
–135.8 6.9* 9 289.6 39 0.0546+ <0.0001+Cytochrome-c oxidase
± 81 0.0573+ 0.0081+ 0.0224 0.0001++ only –162.3 10 344.7 40 0.0490+ 0.8552– 0.0004+
–162.4 0.0 9 342.7 40 0.0316+ 0.0003+Pyruvate dehydrogenase
± 81 0.0296+ 0.0060+ 0.0704 0.1714++ only –51.7 10 123.5 40 0.2616+ 0.1166+ 0.6657+
–53.3 3.2 9 124.6 40 0.0173+ 0.3476+
Values represent nested ANCOVAs comparing all (female) mice (S vs C lines housed with vs without wheel access for 8 weeks). Selected(S) and Control (C) lines for mice housed only with wheel access are then compared to determine whether S lines show greater phenotypicplasticity; see text for further explanation.
AIC, Akaike Information Criterion.*P<0.05. For cytrate synthase, this statistical difference indicates that the higher values exhibited by mice from the S lines can be explained
as being a simple linear function of their greater amount of wheel running during the final week of wheel access. In contrast, for the other fourtraits, mice from S lines seem to exhibit greater phenotypic plasticity (training effects).
aTwice the difference in likelihood is distributed as a �2 with 1 d.f., i.e. 3.841 for P=0.05. Values larger than this indicate that the modelincluding amount of running during final week as a covariate (full model) fits the data significantly better than a model that does not includethis covariate (reduced model).
bIncluding intercept, fixed effects, random effects (even if estimated as zero), residual variance, and all covariates. Other covariates (notshown) in all analyses included log body mass (except for analysis of log body mass itself), age, time of day and (z-transformed time of day)2.
cAIC calculated using all parameters in model, as indicated in previous column.dDegrees of freedom for S vs C, for wheel access vs sedentary, and for the interaction of those two factors were 1 and 6 in all models. For
effect of mini-muscle phenotype, d.f. were approximately 1 and 26–28, depending on sample size. In the analyses of wheel-access mice only,d.f. for amount of running during final week were approximately 1 and 26, depending on sample size; see Swallow et al. (2005) and text forfurther details. Signs indicate direction of effect: + indicates S>C, wheel access>sedentary, or positive effect of body mass.
P values for S vs C, Wheel access vs sedentary, Interaction of those two effects, and Mini-muscle are for two-tailed tests; values <0.05effects are in bold type. P values for amount of running in final week are also for two-tailed tests.
THE JOURNAL OF EXPERIMENTAL BIOLOGY

2357Phenotypic plasticity and experimental evolution
lines in locked wheels. Therefore, the relative magnitude oftraining effects in S and C lines might differ if ‘sedentary’ micewere housed in ordinary cages with no access to even lockedwheels.
The results shown in Table·2 are for (female) mice housedwith or without access to a functional wheel for 8 weeks.However, the selection regime involves only 6 days of wheelaccess, so it will be crucial in future studies to see if a similarpattern emerges for shorter periods of wheel access. In fact, wehave already found that, for some traits, the effects of wheelaccess can be dramatic even over a matter of days. Forexample, the amount of GLUT-4 glucose transporter ingastrocnemius muscle did not differ between S and C femaleswhen they were housed without wheels (Gomes et al., 2004).After 5 days, both groups exhibited an increase in GLUT-4,but the increase was much greater in S mice, such that S andC showed no overlap in values. When the amount of GLUT-4was plotted against the amount of wheel running on day 5, therelation was similar to that shown in Fig.·6B. Thus, thedifference between S and C lines in gastrocnemius GLUT-4expression is not a simple linear function of the amount ofwheel running; rather, mice from the S lines seem to havegreater plasticity for this trait, and this greater plasticity canhave large effects even in as few as 5 days.
Some traits show altered plasticity in the S lines, but in acomplicated way. For example, the amount of neurogenesis inthe hippocampus [see fig.·2D (Rhodes et al., 2003)] shows arelation similar to that depicted in Fig.·8. Mice from C lines(gray squares) exhibit a positive and quantitative relation withthe amount of wheel running exhibited over several weeks,but this relation is lost in the S lines (black circles). Finally,we have also observed some traits that show an actual reversalof the direction of plasticity in S lines. For instance, relative
ovary mass was found to be larger in S mice than in C whenboth were housed without wheels, but the opposite was truefor mice housed with wheels for 8 weeks (Swallow et al.,2005).
Evolutionary change versus phenotypic plasticity
As noted above, some traits do not show a significantinteraction between line type and wheel access. For these traits,the magnitude of any S versus C difference is relativelyconstant, regardless of housing conditions, and the magnitudeof any training effect is similar in both S and C. Therefore, wecan compare these two effects in a straightforward way plottingone versus the other.
Kelly et al. report hindlimb bone properties for male micefrom generation 21 that were given wheel access for 8 weeksand compared with counterparts housed in ordinary cages withno wheels (Kelly et al., 2006). As shown in Fig.·9, bone lengthswere not affected by either selective breeding or chronic wheelaccess. Diameters, in contrast, tended to be increased by bothfactors, with the magnitude of the evolutionary effect beingsomewhat greater than the training effect. In spite of the factthat mice from S lines ran considerably more than C, themagnitude of training effects was similar in S and C lines,indicating no genotype-by-environment interactions (see Kellyet al., 2006). Similarly, plastic and evolved (5–6 generations)responses of larval tracheae were in the same direction inDrosophila melanogaster exposed to different atmospheric
Fig.·8. Complicated hypothetical relations between a phenotypic traitand the amount of running exhibited during the final week of a multi-week exposure to wheels. Mice from Control lines (gray squares)exhibit a positive and linear quantitative relation with the amount ofwheel running, but this relation is lost in the Selected lines (blackcircles). Some traits, such as the amount of neurogenesis in thehippocampus [see fig.·2D (Rhodes et al., 2003)], actually show thissort of complicated pattern.
18
20
22
24
26
28
30
32
34
Hyp
othe
tical
phe
noty
pe
0 5000 10 000 15 000 20 000
Running during final week (revs day–1)Fig.·9. Comparison of the effects of 21 generations of selectivebreeding for high voluntary wheel running (‘Evolution’) with theeffects of 8 weeks of wheel access (‘Phenotypic plasticity’), basedon least-squares (adjusted) means for hindlimb bones [as presentedin table·3 (Kelly et al., 2006)]. Bone lengths were unaffected byeither selective breeding or chronic wheel access, but both factorsincreased bone diameters (one exception), with the former generallyhaving somewhat larger effects. The magnitude of training effects issimilar to what has been reported previously for mammalian bone inresponse to either forced or voluntary exercise (see Kelly et al.,2006).
–2
0
2
4
6
8
10
–2 0 2 4 6 8 10
Phenotypic plasticity (% change)
Evo
lutio
n (%
cha
nge)
Bone lengthsBone diameters
THE JOURNAL OF EXPERIMENTAL BIOLOGY

2358
oxygen content (Henry and Harrison, 2004) [for otherexamples in Drosophila, see (Price et al., 2003) and referencestherein]. An important area for future research will be todetermine how often the underlying mechanisms of change aresimilar versus different for plastic and evolved responses [e.g.(Hodin and Riddiford, 2000) and references therein].
Concluding remarksWhenever a selective event is more than instantaneous,
individuals exposed to it have the opportunity to exhibitphenotypic change (plasticity) even as that event is inprogress. If the direction of plastic change is such that itincreases the probability of survival or other components ofDarwinian fitness, then those individuals will be at a selectiveadvantage. Hence, we may expect that directional selectionwill often lead to the evolution of increased plasticity in theappropriate direction (Fig.·2). This prediction would apply toorganisms in nature or in laboratory or other experimentalsystems. Hence, the tools of selective breeding (sensu lato)can be used to study the evolution of phenotypic plasticity,just as they can be used to study any other complex phenotype(Swallow and Garland, 2005). Even if plasticity per se is notthe intentional target of a selection experiment, we suggestthat any experiment in which the selective event is more thaninstantaneous should explore whether plasticity has increasedas a component of the response to selection. Our ownexperiment that involves selective breeding for high voluntaryactivity levels in mice has uncovered some examples ofincreased and apparently adaptive plasticity in the selectedlines, but not for all traits (e.g. not for hindlimb skeletaldimensions). We believe that experimental evolutionapproaches have much to offer with respect to clarifying theevolution of plasticity, including self-induced adaptiveplasticity (Houle-Leroy et al., 2000; Swallow et al., 2005) andthe related concept of genetic assimilation (Price et al., 2003;Pigliucci et al., 2006).
Although we have argued here that plasticity might bepredicted to increase in the appropriate direction as a correlatedresponse to directional selection (e.g. see Fig.·2), the oppositeprediction has also been offered. For example, in our originalpaper on enzyme activities, we noted that ‘genetic selection forincreased voluntary wheel running did not reduce thecapability of muscle aerobic capacity to respond to training’[see pp. 1608 and 1613 (Houle-Leroy et al., 2000)] because, apriori, we had thought that organisms innately higher for aphysiological function might exhibit relativity less ability toincrease further in that direction via physical conditioning,perhaps because of some sort of ‘ceiling effect’. Similarly,Koch et al. in a training study of rat exercise capacity (Kochet al., 2005) noted that ‘According to the principle of initialvalues, if capacity is low then the percentage gain in capacityin response to training will be high, and vice versa.’ However,their results for two inbred strains that differed in intrinsicaerobic running capacity were not in accord with the principleof initial value.
T. Garland, Jr and S. A. Kelly
We thank A. F. Bennett, T. D. Brutsaert, A. G. Gibbs, R. B.Huey and E. R. Weibel for helpful discussions. We also thankL. G. Harshman, M. Pigliucci, T. Price, M. Van Sant and ananonymous reviewer for comments on the manuscript.Supported by US National Science Foundation grant IBN-0212567 to T.G.
ReferencesAndersen, J. B., Rourke, B. C., Caiozzo, V. J., Bennett, A. F. and Hicks,
J. W. (2005). Postprandial cardiac hypertrophy in pythons. Nature 434, 37-38.
Beall, C. M. (2001). Adaptations to altitude: a current assessment. Annu. Rev.Anthropol. 30, 423-456.
Belter, J. G., Carey, H. V. and Garland, T., Jr (2004). Effects of voluntaryexercise and genetic selection for high activity levels on HSP72 expressionin house mice. J. Appl. Physiol. 96, 1270-1276.
Bennett, A. F. (1997). Adaptation and the evolution of physiologicalcharacters. In Handbook of Physiology: Section 13, ComparativePhysiology. Vol. I (ed. W. H. Dantzler), pp. 3-16. New York: OxfordUniversity Press.
Bennett, A. F. (2002). Experimental evolution. In Encyclopedia of Evolution(ed. M. Pagel), pp. 339-342. New York: Oxford University Press.
Bennett, A. F. (2003). Experimental evolution and the Krogh Principle:generating biological novelty for functional and genetic analyses. Physiol.Biochem. Zool. 76, 1-11.
Berrigan, D. and Scheiner, S. M. (2004). Modeling the evolution ofphenotypic plasticity. In Phenotypic Plasticity: Functional and ConceptualApproaches (ed. T. J. Dewitt and S. M. Scheiner), pp. 82-97. New York:Oxford University Press.
Boorse, G. C. and Denver, R. J. (2004). Endocrine mechanisms underlyingplasticity in metamorphic timing in spadefoot toads. Integr. Comp. Biol. 43,646-657.
Booth, F. W., Chakravathy, M. U., Gordon, S. E. and Spangenburg, E. E.(2002). Waging war on physical inactivity: using modern molecularammunition against an ancient enemy. J. Appl. Physiol. 93, 3-30.
Broadhurst, P. L. and Jinks, J. L. (1974). What genetical architecture cantell us about the natural selection of behavioral traits. In The Genetics ofBehaviour (ed. J. H. F. van Abeelen), pp. 43-63. Amsterdam: North-Holland.
Brutsaert, T. D., Parra, E. J., Shriver, M. D., Gamboa, A., Rivera-Ch, M.and Leon-Velarde, F. (2005). Ancestry explains the blunted ventilatoryresponse to sustained hypoxia and lower exercise ventilation of Quechuaaltitude natives. Am. J. Physiol. 289, R225-R234.
Bubliy, O. A. and Loeschcke, V. (2005). Correlated responses to selectionfor stress resistance and longevity in a laboratory population of Drosophilamelanogaster. J. Evol. Biol. 18, 789-803.
Bumpus, H. C. (1899). The elimination of the unfit as illustrated by theintroduced sparrow, Passer domesticus. In Biological Lectures Delivered atthe Marine Biological Laboratory of Woods Hole, 1896-7. pp. 209-226.Boston: Ginn & Co.
Castaneda, T. R., Jurgens, H., Wiedmer, P., Pfluger, P., Diano, S.,Horvath, T. L., Tang-Christensen, M. and Tschop, M. H. (2005). Obesityand the neuroendocrine control of energy homeostasis: the role ofspontaneous locomotor activity. J. Nutr. 135, 1314-1319.
Chippindale, A. K., Ngo, A. L. and Rose, M. R. (2003). The devil in the detailsof life-history evolution: instability and reversal of genetic correlations duringselection on Drosophila development. J. Genet. 82, 133-145.
Collier, M. H. and Rogstad, S. H. (2004). Clonal variation in floral stagetiming in the common dandelion Taraxacum officinale (Asteraceae). Am. J.Bot. 91, 1828-1833.
Conley, K. E., Christian, K. A., Hoppeler, H. and Weibel, E. R. (1995).Heart mitochondrial properties and aerobic capacity are similarly related ina mammal and a reptile. J. Exp. Biol. 198, 739-746.
Cook, S. A. and Johnson, M. P. (1968). Adaptation to heterogeneousenvironments. I. Variation in heterophylly in Ranunculus flammula L.Evolution 22, 496-516.
Cossins, A., Fraser, J. and Gracey, A. (2006). Post-genomic approaches tounderstanding the mechanisms of environmentally induced phenotypicplasticity. J. Exp. Biol. 209, 2328-2336.
Costa, D. P. and Sinervo, B. (2004). Field physiology: physiological insightsfrom animals in nature. Annu. Rev. Physiol. 66, 209-238.
THE JOURNAL OF EXPERIMENTAL BIOLOGY
2359Phenotypic plasticity and experimental evolution
Diamond, J. M. (1986). Why do disused proteins become genetically lost orrepressed? Nature 321, 565-566.
Dohm, M. R., Richardson, C. S. and Garland, T., Jr (1994). Exercisephysiology of wild and random-bred laboratory house mice and theirreciprocal hybrids. Am. J. Physiol. 267, R1098-R1108.
Donohue, K., Messiqua, D., Pyle, E. H., Heschel, M. S. and Schmitt, J.(2000). Evidence of adaptive divergence in plasticity: density-and-site-dependent selection on shade-avoidance responses in Impatiens capensis.Evolution 54, 1956-1968.
Dumke, C. L., Rhodes, J. S., Garland, T., Jr, Maslowski, E., Swallow, J.G., Wetter, A. C. and Cartee, G. D. (2001).Genetic selection of mice forhigh voluntary wheel running: effect on skeletal muscle glucose uptake. J.Appl. Physiol. 91, 1289-1297.
Ebert, D. (1998). Experimental evolution of parasites. Science 282, 1432-1435.
Endler, J. A. (1986). Natural Selection in the Wild. Princeton, NJ: PrincetonUniversity Press.
Falconer, D. S. (1989). Introduction to Quantitative Genetics (3rd edn).London: Longman.
Falconer, D. S. (1990). Selection in different environments: effects onenvironmental sensitivity (reaction norm) and on mean performance. Genet.Res., Camb. 56, 57-70.
Feder, M. E., Bennett, A. F. and Huey, R. B. (2000). Evolutionaryphysiology. Annu. Rev. Ecol. Syst. 31, 315-341.
Flück, M. (2006). Functional, structural and molecular plasticity ofmammalian skeletal muscle in response to exercise stimuli. J. Exp. Biol.209, 2239-2248.
Fordyce, J. A. (2006). The evolutionary consequences of ecologicalinteractions mediated through phenotypic plasticity. J. Exp. Biol. 209, 2377-2383.
Freeman, S. and Herron, J. C. (2004). Evolutionary Analysis (3rd edn).Upper Saddle River, NJ: Prentice Hall.
Futuyma, D. J. (1998). Evolutionary Biology (3rd edn). Sunderland, MA:Sinauer Associates.
Gabriel, W. (1999). Evolution of reversible plastic responses: inducibledefenses and environmental tolerance. In The Ecology and Evolution ofInducible Defenses (ed. R. Tollrian and C. D. Harvell), pp. 286-305.Princeton, NJ: Princeton University Press.
Gabriel, W. (2005). How stress selects for reversible phenotypic plasticity. J.Evol. Biol. 18, 873-883.
Garland, T., Jr (1994). Quantitative genetics of locomotor behavior andphysiology in a garter snake. In Quantitative Genetic Studies of BehavioralEvolution (ed. C. R. B. Boake), pp. 251-277. Chicago: University ofChicago Press.
Garland, T., Jr (1998). Testing the predictions of symmorphosis: conceptualand methodological issues. In Principles of Animal Design: theOptimization and Symmorphosis Debate (ed. E. R. Weibel, L. Bolis and C.R. Taylor), pp. 40-47. New York: Cambridge University Press.
Garland, T., Jr (1999). Artificial selection for increased wheel-runningactivity in house mice results in decreased body mass at maturity. J. Exp.Biol. 202, 2513-2520.
Garland, T., Jr (2003). Selection experiments: an under-utilized tool inbiomechanics and organismal biology. In Vertebrate Biomechanics andEvolution (ed. V. L. Bels, J. P. Gasc and A. Casinos), pp. 23-56. Oxford:BIOS Scientific Publishers.
Garland, T., Jr and Adolph, S. C. (1994). Why not to do two-speciescomparative studies: limitations on inferring adaptation. Physiol. Zool. 67,797-828.
Garland, T., Jr and Carter, P. A. (1994). Evolutionary physiology. Annu.Rev. Physiol. 56, 579-621.
Garland, T., Jr and Else, P. L. (1987). Seasonal, sexual, and individualvariation in endurance and activity metabolism in lizards. Am. J. Physiol.252, R439-R449.
Garland, T., Jr and Freeman, P. A. (2005). Selective breeding for highendurance running increases hindlimb symmetry. Evolution 59, 1851-1854.
Garland, T., Jr, Bennett, A. F. and Daniels, C. B. (1990). Heritability oflocomotor performance and its correlates in a natural population ofvertebrates. Experientia 46, 530-533.
Garland, T., Jr, Morgan, M. T., Swallow, J. G., Rhodes, J. S., Girard, I.,Belter, J. G. and Carter, P. A. (2002). Evolution of a small-musclepolymorphism in lines of house mice selected for high activity levels.Evolution 56, 1267-1275.
Garland, T., Jr, Bennett, A. F. and Rezende, E. L. (2005). Phylogeneticapproaches in comparative·physiology. J. Exp. Biol. 218, 3015-3035.
Geiser, F., Kenagy, G. J. and Wingfield, J. C. (1997). Dietary cholesterolenhances torpor in a rodent hibernator. J. Comp. Physiol. B 167, 416-422.
Ghalambor, C. K., Walker, J. A. and Reznick, D. N. (2003). Multi-traitselection, adaptation, and constraints on the evolution of burst swimmingperformance. Integr. Comp. Biol. 43, 431-438.
Girard, I. and Garland, T., Jr (2002). Plasma corticosterone response toacute and chronic voluntary exercise in female house mice. J. Appl. Physiol.92, 1553-1561.
Girard, I., McAleer, M. C., Rhodes, J. S. and Garland, T., Jr (2001).Selection for high voluntary wheel-running increases speed andintermittency in house muice (Mus domesticus). J. Exp. Biol. 204, 4311-4320.
Gomes, F. R., Rezende, E. L., Bunkers, J. L., Rivas, D. A., Yaspelkis, B.B., III and Garland, T., Jr (2004). Muscle glucose transporters (GLUT-4) and glycogen storage of mice selectively bred for high activity levels. Int.Comp. Biol. 44, 984.
Gordon, D. M. (1992). Phenotypic plasticity. In Keywords in EvolutionaryBiology (ed. E. F. Keller and E. A. Loyd), pp. 255-262. Cambridge, MA:Harvard University Press.
Harshman, L. G., Ottea, J. A. and Hammock, B. D. (1991). Evolvedenvironment-dependent expression of detoxication enzyme activity inDrosophila melanogaster. Evolution 45, 791-795.
Harshman, L. G., Hoffmann, A. A. and Clark, A. G. (1999). Selection forstarvation resistance in Drosophila melanogaster: physiological correlates,enzyme activities and multiple stress responses. J. Evol. Biol. 12, 370-379.
Hatle, J. D. (2004). Physiology underlying phenotypic plasticity andpolyphenisms: introduction to the symposium. Integr. Comp. Biol. 43, 605-606.
Henderson, K. K., Wagner, H., Favret, F., Britton, S. L., Koch, L. G.,Wagner, P. D. and Gonzalez, N. C. (2002). Determinants of maximal O2
uptake in rats selectively bred for endurance running capacity. J. Appl.Physiol. 93, 1265-1274.
Henderson, N. D. (1981). Genetic influences on locomotor activity in 11-day-old housemice. Behav. Genet. 11, 209-225.
Henderson, N. D. (1989). Interpreting studies that compare high- and low-selected lines on new characters. Behav. Genet. 19, 473-502.
Henry, J. R. and Harrison, J. F. (2004). Plastic and evolved responses oflarval tracheae and mass to varying atmospheric oxygen content inDrosophila melanogaster. J. Exp. Biol. 207, 3559-3567.
Hewitt, J. K., Fulker, D. W. and Broadhurst, P. L. (1981). Genetics ofescape-avoidance conditioning in laboratory and wild populations of rats: abiometrical approach. Behav. Genet. 11, 533-544.
Hodin, J. and Riddiford, L. M. (2000). Different mechanisms underliephenotypic plasticity and interspecific variaiton for a reproductive characterin drosophilids (Insecta: Diptera). Evolution 54, 1638-1653.
Hood, D. A., Irrcher, I., Ljubicic, V. and Joseph, A.-M. (2006).Coordination of metabolic plasticity in skeletal muscle. J. Exp. Biol. 209,2265-2275.
Hoppeler, H., Altpeter, E., Wagner, M., Turner, D. L., Hokanson, J.,König, M., Stalder-Navarro, V. P. and Weibel, E. R. (1995). Coldacclimation and endurance training in guinea pigs: changes in lung, muscleand brown fat tissue. Respir. Physiol. 101, 189-198.
Houle-Leroy, P., Garland, T., Jr, Swallow, J. G. and Guderley, H.(2000). Effects of voluntary activity and genetic selection on musclemetabolic capacitites in house mice Mus domesticus. J. Appl. Physiol. 89,1608-1616.
Houle-Leroy, P., Guderley, H., Swallow, J. G. and Garland, T., Jr (2003).Artificial selection for high activity favors mighty mini-muscles in housemice. Am. J. Physiol. 284, R433-R443.
Hsia, C. C. (2001). Coordinated adaptation of oxygen transport incardiopulmonary disease. Circulation 104, 963-969.
Huey, R. B. and Berrigan, D. (1996). Testing evolutionary hypotheses ofacclimation. In Phenotypic and Evolutionary Adaptation to Temperature(ed. I. A. Johnston and A. F. Bennett), pp. 205-237. Cambridge: CambridgeUniversity Press.
Huey, R. B. and Kingsolver, J. G. (1993). Evolution of resistance to hightemperature in ectotherms. Am. Nat. 142, S21-S46.
Huey, R. B., Berrigan, D., Gilchrist, G. W. and Herron, J. C. (1999).Testing the adaptive significance of acclimation: a strong inferenceapproach. Am. Zool. 39, 323-336.
Huey, R. B., Hertz, P. E. and Sinervo, B. (2003). Behavioral drive versusbehavioral inertia in evolution: a null model approach. Am. Nat. 161, 357-366.
Irschick, D. J. and Garland, T., Jr (2001). Integrating function and ecology
THE JOURNAL OF EXPERIMENTAL BIOLOGY

2360 T. Garland, Jr and S. A. Kelly
in studies of adaptation: investigations of locomotor capacity as a modelsystem. Annu. Rev. Ecol. Syst. 32, 367-396.
Johnson, R. A., Rhodes, J. S., Jeffrey, S. L., Garland, T., Jr and Mitchell,G. S. (2003). Hippocampal brain-derived neurotrophic factor but notneurotrophin-3 increases more in mice selected for increased voluntarywheel running. Neuroscience 121, 1-7.
Johnston, I. (2006). Environment and plasticity of myogenesis in teleost fish.J. Exp. Biol. 209, 2249-2264.
Kelly, S. A., Czech, P. P., Wight, J. T., Blank, K. M. and Garland, T., Jr(2006). Experimental evolution and phenotypic plasticity of hindlimb bonesin high-activity house mice. J. Morphol. 267, 360-374.
Ketterson, E. D. and Nolan, V., Jr (1999). Adaptation, exaptation, andconstraint: a hormonal perspective. Am. Nat. 154, S4-S25.
Kingsolver, J. G. and Huey, R. B. (2003). Introduction: the evolution ofmorphology, performance, and fitness. Integr. Comp. Biol. 43, 361-366.
Knapp, R. (2004). Endocrine mediation of vertebrate male alternativereproductive tactics: the next generation of studies. Integr. Comp. Biol. 43,658-668.
Koch, L. G., Green, C. L., Lee, A. D., Hornyak, J. E., Cicila, G. T. andBritton, S. L. (2005). Test of the principle of initial value in rat geneticmodels of exercise capacity. Am. J. Physiol. 288, R466-R472.
Koteja, P., Swallow, J. G., Carter, P. A. and Garland, T., Jr (1999a).Energy cost of wheel running in house mice: implications for coadaptationof locomotion energy budgets. Physiol. Biochem. Zool. 72, 238-249.
Koteja, P., Garland, T., Jr, Sax, J. N., Swallow, J. G. and Carter, P. A.(1999b). Behaviour of house mice artificially selected for high levels ofvoluntary wheel running. Anim. Behav. 58, 1307-1318.
Kupferberg. S. J. (1997). The role of larval diet in anuran metamorphosis.Am. Zool. 37, 146-159.
Lande, R. and Arnold, S. J. (1983). The measurement of selection oncorrelated characters. Evolution 37, 1210-1226.
Leroi, A., Bennett, A. F. and Lenski, R. E. (1994). Temperature acclimationand competitive fitness: an experimental test of the beneficial acclimationassumption. Proc. Natl. Acad. Sci. USA 91, 1917-1921.
Lillywhite, H. B. (2004). Plasticity of the water barrier in vertebrateintegument. 3rd International Conference of Comparative Physiology andBiochemistry, August 7-13, 2004, KwaZulu Natal, South Africa. Int. Congr.Ser. 1275, 283-290.
Lynch, C. B. (1994). Evolutionary inferences from genetic analyses of coldadaptation in laboratory and wild populations of the house mouse. InQuantitative Genetic Studies of Behavioral Evolution (ed. C. R. B. Boake),pp. 278-301. Chicago: University of Chicago Press.
Lynch, M. and Gabriel, W. (1987). Environmental tolerance. Am. Nat. 129,283-303.
Lynch, M. and Walsh, J. B. (1998). Genetics and Analysis of QuantitativeTraits. Sunderland, MA: Sinauer Associates.
Magistretti, P. J. (2006). Neuron-glia metabolic coupling and plasticity. J.Exp. Biol. 209, 2304-2311.
Mather, K. and Jinks, J. L. (1982). Biometrical Genetics: The Study ofContinuous Variation (3rd edn). London: Chapman & Hall.
Nelson, P., Kiriakidou, M., Sharma, A., Maniataki, E. and Mourelatos, Z.(2003). The microRNA world: small is mighty. Trends Biochem. Sci. 28,534-540.
Nesse, R. M. (2005). Maladaptation and natural selection. Q. Rev. Biol. 80,62-70.
Norcliffe, L. J., Rivera-Ch, M., Claydon, V. E., Moore, J. P., Leon-Velarde, F., Appenzeller, O. and Hainsworth, R. (2005). Cerebrovascularresponses to hypoxia and hypocapnia in high-altitude dwellers. J. Physiol.566, 287-294.
Nunney, L. and Cheung, W. (1997). The effect of temperature on body sizeand fecundity in female Drosophila melanogaster: evidence for adaptiveplasticity. Evolution 51, 1529-1535.
Nussey, D. H., Postma, E., Gienapp, P. and Visser, M. E. (2005). Selectionon heritable phenotypic plasticity in a wild bird population. Science 310,304-306.
Orzack, S. and Sober, E. (ed.) (2001). Adaptationism and Optimality. NewYork: Cambridge University Press.
Piersma, T. and Lindstrom, A. (1997). Rapid reversible changes in organsize as a component of adaptive behavior. Trends Ecol. Evol. 12, 134-138.
Pigliucci, M. (2001). Phenotypic Plasticity: Beyond Nature and Nurture.Baltimore, MD: The Johns Hopkins University Press.
Pigliucci, M. (2005). Evolution of phenotypic plasticity: where are we goingnow? Trends Ecol. Evol. 20, 481-486.
Pigliucci, M., Murran, C. J. and Schlichting, C. D. (2006). Phenotypic
plasticity and evolution by genetic assimilation. J. Exp. Biol. 209, 2362-2367.
Price, T. D. (2006). Phenotypic plasticity, sexual selection, and the evolutionof colour patterns. J. Exp. Biol. 209, 2368-2376.
Price, T. D., Qvarnstrom, A. and Irwin, D. E. (2003). The role of phenotypicplasticity in driving genetic evolution. Proc. R. Soc. Lond. B Biol. Sci. 270,1433-1440.
Rezende, E. L., Gomes, F. R., Ghalambor, C. K., Russell, G. A. andChappell, M. A. (2005). An evolutionary frame of work to studyphysiological adaptation to high altitudes. Rev. Chil. Hist. Nat. 78, 323-336.
Rezende, E. L., Garland, T., Jr, Chappell, M. A., Malisch, J. L. andGomes, F. R. (2006a). Maximum aerobic performance in lines of Musselected for high wheel-running activity: effects of selection, oxygenavailability, and the mini-muscle phenotype. J. Exp. Biol. 209, 115-127.
Rezende, E. L., Kelly, S. A., Gomes, F. R., Chappell, M. A. and Garland,T., Jr (2006b). Effects of size, sex, and voluntary running speeds on costsof locomotion in lines of laboratory mice selectively bred for high wheel-running activity. Physiol. Biochem. Zool. 79, 83-99.
Rhodes, J. S., Koteja, P., Swallow, J. G., Carter, P. A. and Garland, T.,Jr (2000). Body temperatures of house mice artificially selected for highvoluntary wheel-running behavior: repeatability and effect of geneticselection. J. Therm. Biol. 25, 391-400.
Rhodes, J. S., van Praag, H., Jeffrey, S., Girard, I., Mitchell, G. S.,Garland, T., Jr and Gage, F. H. (2003). Exercise increases hippocampalneurogenesis to high levels but does not improve spatial learning in micebred for increased voluntary wheel running. Behav. Neurosci. 117, 1006-1016.
Rhodes, J. S., Gammie, S. C. and Garland, T., Jr (2005). Neurobiology ofmice selected for high voluntary wheel-running activity. Integr. Comp. Biol.45, 438-455.
Rose, M. R., Chippindale, A. K. and Nusbaum, T. J. (1996). Laboratoryevolution: the experimental wonderland and the Cheshire Cat Syndrome. InAdaptation (ed. M. R. Rose and G. V. Lauder), pp. 221-241. New York:Academic Press.
Rose, M. R., Passananti, H. B. and Matos, M. (ed.) (2004). MethuselahFlies: A Case Study in the Evolution of Aging. Singapore: World ScientificPublishing.
Rose, M. R., Passananti, H. B., Chippindale, A. K., Phelan J. P., Matos,M., Teotonio, H. and Mueller, L. D. (2005). The effects of evolution arelocal: Evidence from experimental evolution in Drosophila. Int. Comp. Biol.45, 486-491.
Sapolsky, R. M. (2005). The influence of social hierarchy on primate health.Science 308, 648-652.
Scheiner, S. M. (1993). Genetics and evolution of phenotypic plasticity. Annu.Rev. Ecol. Syst. 24, 35-68.
Scheiner, S. M. (2002). Selection experiments and the study of phenotypicplasticity. J. Evol. Biol. 15, 889-898.
Scheiner, S. M. and Lyman, R. F. (1991). The genetics of phenotypicplasticity. II. Responses to selection. J. Evol. Biol. 4, 23-50.
Schlichting, C. D. and Pigliucci, M. (1998). Phenotypic Evolution: AReaction Norm Perspective. Sunderland, MA: Sinauer Associates.
Schluter, D. (1996). Adaptive radiation along genetic lines of least resistance.Evolution 50, 1766-1774.
Schratt, G. M., Tuebing, F., Nigh, E. A., Kane, C. G., Sabatini, M. E.,Kiebler, M. and Greenberg, M. E. (2006). A brain-specific microRNAregulates dendritic spine development. Nature 439, 283-289.
Secor, S. M. (2005). Evolutionary and cellular mechanisms regulatingintestinal performance of amphibians and reptiles. Integr. Comp. Biol. 45,282-294.
Sinervo, B. and Basolo, A. L. (1996). Testing adaptation using phenotypicmanipulations. In Adaptation (ed. M. R. Rose and G. V. Lauder), pp. 149-185. San Diego: Academic Press.
Sinervo, B. and Calsbeek, R. (2003). Physiological epistasis, ontogeneticconflict and natural selection on physiology and life history. Integr. Comp.Biol. 43, 419-430.
Stearns, S. C. and Hoekstra, R. F. (2005). Evolution: An Introduction (2ndedn). Oxford: Oxford University Press.
Swallow, J. G. and Garland, T., Jr (2005). Selection experiments as a toolin evolutionary and comparative physiology: insights into complex traits –an introduction to the symposium. Integr. Comp. Biol. 45, 387-390.
Swallow, J. G., Carter, P. A. and Garland, T., Jr (1998a). Artificialselection for increased wheel-running behavior in house mice. Behav.Genet. 28, 227-237.
THE JOURNAL OF EXPERIMENTAL BIOLOGY

2361Phenotypic plasticity and experimental evolution
Swallow, J. G., Garland, T., Jr, Carter, P. A., Zhan, W.-Z. and Sieck, G.(1998b). Effects of voluntary activity and genetic selection on aerobiccapacity in house mice. J. Appl. Physiol. 84, 69-76.
Swallow, J. G., Koteja, P., Carter, P. A. and Garland, T., Jr (1999).Artificial selection for increased wheel-running activity in house mice resultsin decreased body mass at maturity. J. Exp. Biol. 202, 2513-2520.
Swallow, J. G., Garland, T., Jr, Koteja, P. and Carter, P. A. (2001). Foodconsumption and body composition in mice selected for high wheel-runningactivity. J. Comp. Physiol. B 171, 651-659.
Swallow, J. G., Rhodes, J. S. and Garland, T., Jr (2005). Phenotypic andevolutionary plasticity of organ masses in response to voluntary exercise inhouse mice. Integr. Comp. Biol. 45, 426-437.
Swynghedauw, B. (2006). Phenotypic plasticity of adult myocardium.Molecular mechanisms. J. Exp. Biol. 209, 2320-2327.
Syme, D. A., Evashuk, K., Grintuch, B., Rezende, E. L. and Garland, T.,Jr (2005). Contractile abilities of normal and ‘mini’ triceps surae musclesfrom mice (Mus domesticus) selectively bred for high voluntary wheelrunning. J. Appl. Physiol. 99, 1308-1316.
Thomson, S. L., Garland, T., Jr, Swallow, J. G. and Carter, P. A. (2002).Response of Sod-2 enzyme activity to selection for high voluntary wheelrunning. Heredity 88, 52-61.
Trussell, G. C. (1997). Phenotypic plasticity in the foot size of an intertidalsnail. Ecology 78, 1033-1048.
Valladares, F., Wright, S. J., Lasso, E., Kitajima, K. and Pearcy, R. W.(2000). Plastic phenotypic response to light of 16 congeneric shrubs from aPanamanian rainforest. Ecology 81, 1925-1936.
Via, S., Gomulkiewicz, R., de Jong, G., Scheiner, S., Schlichting, C. D. andvan Tienderen, P. H. (1995). Adaptive phenotypic plasticity: concensusand controversy. Trends Ecol. Evol. 10, 212-217.
Weibel, E. R. (2000). Symmorphosis: On Form and Function in Shaping Life.Cambridge, MA: Harvard University Press.
Wilson, R. S. and Franklin, C. E. (2002). Testing the beneficial acclimationhypothesis. Trends Ecol. Evol. 17, 66-70.
Winslow, R. M., Chapman, K. W., Gibson, C. C., Samaja, M., Monge, C.C., Goldwasser, E., Sherpa, M., Blume, F. D. and Santolaya, R. (1989).Different hematologic responses to hypoxia in Sherpas and QuechuaIndians. J. Appl. Physiol. 66, 1561-1569.
Wu, T., Wang, X., Wei, C., Cheng, H., Wang, X., Li, Y., Ge-Dong Zhao,H., Young, P., Li, G. and Wang, Z. (2005). Hemoglobin levels in Qinghai-Tibet: different effects of gender for Tibetans vs. Han. J. Appl. Physiol. 98,598-604.
Young, K. V., Brodie, E. D., Jr and Brodie, E. D., III (2004). How thehorned lizard got its horns. Science 304, 65.
Zera, A. J. (2004). The endocrine regulation of wing polymorphism in insects:state of the art, recent surprises, and future directions. Integr. Comp. Biol.43, 607-616.
THE JOURNAL OF EXPERIMENTAL BIOLOGY

Phenotypic plasticity and experimental evolution
T. Garland, Jr and S. A. Kelly
doi:10.1242/jeb.022673
There were two errors published in J. Exp. Biol. 209, 2344-2361.
First, on p. 2355 in the first complete paragraph of the section entitled ‘Plasticity of exercise-related traits’, the authors stated:
If we imagine further that S and C mice housed without wheels showed no difference (or at least values similar to those of C mice
housed with wheels), then the S mice seem to be more responsive to wheel exposure, i.e. they are more plastic.
The sentence should have read:
If we imagine further that S and C mice housed without wheels showed values similar to those of C mice housed with wheels, then the
S mice seem to be more responsive to wheel exposure, i.e. they are more plastic.
Second, on pp. 2355–2356, beginning in column 2 of p. 2355, the authors stated:
For hematocrit in females, Table·2 shows that the ln likelihood of the nested ANCOVA model without wheel running (–75.7) is larger
(less negative, in this case) than for the model with wheel running (–83.7). As the latter model contains one additional parameter (estimating
the effect of wheel running), twice the difference in ln likelihoods (16.0, in this case) can be compared with a χ2 distribution with one
degree of freedom, for which the critical value for P=0.05 is 3.841. Therefore, the model with wheel running as an additional covariate
yields a significantly worse fit to the data, and we conclude that the difference in hematocrit between S and C mice when housed with
wheel access is not best explained as a simple function of the greater running by S mice.
The paragraph should have read:
For hematocrit in females, Table·2 shows that the ln likelihood of the nested ANCOVA model without wheel running is –78.1 whereas
for the model with wheel running it is –77.9. As the latter model contains one additional parameter (estimating the effect of wheel running),
twice the difference in ln likelihoods (0.3 in this case) can be compared with a χ2 distribution with one degree of freedom, for which the
critical value for P=0.05 is 3.841. Therefore, the model with wheel running as an additional covariate does not fit the data significantly
better, and we conclude that the difference in hematocrit between S and C mice when housed with wheel access is not best explained as
a simple function of the greater running by S mice.
We apologise to the authors and readers for these errors but do not believe that they compromise the overall results and conclusions of the
paper.
2725Erratum
THE JOURNAL OF EXPERIMENTAL BIOLOGY