
Review Panel Secretariat, Roberts Bank Terminal 2 Project ... · d'examen, Projet du Terminal 2 à...
24
From: Panel RBT2 / Commission RBT2 (CEAA/ACEE) To: Panel RBT2 / Commission RBT2 (CEAA/ACEE) Subject: CSAS 2016-50 - Assessing Ecosystem Productivity Date: December 9, 2016 6:28:58 PM Attachments: CSAS 2016-50 - Assessing Ecosystem Productivity.pdf Panel Members, As requested, attached is the document titled: “Technical review of Roberts Bank Terminal 2 environmental assessment: section 10.3 – Assessing Ecosystem Productivity” by Fisheries and Oceans Canada, released in 2016. The document will be posted to the CEAA Registry shortly. Thank you. Review Panel Secretariat, Roberts Bank Terminal 2 Project | Secrétariat de la commission d'examen, Projet du Terminal 2 à Roberts Bank c/o Canadian Environmental Assessment Agency | a/s de l’Agence canadienne d'évaluation environnementale 22nd Floor, 160 Elgin St. Ottawa ON K1A 0H3 | 160, rue Elgin, 22ième étage, Ottawa ON K1A 0H3 [email protected] / [email protected] Tel: 613-957-0626 / toll free 1-866-582-1884 | Tél. : 613-957-0626 / sans frais: 1-866-582-1884
Transcript of Review Panel Secretariat, Roberts Bank Terminal 2 Project ... · d'examen, Projet du Terminal 2 à...

From Panel RBT2 Commission RBT2 (CEAAACEE)To Panel RBT2 Commission RBT2 (CEAAACEE)Subject CSAS 2016-50 - Assessing Ecosystem ProductivityDate December 9 2016 62858 PMAttachments CSAS 2016-50 - Assessing Ecosystem Productivitypdf
Panel Members As requested attached is the document titled ldquoTechnical review of Roberts Bank Terminal 2environmental assessment section 103 ndash Assessing Ecosystem Productivityrdquo by Fisheries andOceans Canada released in 2016 The document will be posted to the CEAA Registry shortly Thank you Review Panel Secretariat Roberts Bank Terminal 2 Project | Secreacutetariat de la commissiondexamen Projet du Terminal 2 agrave Roberts Bankco Canadian Environmental Assessment Agency | as de lrsquoAgence canadienne deacutevaluationenvironnementale22nd Floor 160 Elgin St Ottawa ON K1A 0H3 | 160 rue Elgin 22iegraveme eacutetage Ottawa ON K1A 0H3PanelRBT2ceaagcca CommissionRBT2aceegccaTel 613-957-0626 toll free 1-866-582-1884 | Teacutel 613-957-0626 sans frais 1-866-582-1884
Canadian Science Advisory Secretariat Pacific Region Science Response 2016050
December 2016
TECHNICAL REVIEW OF ROBERTS BANK TERMINAL 2 ENVIRONMENTAL ASSESSMENT SECTION 103 ndash
ASSESSING ECOSYSTEM PRODUCTIVITY
10 Context Vancouver Fraser Port Authority (VFPA) formerly Port Metro Vancouver (the Proponent) is proposing to construct and operate the Roberts Bank Terminal 2 Project (the Project) a new three-berth marine container terminal at Roberts Bank in Delta British Columbia The proposed terminal is located next to the existing Deltaport and Westshore Terminals In addition to the construction of the new terminal the Proponent has proposed to widen the north side of the existing Roberts Bank causeway from its east-end connection with the mainland to the entrance to the new terminal The existing tug basin connected to the northeast side of Deltaport Terminal is also proposed to be expanded The new marine terminal is predicted by the Proponent to process up to 260 container ship calls per year at full capacity with the assistance of two or three large berthing or escort tugs to manoeuver ships into or away from assigned berths The terminal is designed to operate 24 hours per day year-round
The Roberts Bank Terminal 2 Project is subject to an environmental assessment by a Review Panel pursuant to the Canadian Environmental Assessment Act 2012 As a federal authority in the environmental assessment for the Project Fisheries and Oceans Canada (DFO) will be asked to present information to the review panel and at public hearings in relation to its expertise on the effects of the Project on fish and fish habitat including aquatic species at risk and the adequacy of mitigation and offsetting measures and monitoring and follow-up programs proposed by the Proponent DFOrsquos Pacific Region Fisheries Protection Program (FPP) will coordinate DFOrsquos participation in the environmental assessment
The Proponent assessed future ecosystem productivity at Roberts Bank using the Ecopath with Ecosim and Ecospace (EwE) model framework The potential impacts of the Project to hydrodynamic conditions and sediment transport in the area as a result of changes in wind wave and current patterns and intensities are projected using different model frameworks A companion Science Response (DFO 2016) has been developed by DFO and Natural Resource Canada (NRCan) to review Section 95 ldquoCoastal Geomorphologyrdquo of the Environmental Impact Statement (EIS) which describes the hydrodynamic and sedimentology models that were used to evaluate the effect of the Project on water and sediment movements
Outcomes of the EwE models are incorporated into the analysis of the potential project-related effects on the ongoing productivity of commercial recreational and Aboriginal fisheries Consequently DFO FPP has requested that DFO Science Branch provide an evaluation of the Proponentrsquos characterization of project-related effects as conducted using the Ecopath with Ecosim and Ecospace (EwE) ecosystem model
Pacific Region Science Response Technical Review Assessing
Ecosystem Productivity Model of Roberts Bank
2
The objectives for this Science Response are to
1 Determine if the functional groups and abiotic factors used in the model adequately represent the ecosystem at Roberts Bank
2 Assess whether the parameter estimates used by the model are valid and defensible for this system
3 Assess whether the limitations and uncertainties of the model are identified and appropriately considered when determining the modelrsquos representation of current and possible future conditions
4 Provide advice regarding whether the model results related to the potential effects of the Project on fish and fish habitat and migratory birds and their food resources are valid and defensible
5 If possible provide advice regarding the validity of using the EwE model framework to quantify large scale impacts to fish habitat and fisheries productivity and the productivity of migratory birds
This Science Response evaluates Section 100 ldquoBiophysical Settingrdquo with a focus on Section 103 ldquoOverview of Assessing Ecosystem Productivityrdquo in the EIS as submitted by the Proponent (Port Metro Vancouver 2015) This Section and consequently this Response describes the ecosystem modelling approach that was taken to evaluate the direct and indirect effects of the footprint of the proposed terminal and widened causeway herein referred to as lsquothe Projectrsquo This ecosystem model provides outputs related to potential effects of the project on the study area at an ecosystem level including aquatic species and bird species in the Project area Evaluation of the model and its outputs therefore required expertise in both fishery aquatic species and migratory bird species Consequently this Science Response is the product of a joint review between DFO and Environment and Climate Change Canada (ECCC) Canadian Wildlife Service and Wildlife and Landscape Science to provide a complete evaluation
This Science Response Report results from the Science Response Process of July 2016 on the Technical Review of Ecopath with Ecosim and Ecospace (EwE) Ecosystem Productivity Model application to the Roberts Bank Terminal 2 Environmental Assessment
20 Background
21 Background and Terms of Reference The Projectrsquos main components have a proposed combined marine footprint area of approximately 179 km2 listed below by specific component
bull Marine Terminal 1335 km 2 including terminal (116 km 2) and dredged berth pocket and marine approach areas (0174 km 2)
bull Widened Causeway 0424 km 2
bull Expanded Tug basin 0031 km 2
Roberts Bank in the Fraser River estuary consists of complex intertidal and subtidal habitats including intertidal eelgrass beds and is an important stopover area for migrating shorebirds and productive feeding and rearing habitats for many fish and invertebrate species It also provides habitat for endangered Southern Resident Killer Whales and other marine mammals
Pacific Region Science Response Technical Review Assessing
Ecosystem Productivity Model of Roberts Bank
3
The environmental conditions at Roberts Bank are dynamic and are influenced by a variety of oceanographic and atmospheric factors including the Fraser River freshwater and sediment plume discharge diurnal tidal currents and prevailing and storm-generated wind and wave activity In addition the intercauseway region provides significant drainage from marsh and agricultural areas which have different characteristics from marine waters and which run along the ferry causeway
To provide the required science advice this Science Response focusses on Section 10 ldquoBiophysical Settingrdquo of the Environmental Impact Statement (EIS) (Port Metro Vancouver 2015a) specifically Section 103 ldquoOverview of Assessing Ecosystem Productivityrdquo (Port Metro Vancouver 2015b) and its related Appendices 10-B ldquoRoberts Bank Ecopath with Ecosim and Ecospace model parameter estimatesrdquo (Hemmera 2014) Appendix 10-C ldquoRoberts Bank Ecosystem model development and key runsrdquo(ESSA Technologies 2014a) and Appendix 10-D ldquoRoberts Bank Ecosystem model sensitivity analysesrdquo (ESSA Technologies 2014b) Additional important information was obtained from the Response to Information Request 6 (IR-73115-06 Canadian Environmental Assessment Agency Reference Number 80054 dated 26 October 2015) (Port Metro Vancouver 2015c) and the Written Responses to Coastal Geomorphology and Ecosystem Modelling Questions provided by the Proponent to DFO ECCC and NRCan on 2 March 2016 (Port Metro Vancouver (PMV) Transmittal TRE-01-RBT2-0004A subsequently referred in this Science Response as ldquoPMV Response 2016-03-02rdquo) (Vancouver Fraser Port Authority 2016)
The process followed in preparing this Science Response involved an initial review of the submitted EIS followed by an in-person meeting of the Proponent its contractors and representatives of DFO ECCC and NRCan to discuss and clarify questions arising from the initial review (Vancouver 23 November 2015) DFO and NRCan provided written questions to the Proponent based on preliminary review of the EIS on November 19 2015 ECCC also provided written questions based on its preliminary review of the EIS to the Proponent on December 1 2015 and January 20 2016 This large initial meeting was followed by smaller focussed meetings between the Proponent its contractors and DFO and NRCan on 11 December 2015 to clarify hydrology and sediment modelling questions with DFO on 8 January 2016 to clarify ecosystem modelling questions and with ECCC on 18 February 2016 to clarify questions relating to birds Written responses to all of these meetings and questions were provided by the Proponent to DFO ECCC and NRCan as the ldquoPMV Response 2016-03-02rdquo and ldquoPMV Response 2016-05-30rdquo (Vancouver Fraser Port Authority 2016) VFPArsquos answers to questions posed by DFO and NRCan regarding coastal geomorphology modelling have been posted to the Canadian Environmental Assessment Registry (CEAR)
22 Approach to assessing ecosystem productivity The Proponent adopted an ecosystem approach to evaluate the direct and indirect effects of the Project on the productivity of the Roberts Bank ecosystem A weight of evidence approach was used to assess the potential effects of the project on the productivity of the ecosystem and selected key components in the study area this approach included a spatial ecosystem simulation model (which included a habitat capacity model) a shorebird opportunity model and empirical data An important point is that any effects on the system during the construction phase or from expansion of the tug basin were excluded from this modelling process the focus instead being a comparison of modelled system productivity before and after the proposed terminal and expanded causeway is in place The chosen ecosystem simulation model was
Pacific Region Science Response Technical Review Assessing
Ecosystem Productivity Model of Roberts Bank
4
Ecopath with Ecosim and its spatial version Ecospace (collectively referred to here as the EwE framework or EwE model) This modelling approach was recommended by a prior Productive Capacity Technical Advisory Group comprised of representatives of technical experts from government agencies academia non-governmental organizations Vancouver Fraser Port Authority and its consultants (Compass 2013) convened by the Proponent and which also recommended a selection of focal species for the model The final selection of functional groups and the resulting food web that form the core of this ecosystem model are shown in Figure 1
Pacific Region Science Response Technical Review Assessing
Ecosystem Productivity Model of Roberts Bank
5
Figure 1 Ecopath with Ecosim model food web for Roberts Bank (Adapted from EIS Volume 3 Section 10 Fig 1033 on page 10-16) The groups coloured in orange represent focal groups size of symbols represents relative annual amount of biomass in the Roberts Bank study area
Pacific Region Science Response Technical Review Assessing
Ecosystem Productivity Model of Roberts Bank
6
The EwE framework is a common approach to ecosystem modelling which has been developed and expanded over the past two to three decades It currently has three main components
1 Ecopath ndash the core model which provides a mass-balance snapshot of the system
2 Ecosim ndash a module that enables simulation modelling over time
3 Ecospace ndash a module that enables simulation modelling over space
In order to make an EwE model tractable species are aggregated into functional groups based on their similar ecological characteristics (habitat and prey preferences etc) the Roberts Bank models had 58 functional groups The first step (Ecopath) was to obtain input parameters representing biomass production consumption emigration and diet for each functional group These parameters were then tuned in an iterative process until the overall production and consumption was balanced (a mass-balance approach) resulting in a model food web with estimates of energy flow between functional groups (Fig 1)
In the second step Ecosim was combined with the spatial model Ecospace The abiotic variables selected in this EIS (depth salinity bottom current wave height sediment type) were used as external forcings to the Ecospace module These abiotic variables provided the physical forcings for the simulations without and with the Project Since time series data on the functional groups of the model were not available Ecospace was run until the model reached equilibrium using various assumptions of the value of the vulnerability parameter (see Section 352) In this EIS the selected time step was annual with all variables abiotic and biotic expressed as yearly averages As used in this EIS the Ecospace module included a habitat capacity model which estimated the distribution of functional groups based on their environmental preferences for each abiotic variable (depth salinity bottom current wave height) and for substrate type (sand mud etc) The model thus allocated the spatial distribution of functional groups over the model domain based on their environmental preferences and the distributions of these abiotic variables with and without the Project The selected spatial unit size (ldquopixelrdquo) for the Ecospace model was 100 m2 In essence an Ecopath model was constructed for each pixel with particular rules governing how the functional groups interacted and moved among these spatial units The Ecospace module was run until it approached equilibrium (20 model years) to establish the spatial patterns without the Project For the lsquowith the Projectrsquo simulations the model was run for an initial 10 years and then the spatial patterns of the abiotic variables with the project were added and the model run for an additional 10 years1 The model outputs predicted changes in the productive potential of the Roberts Bank ecosystem as a comparison (ratio) with and without the Project rather than an absolute biomass that would be lost or gained as a result of the Project
1 EIS Appendix 10-C p 26
Pacific Region Science Response Technical Review Assessing
Ecosystem Productivity Model of Roberts Bank
7
30 Analysis and Response To prepare this response the following sections of the EIS additional documents were reviewed
DocumentSection Title
EIS Section 10
Including appendices 10B 10C and 10D
(Port Metro Vancouver 2015a Hemmera 2014 ESSA Technologies 2014a ESSA Technologies 2014b)
Biophysical Setting
Appendix 10-B Roberts Bank Ecosystem Model Parameter Estimates Port Metro Vancouver File 302-03503
Appendix 10-C Roberts Bank Ecosystem Model Development and Key Run Port Metro Vancouver
Appendix 10-D Roberts Bank Ecosystem Model Sensitivity Analyses Port Metro Vancouver
CEAR document 547 (Including Appendices) ldquoPMV Response 2016-03-02rdquo and ldquoPMV Response 2016-05-30rdquo
(Vancouver Fraser Port Authority 2016)
Vancouver Fraser Port Authority to the Review Panel re Answers to preliminary technical questions submitted during the completeness phase from Fisheries and Oceans Canada Natural Resources Canada and Environment and Climate Change Canada concerning the ecosystem modelling to support the Roberts Bank Terminal 2 Project environmental review
31 The EwE Team Building this ecosystem model was a complex undertaking which required knowledge of the ecosystem to be modelled how to set initial parameter values determination of reasonable ranges of these parameters how to balance the model and how to recognize when the model outputs were unrealistic These tasks became even more complex when spatial model dynamics were involved such as with Ecospace The team engaged by the Proponent to conduct this ecosystem modelling for the Roberts Bank Terminal 2 (RBT2) EIS was led by scientists at the Institute for Oceans and Fisheries located at the University of British Columbia in Vancouver These scientists are global leaders of the EwE model framework having developed much of its current implementation and who continue to lead its elaborations and extensions Construction and running of the model for this specific ecosystem was done in collaboration with ESSA Technologies of Vancouver Parameter values for the ecosystem model were obtained in part from observational studies conducted in the area by Hemmera of Burnaby BC
32 Overview of assessment results of hydrological and sediment modelling Implementation of the ldquowith the Projectrdquo simulations of the ecosystem model was done by driving the model with the abiotic variables as they were projected to be distributed with the Project footprint In the context of this EIS specifying depth salinity bottom currents wave height and sediment type conditions without the Project and changes with the Project were achieved by construction of hydrodynamical and sediment transport models The outputs from these models in combination with the identified environment preferences for the various biological groups were then used as inputs to the Ecospace model to define the spatial
Pacific Region Science Response Technical Review Assessing
Ecosystem Productivity Model of Roberts Bank
8
distributions of these functional groups The implementation of these hydrological and sediment transport models in this EIS was reviewed by DFO and NRCan (DFO 2016) This review concluded that the implementation of these models for this EIS was adequate for average winter conditions but lacking in validation for summer conditions in particular with strong freshwater flows from the Fraser River Simulations of strong storm events and their impacts on wave conditions and sediment transport were also lacking The effect of wave action and current speeds on sediment transport is non-linear such that increasing winds over short periods of time can impact sediment transport processes bottom topography and water depths beyond that determined under average model conditions Overall the review concluded that a greater range of sensitivity analyses is required to have confidence in the model outputs under lsquonon-averagersquo conditions The implication of this conclusion for the present review of the EwE model is that the full range of variability of abiotic characteristics such as bottom topography bottom current and wave heights and how they may affect relevant functional groups in the model with the Project may not be adequately represented Sensitivity analyses were provided by varying the intensity of abiotic variables and by removing abiotic variables to assess their interactive effects In general the ecosystem model outputs were robust to these sensitivity analyses with most groups varying by less than 5 Larger changes however were observed for primary producer and bird groupings and for some fish groups when various abiotic variables were omitted2
33 Model implementation 331 The purpose of the EwE model
The EwE model was intended to provide one line of evidence to assess the potential impacts of the Project on the Roberts Bank ecosystem which would then be used with other lines of evidence to make the final assessment Specifically ldquohellip the objective of the RB [Roberts Bank] model was not to provide an assessment of Project impacts for each functional group at a fine temporal scale but to estimate changes in productive potential with and without the Project at the ecosystem levelrdquo3 In addition ldquohellipthe primary objective of the RB ecosystem model is to evaluate potential changes in productivity from such abiotic factors with and without the terminal and causewayrdquo4 Results are presented for the selected functional groups no results were presented on potential changes in ecosystem structure or function
332 Applicability of the EwE model framework to the Roberts Bank region EwE models work best when the exchanges within the system being modelled are greater than the exchanges between the modelled system and the lsquooutsidersquo world In practice this means that EwE models work best for larger systems with few external exchanges In a meta-analysis of 433 Ecopath models Colleacuteter et al (2015) concluded that ldquohellipin the last two decades the range of the models area has expanded toward very large areas and the median has shifted accordingly from about 1000 km2 in 1984ndash1993 to about 100000 km2 in 1994ndash2014rdquo The section of the Roberts Bank ecosystem that is included in the EwE model was comparatively small (5468 km2) and complex It is an intertidally-dominated environment that is subject to strong seasonal influences of both freshwater and marine exchanges across relatively large seaward and shoreward boundaries
2 EIS Appendix 10-D p ii - iii 3 PMV Response 2016-03-02 p 99 lines 1914-1917 4 PMV Response 2016-03-02 p 38 lines 689-691
Pacific Region Science Response Technical Review Assessing
Ecosystem Productivity Model of Roberts Bank
9
Processes taking place outside the modelled ecosystem will contribute to dynamics within the modelled ecosystem (eg lsquooutsidersquo food supporting predators which occur in the Roberts Bank ecosystem for only part of the year predators which may feed in the Roberts Bank ecosystem but export this energy when they migrate out of the region) but which may not be well-resolved by the EwE model The Proponent justifies the spatial scale because it was specifically chosen for the questions being asked in regard to assessing productivity changes and because the relative influences of external exchanges are assumed to be identical with and without the project In addition highly mobile species with broad prey bases were assumed in the model to be partially sustained by external energy from outside the model system5 The distributions of organisms may differ however with and without the project which may affect their interactions with areas outside of the modelled system and the use of diets from outside the modelled system may not reflect the impacts of the project Further clarification of how the EwE model captures the exchanges and interactions with adjacent ecosystems are needed For example it could be argued that an ecosystem which is open to frequent exchanges of water and organic matter from beyond its boundaries might be more robust to local disturbances such as the Project
There are some inconsistencies in the information and assumptions used for some of the taxa in this ecosystem model For Dungeness Crab the justification for estimating total adult biomass (including females) from the biomass of fished males is unclear In addition it is unclear if the slower growth of female crabs once they have reached sexual maturity in comparison with male crabs has been considered The diet matrix for spiny dogfish does not represent the actual diet well in particular of euphausiids herring and shrimp and there are more recent references for biomass estimates of spiny dogfish in the study area than what was used in the EIS
Fishing mortality was not included in the model under the assumption that this would not change with or without the project While this assumption may be true the model has been parameterized by ignoring a source of mortality that will influence total production In essence fishing removes biomass from the ecosystem with the result that less biomass will be available for higher trophic levels How this may impact the ecosystem with and without the Project is unclear but it could make noticeable differences if for example there were thresholds in the feeding responses by these higher trophic level species The Ecopath model that was used is relatively unconstrained since many ecological efficiencies are low even for forage species which would be expected to be higher It is not clear how many species are exploited or the levels of exploitation but even if this does not change with the Project these mortality rates should be included in the model in order to add realistic constraints to the exploited functional groups
333 Model documentation Based on questions from DFO ECCC and NRCan following their initial review of the EIS the Proponent provided written responses dated 2 March 2016 to clarify several of the steps in the model development and implementation However several questions remain including questions about the Ecospace module Ecospace has undergone several recent developments such as the inclusion of the spatial-temporal data layer framework (Steenbeek et al 2013) the habitat capacity model (Christensen et al 2014) and the Monte Carlo analysis including the diet matrix As yet there are few published studies using these latest Ecospace developments and their documentation and justification need to be improved in the EIS
5 PMV Response 2016-03-02 p 29 lines 446 - 464
Pacific Region Science Response Technical Review Assessing
Ecosystem Productivity Model of Roberts Bank
10
Questions also remain regarding how the Monte Carlo randomization routine treated diet data The report indicates that the Monte Carlo routine randomly selected input parameters from the input ranges and that only models that were balanced were used This suggests that a high proportion of models were not balanced and therefore were not used (for example the EIS indicates that about one out of 1000 sampled input parameters was balanced6) A table showing the minimum maximum mode average and median values from the Monte Carlo runs for all the parameters would enable an evaluation of how much variation was actually sampled by the balanced model runs This is recommended in the EwE user information ie ldquoUsers should check the range of the input parameters that were actually used in the trials in the output csv file (see below)rdquo7
In addition there are several issues with the documentation of the derivation of the parameters for the functional groups Such documentation should clearly outline how the input parameter was estimated and the range of uncertainty for that parameter For example the input biomass of pinnipeds was defined as 04 t km 2 derived from estimates of 034 for Harbour seals and two estimates for Steller sea lions (012 and 014 t km 2) No explanation was provided for how the overall estimated pinniped biomass of 04 t km 2 was determined The diet of Sand Lance was described in the EIS as consisting mostly of zooplankton8 whereas the diet table for the model runs9 included 20 macrofauna 10 green algae and 10 detritus It is unclear why these additional prey were included in the diet used for the model runs
334 Highly mobile functional groups This implementation of the EwE framework included transient and migratory functional groups This is entirely appropriate and these groups cannot be excluded The approach taken in the Ecospace module was to impose a low (and conservative) dispersal rate among model spatial units (lsquopixelsrsquo) of 1 km yr-1 This may be appropriate for low mobility benthic organisms but it likely underestimates the movements of many other functional groups The effects of using higher and perhaps functional-group-specific dispersal rates was not considered The Proponents argued that higher dispersal rates would reduce impacts since species can move away from less desirable areas more quickly for completeness these runs should be done and evaluated Mobile species will also bring energy (food) captured outside the system into the modelled ecosystem This process was included in the model with the use of a diet import factor reflecting the consumption of prey outside the modelled region with the assumption that groups with high import rates were unlikely to respond to local changes on Roberts Bank10 This assumption needs justification perhaps at the functional group level for example many species of highly migratory birds and Pacific salmon use the Roberts Bank ecosystem to obtain food to continue their migrations Although this food does not compose a large fraction of their annual consumption it can be critical to enable them to continue their migrations
The EwE model is not designed to capture differences in prey quality ie differences in essential fatty acid or nutrient ratios The same species of prey may have greater or lesser nutritional value to predators depending on the conditions under which they are growing and their seasonal variations This is a particular concern with the nutritional quality of the diatom-dominated biofilm Diatomaceous biofilm is important to the highly migratory Western Sandpiper (Calidris mauri) Despite its predictive merits in relation to other ecosystem
6 EIS Appendix 10D Section 24 p5 7 EwE Help file p 151 8 EIS Appendix 10B Section 4133 p 76 9 EIS Appendix A of Appendix 10B 10 PMV Response 2016-03-02 p 28 lines 429 - 436
Pacific Region Science Response Technical Review Assessing
Ecosystem Productivity Model of Roberts Bank
11
components the EwE model is not informative with respect to understanding the potential impacts of the Project on biofilm and the Western Sandpiper While this example is specific to seabirds the potential exists for differences in the quality of biofilm to also be an issue for copepods which feed on biofilm and consequently to juvenile salmon which feed on these copepods (eg Sutherland et al 2013)
The EwE model is also not designed to predict effects of the Project on water quality although the Proponent noted that ldquoOther abiotic factors not included were deemed to be representative of variables that were already included in the modelhelliprdquo11 The Project may cause changes in physical and water quality conditions whether in isolation or in combination which may impact the productivity or nutritional quality of key prey organisms for local and migratory species which will not be captured by the model The EwE model does not assess the production of key nutrients or the implications of changes in important physical and water quality parameters to biofilm community structure and hence to important migratory birds
The model does not include biotic factors for both pelagic and benthic environments to assess the potential development of eutrophication and benthic organic enrichment events respectively Organic and redox indicators traditional measures of environmental assessments that are used to determine changes in functional group responses were included in the recent Deltaport Third environmental assessment (ie Pelagic chlorophyll dissolved nutrients Benthic sediment carbonnitrogen content redox state [sulfide concentration]) Benthic anoxic events based on organic enrichment are known to be strong drivers of community composition and exclusion regardless of substrate type In the absence of biotic factors (eg organic particulates) the model has not considered the potential for benthic organic enrichment which coincides with siltation processes within the upper tidal flats The tidal flat corner bordered by the Delta-dyke and Deltaport causeway has served as a catchment area for Fraser River silt since the development of the original Deltaport causeway (Sutherland et al 2013) The proposed position of the new terminal placed at the seaward termination of the Deltaport causeway may produce a crescent-shaped feature in the wake of the Fraser River Plume This feature may provide a more efficient silt trap that will promote benthic organic enrichment This piece of the environmental assessment seems to be missing and is important for assessing fish habitat in this area
335 Seasonality (model time step) Input data to parameterize the model were available on a range of time scales from hourly (eg physical data on salinity and water flow) to annual (eg species biomass) The Proponents indicated12 that this is a strength of the EwE model although ultimately the model was run with an annual time step with all sub-annual values being averaged to annual values This method therefore did not incorporate important seasonal processes such as winter-summer differences in salinity and storm properties and the seasonal appearances of abundances of predators and prey such as migratory salmon and birds that are much larger than the annual average For example juvenile salmon migrate from the Fraser River and onto Roberts Bank in the spring before moving into deeper waters If these spring abundances are averaged over the entire year these average abundances would be 5-10 times lower than the actual abundances during the spring (ie averaging the biomass that occurs in two months over a 12 month period) Additionally this method did not capture the intensity of processes such as growth and predation which can be focused over periods of a few weeks to a few months There may be important threshold effects at particular times and places which may be missed when using an 11 EIS Section 10 p 10-11 12 PMV Response 2016-03-02 p 86 line 1655
Pacific Region Science Response Technical Review Assessing
Ecosystem Productivity Model of Roberts Bank
12
annual time step for the model The Ecospace module has a monthly time step13 and therefore it is feasible to run this module with a sub-annual time step For example the Proponents submit14 that there are inadequate data to model the potential effects of the Project on the timing of biofilm production which could have implications for the migratory dunlin and Western Sandpiper However this could be modelled in an exploratory way to determine hypotheses about which factors could affect the timing of production of biofilm and the potential impacts on these birds These issues are of major concern to ECCC
336 Life history structure The EwE model did not separate functional groups into life history stages (stanzas) yet for many functional groups the juvenile stages can have very different life history characteristics and habitats than the adults It is unclear in the description of the model how different life history structures were considered and whether for example there were enough juveniles to produce the adults The implications of not including early life stages should be explored at least qualitatively to identify which species might have life stages that may be more vulnerable to project effects
337 Model balancing Balancing an EwE model is the process by which parameters are adjusted so that there is sufficient production for consumption requirements ie there are sufficient prey for all predators Expert opinion was used to examine parameter values and to adjust for errors or inconsistencies in logic ldquoPMV is confident that since the approach taken to balance the model was based on best practices the steps are appropriaterdquo15 Adjustments to initial parameters to ensure an ecologically-feasible model are necessary and to be expected For a few functional groups however very large changes to initial parameter estimates (which were often not based on Roberts Bank specific data) were necessary for example to transient killer whales When such initial parameters were adjusted (often by substantial amounts) by expert opinion to balance the model the confidence intervals around these adjusted parameter values were not increased to reflect this added uncertainty (see for example PMV Response 2016-03-02 p 51 lines 955-956) When expert opinion was used to make very large changes to initial parameter values broader confidence intervals about these parameters should have been applied This does not appear to have been the case and as a consequence may cause the actual uncertainty of the model outputs to be underestimated
Another example is for the pinniped group in which 50 of the diet was assumed to come from outside the model area in order to balance the model The rationale provided was ldquoThe pinnipeds caused excessive predation mortalities on numerous fish functional groups The biomass of pinnipeds was an average for the Strait of Georgia which was likely too high for Roberts Bank Therefore it was assumed that pinnipeds extracted only half of their diet from the study areardquo16 It is unclear whether the sensitivity of the model to different percentages of diet allocation was explored
As noted above (332) the Ecopath model was relatively unconstrained and few adjustments to input parameters were required to balance the model This is unusual and the low ecotrophic efficiencies of several functional groups suggest that full accounting of energy flows may not have been achieved (an ecotrophic efficiency of 1 indicates that 100 of the production of that
13 EIS Appendix 10C Section 29 p24 14 EIS Appendix 10D Appendix C p72 15 PMV Response 2016-03-02 p 49 lines 910-912 16 EIS Appendix 10C Section 261 p 20
Pacific Region Science Response Technical Review Assessing
Ecosystem Productivity Model of Roberts Bank
13
particular group is being preyed upon or removed by fishing leaving no individuals to die of old age17) An ldquoexcessrdquo of individuals dying of old age ie ecotrophic efficiencies much less than 1 suggests a potentially large biomass that is not used by the ecosystem and instead is converted to detritus
34 Model validation Model validation is the process by which the model parameters variables and outputs are compared with those from the real ecosystem to ascertain how well the model represents the ecosystem It is an essential step in providing confidence that the projections from the model in this case with and without the Project have relevance to how the real ecosystem may be expected to function with and without the Project In practice validating complex ecosystem models is difficult considering the range of assumptions that must be made when building the model the limited available data and natural variability of the ecosystem at a variety of time and space scales
Many of the standard diagnostics for the Ecopath model have not been evaluated in the EIS The Proponent appears to have assumed that once the Ecopath model was balanced then it was valid and fit for purpose The Proponent should provide all the Ecopath estimates of vital rates including mortality rates As presented questions remain For example many Ecotrophic Efficiencies (which control the transfer of biomass from prey to predators) are less than 1 even for taxa which would be expected to be close to 1 such as carnivorous zooplankton The reason for Ecotrophic Efficiencies less than 1 were not discussed or explained in the EIS
Detailed diagnostics for the Ecospace model should also be presented in order to evaluate model performance In response to criticisms by DFO ECCC and NRCan in discussions with the Proponent the latter provided the biomass of the functional groups from the Ecopath model (before Ecospace) and the Ecospace model after the spin-up period (which involved adjusting the parameters from the Ecopath model to balance the 5468 separate cells of the Ecospace model)18 The Proponents argue that ldquoIt is important to note that changes in biomass values generated during the spin-up period are identical for both with and without Project scenarios and thus do not provide information on the potential Project-related effects on productivity19 However several changes to biomass result from the Ecospace balancing process (spin-up period) This is only given brief attention by the Proponent in its response to the DFO ECCC and NRCan questions An analysis of Table 620 revealed that the biomass of 9 functional groups was larger or smaller than the widest confidence limits allowed for each group21 This requires further discussion and justification
The Proponent used a goodness of fit measure to compare spatial distributions of model outputs with field observations They indicated that ldquono other EwE models were identified which use a goodness-of-fit measure Hence the RB model is potentially the first such EwE model where a goodness of fit measure has been appliedrdquo22 The chosen goodness of fit measure is the percent correct classification (PCC) method23 This method derives a test statistic based on the proportion of locations at which predicted occurrences from the model match observed
17 EIS Appendix 10-B p 11 18 PMV Response 2016-03-02 p 65-66 Table 6 19 PMV Response 2016-03-02 p 64 lines 1205-1207 20 PMV Response 2016-03-02 p 65-66 Table 6 21 PMV Response 2016-03-02 p 45 Table 3 22 PMV Response 2016-03-02 p 78 lines 1481-1483 23 PMV Response 2016-03-02 p 78 lines 1483-1484
Pacific Region Science Response Technical Review Assessing
Ecosystem Productivity Model of Roberts Bank
14
occurrences from data and similarly with predicted and observed absences The Proponent then calculated two additional accuracy of fit measures sensitivity (the model predicts a species to occur in an area where it is known to occur in reality) and specificity (the model predicts a species does not occur in an area it is known not to occur in reality)24 This analysis concluded that the model has high predictability for functional groups such as eelgrass and sea pens with relatively static distributions but lower predictability for functional groups which are more temporally and spatially dynamic such as biofilm and green algae25
There are two problems with this approach The first is that this goodness of fit comparison was done only for habitat-forming functional groups no discussion of how well this analysis applies to mobile functional groups was provided The second problem is that this method does not take into account situations (such as occurs in this study with several groups) in which species occur at only a few locations For example ldquohellipif the test data consist of 95 absences and 5 presences and this reflects the true prevalence of the species on the landscape (a realistic scenario for a rare species) a lsquonullrsquo model that predicted absence in all cases (eg no model at all) would be correct 95 of the timehellipldquo (Franklin 2009 p 151) This latter point is important here as these habitat functional groups (biofilm brown algae native eelgrass green algae Japanese eelgrass tidal marsh biomat and orange sea pens26) appear not to occur over most of the Project area (as portrayed by the model outputs presented in the distribution figures of PMV Response 2016-03-02 Appendix 218) It is therefore important that a robust evaluation of the performance of the Ecospace module is used with preferably more than one measure
In summary the starting point for this modelling analysis matters It is not just about a comparison between results with and without the Project The model has to be considered a sufficient representation of the ecosystem The Proponent has not yet sufficiently validated the model
35 Model results 351 Presentation of model results
As noted above (Section 331) the stated objective of the Roberts Bank ecosystem model was not to provide an assessment of Project impacts for each functional group at a fine temporal scale but to estimate changes in productive potential with and without the Project at the ecosystem level27 However results were presented as comparisons by speciesfunctional group with and without the Project and not as potential changes in total ecosystem productivity The revised figures for each functional group showing distributions without the Project with the Project and their difference indicated impacts were likely to be localized with overall impacts relatively small The range of biomass ratios with and without the Project was 045 ndash 189 with most values slightly less than 1 This is interpreted as indicating slight decreases in the capacity of the study area to support biomass and production with the Project for many functional groups28 (Figure 2)
24 PMV Response 2016-03-02 p 80 lines 1524-1527 25 PMV Response 2016-03-02 p 81 lines 1551-1559 26 PMV Response 2016-03-02 p 82 Table 8 27 PMV Response 2016-03-02 p 99 lines 1914-1917 28 PMV Response 2016-03-02 Appendix 218
Pacific Region Science Response Technical Review Assessing
Ecosystem Productivity Model of Roberts Bank
15
Biomass Ratio
Freq
uenc
y
04 07 10 13 16 19
05
1015
2025
30
Figure 2 Histogram of biomass ratios obtained by comparisons of model runs with and without the project (ie With Without) Values less than 1 indicate reductions in biomass with the Project compared against without the Project) Data from Appendix 218 of PMV Response 2016-03-02
352 Sensitivity and vulnerability analyses Every ecosystem model is only one possible representation of the true ecosystem defined by the modelrsquos structure and the values chosen for its many parameters The key point is how well the model represents the real system how that fit can be measured and the sensitivity of model outputs to variability in the selected parameter values The ideal model should be robust to a wide range of uncertainties in the input data and parameters This robustness is determined by performing sensitivity analyses on the model to see how it responds to variations in the input parameters and determining to which input parameters the model is most sensitive
The vulnerability parameters determine the strength of the feeding interactions between functional groups They set the level of density dependence of each functional group Higher vulnerability settings provide greater top-down (predator) control whereas lower settings provide greater bottom-up (environmental) control29 Several publications have shown that EwE models are very sensitive to the vulnerability parameters and Christensen and Walters (2000) point out that a main pitfall of EwE is that ldquopredation vulnerabilities are often underestimated lessening the modelled impacts of predationrdquo It is usual practice to tune Ecopath models including the vulnerability parameters to time series data such as biomass using the temporal simulation model Ecosim However these data were not available for the RBT2 area so this robust method of fitting the model and estimating vulnerability parameters was not possible Instead a vulnerability setting of 2 was used as the default value for the key model runs which is ldquocommon practice when time series data are not available and estimates of vulnerability in the
29 PMV Response 2016-03-02 p 70 lines 1318-1323
Pacific Region Science Response Technical Review Assessing
Ecosystem Productivity Model of Roberts Bank
16
model cannot be maderdquo30 with sensitivity analyses run for a range of 15 to 3 This narrow range was criticized by DFOECCC in initial discussions about the model with the Proponent The Proponent subsequently reran the model with a larger range of vulnerabilities31 (11 to 10) and concluded this broader vulnerability range produced similar results for the productivity ratio with and without the Project to those in the original EIS and that the EIS was more likely to overestimate than underestimate potential project effects32 The data in Table 7 of the PMV Response33 did indicate changes in productivity ratios ranging from 0 to 50 of the defined key run (which used a vulnerability setting of 2) However the Proponent changed all vulnerability settings to the same value ie all were 2 or all were 10 etc In reality the vulnerability parameters resulting from Ecosim models that are fitted to data as described above vary by functional group which was not explored here Therefore although the results suggest that the original choice of 2 for the default key run seemed reasonable the potential effects of variability in vulnerability settings was not fully explored
Sensitivity analyses are usually based on the range of uncertainty estimated for input data and parameters often called the confidence limits around the model parameters The EwE framework integrates many different data sources and parameters including values from the literature It can therefore be difficult to identify ldquoreasonablerdquo confidence limits when derived from such diverse data sources Standard practice in Ecopath models has been to develop a pedigree for each parameter with default values for uncertainty based on the nature of the source data For example parameter values based on high precision field observations of biomass within the model domain receive default confidence intervals of 10 whereas parameter values based on models developed for elsewhere or professional judgment receive confidence intervals of 8034 Sensitivity analyses are then run using parameter values selected from within these confidence intervals However if these default confidence intervals do not capture the full range of variability then the outputs are not informative of the variability in the lsquorealrsquo ecosystem Field observations were collected for many functional groups within the model domain in 2012 and 2013 as part of studies to support the RBT2 EIS Apparently the purpose of these observations was to document spatial variability (in part for the Ecospace model) and temporal variability (measurements at one location over time) and not to derive confidence intervals around the observations35
The reliance on the pedigree approach to derive confidence intervals for this Roberts Bank model was criticized by DFO ECCC and NRCan in discussions with the Proponent As a result the Proponent reran the model with much larger confidence intervals ranging from 30 to 100 depending on the input parameter and functional group36 The results from this new analysis using the broader confidence intervals were similar to those using the original pedigree approach The Proponent noted that ldquoWhile the production within each helliprun was very different there was little difference in the biomass ratio [with and without the Project] These results further demonstrate that even with a greater range in input values the influence of the Project on the Roberts Bank ecosystem is consistent among allhellipmodel runsrdquo37 This provides confidence that the model may be robust to uncertainty in its input parameters Two concerns
30 PMV Response 2016-03-02 p 70 lines 1321-1322 31 PMV Response 2016-03-02 p 71-74 32 PMV Response 2016-03-02 p 71 lines 1339-1341 33 PMV Response 2016-03-02 p 73 34 EIS Appendix 10-C Section 251 page 18 35 PMV Response 2016-03-02 p 42 lines 772-777 36 PMV Response 2016-03-02 p 44-47 37 PMV Response 2016-03-02 p 47 lines 855-858 and see also PMV Response 2016-03-02 Appendix 27-B
Pacific Region Science Response Technical Review Assessing
Ecosystem Productivity Model of Roberts Bank
17
remain however The quote above indicates that the production among the different model runs was very different although with little difference in the biomass ratios with and without the Project Since biomass is not the same as production it would be informative for understanding model performance and potential impacts to show these production differences This also relates to the point made in Section 34 regarding how well the model represents the real ecosystem and not just within-model comparisons with and without the Project The second question is more technical and relates to how the randomization (Monte Carlo or MC) routine that was used to create multiple model runs used the uncertainty about the diet data Diets are not currently included in the MC routine available to regular users of the Ecosim model how they were handled in this RBT2 model appears not to be explained
Finally the sensitivity analyses indicate that the uncertainty in the input parameters does not lead to much difference between model parameters with or without the project However this conclusion does not describe how the uncertainty in the input parameters affects understanding of the ecosystem
40 Conclusions Overall the main conclusion of the Environmental Impact Statement from the Proponent is stated as ldquohellipafter the implementation of mitigation hellipthe Project is not expected to result in any significant adverse effects on any of the 16 valued componentsrdquo38 In addition ldquohellipapproximately 40 of the functional groups are forecast to change no more than 5 which hellip is judged to be within the uncertainty of the model runsrdquo39 although larger changes were forecast for orange sea pens freshwater biofilm green algae and raptors The conclusions from the modelling studies are that ldquohellipthe proposed project will have an impact on the study area that the effect varies between species and that the findings are robust to parameter uncertaintyrdquo40 Specific outcomes by valued component as derived from the EwE model are presented by functional groups in Table 1
38 PMV March 2015 Roberts Bank Environmental Impact Statement Executive Summary ndash Part 1 page 37 39 EIS Appendix 10-C p ii 40 EIS Appendix 10-D p iv
Pacific Region Science Response Technical Review Assessing
Ecosystem Productivity Model of Roberts Bank
18
Table 1 Changes in productive potential with the Project as derived from the EwE model
Changes in productive potential
Ecosystem category
Number of valued
components
Number with potential
biomass loss
Moderate decrease (31-60 decline)
Minor decrease (6-30 decline)
Negligible (0-5
change)
Minor increase (6-
30 increase)
Moderate increase (31-60 increase)
Source
Marine vegetation
7 7 - 3 2 2 - EIS Vol 3 Section 11 Table 11-17 page 11-65
Marine invertebrates
4 3 1 1 1 1 - EIS Vol 3 Section 12 Table 12-8 page 12-52
Marine fish 13 13 - 2 6 5 - EIS Vol 3 Section 13 Table 13-10 page 13-95
Coastal birds
11 8 - 3 4 3 1 EIS Vol 3 Section 15 Table 15-10 page 15-67
Pacific Region Science Response Technical Review Assessing
Ecosystem Productivity Model of Roberts Bank
19
Most functional groups showed some potential biomass loss with the Project with biomass loss defined as any model run with negative outcomes (ie in which biomass with the project was less than biomass without the Project) The summary of changes in productivity potential are mixed with most (33 out of 35) valued components showing minor decreases to minor increases (defined as 6 to 30 changes in productive potential with the Project compared to without the Project)
The main conclusions of this review in regards to the Terms of Reference are
1 Do the functional groups and abiotic variables used in the model adequately represent the ecosystem at Roberts Bank
o The 58 functional groups and abiotic variables used in the model adequately represent the main components of the Roberts Bank ecosystem however for longer lived species the life stages of the species are not well represented and some of the impacts of the Project may be expected to affect specific life stages
o The abiotic variables adequately represent the physical drivers of this ecosystem on an annual time scale However annual values for these abiotic variables may not adequately capture important sub-annual events such as storms (DFO 2016) the timing of arrival and departure of highly migratory species and whether there may be important sub-annual thresholds or mismatches in timing as a result of the Project
o Biotic factors (eg nutrients) which are particularly important for biofilm and other lower trophic level taxa are not included in this model The model is therefore unable to assess the potential development of eutrophication and benthic organic enrichment events which may affect fish habitats in the study area
2 Are the parameter estimates used by the model valid and defensible for this system
o In general parameter estimates appear to be adequate for this system Field studies were done in two years to provide data in particular on distributions of selected functional groups for the Ecospace module Note the distribution studies focussed on taxa which were relatively immobile and therefore lsquofixedrsquo in space
o the selection of some model parameters would benefit from further explanation for example the choice of fixed diet matrices versus dynamic matrices which can vary with changes in abundances or predators and prey
o the selection of some model parameters would benefit from further explanation for example the link between the diets described in the text of Appendix 10B and the quantities presented in Appendix A of Appendix 10B It is understood that proportions were derived using the ldquofixed selectivityrdquo principle but in order to be fully transparent the derivation of each diet should be provided in an appendix
o discussion and explanation is needed of why ecotrophic efficiencies differ from expected values (eg the ecotrophic efficiency for Pacific herring is listed as 038) and
o the abiotic factor lsquosubstratersquo was limited to ldquohardrdquo or rdquosoftrdquo options which can be restrictive given that they serve as endpoints on a substrate composition continuum These limited options may not provide the sensitivity required to assess substrate preference nor the flexibility for taxa (eg motile organisms) that span hard mixed and soft substrate types In addition it is not clear if changes in the hardsoft categories were considered over time within identified depositional or erosional settings before and after construction
Pacific Region Science Response Technical Review Assessing
Ecosystem Productivity Model of Roberts Bank
20
3 Are the limitations and uncertainties of the model identified and appropriately considered when determining the modelrsquos representation of current and possible future conditions
o the EwE model was not designed to evaluate a range of future conditions It was designed to estimate changes in the productive potential at the ecosystem level with and without the Project Therefore the model was run without the Project and with the Project for a range of plausible abiotic conditions and the results were compared with respect to biomass and productivity by functional group
o the pedigree approach to assessing the uncertainties of model outcomes is unsatisfactory for the purpose here as it relates solely to a qualitative judgment of the value of data based on its source However when the model was rerun with much wider ranges of confidence intervals (uncertainties) the results in general (but not necessarily for each functional group) were similar to the results using the original pedigree approach This suggests that taken overall the model may be robust to wide ranges of uncertainty in these input variables and parameters
o there is inadequate validation of the model This is inadequate for three reasons
(i) the basic Ecopath model is not validated and the Ecospace balancing process (the spin-up period) resulted in some biomass estimates being increased or decreased beyond their confidence limits
(ii) the goodness of fit test used to evaluate how well the model predicted the spatial occurrence functional groups is not fit for purpose (Section 34) and
(iii) validation was provided for only a small number of functional groups (the habitat-forming functional groups) As a consequence the model is currently not validated
o Considering the proportion of open boundaries relative to closed boundaries in the model processes taking place outside the modelled ecosystem are likely to contribute to dynamics within the modelled ecosystem However these external processes may not be well-resolved by the EwE model as currently configured
4 Are the model results related to the potential effects of the Project on fish and fish habitat and migratory birds and their food resources valid and defensible
o this is a very complex ecosystem model constructed for a relatively small and open (in the sense of considerable exchange with adjacent non-modelled areas) system Many assumptions have been made based on poor or missing data Taking all these considerations into account the model does the best job possible of comparing the biomass and productivity of the Roberts Bank ecosystem with and without the Project
o the extent to which the model adequately represents the lsquorealrsquo ecosystem of Roberts Bank as opposed to comparisons of model results with and without the Project is unclear as a number of basic diagnostics are not presented (see point 3 above)
o the EwE model is not capable of and is not designed to represent nutritional and food quality variations in prey functional groups and how these may impact highly migratory predators such as birds with and without the Project
5 Is the EwE model framework a valid method to quantify large scale impacts to fish habitat fish productivity and migratory bird productivity
o the EwE model as implemented in this project and reviewed here is a useful first-order framework to organise information and derive initial estimates of how the system may respond to perturbations
Pacific Region Science Response Technical Review Assessing
Ecosystem Productivity Model of Roberts Bank
21
o the utility of a EWE model for impact purposes is highly dependent on the quality of input data
o each EwE model is highly dependent on local conditions Although appropriate as an overall methodology each application would need to be reviewed for how it may be applied to any new ecosystem and
o the EwE model would need to be substantially reformulated if it was to include considerations of changes in chemical composition or food quality of prey in particular for seasonal migratory species such as birds which may depend on very large biomasses of prey with specific chemical composition to fuel their migrations beyond the ecosystem model boundaries
Contributors Contributor Affiliation Ian Perry Author DFO Science Pacific Region Alida Bundy Author DFO Science Maritimes Region Terri Sutherland Author DFO Science Pacific Region Robert Elner Author ECCC Canadian Wildlife Service Andrew Robinson Author ECCC Canadian Wildlife Service Lesley MacDougall Editor DFO Science Pacific Region
Approved by Carmel Lowe
Regional Director Science Branch Pacific Region Fisheries and Oceans Canada
November 4 2016
Sources of Information Christensen V Coll M Steenbeek J Buszowski J Chagaris D walters CJ 2014
Representing variable habitat quality in a spatial food web model Ecosystems 17 1397-1412
Christensen V and Walters C 2000 Ecopath with Ecosim methods capabilities and limitations Ecological Modelling 172 109-139
Colleacuteter M Valls A Guitton J Gascuel D Pauly D and Christensen V 2015 Global overview of the applications of the Ecopath with Ecosim modeling approach using the EcoBase models repository Ecological Modelling 302 pp42-53
Compass Resource Management Ltd 2013 Roberts Bank Terminal 2 Technical Advisory Group (TAG) Process Report Productive Capacity ndash Final Report 119pp (Accessed November 1 2016)
DFO 2016 Technical Review of Roberts Bank Terminal 2 Environmental Assessment Section 95 ndash Coastal Geomorphology DFO Can Sci Advis Sec Sci Resp 2016045 (Accessed November 4 2016)
Pacific Region Science Response Technical Review Assessing
Ecosystem Productivity Model of Roberts Bank
22
ESSA Technologies 2014a Roberts Bank Terminal 2 Project Roberts Bank Delta BC Environmental Impact Statement Volume 3 Biophysical Effects Assessments Appendix 10-C Roberts Bank Ecosystem Model Development and Key Run Port Metro Vancouver (Accessed November 1 2016)
ESSA Technologies 2014b Roberts Bank Terminal 2 Project Roberts Bank Delta BC Environmental Impact Statement Volume 3 Biophysical Effects Assessments Appendix 10-D Roberts Bank Ecosystem Model Sensitivity Analyses Port Metro Vancouver (Accessed November 1 2016)
Franklin J 2009 Mapping Species Distributions Spatial Inference and Prediction Cambridge University Press Cambridge
Hemmera 2014 Roberts Bank Terminal 2 Project Roberts Bank Delta BC Environmental Impact Statement Volume 3 Biophysical Effects Assessments Appendix 10-B Roberts Bank Ecosystem Model Parameter Estimates Port Metro Vancouver File 302-03503 (Accessed November 1 2016)
Port Metro Vancouver 2015a Roberts Bank Terminal 2 Project Roberts Bank Delta BC Environmental Impact Statement Volume 3 Biophysical Effects Assessments Section 100 Biophysical Setting (Accessed November 1 2016)
Port Metro Vancouver 2015b Roberts Bank Terminal 2 Project Roberts Bank Delta BC Environmental Impact Statement Volume 3 Biophysical Effects Assessments Section 103 Overview of Assessing Ecosystem Productivity (Accessed November 1 2016)
Port Metro Vancouver 2015c Roberts Bank Terminal 2 Project Environmental Assessment Additional Information Requirements (July 31 2015) Responses Response to Information Request 6 IR-73115-06 Canadian Environmental Assessment Agency Reference Number 80054 dated 26 October 2015
Steenbeek J Coll M Gurney L Meacutelin F Hoepffner N Buszowski J and Christensen V 2013 Bridging the gap between ecosystem modeling tools and geographic information systems Driving a food web model with external spatialndashtemporal data Ecological Modelling 263 139ndash 151
Sutherland T Elner R and OrsquoNeill J 2013 Roberts Bank Ecological crucible of the Fraser River estuary Progress in Oceanography 115 171ndash180
Vancouver Fraser Port Authority 2016 From the Vancouver Fraser Port Authority to the Review Panel re Answers to preliminary technical questions submitted during the completeness phase from Fisheries and Oceans Canada Natural Resources Canada and Environment and Climate Change Canada concerning the ecosystem modelling to support the Roberts Bank Terminal 2 Project environmental review CEAR Document 547 (Accessed November 1 2016)
Pacific Region Science Response Technical Review Assessing
Ecosystem Productivity Model of Roberts Bank
23
This Report is Available from the Centre for Science Advice
Pacific Region Fisheries and Oceans Canada
3190 Hammond Bay Road Nanaimo BC V9T 6N7
Telephone (250) 756-7208 E-Mail csapdfo-mpogcca
Internet address wwwdfo-mpogccacsas-sccs
ISSN 1919-3769 copy Her Majesty the Queen in Right of Canada 2016
Correct Citation for this Publication
DFO 2016 Technical review of Roberts Bank Terminal 2 environmental assessment section 103 ndash assessing ecosystem productivity DFO Can Sci Advis Sec Sci Resp 2016050
Aussi disponible en franccedilais
MPO 2016 Examen technique de leacutevaluation environnementale du Terminal 2 agrave Roberts Bank section 103 ndash eacutevaluation de la productiviteacute de leacutecosystegraveme Secr can de consult sci du MPO Reacutep des Sci 2016050
- TECHNICAL REVIEW OF ROBERTS BANK TERMINAL 2 ENVIRONMENTAL ASSESSMENT SECTION 103 ndash ASSESSING ECOSYSTEM PRODUCTIVITY
-
- 10 Context
- 20 Background
-
- 21 Background and Terms of Reference
- 22 Approach to assessing ecosystem productivity
-
- 30 Analysis and Response
-
- 31 The EwE Team
- 32 Overview of assessment results of hydrological and sediment modelling
- 33 Model implementation
-
- 331 The purpose of the EwE model
- 332 Applicability of the EwE model framework to the Roberts Bank region
- 333 Model documentation
- 334 Highly mobile functional groups
- 335 Seasonality (model time step)
- 336 Life history structure
- 337 Model balancing
-
- 34 Model validation
- 35 Model results
-
- 351 Presentation of model results
- 352 Sensitivity and vulnerability analyses
-
- 40 Conclusions
- Contributors
- Approved by
- Sources of Information
- This Report is Available from the
-
- CSAS 2016-50 - Assessing Ecosystem Productivitypdf
-
- TECHNICAL REVIEW OF ROBERTS BANK TERMINAL 2 ENVIRONMENTAL ASSESSMENT SECTION 103 ndash ASSESSING ECOSYSTEM PRODUCTIVITY
-
- 10 Context
- 20 Background
-
- 21 Background and Terms of Reference
- 22 Approach to assessing ecosystem productivity
-
- 30 Analysis and Response
-
- 31 The EwE Team
- 32 Overview of assessment results of hydrological and sediment modelling
- 33 Model implementation
-
- 331 The purpose of the EwE model
- 332 Applicability of the EwE model framework to the Roberts Bank region
- 333 Model documentation
- 334 Highly mobile functional groups
- 335 Seasonality (model time step)
- 336 Life history structure
- 337 Model balancing
-
- 34 Model validation
- 35 Model results
-
- 351 Presentation of model results
- 352 Sensitivity and vulnerability analyses
-
- 40 Conclusions
- Contributors
- Approved by
- Sources of Information
- This Report is Available from the
-
Canadian Science Advisory Secretariat Pacific Region Science Response 2016050
December 2016
TECHNICAL REVIEW OF ROBERTS BANK TERMINAL 2 ENVIRONMENTAL ASSESSMENT SECTION 103 ndash
ASSESSING ECOSYSTEM PRODUCTIVITY
10 Context Vancouver Fraser Port Authority (VFPA) formerly Port Metro Vancouver (the Proponent) is proposing to construct and operate the Roberts Bank Terminal 2 Project (the Project) a new three-berth marine container terminal at Roberts Bank in Delta British Columbia The proposed terminal is located next to the existing Deltaport and Westshore Terminals In addition to the construction of the new terminal the Proponent has proposed to widen the north side of the existing Roberts Bank causeway from its east-end connection with the mainland to the entrance to the new terminal The existing tug basin connected to the northeast side of Deltaport Terminal is also proposed to be expanded The new marine terminal is predicted by the Proponent to process up to 260 container ship calls per year at full capacity with the assistance of two or three large berthing or escort tugs to manoeuver ships into or away from assigned berths The terminal is designed to operate 24 hours per day year-round
The Roberts Bank Terminal 2 Project is subject to an environmental assessment by a Review Panel pursuant to the Canadian Environmental Assessment Act 2012 As a federal authority in the environmental assessment for the Project Fisheries and Oceans Canada (DFO) will be asked to present information to the review panel and at public hearings in relation to its expertise on the effects of the Project on fish and fish habitat including aquatic species at risk and the adequacy of mitigation and offsetting measures and monitoring and follow-up programs proposed by the Proponent DFOrsquos Pacific Region Fisheries Protection Program (FPP) will coordinate DFOrsquos participation in the environmental assessment
The Proponent assessed future ecosystem productivity at Roberts Bank using the Ecopath with Ecosim and Ecospace (EwE) model framework The potential impacts of the Project to hydrodynamic conditions and sediment transport in the area as a result of changes in wind wave and current patterns and intensities are projected using different model frameworks A companion Science Response (DFO 2016) has been developed by DFO and Natural Resource Canada (NRCan) to review Section 95 ldquoCoastal Geomorphologyrdquo of the Environmental Impact Statement (EIS) which describes the hydrodynamic and sedimentology models that were used to evaluate the effect of the Project on water and sediment movements
Outcomes of the EwE models are incorporated into the analysis of the potential project-related effects on the ongoing productivity of commercial recreational and Aboriginal fisheries Consequently DFO FPP has requested that DFO Science Branch provide an evaluation of the Proponentrsquos characterization of project-related effects as conducted using the Ecopath with Ecosim and Ecospace (EwE) ecosystem model
Pacific Region Science Response Technical Review Assessing
Ecosystem Productivity Model of Roberts Bank
2
The objectives for this Science Response are to
1 Determine if the functional groups and abiotic factors used in the model adequately represent the ecosystem at Roberts Bank
2 Assess whether the parameter estimates used by the model are valid and defensible for this system
3 Assess whether the limitations and uncertainties of the model are identified and appropriately considered when determining the modelrsquos representation of current and possible future conditions
4 Provide advice regarding whether the model results related to the potential effects of the Project on fish and fish habitat and migratory birds and their food resources are valid and defensible
5 If possible provide advice regarding the validity of using the EwE model framework to quantify large scale impacts to fish habitat and fisheries productivity and the productivity of migratory birds
This Science Response evaluates Section 100 ldquoBiophysical Settingrdquo with a focus on Section 103 ldquoOverview of Assessing Ecosystem Productivityrdquo in the EIS as submitted by the Proponent (Port Metro Vancouver 2015) This Section and consequently this Response describes the ecosystem modelling approach that was taken to evaluate the direct and indirect effects of the footprint of the proposed terminal and widened causeway herein referred to as lsquothe Projectrsquo This ecosystem model provides outputs related to potential effects of the project on the study area at an ecosystem level including aquatic species and bird species in the Project area Evaluation of the model and its outputs therefore required expertise in both fishery aquatic species and migratory bird species Consequently this Science Response is the product of a joint review between DFO and Environment and Climate Change Canada (ECCC) Canadian Wildlife Service and Wildlife and Landscape Science to provide a complete evaluation
This Science Response Report results from the Science Response Process of July 2016 on the Technical Review of Ecopath with Ecosim and Ecospace (EwE) Ecosystem Productivity Model application to the Roberts Bank Terminal 2 Environmental Assessment
20 Background
21 Background and Terms of Reference The Projectrsquos main components have a proposed combined marine footprint area of approximately 179 km2 listed below by specific component
bull Marine Terminal 1335 km 2 including terminal (116 km 2) and dredged berth pocket and marine approach areas (0174 km 2)
bull Widened Causeway 0424 km 2
bull Expanded Tug basin 0031 km 2
Roberts Bank in the Fraser River estuary consists of complex intertidal and subtidal habitats including intertidal eelgrass beds and is an important stopover area for migrating shorebirds and productive feeding and rearing habitats for many fish and invertebrate species It also provides habitat for endangered Southern Resident Killer Whales and other marine mammals
Pacific Region Science Response Technical Review Assessing
Ecosystem Productivity Model of Roberts Bank
3
The environmental conditions at Roberts Bank are dynamic and are influenced by a variety of oceanographic and atmospheric factors including the Fraser River freshwater and sediment plume discharge diurnal tidal currents and prevailing and storm-generated wind and wave activity In addition the intercauseway region provides significant drainage from marsh and agricultural areas which have different characteristics from marine waters and which run along the ferry causeway
To provide the required science advice this Science Response focusses on Section 10 ldquoBiophysical Settingrdquo of the Environmental Impact Statement (EIS) (Port Metro Vancouver 2015a) specifically Section 103 ldquoOverview of Assessing Ecosystem Productivityrdquo (Port Metro Vancouver 2015b) and its related Appendices 10-B ldquoRoberts Bank Ecopath with Ecosim and Ecospace model parameter estimatesrdquo (Hemmera 2014) Appendix 10-C ldquoRoberts Bank Ecosystem model development and key runsrdquo(ESSA Technologies 2014a) and Appendix 10-D ldquoRoberts Bank Ecosystem model sensitivity analysesrdquo (ESSA Technologies 2014b) Additional important information was obtained from the Response to Information Request 6 (IR-73115-06 Canadian Environmental Assessment Agency Reference Number 80054 dated 26 October 2015) (Port Metro Vancouver 2015c) and the Written Responses to Coastal Geomorphology and Ecosystem Modelling Questions provided by the Proponent to DFO ECCC and NRCan on 2 March 2016 (Port Metro Vancouver (PMV) Transmittal TRE-01-RBT2-0004A subsequently referred in this Science Response as ldquoPMV Response 2016-03-02rdquo) (Vancouver Fraser Port Authority 2016)
The process followed in preparing this Science Response involved an initial review of the submitted EIS followed by an in-person meeting of the Proponent its contractors and representatives of DFO ECCC and NRCan to discuss and clarify questions arising from the initial review (Vancouver 23 November 2015) DFO and NRCan provided written questions to the Proponent based on preliminary review of the EIS on November 19 2015 ECCC also provided written questions based on its preliminary review of the EIS to the Proponent on December 1 2015 and January 20 2016 This large initial meeting was followed by smaller focussed meetings between the Proponent its contractors and DFO and NRCan on 11 December 2015 to clarify hydrology and sediment modelling questions with DFO on 8 January 2016 to clarify ecosystem modelling questions and with ECCC on 18 February 2016 to clarify questions relating to birds Written responses to all of these meetings and questions were provided by the Proponent to DFO ECCC and NRCan as the ldquoPMV Response 2016-03-02rdquo and ldquoPMV Response 2016-05-30rdquo (Vancouver Fraser Port Authority 2016) VFPArsquos answers to questions posed by DFO and NRCan regarding coastal geomorphology modelling have been posted to the Canadian Environmental Assessment Registry (CEAR)
22 Approach to assessing ecosystem productivity The Proponent adopted an ecosystem approach to evaluate the direct and indirect effects of the Project on the productivity of the Roberts Bank ecosystem A weight of evidence approach was used to assess the potential effects of the project on the productivity of the ecosystem and selected key components in the study area this approach included a spatial ecosystem simulation model (which included a habitat capacity model) a shorebird opportunity model and empirical data An important point is that any effects on the system during the construction phase or from expansion of the tug basin were excluded from this modelling process the focus instead being a comparison of modelled system productivity before and after the proposed terminal and expanded causeway is in place The chosen ecosystem simulation model was
Pacific Region Science Response Technical Review Assessing
Ecosystem Productivity Model of Roberts Bank
4
Ecopath with Ecosim and its spatial version Ecospace (collectively referred to here as the EwE framework or EwE model) This modelling approach was recommended by a prior Productive Capacity Technical Advisory Group comprised of representatives of technical experts from government agencies academia non-governmental organizations Vancouver Fraser Port Authority and its consultants (Compass 2013) convened by the Proponent and which also recommended a selection of focal species for the model The final selection of functional groups and the resulting food web that form the core of this ecosystem model are shown in Figure 1
Pacific Region Science Response Technical Review Assessing
Ecosystem Productivity Model of Roberts Bank
5
Figure 1 Ecopath with Ecosim model food web for Roberts Bank (Adapted from EIS Volume 3 Section 10 Fig 1033 on page 10-16) The groups coloured in orange represent focal groups size of symbols represents relative annual amount of biomass in the Roberts Bank study area
Pacific Region Science Response Technical Review Assessing
Ecosystem Productivity Model of Roberts Bank
6
The EwE framework is a common approach to ecosystem modelling which has been developed and expanded over the past two to three decades It currently has three main components
1 Ecopath ndash the core model which provides a mass-balance snapshot of the system
2 Ecosim ndash a module that enables simulation modelling over time
3 Ecospace ndash a module that enables simulation modelling over space
In order to make an EwE model tractable species are aggregated into functional groups based on their similar ecological characteristics (habitat and prey preferences etc) the Roberts Bank models had 58 functional groups The first step (Ecopath) was to obtain input parameters representing biomass production consumption emigration and diet for each functional group These parameters were then tuned in an iterative process until the overall production and consumption was balanced (a mass-balance approach) resulting in a model food web with estimates of energy flow between functional groups (Fig 1)
In the second step Ecosim was combined with the spatial model Ecospace The abiotic variables selected in this EIS (depth salinity bottom current wave height sediment type) were used as external forcings to the Ecospace module These abiotic variables provided the physical forcings for the simulations without and with the Project Since time series data on the functional groups of the model were not available Ecospace was run until the model reached equilibrium using various assumptions of the value of the vulnerability parameter (see Section 352) In this EIS the selected time step was annual with all variables abiotic and biotic expressed as yearly averages As used in this EIS the Ecospace module included a habitat capacity model which estimated the distribution of functional groups based on their environmental preferences for each abiotic variable (depth salinity bottom current wave height) and for substrate type (sand mud etc) The model thus allocated the spatial distribution of functional groups over the model domain based on their environmental preferences and the distributions of these abiotic variables with and without the Project The selected spatial unit size (ldquopixelrdquo) for the Ecospace model was 100 m2 In essence an Ecopath model was constructed for each pixel with particular rules governing how the functional groups interacted and moved among these spatial units The Ecospace module was run until it approached equilibrium (20 model years) to establish the spatial patterns without the Project For the lsquowith the Projectrsquo simulations the model was run for an initial 10 years and then the spatial patterns of the abiotic variables with the project were added and the model run for an additional 10 years1 The model outputs predicted changes in the productive potential of the Roberts Bank ecosystem as a comparison (ratio) with and without the Project rather than an absolute biomass that would be lost or gained as a result of the Project
1 EIS Appendix 10-C p 26
Pacific Region Science Response Technical Review Assessing
Ecosystem Productivity Model of Roberts Bank
7
30 Analysis and Response To prepare this response the following sections of the EIS additional documents were reviewed
DocumentSection Title
EIS Section 10
Including appendices 10B 10C and 10D
(Port Metro Vancouver 2015a Hemmera 2014 ESSA Technologies 2014a ESSA Technologies 2014b)
Biophysical Setting
Appendix 10-B Roberts Bank Ecosystem Model Parameter Estimates Port Metro Vancouver File 302-03503
Appendix 10-C Roberts Bank Ecosystem Model Development and Key Run Port Metro Vancouver
Appendix 10-D Roberts Bank Ecosystem Model Sensitivity Analyses Port Metro Vancouver
CEAR document 547 (Including Appendices) ldquoPMV Response 2016-03-02rdquo and ldquoPMV Response 2016-05-30rdquo
(Vancouver Fraser Port Authority 2016)
Vancouver Fraser Port Authority to the Review Panel re Answers to preliminary technical questions submitted during the completeness phase from Fisheries and Oceans Canada Natural Resources Canada and Environment and Climate Change Canada concerning the ecosystem modelling to support the Roberts Bank Terminal 2 Project environmental review
31 The EwE Team Building this ecosystem model was a complex undertaking which required knowledge of the ecosystem to be modelled how to set initial parameter values determination of reasonable ranges of these parameters how to balance the model and how to recognize when the model outputs were unrealistic These tasks became even more complex when spatial model dynamics were involved such as with Ecospace The team engaged by the Proponent to conduct this ecosystem modelling for the Roberts Bank Terminal 2 (RBT2) EIS was led by scientists at the Institute for Oceans and Fisheries located at the University of British Columbia in Vancouver These scientists are global leaders of the EwE model framework having developed much of its current implementation and who continue to lead its elaborations and extensions Construction and running of the model for this specific ecosystem was done in collaboration with ESSA Technologies of Vancouver Parameter values for the ecosystem model were obtained in part from observational studies conducted in the area by Hemmera of Burnaby BC
32 Overview of assessment results of hydrological and sediment modelling Implementation of the ldquowith the Projectrdquo simulations of the ecosystem model was done by driving the model with the abiotic variables as they were projected to be distributed with the Project footprint In the context of this EIS specifying depth salinity bottom currents wave height and sediment type conditions without the Project and changes with the Project were achieved by construction of hydrodynamical and sediment transport models The outputs from these models in combination with the identified environment preferences for the various biological groups were then used as inputs to the Ecospace model to define the spatial
Pacific Region Science Response Technical Review Assessing
Ecosystem Productivity Model of Roberts Bank
8
distributions of these functional groups The implementation of these hydrological and sediment transport models in this EIS was reviewed by DFO and NRCan (DFO 2016) This review concluded that the implementation of these models for this EIS was adequate for average winter conditions but lacking in validation for summer conditions in particular with strong freshwater flows from the Fraser River Simulations of strong storm events and their impacts on wave conditions and sediment transport were also lacking The effect of wave action and current speeds on sediment transport is non-linear such that increasing winds over short periods of time can impact sediment transport processes bottom topography and water depths beyond that determined under average model conditions Overall the review concluded that a greater range of sensitivity analyses is required to have confidence in the model outputs under lsquonon-averagersquo conditions The implication of this conclusion for the present review of the EwE model is that the full range of variability of abiotic characteristics such as bottom topography bottom current and wave heights and how they may affect relevant functional groups in the model with the Project may not be adequately represented Sensitivity analyses were provided by varying the intensity of abiotic variables and by removing abiotic variables to assess their interactive effects In general the ecosystem model outputs were robust to these sensitivity analyses with most groups varying by less than 5 Larger changes however were observed for primary producer and bird groupings and for some fish groups when various abiotic variables were omitted2
33 Model implementation 331 The purpose of the EwE model
The EwE model was intended to provide one line of evidence to assess the potential impacts of the Project on the Roberts Bank ecosystem which would then be used with other lines of evidence to make the final assessment Specifically ldquohellip the objective of the RB [Roberts Bank] model was not to provide an assessment of Project impacts for each functional group at a fine temporal scale but to estimate changes in productive potential with and without the Project at the ecosystem levelrdquo3 In addition ldquohellipthe primary objective of the RB ecosystem model is to evaluate potential changes in productivity from such abiotic factors with and without the terminal and causewayrdquo4 Results are presented for the selected functional groups no results were presented on potential changes in ecosystem structure or function
332 Applicability of the EwE model framework to the Roberts Bank region EwE models work best when the exchanges within the system being modelled are greater than the exchanges between the modelled system and the lsquooutsidersquo world In practice this means that EwE models work best for larger systems with few external exchanges In a meta-analysis of 433 Ecopath models Colleacuteter et al (2015) concluded that ldquohellipin the last two decades the range of the models area has expanded toward very large areas and the median has shifted accordingly from about 1000 km2 in 1984ndash1993 to about 100000 km2 in 1994ndash2014rdquo The section of the Roberts Bank ecosystem that is included in the EwE model was comparatively small (5468 km2) and complex It is an intertidally-dominated environment that is subject to strong seasonal influences of both freshwater and marine exchanges across relatively large seaward and shoreward boundaries
2 EIS Appendix 10-D p ii - iii 3 PMV Response 2016-03-02 p 99 lines 1914-1917 4 PMV Response 2016-03-02 p 38 lines 689-691
Pacific Region Science Response Technical Review Assessing
Ecosystem Productivity Model of Roberts Bank
9
Processes taking place outside the modelled ecosystem will contribute to dynamics within the modelled ecosystem (eg lsquooutsidersquo food supporting predators which occur in the Roberts Bank ecosystem for only part of the year predators which may feed in the Roberts Bank ecosystem but export this energy when they migrate out of the region) but which may not be well-resolved by the EwE model The Proponent justifies the spatial scale because it was specifically chosen for the questions being asked in regard to assessing productivity changes and because the relative influences of external exchanges are assumed to be identical with and without the project In addition highly mobile species with broad prey bases were assumed in the model to be partially sustained by external energy from outside the model system5 The distributions of organisms may differ however with and without the project which may affect their interactions with areas outside of the modelled system and the use of diets from outside the modelled system may not reflect the impacts of the project Further clarification of how the EwE model captures the exchanges and interactions with adjacent ecosystems are needed For example it could be argued that an ecosystem which is open to frequent exchanges of water and organic matter from beyond its boundaries might be more robust to local disturbances such as the Project
There are some inconsistencies in the information and assumptions used for some of the taxa in this ecosystem model For Dungeness Crab the justification for estimating total adult biomass (including females) from the biomass of fished males is unclear In addition it is unclear if the slower growth of female crabs once they have reached sexual maturity in comparison with male crabs has been considered The diet matrix for spiny dogfish does not represent the actual diet well in particular of euphausiids herring and shrimp and there are more recent references for biomass estimates of spiny dogfish in the study area than what was used in the EIS
Fishing mortality was not included in the model under the assumption that this would not change with or without the project While this assumption may be true the model has been parameterized by ignoring a source of mortality that will influence total production In essence fishing removes biomass from the ecosystem with the result that less biomass will be available for higher trophic levels How this may impact the ecosystem with and without the Project is unclear but it could make noticeable differences if for example there were thresholds in the feeding responses by these higher trophic level species The Ecopath model that was used is relatively unconstrained since many ecological efficiencies are low even for forage species which would be expected to be higher It is not clear how many species are exploited or the levels of exploitation but even if this does not change with the Project these mortality rates should be included in the model in order to add realistic constraints to the exploited functional groups
333 Model documentation Based on questions from DFO ECCC and NRCan following their initial review of the EIS the Proponent provided written responses dated 2 March 2016 to clarify several of the steps in the model development and implementation However several questions remain including questions about the Ecospace module Ecospace has undergone several recent developments such as the inclusion of the spatial-temporal data layer framework (Steenbeek et al 2013) the habitat capacity model (Christensen et al 2014) and the Monte Carlo analysis including the diet matrix As yet there are few published studies using these latest Ecospace developments and their documentation and justification need to be improved in the EIS
5 PMV Response 2016-03-02 p 29 lines 446 - 464
Pacific Region Science Response Technical Review Assessing
Ecosystem Productivity Model of Roberts Bank
10
Questions also remain regarding how the Monte Carlo randomization routine treated diet data The report indicates that the Monte Carlo routine randomly selected input parameters from the input ranges and that only models that were balanced were used This suggests that a high proportion of models were not balanced and therefore were not used (for example the EIS indicates that about one out of 1000 sampled input parameters was balanced6) A table showing the minimum maximum mode average and median values from the Monte Carlo runs for all the parameters would enable an evaluation of how much variation was actually sampled by the balanced model runs This is recommended in the EwE user information ie ldquoUsers should check the range of the input parameters that were actually used in the trials in the output csv file (see below)rdquo7
In addition there are several issues with the documentation of the derivation of the parameters for the functional groups Such documentation should clearly outline how the input parameter was estimated and the range of uncertainty for that parameter For example the input biomass of pinnipeds was defined as 04 t km 2 derived from estimates of 034 for Harbour seals and two estimates for Steller sea lions (012 and 014 t km 2) No explanation was provided for how the overall estimated pinniped biomass of 04 t km 2 was determined The diet of Sand Lance was described in the EIS as consisting mostly of zooplankton8 whereas the diet table for the model runs9 included 20 macrofauna 10 green algae and 10 detritus It is unclear why these additional prey were included in the diet used for the model runs
334 Highly mobile functional groups This implementation of the EwE framework included transient and migratory functional groups This is entirely appropriate and these groups cannot be excluded The approach taken in the Ecospace module was to impose a low (and conservative) dispersal rate among model spatial units (lsquopixelsrsquo) of 1 km yr-1 This may be appropriate for low mobility benthic organisms but it likely underestimates the movements of many other functional groups The effects of using higher and perhaps functional-group-specific dispersal rates was not considered The Proponents argued that higher dispersal rates would reduce impacts since species can move away from less desirable areas more quickly for completeness these runs should be done and evaluated Mobile species will also bring energy (food) captured outside the system into the modelled ecosystem This process was included in the model with the use of a diet import factor reflecting the consumption of prey outside the modelled region with the assumption that groups with high import rates were unlikely to respond to local changes on Roberts Bank10 This assumption needs justification perhaps at the functional group level for example many species of highly migratory birds and Pacific salmon use the Roberts Bank ecosystem to obtain food to continue their migrations Although this food does not compose a large fraction of their annual consumption it can be critical to enable them to continue their migrations
The EwE model is not designed to capture differences in prey quality ie differences in essential fatty acid or nutrient ratios The same species of prey may have greater or lesser nutritional value to predators depending on the conditions under which they are growing and their seasonal variations This is a particular concern with the nutritional quality of the diatom-dominated biofilm Diatomaceous biofilm is important to the highly migratory Western Sandpiper (Calidris mauri) Despite its predictive merits in relation to other ecosystem
6 EIS Appendix 10D Section 24 p5 7 EwE Help file p 151 8 EIS Appendix 10B Section 4133 p 76 9 EIS Appendix A of Appendix 10B 10 PMV Response 2016-03-02 p 28 lines 429 - 436
Pacific Region Science Response Technical Review Assessing
Ecosystem Productivity Model of Roberts Bank
11
components the EwE model is not informative with respect to understanding the potential impacts of the Project on biofilm and the Western Sandpiper While this example is specific to seabirds the potential exists for differences in the quality of biofilm to also be an issue for copepods which feed on biofilm and consequently to juvenile salmon which feed on these copepods (eg Sutherland et al 2013)
The EwE model is also not designed to predict effects of the Project on water quality although the Proponent noted that ldquoOther abiotic factors not included were deemed to be representative of variables that were already included in the modelhelliprdquo11 The Project may cause changes in physical and water quality conditions whether in isolation or in combination which may impact the productivity or nutritional quality of key prey organisms for local and migratory species which will not be captured by the model The EwE model does not assess the production of key nutrients or the implications of changes in important physical and water quality parameters to biofilm community structure and hence to important migratory birds
The model does not include biotic factors for both pelagic and benthic environments to assess the potential development of eutrophication and benthic organic enrichment events respectively Organic and redox indicators traditional measures of environmental assessments that are used to determine changes in functional group responses were included in the recent Deltaport Third environmental assessment (ie Pelagic chlorophyll dissolved nutrients Benthic sediment carbonnitrogen content redox state [sulfide concentration]) Benthic anoxic events based on organic enrichment are known to be strong drivers of community composition and exclusion regardless of substrate type In the absence of biotic factors (eg organic particulates) the model has not considered the potential for benthic organic enrichment which coincides with siltation processes within the upper tidal flats The tidal flat corner bordered by the Delta-dyke and Deltaport causeway has served as a catchment area for Fraser River silt since the development of the original Deltaport causeway (Sutherland et al 2013) The proposed position of the new terminal placed at the seaward termination of the Deltaport causeway may produce a crescent-shaped feature in the wake of the Fraser River Plume This feature may provide a more efficient silt trap that will promote benthic organic enrichment This piece of the environmental assessment seems to be missing and is important for assessing fish habitat in this area
335 Seasonality (model time step) Input data to parameterize the model were available on a range of time scales from hourly (eg physical data on salinity and water flow) to annual (eg species biomass) The Proponents indicated12 that this is a strength of the EwE model although ultimately the model was run with an annual time step with all sub-annual values being averaged to annual values This method therefore did not incorporate important seasonal processes such as winter-summer differences in salinity and storm properties and the seasonal appearances of abundances of predators and prey such as migratory salmon and birds that are much larger than the annual average For example juvenile salmon migrate from the Fraser River and onto Roberts Bank in the spring before moving into deeper waters If these spring abundances are averaged over the entire year these average abundances would be 5-10 times lower than the actual abundances during the spring (ie averaging the biomass that occurs in two months over a 12 month period) Additionally this method did not capture the intensity of processes such as growth and predation which can be focused over periods of a few weeks to a few months There may be important threshold effects at particular times and places which may be missed when using an 11 EIS Section 10 p 10-11 12 PMV Response 2016-03-02 p 86 line 1655
Pacific Region Science Response Technical Review Assessing
Ecosystem Productivity Model of Roberts Bank
12
annual time step for the model The Ecospace module has a monthly time step13 and therefore it is feasible to run this module with a sub-annual time step For example the Proponents submit14 that there are inadequate data to model the potential effects of the Project on the timing of biofilm production which could have implications for the migratory dunlin and Western Sandpiper However this could be modelled in an exploratory way to determine hypotheses about which factors could affect the timing of production of biofilm and the potential impacts on these birds These issues are of major concern to ECCC
336 Life history structure The EwE model did not separate functional groups into life history stages (stanzas) yet for many functional groups the juvenile stages can have very different life history characteristics and habitats than the adults It is unclear in the description of the model how different life history structures were considered and whether for example there were enough juveniles to produce the adults The implications of not including early life stages should be explored at least qualitatively to identify which species might have life stages that may be more vulnerable to project effects
337 Model balancing Balancing an EwE model is the process by which parameters are adjusted so that there is sufficient production for consumption requirements ie there are sufficient prey for all predators Expert opinion was used to examine parameter values and to adjust for errors or inconsistencies in logic ldquoPMV is confident that since the approach taken to balance the model was based on best practices the steps are appropriaterdquo15 Adjustments to initial parameters to ensure an ecologically-feasible model are necessary and to be expected For a few functional groups however very large changes to initial parameter estimates (which were often not based on Roberts Bank specific data) were necessary for example to transient killer whales When such initial parameters were adjusted (often by substantial amounts) by expert opinion to balance the model the confidence intervals around these adjusted parameter values were not increased to reflect this added uncertainty (see for example PMV Response 2016-03-02 p 51 lines 955-956) When expert opinion was used to make very large changes to initial parameter values broader confidence intervals about these parameters should have been applied This does not appear to have been the case and as a consequence may cause the actual uncertainty of the model outputs to be underestimated
Another example is for the pinniped group in which 50 of the diet was assumed to come from outside the model area in order to balance the model The rationale provided was ldquoThe pinnipeds caused excessive predation mortalities on numerous fish functional groups The biomass of pinnipeds was an average for the Strait of Georgia which was likely too high for Roberts Bank Therefore it was assumed that pinnipeds extracted only half of their diet from the study areardquo16 It is unclear whether the sensitivity of the model to different percentages of diet allocation was explored
As noted above (332) the Ecopath model was relatively unconstrained and few adjustments to input parameters were required to balance the model This is unusual and the low ecotrophic efficiencies of several functional groups suggest that full accounting of energy flows may not have been achieved (an ecotrophic efficiency of 1 indicates that 100 of the production of that
13 EIS Appendix 10C Section 29 p24 14 EIS Appendix 10D Appendix C p72 15 PMV Response 2016-03-02 p 49 lines 910-912 16 EIS Appendix 10C Section 261 p 20
Pacific Region Science Response Technical Review Assessing
Ecosystem Productivity Model of Roberts Bank
13
particular group is being preyed upon or removed by fishing leaving no individuals to die of old age17) An ldquoexcessrdquo of individuals dying of old age ie ecotrophic efficiencies much less than 1 suggests a potentially large biomass that is not used by the ecosystem and instead is converted to detritus
34 Model validation Model validation is the process by which the model parameters variables and outputs are compared with those from the real ecosystem to ascertain how well the model represents the ecosystem It is an essential step in providing confidence that the projections from the model in this case with and without the Project have relevance to how the real ecosystem may be expected to function with and without the Project In practice validating complex ecosystem models is difficult considering the range of assumptions that must be made when building the model the limited available data and natural variability of the ecosystem at a variety of time and space scales
Many of the standard diagnostics for the Ecopath model have not been evaluated in the EIS The Proponent appears to have assumed that once the Ecopath model was balanced then it was valid and fit for purpose The Proponent should provide all the Ecopath estimates of vital rates including mortality rates As presented questions remain For example many Ecotrophic Efficiencies (which control the transfer of biomass from prey to predators) are less than 1 even for taxa which would be expected to be close to 1 such as carnivorous zooplankton The reason for Ecotrophic Efficiencies less than 1 were not discussed or explained in the EIS
Detailed diagnostics for the Ecospace model should also be presented in order to evaluate model performance In response to criticisms by DFO ECCC and NRCan in discussions with the Proponent the latter provided the biomass of the functional groups from the Ecopath model (before Ecospace) and the Ecospace model after the spin-up period (which involved adjusting the parameters from the Ecopath model to balance the 5468 separate cells of the Ecospace model)18 The Proponents argue that ldquoIt is important to note that changes in biomass values generated during the spin-up period are identical for both with and without Project scenarios and thus do not provide information on the potential Project-related effects on productivity19 However several changes to biomass result from the Ecospace balancing process (spin-up period) This is only given brief attention by the Proponent in its response to the DFO ECCC and NRCan questions An analysis of Table 620 revealed that the biomass of 9 functional groups was larger or smaller than the widest confidence limits allowed for each group21 This requires further discussion and justification
The Proponent used a goodness of fit measure to compare spatial distributions of model outputs with field observations They indicated that ldquono other EwE models were identified which use a goodness-of-fit measure Hence the RB model is potentially the first such EwE model where a goodness of fit measure has been appliedrdquo22 The chosen goodness of fit measure is the percent correct classification (PCC) method23 This method derives a test statistic based on the proportion of locations at which predicted occurrences from the model match observed
17 EIS Appendix 10-B p 11 18 PMV Response 2016-03-02 p 65-66 Table 6 19 PMV Response 2016-03-02 p 64 lines 1205-1207 20 PMV Response 2016-03-02 p 65-66 Table 6 21 PMV Response 2016-03-02 p 45 Table 3 22 PMV Response 2016-03-02 p 78 lines 1481-1483 23 PMV Response 2016-03-02 p 78 lines 1483-1484
Pacific Region Science Response Technical Review Assessing
Ecosystem Productivity Model of Roberts Bank
14
occurrences from data and similarly with predicted and observed absences The Proponent then calculated two additional accuracy of fit measures sensitivity (the model predicts a species to occur in an area where it is known to occur in reality) and specificity (the model predicts a species does not occur in an area it is known not to occur in reality)24 This analysis concluded that the model has high predictability for functional groups such as eelgrass and sea pens with relatively static distributions but lower predictability for functional groups which are more temporally and spatially dynamic such as biofilm and green algae25
There are two problems with this approach The first is that this goodness of fit comparison was done only for habitat-forming functional groups no discussion of how well this analysis applies to mobile functional groups was provided The second problem is that this method does not take into account situations (such as occurs in this study with several groups) in which species occur at only a few locations For example ldquohellipif the test data consist of 95 absences and 5 presences and this reflects the true prevalence of the species on the landscape (a realistic scenario for a rare species) a lsquonullrsquo model that predicted absence in all cases (eg no model at all) would be correct 95 of the timehellipldquo (Franklin 2009 p 151) This latter point is important here as these habitat functional groups (biofilm brown algae native eelgrass green algae Japanese eelgrass tidal marsh biomat and orange sea pens26) appear not to occur over most of the Project area (as portrayed by the model outputs presented in the distribution figures of PMV Response 2016-03-02 Appendix 218) It is therefore important that a robust evaluation of the performance of the Ecospace module is used with preferably more than one measure
In summary the starting point for this modelling analysis matters It is not just about a comparison between results with and without the Project The model has to be considered a sufficient representation of the ecosystem The Proponent has not yet sufficiently validated the model
35 Model results 351 Presentation of model results
As noted above (Section 331) the stated objective of the Roberts Bank ecosystem model was not to provide an assessment of Project impacts for each functional group at a fine temporal scale but to estimate changes in productive potential with and without the Project at the ecosystem level27 However results were presented as comparisons by speciesfunctional group with and without the Project and not as potential changes in total ecosystem productivity The revised figures for each functional group showing distributions without the Project with the Project and their difference indicated impacts were likely to be localized with overall impacts relatively small The range of biomass ratios with and without the Project was 045 ndash 189 with most values slightly less than 1 This is interpreted as indicating slight decreases in the capacity of the study area to support biomass and production with the Project for many functional groups28 (Figure 2)
24 PMV Response 2016-03-02 p 80 lines 1524-1527 25 PMV Response 2016-03-02 p 81 lines 1551-1559 26 PMV Response 2016-03-02 p 82 Table 8 27 PMV Response 2016-03-02 p 99 lines 1914-1917 28 PMV Response 2016-03-02 Appendix 218
Pacific Region Science Response Technical Review Assessing
Ecosystem Productivity Model of Roberts Bank
15
Biomass Ratio
Freq
uenc
y
04 07 10 13 16 19
05
1015
2025
30
Figure 2 Histogram of biomass ratios obtained by comparisons of model runs with and without the project (ie With Without) Values less than 1 indicate reductions in biomass with the Project compared against without the Project) Data from Appendix 218 of PMV Response 2016-03-02
352 Sensitivity and vulnerability analyses Every ecosystem model is only one possible representation of the true ecosystem defined by the modelrsquos structure and the values chosen for its many parameters The key point is how well the model represents the real system how that fit can be measured and the sensitivity of model outputs to variability in the selected parameter values The ideal model should be robust to a wide range of uncertainties in the input data and parameters This robustness is determined by performing sensitivity analyses on the model to see how it responds to variations in the input parameters and determining to which input parameters the model is most sensitive
The vulnerability parameters determine the strength of the feeding interactions between functional groups They set the level of density dependence of each functional group Higher vulnerability settings provide greater top-down (predator) control whereas lower settings provide greater bottom-up (environmental) control29 Several publications have shown that EwE models are very sensitive to the vulnerability parameters and Christensen and Walters (2000) point out that a main pitfall of EwE is that ldquopredation vulnerabilities are often underestimated lessening the modelled impacts of predationrdquo It is usual practice to tune Ecopath models including the vulnerability parameters to time series data such as biomass using the temporal simulation model Ecosim However these data were not available for the RBT2 area so this robust method of fitting the model and estimating vulnerability parameters was not possible Instead a vulnerability setting of 2 was used as the default value for the key model runs which is ldquocommon practice when time series data are not available and estimates of vulnerability in the
29 PMV Response 2016-03-02 p 70 lines 1318-1323
Pacific Region Science Response Technical Review Assessing
Ecosystem Productivity Model of Roberts Bank
16
model cannot be maderdquo30 with sensitivity analyses run for a range of 15 to 3 This narrow range was criticized by DFOECCC in initial discussions about the model with the Proponent The Proponent subsequently reran the model with a larger range of vulnerabilities31 (11 to 10) and concluded this broader vulnerability range produced similar results for the productivity ratio with and without the Project to those in the original EIS and that the EIS was more likely to overestimate than underestimate potential project effects32 The data in Table 7 of the PMV Response33 did indicate changes in productivity ratios ranging from 0 to 50 of the defined key run (which used a vulnerability setting of 2) However the Proponent changed all vulnerability settings to the same value ie all were 2 or all were 10 etc In reality the vulnerability parameters resulting from Ecosim models that are fitted to data as described above vary by functional group which was not explored here Therefore although the results suggest that the original choice of 2 for the default key run seemed reasonable the potential effects of variability in vulnerability settings was not fully explored
Sensitivity analyses are usually based on the range of uncertainty estimated for input data and parameters often called the confidence limits around the model parameters The EwE framework integrates many different data sources and parameters including values from the literature It can therefore be difficult to identify ldquoreasonablerdquo confidence limits when derived from such diverse data sources Standard practice in Ecopath models has been to develop a pedigree for each parameter with default values for uncertainty based on the nature of the source data For example parameter values based on high precision field observations of biomass within the model domain receive default confidence intervals of 10 whereas parameter values based on models developed for elsewhere or professional judgment receive confidence intervals of 8034 Sensitivity analyses are then run using parameter values selected from within these confidence intervals However if these default confidence intervals do not capture the full range of variability then the outputs are not informative of the variability in the lsquorealrsquo ecosystem Field observations were collected for many functional groups within the model domain in 2012 and 2013 as part of studies to support the RBT2 EIS Apparently the purpose of these observations was to document spatial variability (in part for the Ecospace model) and temporal variability (measurements at one location over time) and not to derive confidence intervals around the observations35
The reliance on the pedigree approach to derive confidence intervals for this Roberts Bank model was criticized by DFO ECCC and NRCan in discussions with the Proponent As a result the Proponent reran the model with much larger confidence intervals ranging from 30 to 100 depending on the input parameter and functional group36 The results from this new analysis using the broader confidence intervals were similar to those using the original pedigree approach The Proponent noted that ldquoWhile the production within each helliprun was very different there was little difference in the biomass ratio [with and without the Project] These results further demonstrate that even with a greater range in input values the influence of the Project on the Roberts Bank ecosystem is consistent among allhellipmodel runsrdquo37 This provides confidence that the model may be robust to uncertainty in its input parameters Two concerns
30 PMV Response 2016-03-02 p 70 lines 1321-1322 31 PMV Response 2016-03-02 p 71-74 32 PMV Response 2016-03-02 p 71 lines 1339-1341 33 PMV Response 2016-03-02 p 73 34 EIS Appendix 10-C Section 251 page 18 35 PMV Response 2016-03-02 p 42 lines 772-777 36 PMV Response 2016-03-02 p 44-47 37 PMV Response 2016-03-02 p 47 lines 855-858 and see also PMV Response 2016-03-02 Appendix 27-B
Pacific Region Science Response Technical Review Assessing
Ecosystem Productivity Model of Roberts Bank
17
remain however The quote above indicates that the production among the different model runs was very different although with little difference in the biomass ratios with and without the Project Since biomass is not the same as production it would be informative for understanding model performance and potential impacts to show these production differences This also relates to the point made in Section 34 regarding how well the model represents the real ecosystem and not just within-model comparisons with and without the Project The second question is more technical and relates to how the randomization (Monte Carlo or MC) routine that was used to create multiple model runs used the uncertainty about the diet data Diets are not currently included in the MC routine available to regular users of the Ecosim model how they were handled in this RBT2 model appears not to be explained
Finally the sensitivity analyses indicate that the uncertainty in the input parameters does not lead to much difference between model parameters with or without the project However this conclusion does not describe how the uncertainty in the input parameters affects understanding of the ecosystem
40 Conclusions Overall the main conclusion of the Environmental Impact Statement from the Proponent is stated as ldquohellipafter the implementation of mitigation hellipthe Project is not expected to result in any significant adverse effects on any of the 16 valued componentsrdquo38 In addition ldquohellipapproximately 40 of the functional groups are forecast to change no more than 5 which hellip is judged to be within the uncertainty of the model runsrdquo39 although larger changes were forecast for orange sea pens freshwater biofilm green algae and raptors The conclusions from the modelling studies are that ldquohellipthe proposed project will have an impact on the study area that the effect varies between species and that the findings are robust to parameter uncertaintyrdquo40 Specific outcomes by valued component as derived from the EwE model are presented by functional groups in Table 1
38 PMV March 2015 Roberts Bank Environmental Impact Statement Executive Summary ndash Part 1 page 37 39 EIS Appendix 10-C p ii 40 EIS Appendix 10-D p iv
Pacific Region Science Response Technical Review Assessing
Ecosystem Productivity Model of Roberts Bank
18
Table 1 Changes in productive potential with the Project as derived from the EwE model
Changes in productive potential
Ecosystem category
Number of valued
components
Number with potential
biomass loss
Moderate decrease (31-60 decline)
Minor decrease (6-30 decline)
Negligible (0-5
change)
Minor increase (6-
30 increase)
Moderate increase (31-60 increase)
Source
Marine vegetation
7 7 - 3 2 2 - EIS Vol 3 Section 11 Table 11-17 page 11-65
Marine invertebrates
4 3 1 1 1 1 - EIS Vol 3 Section 12 Table 12-8 page 12-52
Marine fish 13 13 - 2 6 5 - EIS Vol 3 Section 13 Table 13-10 page 13-95
Coastal birds
11 8 - 3 4 3 1 EIS Vol 3 Section 15 Table 15-10 page 15-67
Pacific Region Science Response Technical Review Assessing
Ecosystem Productivity Model of Roberts Bank
19
Most functional groups showed some potential biomass loss with the Project with biomass loss defined as any model run with negative outcomes (ie in which biomass with the project was less than biomass without the Project) The summary of changes in productivity potential are mixed with most (33 out of 35) valued components showing minor decreases to minor increases (defined as 6 to 30 changes in productive potential with the Project compared to without the Project)
The main conclusions of this review in regards to the Terms of Reference are
1 Do the functional groups and abiotic variables used in the model adequately represent the ecosystem at Roberts Bank
o The 58 functional groups and abiotic variables used in the model adequately represent the main components of the Roberts Bank ecosystem however for longer lived species the life stages of the species are not well represented and some of the impacts of the Project may be expected to affect specific life stages
o The abiotic variables adequately represent the physical drivers of this ecosystem on an annual time scale However annual values for these abiotic variables may not adequately capture important sub-annual events such as storms (DFO 2016) the timing of arrival and departure of highly migratory species and whether there may be important sub-annual thresholds or mismatches in timing as a result of the Project
o Biotic factors (eg nutrients) which are particularly important for biofilm and other lower trophic level taxa are not included in this model The model is therefore unable to assess the potential development of eutrophication and benthic organic enrichment events which may affect fish habitats in the study area
2 Are the parameter estimates used by the model valid and defensible for this system
o In general parameter estimates appear to be adequate for this system Field studies were done in two years to provide data in particular on distributions of selected functional groups for the Ecospace module Note the distribution studies focussed on taxa which were relatively immobile and therefore lsquofixedrsquo in space
o the selection of some model parameters would benefit from further explanation for example the choice of fixed diet matrices versus dynamic matrices which can vary with changes in abundances or predators and prey
o the selection of some model parameters would benefit from further explanation for example the link between the diets described in the text of Appendix 10B and the quantities presented in Appendix A of Appendix 10B It is understood that proportions were derived using the ldquofixed selectivityrdquo principle but in order to be fully transparent the derivation of each diet should be provided in an appendix
o discussion and explanation is needed of why ecotrophic efficiencies differ from expected values (eg the ecotrophic efficiency for Pacific herring is listed as 038) and
o the abiotic factor lsquosubstratersquo was limited to ldquohardrdquo or rdquosoftrdquo options which can be restrictive given that they serve as endpoints on a substrate composition continuum These limited options may not provide the sensitivity required to assess substrate preference nor the flexibility for taxa (eg motile organisms) that span hard mixed and soft substrate types In addition it is not clear if changes in the hardsoft categories were considered over time within identified depositional or erosional settings before and after construction
Pacific Region Science Response Technical Review Assessing
Ecosystem Productivity Model of Roberts Bank
20
3 Are the limitations and uncertainties of the model identified and appropriately considered when determining the modelrsquos representation of current and possible future conditions
o the EwE model was not designed to evaluate a range of future conditions It was designed to estimate changes in the productive potential at the ecosystem level with and without the Project Therefore the model was run without the Project and with the Project for a range of plausible abiotic conditions and the results were compared with respect to biomass and productivity by functional group
o the pedigree approach to assessing the uncertainties of model outcomes is unsatisfactory for the purpose here as it relates solely to a qualitative judgment of the value of data based on its source However when the model was rerun with much wider ranges of confidence intervals (uncertainties) the results in general (but not necessarily for each functional group) were similar to the results using the original pedigree approach This suggests that taken overall the model may be robust to wide ranges of uncertainty in these input variables and parameters
o there is inadequate validation of the model This is inadequate for three reasons
(i) the basic Ecopath model is not validated and the Ecospace balancing process (the spin-up period) resulted in some biomass estimates being increased or decreased beyond their confidence limits
(ii) the goodness of fit test used to evaluate how well the model predicted the spatial occurrence functional groups is not fit for purpose (Section 34) and
(iii) validation was provided for only a small number of functional groups (the habitat-forming functional groups) As a consequence the model is currently not validated
o Considering the proportion of open boundaries relative to closed boundaries in the model processes taking place outside the modelled ecosystem are likely to contribute to dynamics within the modelled ecosystem However these external processes may not be well-resolved by the EwE model as currently configured
4 Are the model results related to the potential effects of the Project on fish and fish habitat and migratory birds and their food resources valid and defensible
o this is a very complex ecosystem model constructed for a relatively small and open (in the sense of considerable exchange with adjacent non-modelled areas) system Many assumptions have been made based on poor or missing data Taking all these considerations into account the model does the best job possible of comparing the biomass and productivity of the Roberts Bank ecosystem with and without the Project
o the extent to which the model adequately represents the lsquorealrsquo ecosystem of Roberts Bank as opposed to comparisons of model results with and without the Project is unclear as a number of basic diagnostics are not presented (see point 3 above)
o the EwE model is not capable of and is not designed to represent nutritional and food quality variations in prey functional groups and how these may impact highly migratory predators such as birds with and without the Project
5 Is the EwE model framework a valid method to quantify large scale impacts to fish habitat fish productivity and migratory bird productivity
o the EwE model as implemented in this project and reviewed here is a useful first-order framework to organise information and derive initial estimates of how the system may respond to perturbations
Pacific Region Science Response Technical Review Assessing
Ecosystem Productivity Model of Roberts Bank
21
o the utility of a EWE model for impact purposes is highly dependent on the quality of input data
o each EwE model is highly dependent on local conditions Although appropriate as an overall methodology each application would need to be reviewed for how it may be applied to any new ecosystem and
o the EwE model would need to be substantially reformulated if it was to include considerations of changes in chemical composition or food quality of prey in particular for seasonal migratory species such as birds which may depend on very large biomasses of prey with specific chemical composition to fuel their migrations beyond the ecosystem model boundaries
Contributors Contributor Affiliation Ian Perry Author DFO Science Pacific Region Alida Bundy Author DFO Science Maritimes Region Terri Sutherland Author DFO Science Pacific Region Robert Elner Author ECCC Canadian Wildlife Service Andrew Robinson Author ECCC Canadian Wildlife Service Lesley MacDougall Editor DFO Science Pacific Region
Approved by Carmel Lowe
Regional Director Science Branch Pacific Region Fisheries and Oceans Canada
November 4 2016
Sources of Information Christensen V Coll M Steenbeek J Buszowski J Chagaris D walters CJ 2014
Representing variable habitat quality in a spatial food web model Ecosystems 17 1397-1412
Christensen V and Walters C 2000 Ecopath with Ecosim methods capabilities and limitations Ecological Modelling 172 109-139
Colleacuteter M Valls A Guitton J Gascuel D Pauly D and Christensen V 2015 Global overview of the applications of the Ecopath with Ecosim modeling approach using the EcoBase models repository Ecological Modelling 302 pp42-53
Compass Resource Management Ltd 2013 Roberts Bank Terminal 2 Technical Advisory Group (TAG) Process Report Productive Capacity ndash Final Report 119pp (Accessed November 1 2016)
DFO 2016 Technical Review of Roberts Bank Terminal 2 Environmental Assessment Section 95 ndash Coastal Geomorphology DFO Can Sci Advis Sec Sci Resp 2016045 (Accessed November 4 2016)
Pacific Region Science Response Technical Review Assessing
Ecosystem Productivity Model of Roberts Bank
22
ESSA Technologies 2014a Roberts Bank Terminal 2 Project Roberts Bank Delta BC Environmental Impact Statement Volume 3 Biophysical Effects Assessments Appendix 10-C Roberts Bank Ecosystem Model Development and Key Run Port Metro Vancouver (Accessed November 1 2016)
ESSA Technologies 2014b Roberts Bank Terminal 2 Project Roberts Bank Delta BC Environmental Impact Statement Volume 3 Biophysical Effects Assessments Appendix 10-D Roberts Bank Ecosystem Model Sensitivity Analyses Port Metro Vancouver (Accessed November 1 2016)
Franklin J 2009 Mapping Species Distributions Spatial Inference and Prediction Cambridge University Press Cambridge
Hemmera 2014 Roberts Bank Terminal 2 Project Roberts Bank Delta BC Environmental Impact Statement Volume 3 Biophysical Effects Assessments Appendix 10-B Roberts Bank Ecosystem Model Parameter Estimates Port Metro Vancouver File 302-03503 (Accessed November 1 2016)
Port Metro Vancouver 2015a Roberts Bank Terminal 2 Project Roberts Bank Delta BC Environmental Impact Statement Volume 3 Biophysical Effects Assessments Section 100 Biophysical Setting (Accessed November 1 2016)
Port Metro Vancouver 2015b Roberts Bank Terminal 2 Project Roberts Bank Delta BC Environmental Impact Statement Volume 3 Biophysical Effects Assessments Section 103 Overview of Assessing Ecosystem Productivity (Accessed November 1 2016)
Port Metro Vancouver 2015c Roberts Bank Terminal 2 Project Environmental Assessment Additional Information Requirements (July 31 2015) Responses Response to Information Request 6 IR-73115-06 Canadian Environmental Assessment Agency Reference Number 80054 dated 26 October 2015
Steenbeek J Coll M Gurney L Meacutelin F Hoepffner N Buszowski J and Christensen V 2013 Bridging the gap between ecosystem modeling tools and geographic information systems Driving a food web model with external spatialndashtemporal data Ecological Modelling 263 139ndash 151
Sutherland T Elner R and OrsquoNeill J 2013 Roberts Bank Ecological crucible of the Fraser River estuary Progress in Oceanography 115 171ndash180
Vancouver Fraser Port Authority 2016 From the Vancouver Fraser Port Authority to the Review Panel re Answers to preliminary technical questions submitted during the completeness phase from Fisheries and Oceans Canada Natural Resources Canada and Environment and Climate Change Canada concerning the ecosystem modelling to support the Roberts Bank Terminal 2 Project environmental review CEAR Document 547 (Accessed November 1 2016)
Pacific Region Science Response Technical Review Assessing
Ecosystem Productivity Model of Roberts Bank
23
This Report is Available from the Centre for Science Advice
Pacific Region Fisheries and Oceans Canada
3190 Hammond Bay Road Nanaimo BC V9T 6N7
Telephone (250) 756-7208 E-Mail csapdfo-mpogcca
Internet address wwwdfo-mpogccacsas-sccs
ISSN 1919-3769 copy Her Majesty the Queen in Right of Canada 2016
Correct Citation for this Publication
DFO 2016 Technical review of Roberts Bank Terminal 2 environmental assessment section 103 ndash assessing ecosystem productivity DFO Can Sci Advis Sec Sci Resp 2016050
Aussi disponible en franccedilais
MPO 2016 Examen technique de leacutevaluation environnementale du Terminal 2 agrave Roberts Bank section 103 ndash eacutevaluation de la productiviteacute de leacutecosystegraveme Secr can de consult sci du MPO Reacutep des Sci 2016050

Pacific Region Science Response Technical Review Assessing
Ecosystem Productivity Model of Roberts Bank
2
The objectives for this Science Response are to
1 Determine if the functional groups and abiotic factors used in the model adequately represent the ecosystem at Roberts Bank
2 Assess whether the parameter estimates used by the model are valid and defensible for this system
3 Assess whether the limitations and uncertainties of the model are identified and appropriately considered when determining the modelrsquos representation of current and possible future conditions
4 Provide advice regarding whether the model results related to the potential effects of the Project on fish and fish habitat and migratory birds and their food resources are valid and defensible
5 If possible provide advice regarding the validity of using the EwE model framework to quantify large scale impacts to fish habitat and fisheries productivity and the productivity of migratory birds
This Science Response evaluates Section 100 ldquoBiophysical Settingrdquo with a focus on Section 103 ldquoOverview of Assessing Ecosystem Productivityrdquo in the EIS as submitted by the Proponent (Port Metro Vancouver 2015) This Section and consequently this Response describes the ecosystem modelling approach that was taken to evaluate the direct and indirect effects of the footprint of the proposed terminal and widened causeway herein referred to as lsquothe Projectrsquo This ecosystem model provides outputs related to potential effects of the project on the study area at an ecosystem level including aquatic species and bird species in the Project area Evaluation of the model and its outputs therefore required expertise in both fishery aquatic species and migratory bird species Consequently this Science Response is the product of a joint review between DFO and Environment and Climate Change Canada (ECCC) Canadian Wildlife Service and Wildlife and Landscape Science to provide a complete evaluation
This Science Response Report results from the Science Response Process of July 2016 on the Technical Review of Ecopath with Ecosim and Ecospace (EwE) Ecosystem Productivity Model application to the Roberts Bank Terminal 2 Environmental Assessment
20 Background
21 Background and Terms of Reference The Projectrsquos main components have a proposed combined marine footprint area of approximately 179 km2 listed below by specific component
bull Marine Terminal 1335 km 2 including terminal (116 km 2) and dredged berth pocket and marine approach areas (0174 km 2)
bull Widened Causeway 0424 km 2
bull Expanded Tug basin 0031 km 2
Roberts Bank in the Fraser River estuary consists of complex intertidal and subtidal habitats including intertidal eelgrass beds and is an important stopover area for migrating shorebirds and productive feeding and rearing habitats for many fish and invertebrate species It also provides habitat for endangered Southern Resident Killer Whales and other marine mammals
Pacific Region Science Response Technical Review Assessing
Ecosystem Productivity Model of Roberts Bank
3
The environmental conditions at Roberts Bank are dynamic and are influenced by a variety of oceanographic and atmospheric factors including the Fraser River freshwater and sediment plume discharge diurnal tidal currents and prevailing and storm-generated wind and wave activity In addition the intercauseway region provides significant drainage from marsh and agricultural areas which have different characteristics from marine waters and which run along the ferry causeway
To provide the required science advice this Science Response focusses on Section 10 ldquoBiophysical Settingrdquo of the Environmental Impact Statement (EIS) (Port Metro Vancouver 2015a) specifically Section 103 ldquoOverview of Assessing Ecosystem Productivityrdquo (Port Metro Vancouver 2015b) and its related Appendices 10-B ldquoRoberts Bank Ecopath with Ecosim and Ecospace model parameter estimatesrdquo (Hemmera 2014) Appendix 10-C ldquoRoberts Bank Ecosystem model development and key runsrdquo(ESSA Technologies 2014a) and Appendix 10-D ldquoRoberts Bank Ecosystem model sensitivity analysesrdquo (ESSA Technologies 2014b) Additional important information was obtained from the Response to Information Request 6 (IR-73115-06 Canadian Environmental Assessment Agency Reference Number 80054 dated 26 October 2015) (Port Metro Vancouver 2015c) and the Written Responses to Coastal Geomorphology and Ecosystem Modelling Questions provided by the Proponent to DFO ECCC and NRCan on 2 March 2016 (Port Metro Vancouver (PMV) Transmittal TRE-01-RBT2-0004A subsequently referred in this Science Response as ldquoPMV Response 2016-03-02rdquo) (Vancouver Fraser Port Authority 2016)
The process followed in preparing this Science Response involved an initial review of the submitted EIS followed by an in-person meeting of the Proponent its contractors and representatives of DFO ECCC and NRCan to discuss and clarify questions arising from the initial review (Vancouver 23 November 2015) DFO and NRCan provided written questions to the Proponent based on preliminary review of the EIS on November 19 2015 ECCC also provided written questions based on its preliminary review of the EIS to the Proponent on December 1 2015 and January 20 2016 This large initial meeting was followed by smaller focussed meetings between the Proponent its contractors and DFO and NRCan on 11 December 2015 to clarify hydrology and sediment modelling questions with DFO on 8 January 2016 to clarify ecosystem modelling questions and with ECCC on 18 February 2016 to clarify questions relating to birds Written responses to all of these meetings and questions were provided by the Proponent to DFO ECCC and NRCan as the ldquoPMV Response 2016-03-02rdquo and ldquoPMV Response 2016-05-30rdquo (Vancouver Fraser Port Authority 2016) VFPArsquos answers to questions posed by DFO and NRCan regarding coastal geomorphology modelling have been posted to the Canadian Environmental Assessment Registry (CEAR)
22 Approach to assessing ecosystem productivity The Proponent adopted an ecosystem approach to evaluate the direct and indirect effects of the Project on the productivity of the Roberts Bank ecosystem A weight of evidence approach was used to assess the potential effects of the project on the productivity of the ecosystem and selected key components in the study area this approach included a spatial ecosystem simulation model (which included a habitat capacity model) a shorebird opportunity model and empirical data An important point is that any effects on the system during the construction phase or from expansion of the tug basin were excluded from this modelling process the focus instead being a comparison of modelled system productivity before and after the proposed terminal and expanded causeway is in place The chosen ecosystem simulation model was
Pacific Region Science Response Technical Review Assessing
Ecosystem Productivity Model of Roberts Bank
4
Ecopath with Ecosim and its spatial version Ecospace (collectively referred to here as the EwE framework or EwE model) This modelling approach was recommended by a prior Productive Capacity Technical Advisory Group comprised of representatives of technical experts from government agencies academia non-governmental organizations Vancouver Fraser Port Authority and its consultants (Compass 2013) convened by the Proponent and which also recommended a selection of focal species for the model The final selection of functional groups and the resulting food web that form the core of this ecosystem model are shown in Figure 1
Pacific Region Science Response Technical Review Assessing
Ecosystem Productivity Model of Roberts Bank
5
Figure 1 Ecopath with Ecosim model food web for Roberts Bank (Adapted from EIS Volume 3 Section 10 Fig 1033 on page 10-16) The groups coloured in orange represent focal groups size of symbols represents relative annual amount of biomass in the Roberts Bank study area
Pacific Region Science Response Technical Review Assessing
Ecosystem Productivity Model of Roberts Bank
6
The EwE framework is a common approach to ecosystem modelling which has been developed and expanded over the past two to three decades It currently has three main components
1 Ecopath ndash the core model which provides a mass-balance snapshot of the system
2 Ecosim ndash a module that enables simulation modelling over time
3 Ecospace ndash a module that enables simulation modelling over space
In order to make an EwE model tractable species are aggregated into functional groups based on their similar ecological characteristics (habitat and prey preferences etc) the Roberts Bank models had 58 functional groups The first step (Ecopath) was to obtain input parameters representing biomass production consumption emigration and diet for each functional group These parameters were then tuned in an iterative process until the overall production and consumption was balanced (a mass-balance approach) resulting in a model food web with estimates of energy flow between functional groups (Fig 1)
In the second step Ecosim was combined with the spatial model Ecospace The abiotic variables selected in this EIS (depth salinity bottom current wave height sediment type) were used as external forcings to the Ecospace module These abiotic variables provided the physical forcings for the simulations without and with the Project Since time series data on the functional groups of the model were not available Ecospace was run until the model reached equilibrium using various assumptions of the value of the vulnerability parameter (see Section 352) In this EIS the selected time step was annual with all variables abiotic and biotic expressed as yearly averages As used in this EIS the Ecospace module included a habitat capacity model which estimated the distribution of functional groups based on their environmental preferences for each abiotic variable (depth salinity bottom current wave height) and for substrate type (sand mud etc) The model thus allocated the spatial distribution of functional groups over the model domain based on their environmental preferences and the distributions of these abiotic variables with and without the Project The selected spatial unit size (ldquopixelrdquo) for the Ecospace model was 100 m2 In essence an Ecopath model was constructed for each pixel with particular rules governing how the functional groups interacted and moved among these spatial units The Ecospace module was run until it approached equilibrium (20 model years) to establish the spatial patterns without the Project For the lsquowith the Projectrsquo simulations the model was run for an initial 10 years and then the spatial patterns of the abiotic variables with the project were added and the model run for an additional 10 years1 The model outputs predicted changes in the productive potential of the Roberts Bank ecosystem as a comparison (ratio) with and without the Project rather than an absolute biomass that would be lost or gained as a result of the Project
1 EIS Appendix 10-C p 26
Pacific Region Science Response Technical Review Assessing
Ecosystem Productivity Model of Roberts Bank
7
30 Analysis and Response To prepare this response the following sections of the EIS additional documents were reviewed
DocumentSection Title
EIS Section 10
Including appendices 10B 10C and 10D
(Port Metro Vancouver 2015a Hemmera 2014 ESSA Technologies 2014a ESSA Technologies 2014b)
Biophysical Setting
Appendix 10-B Roberts Bank Ecosystem Model Parameter Estimates Port Metro Vancouver File 302-03503
Appendix 10-C Roberts Bank Ecosystem Model Development and Key Run Port Metro Vancouver
Appendix 10-D Roberts Bank Ecosystem Model Sensitivity Analyses Port Metro Vancouver
CEAR document 547 (Including Appendices) ldquoPMV Response 2016-03-02rdquo and ldquoPMV Response 2016-05-30rdquo
(Vancouver Fraser Port Authority 2016)
Vancouver Fraser Port Authority to the Review Panel re Answers to preliminary technical questions submitted during the completeness phase from Fisheries and Oceans Canada Natural Resources Canada and Environment and Climate Change Canada concerning the ecosystem modelling to support the Roberts Bank Terminal 2 Project environmental review
31 The EwE Team Building this ecosystem model was a complex undertaking which required knowledge of the ecosystem to be modelled how to set initial parameter values determination of reasonable ranges of these parameters how to balance the model and how to recognize when the model outputs were unrealistic These tasks became even more complex when spatial model dynamics were involved such as with Ecospace The team engaged by the Proponent to conduct this ecosystem modelling for the Roberts Bank Terminal 2 (RBT2) EIS was led by scientists at the Institute for Oceans and Fisheries located at the University of British Columbia in Vancouver These scientists are global leaders of the EwE model framework having developed much of its current implementation and who continue to lead its elaborations and extensions Construction and running of the model for this specific ecosystem was done in collaboration with ESSA Technologies of Vancouver Parameter values for the ecosystem model were obtained in part from observational studies conducted in the area by Hemmera of Burnaby BC
32 Overview of assessment results of hydrological and sediment modelling Implementation of the ldquowith the Projectrdquo simulations of the ecosystem model was done by driving the model with the abiotic variables as they were projected to be distributed with the Project footprint In the context of this EIS specifying depth salinity bottom currents wave height and sediment type conditions without the Project and changes with the Project were achieved by construction of hydrodynamical and sediment transport models The outputs from these models in combination with the identified environment preferences for the various biological groups were then used as inputs to the Ecospace model to define the spatial
Pacific Region Science Response Technical Review Assessing
Ecosystem Productivity Model of Roberts Bank
8
distributions of these functional groups The implementation of these hydrological and sediment transport models in this EIS was reviewed by DFO and NRCan (DFO 2016) This review concluded that the implementation of these models for this EIS was adequate for average winter conditions but lacking in validation for summer conditions in particular with strong freshwater flows from the Fraser River Simulations of strong storm events and their impacts on wave conditions and sediment transport were also lacking The effect of wave action and current speeds on sediment transport is non-linear such that increasing winds over short periods of time can impact sediment transport processes bottom topography and water depths beyond that determined under average model conditions Overall the review concluded that a greater range of sensitivity analyses is required to have confidence in the model outputs under lsquonon-averagersquo conditions The implication of this conclusion for the present review of the EwE model is that the full range of variability of abiotic characteristics such as bottom topography bottom current and wave heights and how they may affect relevant functional groups in the model with the Project may not be adequately represented Sensitivity analyses were provided by varying the intensity of abiotic variables and by removing abiotic variables to assess their interactive effects In general the ecosystem model outputs were robust to these sensitivity analyses with most groups varying by less than 5 Larger changes however were observed for primary producer and bird groupings and for some fish groups when various abiotic variables were omitted2
33 Model implementation 331 The purpose of the EwE model
The EwE model was intended to provide one line of evidence to assess the potential impacts of the Project on the Roberts Bank ecosystem which would then be used with other lines of evidence to make the final assessment Specifically ldquohellip the objective of the RB [Roberts Bank] model was not to provide an assessment of Project impacts for each functional group at a fine temporal scale but to estimate changes in productive potential with and without the Project at the ecosystem levelrdquo3 In addition ldquohellipthe primary objective of the RB ecosystem model is to evaluate potential changes in productivity from such abiotic factors with and without the terminal and causewayrdquo4 Results are presented for the selected functional groups no results were presented on potential changes in ecosystem structure or function
332 Applicability of the EwE model framework to the Roberts Bank region EwE models work best when the exchanges within the system being modelled are greater than the exchanges between the modelled system and the lsquooutsidersquo world In practice this means that EwE models work best for larger systems with few external exchanges In a meta-analysis of 433 Ecopath models Colleacuteter et al (2015) concluded that ldquohellipin the last two decades the range of the models area has expanded toward very large areas and the median has shifted accordingly from about 1000 km2 in 1984ndash1993 to about 100000 km2 in 1994ndash2014rdquo The section of the Roberts Bank ecosystem that is included in the EwE model was comparatively small (5468 km2) and complex It is an intertidally-dominated environment that is subject to strong seasonal influences of both freshwater and marine exchanges across relatively large seaward and shoreward boundaries
2 EIS Appendix 10-D p ii - iii 3 PMV Response 2016-03-02 p 99 lines 1914-1917 4 PMV Response 2016-03-02 p 38 lines 689-691
Pacific Region Science Response Technical Review Assessing
Ecosystem Productivity Model of Roberts Bank
9
Processes taking place outside the modelled ecosystem will contribute to dynamics within the modelled ecosystem (eg lsquooutsidersquo food supporting predators which occur in the Roberts Bank ecosystem for only part of the year predators which may feed in the Roberts Bank ecosystem but export this energy when they migrate out of the region) but which may not be well-resolved by the EwE model The Proponent justifies the spatial scale because it was specifically chosen for the questions being asked in regard to assessing productivity changes and because the relative influences of external exchanges are assumed to be identical with and without the project In addition highly mobile species with broad prey bases were assumed in the model to be partially sustained by external energy from outside the model system5 The distributions of organisms may differ however with and without the project which may affect their interactions with areas outside of the modelled system and the use of diets from outside the modelled system may not reflect the impacts of the project Further clarification of how the EwE model captures the exchanges and interactions with adjacent ecosystems are needed For example it could be argued that an ecosystem which is open to frequent exchanges of water and organic matter from beyond its boundaries might be more robust to local disturbances such as the Project
There are some inconsistencies in the information and assumptions used for some of the taxa in this ecosystem model For Dungeness Crab the justification for estimating total adult biomass (including females) from the biomass of fished males is unclear In addition it is unclear if the slower growth of female crabs once they have reached sexual maturity in comparison with male crabs has been considered The diet matrix for spiny dogfish does not represent the actual diet well in particular of euphausiids herring and shrimp and there are more recent references for biomass estimates of spiny dogfish in the study area than what was used in the EIS
Fishing mortality was not included in the model under the assumption that this would not change with or without the project While this assumption may be true the model has been parameterized by ignoring a source of mortality that will influence total production In essence fishing removes biomass from the ecosystem with the result that less biomass will be available for higher trophic levels How this may impact the ecosystem with and without the Project is unclear but it could make noticeable differences if for example there were thresholds in the feeding responses by these higher trophic level species The Ecopath model that was used is relatively unconstrained since many ecological efficiencies are low even for forage species which would be expected to be higher It is not clear how many species are exploited or the levels of exploitation but even if this does not change with the Project these mortality rates should be included in the model in order to add realistic constraints to the exploited functional groups
333 Model documentation Based on questions from DFO ECCC and NRCan following their initial review of the EIS the Proponent provided written responses dated 2 March 2016 to clarify several of the steps in the model development and implementation However several questions remain including questions about the Ecospace module Ecospace has undergone several recent developments such as the inclusion of the spatial-temporal data layer framework (Steenbeek et al 2013) the habitat capacity model (Christensen et al 2014) and the Monte Carlo analysis including the diet matrix As yet there are few published studies using these latest Ecospace developments and their documentation and justification need to be improved in the EIS
5 PMV Response 2016-03-02 p 29 lines 446 - 464
Pacific Region Science Response Technical Review Assessing
Ecosystem Productivity Model of Roberts Bank
10
Questions also remain regarding how the Monte Carlo randomization routine treated diet data The report indicates that the Monte Carlo routine randomly selected input parameters from the input ranges and that only models that were balanced were used This suggests that a high proportion of models were not balanced and therefore were not used (for example the EIS indicates that about one out of 1000 sampled input parameters was balanced6) A table showing the minimum maximum mode average and median values from the Monte Carlo runs for all the parameters would enable an evaluation of how much variation was actually sampled by the balanced model runs This is recommended in the EwE user information ie ldquoUsers should check the range of the input parameters that were actually used in the trials in the output csv file (see below)rdquo7
In addition there are several issues with the documentation of the derivation of the parameters for the functional groups Such documentation should clearly outline how the input parameter was estimated and the range of uncertainty for that parameter For example the input biomass of pinnipeds was defined as 04 t km 2 derived from estimates of 034 for Harbour seals and two estimates for Steller sea lions (012 and 014 t km 2) No explanation was provided for how the overall estimated pinniped biomass of 04 t km 2 was determined The diet of Sand Lance was described in the EIS as consisting mostly of zooplankton8 whereas the diet table for the model runs9 included 20 macrofauna 10 green algae and 10 detritus It is unclear why these additional prey were included in the diet used for the model runs
334 Highly mobile functional groups This implementation of the EwE framework included transient and migratory functional groups This is entirely appropriate and these groups cannot be excluded The approach taken in the Ecospace module was to impose a low (and conservative) dispersal rate among model spatial units (lsquopixelsrsquo) of 1 km yr-1 This may be appropriate for low mobility benthic organisms but it likely underestimates the movements of many other functional groups The effects of using higher and perhaps functional-group-specific dispersal rates was not considered The Proponents argued that higher dispersal rates would reduce impacts since species can move away from less desirable areas more quickly for completeness these runs should be done and evaluated Mobile species will also bring energy (food) captured outside the system into the modelled ecosystem This process was included in the model with the use of a diet import factor reflecting the consumption of prey outside the modelled region with the assumption that groups with high import rates were unlikely to respond to local changes on Roberts Bank10 This assumption needs justification perhaps at the functional group level for example many species of highly migratory birds and Pacific salmon use the Roberts Bank ecosystem to obtain food to continue their migrations Although this food does not compose a large fraction of their annual consumption it can be critical to enable them to continue their migrations
The EwE model is not designed to capture differences in prey quality ie differences in essential fatty acid or nutrient ratios The same species of prey may have greater or lesser nutritional value to predators depending on the conditions under which they are growing and their seasonal variations This is a particular concern with the nutritional quality of the diatom-dominated biofilm Diatomaceous biofilm is important to the highly migratory Western Sandpiper (Calidris mauri) Despite its predictive merits in relation to other ecosystem
6 EIS Appendix 10D Section 24 p5 7 EwE Help file p 151 8 EIS Appendix 10B Section 4133 p 76 9 EIS Appendix A of Appendix 10B 10 PMV Response 2016-03-02 p 28 lines 429 - 436
Pacific Region Science Response Technical Review Assessing
Ecosystem Productivity Model of Roberts Bank
11
components the EwE model is not informative with respect to understanding the potential impacts of the Project on biofilm and the Western Sandpiper While this example is specific to seabirds the potential exists for differences in the quality of biofilm to also be an issue for copepods which feed on biofilm and consequently to juvenile salmon which feed on these copepods (eg Sutherland et al 2013)
The EwE model is also not designed to predict effects of the Project on water quality although the Proponent noted that ldquoOther abiotic factors not included were deemed to be representative of variables that were already included in the modelhelliprdquo11 The Project may cause changes in physical and water quality conditions whether in isolation or in combination which may impact the productivity or nutritional quality of key prey organisms for local and migratory species which will not be captured by the model The EwE model does not assess the production of key nutrients or the implications of changes in important physical and water quality parameters to biofilm community structure and hence to important migratory birds
The model does not include biotic factors for both pelagic and benthic environments to assess the potential development of eutrophication and benthic organic enrichment events respectively Organic and redox indicators traditional measures of environmental assessments that are used to determine changes in functional group responses were included in the recent Deltaport Third environmental assessment (ie Pelagic chlorophyll dissolved nutrients Benthic sediment carbonnitrogen content redox state [sulfide concentration]) Benthic anoxic events based on organic enrichment are known to be strong drivers of community composition and exclusion regardless of substrate type In the absence of biotic factors (eg organic particulates) the model has not considered the potential for benthic organic enrichment which coincides with siltation processes within the upper tidal flats The tidal flat corner bordered by the Delta-dyke and Deltaport causeway has served as a catchment area for Fraser River silt since the development of the original Deltaport causeway (Sutherland et al 2013) The proposed position of the new terminal placed at the seaward termination of the Deltaport causeway may produce a crescent-shaped feature in the wake of the Fraser River Plume This feature may provide a more efficient silt trap that will promote benthic organic enrichment This piece of the environmental assessment seems to be missing and is important for assessing fish habitat in this area
335 Seasonality (model time step) Input data to parameterize the model were available on a range of time scales from hourly (eg physical data on salinity and water flow) to annual (eg species biomass) The Proponents indicated12 that this is a strength of the EwE model although ultimately the model was run with an annual time step with all sub-annual values being averaged to annual values This method therefore did not incorporate important seasonal processes such as winter-summer differences in salinity and storm properties and the seasonal appearances of abundances of predators and prey such as migratory salmon and birds that are much larger than the annual average For example juvenile salmon migrate from the Fraser River and onto Roberts Bank in the spring before moving into deeper waters If these spring abundances are averaged over the entire year these average abundances would be 5-10 times lower than the actual abundances during the spring (ie averaging the biomass that occurs in two months over a 12 month period) Additionally this method did not capture the intensity of processes such as growth and predation which can be focused over periods of a few weeks to a few months There may be important threshold effects at particular times and places which may be missed when using an 11 EIS Section 10 p 10-11 12 PMV Response 2016-03-02 p 86 line 1655
Pacific Region Science Response Technical Review Assessing
Ecosystem Productivity Model of Roberts Bank
12
annual time step for the model The Ecospace module has a monthly time step13 and therefore it is feasible to run this module with a sub-annual time step For example the Proponents submit14 that there are inadequate data to model the potential effects of the Project on the timing of biofilm production which could have implications for the migratory dunlin and Western Sandpiper However this could be modelled in an exploratory way to determine hypotheses about which factors could affect the timing of production of biofilm and the potential impacts on these birds These issues are of major concern to ECCC
336 Life history structure The EwE model did not separate functional groups into life history stages (stanzas) yet for many functional groups the juvenile stages can have very different life history characteristics and habitats than the adults It is unclear in the description of the model how different life history structures were considered and whether for example there were enough juveniles to produce the adults The implications of not including early life stages should be explored at least qualitatively to identify which species might have life stages that may be more vulnerable to project effects
337 Model balancing Balancing an EwE model is the process by which parameters are adjusted so that there is sufficient production for consumption requirements ie there are sufficient prey for all predators Expert opinion was used to examine parameter values and to adjust for errors or inconsistencies in logic ldquoPMV is confident that since the approach taken to balance the model was based on best practices the steps are appropriaterdquo15 Adjustments to initial parameters to ensure an ecologically-feasible model are necessary and to be expected For a few functional groups however very large changes to initial parameter estimates (which were often not based on Roberts Bank specific data) were necessary for example to transient killer whales When such initial parameters were adjusted (often by substantial amounts) by expert opinion to balance the model the confidence intervals around these adjusted parameter values were not increased to reflect this added uncertainty (see for example PMV Response 2016-03-02 p 51 lines 955-956) When expert opinion was used to make very large changes to initial parameter values broader confidence intervals about these parameters should have been applied This does not appear to have been the case and as a consequence may cause the actual uncertainty of the model outputs to be underestimated
Another example is for the pinniped group in which 50 of the diet was assumed to come from outside the model area in order to balance the model The rationale provided was ldquoThe pinnipeds caused excessive predation mortalities on numerous fish functional groups The biomass of pinnipeds was an average for the Strait of Georgia which was likely too high for Roberts Bank Therefore it was assumed that pinnipeds extracted only half of their diet from the study areardquo16 It is unclear whether the sensitivity of the model to different percentages of diet allocation was explored
As noted above (332) the Ecopath model was relatively unconstrained and few adjustments to input parameters were required to balance the model This is unusual and the low ecotrophic efficiencies of several functional groups suggest that full accounting of energy flows may not have been achieved (an ecotrophic efficiency of 1 indicates that 100 of the production of that
13 EIS Appendix 10C Section 29 p24 14 EIS Appendix 10D Appendix C p72 15 PMV Response 2016-03-02 p 49 lines 910-912 16 EIS Appendix 10C Section 261 p 20
Pacific Region Science Response Technical Review Assessing
Ecosystem Productivity Model of Roberts Bank
13
particular group is being preyed upon or removed by fishing leaving no individuals to die of old age17) An ldquoexcessrdquo of individuals dying of old age ie ecotrophic efficiencies much less than 1 suggests a potentially large biomass that is not used by the ecosystem and instead is converted to detritus
34 Model validation Model validation is the process by which the model parameters variables and outputs are compared with those from the real ecosystem to ascertain how well the model represents the ecosystem It is an essential step in providing confidence that the projections from the model in this case with and without the Project have relevance to how the real ecosystem may be expected to function with and without the Project In practice validating complex ecosystem models is difficult considering the range of assumptions that must be made when building the model the limited available data and natural variability of the ecosystem at a variety of time and space scales
Many of the standard diagnostics for the Ecopath model have not been evaluated in the EIS The Proponent appears to have assumed that once the Ecopath model was balanced then it was valid and fit for purpose The Proponent should provide all the Ecopath estimates of vital rates including mortality rates As presented questions remain For example many Ecotrophic Efficiencies (which control the transfer of biomass from prey to predators) are less than 1 even for taxa which would be expected to be close to 1 such as carnivorous zooplankton The reason for Ecotrophic Efficiencies less than 1 were not discussed or explained in the EIS
Detailed diagnostics for the Ecospace model should also be presented in order to evaluate model performance In response to criticisms by DFO ECCC and NRCan in discussions with the Proponent the latter provided the biomass of the functional groups from the Ecopath model (before Ecospace) and the Ecospace model after the spin-up period (which involved adjusting the parameters from the Ecopath model to balance the 5468 separate cells of the Ecospace model)18 The Proponents argue that ldquoIt is important to note that changes in biomass values generated during the spin-up period are identical for both with and without Project scenarios and thus do not provide information on the potential Project-related effects on productivity19 However several changes to biomass result from the Ecospace balancing process (spin-up period) This is only given brief attention by the Proponent in its response to the DFO ECCC and NRCan questions An analysis of Table 620 revealed that the biomass of 9 functional groups was larger or smaller than the widest confidence limits allowed for each group21 This requires further discussion and justification
The Proponent used a goodness of fit measure to compare spatial distributions of model outputs with field observations They indicated that ldquono other EwE models were identified which use a goodness-of-fit measure Hence the RB model is potentially the first such EwE model where a goodness of fit measure has been appliedrdquo22 The chosen goodness of fit measure is the percent correct classification (PCC) method23 This method derives a test statistic based on the proportion of locations at which predicted occurrences from the model match observed
17 EIS Appendix 10-B p 11 18 PMV Response 2016-03-02 p 65-66 Table 6 19 PMV Response 2016-03-02 p 64 lines 1205-1207 20 PMV Response 2016-03-02 p 65-66 Table 6 21 PMV Response 2016-03-02 p 45 Table 3 22 PMV Response 2016-03-02 p 78 lines 1481-1483 23 PMV Response 2016-03-02 p 78 lines 1483-1484
Pacific Region Science Response Technical Review Assessing
Ecosystem Productivity Model of Roberts Bank
14
occurrences from data and similarly with predicted and observed absences The Proponent then calculated two additional accuracy of fit measures sensitivity (the model predicts a species to occur in an area where it is known to occur in reality) and specificity (the model predicts a species does not occur in an area it is known not to occur in reality)24 This analysis concluded that the model has high predictability for functional groups such as eelgrass and sea pens with relatively static distributions but lower predictability for functional groups which are more temporally and spatially dynamic such as biofilm and green algae25
There are two problems with this approach The first is that this goodness of fit comparison was done only for habitat-forming functional groups no discussion of how well this analysis applies to mobile functional groups was provided The second problem is that this method does not take into account situations (such as occurs in this study with several groups) in which species occur at only a few locations For example ldquohellipif the test data consist of 95 absences and 5 presences and this reflects the true prevalence of the species on the landscape (a realistic scenario for a rare species) a lsquonullrsquo model that predicted absence in all cases (eg no model at all) would be correct 95 of the timehellipldquo (Franklin 2009 p 151) This latter point is important here as these habitat functional groups (biofilm brown algae native eelgrass green algae Japanese eelgrass tidal marsh biomat and orange sea pens26) appear not to occur over most of the Project area (as portrayed by the model outputs presented in the distribution figures of PMV Response 2016-03-02 Appendix 218) It is therefore important that a robust evaluation of the performance of the Ecospace module is used with preferably more than one measure
In summary the starting point for this modelling analysis matters It is not just about a comparison between results with and without the Project The model has to be considered a sufficient representation of the ecosystem The Proponent has not yet sufficiently validated the model
35 Model results 351 Presentation of model results
As noted above (Section 331) the stated objective of the Roberts Bank ecosystem model was not to provide an assessment of Project impacts for each functional group at a fine temporal scale but to estimate changes in productive potential with and without the Project at the ecosystem level27 However results were presented as comparisons by speciesfunctional group with and without the Project and not as potential changes in total ecosystem productivity The revised figures for each functional group showing distributions without the Project with the Project and their difference indicated impacts were likely to be localized with overall impacts relatively small The range of biomass ratios with and without the Project was 045 ndash 189 with most values slightly less than 1 This is interpreted as indicating slight decreases in the capacity of the study area to support biomass and production with the Project for many functional groups28 (Figure 2)
24 PMV Response 2016-03-02 p 80 lines 1524-1527 25 PMV Response 2016-03-02 p 81 lines 1551-1559 26 PMV Response 2016-03-02 p 82 Table 8 27 PMV Response 2016-03-02 p 99 lines 1914-1917 28 PMV Response 2016-03-02 Appendix 218
Pacific Region Science Response Technical Review Assessing
Ecosystem Productivity Model of Roberts Bank
15
Biomass Ratio
Freq
uenc
y
04 07 10 13 16 19
05
1015
2025
30
Figure 2 Histogram of biomass ratios obtained by comparisons of model runs with and without the project (ie With Without) Values less than 1 indicate reductions in biomass with the Project compared against without the Project) Data from Appendix 218 of PMV Response 2016-03-02
352 Sensitivity and vulnerability analyses Every ecosystem model is only one possible representation of the true ecosystem defined by the modelrsquos structure and the values chosen for its many parameters The key point is how well the model represents the real system how that fit can be measured and the sensitivity of model outputs to variability in the selected parameter values The ideal model should be robust to a wide range of uncertainties in the input data and parameters This robustness is determined by performing sensitivity analyses on the model to see how it responds to variations in the input parameters and determining to which input parameters the model is most sensitive
The vulnerability parameters determine the strength of the feeding interactions between functional groups They set the level of density dependence of each functional group Higher vulnerability settings provide greater top-down (predator) control whereas lower settings provide greater bottom-up (environmental) control29 Several publications have shown that EwE models are very sensitive to the vulnerability parameters and Christensen and Walters (2000) point out that a main pitfall of EwE is that ldquopredation vulnerabilities are often underestimated lessening the modelled impacts of predationrdquo It is usual practice to tune Ecopath models including the vulnerability parameters to time series data such as biomass using the temporal simulation model Ecosim However these data were not available for the RBT2 area so this robust method of fitting the model and estimating vulnerability parameters was not possible Instead a vulnerability setting of 2 was used as the default value for the key model runs which is ldquocommon practice when time series data are not available and estimates of vulnerability in the
29 PMV Response 2016-03-02 p 70 lines 1318-1323
Pacific Region Science Response Technical Review Assessing
Ecosystem Productivity Model of Roberts Bank
16
model cannot be maderdquo30 with sensitivity analyses run for a range of 15 to 3 This narrow range was criticized by DFOECCC in initial discussions about the model with the Proponent The Proponent subsequently reran the model with a larger range of vulnerabilities31 (11 to 10) and concluded this broader vulnerability range produced similar results for the productivity ratio with and without the Project to those in the original EIS and that the EIS was more likely to overestimate than underestimate potential project effects32 The data in Table 7 of the PMV Response33 did indicate changes in productivity ratios ranging from 0 to 50 of the defined key run (which used a vulnerability setting of 2) However the Proponent changed all vulnerability settings to the same value ie all were 2 or all were 10 etc In reality the vulnerability parameters resulting from Ecosim models that are fitted to data as described above vary by functional group which was not explored here Therefore although the results suggest that the original choice of 2 for the default key run seemed reasonable the potential effects of variability in vulnerability settings was not fully explored
Sensitivity analyses are usually based on the range of uncertainty estimated for input data and parameters often called the confidence limits around the model parameters The EwE framework integrates many different data sources and parameters including values from the literature It can therefore be difficult to identify ldquoreasonablerdquo confidence limits when derived from such diverse data sources Standard practice in Ecopath models has been to develop a pedigree for each parameter with default values for uncertainty based on the nature of the source data For example parameter values based on high precision field observations of biomass within the model domain receive default confidence intervals of 10 whereas parameter values based on models developed for elsewhere or professional judgment receive confidence intervals of 8034 Sensitivity analyses are then run using parameter values selected from within these confidence intervals However if these default confidence intervals do not capture the full range of variability then the outputs are not informative of the variability in the lsquorealrsquo ecosystem Field observations were collected for many functional groups within the model domain in 2012 and 2013 as part of studies to support the RBT2 EIS Apparently the purpose of these observations was to document spatial variability (in part for the Ecospace model) and temporal variability (measurements at one location over time) and not to derive confidence intervals around the observations35
The reliance on the pedigree approach to derive confidence intervals for this Roberts Bank model was criticized by DFO ECCC and NRCan in discussions with the Proponent As a result the Proponent reran the model with much larger confidence intervals ranging from 30 to 100 depending on the input parameter and functional group36 The results from this new analysis using the broader confidence intervals were similar to those using the original pedigree approach The Proponent noted that ldquoWhile the production within each helliprun was very different there was little difference in the biomass ratio [with and without the Project] These results further demonstrate that even with a greater range in input values the influence of the Project on the Roberts Bank ecosystem is consistent among allhellipmodel runsrdquo37 This provides confidence that the model may be robust to uncertainty in its input parameters Two concerns
30 PMV Response 2016-03-02 p 70 lines 1321-1322 31 PMV Response 2016-03-02 p 71-74 32 PMV Response 2016-03-02 p 71 lines 1339-1341 33 PMV Response 2016-03-02 p 73 34 EIS Appendix 10-C Section 251 page 18 35 PMV Response 2016-03-02 p 42 lines 772-777 36 PMV Response 2016-03-02 p 44-47 37 PMV Response 2016-03-02 p 47 lines 855-858 and see also PMV Response 2016-03-02 Appendix 27-B
Pacific Region Science Response Technical Review Assessing
Ecosystem Productivity Model of Roberts Bank
17
remain however The quote above indicates that the production among the different model runs was very different although with little difference in the biomass ratios with and without the Project Since biomass is not the same as production it would be informative for understanding model performance and potential impacts to show these production differences This also relates to the point made in Section 34 regarding how well the model represents the real ecosystem and not just within-model comparisons with and without the Project The second question is more technical and relates to how the randomization (Monte Carlo or MC) routine that was used to create multiple model runs used the uncertainty about the diet data Diets are not currently included in the MC routine available to regular users of the Ecosim model how they were handled in this RBT2 model appears not to be explained
Finally the sensitivity analyses indicate that the uncertainty in the input parameters does not lead to much difference between model parameters with or without the project However this conclusion does not describe how the uncertainty in the input parameters affects understanding of the ecosystem
40 Conclusions Overall the main conclusion of the Environmental Impact Statement from the Proponent is stated as ldquohellipafter the implementation of mitigation hellipthe Project is not expected to result in any significant adverse effects on any of the 16 valued componentsrdquo38 In addition ldquohellipapproximately 40 of the functional groups are forecast to change no more than 5 which hellip is judged to be within the uncertainty of the model runsrdquo39 although larger changes were forecast for orange sea pens freshwater biofilm green algae and raptors The conclusions from the modelling studies are that ldquohellipthe proposed project will have an impact on the study area that the effect varies between species and that the findings are robust to parameter uncertaintyrdquo40 Specific outcomes by valued component as derived from the EwE model are presented by functional groups in Table 1
38 PMV March 2015 Roberts Bank Environmental Impact Statement Executive Summary ndash Part 1 page 37 39 EIS Appendix 10-C p ii 40 EIS Appendix 10-D p iv
Pacific Region Science Response Technical Review Assessing
Ecosystem Productivity Model of Roberts Bank
18
Table 1 Changes in productive potential with the Project as derived from the EwE model
Changes in productive potential
Ecosystem category
Number of valued
components
Number with potential
biomass loss
Moderate decrease (31-60 decline)
Minor decrease (6-30 decline)
Negligible (0-5
change)
Minor increase (6-
30 increase)
Moderate increase (31-60 increase)
Source
Marine vegetation
7 7 - 3 2 2 - EIS Vol 3 Section 11 Table 11-17 page 11-65
Marine invertebrates
4 3 1 1 1 1 - EIS Vol 3 Section 12 Table 12-8 page 12-52
Marine fish 13 13 - 2 6 5 - EIS Vol 3 Section 13 Table 13-10 page 13-95
Coastal birds
11 8 - 3 4 3 1 EIS Vol 3 Section 15 Table 15-10 page 15-67
Pacific Region Science Response Technical Review Assessing
Ecosystem Productivity Model of Roberts Bank
19
Most functional groups showed some potential biomass loss with the Project with biomass loss defined as any model run with negative outcomes (ie in which biomass with the project was less than biomass without the Project) The summary of changes in productivity potential are mixed with most (33 out of 35) valued components showing minor decreases to minor increases (defined as 6 to 30 changes in productive potential with the Project compared to without the Project)
The main conclusions of this review in regards to the Terms of Reference are
1 Do the functional groups and abiotic variables used in the model adequately represent the ecosystem at Roberts Bank
o The 58 functional groups and abiotic variables used in the model adequately represent the main components of the Roberts Bank ecosystem however for longer lived species the life stages of the species are not well represented and some of the impacts of the Project may be expected to affect specific life stages
o The abiotic variables adequately represent the physical drivers of this ecosystem on an annual time scale However annual values for these abiotic variables may not adequately capture important sub-annual events such as storms (DFO 2016) the timing of arrival and departure of highly migratory species and whether there may be important sub-annual thresholds or mismatches in timing as a result of the Project
o Biotic factors (eg nutrients) which are particularly important for biofilm and other lower trophic level taxa are not included in this model The model is therefore unable to assess the potential development of eutrophication and benthic organic enrichment events which may affect fish habitats in the study area
2 Are the parameter estimates used by the model valid and defensible for this system
o In general parameter estimates appear to be adequate for this system Field studies were done in two years to provide data in particular on distributions of selected functional groups for the Ecospace module Note the distribution studies focussed on taxa which were relatively immobile and therefore lsquofixedrsquo in space
o the selection of some model parameters would benefit from further explanation for example the choice of fixed diet matrices versus dynamic matrices which can vary with changes in abundances or predators and prey
o the selection of some model parameters would benefit from further explanation for example the link between the diets described in the text of Appendix 10B and the quantities presented in Appendix A of Appendix 10B It is understood that proportions were derived using the ldquofixed selectivityrdquo principle but in order to be fully transparent the derivation of each diet should be provided in an appendix
o discussion and explanation is needed of why ecotrophic efficiencies differ from expected values (eg the ecotrophic efficiency for Pacific herring is listed as 038) and
o the abiotic factor lsquosubstratersquo was limited to ldquohardrdquo or rdquosoftrdquo options which can be restrictive given that they serve as endpoints on a substrate composition continuum These limited options may not provide the sensitivity required to assess substrate preference nor the flexibility for taxa (eg motile organisms) that span hard mixed and soft substrate types In addition it is not clear if changes in the hardsoft categories were considered over time within identified depositional or erosional settings before and after construction
Pacific Region Science Response Technical Review Assessing
Ecosystem Productivity Model of Roberts Bank
20
3 Are the limitations and uncertainties of the model identified and appropriately considered when determining the modelrsquos representation of current and possible future conditions
o the EwE model was not designed to evaluate a range of future conditions It was designed to estimate changes in the productive potential at the ecosystem level with and without the Project Therefore the model was run without the Project and with the Project for a range of plausible abiotic conditions and the results were compared with respect to biomass and productivity by functional group
o the pedigree approach to assessing the uncertainties of model outcomes is unsatisfactory for the purpose here as it relates solely to a qualitative judgment of the value of data based on its source However when the model was rerun with much wider ranges of confidence intervals (uncertainties) the results in general (but not necessarily for each functional group) were similar to the results using the original pedigree approach This suggests that taken overall the model may be robust to wide ranges of uncertainty in these input variables and parameters
o there is inadequate validation of the model This is inadequate for three reasons
(i) the basic Ecopath model is not validated and the Ecospace balancing process (the spin-up period) resulted in some biomass estimates being increased or decreased beyond their confidence limits
(ii) the goodness of fit test used to evaluate how well the model predicted the spatial occurrence functional groups is not fit for purpose (Section 34) and
(iii) validation was provided for only a small number of functional groups (the habitat-forming functional groups) As a consequence the model is currently not validated
o Considering the proportion of open boundaries relative to closed boundaries in the model processes taking place outside the modelled ecosystem are likely to contribute to dynamics within the modelled ecosystem However these external processes may not be well-resolved by the EwE model as currently configured
4 Are the model results related to the potential effects of the Project on fish and fish habitat and migratory birds and their food resources valid and defensible
o this is a very complex ecosystem model constructed for a relatively small and open (in the sense of considerable exchange with adjacent non-modelled areas) system Many assumptions have been made based on poor or missing data Taking all these considerations into account the model does the best job possible of comparing the biomass and productivity of the Roberts Bank ecosystem with and without the Project
o the extent to which the model adequately represents the lsquorealrsquo ecosystem of Roberts Bank as opposed to comparisons of model results with and without the Project is unclear as a number of basic diagnostics are not presented (see point 3 above)
o the EwE model is not capable of and is not designed to represent nutritional and food quality variations in prey functional groups and how these may impact highly migratory predators such as birds with and without the Project
5 Is the EwE model framework a valid method to quantify large scale impacts to fish habitat fish productivity and migratory bird productivity
o the EwE model as implemented in this project and reviewed here is a useful first-order framework to organise information and derive initial estimates of how the system may respond to perturbations
Pacific Region Science Response Technical Review Assessing
Ecosystem Productivity Model of Roberts Bank
21
o the utility of a EWE model for impact purposes is highly dependent on the quality of input data
o each EwE model is highly dependent on local conditions Although appropriate as an overall methodology each application would need to be reviewed for how it may be applied to any new ecosystem and
o the EwE model would need to be substantially reformulated if it was to include considerations of changes in chemical composition or food quality of prey in particular for seasonal migratory species such as birds which may depend on very large biomasses of prey with specific chemical composition to fuel their migrations beyond the ecosystem model boundaries
Contributors Contributor Affiliation Ian Perry Author DFO Science Pacific Region Alida Bundy Author DFO Science Maritimes Region Terri Sutherland Author DFO Science Pacific Region Robert Elner Author ECCC Canadian Wildlife Service Andrew Robinson Author ECCC Canadian Wildlife Service Lesley MacDougall Editor DFO Science Pacific Region
Approved by Carmel Lowe
Regional Director Science Branch Pacific Region Fisheries and Oceans Canada
November 4 2016
Sources of Information Christensen V Coll M Steenbeek J Buszowski J Chagaris D walters CJ 2014
Representing variable habitat quality in a spatial food web model Ecosystems 17 1397-1412
Christensen V and Walters C 2000 Ecopath with Ecosim methods capabilities and limitations Ecological Modelling 172 109-139
Colleacuteter M Valls A Guitton J Gascuel D Pauly D and Christensen V 2015 Global overview of the applications of the Ecopath with Ecosim modeling approach using the EcoBase models repository Ecological Modelling 302 pp42-53
Compass Resource Management Ltd 2013 Roberts Bank Terminal 2 Technical Advisory Group (TAG) Process Report Productive Capacity ndash Final Report 119pp (Accessed November 1 2016)
DFO 2016 Technical Review of Roberts Bank Terminal 2 Environmental Assessment Section 95 ndash Coastal Geomorphology DFO Can Sci Advis Sec Sci Resp 2016045 (Accessed November 4 2016)
Pacific Region Science Response Technical Review Assessing
Ecosystem Productivity Model of Roberts Bank
22
ESSA Technologies 2014a Roberts Bank Terminal 2 Project Roberts Bank Delta BC Environmental Impact Statement Volume 3 Biophysical Effects Assessments Appendix 10-C Roberts Bank Ecosystem Model Development and Key Run Port Metro Vancouver (Accessed November 1 2016)
ESSA Technologies 2014b Roberts Bank Terminal 2 Project Roberts Bank Delta BC Environmental Impact Statement Volume 3 Biophysical Effects Assessments Appendix 10-D Roberts Bank Ecosystem Model Sensitivity Analyses Port Metro Vancouver (Accessed November 1 2016)
Franklin J 2009 Mapping Species Distributions Spatial Inference and Prediction Cambridge University Press Cambridge
Hemmera 2014 Roberts Bank Terminal 2 Project Roberts Bank Delta BC Environmental Impact Statement Volume 3 Biophysical Effects Assessments Appendix 10-B Roberts Bank Ecosystem Model Parameter Estimates Port Metro Vancouver File 302-03503 (Accessed November 1 2016)
Port Metro Vancouver 2015a Roberts Bank Terminal 2 Project Roberts Bank Delta BC Environmental Impact Statement Volume 3 Biophysical Effects Assessments Section 100 Biophysical Setting (Accessed November 1 2016)
Port Metro Vancouver 2015b Roberts Bank Terminal 2 Project Roberts Bank Delta BC Environmental Impact Statement Volume 3 Biophysical Effects Assessments Section 103 Overview of Assessing Ecosystem Productivity (Accessed November 1 2016)
Port Metro Vancouver 2015c Roberts Bank Terminal 2 Project Environmental Assessment Additional Information Requirements (July 31 2015) Responses Response to Information Request 6 IR-73115-06 Canadian Environmental Assessment Agency Reference Number 80054 dated 26 October 2015
Steenbeek J Coll M Gurney L Meacutelin F Hoepffner N Buszowski J and Christensen V 2013 Bridging the gap between ecosystem modeling tools and geographic information systems Driving a food web model with external spatialndashtemporal data Ecological Modelling 263 139ndash 151
Sutherland T Elner R and OrsquoNeill J 2013 Roberts Bank Ecological crucible of the Fraser River estuary Progress in Oceanography 115 171ndash180
Vancouver Fraser Port Authority 2016 From the Vancouver Fraser Port Authority to the Review Panel re Answers to preliminary technical questions submitted during the completeness phase from Fisheries and Oceans Canada Natural Resources Canada and Environment and Climate Change Canada concerning the ecosystem modelling to support the Roberts Bank Terminal 2 Project environmental review CEAR Document 547 (Accessed November 1 2016)
Pacific Region Science Response Technical Review Assessing
Ecosystem Productivity Model of Roberts Bank
23
This Report is Available from the Centre for Science Advice
Pacific Region Fisheries and Oceans Canada
3190 Hammond Bay Road Nanaimo BC V9T 6N7
Telephone (250) 756-7208 E-Mail csapdfo-mpogcca
Internet address wwwdfo-mpogccacsas-sccs
ISSN 1919-3769 copy Her Majesty the Queen in Right of Canada 2016
Correct Citation for this Publication
DFO 2016 Technical review of Roberts Bank Terminal 2 environmental assessment section 103 ndash assessing ecosystem productivity DFO Can Sci Advis Sec Sci Resp 2016050
Aussi disponible en franccedilais
MPO 2016 Examen technique de leacutevaluation environnementale du Terminal 2 agrave Roberts Bank section 103 ndash eacutevaluation de la productiviteacute de leacutecosystegraveme Secr can de consult sci du MPO Reacutep des Sci 2016050
- TECHNICAL REVIEW OF ROBERTS BANK TERMINAL 2 ENVIRONMENTAL ASSESSMENT SECTION 103 ndash ASSESSING ECOSYSTEM PRODUCTIVITY
-
- 10 Context
- 20 Background
-
- 21 Background and Terms of Reference
- 22 Approach to assessing ecosystem productivity
-
- 30 Analysis and Response
-
- 31 The EwE Team
- 32 Overview of assessment results of hydrological and sediment modelling
- 33 Model implementation
-
- 331 The purpose of the EwE model
- 332 Applicability of the EwE model framework to the Roberts Bank region
- 333 Model documentation
- 334 Highly mobile functional groups
- 335 Seasonality (model time step)
- 336 Life history structure
- 337 Model balancing
-
- 34 Model validation
- 35 Model results
-
- 351 Presentation of model results
- 352 Sensitivity and vulnerability analyses
-
- 40 Conclusions
- Contributors
- Approved by
- Sources of Information
- This Report is Available from the
-
- CSAS 2016-50 - Assessing Ecosystem Productivitypdf
-
- TECHNICAL REVIEW OF ROBERTS BANK TERMINAL 2 ENVIRONMENTAL ASSESSMENT SECTION 103 ndash ASSESSING ECOSYSTEM PRODUCTIVITY
-
- 10 Context
- 20 Background
-
- 21 Background and Terms of Reference
- 22 Approach to assessing ecosystem productivity
-
- 30 Analysis and Response
-
- 31 The EwE Team
- 32 Overview of assessment results of hydrological and sediment modelling
- 33 Model implementation
-
- 331 The purpose of the EwE model
- 332 Applicability of the EwE model framework to the Roberts Bank region
- 333 Model documentation
- 334 Highly mobile functional groups
- 335 Seasonality (model time step)
- 336 Life history structure
- 337 Model balancing
-
- 34 Model validation
- 35 Model results
-
- 351 Presentation of model results
- 352 Sensitivity and vulnerability analyses
-
- 40 Conclusions
- Contributors
- Approved by
- Sources of Information
- This Report is Available from the
-
Canadian Science Advisory Secretariat Pacific Region Science Response 2016050
December 2016
TECHNICAL REVIEW OF ROBERTS BANK TERMINAL 2 ENVIRONMENTAL ASSESSMENT SECTION 103 ndash
ASSESSING ECOSYSTEM PRODUCTIVITY
10 Context Vancouver Fraser Port Authority (VFPA) formerly Port Metro Vancouver (the Proponent) is proposing to construct and operate the Roberts Bank Terminal 2 Project (the Project) a new three-berth marine container terminal at Roberts Bank in Delta British Columbia The proposed terminal is located next to the existing Deltaport and Westshore Terminals In addition to the construction of the new terminal the Proponent has proposed to widen the north side of the existing Roberts Bank causeway from its east-end connection with the mainland to the entrance to the new terminal The existing tug basin connected to the northeast side of Deltaport Terminal is also proposed to be expanded The new marine terminal is predicted by the Proponent to process up to 260 container ship calls per year at full capacity with the assistance of two or three large berthing or escort tugs to manoeuver ships into or away from assigned berths The terminal is designed to operate 24 hours per day year-round
The Roberts Bank Terminal 2 Project is subject to an environmental assessment by a Review Panel pursuant to the Canadian Environmental Assessment Act 2012 As a federal authority in the environmental assessment for the Project Fisheries and Oceans Canada (DFO) will be asked to present information to the review panel and at public hearings in relation to its expertise on the effects of the Project on fish and fish habitat including aquatic species at risk and the adequacy of mitigation and offsetting measures and monitoring and follow-up programs proposed by the Proponent DFOrsquos Pacific Region Fisheries Protection Program (FPP) will coordinate DFOrsquos participation in the environmental assessment
The Proponent assessed future ecosystem productivity at Roberts Bank using the Ecopath with Ecosim and Ecospace (EwE) model framework The potential impacts of the Project to hydrodynamic conditions and sediment transport in the area as a result of changes in wind wave and current patterns and intensities are projected using different model frameworks A companion Science Response (DFO 2016) has been developed by DFO and Natural Resource Canada (NRCan) to review Section 95 ldquoCoastal Geomorphologyrdquo of the Environmental Impact Statement (EIS) which describes the hydrodynamic and sedimentology models that were used to evaluate the effect of the Project on water and sediment movements
Outcomes of the EwE models are incorporated into the analysis of the potential project-related effects on the ongoing productivity of commercial recreational and Aboriginal fisheries Consequently DFO FPP has requested that DFO Science Branch provide an evaluation of the Proponentrsquos characterization of project-related effects as conducted using the Ecopath with Ecosim and Ecospace (EwE) ecosystem model
Pacific Region Science Response Technical Review Assessing
Ecosystem Productivity Model of Roberts Bank
2
The objectives for this Science Response are to
1 Determine if the functional groups and abiotic factors used in the model adequately represent the ecosystem at Roberts Bank
2 Assess whether the parameter estimates used by the model are valid and defensible for this system
3 Assess whether the limitations and uncertainties of the model are identified and appropriately considered when determining the modelrsquos representation of current and possible future conditions
4 Provide advice regarding whether the model results related to the potential effects of the Project on fish and fish habitat and migratory birds and their food resources are valid and defensible
5 If possible provide advice regarding the validity of using the EwE model framework to quantify large scale impacts to fish habitat and fisheries productivity and the productivity of migratory birds
This Science Response evaluates Section 100 ldquoBiophysical Settingrdquo with a focus on Section 103 ldquoOverview of Assessing Ecosystem Productivityrdquo in the EIS as submitted by the Proponent (Port Metro Vancouver 2015) This Section and consequently this Response describes the ecosystem modelling approach that was taken to evaluate the direct and indirect effects of the footprint of the proposed terminal and widened causeway herein referred to as lsquothe Projectrsquo This ecosystem model provides outputs related to potential effects of the project on the study area at an ecosystem level including aquatic species and bird species in the Project area Evaluation of the model and its outputs therefore required expertise in both fishery aquatic species and migratory bird species Consequently this Science Response is the product of a joint review between DFO and Environment and Climate Change Canada (ECCC) Canadian Wildlife Service and Wildlife and Landscape Science to provide a complete evaluation
This Science Response Report results from the Science Response Process of July 2016 on the Technical Review of Ecopath with Ecosim and Ecospace (EwE) Ecosystem Productivity Model application to the Roberts Bank Terminal 2 Environmental Assessment
20 Background
21 Background and Terms of Reference The Projectrsquos main components have a proposed combined marine footprint area of approximately 179 km2 listed below by specific component
bull Marine Terminal 1335 km 2 including terminal (116 km 2) and dredged berth pocket and marine approach areas (0174 km 2)
bull Widened Causeway 0424 km 2
bull Expanded Tug basin 0031 km 2
Roberts Bank in the Fraser River estuary consists of complex intertidal and subtidal habitats including intertidal eelgrass beds and is an important stopover area for migrating shorebirds and productive feeding and rearing habitats for many fish and invertebrate species It also provides habitat for endangered Southern Resident Killer Whales and other marine mammals
Pacific Region Science Response Technical Review Assessing
Ecosystem Productivity Model of Roberts Bank
3
The environmental conditions at Roberts Bank are dynamic and are influenced by a variety of oceanographic and atmospheric factors including the Fraser River freshwater and sediment plume discharge diurnal tidal currents and prevailing and storm-generated wind and wave activity In addition the intercauseway region provides significant drainage from marsh and agricultural areas which have different characteristics from marine waters and which run along the ferry causeway
To provide the required science advice this Science Response focusses on Section 10 ldquoBiophysical Settingrdquo of the Environmental Impact Statement (EIS) (Port Metro Vancouver 2015a) specifically Section 103 ldquoOverview of Assessing Ecosystem Productivityrdquo (Port Metro Vancouver 2015b) and its related Appendices 10-B ldquoRoberts Bank Ecopath with Ecosim and Ecospace model parameter estimatesrdquo (Hemmera 2014) Appendix 10-C ldquoRoberts Bank Ecosystem model development and key runsrdquo(ESSA Technologies 2014a) and Appendix 10-D ldquoRoberts Bank Ecosystem model sensitivity analysesrdquo (ESSA Technologies 2014b) Additional important information was obtained from the Response to Information Request 6 (IR-73115-06 Canadian Environmental Assessment Agency Reference Number 80054 dated 26 October 2015) (Port Metro Vancouver 2015c) and the Written Responses to Coastal Geomorphology and Ecosystem Modelling Questions provided by the Proponent to DFO ECCC and NRCan on 2 March 2016 (Port Metro Vancouver (PMV) Transmittal TRE-01-RBT2-0004A subsequently referred in this Science Response as ldquoPMV Response 2016-03-02rdquo) (Vancouver Fraser Port Authority 2016)
The process followed in preparing this Science Response involved an initial review of the submitted EIS followed by an in-person meeting of the Proponent its contractors and representatives of DFO ECCC and NRCan to discuss and clarify questions arising from the initial review (Vancouver 23 November 2015) DFO and NRCan provided written questions to the Proponent based on preliminary review of the EIS on November 19 2015 ECCC also provided written questions based on its preliminary review of the EIS to the Proponent on December 1 2015 and January 20 2016 This large initial meeting was followed by smaller focussed meetings between the Proponent its contractors and DFO and NRCan on 11 December 2015 to clarify hydrology and sediment modelling questions with DFO on 8 January 2016 to clarify ecosystem modelling questions and with ECCC on 18 February 2016 to clarify questions relating to birds Written responses to all of these meetings and questions were provided by the Proponent to DFO ECCC and NRCan as the ldquoPMV Response 2016-03-02rdquo and ldquoPMV Response 2016-05-30rdquo (Vancouver Fraser Port Authority 2016) VFPArsquos answers to questions posed by DFO and NRCan regarding coastal geomorphology modelling have been posted to the Canadian Environmental Assessment Registry (CEAR)
22 Approach to assessing ecosystem productivity The Proponent adopted an ecosystem approach to evaluate the direct and indirect effects of the Project on the productivity of the Roberts Bank ecosystem A weight of evidence approach was used to assess the potential effects of the project on the productivity of the ecosystem and selected key components in the study area this approach included a spatial ecosystem simulation model (which included a habitat capacity model) a shorebird opportunity model and empirical data An important point is that any effects on the system during the construction phase or from expansion of the tug basin were excluded from this modelling process the focus instead being a comparison of modelled system productivity before and after the proposed terminal and expanded causeway is in place The chosen ecosystem simulation model was
Pacific Region Science Response Technical Review Assessing
Ecosystem Productivity Model of Roberts Bank
4
Ecopath with Ecosim and its spatial version Ecospace (collectively referred to here as the EwE framework or EwE model) This modelling approach was recommended by a prior Productive Capacity Technical Advisory Group comprised of representatives of technical experts from government agencies academia non-governmental organizations Vancouver Fraser Port Authority and its consultants (Compass 2013) convened by the Proponent and which also recommended a selection of focal species for the model The final selection of functional groups and the resulting food web that form the core of this ecosystem model are shown in Figure 1
Pacific Region Science Response Technical Review Assessing
Ecosystem Productivity Model of Roberts Bank
5
Figure 1 Ecopath with Ecosim model food web for Roberts Bank (Adapted from EIS Volume 3 Section 10 Fig 1033 on page 10-16) The groups coloured in orange represent focal groups size of symbols represents relative annual amount of biomass in the Roberts Bank study area
Pacific Region Science Response Technical Review Assessing
Ecosystem Productivity Model of Roberts Bank
6
The EwE framework is a common approach to ecosystem modelling which has been developed and expanded over the past two to three decades It currently has three main components
1 Ecopath ndash the core model which provides a mass-balance snapshot of the system
2 Ecosim ndash a module that enables simulation modelling over time
3 Ecospace ndash a module that enables simulation modelling over space
In order to make an EwE model tractable species are aggregated into functional groups based on their similar ecological characteristics (habitat and prey preferences etc) the Roberts Bank models had 58 functional groups The first step (Ecopath) was to obtain input parameters representing biomass production consumption emigration and diet for each functional group These parameters were then tuned in an iterative process until the overall production and consumption was balanced (a mass-balance approach) resulting in a model food web with estimates of energy flow between functional groups (Fig 1)
In the second step Ecosim was combined with the spatial model Ecospace The abiotic variables selected in this EIS (depth salinity bottom current wave height sediment type) were used as external forcings to the Ecospace module These abiotic variables provided the physical forcings for the simulations without and with the Project Since time series data on the functional groups of the model were not available Ecospace was run until the model reached equilibrium using various assumptions of the value of the vulnerability parameter (see Section 352) In this EIS the selected time step was annual with all variables abiotic and biotic expressed as yearly averages As used in this EIS the Ecospace module included a habitat capacity model which estimated the distribution of functional groups based on their environmental preferences for each abiotic variable (depth salinity bottom current wave height) and for substrate type (sand mud etc) The model thus allocated the spatial distribution of functional groups over the model domain based on their environmental preferences and the distributions of these abiotic variables with and without the Project The selected spatial unit size (ldquopixelrdquo) for the Ecospace model was 100 m2 In essence an Ecopath model was constructed for each pixel with particular rules governing how the functional groups interacted and moved among these spatial units The Ecospace module was run until it approached equilibrium (20 model years) to establish the spatial patterns without the Project For the lsquowith the Projectrsquo simulations the model was run for an initial 10 years and then the spatial patterns of the abiotic variables with the project were added and the model run for an additional 10 years1 The model outputs predicted changes in the productive potential of the Roberts Bank ecosystem as a comparison (ratio) with and without the Project rather than an absolute biomass that would be lost or gained as a result of the Project
1 EIS Appendix 10-C p 26
Pacific Region Science Response Technical Review Assessing
Ecosystem Productivity Model of Roberts Bank
7
30 Analysis and Response To prepare this response the following sections of the EIS additional documents were reviewed
DocumentSection Title
EIS Section 10
Including appendices 10B 10C and 10D
(Port Metro Vancouver 2015a Hemmera 2014 ESSA Technologies 2014a ESSA Technologies 2014b)
Biophysical Setting
Appendix 10-B Roberts Bank Ecosystem Model Parameter Estimates Port Metro Vancouver File 302-03503
Appendix 10-C Roberts Bank Ecosystem Model Development and Key Run Port Metro Vancouver
Appendix 10-D Roberts Bank Ecosystem Model Sensitivity Analyses Port Metro Vancouver
CEAR document 547 (Including Appendices) ldquoPMV Response 2016-03-02rdquo and ldquoPMV Response 2016-05-30rdquo
(Vancouver Fraser Port Authority 2016)
Vancouver Fraser Port Authority to the Review Panel re Answers to preliminary technical questions submitted during the completeness phase from Fisheries and Oceans Canada Natural Resources Canada and Environment and Climate Change Canada concerning the ecosystem modelling to support the Roberts Bank Terminal 2 Project environmental review
31 The EwE Team Building this ecosystem model was a complex undertaking which required knowledge of the ecosystem to be modelled how to set initial parameter values determination of reasonable ranges of these parameters how to balance the model and how to recognize when the model outputs were unrealistic These tasks became even more complex when spatial model dynamics were involved such as with Ecospace The team engaged by the Proponent to conduct this ecosystem modelling for the Roberts Bank Terminal 2 (RBT2) EIS was led by scientists at the Institute for Oceans and Fisheries located at the University of British Columbia in Vancouver These scientists are global leaders of the EwE model framework having developed much of its current implementation and who continue to lead its elaborations and extensions Construction and running of the model for this specific ecosystem was done in collaboration with ESSA Technologies of Vancouver Parameter values for the ecosystem model were obtained in part from observational studies conducted in the area by Hemmera of Burnaby BC
32 Overview of assessment results of hydrological and sediment modelling Implementation of the ldquowith the Projectrdquo simulations of the ecosystem model was done by driving the model with the abiotic variables as they were projected to be distributed with the Project footprint In the context of this EIS specifying depth salinity bottom currents wave height and sediment type conditions without the Project and changes with the Project were achieved by construction of hydrodynamical and sediment transport models The outputs from these models in combination with the identified environment preferences for the various biological groups were then used as inputs to the Ecospace model to define the spatial
Pacific Region Science Response Technical Review Assessing
Ecosystem Productivity Model of Roberts Bank
8
distributions of these functional groups The implementation of these hydrological and sediment transport models in this EIS was reviewed by DFO and NRCan (DFO 2016) This review concluded that the implementation of these models for this EIS was adequate for average winter conditions but lacking in validation for summer conditions in particular with strong freshwater flows from the Fraser River Simulations of strong storm events and their impacts on wave conditions and sediment transport were also lacking The effect of wave action and current speeds on sediment transport is non-linear such that increasing winds over short periods of time can impact sediment transport processes bottom topography and water depths beyond that determined under average model conditions Overall the review concluded that a greater range of sensitivity analyses is required to have confidence in the model outputs under lsquonon-averagersquo conditions The implication of this conclusion for the present review of the EwE model is that the full range of variability of abiotic characteristics such as bottom topography bottom current and wave heights and how they may affect relevant functional groups in the model with the Project may not be adequately represented Sensitivity analyses were provided by varying the intensity of abiotic variables and by removing abiotic variables to assess their interactive effects In general the ecosystem model outputs were robust to these sensitivity analyses with most groups varying by less than 5 Larger changes however were observed for primary producer and bird groupings and for some fish groups when various abiotic variables were omitted2
33 Model implementation 331 The purpose of the EwE model
The EwE model was intended to provide one line of evidence to assess the potential impacts of the Project on the Roberts Bank ecosystem which would then be used with other lines of evidence to make the final assessment Specifically ldquohellip the objective of the RB [Roberts Bank] model was not to provide an assessment of Project impacts for each functional group at a fine temporal scale but to estimate changes in productive potential with and without the Project at the ecosystem levelrdquo3 In addition ldquohellipthe primary objective of the RB ecosystem model is to evaluate potential changes in productivity from such abiotic factors with and without the terminal and causewayrdquo4 Results are presented for the selected functional groups no results were presented on potential changes in ecosystem structure or function
332 Applicability of the EwE model framework to the Roberts Bank region EwE models work best when the exchanges within the system being modelled are greater than the exchanges between the modelled system and the lsquooutsidersquo world In practice this means that EwE models work best for larger systems with few external exchanges In a meta-analysis of 433 Ecopath models Colleacuteter et al (2015) concluded that ldquohellipin the last two decades the range of the models area has expanded toward very large areas and the median has shifted accordingly from about 1000 km2 in 1984ndash1993 to about 100000 km2 in 1994ndash2014rdquo The section of the Roberts Bank ecosystem that is included in the EwE model was comparatively small (5468 km2) and complex It is an intertidally-dominated environment that is subject to strong seasonal influences of both freshwater and marine exchanges across relatively large seaward and shoreward boundaries
2 EIS Appendix 10-D p ii - iii 3 PMV Response 2016-03-02 p 99 lines 1914-1917 4 PMV Response 2016-03-02 p 38 lines 689-691
Pacific Region Science Response Technical Review Assessing
Ecosystem Productivity Model of Roberts Bank
9
Processes taking place outside the modelled ecosystem will contribute to dynamics within the modelled ecosystem (eg lsquooutsidersquo food supporting predators which occur in the Roberts Bank ecosystem for only part of the year predators which may feed in the Roberts Bank ecosystem but export this energy when they migrate out of the region) but which may not be well-resolved by the EwE model The Proponent justifies the spatial scale because it was specifically chosen for the questions being asked in regard to assessing productivity changes and because the relative influences of external exchanges are assumed to be identical with and without the project In addition highly mobile species with broad prey bases were assumed in the model to be partially sustained by external energy from outside the model system5 The distributions of organisms may differ however with and without the project which may affect their interactions with areas outside of the modelled system and the use of diets from outside the modelled system may not reflect the impacts of the project Further clarification of how the EwE model captures the exchanges and interactions with adjacent ecosystems are needed For example it could be argued that an ecosystem which is open to frequent exchanges of water and organic matter from beyond its boundaries might be more robust to local disturbances such as the Project
There are some inconsistencies in the information and assumptions used for some of the taxa in this ecosystem model For Dungeness Crab the justification for estimating total adult biomass (including females) from the biomass of fished males is unclear In addition it is unclear if the slower growth of female crabs once they have reached sexual maturity in comparison with male crabs has been considered The diet matrix for spiny dogfish does not represent the actual diet well in particular of euphausiids herring and shrimp and there are more recent references for biomass estimates of spiny dogfish in the study area than what was used in the EIS
Fishing mortality was not included in the model under the assumption that this would not change with or without the project While this assumption may be true the model has been parameterized by ignoring a source of mortality that will influence total production In essence fishing removes biomass from the ecosystem with the result that less biomass will be available for higher trophic levels How this may impact the ecosystem with and without the Project is unclear but it could make noticeable differences if for example there were thresholds in the feeding responses by these higher trophic level species The Ecopath model that was used is relatively unconstrained since many ecological efficiencies are low even for forage species which would be expected to be higher It is not clear how many species are exploited or the levels of exploitation but even if this does not change with the Project these mortality rates should be included in the model in order to add realistic constraints to the exploited functional groups
333 Model documentation Based on questions from DFO ECCC and NRCan following their initial review of the EIS the Proponent provided written responses dated 2 March 2016 to clarify several of the steps in the model development and implementation However several questions remain including questions about the Ecospace module Ecospace has undergone several recent developments such as the inclusion of the spatial-temporal data layer framework (Steenbeek et al 2013) the habitat capacity model (Christensen et al 2014) and the Monte Carlo analysis including the diet matrix As yet there are few published studies using these latest Ecospace developments and their documentation and justification need to be improved in the EIS
5 PMV Response 2016-03-02 p 29 lines 446 - 464
Pacific Region Science Response Technical Review Assessing
Ecosystem Productivity Model of Roberts Bank
10
Questions also remain regarding how the Monte Carlo randomization routine treated diet data The report indicates that the Monte Carlo routine randomly selected input parameters from the input ranges and that only models that were balanced were used This suggests that a high proportion of models were not balanced and therefore were not used (for example the EIS indicates that about one out of 1000 sampled input parameters was balanced6) A table showing the minimum maximum mode average and median values from the Monte Carlo runs for all the parameters would enable an evaluation of how much variation was actually sampled by the balanced model runs This is recommended in the EwE user information ie ldquoUsers should check the range of the input parameters that were actually used in the trials in the output csv file (see below)rdquo7
In addition there are several issues with the documentation of the derivation of the parameters for the functional groups Such documentation should clearly outline how the input parameter was estimated and the range of uncertainty for that parameter For example the input biomass of pinnipeds was defined as 04 t km 2 derived from estimates of 034 for Harbour seals and two estimates for Steller sea lions (012 and 014 t km 2) No explanation was provided for how the overall estimated pinniped biomass of 04 t km 2 was determined The diet of Sand Lance was described in the EIS as consisting mostly of zooplankton8 whereas the diet table for the model runs9 included 20 macrofauna 10 green algae and 10 detritus It is unclear why these additional prey were included in the diet used for the model runs
334 Highly mobile functional groups This implementation of the EwE framework included transient and migratory functional groups This is entirely appropriate and these groups cannot be excluded The approach taken in the Ecospace module was to impose a low (and conservative) dispersal rate among model spatial units (lsquopixelsrsquo) of 1 km yr-1 This may be appropriate for low mobility benthic organisms but it likely underestimates the movements of many other functional groups The effects of using higher and perhaps functional-group-specific dispersal rates was not considered The Proponents argued that higher dispersal rates would reduce impacts since species can move away from less desirable areas more quickly for completeness these runs should be done and evaluated Mobile species will also bring energy (food) captured outside the system into the modelled ecosystem This process was included in the model with the use of a diet import factor reflecting the consumption of prey outside the modelled region with the assumption that groups with high import rates were unlikely to respond to local changes on Roberts Bank10 This assumption needs justification perhaps at the functional group level for example many species of highly migratory birds and Pacific salmon use the Roberts Bank ecosystem to obtain food to continue their migrations Although this food does not compose a large fraction of their annual consumption it can be critical to enable them to continue their migrations
The EwE model is not designed to capture differences in prey quality ie differences in essential fatty acid or nutrient ratios The same species of prey may have greater or lesser nutritional value to predators depending on the conditions under which they are growing and their seasonal variations This is a particular concern with the nutritional quality of the diatom-dominated biofilm Diatomaceous biofilm is important to the highly migratory Western Sandpiper (Calidris mauri) Despite its predictive merits in relation to other ecosystem
6 EIS Appendix 10D Section 24 p5 7 EwE Help file p 151 8 EIS Appendix 10B Section 4133 p 76 9 EIS Appendix A of Appendix 10B 10 PMV Response 2016-03-02 p 28 lines 429 - 436
Pacific Region Science Response Technical Review Assessing
Ecosystem Productivity Model of Roberts Bank
11
components the EwE model is not informative with respect to understanding the potential impacts of the Project on biofilm and the Western Sandpiper While this example is specific to seabirds the potential exists for differences in the quality of biofilm to also be an issue for copepods which feed on biofilm and consequently to juvenile salmon which feed on these copepods (eg Sutherland et al 2013)
The EwE model is also not designed to predict effects of the Project on water quality although the Proponent noted that ldquoOther abiotic factors not included were deemed to be representative of variables that were already included in the modelhelliprdquo11 The Project may cause changes in physical and water quality conditions whether in isolation or in combination which may impact the productivity or nutritional quality of key prey organisms for local and migratory species which will not be captured by the model The EwE model does not assess the production of key nutrients or the implications of changes in important physical and water quality parameters to biofilm community structure and hence to important migratory birds
The model does not include biotic factors for both pelagic and benthic environments to assess the potential development of eutrophication and benthic organic enrichment events respectively Organic and redox indicators traditional measures of environmental assessments that are used to determine changes in functional group responses were included in the recent Deltaport Third environmental assessment (ie Pelagic chlorophyll dissolved nutrients Benthic sediment carbonnitrogen content redox state [sulfide concentration]) Benthic anoxic events based on organic enrichment are known to be strong drivers of community composition and exclusion regardless of substrate type In the absence of biotic factors (eg organic particulates) the model has not considered the potential for benthic organic enrichment which coincides with siltation processes within the upper tidal flats The tidal flat corner bordered by the Delta-dyke and Deltaport causeway has served as a catchment area for Fraser River silt since the development of the original Deltaport causeway (Sutherland et al 2013) The proposed position of the new terminal placed at the seaward termination of the Deltaport causeway may produce a crescent-shaped feature in the wake of the Fraser River Plume This feature may provide a more efficient silt trap that will promote benthic organic enrichment This piece of the environmental assessment seems to be missing and is important for assessing fish habitat in this area
335 Seasonality (model time step) Input data to parameterize the model were available on a range of time scales from hourly (eg physical data on salinity and water flow) to annual (eg species biomass) The Proponents indicated12 that this is a strength of the EwE model although ultimately the model was run with an annual time step with all sub-annual values being averaged to annual values This method therefore did not incorporate important seasonal processes such as winter-summer differences in salinity and storm properties and the seasonal appearances of abundances of predators and prey such as migratory salmon and birds that are much larger than the annual average For example juvenile salmon migrate from the Fraser River and onto Roberts Bank in the spring before moving into deeper waters If these spring abundances are averaged over the entire year these average abundances would be 5-10 times lower than the actual abundances during the spring (ie averaging the biomass that occurs in two months over a 12 month period) Additionally this method did not capture the intensity of processes such as growth and predation which can be focused over periods of a few weeks to a few months There may be important threshold effects at particular times and places which may be missed when using an 11 EIS Section 10 p 10-11 12 PMV Response 2016-03-02 p 86 line 1655
Pacific Region Science Response Technical Review Assessing
Ecosystem Productivity Model of Roberts Bank
12
annual time step for the model The Ecospace module has a monthly time step13 and therefore it is feasible to run this module with a sub-annual time step For example the Proponents submit14 that there are inadequate data to model the potential effects of the Project on the timing of biofilm production which could have implications for the migratory dunlin and Western Sandpiper However this could be modelled in an exploratory way to determine hypotheses about which factors could affect the timing of production of biofilm and the potential impacts on these birds These issues are of major concern to ECCC
336 Life history structure The EwE model did not separate functional groups into life history stages (stanzas) yet for many functional groups the juvenile stages can have very different life history characteristics and habitats than the adults It is unclear in the description of the model how different life history structures were considered and whether for example there were enough juveniles to produce the adults The implications of not including early life stages should be explored at least qualitatively to identify which species might have life stages that may be more vulnerable to project effects
337 Model balancing Balancing an EwE model is the process by which parameters are adjusted so that there is sufficient production for consumption requirements ie there are sufficient prey for all predators Expert opinion was used to examine parameter values and to adjust for errors or inconsistencies in logic ldquoPMV is confident that since the approach taken to balance the model was based on best practices the steps are appropriaterdquo15 Adjustments to initial parameters to ensure an ecologically-feasible model are necessary and to be expected For a few functional groups however very large changes to initial parameter estimates (which were often not based on Roberts Bank specific data) were necessary for example to transient killer whales When such initial parameters were adjusted (often by substantial amounts) by expert opinion to balance the model the confidence intervals around these adjusted parameter values were not increased to reflect this added uncertainty (see for example PMV Response 2016-03-02 p 51 lines 955-956) When expert opinion was used to make very large changes to initial parameter values broader confidence intervals about these parameters should have been applied This does not appear to have been the case and as a consequence may cause the actual uncertainty of the model outputs to be underestimated
Another example is for the pinniped group in which 50 of the diet was assumed to come from outside the model area in order to balance the model The rationale provided was ldquoThe pinnipeds caused excessive predation mortalities on numerous fish functional groups The biomass of pinnipeds was an average for the Strait of Georgia which was likely too high for Roberts Bank Therefore it was assumed that pinnipeds extracted only half of their diet from the study areardquo16 It is unclear whether the sensitivity of the model to different percentages of diet allocation was explored
As noted above (332) the Ecopath model was relatively unconstrained and few adjustments to input parameters were required to balance the model This is unusual and the low ecotrophic efficiencies of several functional groups suggest that full accounting of energy flows may not have been achieved (an ecotrophic efficiency of 1 indicates that 100 of the production of that
13 EIS Appendix 10C Section 29 p24 14 EIS Appendix 10D Appendix C p72 15 PMV Response 2016-03-02 p 49 lines 910-912 16 EIS Appendix 10C Section 261 p 20
Pacific Region Science Response Technical Review Assessing
Ecosystem Productivity Model of Roberts Bank
13
particular group is being preyed upon or removed by fishing leaving no individuals to die of old age17) An ldquoexcessrdquo of individuals dying of old age ie ecotrophic efficiencies much less than 1 suggests a potentially large biomass that is not used by the ecosystem and instead is converted to detritus
34 Model validation Model validation is the process by which the model parameters variables and outputs are compared with those from the real ecosystem to ascertain how well the model represents the ecosystem It is an essential step in providing confidence that the projections from the model in this case with and without the Project have relevance to how the real ecosystem may be expected to function with and without the Project In practice validating complex ecosystem models is difficult considering the range of assumptions that must be made when building the model the limited available data and natural variability of the ecosystem at a variety of time and space scales
Many of the standard diagnostics for the Ecopath model have not been evaluated in the EIS The Proponent appears to have assumed that once the Ecopath model was balanced then it was valid and fit for purpose The Proponent should provide all the Ecopath estimates of vital rates including mortality rates As presented questions remain For example many Ecotrophic Efficiencies (which control the transfer of biomass from prey to predators) are less than 1 even for taxa which would be expected to be close to 1 such as carnivorous zooplankton The reason for Ecotrophic Efficiencies less than 1 were not discussed or explained in the EIS
Detailed diagnostics for the Ecospace model should also be presented in order to evaluate model performance In response to criticisms by DFO ECCC and NRCan in discussions with the Proponent the latter provided the biomass of the functional groups from the Ecopath model (before Ecospace) and the Ecospace model after the spin-up period (which involved adjusting the parameters from the Ecopath model to balance the 5468 separate cells of the Ecospace model)18 The Proponents argue that ldquoIt is important to note that changes in biomass values generated during the spin-up period are identical for both with and without Project scenarios and thus do not provide information on the potential Project-related effects on productivity19 However several changes to biomass result from the Ecospace balancing process (spin-up period) This is only given brief attention by the Proponent in its response to the DFO ECCC and NRCan questions An analysis of Table 620 revealed that the biomass of 9 functional groups was larger or smaller than the widest confidence limits allowed for each group21 This requires further discussion and justification
The Proponent used a goodness of fit measure to compare spatial distributions of model outputs with field observations They indicated that ldquono other EwE models were identified which use a goodness-of-fit measure Hence the RB model is potentially the first such EwE model where a goodness of fit measure has been appliedrdquo22 The chosen goodness of fit measure is the percent correct classification (PCC) method23 This method derives a test statistic based on the proportion of locations at which predicted occurrences from the model match observed
17 EIS Appendix 10-B p 11 18 PMV Response 2016-03-02 p 65-66 Table 6 19 PMV Response 2016-03-02 p 64 lines 1205-1207 20 PMV Response 2016-03-02 p 65-66 Table 6 21 PMV Response 2016-03-02 p 45 Table 3 22 PMV Response 2016-03-02 p 78 lines 1481-1483 23 PMV Response 2016-03-02 p 78 lines 1483-1484
Pacific Region Science Response Technical Review Assessing
Ecosystem Productivity Model of Roberts Bank
14
occurrences from data and similarly with predicted and observed absences The Proponent then calculated two additional accuracy of fit measures sensitivity (the model predicts a species to occur in an area where it is known to occur in reality) and specificity (the model predicts a species does not occur in an area it is known not to occur in reality)24 This analysis concluded that the model has high predictability for functional groups such as eelgrass and sea pens with relatively static distributions but lower predictability for functional groups which are more temporally and spatially dynamic such as biofilm and green algae25
There are two problems with this approach The first is that this goodness of fit comparison was done only for habitat-forming functional groups no discussion of how well this analysis applies to mobile functional groups was provided The second problem is that this method does not take into account situations (such as occurs in this study with several groups) in which species occur at only a few locations For example ldquohellipif the test data consist of 95 absences and 5 presences and this reflects the true prevalence of the species on the landscape (a realistic scenario for a rare species) a lsquonullrsquo model that predicted absence in all cases (eg no model at all) would be correct 95 of the timehellipldquo (Franklin 2009 p 151) This latter point is important here as these habitat functional groups (biofilm brown algae native eelgrass green algae Japanese eelgrass tidal marsh biomat and orange sea pens26) appear not to occur over most of the Project area (as portrayed by the model outputs presented in the distribution figures of PMV Response 2016-03-02 Appendix 218) It is therefore important that a robust evaluation of the performance of the Ecospace module is used with preferably more than one measure
In summary the starting point for this modelling analysis matters It is not just about a comparison between results with and without the Project The model has to be considered a sufficient representation of the ecosystem The Proponent has not yet sufficiently validated the model
35 Model results 351 Presentation of model results
As noted above (Section 331) the stated objective of the Roberts Bank ecosystem model was not to provide an assessment of Project impacts for each functional group at a fine temporal scale but to estimate changes in productive potential with and without the Project at the ecosystem level27 However results were presented as comparisons by speciesfunctional group with and without the Project and not as potential changes in total ecosystem productivity The revised figures for each functional group showing distributions without the Project with the Project and their difference indicated impacts were likely to be localized with overall impacts relatively small The range of biomass ratios with and without the Project was 045 ndash 189 with most values slightly less than 1 This is interpreted as indicating slight decreases in the capacity of the study area to support biomass and production with the Project for many functional groups28 (Figure 2)
24 PMV Response 2016-03-02 p 80 lines 1524-1527 25 PMV Response 2016-03-02 p 81 lines 1551-1559 26 PMV Response 2016-03-02 p 82 Table 8 27 PMV Response 2016-03-02 p 99 lines 1914-1917 28 PMV Response 2016-03-02 Appendix 218
Pacific Region Science Response Technical Review Assessing
Ecosystem Productivity Model of Roberts Bank
15
Biomass Ratio
Freq
uenc
y
04 07 10 13 16 19
05
1015
2025
30
Figure 2 Histogram of biomass ratios obtained by comparisons of model runs with and without the project (ie With Without) Values less than 1 indicate reductions in biomass with the Project compared against without the Project) Data from Appendix 218 of PMV Response 2016-03-02
352 Sensitivity and vulnerability analyses Every ecosystem model is only one possible representation of the true ecosystem defined by the modelrsquos structure and the values chosen for its many parameters The key point is how well the model represents the real system how that fit can be measured and the sensitivity of model outputs to variability in the selected parameter values The ideal model should be robust to a wide range of uncertainties in the input data and parameters This robustness is determined by performing sensitivity analyses on the model to see how it responds to variations in the input parameters and determining to which input parameters the model is most sensitive
The vulnerability parameters determine the strength of the feeding interactions between functional groups They set the level of density dependence of each functional group Higher vulnerability settings provide greater top-down (predator) control whereas lower settings provide greater bottom-up (environmental) control29 Several publications have shown that EwE models are very sensitive to the vulnerability parameters and Christensen and Walters (2000) point out that a main pitfall of EwE is that ldquopredation vulnerabilities are often underestimated lessening the modelled impacts of predationrdquo It is usual practice to tune Ecopath models including the vulnerability parameters to time series data such as biomass using the temporal simulation model Ecosim However these data were not available for the RBT2 area so this robust method of fitting the model and estimating vulnerability parameters was not possible Instead a vulnerability setting of 2 was used as the default value for the key model runs which is ldquocommon practice when time series data are not available and estimates of vulnerability in the
29 PMV Response 2016-03-02 p 70 lines 1318-1323
Pacific Region Science Response Technical Review Assessing
Ecosystem Productivity Model of Roberts Bank
16
model cannot be maderdquo30 with sensitivity analyses run for a range of 15 to 3 This narrow range was criticized by DFOECCC in initial discussions about the model with the Proponent The Proponent subsequently reran the model with a larger range of vulnerabilities31 (11 to 10) and concluded this broader vulnerability range produced similar results for the productivity ratio with and without the Project to those in the original EIS and that the EIS was more likely to overestimate than underestimate potential project effects32 The data in Table 7 of the PMV Response33 did indicate changes in productivity ratios ranging from 0 to 50 of the defined key run (which used a vulnerability setting of 2) However the Proponent changed all vulnerability settings to the same value ie all were 2 or all were 10 etc In reality the vulnerability parameters resulting from Ecosim models that are fitted to data as described above vary by functional group which was not explored here Therefore although the results suggest that the original choice of 2 for the default key run seemed reasonable the potential effects of variability in vulnerability settings was not fully explored
Sensitivity analyses are usually based on the range of uncertainty estimated for input data and parameters often called the confidence limits around the model parameters The EwE framework integrates many different data sources and parameters including values from the literature It can therefore be difficult to identify ldquoreasonablerdquo confidence limits when derived from such diverse data sources Standard practice in Ecopath models has been to develop a pedigree for each parameter with default values for uncertainty based on the nature of the source data For example parameter values based on high precision field observations of biomass within the model domain receive default confidence intervals of 10 whereas parameter values based on models developed for elsewhere or professional judgment receive confidence intervals of 8034 Sensitivity analyses are then run using parameter values selected from within these confidence intervals However if these default confidence intervals do not capture the full range of variability then the outputs are not informative of the variability in the lsquorealrsquo ecosystem Field observations were collected for many functional groups within the model domain in 2012 and 2013 as part of studies to support the RBT2 EIS Apparently the purpose of these observations was to document spatial variability (in part for the Ecospace model) and temporal variability (measurements at one location over time) and not to derive confidence intervals around the observations35
The reliance on the pedigree approach to derive confidence intervals for this Roberts Bank model was criticized by DFO ECCC and NRCan in discussions with the Proponent As a result the Proponent reran the model with much larger confidence intervals ranging from 30 to 100 depending on the input parameter and functional group36 The results from this new analysis using the broader confidence intervals were similar to those using the original pedigree approach The Proponent noted that ldquoWhile the production within each helliprun was very different there was little difference in the biomass ratio [with and without the Project] These results further demonstrate that even with a greater range in input values the influence of the Project on the Roberts Bank ecosystem is consistent among allhellipmodel runsrdquo37 This provides confidence that the model may be robust to uncertainty in its input parameters Two concerns
30 PMV Response 2016-03-02 p 70 lines 1321-1322 31 PMV Response 2016-03-02 p 71-74 32 PMV Response 2016-03-02 p 71 lines 1339-1341 33 PMV Response 2016-03-02 p 73 34 EIS Appendix 10-C Section 251 page 18 35 PMV Response 2016-03-02 p 42 lines 772-777 36 PMV Response 2016-03-02 p 44-47 37 PMV Response 2016-03-02 p 47 lines 855-858 and see also PMV Response 2016-03-02 Appendix 27-B
Pacific Region Science Response Technical Review Assessing
Ecosystem Productivity Model of Roberts Bank
17
remain however The quote above indicates that the production among the different model runs was very different although with little difference in the biomass ratios with and without the Project Since biomass is not the same as production it would be informative for understanding model performance and potential impacts to show these production differences This also relates to the point made in Section 34 regarding how well the model represents the real ecosystem and not just within-model comparisons with and without the Project The second question is more technical and relates to how the randomization (Monte Carlo or MC) routine that was used to create multiple model runs used the uncertainty about the diet data Diets are not currently included in the MC routine available to regular users of the Ecosim model how they were handled in this RBT2 model appears not to be explained
Finally the sensitivity analyses indicate that the uncertainty in the input parameters does not lead to much difference between model parameters with or without the project However this conclusion does not describe how the uncertainty in the input parameters affects understanding of the ecosystem
40 Conclusions Overall the main conclusion of the Environmental Impact Statement from the Proponent is stated as ldquohellipafter the implementation of mitigation hellipthe Project is not expected to result in any significant adverse effects on any of the 16 valued componentsrdquo38 In addition ldquohellipapproximately 40 of the functional groups are forecast to change no more than 5 which hellip is judged to be within the uncertainty of the model runsrdquo39 although larger changes were forecast for orange sea pens freshwater biofilm green algae and raptors The conclusions from the modelling studies are that ldquohellipthe proposed project will have an impact on the study area that the effect varies between species and that the findings are robust to parameter uncertaintyrdquo40 Specific outcomes by valued component as derived from the EwE model are presented by functional groups in Table 1
38 PMV March 2015 Roberts Bank Environmental Impact Statement Executive Summary ndash Part 1 page 37 39 EIS Appendix 10-C p ii 40 EIS Appendix 10-D p iv
Pacific Region Science Response Technical Review Assessing
Ecosystem Productivity Model of Roberts Bank
18
Table 1 Changes in productive potential with the Project as derived from the EwE model
Changes in productive potential
Ecosystem category
Number of valued
components
Number with potential
biomass loss
Moderate decrease (31-60 decline)
Minor decrease (6-30 decline)
Negligible (0-5
change)
Minor increase (6-
30 increase)
Moderate increase (31-60 increase)
Source
Marine vegetation
7 7 - 3 2 2 - EIS Vol 3 Section 11 Table 11-17 page 11-65
Marine invertebrates
4 3 1 1 1 1 - EIS Vol 3 Section 12 Table 12-8 page 12-52
Marine fish 13 13 - 2 6 5 - EIS Vol 3 Section 13 Table 13-10 page 13-95
Coastal birds
11 8 - 3 4 3 1 EIS Vol 3 Section 15 Table 15-10 page 15-67
Pacific Region Science Response Technical Review Assessing
Ecosystem Productivity Model of Roberts Bank
19
Most functional groups showed some potential biomass loss with the Project with biomass loss defined as any model run with negative outcomes (ie in which biomass with the project was less than biomass without the Project) The summary of changes in productivity potential are mixed with most (33 out of 35) valued components showing minor decreases to minor increases (defined as 6 to 30 changes in productive potential with the Project compared to without the Project)
The main conclusions of this review in regards to the Terms of Reference are
1 Do the functional groups and abiotic variables used in the model adequately represent the ecosystem at Roberts Bank
o The 58 functional groups and abiotic variables used in the model adequately represent the main components of the Roberts Bank ecosystem however for longer lived species the life stages of the species are not well represented and some of the impacts of the Project may be expected to affect specific life stages
o The abiotic variables adequately represent the physical drivers of this ecosystem on an annual time scale However annual values for these abiotic variables may not adequately capture important sub-annual events such as storms (DFO 2016) the timing of arrival and departure of highly migratory species and whether there may be important sub-annual thresholds or mismatches in timing as a result of the Project
o Biotic factors (eg nutrients) which are particularly important for biofilm and other lower trophic level taxa are not included in this model The model is therefore unable to assess the potential development of eutrophication and benthic organic enrichment events which may affect fish habitats in the study area
2 Are the parameter estimates used by the model valid and defensible for this system
o In general parameter estimates appear to be adequate for this system Field studies were done in two years to provide data in particular on distributions of selected functional groups for the Ecospace module Note the distribution studies focussed on taxa which were relatively immobile and therefore lsquofixedrsquo in space
o the selection of some model parameters would benefit from further explanation for example the choice of fixed diet matrices versus dynamic matrices which can vary with changes in abundances or predators and prey
o the selection of some model parameters would benefit from further explanation for example the link between the diets described in the text of Appendix 10B and the quantities presented in Appendix A of Appendix 10B It is understood that proportions were derived using the ldquofixed selectivityrdquo principle but in order to be fully transparent the derivation of each diet should be provided in an appendix
o discussion and explanation is needed of why ecotrophic efficiencies differ from expected values (eg the ecotrophic efficiency for Pacific herring is listed as 038) and
o the abiotic factor lsquosubstratersquo was limited to ldquohardrdquo or rdquosoftrdquo options which can be restrictive given that they serve as endpoints on a substrate composition continuum These limited options may not provide the sensitivity required to assess substrate preference nor the flexibility for taxa (eg motile organisms) that span hard mixed and soft substrate types In addition it is not clear if changes in the hardsoft categories were considered over time within identified depositional or erosional settings before and after construction
Pacific Region Science Response Technical Review Assessing
Ecosystem Productivity Model of Roberts Bank
20
3 Are the limitations and uncertainties of the model identified and appropriately considered when determining the modelrsquos representation of current and possible future conditions
o the EwE model was not designed to evaluate a range of future conditions It was designed to estimate changes in the productive potential at the ecosystem level with and without the Project Therefore the model was run without the Project and with the Project for a range of plausible abiotic conditions and the results were compared with respect to biomass and productivity by functional group
o the pedigree approach to assessing the uncertainties of model outcomes is unsatisfactory for the purpose here as it relates solely to a qualitative judgment of the value of data based on its source However when the model was rerun with much wider ranges of confidence intervals (uncertainties) the results in general (but not necessarily for each functional group) were similar to the results using the original pedigree approach This suggests that taken overall the model may be robust to wide ranges of uncertainty in these input variables and parameters
o there is inadequate validation of the model This is inadequate for three reasons
(i) the basic Ecopath model is not validated and the Ecospace balancing process (the spin-up period) resulted in some biomass estimates being increased or decreased beyond their confidence limits
(ii) the goodness of fit test used to evaluate how well the model predicted the spatial occurrence functional groups is not fit for purpose (Section 34) and
(iii) validation was provided for only a small number of functional groups (the habitat-forming functional groups) As a consequence the model is currently not validated
o Considering the proportion of open boundaries relative to closed boundaries in the model processes taking place outside the modelled ecosystem are likely to contribute to dynamics within the modelled ecosystem However these external processes may not be well-resolved by the EwE model as currently configured
4 Are the model results related to the potential effects of the Project on fish and fish habitat and migratory birds and their food resources valid and defensible
o this is a very complex ecosystem model constructed for a relatively small and open (in the sense of considerable exchange with adjacent non-modelled areas) system Many assumptions have been made based on poor or missing data Taking all these considerations into account the model does the best job possible of comparing the biomass and productivity of the Roberts Bank ecosystem with and without the Project
o the extent to which the model adequately represents the lsquorealrsquo ecosystem of Roberts Bank as opposed to comparisons of model results with and without the Project is unclear as a number of basic diagnostics are not presented (see point 3 above)
o the EwE model is not capable of and is not designed to represent nutritional and food quality variations in prey functional groups and how these may impact highly migratory predators such as birds with and without the Project
5 Is the EwE model framework a valid method to quantify large scale impacts to fish habitat fish productivity and migratory bird productivity
o the EwE model as implemented in this project and reviewed here is a useful first-order framework to organise information and derive initial estimates of how the system may respond to perturbations
Pacific Region Science Response Technical Review Assessing
Ecosystem Productivity Model of Roberts Bank
21
o the utility of a EWE model for impact purposes is highly dependent on the quality of input data
o each EwE model is highly dependent on local conditions Although appropriate as an overall methodology each application would need to be reviewed for how it may be applied to any new ecosystem and
o the EwE model would need to be substantially reformulated if it was to include considerations of changes in chemical composition or food quality of prey in particular for seasonal migratory species such as birds which may depend on very large biomasses of prey with specific chemical composition to fuel their migrations beyond the ecosystem model boundaries
Contributors Contributor Affiliation Ian Perry Author DFO Science Pacific Region Alida Bundy Author DFO Science Maritimes Region Terri Sutherland Author DFO Science Pacific Region Robert Elner Author ECCC Canadian Wildlife Service Andrew Robinson Author ECCC Canadian Wildlife Service Lesley MacDougall Editor DFO Science Pacific Region
Approved by Carmel Lowe
Regional Director Science Branch Pacific Region Fisheries and Oceans Canada
November 4 2016
Sources of Information Christensen V Coll M Steenbeek J Buszowski J Chagaris D walters CJ 2014
Representing variable habitat quality in a spatial food web model Ecosystems 17 1397-1412
Christensen V and Walters C 2000 Ecopath with Ecosim methods capabilities and limitations Ecological Modelling 172 109-139
Colleacuteter M Valls A Guitton J Gascuel D Pauly D and Christensen V 2015 Global overview of the applications of the Ecopath with Ecosim modeling approach using the EcoBase models repository Ecological Modelling 302 pp42-53
Compass Resource Management Ltd 2013 Roberts Bank Terminal 2 Technical Advisory Group (TAG) Process Report Productive Capacity ndash Final Report 119pp (Accessed November 1 2016)
DFO 2016 Technical Review of Roberts Bank Terminal 2 Environmental Assessment Section 95 ndash Coastal Geomorphology DFO Can Sci Advis Sec Sci Resp 2016045 (Accessed November 4 2016)
Pacific Region Science Response Technical Review Assessing
Ecosystem Productivity Model of Roberts Bank
22
ESSA Technologies 2014a Roberts Bank Terminal 2 Project Roberts Bank Delta BC Environmental Impact Statement Volume 3 Biophysical Effects Assessments Appendix 10-C Roberts Bank Ecosystem Model Development and Key Run Port Metro Vancouver (Accessed November 1 2016)
ESSA Technologies 2014b Roberts Bank Terminal 2 Project Roberts Bank Delta BC Environmental Impact Statement Volume 3 Biophysical Effects Assessments Appendix 10-D Roberts Bank Ecosystem Model Sensitivity Analyses Port Metro Vancouver (Accessed November 1 2016)
Franklin J 2009 Mapping Species Distributions Spatial Inference and Prediction Cambridge University Press Cambridge
Hemmera 2014 Roberts Bank Terminal 2 Project Roberts Bank Delta BC Environmental Impact Statement Volume 3 Biophysical Effects Assessments Appendix 10-B Roberts Bank Ecosystem Model Parameter Estimates Port Metro Vancouver File 302-03503 (Accessed November 1 2016)
Port Metro Vancouver 2015a Roberts Bank Terminal 2 Project Roberts Bank Delta BC Environmental Impact Statement Volume 3 Biophysical Effects Assessments Section 100 Biophysical Setting (Accessed November 1 2016)
Port Metro Vancouver 2015b Roberts Bank Terminal 2 Project Roberts Bank Delta BC Environmental Impact Statement Volume 3 Biophysical Effects Assessments Section 103 Overview of Assessing Ecosystem Productivity (Accessed November 1 2016)
Port Metro Vancouver 2015c Roberts Bank Terminal 2 Project Environmental Assessment Additional Information Requirements (July 31 2015) Responses Response to Information Request 6 IR-73115-06 Canadian Environmental Assessment Agency Reference Number 80054 dated 26 October 2015
Steenbeek J Coll M Gurney L Meacutelin F Hoepffner N Buszowski J and Christensen V 2013 Bridging the gap between ecosystem modeling tools and geographic information systems Driving a food web model with external spatialndashtemporal data Ecological Modelling 263 139ndash 151
Sutherland T Elner R and OrsquoNeill J 2013 Roberts Bank Ecological crucible of the Fraser River estuary Progress in Oceanography 115 171ndash180
Vancouver Fraser Port Authority 2016 From the Vancouver Fraser Port Authority to the Review Panel re Answers to preliminary technical questions submitted during the completeness phase from Fisheries and Oceans Canada Natural Resources Canada and Environment and Climate Change Canada concerning the ecosystem modelling to support the Roberts Bank Terminal 2 Project environmental review CEAR Document 547 (Accessed November 1 2016)
Pacific Region Science Response Technical Review Assessing
Ecosystem Productivity Model of Roberts Bank
23
This Report is Available from the Centre for Science Advice
Pacific Region Fisheries and Oceans Canada
3190 Hammond Bay Road Nanaimo BC V9T 6N7
Telephone (250) 756-7208 E-Mail csapdfo-mpogcca
Internet address wwwdfo-mpogccacsas-sccs
ISSN 1919-3769 copy Her Majesty the Queen in Right of Canada 2016
Correct Citation for this Publication
DFO 2016 Technical review of Roberts Bank Terminal 2 environmental assessment section 103 ndash assessing ecosystem productivity DFO Can Sci Advis Sec Sci Resp 2016050
Aussi disponible en franccedilais
MPO 2016 Examen technique de leacutevaluation environnementale du Terminal 2 agrave Roberts Bank section 103 ndash eacutevaluation de la productiviteacute de leacutecosystegraveme Secr can de consult sci du MPO Reacutep des Sci 2016050

Pacific Region Science Response Technical Review Assessing
Ecosystem Productivity Model of Roberts Bank
3
The environmental conditions at Roberts Bank are dynamic and are influenced by a variety of oceanographic and atmospheric factors including the Fraser River freshwater and sediment plume discharge diurnal tidal currents and prevailing and storm-generated wind and wave activity In addition the intercauseway region provides significant drainage from marsh and agricultural areas which have different characteristics from marine waters and which run along the ferry causeway
To provide the required science advice this Science Response focusses on Section 10 ldquoBiophysical Settingrdquo of the Environmental Impact Statement (EIS) (Port Metro Vancouver 2015a) specifically Section 103 ldquoOverview of Assessing Ecosystem Productivityrdquo (Port Metro Vancouver 2015b) and its related Appendices 10-B ldquoRoberts Bank Ecopath with Ecosim and Ecospace model parameter estimatesrdquo (Hemmera 2014) Appendix 10-C ldquoRoberts Bank Ecosystem model development and key runsrdquo(ESSA Technologies 2014a) and Appendix 10-D ldquoRoberts Bank Ecosystem model sensitivity analysesrdquo (ESSA Technologies 2014b) Additional important information was obtained from the Response to Information Request 6 (IR-73115-06 Canadian Environmental Assessment Agency Reference Number 80054 dated 26 October 2015) (Port Metro Vancouver 2015c) and the Written Responses to Coastal Geomorphology and Ecosystem Modelling Questions provided by the Proponent to DFO ECCC and NRCan on 2 March 2016 (Port Metro Vancouver (PMV) Transmittal TRE-01-RBT2-0004A subsequently referred in this Science Response as ldquoPMV Response 2016-03-02rdquo) (Vancouver Fraser Port Authority 2016)
The process followed in preparing this Science Response involved an initial review of the submitted EIS followed by an in-person meeting of the Proponent its contractors and representatives of DFO ECCC and NRCan to discuss and clarify questions arising from the initial review (Vancouver 23 November 2015) DFO and NRCan provided written questions to the Proponent based on preliminary review of the EIS on November 19 2015 ECCC also provided written questions based on its preliminary review of the EIS to the Proponent on December 1 2015 and January 20 2016 This large initial meeting was followed by smaller focussed meetings between the Proponent its contractors and DFO and NRCan on 11 December 2015 to clarify hydrology and sediment modelling questions with DFO on 8 January 2016 to clarify ecosystem modelling questions and with ECCC on 18 February 2016 to clarify questions relating to birds Written responses to all of these meetings and questions were provided by the Proponent to DFO ECCC and NRCan as the ldquoPMV Response 2016-03-02rdquo and ldquoPMV Response 2016-05-30rdquo (Vancouver Fraser Port Authority 2016) VFPArsquos answers to questions posed by DFO and NRCan regarding coastal geomorphology modelling have been posted to the Canadian Environmental Assessment Registry (CEAR)
22 Approach to assessing ecosystem productivity The Proponent adopted an ecosystem approach to evaluate the direct and indirect effects of the Project on the productivity of the Roberts Bank ecosystem A weight of evidence approach was used to assess the potential effects of the project on the productivity of the ecosystem and selected key components in the study area this approach included a spatial ecosystem simulation model (which included a habitat capacity model) a shorebird opportunity model and empirical data An important point is that any effects on the system during the construction phase or from expansion of the tug basin were excluded from this modelling process the focus instead being a comparison of modelled system productivity before and after the proposed terminal and expanded causeway is in place The chosen ecosystem simulation model was
Pacific Region Science Response Technical Review Assessing
Ecosystem Productivity Model of Roberts Bank
4
Ecopath with Ecosim and its spatial version Ecospace (collectively referred to here as the EwE framework or EwE model) This modelling approach was recommended by a prior Productive Capacity Technical Advisory Group comprised of representatives of technical experts from government agencies academia non-governmental organizations Vancouver Fraser Port Authority and its consultants (Compass 2013) convened by the Proponent and which also recommended a selection of focal species for the model The final selection of functional groups and the resulting food web that form the core of this ecosystem model are shown in Figure 1
Pacific Region Science Response Technical Review Assessing
Ecosystem Productivity Model of Roberts Bank
5
Figure 1 Ecopath with Ecosim model food web for Roberts Bank (Adapted from EIS Volume 3 Section 10 Fig 1033 on page 10-16) The groups coloured in orange represent focal groups size of symbols represents relative annual amount of biomass in the Roberts Bank study area
Pacific Region Science Response Technical Review Assessing
Ecosystem Productivity Model of Roberts Bank
6
The EwE framework is a common approach to ecosystem modelling which has been developed and expanded over the past two to three decades It currently has three main components
1 Ecopath ndash the core model which provides a mass-balance snapshot of the system
2 Ecosim ndash a module that enables simulation modelling over time
3 Ecospace ndash a module that enables simulation modelling over space
In order to make an EwE model tractable species are aggregated into functional groups based on their similar ecological characteristics (habitat and prey preferences etc) the Roberts Bank models had 58 functional groups The first step (Ecopath) was to obtain input parameters representing biomass production consumption emigration and diet for each functional group These parameters were then tuned in an iterative process until the overall production and consumption was balanced (a mass-balance approach) resulting in a model food web with estimates of energy flow between functional groups (Fig 1)
In the second step Ecosim was combined with the spatial model Ecospace The abiotic variables selected in this EIS (depth salinity bottom current wave height sediment type) were used as external forcings to the Ecospace module These abiotic variables provided the physical forcings for the simulations without and with the Project Since time series data on the functional groups of the model were not available Ecospace was run until the model reached equilibrium using various assumptions of the value of the vulnerability parameter (see Section 352) In this EIS the selected time step was annual with all variables abiotic and biotic expressed as yearly averages As used in this EIS the Ecospace module included a habitat capacity model which estimated the distribution of functional groups based on their environmental preferences for each abiotic variable (depth salinity bottom current wave height) and for substrate type (sand mud etc) The model thus allocated the spatial distribution of functional groups over the model domain based on their environmental preferences and the distributions of these abiotic variables with and without the Project The selected spatial unit size (ldquopixelrdquo) for the Ecospace model was 100 m2 In essence an Ecopath model was constructed for each pixel with particular rules governing how the functional groups interacted and moved among these spatial units The Ecospace module was run until it approached equilibrium (20 model years) to establish the spatial patterns without the Project For the lsquowith the Projectrsquo simulations the model was run for an initial 10 years and then the spatial patterns of the abiotic variables with the project were added and the model run for an additional 10 years1 The model outputs predicted changes in the productive potential of the Roberts Bank ecosystem as a comparison (ratio) with and without the Project rather than an absolute biomass that would be lost or gained as a result of the Project
1 EIS Appendix 10-C p 26
Pacific Region Science Response Technical Review Assessing
Ecosystem Productivity Model of Roberts Bank
7
30 Analysis and Response To prepare this response the following sections of the EIS additional documents were reviewed
DocumentSection Title
EIS Section 10
Including appendices 10B 10C and 10D
(Port Metro Vancouver 2015a Hemmera 2014 ESSA Technologies 2014a ESSA Technologies 2014b)
Biophysical Setting
Appendix 10-B Roberts Bank Ecosystem Model Parameter Estimates Port Metro Vancouver File 302-03503
Appendix 10-C Roberts Bank Ecosystem Model Development and Key Run Port Metro Vancouver
Appendix 10-D Roberts Bank Ecosystem Model Sensitivity Analyses Port Metro Vancouver
CEAR document 547 (Including Appendices) ldquoPMV Response 2016-03-02rdquo and ldquoPMV Response 2016-05-30rdquo
(Vancouver Fraser Port Authority 2016)
Vancouver Fraser Port Authority to the Review Panel re Answers to preliminary technical questions submitted during the completeness phase from Fisheries and Oceans Canada Natural Resources Canada and Environment and Climate Change Canada concerning the ecosystem modelling to support the Roberts Bank Terminal 2 Project environmental review
31 The EwE Team Building this ecosystem model was a complex undertaking which required knowledge of the ecosystem to be modelled how to set initial parameter values determination of reasonable ranges of these parameters how to balance the model and how to recognize when the model outputs were unrealistic These tasks became even more complex when spatial model dynamics were involved such as with Ecospace The team engaged by the Proponent to conduct this ecosystem modelling for the Roberts Bank Terminal 2 (RBT2) EIS was led by scientists at the Institute for Oceans and Fisheries located at the University of British Columbia in Vancouver These scientists are global leaders of the EwE model framework having developed much of its current implementation and who continue to lead its elaborations and extensions Construction and running of the model for this specific ecosystem was done in collaboration with ESSA Technologies of Vancouver Parameter values for the ecosystem model were obtained in part from observational studies conducted in the area by Hemmera of Burnaby BC
32 Overview of assessment results of hydrological and sediment modelling Implementation of the ldquowith the Projectrdquo simulations of the ecosystem model was done by driving the model with the abiotic variables as they were projected to be distributed with the Project footprint In the context of this EIS specifying depth salinity bottom currents wave height and sediment type conditions without the Project and changes with the Project were achieved by construction of hydrodynamical and sediment transport models The outputs from these models in combination with the identified environment preferences for the various biological groups were then used as inputs to the Ecospace model to define the spatial
Pacific Region Science Response Technical Review Assessing
Ecosystem Productivity Model of Roberts Bank
8
distributions of these functional groups The implementation of these hydrological and sediment transport models in this EIS was reviewed by DFO and NRCan (DFO 2016) This review concluded that the implementation of these models for this EIS was adequate for average winter conditions but lacking in validation for summer conditions in particular with strong freshwater flows from the Fraser River Simulations of strong storm events and their impacts on wave conditions and sediment transport were also lacking The effect of wave action and current speeds on sediment transport is non-linear such that increasing winds over short periods of time can impact sediment transport processes bottom topography and water depths beyond that determined under average model conditions Overall the review concluded that a greater range of sensitivity analyses is required to have confidence in the model outputs under lsquonon-averagersquo conditions The implication of this conclusion for the present review of the EwE model is that the full range of variability of abiotic characteristics such as bottom topography bottom current and wave heights and how they may affect relevant functional groups in the model with the Project may not be adequately represented Sensitivity analyses were provided by varying the intensity of abiotic variables and by removing abiotic variables to assess their interactive effects In general the ecosystem model outputs were robust to these sensitivity analyses with most groups varying by less than 5 Larger changes however were observed for primary producer and bird groupings and for some fish groups when various abiotic variables were omitted2
33 Model implementation 331 The purpose of the EwE model
The EwE model was intended to provide one line of evidence to assess the potential impacts of the Project on the Roberts Bank ecosystem which would then be used with other lines of evidence to make the final assessment Specifically ldquohellip the objective of the RB [Roberts Bank] model was not to provide an assessment of Project impacts for each functional group at a fine temporal scale but to estimate changes in productive potential with and without the Project at the ecosystem levelrdquo3 In addition ldquohellipthe primary objective of the RB ecosystem model is to evaluate potential changes in productivity from such abiotic factors with and without the terminal and causewayrdquo4 Results are presented for the selected functional groups no results were presented on potential changes in ecosystem structure or function
332 Applicability of the EwE model framework to the Roberts Bank region EwE models work best when the exchanges within the system being modelled are greater than the exchanges between the modelled system and the lsquooutsidersquo world In practice this means that EwE models work best for larger systems with few external exchanges In a meta-analysis of 433 Ecopath models Colleacuteter et al (2015) concluded that ldquohellipin the last two decades the range of the models area has expanded toward very large areas and the median has shifted accordingly from about 1000 km2 in 1984ndash1993 to about 100000 km2 in 1994ndash2014rdquo The section of the Roberts Bank ecosystem that is included in the EwE model was comparatively small (5468 km2) and complex It is an intertidally-dominated environment that is subject to strong seasonal influences of both freshwater and marine exchanges across relatively large seaward and shoreward boundaries
2 EIS Appendix 10-D p ii - iii 3 PMV Response 2016-03-02 p 99 lines 1914-1917 4 PMV Response 2016-03-02 p 38 lines 689-691
Pacific Region Science Response Technical Review Assessing
Ecosystem Productivity Model of Roberts Bank
9
Processes taking place outside the modelled ecosystem will contribute to dynamics within the modelled ecosystem (eg lsquooutsidersquo food supporting predators which occur in the Roberts Bank ecosystem for only part of the year predators which may feed in the Roberts Bank ecosystem but export this energy when they migrate out of the region) but which may not be well-resolved by the EwE model The Proponent justifies the spatial scale because it was specifically chosen for the questions being asked in regard to assessing productivity changes and because the relative influences of external exchanges are assumed to be identical with and without the project In addition highly mobile species with broad prey bases were assumed in the model to be partially sustained by external energy from outside the model system5 The distributions of organisms may differ however with and without the project which may affect their interactions with areas outside of the modelled system and the use of diets from outside the modelled system may not reflect the impacts of the project Further clarification of how the EwE model captures the exchanges and interactions with adjacent ecosystems are needed For example it could be argued that an ecosystem which is open to frequent exchanges of water and organic matter from beyond its boundaries might be more robust to local disturbances such as the Project
There are some inconsistencies in the information and assumptions used for some of the taxa in this ecosystem model For Dungeness Crab the justification for estimating total adult biomass (including females) from the biomass of fished males is unclear In addition it is unclear if the slower growth of female crabs once they have reached sexual maturity in comparison with male crabs has been considered The diet matrix for spiny dogfish does not represent the actual diet well in particular of euphausiids herring and shrimp and there are more recent references for biomass estimates of spiny dogfish in the study area than what was used in the EIS
Fishing mortality was not included in the model under the assumption that this would not change with or without the project While this assumption may be true the model has been parameterized by ignoring a source of mortality that will influence total production In essence fishing removes biomass from the ecosystem with the result that less biomass will be available for higher trophic levels How this may impact the ecosystem with and without the Project is unclear but it could make noticeable differences if for example there were thresholds in the feeding responses by these higher trophic level species The Ecopath model that was used is relatively unconstrained since many ecological efficiencies are low even for forage species which would be expected to be higher It is not clear how many species are exploited or the levels of exploitation but even if this does not change with the Project these mortality rates should be included in the model in order to add realistic constraints to the exploited functional groups
333 Model documentation Based on questions from DFO ECCC and NRCan following their initial review of the EIS the Proponent provided written responses dated 2 March 2016 to clarify several of the steps in the model development and implementation However several questions remain including questions about the Ecospace module Ecospace has undergone several recent developments such as the inclusion of the spatial-temporal data layer framework (Steenbeek et al 2013) the habitat capacity model (Christensen et al 2014) and the Monte Carlo analysis including the diet matrix As yet there are few published studies using these latest Ecospace developments and their documentation and justification need to be improved in the EIS
5 PMV Response 2016-03-02 p 29 lines 446 - 464
Pacific Region Science Response Technical Review Assessing
Ecosystem Productivity Model of Roberts Bank
10
Questions also remain regarding how the Monte Carlo randomization routine treated diet data The report indicates that the Monte Carlo routine randomly selected input parameters from the input ranges and that only models that were balanced were used This suggests that a high proportion of models were not balanced and therefore were not used (for example the EIS indicates that about one out of 1000 sampled input parameters was balanced6) A table showing the minimum maximum mode average and median values from the Monte Carlo runs for all the parameters would enable an evaluation of how much variation was actually sampled by the balanced model runs This is recommended in the EwE user information ie ldquoUsers should check the range of the input parameters that were actually used in the trials in the output csv file (see below)rdquo7
In addition there are several issues with the documentation of the derivation of the parameters for the functional groups Such documentation should clearly outline how the input parameter was estimated and the range of uncertainty for that parameter For example the input biomass of pinnipeds was defined as 04 t km 2 derived from estimates of 034 for Harbour seals and two estimates for Steller sea lions (012 and 014 t km 2) No explanation was provided for how the overall estimated pinniped biomass of 04 t km 2 was determined The diet of Sand Lance was described in the EIS as consisting mostly of zooplankton8 whereas the diet table for the model runs9 included 20 macrofauna 10 green algae and 10 detritus It is unclear why these additional prey were included in the diet used for the model runs
334 Highly mobile functional groups This implementation of the EwE framework included transient and migratory functional groups This is entirely appropriate and these groups cannot be excluded The approach taken in the Ecospace module was to impose a low (and conservative) dispersal rate among model spatial units (lsquopixelsrsquo) of 1 km yr-1 This may be appropriate for low mobility benthic organisms but it likely underestimates the movements of many other functional groups The effects of using higher and perhaps functional-group-specific dispersal rates was not considered The Proponents argued that higher dispersal rates would reduce impacts since species can move away from less desirable areas more quickly for completeness these runs should be done and evaluated Mobile species will also bring energy (food) captured outside the system into the modelled ecosystem This process was included in the model with the use of a diet import factor reflecting the consumption of prey outside the modelled region with the assumption that groups with high import rates were unlikely to respond to local changes on Roberts Bank10 This assumption needs justification perhaps at the functional group level for example many species of highly migratory birds and Pacific salmon use the Roberts Bank ecosystem to obtain food to continue their migrations Although this food does not compose a large fraction of their annual consumption it can be critical to enable them to continue their migrations
The EwE model is not designed to capture differences in prey quality ie differences in essential fatty acid or nutrient ratios The same species of prey may have greater or lesser nutritional value to predators depending on the conditions under which they are growing and their seasonal variations This is a particular concern with the nutritional quality of the diatom-dominated biofilm Diatomaceous biofilm is important to the highly migratory Western Sandpiper (Calidris mauri) Despite its predictive merits in relation to other ecosystem
6 EIS Appendix 10D Section 24 p5 7 EwE Help file p 151 8 EIS Appendix 10B Section 4133 p 76 9 EIS Appendix A of Appendix 10B 10 PMV Response 2016-03-02 p 28 lines 429 - 436
Pacific Region Science Response Technical Review Assessing
Ecosystem Productivity Model of Roberts Bank
11
components the EwE model is not informative with respect to understanding the potential impacts of the Project on biofilm and the Western Sandpiper While this example is specific to seabirds the potential exists for differences in the quality of biofilm to also be an issue for copepods which feed on biofilm and consequently to juvenile salmon which feed on these copepods (eg Sutherland et al 2013)
The EwE model is also not designed to predict effects of the Project on water quality although the Proponent noted that ldquoOther abiotic factors not included were deemed to be representative of variables that were already included in the modelhelliprdquo11 The Project may cause changes in physical and water quality conditions whether in isolation or in combination which may impact the productivity or nutritional quality of key prey organisms for local and migratory species which will not be captured by the model The EwE model does not assess the production of key nutrients or the implications of changes in important physical and water quality parameters to biofilm community structure and hence to important migratory birds
The model does not include biotic factors for both pelagic and benthic environments to assess the potential development of eutrophication and benthic organic enrichment events respectively Organic and redox indicators traditional measures of environmental assessments that are used to determine changes in functional group responses were included in the recent Deltaport Third environmental assessment (ie Pelagic chlorophyll dissolved nutrients Benthic sediment carbonnitrogen content redox state [sulfide concentration]) Benthic anoxic events based on organic enrichment are known to be strong drivers of community composition and exclusion regardless of substrate type In the absence of biotic factors (eg organic particulates) the model has not considered the potential for benthic organic enrichment which coincides with siltation processes within the upper tidal flats The tidal flat corner bordered by the Delta-dyke and Deltaport causeway has served as a catchment area for Fraser River silt since the development of the original Deltaport causeway (Sutherland et al 2013) The proposed position of the new terminal placed at the seaward termination of the Deltaport causeway may produce a crescent-shaped feature in the wake of the Fraser River Plume This feature may provide a more efficient silt trap that will promote benthic organic enrichment This piece of the environmental assessment seems to be missing and is important for assessing fish habitat in this area
335 Seasonality (model time step) Input data to parameterize the model were available on a range of time scales from hourly (eg physical data on salinity and water flow) to annual (eg species biomass) The Proponents indicated12 that this is a strength of the EwE model although ultimately the model was run with an annual time step with all sub-annual values being averaged to annual values This method therefore did not incorporate important seasonal processes such as winter-summer differences in salinity and storm properties and the seasonal appearances of abundances of predators and prey such as migratory salmon and birds that are much larger than the annual average For example juvenile salmon migrate from the Fraser River and onto Roberts Bank in the spring before moving into deeper waters If these spring abundances are averaged over the entire year these average abundances would be 5-10 times lower than the actual abundances during the spring (ie averaging the biomass that occurs in two months over a 12 month period) Additionally this method did not capture the intensity of processes such as growth and predation which can be focused over periods of a few weeks to a few months There may be important threshold effects at particular times and places which may be missed when using an 11 EIS Section 10 p 10-11 12 PMV Response 2016-03-02 p 86 line 1655
Pacific Region Science Response Technical Review Assessing
Ecosystem Productivity Model of Roberts Bank
12
annual time step for the model The Ecospace module has a monthly time step13 and therefore it is feasible to run this module with a sub-annual time step For example the Proponents submit14 that there are inadequate data to model the potential effects of the Project on the timing of biofilm production which could have implications for the migratory dunlin and Western Sandpiper However this could be modelled in an exploratory way to determine hypotheses about which factors could affect the timing of production of biofilm and the potential impacts on these birds These issues are of major concern to ECCC
336 Life history structure The EwE model did not separate functional groups into life history stages (stanzas) yet for many functional groups the juvenile stages can have very different life history characteristics and habitats than the adults It is unclear in the description of the model how different life history structures were considered and whether for example there were enough juveniles to produce the adults The implications of not including early life stages should be explored at least qualitatively to identify which species might have life stages that may be more vulnerable to project effects
337 Model balancing Balancing an EwE model is the process by which parameters are adjusted so that there is sufficient production for consumption requirements ie there are sufficient prey for all predators Expert opinion was used to examine parameter values and to adjust for errors or inconsistencies in logic ldquoPMV is confident that since the approach taken to balance the model was based on best practices the steps are appropriaterdquo15 Adjustments to initial parameters to ensure an ecologically-feasible model are necessary and to be expected For a few functional groups however very large changes to initial parameter estimates (which were often not based on Roberts Bank specific data) were necessary for example to transient killer whales When such initial parameters were adjusted (often by substantial amounts) by expert opinion to balance the model the confidence intervals around these adjusted parameter values were not increased to reflect this added uncertainty (see for example PMV Response 2016-03-02 p 51 lines 955-956) When expert opinion was used to make very large changes to initial parameter values broader confidence intervals about these parameters should have been applied This does not appear to have been the case and as a consequence may cause the actual uncertainty of the model outputs to be underestimated
Another example is for the pinniped group in which 50 of the diet was assumed to come from outside the model area in order to balance the model The rationale provided was ldquoThe pinnipeds caused excessive predation mortalities on numerous fish functional groups The biomass of pinnipeds was an average for the Strait of Georgia which was likely too high for Roberts Bank Therefore it was assumed that pinnipeds extracted only half of their diet from the study areardquo16 It is unclear whether the sensitivity of the model to different percentages of diet allocation was explored
As noted above (332) the Ecopath model was relatively unconstrained and few adjustments to input parameters were required to balance the model This is unusual and the low ecotrophic efficiencies of several functional groups suggest that full accounting of energy flows may not have been achieved (an ecotrophic efficiency of 1 indicates that 100 of the production of that
13 EIS Appendix 10C Section 29 p24 14 EIS Appendix 10D Appendix C p72 15 PMV Response 2016-03-02 p 49 lines 910-912 16 EIS Appendix 10C Section 261 p 20
Pacific Region Science Response Technical Review Assessing
Ecosystem Productivity Model of Roberts Bank
13
particular group is being preyed upon or removed by fishing leaving no individuals to die of old age17) An ldquoexcessrdquo of individuals dying of old age ie ecotrophic efficiencies much less than 1 suggests a potentially large biomass that is not used by the ecosystem and instead is converted to detritus
34 Model validation Model validation is the process by which the model parameters variables and outputs are compared with those from the real ecosystem to ascertain how well the model represents the ecosystem It is an essential step in providing confidence that the projections from the model in this case with and without the Project have relevance to how the real ecosystem may be expected to function with and without the Project In practice validating complex ecosystem models is difficult considering the range of assumptions that must be made when building the model the limited available data and natural variability of the ecosystem at a variety of time and space scales
Many of the standard diagnostics for the Ecopath model have not been evaluated in the EIS The Proponent appears to have assumed that once the Ecopath model was balanced then it was valid and fit for purpose The Proponent should provide all the Ecopath estimates of vital rates including mortality rates As presented questions remain For example many Ecotrophic Efficiencies (which control the transfer of biomass from prey to predators) are less than 1 even for taxa which would be expected to be close to 1 such as carnivorous zooplankton The reason for Ecotrophic Efficiencies less than 1 were not discussed or explained in the EIS
Detailed diagnostics for the Ecospace model should also be presented in order to evaluate model performance In response to criticisms by DFO ECCC and NRCan in discussions with the Proponent the latter provided the biomass of the functional groups from the Ecopath model (before Ecospace) and the Ecospace model after the spin-up period (which involved adjusting the parameters from the Ecopath model to balance the 5468 separate cells of the Ecospace model)18 The Proponents argue that ldquoIt is important to note that changes in biomass values generated during the spin-up period are identical for both with and without Project scenarios and thus do not provide information on the potential Project-related effects on productivity19 However several changes to biomass result from the Ecospace balancing process (spin-up period) This is only given brief attention by the Proponent in its response to the DFO ECCC and NRCan questions An analysis of Table 620 revealed that the biomass of 9 functional groups was larger or smaller than the widest confidence limits allowed for each group21 This requires further discussion and justification
The Proponent used a goodness of fit measure to compare spatial distributions of model outputs with field observations They indicated that ldquono other EwE models were identified which use a goodness-of-fit measure Hence the RB model is potentially the first such EwE model where a goodness of fit measure has been appliedrdquo22 The chosen goodness of fit measure is the percent correct classification (PCC) method23 This method derives a test statistic based on the proportion of locations at which predicted occurrences from the model match observed
17 EIS Appendix 10-B p 11 18 PMV Response 2016-03-02 p 65-66 Table 6 19 PMV Response 2016-03-02 p 64 lines 1205-1207 20 PMV Response 2016-03-02 p 65-66 Table 6 21 PMV Response 2016-03-02 p 45 Table 3 22 PMV Response 2016-03-02 p 78 lines 1481-1483 23 PMV Response 2016-03-02 p 78 lines 1483-1484
Pacific Region Science Response Technical Review Assessing
Ecosystem Productivity Model of Roberts Bank
14
occurrences from data and similarly with predicted and observed absences The Proponent then calculated two additional accuracy of fit measures sensitivity (the model predicts a species to occur in an area where it is known to occur in reality) and specificity (the model predicts a species does not occur in an area it is known not to occur in reality)24 This analysis concluded that the model has high predictability for functional groups such as eelgrass and sea pens with relatively static distributions but lower predictability for functional groups which are more temporally and spatially dynamic such as biofilm and green algae25
There are two problems with this approach The first is that this goodness of fit comparison was done only for habitat-forming functional groups no discussion of how well this analysis applies to mobile functional groups was provided The second problem is that this method does not take into account situations (such as occurs in this study with several groups) in which species occur at only a few locations For example ldquohellipif the test data consist of 95 absences and 5 presences and this reflects the true prevalence of the species on the landscape (a realistic scenario for a rare species) a lsquonullrsquo model that predicted absence in all cases (eg no model at all) would be correct 95 of the timehellipldquo (Franklin 2009 p 151) This latter point is important here as these habitat functional groups (biofilm brown algae native eelgrass green algae Japanese eelgrass tidal marsh biomat and orange sea pens26) appear not to occur over most of the Project area (as portrayed by the model outputs presented in the distribution figures of PMV Response 2016-03-02 Appendix 218) It is therefore important that a robust evaluation of the performance of the Ecospace module is used with preferably more than one measure
In summary the starting point for this modelling analysis matters It is not just about a comparison between results with and without the Project The model has to be considered a sufficient representation of the ecosystem The Proponent has not yet sufficiently validated the model
35 Model results 351 Presentation of model results
As noted above (Section 331) the stated objective of the Roberts Bank ecosystem model was not to provide an assessment of Project impacts for each functional group at a fine temporal scale but to estimate changes in productive potential with and without the Project at the ecosystem level27 However results were presented as comparisons by speciesfunctional group with and without the Project and not as potential changes in total ecosystem productivity The revised figures for each functional group showing distributions without the Project with the Project and their difference indicated impacts were likely to be localized with overall impacts relatively small The range of biomass ratios with and without the Project was 045 ndash 189 with most values slightly less than 1 This is interpreted as indicating slight decreases in the capacity of the study area to support biomass and production with the Project for many functional groups28 (Figure 2)
24 PMV Response 2016-03-02 p 80 lines 1524-1527 25 PMV Response 2016-03-02 p 81 lines 1551-1559 26 PMV Response 2016-03-02 p 82 Table 8 27 PMV Response 2016-03-02 p 99 lines 1914-1917 28 PMV Response 2016-03-02 Appendix 218
Pacific Region Science Response Technical Review Assessing
Ecosystem Productivity Model of Roberts Bank
15
Biomass Ratio
Freq
uenc
y
04 07 10 13 16 19
05
1015
2025
30
Figure 2 Histogram of biomass ratios obtained by comparisons of model runs with and without the project (ie With Without) Values less than 1 indicate reductions in biomass with the Project compared against without the Project) Data from Appendix 218 of PMV Response 2016-03-02
352 Sensitivity and vulnerability analyses Every ecosystem model is only one possible representation of the true ecosystem defined by the modelrsquos structure and the values chosen for its many parameters The key point is how well the model represents the real system how that fit can be measured and the sensitivity of model outputs to variability in the selected parameter values The ideal model should be robust to a wide range of uncertainties in the input data and parameters This robustness is determined by performing sensitivity analyses on the model to see how it responds to variations in the input parameters and determining to which input parameters the model is most sensitive
The vulnerability parameters determine the strength of the feeding interactions between functional groups They set the level of density dependence of each functional group Higher vulnerability settings provide greater top-down (predator) control whereas lower settings provide greater bottom-up (environmental) control29 Several publications have shown that EwE models are very sensitive to the vulnerability parameters and Christensen and Walters (2000) point out that a main pitfall of EwE is that ldquopredation vulnerabilities are often underestimated lessening the modelled impacts of predationrdquo It is usual practice to tune Ecopath models including the vulnerability parameters to time series data such as biomass using the temporal simulation model Ecosim However these data were not available for the RBT2 area so this robust method of fitting the model and estimating vulnerability parameters was not possible Instead a vulnerability setting of 2 was used as the default value for the key model runs which is ldquocommon practice when time series data are not available and estimates of vulnerability in the
29 PMV Response 2016-03-02 p 70 lines 1318-1323
Pacific Region Science Response Technical Review Assessing
Ecosystem Productivity Model of Roberts Bank
16
model cannot be maderdquo30 with sensitivity analyses run for a range of 15 to 3 This narrow range was criticized by DFOECCC in initial discussions about the model with the Proponent The Proponent subsequently reran the model with a larger range of vulnerabilities31 (11 to 10) and concluded this broader vulnerability range produced similar results for the productivity ratio with and without the Project to those in the original EIS and that the EIS was more likely to overestimate than underestimate potential project effects32 The data in Table 7 of the PMV Response33 did indicate changes in productivity ratios ranging from 0 to 50 of the defined key run (which used a vulnerability setting of 2) However the Proponent changed all vulnerability settings to the same value ie all were 2 or all were 10 etc In reality the vulnerability parameters resulting from Ecosim models that are fitted to data as described above vary by functional group which was not explored here Therefore although the results suggest that the original choice of 2 for the default key run seemed reasonable the potential effects of variability in vulnerability settings was not fully explored
Sensitivity analyses are usually based on the range of uncertainty estimated for input data and parameters often called the confidence limits around the model parameters The EwE framework integrates many different data sources and parameters including values from the literature It can therefore be difficult to identify ldquoreasonablerdquo confidence limits when derived from such diverse data sources Standard practice in Ecopath models has been to develop a pedigree for each parameter with default values for uncertainty based on the nature of the source data For example parameter values based on high precision field observations of biomass within the model domain receive default confidence intervals of 10 whereas parameter values based on models developed for elsewhere or professional judgment receive confidence intervals of 8034 Sensitivity analyses are then run using parameter values selected from within these confidence intervals However if these default confidence intervals do not capture the full range of variability then the outputs are not informative of the variability in the lsquorealrsquo ecosystem Field observations were collected for many functional groups within the model domain in 2012 and 2013 as part of studies to support the RBT2 EIS Apparently the purpose of these observations was to document spatial variability (in part for the Ecospace model) and temporal variability (measurements at one location over time) and not to derive confidence intervals around the observations35
The reliance on the pedigree approach to derive confidence intervals for this Roberts Bank model was criticized by DFO ECCC and NRCan in discussions with the Proponent As a result the Proponent reran the model with much larger confidence intervals ranging from 30 to 100 depending on the input parameter and functional group36 The results from this new analysis using the broader confidence intervals were similar to those using the original pedigree approach The Proponent noted that ldquoWhile the production within each helliprun was very different there was little difference in the biomass ratio [with and without the Project] These results further demonstrate that even with a greater range in input values the influence of the Project on the Roberts Bank ecosystem is consistent among allhellipmodel runsrdquo37 This provides confidence that the model may be robust to uncertainty in its input parameters Two concerns
30 PMV Response 2016-03-02 p 70 lines 1321-1322 31 PMV Response 2016-03-02 p 71-74 32 PMV Response 2016-03-02 p 71 lines 1339-1341 33 PMV Response 2016-03-02 p 73 34 EIS Appendix 10-C Section 251 page 18 35 PMV Response 2016-03-02 p 42 lines 772-777 36 PMV Response 2016-03-02 p 44-47 37 PMV Response 2016-03-02 p 47 lines 855-858 and see also PMV Response 2016-03-02 Appendix 27-B
Pacific Region Science Response Technical Review Assessing
Ecosystem Productivity Model of Roberts Bank
17
remain however The quote above indicates that the production among the different model runs was very different although with little difference in the biomass ratios with and without the Project Since biomass is not the same as production it would be informative for understanding model performance and potential impacts to show these production differences This also relates to the point made in Section 34 regarding how well the model represents the real ecosystem and not just within-model comparisons with and without the Project The second question is more technical and relates to how the randomization (Monte Carlo or MC) routine that was used to create multiple model runs used the uncertainty about the diet data Diets are not currently included in the MC routine available to regular users of the Ecosim model how they were handled in this RBT2 model appears not to be explained
Finally the sensitivity analyses indicate that the uncertainty in the input parameters does not lead to much difference between model parameters with or without the project However this conclusion does not describe how the uncertainty in the input parameters affects understanding of the ecosystem
40 Conclusions Overall the main conclusion of the Environmental Impact Statement from the Proponent is stated as ldquohellipafter the implementation of mitigation hellipthe Project is not expected to result in any significant adverse effects on any of the 16 valued componentsrdquo38 In addition ldquohellipapproximately 40 of the functional groups are forecast to change no more than 5 which hellip is judged to be within the uncertainty of the model runsrdquo39 although larger changes were forecast for orange sea pens freshwater biofilm green algae and raptors The conclusions from the modelling studies are that ldquohellipthe proposed project will have an impact on the study area that the effect varies between species and that the findings are robust to parameter uncertaintyrdquo40 Specific outcomes by valued component as derived from the EwE model are presented by functional groups in Table 1
38 PMV March 2015 Roberts Bank Environmental Impact Statement Executive Summary ndash Part 1 page 37 39 EIS Appendix 10-C p ii 40 EIS Appendix 10-D p iv
Pacific Region Science Response Technical Review Assessing
Ecosystem Productivity Model of Roberts Bank
18
Table 1 Changes in productive potential with the Project as derived from the EwE model
Changes in productive potential
Ecosystem category
Number of valued
components
Number with potential
biomass loss
Moderate decrease (31-60 decline)
Minor decrease (6-30 decline)
Negligible (0-5
change)
Minor increase (6-
30 increase)
Moderate increase (31-60 increase)
Source
Marine vegetation
7 7 - 3 2 2 - EIS Vol 3 Section 11 Table 11-17 page 11-65
Marine invertebrates
4 3 1 1 1 1 - EIS Vol 3 Section 12 Table 12-8 page 12-52
Marine fish 13 13 - 2 6 5 - EIS Vol 3 Section 13 Table 13-10 page 13-95
Coastal birds
11 8 - 3 4 3 1 EIS Vol 3 Section 15 Table 15-10 page 15-67
Pacific Region Science Response Technical Review Assessing
Ecosystem Productivity Model of Roberts Bank
19
Most functional groups showed some potential biomass loss with the Project with biomass loss defined as any model run with negative outcomes (ie in which biomass with the project was less than biomass without the Project) The summary of changes in productivity potential are mixed with most (33 out of 35) valued components showing minor decreases to minor increases (defined as 6 to 30 changes in productive potential with the Project compared to without the Project)
The main conclusions of this review in regards to the Terms of Reference are
1 Do the functional groups and abiotic variables used in the model adequately represent the ecosystem at Roberts Bank
o The 58 functional groups and abiotic variables used in the model adequately represent the main components of the Roberts Bank ecosystem however for longer lived species the life stages of the species are not well represented and some of the impacts of the Project may be expected to affect specific life stages
o The abiotic variables adequately represent the physical drivers of this ecosystem on an annual time scale However annual values for these abiotic variables may not adequately capture important sub-annual events such as storms (DFO 2016) the timing of arrival and departure of highly migratory species and whether there may be important sub-annual thresholds or mismatches in timing as a result of the Project
o Biotic factors (eg nutrients) which are particularly important for biofilm and other lower trophic level taxa are not included in this model The model is therefore unable to assess the potential development of eutrophication and benthic organic enrichment events which may affect fish habitats in the study area
2 Are the parameter estimates used by the model valid and defensible for this system
o In general parameter estimates appear to be adequate for this system Field studies were done in two years to provide data in particular on distributions of selected functional groups for the Ecospace module Note the distribution studies focussed on taxa which were relatively immobile and therefore lsquofixedrsquo in space
o the selection of some model parameters would benefit from further explanation for example the choice of fixed diet matrices versus dynamic matrices which can vary with changes in abundances or predators and prey
o the selection of some model parameters would benefit from further explanation for example the link between the diets described in the text of Appendix 10B and the quantities presented in Appendix A of Appendix 10B It is understood that proportions were derived using the ldquofixed selectivityrdquo principle but in order to be fully transparent the derivation of each diet should be provided in an appendix
o discussion and explanation is needed of why ecotrophic efficiencies differ from expected values (eg the ecotrophic efficiency for Pacific herring is listed as 038) and
o the abiotic factor lsquosubstratersquo was limited to ldquohardrdquo or rdquosoftrdquo options which can be restrictive given that they serve as endpoints on a substrate composition continuum These limited options may not provide the sensitivity required to assess substrate preference nor the flexibility for taxa (eg motile organisms) that span hard mixed and soft substrate types In addition it is not clear if changes in the hardsoft categories were considered over time within identified depositional or erosional settings before and after construction
Pacific Region Science Response Technical Review Assessing
Ecosystem Productivity Model of Roberts Bank
20
3 Are the limitations and uncertainties of the model identified and appropriately considered when determining the modelrsquos representation of current and possible future conditions
o the EwE model was not designed to evaluate a range of future conditions It was designed to estimate changes in the productive potential at the ecosystem level with and without the Project Therefore the model was run without the Project and with the Project for a range of plausible abiotic conditions and the results were compared with respect to biomass and productivity by functional group
o the pedigree approach to assessing the uncertainties of model outcomes is unsatisfactory for the purpose here as it relates solely to a qualitative judgment of the value of data based on its source However when the model was rerun with much wider ranges of confidence intervals (uncertainties) the results in general (but not necessarily for each functional group) were similar to the results using the original pedigree approach This suggests that taken overall the model may be robust to wide ranges of uncertainty in these input variables and parameters
o there is inadequate validation of the model This is inadequate for three reasons
(i) the basic Ecopath model is not validated and the Ecospace balancing process (the spin-up period) resulted in some biomass estimates being increased or decreased beyond their confidence limits
(ii) the goodness of fit test used to evaluate how well the model predicted the spatial occurrence functional groups is not fit for purpose (Section 34) and
(iii) validation was provided for only a small number of functional groups (the habitat-forming functional groups) As a consequence the model is currently not validated
o Considering the proportion of open boundaries relative to closed boundaries in the model processes taking place outside the modelled ecosystem are likely to contribute to dynamics within the modelled ecosystem However these external processes may not be well-resolved by the EwE model as currently configured
4 Are the model results related to the potential effects of the Project on fish and fish habitat and migratory birds and their food resources valid and defensible
o this is a very complex ecosystem model constructed for a relatively small and open (in the sense of considerable exchange with adjacent non-modelled areas) system Many assumptions have been made based on poor or missing data Taking all these considerations into account the model does the best job possible of comparing the biomass and productivity of the Roberts Bank ecosystem with and without the Project
o the extent to which the model adequately represents the lsquorealrsquo ecosystem of Roberts Bank as opposed to comparisons of model results with and without the Project is unclear as a number of basic diagnostics are not presented (see point 3 above)
o the EwE model is not capable of and is not designed to represent nutritional and food quality variations in prey functional groups and how these may impact highly migratory predators such as birds with and without the Project
5 Is the EwE model framework a valid method to quantify large scale impacts to fish habitat fish productivity and migratory bird productivity
o the EwE model as implemented in this project and reviewed here is a useful first-order framework to organise information and derive initial estimates of how the system may respond to perturbations
Pacific Region Science Response Technical Review Assessing
Ecosystem Productivity Model of Roberts Bank
21
o the utility of a EWE model for impact purposes is highly dependent on the quality of input data
o each EwE model is highly dependent on local conditions Although appropriate as an overall methodology each application would need to be reviewed for how it may be applied to any new ecosystem and
o the EwE model would need to be substantially reformulated if it was to include considerations of changes in chemical composition or food quality of prey in particular for seasonal migratory species such as birds which may depend on very large biomasses of prey with specific chemical composition to fuel their migrations beyond the ecosystem model boundaries
Contributors Contributor Affiliation Ian Perry Author DFO Science Pacific Region Alida Bundy Author DFO Science Maritimes Region Terri Sutherland Author DFO Science Pacific Region Robert Elner Author ECCC Canadian Wildlife Service Andrew Robinson Author ECCC Canadian Wildlife Service Lesley MacDougall Editor DFO Science Pacific Region
Approved by Carmel Lowe
Regional Director Science Branch Pacific Region Fisheries and Oceans Canada
November 4 2016
Sources of Information Christensen V Coll M Steenbeek J Buszowski J Chagaris D walters CJ 2014
Representing variable habitat quality in a spatial food web model Ecosystems 17 1397-1412
Christensen V and Walters C 2000 Ecopath with Ecosim methods capabilities and limitations Ecological Modelling 172 109-139
Colleacuteter M Valls A Guitton J Gascuel D Pauly D and Christensen V 2015 Global overview of the applications of the Ecopath with Ecosim modeling approach using the EcoBase models repository Ecological Modelling 302 pp42-53
Compass Resource Management Ltd 2013 Roberts Bank Terminal 2 Technical Advisory Group (TAG) Process Report Productive Capacity ndash Final Report 119pp (Accessed November 1 2016)
DFO 2016 Technical Review of Roberts Bank Terminal 2 Environmental Assessment Section 95 ndash Coastal Geomorphology DFO Can Sci Advis Sec Sci Resp 2016045 (Accessed November 4 2016)
Pacific Region Science Response Technical Review Assessing
Ecosystem Productivity Model of Roberts Bank
22
ESSA Technologies 2014a Roberts Bank Terminal 2 Project Roberts Bank Delta BC Environmental Impact Statement Volume 3 Biophysical Effects Assessments Appendix 10-C Roberts Bank Ecosystem Model Development and Key Run Port Metro Vancouver (Accessed November 1 2016)
ESSA Technologies 2014b Roberts Bank Terminal 2 Project Roberts Bank Delta BC Environmental Impact Statement Volume 3 Biophysical Effects Assessments Appendix 10-D Roberts Bank Ecosystem Model Sensitivity Analyses Port Metro Vancouver (Accessed November 1 2016)
Franklin J 2009 Mapping Species Distributions Spatial Inference and Prediction Cambridge University Press Cambridge
Hemmera 2014 Roberts Bank Terminal 2 Project Roberts Bank Delta BC Environmental Impact Statement Volume 3 Biophysical Effects Assessments Appendix 10-B Roberts Bank Ecosystem Model Parameter Estimates Port Metro Vancouver File 302-03503 (Accessed November 1 2016)
Port Metro Vancouver 2015a Roberts Bank Terminal 2 Project Roberts Bank Delta BC Environmental Impact Statement Volume 3 Biophysical Effects Assessments Section 100 Biophysical Setting (Accessed November 1 2016)
Port Metro Vancouver 2015b Roberts Bank Terminal 2 Project Roberts Bank Delta BC Environmental Impact Statement Volume 3 Biophysical Effects Assessments Section 103 Overview of Assessing Ecosystem Productivity (Accessed November 1 2016)
Port Metro Vancouver 2015c Roberts Bank Terminal 2 Project Environmental Assessment Additional Information Requirements (July 31 2015) Responses Response to Information Request 6 IR-73115-06 Canadian Environmental Assessment Agency Reference Number 80054 dated 26 October 2015
Steenbeek J Coll M Gurney L Meacutelin F Hoepffner N Buszowski J and Christensen V 2013 Bridging the gap between ecosystem modeling tools and geographic information systems Driving a food web model with external spatialndashtemporal data Ecological Modelling 263 139ndash 151
Sutherland T Elner R and OrsquoNeill J 2013 Roberts Bank Ecological crucible of the Fraser River estuary Progress in Oceanography 115 171ndash180
Vancouver Fraser Port Authority 2016 From the Vancouver Fraser Port Authority to the Review Panel re Answers to preliminary technical questions submitted during the completeness phase from Fisheries and Oceans Canada Natural Resources Canada and Environment and Climate Change Canada concerning the ecosystem modelling to support the Roberts Bank Terminal 2 Project environmental review CEAR Document 547 (Accessed November 1 2016)
Pacific Region Science Response Technical Review Assessing
Ecosystem Productivity Model of Roberts Bank
23
This Report is Available from the Centre for Science Advice
Pacific Region Fisheries and Oceans Canada
3190 Hammond Bay Road Nanaimo BC V9T 6N7
Telephone (250) 756-7208 E-Mail csapdfo-mpogcca
Internet address wwwdfo-mpogccacsas-sccs
ISSN 1919-3769 copy Her Majesty the Queen in Right of Canada 2016
Correct Citation for this Publication
DFO 2016 Technical review of Roberts Bank Terminal 2 environmental assessment section 103 ndash assessing ecosystem productivity DFO Can Sci Advis Sec Sci Resp 2016050
Aussi disponible en franccedilais
MPO 2016 Examen technique de leacutevaluation environnementale du Terminal 2 agrave Roberts Bank section 103 ndash eacutevaluation de la productiviteacute de leacutecosystegraveme Secr can de consult sci du MPO Reacutep des Sci 2016050
- TECHNICAL REVIEW OF ROBERTS BANK TERMINAL 2 ENVIRONMENTAL ASSESSMENT SECTION 103 ndash ASSESSING ECOSYSTEM PRODUCTIVITY
-
- 10 Context
- 20 Background
-
- 21 Background and Terms of Reference
- 22 Approach to assessing ecosystem productivity
-
- 30 Analysis and Response
-
- 31 The EwE Team
- 32 Overview of assessment results of hydrological and sediment modelling
- 33 Model implementation
-
- 331 The purpose of the EwE model
- 332 Applicability of the EwE model framework to the Roberts Bank region
- 333 Model documentation
- 334 Highly mobile functional groups
- 335 Seasonality (model time step)
- 336 Life history structure
- 337 Model balancing
-
- 34 Model validation
- 35 Model results
-
- 351 Presentation of model results
- 352 Sensitivity and vulnerability analyses
-
- 40 Conclusions
- Contributors
- Approved by
- Sources of Information
- This Report is Available from the
-
- CSAS 2016-50 - Assessing Ecosystem Productivitypdf
-
- TECHNICAL REVIEW OF ROBERTS BANK TERMINAL 2 ENVIRONMENTAL ASSESSMENT SECTION 103 ndash ASSESSING ECOSYSTEM PRODUCTIVITY
-
- 10 Context
- 20 Background
-
- 21 Background and Terms of Reference
- 22 Approach to assessing ecosystem productivity
-
- 30 Analysis and Response
-
- 31 The EwE Team
- 32 Overview of assessment results of hydrological and sediment modelling
- 33 Model implementation
-
- 331 The purpose of the EwE model
- 332 Applicability of the EwE model framework to the Roberts Bank region
- 333 Model documentation
- 334 Highly mobile functional groups
- 335 Seasonality (model time step)
- 336 Life history structure
- 337 Model balancing
-
- 34 Model validation
- 35 Model results
-
- 351 Presentation of model results
- 352 Sensitivity and vulnerability analyses
-
- 40 Conclusions
- Contributors
- Approved by
- Sources of Information
- This Report is Available from the
-
Canadian Science Advisory Secretariat Pacific Region Science Response 2016050
December 2016
TECHNICAL REVIEW OF ROBERTS BANK TERMINAL 2 ENVIRONMENTAL ASSESSMENT SECTION 103 ndash
ASSESSING ECOSYSTEM PRODUCTIVITY
10 Context Vancouver Fraser Port Authority (VFPA) formerly Port Metro Vancouver (the Proponent) is proposing to construct and operate the Roberts Bank Terminal 2 Project (the Project) a new three-berth marine container terminal at Roberts Bank in Delta British Columbia The proposed terminal is located next to the existing Deltaport and Westshore Terminals In addition to the construction of the new terminal the Proponent has proposed to widen the north side of the existing Roberts Bank causeway from its east-end connection with the mainland to the entrance to the new terminal The existing tug basin connected to the northeast side of Deltaport Terminal is also proposed to be expanded The new marine terminal is predicted by the Proponent to process up to 260 container ship calls per year at full capacity with the assistance of two or three large berthing or escort tugs to manoeuver ships into or away from assigned berths The terminal is designed to operate 24 hours per day year-round
The Roberts Bank Terminal 2 Project is subject to an environmental assessment by a Review Panel pursuant to the Canadian Environmental Assessment Act 2012 As a federal authority in the environmental assessment for the Project Fisheries and Oceans Canada (DFO) will be asked to present information to the review panel and at public hearings in relation to its expertise on the effects of the Project on fish and fish habitat including aquatic species at risk and the adequacy of mitigation and offsetting measures and monitoring and follow-up programs proposed by the Proponent DFOrsquos Pacific Region Fisheries Protection Program (FPP) will coordinate DFOrsquos participation in the environmental assessment
The Proponent assessed future ecosystem productivity at Roberts Bank using the Ecopath with Ecosim and Ecospace (EwE) model framework The potential impacts of the Project to hydrodynamic conditions and sediment transport in the area as a result of changes in wind wave and current patterns and intensities are projected using different model frameworks A companion Science Response (DFO 2016) has been developed by DFO and Natural Resource Canada (NRCan) to review Section 95 ldquoCoastal Geomorphologyrdquo of the Environmental Impact Statement (EIS) which describes the hydrodynamic and sedimentology models that were used to evaluate the effect of the Project on water and sediment movements
Outcomes of the EwE models are incorporated into the analysis of the potential project-related effects on the ongoing productivity of commercial recreational and Aboriginal fisheries Consequently DFO FPP has requested that DFO Science Branch provide an evaluation of the Proponentrsquos characterization of project-related effects as conducted using the Ecopath with Ecosim and Ecospace (EwE) ecosystem model
Pacific Region Science Response Technical Review Assessing
Ecosystem Productivity Model of Roberts Bank
2
The objectives for this Science Response are to
1 Determine if the functional groups and abiotic factors used in the model adequately represent the ecosystem at Roberts Bank
2 Assess whether the parameter estimates used by the model are valid and defensible for this system
3 Assess whether the limitations and uncertainties of the model are identified and appropriately considered when determining the modelrsquos representation of current and possible future conditions
4 Provide advice regarding whether the model results related to the potential effects of the Project on fish and fish habitat and migratory birds and their food resources are valid and defensible
5 If possible provide advice regarding the validity of using the EwE model framework to quantify large scale impacts to fish habitat and fisheries productivity and the productivity of migratory birds
This Science Response evaluates Section 100 ldquoBiophysical Settingrdquo with a focus on Section 103 ldquoOverview of Assessing Ecosystem Productivityrdquo in the EIS as submitted by the Proponent (Port Metro Vancouver 2015) This Section and consequently this Response describes the ecosystem modelling approach that was taken to evaluate the direct and indirect effects of the footprint of the proposed terminal and widened causeway herein referred to as lsquothe Projectrsquo This ecosystem model provides outputs related to potential effects of the project on the study area at an ecosystem level including aquatic species and bird species in the Project area Evaluation of the model and its outputs therefore required expertise in both fishery aquatic species and migratory bird species Consequently this Science Response is the product of a joint review between DFO and Environment and Climate Change Canada (ECCC) Canadian Wildlife Service and Wildlife and Landscape Science to provide a complete evaluation
This Science Response Report results from the Science Response Process of July 2016 on the Technical Review of Ecopath with Ecosim and Ecospace (EwE) Ecosystem Productivity Model application to the Roberts Bank Terminal 2 Environmental Assessment
20 Background
21 Background and Terms of Reference The Projectrsquos main components have a proposed combined marine footprint area of approximately 179 km2 listed below by specific component
bull Marine Terminal 1335 km 2 including terminal (116 km 2) and dredged berth pocket and marine approach areas (0174 km 2)
bull Widened Causeway 0424 km 2
bull Expanded Tug basin 0031 km 2
Roberts Bank in the Fraser River estuary consists of complex intertidal and subtidal habitats including intertidal eelgrass beds and is an important stopover area for migrating shorebirds and productive feeding and rearing habitats for many fish and invertebrate species It also provides habitat for endangered Southern Resident Killer Whales and other marine mammals
Pacific Region Science Response Technical Review Assessing
Ecosystem Productivity Model of Roberts Bank
3
The environmental conditions at Roberts Bank are dynamic and are influenced by a variety of oceanographic and atmospheric factors including the Fraser River freshwater and sediment plume discharge diurnal tidal currents and prevailing and storm-generated wind and wave activity In addition the intercauseway region provides significant drainage from marsh and agricultural areas which have different characteristics from marine waters and which run along the ferry causeway
To provide the required science advice this Science Response focusses on Section 10 ldquoBiophysical Settingrdquo of the Environmental Impact Statement (EIS) (Port Metro Vancouver 2015a) specifically Section 103 ldquoOverview of Assessing Ecosystem Productivityrdquo (Port Metro Vancouver 2015b) and its related Appendices 10-B ldquoRoberts Bank Ecopath with Ecosim and Ecospace model parameter estimatesrdquo (Hemmera 2014) Appendix 10-C ldquoRoberts Bank Ecosystem model development and key runsrdquo(ESSA Technologies 2014a) and Appendix 10-D ldquoRoberts Bank Ecosystem model sensitivity analysesrdquo (ESSA Technologies 2014b) Additional important information was obtained from the Response to Information Request 6 (IR-73115-06 Canadian Environmental Assessment Agency Reference Number 80054 dated 26 October 2015) (Port Metro Vancouver 2015c) and the Written Responses to Coastal Geomorphology and Ecosystem Modelling Questions provided by the Proponent to DFO ECCC and NRCan on 2 March 2016 (Port Metro Vancouver (PMV) Transmittal TRE-01-RBT2-0004A subsequently referred in this Science Response as ldquoPMV Response 2016-03-02rdquo) (Vancouver Fraser Port Authority 2016)
The process followed in preparing this Science Response involved an initial review of the submitted EIS followed by an in-person meeting of the Proponent its contractors and representatives of DFO ECCC and NRCan to discuss and clarify questions arising from the initial review (Vancouver 23 November 2015) DFO and NRCan provided written questions to the Proponent based on preliminary review of the EIS on November 19 2015 ECCC also provided written questions based on its preliminary review of the EIS to the Proponent on December 1 2015 and January 20 2016 This large initial meeting was followed by smaller focussed meetings between the Proponent its contractors and DFO and NRCan on 11 December 2015 to clarify hydrology and sediment modelling questions with DFO on 8 January 2016 to clarify ecosystem modelling questions and with ECCC on 18 February 2016 to clarify questions relating to birds Written responses to all of these meetings and questions were provided by the Proponent to DFO ECCC and NRCan as the ldquoPMV Response 2016-03-02rdquo and ldquoPMV Response 2016-05-30rdquo (Vancouver Fraser Port Authority 2016) VFPArsquos answers to questions posed by DFO and NRCan regarding coastal geomorphology modelling have been posted to the Canadian Environmental Assessment Registry (CEAR)
22 Approach to assessing ecosystem productivity The Proponent adopted an ecosystem approach to evaluate the direct and indirect effects of the Project on the productivity of the Roberts Bank ecosystem A weight of evidence approach was used to assess the potential effects of the project on the productivity of the ecosystem and selected key components in the study area this approach included a spatial ecosystem simulation model (which included a habitat capacity model) a shorebird opportunity model and empirical data An important point is that any effects on the system during the construction phase or from expansion of the tug basin were excluded from this modelling process the focus instead being a comparison of modelled system productivity before and after the proposed terminal and expanded causeway is in place The chosen ecosystem simulation model was
Pacific Region Science Response Technical Review Assessing
Ecosystem Productivity Model of Roberts Bank
4
Ecopath with Ecosim and its spatial version Ecospace (collectively referred to here as the EwE framework or EwE model) This modelling approach was recommended by a prior Productive Capacity Technical Advisory Group comprised of representatives of technical experts from government agencies academia non-governmental organizations Vancouver Fraser Port Authority and its consultants (Compass 2013) convened by the Proponent and which also recommended a selection of focal species for the model The final selection of functional groups and the resulting food web that form the core of this ecosystem model are shown in Figure 1
Pacific Region Science Response Technical Review Assessing
Ecosystem Productivity Model of Roberts Bank
5
Figure 1 Ecopath with Ecosim model food web for Roberts Bank (Adapted from EIS Volume 3 Section 10 Fig 1033 on page 10-16) The groups coloured in orange represent focal groups size of symbols represents relative annual amount of biomass in the Roberts Bank study area
Pacific Region Science Response Technical Review Assessing
Ecosystem Productivity Model of Roberts Bank
6
The EwE framework is a common approach to ecosystem modelling which has been developed and expanded over the past two to three decades It currently has three main components
1 Ecopath ndash the core model which provides a mass-balance snapshot of the system
2 Ecosim ndash a module that enables simulation modelling over time
3 Ecospace ndash a module that enables simulation modelling over space
In order to make an EwE model tractable species are aggregated into functional groups based on their similar ecological characteristics (habitat and prey preferences etc) the Roberts Bank models had 58 functional groups The first step (Ecopath) was to obtain input parameters representing biomass production consumption emigration and diet for each functional group These parameters were then tuned in an iterative process until the overall production and consumption was balanced (a mass-balance approach) resulting in a model food web with estimates of energy flow between functional groups (Fig 1)
In the second step Ecosim was combined with the spatial model Ecospace The abiotic variables selected in this EIS (depth salinity bottom current wave height sediment type) were used as external forcings to the Ecospace module These abiotic variables provided the physical forcings for the simulations without and with the Project Since time series data on the functional groups of the model were not available Ecospace was run until the model reached equilibrium using various assumptions of the value of the vulnerability parameter (see Section 352) In this EIS the selected time step was annual with all variables abiotic and biotic expressed as yearly averages As used in this EIS the Ecospace module included a habitat capacity model which estimated the distribution of functional groups based on their environmental preferences for each abiotic variable (depth salinity bottom current wave height) and for substrate type (sand mud etc) The model thus allocated the spatial distribution of functional groups over the model domain based on their environmental preferences and the distributions of these abiotic variables with and without the Project The selected spatial unit size (ldquopixelrdquo) for the Ecospace model was 100 m2 In essence an Ecopath model was constructed for each pixel with particular rules governing how the functional groups interacted and moved among these spatial units The Ecospace module was run until it approached equilibrium (20 model years) to establish the spatial patterns without the Project For the lsquowith the Projectrsquo simulations the model was run for an initial 10 years and then the spatial patterns of the abiotic variables with the project were added and the model run for an additional 10 years1 The model outputs predicted changes in the productive potential of the Roberts Bank ecosystem as a comparison (ratio) with and without the Project rather than an absolute biomass that would be lost or gained as a result of the Project
1 EIS Appendix 10-C p 26
Pacific Region Science Response Technical Review Assessing
Ecosystem Productivity Model of Roberts Bank
7
30 Analysis and Response To prepare this response the following sections of the EIS additional documents were reviewed
DocumentSection Title
EIS Section 10
Including appendices 10B 10C and 10D
(Port Metro Vancouver 2015a Hemmera 2014 ESSA Technologies 2014a ESSA Technologies 2014b)
Biophysical Setting
Appendix 10-B Roberts Bank Ecosystem Model Parameter Estimates Port Metro Vancouver File 302-03503
Appendix 10-C Roberts Bank Ecosystem Model Development and Key Run Port Metro Vancouver
Appendix 10-D Roberts Bank Ecosystem Model Sensitivity Analyses Port Metro Vancouver
CEAR document 547 (Including Appendices) ldquoPMV Response 2016-03-02rdquo and ldquoPMV Response 2016-05-30rdquo
(Vancouver Fraser Port Authority 2016)
Vancouver Fraser Port Authority to the Review Panel re Answers to preliminary technical questions submitted during the completeness phase from Fisheries and Oceans Canada Natural Resources Canada and Environment and Climate Change Canada concerning the ecosystem modelling to support the Roberts Bank Terminal 2 Project environmental review
31 The EwE Team Building this ecosystem model was a complex undertaking which required knowledge of the ecosystem to be modelled how to set initial parameter values determination of reasonable ranges of these parameters how to balance the model and how to recognize when the model outputs were unrealistic These tasks became even more complex when spatial model dynamics were involved such as with Ecospace The team engaged by the Proponent to conduct this ecosystem modelling for the Roberts Bank Terminal 2 (RBT2) EIS was led by scientists at the Institute for Oceans and Fisheries located at the University of British Columbia in Vancouver These scientists are global leaders of the EwE model framework having developed much of its current implementation and who continue to lead its elaborations and extensions Construction and running of the model for this specific ecosystem was done in collaboration with ESSA Technologies of Vancouver Parameter values for the ecosystem model were obtained in part from observational studies conducted in the area by Hemmera of Burnaby BC
32 Overview of assessment results of hydrological and sediment modelling Implementation of the ldquowith the Projectrdquo simulations of the ecosystem model was done by driving the model with the abiotic variables as they were projected to be distributed with the Project footprint In the context of this EIS specifying depth salinity bottom currents wave height and sediment type conditions without the Project and changes with the Project were achieved by construction of hydrodynamical and sediment transport models The outputs from these models in combination with the identified environment preferences for the various biological groups were then used as inputs to the Ecospace model to define the spatial
Pacific Region Science Response Technical Review Assessing
Ecosystem Productivity Model of Roberts Bank
8
distributions of these functional groups The implementation of these hydrological and sediment transport models in this EIS was reviewed by DFO and NRCan (DFO 2016) This review concluded that the implementation of these models for this EIS was adequate for average winter conditions but lacking in validation for summer conditions in particular with strong freshwater flows from the Fraser River Simulations of strong storm events and their impacts on wave conditions and sediment transport were also lacking The effect of wave action and current speeds on sediment transport is non-linear such that increasing winds over short periods of time can impact sediment transport processes bottom topography and water depths beyond that determined under average model conditions Overall the review concluded that a greater range of sensitivity analyses is required to have confidence in the model outputs under lsquonon-averagersquo conditions The implication of this conclusion for the present review of the EwE model is that the full range of variability of abiotic characteristics such as bottom topography bottom current and wave heights and how they may affect relevant functional groups in the model with the Project may not be adequately represented Sensitivity analyses were provided by varying the intensity of abiotic variables and by removing abiotic variables to assess their interactive effects In general the ecosystem model outputs were robust to these sensitivity analyses with most groups varying by less than 5 Larger changes however were observed for primary producer and bird groupings and for some fish groups when various abiotic variables were omitted2
33 Model implementation 331 The purpose of the EwE model
The EwE model was intended to provide one line of evidence to assess the potential impacts of the Project on the Roberts Bank ecosystem which would then be used with other lines of evidence to make the final assessment Specifically ldquohellip the objective of the RB [Roberts Bank] model was not to provide an assessment of Project impacts for each functional group at a fine temporal scale but to estimate changes in productive potential with and without the Project at the ecosystem levelrdquo3 In addition ldquohellipthe primary objective of the RB ecosystem model is to evaluate potential changes in productivity from such abiotic factors with and without the terminal and causewayrdquo4 Results are presented for the selected functional groups no results were presented on potential changes in ecosystem structure or function
332 Applicability of the EwE model framework to the Roberts Bank region EwE models work best when the exchanges within the system being modelled are greater than the exchanges between the modelled system and the lsquooutsidersquo world In practice this means that EwE models work best for larger systems with few external exchanges In a meta-analysis of 433 Ecopath models Colleacuteter et al (2015) concluded that ldquohellipin the last two decades the range of the models area has expanded toward very large areas and the median has shifted accordingly from about 1000 km2 in 1984ndash1993 to about 100000 km2 in 1994ndash2014rdquo The section of the Roberts Bank ecosystem that is included in the EwE model was comparatively small (5468 km2) and complex It is an intertidally-dominated environment that is subject to strong seasonal influences of both freshwater and marine exchanges across relatively large seaward and shoreward boundaries
2 EIS Appendix 10-D p ii - iii 3 PMV Response 2016-03-02 p 99 lines 1914-1917 4 PMV Response 2016-03-02 p 38 lines 689-691
Pacific Region Science Response Technical Review Assessing
Ecosystem Productivity Model of Roberts Bank
9
Processes taking place outside the modelled ecosystem will contribute to dynamics within the modelled ecosystem (eg lsquooutsidersquo food supporting predators which occur in the Roberts Bank ecosystem for only part of the year predators which may feed in the Roberts Bank ecosystem but export this energy when they migrate out of the region) but which may not be well-resolved by the EwE model The Proponent justifies the spatial scale because it was specifically chosen for the questions being asked in regard to assessing productivity changes and because the relative influences of external exchanges are assumed to be identical with and without the project In addition highly mobile species with broad prey bases were assumed in the model to be partially sustained by external energy from outside the model system5 The distributions of organisms may differ however with and without the project which may affect their interactions with areas outside of the modelled system and the use of diets from outside the modelled system may not reflect the impacts of the project Further clarification of how the EwE model captures the exchanges and interactions with adjacent ecosystems are needed For example it could be argued that an ecosystem which is open to frequent exchanges of water and organic matter from beyond its boundaries might be more robust to local disturbances such as the Project
There are some inconsistencies in the information and assumptions used for some of the taxa in this ecosystem model For Dungeness Crab the justification for estimating total adult biomass (including females) from the biomass of fished males is unclear In addition it is unclear if the slower growth of female crabs once they have reached sexual maturity in comparison with male crabs has been considered The diet matrix for spiny dogfish does not represent the actual diet well in particular of euphausiids herring and shrimp and there are more recent references for biomass estimates of spiny dogfish in the study area than what was used in the EIS
Fishing mortality was not included in the model under the assumption that this would not change with or without the project While this assumption may be true the model has been parameterized by ignoring a source of mortality that will influence total production In essence fishing removes biomass from the ecosystem with the result that less biomass will be available for higher trophic levels How this may impact the ecosystem with and without the Project is unclear but it could make noticeable differences if for example there were thresholds in the feeding responses by these higher trophic level species The Ecopath model that was used is relatively unconstrained since many ecological efficiencies are low even for forage species which would be expected to be higher It is not clear how many species are exploited or the levels of exploitation but even if this does not change with the Project these mortality rates should be included in the model in order to add realistic constraints to the exploited functional groups
333 Model documentation Based on questions from DFO ECCC and NRCan following their initial review of the EIS the Proponent provided written responses dated 2 March 2016 to clarify several of the steps in the model development and implementation However several questions remain including questions about the Ecospace module Ecospace has undergone several recent developments such as the inclusion of the spatial-temporal data layer framework (Steenbeek et al 2013) the habitat capacity model (Christensen et al 2014) and the Monte Carlo analysis including the diet matrix As yet there are few published studies using these latest Ecospace developments and their documentation and justification need to be improved in the EIS
5 PMV Response 2016-03-02 p 29 lines 446 - 464
Pacific Region Science Response Technical Review Assessing
Ecosystem Productivity Model of Roberts Bank
10
Questions also remain regarding how the Monte Carlo randomization routine treated diet data The report indicates that the Monte Carlo routine randomly selected input parameters from the input ranges and that only models that were balanced were used This suggests that a high proportion of models were not balanced and therefore were not used (for example the EIS indicates that about one out of 1000 sampled input parameters was balanced6) A table showing the minimum maximum mode average and median values from the Monte Carlo runs for all the parameters would enable an evaluation of how much variation was actually sampled by the balanced model runs This is recommended in the EwE user information ie ldquoUsers should check the range of the input parameters that were actually used in the trials in the output csv file (see below)rdquo7
In addition there are several issues with the documentation of the derivation of the parameters for the functional groups Such documentation should clearly outline how the input parameter was estimated and the range of uncertainty for that parameter For example the input biomass of pinnipeds was defined as 04 t km 2 derived from estimates of 034 for Harbour seals and two estimates for Steller sea lions (012 and 014 t km 2) No explanation was provided for how the overall estimated pinniped biomass of 04 t km 2 was determined The diet of Sand Lance was described in the EIS as consisting mostly of zooplankton8 whereas the diet table for the model runs9 included 20 macrofauna 10 green algae and 10 detritus It is unclear why these additional prey were included in the diet used for the model runs
334 Highly mobile functional groups This implementation of the EwE framework included transient and migratory functional groups This is entirely appropriate and these groups cannot be excluded The approach taken in the Ecospace module was to impose a low (and conservative) dispersal rate among model spatial units (lsquopixelsrsquo) of 1 km yr-1 This may be appropriate for low mobility benthic organisms but it likely underestimates the movements of many other functional groups The effects of using higher and perhaps functional-group-specific dispersal rates was not considered The Proponents argued that higher dispersal rates would reduce impacts since species can move away from less desirable areas more quickly for completeness these runs should be done and evaluated Mobile species will also bring energy (food) captured outside the system into the modelled ecosystem This process was included in the model with the use of a diet import factor reflecting the consumption of prey outside the modelled region with the assumption that groups with high import rates were unlikely to respond to local changes on Roberts Bank10 This assumption needs justification perhaps at the functional group level for example many species of highly migratory birds and Pacific salmon use the Roberts Bank ecosystem to obtain food to continue their migrations Although this food does not compose a large fraction of their annual consumption it can be critical to enable them to continue their migrations
The EwE model is not designed to capture differences in prey quality ie differences in essential fatty acid or nutrient ratios The same species of prey may have greater or lesser nutritional value to predators depending on the conditions under which they are growing and their seasonal variations This is a particular concern with the nutritional quality of the diatom-dominated biofilm Diatomaceous biofilm is important to the highly migratory Western Sandpiper (Calidris mauri) Despite its predictive merits in relation to other ecosystem
6 EIS Appendix 10D Section 24 p5 7 EwE Help file p 151 8 EIS Appendix 10B Section 4133 p 76 9 EIS Appendix A of Appendix 10B 10 PMV Response 2016-03-02 p 28 lines 429 - 436
Pacific Region Science Response Technical Review Assessing
Ecosystem Productivity Model of Roberts Bank
11
components the EwE model is not informative with respect to understanding the potential impacts of the Project on biofilm and the Western Sandpiper While this example is specific to seabirds the potential exists for differences in the quality of biofilm to also be an issue for copepods which feed on biofilm and consequently to juvenile salmon which feed on these copepods (eg Sutherland et al 2013)
The EwE model is also not designed to predict effects of the Project on water quality although the Proponent noted that ldquoOther abiotic factors not included were deemed to be representative of variables that were already included in the modelhelliprdquo11 The Project may cause changes in physical and water quality conditions whether in isolation or in combination which may impact the productivity or nutritional quality of key prey organisms for local and migratory species which will not be captured by the model The EwE model does not assess the production of key nutrients or the implications of changes in important physical and water quality parameters to biofilm community structure and hence to important migratory birds
The model does not include biotic factors for both pelagic and benthic environments to assess the potential development of eutrophication and benthic organic enrichment events respectively Organic and redox indicators traditional measures of environmental assessments that are used to determine changes in functional group responses were included in the recent Deltaport Third environmental assessment (ie Pelagic chlorophyll dissolved nutrients Benthic sediment carbonnitrogen content redox state [sulfide concentration]) Benthic anoxic events based on organic enrichment are known to be strong drivers of community composition and exclusion regardless of substrate type In the absence of biotic factors (eg organic particulates) the model has not considered the potential for benthic organic enrichment which coincides with siltation processes within the upper tidal flats The tidal flat corner bordered by the Delta-dyke and Deltaport causeway has served as a catchment area for Fraser River silt since the development of the original Deltaport causeway (Sutherland et al 2013) The proposed position of the new terminal placed at the seaward termination of the Deltaport causeway may produce a crescent-shaped feature in the wake of the Fraser River Plume This feature may provide a more efficient silt trap that will promote benthic organic enrichment This piece of the environmental assessment seems to be missing and is important for assessing fish habitat in this area
335 Seasonality (model time step) Input data to parameterize the model were available on a range of time scales from hourly (eg physical data on salinity and water flow) to annual (eg species biomass) The Proponents indicated12 that this is a strength of the EwE model although ultimately the model was run with an annual time step with all sub-annual values being averaged to annual values This method therefore did not incorporate important seasonal processes such as winter-summer differences in salinity and storm properties and the seasonal appearances of abundances of predators and prey such as migratory salmon and birds that are much larger than the annual average For example juvenile salmon migrate from the Fraser River and onto Roberts Bank in the spring before moving into deeper waters If these spring abundances are averaged over the entire year these average abundances would be 5-10 times lower than the actual abundances during the spring (ie averaging the biomass that occurs in two months over a 12 month period) Additionally this method did not capture the intensity of processes such as growth and predation which can be focused over periods of a few weeks to a few months There may be important threshold effects at particular times and places which may be missed when using an 11 EIS Section 10 p 10-11 12 PMV Response 2016-03-02 p 86 line 1655
Pacific Region Science Response Technical Review Assessing
Ecosystem Productivity Model of Roberts Bank
12
annual time step for the model The Ecospace module has a monthly time step13 and therefore it is feasible to run this module with a sub-annual time step For example the Proponents submit14 that there are inadequate data to model the potential effects of the Project on the timing of biofilm production which could have implications for the migratory dunlin and Western Sandpiper However this could be modelled in an exploratory way to determine hypotheses about which factors could affect the timing of production of biofilm and the potential impacts on these birds These issues are of major concern to ECCC
336 Life history structure The EwE model did not separate functional groups into life history stages (stanzas) yet for many functional groups the juvenile stages can have very different life history characteristics and habitats than the adults It is unclear in the description of the model how different life history structures were considered and whether for example there were enough juveniles to produce the adults The implications of not including early life stages should be explored at least qualitatively to identify which species might have life stages that may be more vulnerable to project effects
337 Model balancing Balancing an EwE model is the process by which parameters are adjusted so that there is sufficient production for consumption requirements ie there are sufficient prey for all predators Expert opinion was used to examine parameter values and to adjust for errors or inconsistencies in logic ldquoPMV is confident that since the approach taken to balance the model was based on best practices the steps are appropriaterdquo15 Adjustments to initial parameters to ensure an ecologically-feasible model are necessary and to be expected For a few functional groups however very large changes to initial parameter estimates (which were often not based on Roberts Bank specific data) were necessary for example to transient killer whales When such initial parameters were adjusted (often by substantial amounts) by expert opinion to balance the model the confidence intervals around these adjusted parameter values were not increased to reflect this added uncertainty (see for example PMV Response 2016-03-02 p 51 lines 955-956) When expert opinion was used to make very large changes to initial parameter values broader confidence intervals about these parameters should have been applied This does not appear to have been the case and as a consequence may cause the actual uncertainty of the model outputs to be underestimated
Another example is for the pinniped group in which 50 of the diet was assumed to come from outside the model area in order to balance the model The rationale provided was ldquoThe pinnipeds caused excessive predation mortalities on numerous fish functional groups The biomass of pinnipeds was an average for the Strait of Georgia which was likely too high for Roberts Bank Therefore it was assumed that pinnipeds extracted only half of their diet from the study areardquo16 It is unclear whether the sensitivity of the model to different percentages of diet allocation was explored
As noted above (332) the Ecopath model was relatively unconstrained and few adjustments to input parameters were required to balance the model This is unusual and the low ecotrophic efficiencies of several functional groups suggest that full accounting of energy flows may not have been achieved (an ecotrophic efficiency of 1 indicates that 100 of the production of that
13 EIS Appendix 10C Section 29 p24 14 EIS Appendix 10D Appendix C p72 15 PMV Response 2016-03-02 p 49 lines 910-912 16 EIS Appendix 10C Section 261 p 20
Pacific Region Science Response Technical Review Assessing
Ecosystem Productivity Model of Roberts Bank
13
particular group is being preyed upon or removed by fishing leaving no individuals to die of old age17) An ldquoexcessrdquo of individuals dying of old age ie ecotrophic efficiencies much less than 1 suggests a potentially large biomass that is not used by the ecosystem and instead is converted to detritus
34 Model validation Model validation is the process by which the model parameters variables and outputs are compared with those from the real ecosystem to ascertain how well the model represents the ecosystem It is an essential step in providing confidence that the projections from the model in this case with and without the Project have relevance to how the real ecosystem may be expected to function with and without the Project In practice validating complex ecosystem models is difficult considering the range of assumptions that must be made when building the model the limited available data and natural variability of the ecosystem at a variety of time and space scales
Many of the standard diagnostics for the Ecopath model have not been evaluated in the EIS The Proponent appears to have assumed that once the Ecopath model was balanced then it was valid and fit for purpose The Proponent should provide all the Ecopath estimates of vital rates including mortality rates As presented questions remain For example many Ecotrophic Efficiencies (which control the transfer of biomass from prey to predators) are less than 1 even for taxa which would be expected to be close to 1 such as carnivorous zooplankton The reason for Ecotrophic Efficiencies less than 1 were not discussed or explained in the EIS
Detailed diagnostics for the Ecospace model should also be presented in order to evaluate model performance In response to criticisms by DFO ECCC and NRCan in discussions with the Proponent the latter provided the biomass of the functional groups from the Ecopath model (before Ecospace) and the Ecospace model after the spin-up period (which involved adjusting the parameters from the Ecopath model to balance the 5468 separate cells of the Ecospace model)18 The Proponents argue that ldquoIt is important to note that changes in biomass values generated during the spin-up period are identical for both with and without Project scenarios and thus do not provide information on the potential Project-related effects on productivity19 However several changes to biomass result from the Ecospace balancing process (spin-up period) This is only given brief attention by the Proponent in its response to the DFO ECCC and NRCan questions An analysis of Table 620 revealed that the biomass of 9 functional groups was larger or smaller than the widest confidence limits allowed for each group21 This requires further discussion and justification
The Proponent used a goodness of fit measure to compare spatial distributions of model outputs with field observations They indicated that ldquono other EwE models were identified which use a goodness-of-fit measure Hence the RB model is potentially the first such EwE model where a goodness of fit measure has been appliedrdquo22 The chosen goodness of fit measure is the percent correct classification (PCC) method23 This method derives a test statistic based on the proportion of locations at which predicted occurrences from the model match observed
17 EIS Appendix 10-B p 11 18 PMV Response 2016-03-02 p 65-66 Table 6 19 PMV Response 2016-03-02 p 64 lines 1205-1207 20 PMV Response 2016-03-02 p 65-66 Table 6 21 PMV Response 2016-03-02 p 45 Table 3 22 PMV Response 2016-03-02 p 78 lines 1481-1483 23 PMV Response 2016-03-02 p 78 lines 1483-1484
Pacific Region Science Response Technical Review Assessing
Ecosystem Productivity Model of Roberts Bank
14
occurrences from data and similarly with predicted and observed absences The Proponent then calculated two additional accuracy of fit measures sensitivity (the model predicts a species to occur in an area where it is known to occur in reality) and specificity (the model predicts a species does not occur in an area it is known not to occur in reality)24 This analysis concluded that the model has high predictability for functional groups such as eelgrass and sea pens with relatively static distributions but lower predictability for functional groups which are more temporally and spatially dynamic such as biofilm and green algae25
There are two problems with this approach The first is that this goodness of fit comparison was done only for habitat-forming functional groups no discussion of how well this analysis applies to mobile functional groups was provided The second problem is that this method does not take into account situations (such as occurs in this study with several groups) in which species occur at only a few locations For example ldquohellipif the test data consist of 95 absences and 5 presences and this reflects the true prevalence of the species on the landscape (a realistic scenario for a rare species) a lsquonullrsquo model that predicted absence in all cases (eg no model at all) would be correct 95 of the timehellipldquo (Franklin 2009 p 151) This latter point is important here as these habitat functional groups (biofilm brown algae native eelgrass green algae Japanese eelgrass tidal marsh biomat and orange sea pens26) appear not to occur over most of the Project area (as portrayed by the model outputs presented in the distribution figures of PMV Response 2016-03-02 Appendix 218) It is therefore important that a robust evaluation of the performance of the Ecospace module is used with preferably more than one measure
In summary the starting point for this modelling analysis matters It is not just about a comparison between results with and without the Project The model has to be considered a sufficient representation of the ecosystem The Proponent has not yet sufficiently validated the model
35 Model results 351 Presentation of model results
As noted above (Section 331) the stated objective of the Roberts Bank ecosystem model was not to provide an assessment of Project impacts for each functional group at a fine temporal scale but to estimate changes in productive potential with and without the Project at the ecosystem level27 However results were presented as comparisons by speciesfunctional group with and without the Project and not as potential changes in total ecosystem productivity The revised figures for each functional group showing distributions without the Project with the Project and their difference indicated impacts were likely to be localized with overall impacts relatively small The range of biomass ratios with and without the Project was 045 ndash 189 with most values slightly less than 1 This is interpreted as indicating slight decreases in the capacity of the study area to support biomass and production with the Project for many functional groups28 (Figure 2)
24 PMV Response 2016-03-02 p 80 lines 1524-1527 25 PMV Response 2016-03-02 p 81 lines 1551-1559 26 PMV Response 2016-03-02 p 82 Table 8 27 PMV Response 2016-03-02 p 99 lines 1914-1917 28 PMV Response 2016-03-02 Appendix 218
Pacific Region Science Response Technical Review Assessing
Ecosystem Productivity Model of Roberts Bank
15
Biomass Ratio
Freq
uenc
y
04 07 10 13 16 19
05
1015
2025
30
Figure 2 Histogram of biomass ratios obtained by comparisons of model runs with and without the project (ie With Without) Values less than 1 indicate reductions in biomass with the Project compared against without the Project) Data from Appendix 218 of PMV Response 2016-03-02
352 Sensitivity and vulnerability analyses Every ecosystem model is only one possible representation of the true ecosystem defined by the modelrsquos structure and the values chosen for its many parameters The key point is how well the model represents the real system how that fit can be measured and the sensitivity of model outputs to variability in the selected parameter values The ideal model should be robust to a wide range of uncertainties in the input data and parameters This robustness is determined by performing sensitivity analyses on the model to see how it responds to variations in the input parameters and determining to which input parameters the model is most sensitive
The vulnerability parameters determine the strength of the feeding interactions between functional groups They set the level of density dependence of each functional group Higher vulnerability settings provide greater top-down (predator) control whereas lower settings provide greater bottom-up (environmental) control29 Several publications have shown that EwE models are very sensitive to the vulnerability parameters and Christensen and Walters (2000) point out that a main pitfall of EwE is that ldquopredation vulnerabilities are often underestimated lessening the modelled impacts of predationrdquo It is usual practice to tune Ecopath models including the vulnerability parameters to time series data such as biomass using the temporal simulation model Ecosim However these data were not available for the RBT2 area so this robust method of fitting the model and estimating vulnerability parameters was not possible Instead a vulnerability setting of 2 was used as the default value for the key model runs which is ldquocommon practice when time series data are not available and estimates of vulnerability in the
29 PMV Response 2016-03-02 p 70 lines 1318-1323
Pacific Region Science Response Technical Review Assessing
Ecosystem Productivity Model of Roberts Bank
16
model cannot be maderdquo30 with sensitivity analyses run for a range of 15 to 3 This narrow range was criticized by DFOECCC in initial discussions about the model with the Proponent The Proponent subsequently reran the model with a larger range of vulnerabilities31 (11 to 10) and concluded this broader vulnerability range produced similar results for the productivity ratio with and without the Project to those in the original EIS and that the EIS was more likely to overestimate than underestimate potential project effects32 The data in Table 7 of the PMV Response33 did indicate changes in productivity ratios ranging from 0 to 50 of the defined key run (which used a vulnerability setting of 2) However the Proponent changed all vulnerability settings to the same value ie all were 2 or all were 10 etc In reality the vulnerability parameters resulting from Ecosim models that are fitted to data as described above vary by functional group which was not explored here Therefore although the results suggest that the original choice of 2 for the default key run seemed reasonable the potential effects of variability in vulnerability settings was not fully explored
Sensitivity analyses are usually based on the range of uncertainty estimated for input data and parameters often called the confidence limits around the model parameters The EwE framework integrates many different data sources and parameters including values from the literature It can therefore be difficult to identify ldquoreasonablerdquo confidence limits when derived from such diverse data sources Standard practice in Ecopath models has been to develop a pedigree for each parameter with default values for uncertainty based on the nature of the source data For example parameter values based on high precision field observations of biomass within the model domain receive default confidence intervals of 10 whereas parameter values based on models developed for elsewhere or professional judgment receive confidence intervals of 8034 Sensitivity analyses are then run using parameter values selected from within these confidence intervals However if these default confidence intervals do not capture the full range of variability then the outputs are not informative of the variability in the lsquorealrsquo ecosystem Field observations were collected for many functional groups within the model domain in 2012 and 2013 as part of studies to support the RBT2 EIS Apparently the purpose of these observations was to document spatial variability (in part for the Ecospace model) and temporal variability (measurements at one location over time) and not to derive confidence intervals around the observations35
The reliance on the pedigree approach to derive confidence intervals for this Roberts Bank model was criticized by DFO ECCC and NRCan in discussions with the Proponent As a result the Proponent reran the model with much larger confidence intervals ranging from 30 to 100 depending on the input parameter and functional group36 The results from this new analysis using the broader confidence intervals were similar to those using the original pedigree approach The Proponent noted that ldquoWhile the production within each helliprun was very different there was little difference in the biomass ratio [with and without the Project] These results further demonstrate that even with a greater range in input values the influence of the Project on the Roberts Bank ecosystem is consistent among allhellipmodel runsrdquo37 This provides confidence that the model may be robust to uncertainty in its input parameters Two concerns
30 PMV Response 2016-03-02 p 70 lines 1321-1322 31 PMV Response 2016-03-02 p 71-74 32 PMV Response 2016-03-02 p 71 lines 1339-1341 33 PMV Response 2016-03-02 p 73 34 EIS Appendix 10-C Section 251 page 18 35 PMV Response 2016-03-02 p 42 lines 772-777 36 PMV Response 2016-03-02 p 44-47 37 PMV Response 2016-03-02 p 47 lines 855-858 and see also PMV Response 2016-03-02 Appendix 27-B
Pacific Region Science Response Technical Review Assessing
Ecosystem Productivity Model of Roberts Bank
17
remain however The quote above indicates that the production among the different model runs was very different although with little difference in the biomass ratios with and without the Project Since biomass is not the same as production it would be informative for understanding model performance and potential impacts to show these production differences This also relates to the point made in Section 34 regarding how well the model represents the real ecosystem and not just within-model comparisons with and without the Project The second question is more technical and relates to how the randomization (Monte Carlo or MC) routine that was used to create multiple model runs used the uncertainty about the diet data Diets are not currently included in the MC routine available to regular users of the Ecosim model how they were handled in this RBT2 model appears not to be explained
Finally the sensitivity analyses indicate that the uncertainty in the input parameters does not lead to much difference between model parameters with or without the project However this conclusion does not describe how the uncertainty in the input parameters affects understanding of the ecosystem
40 Conclusions Overall the main conclusion of the Environmental Impact Statement from the Proponent is stated as ldquohellipafter the implementation of mitigation hellipthe Project is not expected to result in any significant adverse effects on any of the 16 valued componentsrdquo38 In addition ldquohellipapproximately 40 of the functional groups are forecast to change no more than 5 which hellip is judged to be within the uncertainty of the model runsrdquo39 although larger changes were forecast for orange sea pens freshwater biofilm green algae and raptors The conclusions from the modelling studies are that ldquohellipthe proposed project will have an impact on the study area that the effect varies between species and that the findings are robust to parameter uncertaintyrdquo40 Specific outcomes by valued component as derived from the EwE model are presented by functional groups in Table 1
38 PMV March 2015 Roberts Bank Environmental Impact Statement Executive Summary ndash Part 1 page 37 39 EIS Appendix 10-C p ii 40 EIS Appendix 10-D p iv
Pacific Region Science Response Technical Review Assessing
Ecosystem Productivity Model of Roberts Bank
18
Table 1 Changes in productive potential with the Project as derived from the EwE model
Changes in productive potential
Ecosystem category
Number of valued
components
Number with potential
biomass loss
Moderate decrease (31-60 decline)
Minor decrease (6-30 decline)
Negligible (0-5
change)
Minor increase (6-
30 increase)
Moderate increase (31-60 increase)
Source
Marine vegetation
7 7 - 3 2 2 - EIS Vol 3 Section 11 Table 11-17 page 11-65
Marine invertebrates
4 3 1 1 1 1 - EIS Vol 3 Section 12 Table 12-8 page 12-52
Marine fish 13 13 - 2 6 5 - EIS Vol 3 Section 13 Table 13-10 page 13-95
Coastal birds
11 8 - 3 4 3 1 EIS Vol 3 Section 15 Table 15-10 page 15-67
Pacific Region Science Response Technical Review Assessing
Ecosystem Productivity Model of Roberts Bank
19
Most functional groups showed some potential biomass loss with the Project with biomass loss defined as any model run with negative outcomes (ie in which biomass with the project was less than biomass without the Project) The summary of changes in productivity potential are mixed with most (33 out of 35) valued components showing minor decreases to minor increases (defined as 6 to 30 changes in productive potential with the Project compared to without the Project)
The main conclusions of this review in regards to the Terms of Reference are
1 Do the functional groups and abiotic variables used in the model adequately represent the ecosystem at Roberts Bank
o The 58 functional groups and abiotic variables used in the model adequately represent the main components of the Roberts Bank ecosystem however for longer lived species the life stages of the species are not well represented and some of the impacts of the Project may be expected to affect specific life stages
o The abiotic variables adequately represent the physical drivers of this ecosystem on an annual time scale However annual values for these abiotic variables may not adequately capture important sub-annual events such as storms (DFO 2016) the timing of arrival and departure of highly migratory species and whether there may be important sub-annual thresholds or mismatches in timing as a result of the Project
o Biotic factors (eg nutrients) which are particularly important for biofilm and other lower trophic level taxa are not included in this model The model is therefore unable to assess the potential development of eutrophication and benthic organic enrichment events which may affect fish habitats in the study area
2 Are the parameter estimates used by the model valid and defensible for this system
o In general parameter estimates appear to be adequate for this system Field studies were done in two years to provide data in particular on distributions of selected functional groups for the Ecospace module Note the distribution studies focussed on taxa which were relatively immobile and therefore lsquofixedrsquo in space
o the selection of some model parameters would benefit from further explanation for example the choice of fixed diet matrices versus dynamic matrices which can vary with changes in abundances or predators and prey
o the selection of some model parameters would benefit from further explanation for example the link between the diets described in the text of Appendix 10B and the quantities presented in Appendix A of Appendix 10B It is understood that proportions were derived using the ldquofixed selectivityrdquo principle but in order to be fully transparent the derivation of each diet should be provided in an appendix
o discussion and explanation is needed of why ecotrophic efficiencies differ from expected values (eg the ecotrophic efficiency for Pacific herring is listed as 038) and
o the abiotic factor lsquosubstratersquo was limited to ldquohardrdquo or rdquosoftrdquo options which can be restrictive given that they serve as endpoints on a substrate composition continuum These limited options may not provide the sensitivity required to assess substrate preference nor the flexibility for taxa (eg motile organisms) that span hard mixed and soft substrate types In addition it is not clear if changes in the hardsoft categories were considered over time within identified depositional or erosional settings before and after construction
Pacific Region Science Response Technical Review Assessing
Ecosystem Productivity Model of Roberts Bank
20
3 Are the limitations and uncertainties of the model identified and appropriately considered when determining the modelrsquos representation of current and possible future conditions
o the EwE model was not designed to evaluate a range of future conditions It was designed to estimate changes in the productive potential at the ecosystem level with and without the Project Therefore the model was run without the Project and with the Project for a range of plausible abiotic conditions and the results were compared with respect to biomass and productivity by functional group
o the pedigree approach to assessing the uncertainties of model outcomes is unsatisfactory for the purpose here as it relates solely to a qualitative judgment of the value of data based on its source However when the model was rerun with much wider ranges of confidence intervals (uncertainties) the results in general (but not necessarily for each functional group) were similar to the results using the original pedigree approach This suggests that taken overall the model may be robust to wide ranges of uncertainty in these input variables and parameters
o there is inadequate validation of the model This is inadequate for three reasons
(i) the basic Ecopath model is not validated and the Ecospace balancing process (the spin-up period) resulted in some biomass estimates being increased or decreased beyond their confidence limits
(ii) the goodness of fit test used to evaluate how well the model predicted the spatial occurrence functional groups is not fit for purpose (Section 34) and
(iii) validation was provided for only a small number of functional groups (the habitat-forming functional groups) As a consequence the model is currently not validated
o Considering the proportion of open boundaries relative to closed boundaries in the model processes taking place outside the modelled ecosystem are likely to contribute to dynamics within the modelled ecosystem However these external processes may not be well-resolved by the EwE model as currently configured
4 Are the model results related to the potential effects of the Project on fish and fish habitat and migratory birds and their food resources valid and defensible
o this is a very complex ecosystem model constructed for a relatively small and open (in the sense of considerable exchange with adjacent non-modelled areas) system Many assumptions have been made based on poor or missing data Taking all these considerations into account the model does the best job possible of comparing the biomass and productivity of the Roberts Bank ecosystem with and without the Project
o the extent to which the model adequately represents the lsquorealrsquo ecosystem of Roberts Bank as opposed to comparisons of model results with and without the Project is unclear as a number of basic diagnostics are not presented (see point 3 above)
o the EwE model is not capable of and is not designed to represent nutritional and food quality variations in prey functional groups and how these may impact highly migratory predators such as birds with and without the Project
5 Is the EwE model framework a valid method to quantify large scale impacts to fish habitat fish productivity and migratory bird productivity
o the EwE model as implemented in this project and reviewed here is a useful first-order framework to organise information and derive initial estimates of how the system may respond to perturbations
Pacific Region Science Response Technical Review Assessing
Ecosystem Productivity Model of Roberts Bank
21
o the utility of a EWE model for impact purposes is highly dependent on the quality of input data
o each EwE model is highly dependent on local conditions Although appropriate as an overall methodology each application would need to be reviewed for how it may be applied to any new ecosystem and
o the EwE model would need to be substantially reformulated if it was to include considerations of changes in chemical composition or food quality of prey in particular for seasonal migratory species such as birds which may depend on very large biomasses of prey with specific chemical composition to fuel their migrations beyond the ecosystem model boundaries
Contributors Contributor Affiliation Ian Perry Author DFO Science Pacific Region Alida Bundy Author DFO Science Maritimes Region Terri Sutherland Author DFO Science Pacific Region Robert Elner Author ECCC Canadian Wildlife Service Andrew Robinson Author ECCC Canadian Wildlife Service Lesley MacDougall Editor DFO Science Pacific Region
Approved by Carmel Lowe
Regional Director Science Branch Pacific Region Fisheries and Oceans Canada
November 4 2016
Sources of Information Christensen V Coll M Steenbeek J Buszowski J Chagaris D walters CJ 2014
Representing variable habitat quality in a spatial food web model Ecosystems 17 1397-1412
Christensen V and Walters C 2000 Ecopath with Ecosim methods capabilities and limitations Ecological Modelling 172 109-139
Colleacuteter M Valls A Guitton J Gascuel D Pauly D and Christensen V 2015 Global overview of the applications of the Ecopath with Ecosim modeling approach using the EcoBase models repository Ecological Modelling 302 pp42-53
Compass Resource Management Ltd 2013 Roberts Bank Terminal 2 Technical Advisory Group (TAG) Process Report Productive Capacity ndash Final Report 119pp (Accessed November 1 2016)
DFO 2016 Technical Review of Roberts Bank Terminal 2 Environmental Assessment Section 95 ndash Coastal Geomorphology DFO Can Sci Advis Sec Sci Resp 2016045 (Accessed November 4 2016)
Pacific Region Science Response Technical Review Assessing
Ecosystem Productivity Model of Roberts Bank
22
ESSA Technologies 2014a Roberts Bank Terminal 2 Project Roberts Bank Delta BC Environmental Impact Statement Volume 3 Biophysical Effects Assessments Appendix 10-C Roberts Bank Ecosystem Model Development and Key Run Port Metro Vancouver (Accessed November 1 2016)
ESSA Technologies 2014b Roberts Bank Terminal 2 Project Roberts Bank Delta BC Environmental Impact Statement Volume 3 Biophysical Effects Assessments Appendix 10-D Roberts Bank Ecosystem Model Sensitivity Analyses Port Metro Vancouver (Accessed November 1 2016)
Franklin J 2009 Mapping Species Distributions Spatial Inference and Prediction Cambridge University Press Cambridge
Hemmera 2014 Roberts Bank Terminal 2 Project Roberts Bank Delta BC Environmental Impact Statement Volume 3 Biophysical Effects Assessments Appendix 10-B Roberts Bank Ecosystem Model Parameter Estimates Port Metro Vancouver File 302-03503 (Accessed November 1 2016)
Port Metro Vancouver 2015a Roberts Bank Terminal 2 Project Roberts Bank Delta BC Environmental Impact Statement Volume 3 Biophysical Effects Assessments Section 100 Biophysical Setting (Accessed November 1 2016)
Port Metro Vancouver 2015b Roberts Bank Terminal 2 Project Roberts Bank Delta BC Environmental Impact Statement Volume 3 Biophysical Effects Assessments Section 103 Overview of Assessing Ecosystem Productivity (Accessed November 1 2016)
Port Metro Vancouver 2015c Roberts Bank Terminal 2 Project Environmental Assessment Additional Information Requirements (July 31 2015) Responses Response to Information Request 6 IR-73115-06 Canadian Environmental Assessment Agency Reference Number 80054 dated 26 October 2015
Steenbeek J Coll M Gurney L Meacutelin F Hoepffner N Buszowski J and Christensen V 2013 Bridging the gap between ecosystem modeling tools and geographic information systems Driving a food web model with external spatialndashtemporal data Ecological Modelling 263 139ndash 151
Sutherland T Elner R and OrsquoNeill J 2013 Roberts Bank Ecological crucible of the Fraser River estuary Progress in Oceanography 115 171ndash180
Vancouver Fraser Port Authority 2016 From the Vancouver Fraser Port Authority to the Review Panel re Answers to preliminary technical questions submitted during the completeness phase from Fisheries and Oceans Canada Natural Resources Canada and Environment and Climate Change Canada concerning the ecosystem modelling to support the Roberts Bank Terminal 2 Project environmental review CEAR Document 547 (Accessed November 1 2016)
Pacific Region Science Response Technical Review Assessing
Ecosystem Productivity Model of Roberts Bank
23
This Report is Available from the Centre for Science Advice
Pacific Region Fisheries and Oceans Canada
3190 Hammond Bay Road Nanaimo BC V9T 6N7
Telephone (250) 756-7208 E-Mail csapdfo-mpogcca
Internet address wwwdfo-mpogccacsas-sccs
ISSN 1919-3769 copy Her Majesty the Queen in Right of Canada 2016
Correct Citation for this Publication
DFO 2016 Technical review of Roberts Bank Terminal 2 environmental assessment section 103 ndash assessing ecosystem productivity DFO Can Sci Advis Sec Sci Resp 2016050
Aussi disponible en franccedilais
MPO 2016 Examen technique de leacutevaluation environnementale du Terminal 2 agrave Roberts Bank section 103 ndash eacutevaluation de la productiviteacute de leacutecosystegraveme Secr can de consult sci du MPO Reacutep des Sci 2016050

Pacific Region Science Response Technical Review Assessing
Ecosystem Productivity Model of Roberts Bank
4
Ecopath with Ecosim and its spatial version Ecospace (collectively referred to here as the EwE framework or EwE model) This modelling approach was recommended by a prior Productive Capacity Technical Advisory Group comprised of representatives of technical experts from government agencies academia non-governmental organizations Vancouver Fraser Port Authority and its consultants (Compass 2013) convened by the Proponent and which also recommended a selection of focal species for the model The final selection of functional groups and the resulting food web that form the core of this ecosystem model are shown in Figure 1
Pacific Region Science Response Technical Review Assessing
Ecosystem Productivity Model of Roberts Bank
5
Figure 1 Ecopath with Ecosim model food web for Roberts Bank (Adapted from EIS Volume 3 Section 10 Fig 1033 on page 10-16) The groups coloured in orange represent focal groups size of symbols represents relative annual amount of biomass in the Roberts Bank study area
Pacific Region Science Response Technical Review Assessing
Ecosystem Productivity Model of Roberts Bank
6
The EwE framework is a common approach to ecosystem modelling which has been developed and expanded over the past two to three decades It currently has three main components
1 Ecopath ndash the core model which provides a mass-balance snapshot of the system
2 Ecosim ndash a module that enables simulation modelling over time
3 Ecospace ndash a module that enables simulation modelling over space
In order to make an EwE model tractable species are aggregated into functional groups based on their similar ecological characteristics (habitat and prey preferences etc) the Roberts Bank models had 58 functional groups The first step (Ecopath) was to obtain input parameters representing biomass production consumption emigration and diet for each functional group These parameters were then tuned in an iterative process until the overall production and consumption was balanced (a mass-balance approach) resulting in a model food web with estimates of energy flow between functional groups (Fig 1)
In the second step Ecosim was combined with the spatial model Ecospace The abiotic variables selected in this EIS (depth salinity bottom current wave height sediment type) were used as external forcings to the Ecospace module These abiotic variables provided the physical forcings for the simulations without and with the Project Since time series data on the functional groups of the model were not available Ecospace was run until the model reached equilibrium using various assumptions of the value of the vulnerability parameter (see Section 352) In this EIS the selected time step was annual with all variables abiotic and biotic expressed as yearly averages As used in this EIS the Ecospace module included a habitat capacity model which estimated the distribution of functional groups based on their environmental preferences for each abiotic variable (depth salinity bottom current wave height) and for substrate type (sand mud etc) The model thus allocated the spatial distribution of functional groups over the model domain based on their environmental preferences and the distributions of these abiotic variables with and without the Project The selected spatial unit size (ldquopixelrdquo) for the Ecospace model was 100 m2 In essence an Ecopath model was constructed for each pixel with particular rules governing how the functional groups interacted and moved among these spatial units The Ecospace module was run until it approached equilibrium (20 model years) to establish the spatial patterns without the Project For the lsquowith the Projectrsquo simulations the model was run for an initial 10 years and then the spatial patterns of the abiotic variables with the project were added and the model run for an additional 10 years1 The model outputs predicted changes in the productive potential of the Roberts Bank ecosystem as a comparison (ratio) with and without the Project rather than an absolute biomass that would be lost or gained as a result of the Project
1 EIS Appendix 10-C p 26
Pacific Region Science Response Technical Review Assessing
Ecosystem Productivity Model of Roberts Bank
7
30 Analysis and Response To prepare this response the following sections of the EIS additional documents were reviewed
DocumentSection Title
EIS Section 10
Including appendices 10B 10C and 10D
(Port Metro Vancouver 2015a Hemmera 2014 ESSA Technologies 2014a ESSA Technologies 2014b)
Biophysical Setting
Appendix 10-B Roberts Bank Ecosystem Model Parameter Estimates Port Metro Vancouver File 302-03503
Appendix 10-C Roberts Bank Ecosystem Model Development and Key Run Port Metro Vancouver
Appendix 10-D Roberts Bank Ecosystem Model Sensitivity Analyses Port Metro Vancouver
CEAR document 547 (Including Appendices) ldquoPMV Response 2016-03-02rdquo and ldquoPMV Response 2016-05-30rdquo
(Vancouver Fraser Port Authority 2016)
Vancouver Fraser Port Authority to the Review Panel re Answers to preliminary technical questions submitted during the completeness phase from Fisheries and Oceans Canada Natural Resources Canada and Environment and Climate Change Canada concerning the ecosystem modelling to support the Roberts Bank Terminal 2 Project environmental review
31 The EwE Team Building this ecosystem model was a complex undertaking which required knowledge of the ecosystem to be modelled how to set initial parameter values determination of reasonable ranges of these parameters how to balance the model and how to recognize when the model outputs were unrealistic These tasks became even more complex when spatial model dynamics were involved such as with Ecospace The team engaged by the Proponent to conduct this ecosystem modelling for the Roberts Bank Terminal 2 (RBT2) EIS was led by scientists at the Institute for Oceans and Fisheries located at the University of British Columbia in Vancouver These scientists are global leaders of the EwE model framework having developed much of its current implementation and who continue to lead its elaborations and extensions Construction and running of the model for this specific ecosystem was done in collaboration with ESSA Technologies of Vancouver Parameter values for the ecosystem model were obtained in part from observational studies conducted in the area by Hemmera of Burnaby BC
32 Overview of assessment results of hydrological and sediment modelling Implementation of the ldquowith the Projectrdquo simulations of the ecosystem model was done by driving the model with the abiotic variables as they were projected to be distributed with the Project footprint In the context of this EIS specifying depth salinity bottom currents wave height and sediment type conditions without the Project and changes with the Project were achieved by construction of hydrodynamical and sediment transport models The outputs from these models in combination with the identified environment preferences for the various biological groups were then used as inputs to the Ecospace model to define the spatial
Pacific Region Science Response Technical Review Assessing
Ecosystem Productivity Model of Roberts Bank
8
distributions of these functional groups The implementation of these hydrological and sediment transport models in this EIS was reviewed by DFO and NRCan (DFO 2016) This review concluded that the implementation of these models for this EIS was adequate for average winter conditions but lacking in validation for summer conditions in particular with strong freshwater flows from the Fraser River Simulations of strong storm events and their impacts on wave conditions and sediment transport were also lacking The effect of wave action and current speeds on sediment transport is non-linear such that increasing winds over short periods of time can impact sediment transport processes bottom topography and water depths beyond that determined under average model conditions Overall the review concluded that a greater range of sensitivity analyses is required to have confidence in the model outputs under lsquonon-averagersquo conditions The implication of this conclusion for the present review of the EwE model is that the full range of variability of abiotic characteristics such as bottom topography bottom current and wave heights and how they may affect relevant functional groups in the model with the Project may not be adequately represented Sensitivity analyses were provided by varying the intensity of abiotic variables and by removing abiotic variables to assess their interactive effects In general the ecosystem model outputs were robust to these sensitivity analyses with most groups varying by less than 5 Larger changes however were observed for primary producer and bird groupings and for some fish groups when various abiotic variables were omitted2
33 Model implementation 331 The purpose of the EwE model
The EwE model was intended to provide one line of evidence to assess the potential impacts of the Project on the Roberts Bank ecosystem which would then be used with other lines of evidence to make the final assessment Specifically ldquohellip the objective of the RB [Roberts Bank] model was not to provide an assessment of Project impacts for each functional group at a fine temporal scale but to estimate changes in productive potential with and without the Project at the ecosystem levelrdquo3 In addition ldquohellipthe primary objective of the RB ecosystem model is to evaluate potential changes in productivity from such abiotic factors with and without the terminal and causewayrdquo4 Results are presented for the selected functional groups no results were presented on potential changes in ecosystem structure or function
332 Applicability of the EwE model framework to the Roberts Bank region EwE models work best when the exchanges within the system being modelled are greater than the exchanges between the modelled system and the lsquooutsidersquo world In practice this means that EwE models work best for larger systems with few external exchanges In a meta-analysis of 433 Ecopath models Colleacuteter et al (2015) concluded that ldquohellipin the last two decades the range of the models area has expanded toward very large areas and the median has shifted accordingly from about 1000 km2 in 1984ndash1993 to about 100000 km2 in 1994ndash2014rdquo The section of the Roberts Bank ecosystem that is included in the EwE model was comparatively small (5468 km2) and complex It is an intertidally-dominated environment that is subject to strong seasonal influences of both freshwater and marine exchanges across relatively large seaward and shoreward boundaries
2 EIS Appendix 10-D p ii - iii 3 PMV Response 2016-03-02 p 99 lines 1914-1917 4 PMV Response 2016-03-02 p 38 lines 689-691
Pacific Region Science Response Technical Review Assessing
Ecosystem Productivity Model of Roberts Bank
9
Processes taking place outside the modelled ecosystem will contribute to dynamics within the modelled ecosystem (eg lsquooutsidersquo food supporting predators which occur in the Roberts Bank ecosystem for only part of the year predators which may feed in the Roberts Bank ecosystem but export this energy when they migrate out of the region) but which may not be well-resolved by the EwE model The Proponent justifies the spatial scale because it was specifically chosen for the questions being asked in regard to assessing productivity changes and because the relative influences of external exchanges are assumed to be identical with and without the project In addition highly mobile species with broad prey bases were assumed in the model to be partially sustained by external energy from outside the model system5 The distributions of organisms may differ however with and without the project which may affect their interactions with areas outside of the modelled system and the use of diets from outside the modelled system may not reflect the impacts of the project Further clarification of how the EwE model captures the exchanges and interactions with adjacent ecosystems are needed For example it could be argued that an ecosystem which is open to frequent exchanges of water and organic matter from beyond its boundaries might be more robust to local disturbances such as the Project
There are some inconsistencies in the information and assumptions used for some of the taxa in this ecosystem model For Dungeness Crab the justification for estimating total adult biomass (including females) from the biomass of fished males is unclear In addition it is unclear if the slower growth of female crabs once they have reached sexual maturity in comparison with male crabs has been considered The diet matrix for spiny dogfish does not represent the actual diet well in particular of euphausiids herring and shrimp and there are more recent references for biomass estimates of spiny dogfish in the study area than what was used in the EIS
Fishing mortality was not included in the model under the assumption that this would not change with or without the project While this assumption may be true the model has been parameterized by ignoring a source of mortality that will influence total production In essence fishing removes biomass from the ecosystem with the result that less biomass will be available for higher trophic levels How this may impact the ecosystem with and without the Project is unclear but it could make noticeable differences if for example there were thresholds in the feeding responses by these higher trophic level species The Ecopath model that was used is relatively unconstrained since many ecological efficiencies are low even for forage species which would be expected to be higher It is not clear how many species are exploited or the levels of exploitation but even if this does not change with the Project these mortality rates should be included in the model in order to add realistic constraints to the exploited functional groups
333 Model documentation Based on questions from DFO ECCC and NRCan following their initial review of the EIS the Proponent provided written responses dated 2 March 2016 to clarify several of the steps in the model development and implementation However several questions remain including questions about the Ecospace module Ecospace has undergone several recent developments such as the inclusion of the spatial-temporal data layer framework (Steenbeek et al 2013) the habitat capacity model (Christensen et al 2014) and the Monte Carlo analysis including the diet matrix As yet there are few published studies using these latest Ecospace developments and their documentation and justification need to be improved in the EIS
5 PMV Response 2016-03-02 p 29 lines 446 - 464
Pacific Region Science Response Technical Review Assessing
Ecosystem Productivity Model of Roberts Bank
10
Questions also remain regarding how the Monte Carlo randomization routine treated diet data The report indicates that the Monte Carlo routine randomly selected input parameters from the input ranges and that only models that were balanced were used This suggests that a high proportion of models were not balanced and therefore were not used (for example the EIS indicates that about one out of 1000 sampled input parameters was balanced6) A table showing the minimum maximum mode average and median values from the Monte Carlo runs for all the parameters would enable an evaluation of how much variation was actually sampled by the balanced model runs This is recommended in the EwE user information ie ldquoUsers should check the range of the input parameters that were actually used in the trials in the output csv file (see below)rdquo7
In addition there are several issues with the documentation of the derivation of the parameters for the functional groups Such documentation should clearly outline how the input parameter was estimated and the range of uncertainty for that parameter For example the input biomass of pinnipeds was defined as 04 t km 2 derived from estimates of 034 for Harbour seals and two estimates for Steller sea lions (012 and 014 t km 2) No explanation was provided for how the overall estimated pinniped biomass of 04 t km 2 was determined The diet of Sand Lance was described in the EIS as consisting mostly of zooplankton8 whereas the diet table for the model runs9 included 20 macrofauna 10 green algae and 10 detritus It is unclear why these additional prey were included in the diet used for the model runs
334 Highly mobile functional groups This implementation of the EwE framework included transient and migratory functional groups This is entirely appropriate and these groups cannot be excluded The approach taken in the Ecospace module was to impose a low (and conservative) dispersal rate among model spatial units (lsquopixelsrsquo) of 1 km yr-1 This may be appropriate for low mobility benthic organisms but it likely underestimates the movements of many other functional groups The effects of using higher and perhaps functional-group-specific dispersal rates was not considered The Proponents argued that higher dispersal rates would reduce impacts since species can move away from less desirable areas more quickly for completeness these runs should be done and evaluated Mobile species will also bring energy (food) captured outside the system into the modelled ecosystem This process was included in the model with the use of a diet import factor reflecting the consumption of prey outside the modelled region with the assumption that groups with high import rates were unlikely to respond to local changes on Roberts Bank10 This assumption needs justification perhaps at the functional group level for example many species of highly migratory birds and Pacific salmon use the Roberts Bank ecosystem to obtain food to continue their migrations Although this food does not compose a large fraction of their annual consumption it can be critical to enable them to continue their migrations
The EwE model is not designed to capture differences in prey quality ie differences in essential fatty acid or nutrient ratios The same species of prey may have greater or lesser nutritional value to predators depending on the conditions under which they are growing and their seasonal variations This is a particular concern with the nutritional quality of the diatom-dominated biofilm Diatomaceous biofilm is important to the highly migratory Western Sandpiper (Calidris mauri) Despite its predictive merits in relation to other ecosystem
6 EIS Appendix 10D Section 24 p5 7 EwE Help file p 151 8 EIS Appendix 10B Section 4133 p 76 9 EIS Appendix A of Appendix 10B 10 PMV Response 2016-03-02 p 28 lines 429 - 436
Pacific Region Science Response Technical Review Assessing
Ecosystem Productivity Model of Roberts Bank
11
components the EwE model is not informative with respect to understanding the potential impacts of the Project on biofilm and the Western Sandpiper While this example is specific to seabirds the potential exists for differences in the quality of biofilm to also be an issue for copepods which feed on biofilm and consequently to juvenile salmon which feed on these copepods (eg Sutherland et al 2013)
The EwE model is also not designed to predict effects of the Project on water quality although the Proponent noted that ldquoOther abiotic factors not included were deemed to be representative of variables that were already included in the modelhelliprdquo11 The Project may cause changes in physical and water quality conditions whether in isolation or in combination which may impact the productivity or nutritional quality of key prey organisms for local and migratory species which will not be captured by the model The EwE model does not assess the production of key nutrients or the implications of changes in important physical and water quality parameters to biofilm community structure and hence to important migratory birds
The model does not include biotic factors for both pelagic and benthic environments to assess the potential development of eutrophication and benthic organic enrichment events respectively Organic and redox indicators traditional measures of environmental assessments that are used to determine changes in functional group responses were included in the recent Deltaport Third environmental assessment (ie Pelagic chlorophyll dissolved nutrients Benthic sediment carbonnitrogen content redox state [sulfide concentration]) Benthic anoxic events based on organic enrichment are known to be strong drivers of community composition and exclusion regardless of substrate type In the absence of biotic factors (eg organic particulates) the model has not considered the potential for benthic organic enrichment which coincides with siltation processes within the upper tidal flats The tidal flat corner bordered by the Delta-dyke and Deltaport causeway has served as a catchment area for Fraser River silt since the development of the original Deltaport causeway (Sutherland et al 2013) The proposed position of the new terminal placed at the seaward termination of the Deltaport causeway may produce a crescent-shaped feature in the wake of the Fraser River Plume This feature may provide a more efficient silt trap that will promote benthic organic enrichment This piece of the environmental assessment seems to be missing and is important for assessing fish habitat in this area
335 Seasonality (model time step) Input data to parameterize the model were available on a range of time scales from hourly (eg physical data on salinity and water flow) to annual (eg species biomass) The Proponents indicated12 that this is a strength of the EwE model although ultimately the model was run with an annual time step with all sub-annual values being averaged to annual values This method therefore did not incorporate important seasonal processes such as winter-summer differences in salinity and storm properties and the seasonal appearances of abundances of predators and prey such as migratory salmon and birds that are much larger than the annual average For example juvenile salmon migrate from the Fraser River and onto Roberts Bank in the spring before moving into deeper waters If these spring abundances are averaged over the entire year these average abundances would be 5-10 times lower than the actual abundances during the spring (ie averaging the biomass that occurs in two months over a 12 month period) Additionally this method did not capture the intensity of processes such as growth and predation which can be focused over periods of a few weeks to a few months There may be important threshold effects at particular times and places which may be missed when using an 11 EIS Section 10 p 10-11 12 PMV Response 2016-03-02 p 86 line 1655
Pacific Region Science Response Technical Review Assessing
Ecosystem Productivity Model of Roberts Bank
12
annual time step for the model The Ecospace module has a monthly time step13 and therefore it is feasible to run this module with a sub-annual time step For example the Proponents submit14 that there are inadequate data to model the potential effects of the Project on the timing of biofilm production which could have implications for the migratory dunlin and Western Sandpiper However this could be modelled in an exploratory way to determine hypotheses about which factors could affect the timing of production of biofilm and the potential impacts on these birds These issues are of major concern to ECCC
336 Life history structure The EwE model did not separate functional groups into life history stages (stanzas) yet for many functional groups the juvenile stages can have very different life history characteristics and habitats than the adults It is unclear in the description of the model how different life history structures were considered and whether for example there were enough juveniles to produce the adults The implications of not including early life stages should be explored at least qualitatively to identify which species might have life stages that may be more vulnerable to project effects
337 Model balancing Balancing an EwE model is the process by which parameters are adjusted so that there is sufficient production for consumption requirements ie there are sufficient prey for all predators Expert opinion was used to examine parameter values and to adjust for errors or inconsistencies in logic ldquoPMV is confident that since the approach taken to balance the model was based on best practices the steps are appropriaterdquo15 Adjustments to initial parameters to ensure an ecologically-feasible model are necessary and to be expected For a few functional groups however very large changes to initial parameter estimates (which were often not based on Roberts Bank specific data) were necessary for example to transient killer whales When such initial parameters were adjusted (often by substantial amounts) by expert opinion to balance the model the confidence intervals around these adjusted parameter values were not increased to reflect this added uncertainty (see for example PMV Response 2016-03-02 p 51 lines 955-956) When expert opinion was used to make very large changes to initial parameter values broader confidence intervals about these parameters should have been applied This does not appear to have been the case and as a consequence may cause the actual uncertainty of the model outputs to be underestimated
Another example is for the pinniped group in which 50 of the diet was assumed to come from outside the model area in order to balance the model The rationale provided was ldquoThe pinnipeds caused excessive predation mortalities on numerous fish functional groups The biomass of pinnipeds was an average for the Strait of Georgia which was likely too high for Roberts Bank Therefore it was assumed that pinnipeds extracted only half of their diet from the study areardquo16 It is unclear whether the sensitivity of the model to different percentages of diet allocation was explored
As noted above (332) the Ecopath model was relatively unconstrained and few adjustments to input parameters were required to balance the model This is unusual and the low ecotrophic efficiencies of several functional groups suggest that full accounting of energy flows may not have been achieved (an ecotrophic efficiency of 1 indicates that 100 of the production of that
13 EIS Appendix 10C Section 29 p24 14 EIS Appendix 10D Appendix C p72 15 PMV Response 2016-03-02 p 49 lines 910-912 16 EIS Appendix 10C Section 261 p 20
Pacific Region Science Response Technical Review Assessing
Ecosystem Productivity Model of Roberts Bank
13
particular group is being preyed upon or removed by fishing leaving no individuals to die of old age17) An ldquoexcessrdquo of individuals dying of old age ie ecotrophic efficiencies much less than 1 suggests a potentially large biomass that is not used by the ecosystem and instead is converted to detritus
34 Model validation Model validation is the process by which the model parameters variables and outputs are compared with those from the real ecosystem to ascertain how well the model represents the ecosystem It is an essential step in providing confidence that the projections from the model in this case with and without the Project have relevance to how the real ecosystem may be expected to function with and without the Project In practice validating complex ecosystem models is difficult considering the range of assumptions that must be made when building the model the limited available data and natural variability of the ecosystem at a variety of time and space scales
Many of the standard diagnostics for the Ecopath model have not been evaluated in the EIS The Proponent appears to have assumed that once the Ecopath model was balanced then it was valid and fit for purpose The Proponent should provide all the Ecopath estimates of vital rates including mortality rates As presented questions remain For example many Ecotrophic Efficiencies (which control the transfer of biomass from prey to predators) are less than 1 even for taxa which would be expected to be close to 1 such as carnivorous zooplankton The reason for Ecotrophic Efficiencies less than 1 were not discussed or explained in the EIS
Detailed diagnostics for the Ecospace model should also be presented in order to evaluate model performance In response to criticisms by DFO ECCC and NRCan in discussions with the Proponent the latter provided the biomass of the functional groups from the Ecopath model (before Ecospace) and the Ecospace model after the spin-up period (which involved adjusting the parameters from the Ecopath model to balance the 5468 separate cells of the Ecospace model)18 The Proponents argue that ldquoIt is important to note that changes in biomass values generated during the spin-up period are identical for both with and without Project scenarios and thus do not provide information on the potential Project-related effects on productivity19 However several changes to biomass result from the Ecospace balancing process (spin-up period) This is only given brief attention by the Proponent in its response to the DFO ECCC and NRCan questions An analysis of Table 620 revealed that the biomass of 9 functional groups was larger or smaller than the widest confidence limits allowed for each group21 This requires further discussion and justification
The Proponent used a goodness of fit measure to compare spatial distributions of model outputs with field observations They indicated that ldquono other EwE models were identified which use a goodness-of-fit measure Hence the RB model is potentially the first such EwE model where a goodness of fit measure has been appliedrdquo22 The chosen goodness of fit measure is the percent correct classification (PCC) method23 This method derives a test statistic based on the proportion of locations at which predicted occurrences from the model match observed
17 EIS Appendix 10-B p 11 18 PMV Response 2016-03-02 p 65-66 Table 6 19 PMV Response 2016-03-02 p 64 lines 1205-1207 20 PMV Response 2016-03-02 p 65-66 Table 6 21 PMV Response 2016-03-02 p 45 Table 3 22 PMV Response 2016-03-02 p 78 lines 1481-1483 23 PMV Response 2016-03-02 p 78 lines 1483-1484
Pacific Region Science Response Technical Review Assessing
Ecosystem Productivity Model of Roberts Bank
14
occurrences from data and similarly with predicted and observed absences The Proponent then calculated two additional accuracy of fit measures sensitivity (the model predicts a species to occur in an area where it is known to occur in reality) and specificity (the model predicts a species does not occur in an area it is known not to occur in reality)24 This analysis concluded that the model has high predictability for functional groups such as eelgrass and sea pens with relatively static distributions but lower predictability for functional groups which are more temporally and spatially dynamic such as biofilm and green algae25
There are two problems with this approach The first is that this goodness of fit comparison was done only for habitat-forming functional groups no discussion of how well this analysis applies to mobile functional groups was provided The second problem is that this method does not take into account situations (such as occurs in this study with several groups) in which species occur at only a few locations For example ldquohellipif the test data consist of 95 absences and 5 presences and this reflects the true prevalence of the species on the landscape (a realistic scenario for a rare species) a lsquonullrsquo model that predicted absence in all cases (eg no model at all) would be correct 95 of the timehellipldquo (Franklin 2009 p 151) This latter point is important here as these habitat functional groups (biofilm brown algae native eelgrass green algae Japanese eelgrass tidal marsh biomat and orange sea pens26) appear not to occur over most of the Project area (as portrayed by the model outputs presented in the distribution figures of PMV Response 2016-03-02 Appendix 218) It is therefore important that a robust evaluation of the performance of the Ecospace module is used with preferably more than one measure
In summary the starting point for this modelling analysis matters It is not just about a comparison between results with and without the Project The model has to be considered a sufficient representation of the ecosystem The Proponent has not yet sufficiently validated the model
35 Model results 351 Presentation of model results
As noted above (Section 331) the stated objective of the Roberts Bank ecosystem model was not to provide an assessment of Project impacts for each functional group at a fine temporal scale but to estimate changes in productive potential with and without the Project at the ecosystem level27 However results were presented as comparisons by speciesfunctional group with and without the Project and not as potential changes in total ecosystem productivity The revised figures for each functional group showing distributions without the Project with the Project and their difference indicated impacts were likely to be localized with overall impacts relatively small The range of biomass ratios with and without the Project was 045 ndash 189 with most values slightly less than 1 This is interpreted as indicating slight decreases in the capacity of the study area to support biomass and production with the Project for many functional groups28 (Figure 2)
24 PMV Response 2016-03-02 p 80 lines 1524-1527 25 PMV Response 2016-03-02 p 81 lines 1551-1559 26 PMV Response 2016-03-02 p 82 Table 8 27 PMV Response 2016-03-02 p 99 lines 1914-1917 28 PMV Response 2016-03-02 Appendix 218
Pacific Region Science Response Technical Review Assessing
Ecosystem Productivity Model of Roberts Bank
15
Biomass Ratio
Freq
uenc
y
04 07 10 13 16 19
05
1015
2025
30
Figure 2 Histogram of biomass ratios obtained by comparisons of model runs with and without the project (ie With Without) Values less than 1 indicate reductions in biomass with the Project compared against without the Project) Data from Appendix 218 of PMV Response 2016-03-02
352 Sensitivity and vulnerability analyses Every ecosystem model is only one possible representation of the true ecosystem defined by the modelrsquos structure and the values chosen for its many parameters The key point is how well the model represents the real system how that fit can be measured and the sensitivity of model outputs to variability in the selected parameter values The ideal model should be robust to a wide range of uncertainties in the input data and parameters This robustness is determined by performing sensitivity analyses on the model to see how it responds to variations in the input parameters and determining to which input parameters the model is most sensitive
The vulnerability parameters determine the strength of the feeding interactions between functional groups They set the level of density dependence of each functional group Higher vulnerability settings provide greater top-down (predator) control whereas lower settings provide greater bottom-up (environmental) control29 Several publications have shown that EwE models are very sensitive to the vulnerability parameters and Christensen and Walters (2000) point out that a main pitfall of EwE is that ldquopredation vulnerabilities are often underestimated lessening the modelled impacts of predationrdquo It is usual practice to tune Ecopath models including the vulnerability parameters to time series data such as biomass using the temporal simulation model Ecosim However these data were not available for the RBT2 area so this robust method of fitting the model and estimating vulnerability parameters was not possible Instead a vulnerability setting of 2 was used as the default value for the key model runs which is ldquocommon practice when time series data are not available and estimates of vulnerability in the
29 PMV Response 2016-03-02 p 70 lines 1318-1323
Pacific Region Science Response Technical Review Assessing
Ecosystem Productivity Model of Roberts Bank
16
model cannot be maderdquo30 with sensitivity analyses run for a range of 15 to 3 This narrow range was criticized by DFOECCC in initial discussions about the model with the Proponent The Proponent subsequently reran the model with a larger range of vulnerabilities31 (11 to 10) and concluded this broader vulnerability range produced similar results for the productivity ratio with and without the Project to those in the original EIS and that the EIS was more likely to overestimate than underestimate potential project effects32 The data in Table 7 of the PMV Response33 did indicate changes in productivity ratios ranging from 0 to 50 of the defined key run (which used a vulnerability setting of 2) However the Proponent changed all vulnerability settings to the same value ie all were 2 or all were 10 etc In reality the vulnerability parameters resulting from Ecosim models that are fitted to data as described above vary by functional group which was not explored here Therefore although the results suggest that the original choice of 2 for the default key run seemed reasonable the potential effects of variability in vulnerability settings was not fully explored
Sensitivity analyses are usually based on the range of uncertainty estimated for input data and parameters often called the confidence limits around the model parameters The EwE framework integrates many different data sources and parameters including values from the literature It can therefore be difficult to identify ldquoreasonablerdquo confidence limits when derived from such diverse data sources Standard practice in Ecopath models has been to develop a pedigree for each parameter with default values for uncertainty based on the nature of the source data For example parameter values based on high precision field observations of biomass within the model domain receive default confidence intervals of 10 whereas parameter values based on models developed for elsewhere or professional judgment receive confidence intervals of 8034 Sensitivity analyses are then run using parameter values selected from within these confidence intervals However if these default confidence intervals do not capture the full range of variability then the outputs are not informative of the variability in the lsquorealrsquo ecosystem Field observations were collected for many functional groups within the model domain in 2012 and 2013 as part of studies to support the RBT2 EIS Apparently the purpose of these observations was to document spatial variability (in part for the Ecospace model) and temporal variability (measurements at one location over time) and not to derive confidence intervals around the observations35
The reliance on the pedigree approach to derive confidence intervals for this Roberts Bank model was criticized by DFO ECCC and NRCan in discussions with the Proponent As a result the Proponent reran the model with much larger confidence intervals ranging from 30 to 100 depending on the input parameter and functional group36 The results from this new analysis using the broader confidence intervals were similar to those using the original pedigree approach The Proponent noted that ldquoWhile the production within each helliprun was very different there was little difference in the biomass ratio [with and without the Project] These results further demonstrate that even with a greater range in input values the influence of the Project on the Roberts Bank ecosystem is consistent among allhellipmodel runsrdquo37 This provides confidence that the model may be robust to uncertainty in its input parameters Two concerns
30 PMV Response 2016-03-02 p 70 lines 1321-1322 31 PMV Response 2016-03-02 p 71-74 32 PMV Response 2016-03-02 p 71 lines 1339-1341 33 PMV Response 2016-03-02 p 73 34 EIS Appendix 10-C Section 251 page 18 35 PMV Response 2016-03-02 p 42 lines 772-777 36 PMV Response 2016-03-02 p 44-47 37 PMV Response 2016-03-02 p 47 lines 855-858 and see also PMV Response 2016-03-02 Appendix 27-B
Pacific Region Science Response Technical Review Assessing
Ecosystem Productivity Model of Roberts Bank
17
remain however The quote above indicates that the production among the different model runs was very different although with little difference in the biomass ratios with and without the Project Since biomass is not the same as production it would be informative for understanding model performance and potential impacts to show these production differences This also relates to the point made in Section 34 regarding how well the model represents the real ecosystem and not just within-model comparisons with and without the Project The second question is more technical and relates to how the randomization (Monte Carlo or MC) routine that was used to create multiple model runs used the uncertainty about the diet data Diets are not currently included in the MC routine available to regular users of the Ecosim model how they were handled in this RBT2 model appears not to be explained
Finally the sensitivity analyses indicate that the uncertainty in the input parameters does not lead to much difference between model parameters with or without the project However this conclusion does not describe how the uncertainty in the input parameters affects understanding of the ecosystem
40 Conclusions Overall the main conclusion of the Environmental Impact Statement from the Proponent is stated as ldquohellipafter the implementation of mitigation hellipthe Project is not expected to result in any significant adverse effects on any of the 16 valued componentsrdquo38 In addition ldquohellipapproximately 40 of the functional groups are forecast to change no more than 5 which hellip is judged to be within the uncertainty of the model runsrdquo39 although larger changes were forecast for orange sea pens freshwater biofilm green algae and raptors The conclusions from the modelling studies are that ldquohellipthe proposed project will have an impact on the study area that the effect varies between species and that the findings are robust to parameter uncertaintyrdquo40 Specific outcomes by valued component as derived from the EwE model are presented by functional groups in Table 1
38 PMV March 2015 Roberts Bank Environmental Impact Statement Executive Summary ndash Part 1 page 37 39 EIS Appendix 10-C p ii 40 EIS Appendix 10-D p iv
Pacific Region Science Response Technical Review Assessing
Ecosystem Productivity Model of Roberts Bank
18
Table 1 Changes in productive potential with the Project as derived from the EwE model
Changes in productive potential
Ecosystem category
Number of valued
components
Number with potential
biomass loss
Moderate decrease (31-60 decline)
Minor decrease (6-30 decline)
Negligible (0-5
change)
Minor increase (6-
30 increase)
Moderate increase (31-60 increase)
Source
Marine vegetation
7 7 - 3 2 2 - EIS Vol 3 Section 11 Table 11-17 page 11-65
Marine invertebrates
4 3 1 1 1 1 - EIS Vol 3 Section 12 Table 12-8 page 12-52
Marine fish 13 13 - 2 6 5 - EIS Vol 3 Section 13 Table 13-10 page 13-95
Coastal birds
11 8 - 3 4 3 1 EIS Vol 3 Section 15 Table 15-10 page 15-67
Pacific Region Science Response Technical Review Assessing
Ecosystem Productivity Model of Roberts Bank
19
Most functional groups showed some potential biomass loss with the Project with biomass loss defined as any model run with negative outcomes (ie in which biomass with the project was less than biomass without the Project) The summary of changes in productivity potential are mixed with most (33 out of 35) valued components showing minor decreases to minor increases (defined as 6 to 30 changes in productive potential with the Project compared to without the Project)
The main conclusions of this review in regards to the Terms of Reference are
1 Do the functional groups and abiotic variables used in the model adequately represent the ecosystem at Roberts Bank
o The 58 functional groups and abiotic variables used in the model adequately represent the main components of the Roberts Bank ecosystem however for longer lived species the life stages of the species are not well represented and some of the impacts of the Project may be expected to affect specific life stages
o The abiotic variables adequately represent the physical drivers of this ecosystem on an annual time scale However annual values for these abiotic variables may not adequately capture important sub-annual events such as storms (DFO 2016) the timing of arrival and departure of highly migratory species and whether there may be important sub-annual thresholds or mismatches in timing as a result of the Project
o Biotic factors (eg nutrients) which are particularly important for biofilm and other lower trophic level taxa are not included in this model The model is therefore unable to assess the potential development of eutrophication and benthic organic enrichment events which may affect fish habitats in the study area
2 Are the parameter estimates used by the model valid and defensible for this system
o In general parameter estimates appear to be adequate for this system Field studies were done in two years to provide data in particular on distributions of selected functional groups for the Ecospace module Note the distribution studies focussed on taxa which were relatively immobile and therefore lsquofixedrsquo in space
o the selection of some model parameters would benefit from further explanation for example the choice of fixed diet matrices versus dynamic matrices which can vary with changes in abundances or predators and prey
o the selection of some model parameters would benefit from further explanation for example the link between the diets described in the text of Appendix 10B and the quantities presented in Appendix A of Appendix 10B It is understood that proportions were derived using the ldquofixed selectivityrdquo principle but in order to be fully transparent the derivation of each diet should be provided in an appendix
o discussion and explanation is needed of why ecotrophic efficiencies differ from expected values (eg the ecotrophic efficiency for Pacific herring is listed as 038) and
o the abiotic factor lsquosubstratersquo was limited to ldquohardrdquo or rdquosoftrdquo options which can be restrictive given that they serve as endpoints on a substrate composition continuum These limited options may not provide the sensitivity required to assess substrate preference nor the flexibility for taxa (eg motile organisms) that span hard mixed and soft substrate types In addition it is not clear if changes in the hardsoft categories were considered over time within identified depositional or erosional settings before and after construction
Pacific Region Science Response Technical Review Assessing
Ecosystem Productivity Model of Roberts Bank
20
3 Are the limitations and uncertainties of the model identified and appropriately considered when determining the modelrsquos representation of current and possible future conditions
o the EwE model was not designed to evaluate a range of future conditions It was designed to estimate changes in the productive potential at the ecosystem level with and without the Project Therefore the model was run without the Project and with the Project for a range of plausible abiotic conditions and the results were compared with respect to biomass and productivity by functional group
o the pedigree approach to assessing the uncertainties of model outcomes is unsatisfactory for the purpose here as it relates solely to a qualitative judgment of the value of data based on its source However when the model was rerun with much wider ranges of confidence intervals (uncertainties) the results in general (but not necessarily for each functional group) were similar to the results using the original pedigree approach This suggests that taken overall the model may be robust to wide ranges of uncertainty in these input variables and parameters
o there is inadequate validation of the model This is inadequate for three reasons
(i) the basic Ecopath model is not validated and the Ecospace balancing process (the spin-up period) resulted in some biomass estimates being increased or decreased beyond their confidence limits
(ii) the goodness of fit test used to evaluate how well the model predicted the spatial occurrence functional groups is not fit for purpose (Section 34) and
(iii) validation was provided for only a small number of functional groups (the habitat-forming functional groups) As a consequence the model is currently not validated
o Considering the proportion of open boundaries relative to closed boundaries in the model processes taking place outside the modelled ecosystem are likely to contribute to dynamics within the modelled ecosystem However these external processes may not be well-resolved by the EwE model as currently configured
4 Are the model results related to the potential effects of the Project on fish and fish habitat and migratory birds and their food resources valid and defensible
o this is a very complex ecosystem model constructed for a relatively small and open (in the sense of considerable exchange with adjacent non-modelled areas) system Many assumptions have been made based on poor or missing data Taking all these considerations into account the model does the best job possible of comparing the biomass and productivity of the Roberts Bank ecosystem with and without the Project
o the extent to which the model adequately represents the lsquorealrsquo ecosystem of Roberts Bank as opposed to comparisons of model results with and without the Project is unclear as a number of basic diagnostics are not presented (see point 3 above)
o the EwE model is not capable of and is not designed to represent nutritional and food quality variations in prey functional groups and how these may impact highly migratory predators such as birds with and without the Project
5 Is the EwE model framework a valid method to quantify large scale impacts to fish habitat fish productivity and migratory bird productivity
o the EwE model as implemented in this project and reviewed here is a useful first-order framework to organise information and derive initial estimates of how the system may respond to perturbations
Pacific Region Science Response Technical Review Assessing
Ecosystem Productivity Model of Roberts Bank
21
o the utility of a EWE model for impact purposes is highly dependent on the quality of input data
o each EwE model is highly dependent on local conditions Although appropriate as an overall methodology each application would need to be reviewed for how it may be applied to any new ecosystem and
o the EwE model would need to be substantially reformulated if it was to include considerations of changes in chemical composition or food quality of prey in particular for seasonal migratory species such as birds which may depend on very large biomasses of prey with specific chemical composition to fuel their migrations beyond the ecosystem model boundaries
Contributors Contributor Affiliation Ian Perry Author DFO Science Pacific Region Alida Bundy Author DFO Science Maritimes Region Terri Sutherland Author DFO Science Pacific Region Robert Elner Author ECCC Canadian Wildlife Service Andrew Robinson Author ECCC Canadian Wildlife Service Lesley MacDougall Editor DFO Science Pacific Region
Approved by Carmel Lowe
Regional Director Science Branch Pacific Region Fisheries and Oceans Canada
November 4 2016
Sources of Information Christensen V Coll M Steenbeek J Buszowski J Chagaris D walters CJ 2014
Representing variable habitat quality in a spatial food web model Ecosystems 17 1397-1412
Christensen V and Walters C 2000 Ecopath with Ecosim methods capabilities and limitations Ecological Modelling 172 109-139
Colleacuteter M Valls A Guitton J Gascuel D Pauly D and Christensen V 2015 Global overview of the applications of the Ecopath with Ecosim modeling approach using the EcoBase models repository Ecological Modelling 302 pp42-53
Compass Resource Management Ltd 2013 Roberts Bank Terminal 2 Technical Advisory Group (TAG) Process Report Productive Capacity ndash Final Report 119pp (Accessed November 1 2016)
DFO 2016 Technical Review of Roberts Bank Terminal 2 Environmental Assessment Section 95 ndash Coastal Geomorphology DFO Can Sci Advis Sec Sci Resp 2016045 (Accessed November 4 2016)
Pacific Region Science Response Technical Review Assessing
Ecosystem Productivity Model of Roberts Bank
22
ESSA Technologies 2014a Roberts Bank Terminal 2 Project Roberts Bank Delta BC Environmental Impact Statement Volume 3 Biophysical Effects Assessments Appendix 10-C Roberts Bank Ecosystem Model Development and Key Run Port Metro Vancouver (Accessed November 1 2016)
ESSA Technologies 2014b Roberts Bank Terminal 2 Project Roberts Bank Delta BC Environmental Impact Statement Volume 3 Biophysical Effects Assessments Appendix 10-D Roberts Bank Ecosystem Model Sensitivity Analyses Port Metro Vancouver (Accessed November 1 2016)
Franklin J 2009 Mapping Species Distributions Spatial Inference and Prediction Cambridge University Press Cambridge
Hemmera 2014 Roberts Bank Terminal 2 Project Roberts Bank Delta BC Environmental Impact Statement Volume 3 Biophysical Effects Assessments Appendix 10-B Roberts Bank Ecosystem Model Parameter Estimates Port Metro Vancouver File 302-03503 (Accessed November 1 2016)
Port Metro Vancouver 2015a Roberts Bank Terminal 2 Project Roberts Bank Delta BC Environmental Impact Statement Volume 3 Biophysical Effects Assessments Section 100 Biophysical Setting (Accessed November 1 2016)
Port Metro Vancouver 2015b Roberts Bank Terminal 2 Project Roberts Bank Delta BC Environmental Impact Statement Volume 3 Biophysical Effects Assessments Section 103 Overview of Assessing Ecosystem Productivity (Accessed November 1 2016)
Port Metro Vancouver 2015c Roberts Bank Terminal 2 Project Environmental Assessment Additional Information Requirements (July 31 2015) Responses Response to Information Request 6 IR-73115-06 Canadian Environmental Assessment Agency Reference Number 80054 dated 26 October 2015
Steenbeek J Coll M Gurney L Meacutelin F Hoepffner N Buszowski J and Christensen V 2013 Bridging the gap between ecosystem modeling tools and geographic information systems Driving a food web model with external spatialndashtemporal data Ecological Modelling 263 139ndash 151
Sutherland T Elner R and OrsquoNeill J 2013 Roberts Bank Ecological crucible of the Fraser River estuary Progress in Oceanography 115 171ndash180
Vancouver Fraser Port Authority 2016 From the Vancouver Fraser Port Authority to the Review Panel re Answers to preliminary technical questions submitted during the completeness phase from Fisheries and Oceans Canada Natural Resources Canada and Environment and Climate Change Canada concerning the ecosystem modelling to support the Roberts Bank Terminal 2 Project environmental review CEAR Document 547 (Accessed November 1 2016)
Pacific Region Science Response Technical Review Assessing
Ecosystem Productivity Model of Roberts Bank
23
This Report is Available from the Centre for Science Advice
Pacific Region Fisheries and Oceans Canada
3190 Hammond Bay Road Nanaimo BC V9T 6N7
Telephone (250) 756-7208 E-Mail csapdfo-mpogcca
Internet address wwwdfo-mpogccacsas-sccs
ISSN 1919-3769 copy Her Majesty the Queen in Right of Canada 2016
Correct Citation for this Publication
DFO 2016 Technical review of Roberts Bank Terminal 2 environmental assessment section 103 ndash assessing ecosystem productivity DFO Can Sci Advis Sec Sci Resp 2016050
Aussi disponible en franccedilais
MPO 2016 Examen technique de leacutevaluation environnementale du Terminal 2 agrave Roberts Bank section 103 ndash eacutevaluation de la productiviteacute de leacutecosystegraveme Secr can de consult sci du MPO Reacutep des Sci 2016050
- TECHNICAL REVIEW OF ROBERTS BANK TERMINAL 2 ENVIRONMENTAL ASSESSMENT SECTION 103 ndash ASSESSING ECOSYSTEM PRODUCTIVITY
-
- 10 Context
- 20 Background
-
- 21 Background and Terms of Reference
- 22 Approach to assessing ecosystem productivity
-
- 30 Analysis and Response
-
- 31 The EwE Team
- 32 Overview of assessment results of hydrological and sediment modelling
- 33 Model implementation
-
- 331 The purpose of the EwE model
- 332 Applicability of the EwE model framework to the Roberts Bank region
- 333 Model documentation
- 334 Highly mobile functional groups
- 335 Seasonality (model time step)
- 336 Life history structure
- 337 Model balancing
-
- 34 Model validation
- 35 Model results
-
- 351 Presentation of model results
- 352 Sensitivity and vulnerability analyses
-
- 40 Conclusions
- Contributors
- Approved by
- Sources of Information
- This Report is Available from the
-
- CSAS 2016-50 - Assessing Ecosystem Productivitypdf
-
- TECHNICAL REVIEW OF ROBERTS BANK TERMINAL 2 ENVIRONMENTAL ASSESSMENT SECTION 103 ndash ASSESSING ECOSYSTEM PRODUCTIVITY
-
- 10 Context
- 20 Background
-
- 21 Background and Terms of Reference
- 22 Approach to assessing ecosystem productivity
-
- 30 Analysis and Response
-
- 31 The EwE Team
- 32 Overview of assessment results of hydrological and sediment modelling
- 33 Model implementation
-
- 331 The purpose of the EwE model
- 332 Applicability of the EwE model framework to the Roberts Bank region
- 333 Model documentation
- 334 Highly mobile functional groups
- 335 Seasonality (model time step)
- 336 Life history structure
- 337 Model balancing
-
- 34 Model validation
- 35 Model results
-
- 351 Presentation of model results
- 352 Sensitivity and vulnerability analyses
-
- 40 Conclusions
- Contributors
- Approved by
- Sources of Information
- This Report is Available from the
-
Canadian Science Advisory Secretariat Pacific Region Science Response 2016050
December 2016
TECHNICAL REVIEW OF ROBERTS BANK TERMINAL 2 ENVIRONMENTAL ASSESSMENT SECTION 103 ndash
ASSESSING ECOSYSTEM PRODUCTIVITY
10 Context Vancouver Fraser Port Authority (VFPA) formerly Port Metro Vancouver (the Proponent) is proposing to construct and operate the Roberts Bank Terminal 2 Project (the Project) a new three-berth marine container terminal at Roberts Bank in Delta British Columbia The proposed terminal is located next to the existing Deltaport and Westshore Terminals In addition to the construction of the new terminal the Proponent has proposed to widen the north side of the existing Roberts Bank causeway from its east-end connection with the mainland to the entrance to the new terminal The existing tug basin connected to the northeast side of Deltaport Terminal is also proposed to be expanded The new marine terminal is predicted by the Proponent to process up to 260 container ship calls per year at full capacity with the assistance of two or three large berthing or escort tugs to manoeuver ships into or away from assigned berths The terminal is designed to operate 24 hours per day year-round
The Roberts Bank Terminal 2 Project is subject to an environmental assessment by a Review Panel pursuant to the Canadian Environmental Assessment Act 2012 As a federal authority in the environmental assessment for the Project Fisheries and Oceans Canada (DFO) will be asked to present information to the review panel and at public hearings in relation to its expertise on the effects of the Project on fish and fish habitat including aquatic species at risk and the adequacy of mitigation and offsetting measures and monitoring and follow-up programs proposed by the Proponent DFOrsquos Pacific Region Fisheries Protection Program (FPP) will coordinate DFOrsquos participation in the environmental assessment
The Proponent assessed future ecosystem productivity at Roberts Bank using the Ecopath with Ecosim and Ecospace (EwE) model framework The potential impacts of the Project to hydrodynamic conditions and sediment transport in the area as a result of changes in wind wave and current patterns and intensities are projected using different model frameworks A companion Science Response (DFO 2016) has been developed by DFO and Natural Resource Canada (NRCan) to review Section 95 ldquoCoastal Geomorphologyrdquo of the Environmental Impact Statement (EIS) which describes the hydrodynamic and sedimentology models that were used to evaluate the effect of the Project on water and sediment movements
Outcomes of the EwE models are incorporated into the analysis of the potential project-related effects on the ongoing productivity of commercial recreational and Aboriginal fisheries Consequently DFO FPP has requested that DFO Science Branch provide an evaluation of the Proponentrsquos characterization of project-related effects as conducted using the Ecopath with Ecosim and Ecospace (EwE) ecosystem model
Pacific Region Science Response Technical Review Assessing
Ecosystem Productivity Model of Roberts Bank
2
The objectives for this Science Response are to
1 Determine if the functional groups and abiotic factors used in the model adequately represent the ecosystem at Roberts Bank
2 Assess whether the parameter estimates used by the model are valid and defensible for this system
3 Assess whether the limitations and uncertainties of the model are identified and appropriately considered when determining the modelrsquos representation of current and possible future conditions
4 Provide advice regarding whether the model results related to the potential effects of the Project on fish and fish habitat and migratory birds and their food resources are valid and defensible
5 If possible provide advice regarding the validity of using the EwE model framework to quantify large scale impacts to fish habitat and fisheries productivity and the productivity of migratory birds
This Science Response evaluates Section 100 ldquoBiophysical Settingrdquo with a focus on Section 103 ldquoOverview of Assessing Ecosystem Productivityrdquo in the EIS as submitted by the Proponent (Port Metro Vancouver 2015) This Section and consequently this Response describes the ecosystem modelling approach that was taken to evaluate the direct and indirect effects of the footprint of the proposed terminal and widened causeway herein referred to as lsquothe Projectrsquo This ecosystem model provides outputs related to potential effects of the project on the study area at an ecosystem level including aquatic species and bird species in the Project area Evaluation of the model and its outputs therefore required expertise in both fishery aquatic species and migratory bird species Consequently this Science Response is the product of a joint review between DFO and Environment and Climate Change Canada (ECCC) Canadian Wildlife Service and Wildlife and Landscape Science to provide a complete evaluation
This Science Response Report results from the Science Response Process of July 2016 on the Technical Review of Ecopath with Ecosim and Ecospace (EwE) Ecosystem Productivity Model application to the Roberts Bank Terminal 2 Environmental Assessment
20 Background
21 Background and Terms of Reference The Projectrsquos main components have a proposed combined marine footprint area of approximately 179 km2 listed below by specific component
bull Marine Terminal 1335 km 2 including terminal (116 km 2) and dredged berth pocket and marine approach areas (0174 km 2)
bull Widened Causeway 0424 km 2
bull Expanded Tug basin 0031 km 2
Roberts Bank in the Fraser River estuary consists of complex intertidal and subtidal habitats including intertidal eelgrass beds and is an important stopover area for migrating shorebirds and productive feeding and rearing habitats for many fish and invertebrate species It also provides habitat for endangered Southern Resident Killer Whales and other marine mammals
Pacific Region Science Response Technical Review Assessing
Ecosystem Productivity Model of Roberts Bank
3
The environmental conditions at Roberts Bank are dynamic and are influenced by a variety of oceanographic and atmospheric factors including the Fraser River freshwater and sediment plume discharge diurnal tidal currents and prevailing and storm-generated wind and wave activity In addition the intercauseway region provides significant drainage from marsh and agricultural areas which have different characteristics from marine waters and which run along the ferry causeway
To provide the required science advice this Science Response focusses on Section 10 ldquoBiophysical Settingrdquo of the Environmental Impact Statement (EIS) (Port Metro Vancouver 2015a) specifically Section 103 ldquoOverview of Assessing Ecosystem Productivityrdquo (Port Metro Vancouver 2015b) and its related Appendices 10-B ldquoRoberts Bank Ecopath with Ecosim and Ecospace model parameter estimatesrdquo (Hemmera 2014) Appendix 10-C ldquoRoberts Bank Ecosystem model development and key runsrdquo(ESSA Technologies 2014a) and Appendix 10-D ldquoRoberts Bank Ecosystem model sensitivity analysesrdquo (ESSA Technologies 2014b) Additional important information was obtained from the Response to Information Request 6 (IR-73115-06 Canadian Environmental Assessment Agency Reference Number 80054 dated 26 October 2015) (Port Metro Vancouver 2015c) and the Written Responses to Coastal Geomorphology and Ecosystem Modelling Questions provided by the Proponent to DFO ECCC and NRCan on 2 March 2016 (Port Metro Vancouver (PMV) Transmittal TRE-01-RBT2-0004A subsequently referred in this Science Response as ldquoPMV Response 2016-03-02rdquo) (Vancouver Fraser Port Authority 2016)
The process followed in preparing this Science Response involved an initial review of the submitted EIS followed by an in-person meeting of the Proponent its contractors and representatives of DFO ECCC and NRCan to discuss and clarify questions arising from the initial review (Vancouver 23 November 2015) DFO and NRCan provided written questions to the Proponent based on preliminary review of the EIS on November 19 2015 ECCC also provided written questions based on its preliminary review of the EIS to the Proponent on December 1 2015 and January 20 2016 This large initial meeting was followed by smaller focussed meetings between the Proponent its contractors and DFO and NRCan on 11 December 2015 to clarify hydrology and sediment modelling questions with DFO on 8 January 2016 to clarify ecosystem modelling questions and with ECCC on 18 February 2016 to clarify questions relating to birds Written responses to all of these meetings and questions were provided by the Proponent to DFO ECCC and NRCan as the ldquoPMV Response 2016-03-02rdquo and ldquoPMV Response 2016-05-30rdquo (Vancouver Fraser Port Authority 2016) VFPArsquos answers to questions posed by DFO and NRCan regarding coastal geomorphology modelling have been posted to the Canadian Environmental Assessment Registry (CEAR)
22 Approach to assessing ecosystem productivity The Proponent adopted an ecosystem approach to evaluate the direct and indirect effects of the Project on the productivity of the Roberts Bank ecosystem A weight of evidence approach was used to assess the potential effects of the project on the productivity of the ecosystem and selected key components in the study area this approach included a spatial ecosystem simulation model (which included a habitat capacity model) a shorebird opportunity model and empirical data An important point is that any effects on the system during the construction phase or from expansion of the tug basin were excluded from this modelling process the focus instead being a comparison of modelled system productivity before and after the proposed terminal and expanded causeway is in place The chosen ecosystem simulation model was
Pacific Region Science Response Technical Review Assessing
Ecosystem Productivity Model of Roberts Bank
4
Ecopath with Ecosim and its spatial version Ecospace (collectively referred to here as the EwE framework or EwE model) This modelling approach was recommended by a prior Productive Capacity Technical Advisory Group comprised of representatives of technical experts from government agencies academia non-governmental organizations Vancouver Fraser Port Authority and its consultants (Compass 2013) convened by the Proponent and which also recommended a selection of focal species for the model The final selection of functional groups and the resulting food web that form the core of this ecosystem model are shown in Figure 1
Pacific Region Science Response Technical Review Assessing
Ecosystem Productivity Model of Roberts Bank
5
Figure 1 Ecopath with Ecosim model food web for Roberts Bank (Adapted from EIS Volume 3 Section 10 Fig 1033 on page 10-16) The groups coloured in orange represent focal groups size of symbols represents relative annual amount of biomass in the Roberts Bank study area
Pacific Region Science Response Technical Review Assessing
Ecosystem Productivity Model of Roberts Bank
6
The EwE framework is a common approach to ecosystem modelling which has been developed and expanded over the past two to three decades It currently has three main components
1 Ecopath ndash the core model which provides a mass-balance snapshot of the system
2 Ecosim ndash a module that enables simulation modelling over time
3 Ecospace ndash a module that enables simulation modelling over space
In order to make an EwE model tractable species are aggregated into functional groups based on their similar ecological characteristics (habitat and prey preferences etc) the Roberts Bank models had 58 functional groups The first step (Ecopath) was to obtain input parameters representing biomass production consumption emigration and diet for each functional group These parameters were then tuned in an iterative process until the overall production and consumption was balanced (a mass-balance approach) resulting in a model food web with estimates of energy flow between functional groups (Fig 1)
In the second step Ecosim was combined with the spatial model Ecospace The abiotic variables selected in this EIS (depth salinity bottom current wave height sediment type) were used as external forcings to the Ecospace module These abiotic variables provided the physical forcings for the simulations without and with the Project Since time series data on the functional groups of the model were not available Ecospace was run until the model reached equilibrium using various assumptions of the value of the vulnerability parameter (see Section 352) In this EIS the selected time step was annual with all variables abiotic and biotic expressed as yearly averages As used in this EIS the Ecospace module included a habitat capacity model which estimated the distribution of functional groups based on their environmental preferences for each abiotic variable (depth salinity bottom current wave height) and for substrate type (sand mud etc) The model thus allocated the spatial distribution of functional groups over the model domain based on their environmental preferences and the distributions of these abiotic variables with and without the Project The selected spatial unit size (ldquopixelrdquo) for the Ecospace model was 100 m2 In essence an Ecopath model was constructed for each pixel with particular rules governing how the functional groups interacted and moved among these spatial units The Ecospace module was run until it approached equilibrium (20 model years) to establish the spatial patterns without the Project For the lsquowith the Projectrsquo simulations the model was run for an initial 10 years and then the spatial patterns of the abiotic variables with the project were added and the model run for an additional 10 years1 The model outputs predicted changes in the productive potential of the Roberts Bank ecosystem as a comparison (ratio) with and without the Project rather than an absolute biomass that would be lost or gained as a result of the Project
1 EIS Appendix 10-C p 26
Pacific Region Science Response Technical Review Assessing
Ecosystem Productivity Model of Roberts Bank
7
30 Analysis and Response To prepare this response the following sections of the EIS additional documents were reviewed
DocumentSection Title
EIS Section 10
Including appendices 10B 10C and 10D
(Port Metro Vancouver 2015a Hemmera 2014 ESSA Technologies 2014a ESSA Technologies 2014b)
Biophysical Setting
Appendix 10-B Roberts Bank Ecosystem Model Parameter Estimates Port Metro Vancouver File 302-03503
Appendix 10-C Roberts Bank Ecosystem Model Development and Key Run Port Metro Vancouver
Appendix 10-D Roberts Bank Ecosystem Model Sensitivity Analyses Port Metro Vancouver
CEAR document 547 (Including Appendices) ldquoPMV Response 2016-03-02rdquo and ldquoPMV Response 2016-05-30rdquo
(Vancouver Fraser Port Authority 2016)
Vancouver Fraser Port Authority to the Review Panel re Answers to preliminary technical questions submitted during the completeness phase from Fisheries and Oceans Canada Natural Resources Canada and Environment and Climate Change Canada concerning the ecosystem modelling to support the Roberts Bank Terminal 2 Project environmental review
31 The EwE Team Building this ecosystem model was a complex undertaking which required knowledge of the ecosystem to be modelled how to set initial parameter values determination of reasonable ranges of these parameters how to balance the model and how to recognize when the model outputs were unrealistic These tasks became even more complex when spatial model dynamics were involved such as with Ecospace The team engaged by the Proponent to conduct this ecosystem modelling for the Roberts Bank Terminal 2 (RBT2) EIS was led by scientists at the Institute for Oceans and Fisheries located at the University of British Columbia in Vancouver These scientists are global leaders of the EwE model framework having developed much of its current implementation and who continue to lead its elaborations and extensions Construction and running of the model for this specific ecosystem was done in collaboration with ESSA Technologies of Vancouver Parameter values for the ecosystem model were obtained in part from observational studies conducted in the area by Hemmera of Burnaby BC
32 Overview of assessment results of hydrological and sediment modelling Implementation of the ldquowith the Projectrdquo simulations of the ecosystem model was done by driving the model with the abiotic variables as they were projected to be distributed with the Project footprint In the context of this EIS specifying depth salinity bottom currents wave height and sediment type conditions without the Project and changes with the Project were achieved by construction of hydrodynamical and sediment transport models The outputs from these models in combination with the identified environment preferences for the various biological groups were then used as inputs to the Ecospace model to define the spatial
Pacific Region Science Response Technical Review Assessing
Ecosystem Productivity Model of Roberts Bank
8
distributions of these functional groups The implementation of these hydrological and sediment transport models in this EIS was reviewed by DFO and NRCan (DFO 2016) This review concluded that the implementation of these models for this EIS was adequate for average winter conditions but lacking in validation for summer conditions in particular with strong freshwater flows from the Fraser River Simulations of strong storm events and their impacts on wave conditions and sediment transport were also lacking The effect of wave action and current speeds on sediment transport is non-linear such that increasing winds over short periods of time can impact sediment transport processes bottom topography and water depths beyond that determined under average model conditions Overall the review concluded that a greater range of sensitivity analyses is required to have confidence in the model outputs under lsquonon-averagersquo conditions The implication of this conclusion for the present review of the EwE model is that the full range of variability of abiotic characteristics such as bottom topography bottom current and wave heights and how they may affect relevant functional groups in the model with the Project may not be adequately represented Sensitivity analyses were provided by varying the intensity of abiotic variables and by removing abiotic variables to assess their interactive effects In general the ecosystem model outputs were robust to these sensitivity analyses with most groups varying by less than 5 Larger changes however were observed for primary producer and bird groupings and for some fish groups when various abiotic variables were omitted2
33 Model implementation 331 The purpose of the EwE model
The EwE model was intended to provide one line of evidence to assess the potential impacts of the Project on the Roberts Bank ecosystem which would then be used with other lines of evidence to make the final assessment Specifically ldquohellip the objective of the RB [Roberts Bank] model was not to provide an assessment of Project impacts for each functional group at a fine temporal scale but to estimate changes in productive potential with and without the Project at the ecosystem levelrdquo3 In addition ldquohellipthe primary objective of the RB ecosystem model is to evaluate potential changes in productivity from such abiotic factors with and without the terminal and causewayrdquo4 Results are presented for the selected functional groups no results were presented on potential changes in ecosystem structure or function
332 Applicability of the EwE model framework to the Roberts Bank region EwE models work best when the exchanges within the system being modelled are greater than the exchanges between the modelled system and the lsquooutsidersquo world In practice this means that EwE models work best for larger systems with few external exchanges In a meta-analysis of 433 Ecopath models Colleacuteter et al (2015) concluded that ldquohellipin the last two decades the range of the models area has expanded toward very large areas and the median has shifted accordingly from about 1000 km2 in 1984ndash1993 to about 100000 km2 in 1994ndash2014rdquo The section of the Roberts Bank ecosystem that is included in the EwE model was comparatively small (5468 km2) and complex It is an intertidally-dominated environment that is subject to strong seasonal influences of both freshwater and marine exchanges across relatively large seaward and shoreward boundaries
2 EIS Appendix 10-D p ii - iii 3 PMV Response 2016-03-02 p 99 lines 1914-1917 4 PMV Response 2016-03-02 p 38 lines 689-691
Pacific Region Science Response Technical Review Assessing
Ecosystem Productivity Model of Roberts Bank
9
Processes taking place outside the modelled ecosystem will contribute to dynamics within the modelled ecosystem (eg lsquooutsidersquo food supporting predators which occur in the Roberts Bank ecosystem for only part of the year predators which may feed in the Roberts Bank ecosystem but export this energy when they migrate out of the region) but which may not be well-resolved by the EwE model The Proponent justifies the spatial scale because it was specifically chosen for the questions being asked in regard to assessing productivity changes and because the relative influences of external exchanges are assumed to be identical with and without the project In addition highly mobile species with broad prey bases were assumed in the model to be partially sustained by external energy from outside the model system5 The distributions of organisms may differ however with and without the project which may affect their interactions with areas outside of the modelled system and the use of diets from outside the modelled system may not reflect the impacts of the project Further clarification of how the EwE model captures the exchanges and interactions with adjacent ecosystems are needed For example it could be argued that an ecosystem which is open to frequent exchanges of water and organic matter from beyond its boundaries might be more robust to local disturbances such as the Project
There are some inconsistencies in the information and assumptions used for some of the taxa in this ecosystem model For Dungeness Crab the justification for estimating total adult biomass (including females) from the biomass of fished males is unclear In addition it is unclear if the slower growth of female crabs once they have reached sexual maturity in comparison with male crabs has been considered The diet matrix for spiny dogfish does not represent the actual diet well in particular of euphausiids herring and shrimp and there are more recent references for biomass estimates of spiny dogfish in the study area than what was used in the EIS
Fishing mortality was not included in the model under the assumption that this would not change with or without the project While this assumption may be true the model has been parameterized by ignoring a source of mortality that will influence total production In essence fishing removes biomass from the ecosystem with the result that less biomass will be available for higher trophic levels How this may impact the ecosystem with and without the Project is unclear but it could make noticeable differences if for example there were thresholds in the feeding responses by these higher trophic level species The Ecopath model that was used is relatively unconstrained since many ecological efficiencies are low even for forage species which would be expected to be higher It is not clear how many species are exploited or the levels of exploitation but even if this does not change with the Project these mortality rates should be included in the model in order to add realistic constraints to the exploited functional groups
333 Model documentation Based on questions from DFO ECCC and NRCan following their initial review of the EIS the Proponent provided written responses dated 2 March 2016 to clarify several of the steps in the model development and implementation However several questions remain including questions about the Ecospace module Ecospace has undergone several recent developments such as the inclusion of the spatial-temporal data layer framework (Steenbeek et al 2013) the habitat capacity model (Christensen et al 2014) and the Monte Carlo analysis including the diet matrix As yet there are few published studies using these latest Ecospace developments and their documentation and justification need to be improved in the EIS
5 PMV Response 2016-03-02 p 29 lines 446 - 464
Pacific Region Science Response Technical Review Assessing
Ecosystem Productivity Model of Roberts Bank
10
Questions also remain regarding how the Monte Carlo randomization routine treated diet data The report indicates that the Monte Carlo routine randomly selected input parameters from the input ranges and that only models that were balanced were used This suggests that a high proportion of models were not balanced and therefore were not used (for example the EIS indicates that about one out of 1000 sampled input parameters was balanced6) A table showing the minimum maximum mode average and median values from the Monte Carlo runs for all the parameters would enable an evaluation of how much variation was actually sampled by the balanced model runs This is recommended in the EwE user information ie ldquoUsers should check the range of the input parameters that were actually used in the trials in the output csv file (see below)rdquo7
In addition there are several issues with the documentation of the derivation of the parameters for the functional groups Such documentation should clearly outline how the input parameter was estimated and the range of uncertainty for that parameter For example the input biomass of pinnipeds was defined as 04 t km 2 derived from estimates of 034 for Harbour seals and two estimates for Steller sea lions (012 and 014 t km 2) No explanation was provided for how the overall estimated pinniped biomass of 04 t km 2 was determined The diet of Sand Lance was described in the EIS as consisting mostly of zooplankton8 whereas the diet table for the model runs9 included 20 macrofauna 10 green algae and 10 detritus It is unclear why these additional prey were included in the diet used for the model runs
334 Highly mobile functional groups This implementation of the EwE framework included transient and migratory functional groups This is entirely appropriate and these groups cannot be excluded The approach taken in the Ecospace module was to impose a low (and conservative) dispersal rate among model spatial units (lsquopixelsrsquo) of 1 km yr-1 This may be appropriate for low mobility benthic organisms but it likely underestimates the movements of many other functional groups The effects of using higher and perhaps functional-group-specific dispersal rates was not considered The Proponents argued that higher dispersal rates would reduce impacts since species can move away from less desirable areas more quickly for completeness these runs should be done and evaluated Mobile species will also bring energy (food) captured outside the system into the modelled ecosystem This process was included in the model with the use of a diet import factor reflecting the consumption of prey outside the modelled region with the assumption that groups with high import rates were unlikely to respond to local changes on Roberts Bank10 This assumption needs justification perhaps at the functional group level for example many species of highly migratory birds and Pacific salmon use the Roberts Bank ecosystem to obtain food to continue their migrations Although this food does not compose a large fraction of their annual consumption it can be critical to enable them to continue their migrations
The EwE model is not designed to capture differences in prey quality ie differences in essential fatty acid or nutrient ratios The same species of prey may have greater or lesser nutritional value to predators depending on the conditions under which they are growing and their seasonal variations This is a particular concern with the nutritional quality of the diatom-dominated biofilm Diatomaceous biofilm is important to the highly migratory Western Sandpiper (Calidris mauri) Despite its predictive merits in relation to other ecosystem
6 EIS Appendix 10D Section 24 p5 7 EwE Help file p 151 8 EIS Appendix 10B Section 4133 p 76 9 EIS Appendix A of Appendix 10B 10 PMV Response 2016-03-02 p 28 lines 429 - 436
Pacific Region Science Response Technical Review Assessing
Ecosystem Productivity Model of Roberts Bank
11
components the EwE model is not informative with respect to understanding the potential impacts of the Project on biofilm and the Western Sandpiper While this example is specific to seabirds the potential exists for differences in the quality of biofilm to also be an issue for copepods which feed on biofilm and consequently to juvenile salmon which feed on these copepods (eg Sutherland et al 2013)
The EwE model is also not designed to predict effects of the Project on water quality although the Proponent noted that ldquoOther abiotic factors not included were deemed to be representative of variables that were already included in the modelhelliprdquo11 The Project may cause changes in physical and water quality conditions whether in isolation or in combination which may impact the productivity or nutritional quality of key prey organisms for local and migratory species which will not be captured by the model The EwE model does not assess the production of key nutrients or the implications of changes in important physical and water quality parameters to biofilm community structure and hence to important migratory birds
The model does not include biotic factors for both pelagic and benthic environments to assess the potential development of eutrophication and benthic organic enrichment events respectively Organic and redox indicators traditional measures of environmental assessments that are used to determine changes in functional group responses were included in the recent Deltaport Third environmental assessment (ie Pelagic chlorophyll dissolved nutrients Benthic sediment carbonnitrogen content redox state [sulfide concentration]) Benthic anoxic events based on organic enrichment are known to be strong drivers of community composition and exclusion regardless of substrate type In the absence of biotic factors (eg organic particulates) the model has not considered the potential for benthic organic enrichment which coincides with siltation processes within the upper tidal flats The tidal flat corner bordered by the Delta-dyke and Deltaport causeway has served as a catchment area for Fraser River silt since the development of the original Deltaport causeway (Sutherland et al 2013) The proposed position of the new terminal placed at the seaward termination of the Deltaport causeway may produce a crescent-shaped feature in the wake of the Fraser River Plume This feature may provide a more efficient silt trap that will promote benthic organic enrichment This piece of the environmental assessment seems to be missing and is important for assessing fish habitat in this area
335 Seasonality (model time step) Input data to parameterize the model were available on a range of time scales from hourly (eg physical data on salinity and water flow) to annual (eg species biomass) The Proponents indicated12 that this is a strength of the EwE model although ultimately the model was run with an annual time step with all sub-annual values being averaged to annual values This method therefore did not incorporate important seasonal processes such as winter-summer differences in salinity and storm properties and the seasonal appearances of abundances of predators and prey such as migratory salmon and birds that are much larger than the annual average For example juvenile salmon migrate from the Fraser River and onto Roberts Bank in the spring before moving into deeper waters If these spring abundances are averaged over the entire year these average abundances would be 5-10 times lower than the actual abundances during the spring (ie averaging the biomass that occurs in two months over a 12 month period) Additionally this method did not capture the intensity of processes such as growth and predation which can be focused over periods of a few weeks to a few months There may be important threshold effects at particular times and places which may be missed when using an 11 EIS Section 10 p 10-11 12 PMV Response 2016-03-02 p 86 line 1655
Pacific Region Science Response Technical Review Assessing
Ecosystem Productivity Model of Roberts Bank
12
annual time step for the model The Ecospace module has a monthly time step13 and therefore it is feasible to run this module with a sub-annual time step For example the Proponents submit14 that there are inadequate data to model the potential effects of the Project on the timing of biofilm production which could have implications for the migratory dunlin and Western Sandpiper However this could be modelled in an exploratory way to determine hypotheses about which factors could affect the timing of production of biofilm and the potential impacts on these birds These issues are of major concern to ECCC
336 Life history structure The EwE model did not separate functional groups into life history stages (stanzas) yet for many functional groups the juvenile stages can have very different life history characteristics and habitats than the adults It is unclear in the description of the model how different life history structures were considered and whether for example there were enough juveniles to produce the adults The implications of not including early life stages should be explored at least qualitatively to identify which species might have life stages that may be more vulnerable to project effects
337 Model balancing Balancing an EwE model is the process by which parameters are adjusted so that there is sufficient production for consumption requirements ie there are sufficient prey for all predators Expert opinion was used to examine parameter values and to adjust for errors or inconsistencies in logic ldquoPMV is confident that since the approach taken to balance the model was based on best practices the steps are appropriaterdquo15 Adjustments to initial parameters to ensure an ecologically-feasible model are necessary and to be expected For a few functional groups however very large changes to initial parameter estimates (which were often not based on Roberts Bank specific data) were necessary for example to transient killer whales When such initial parameters were adjusted (often by substantial amounts) by expert opinion to balance the model the confidence intervals around these adjusted parameter values were not increased to reflect this added uncertainty (see for example PMV Response 2016-03-02 p 51 lines 955-956) When expert opinion was used to make very large changes to initial parameter values broader confidence intervals about these parameters should have been applied This does not appear to have been the case and as a consequence may cause the actual uncertainty of the model outputs to be underestimated
Another example is for the pinniped group in which 50 of the diet was assumed to come from outside the model area in order to balance the model The rationale provided was ldquoThe pinnipeds caused excessive predation mortalities on numerous fish functional groups The biomass of pinnipeds was an average for the Strait of Georgia which was likely too high for Roberts Bank Therefore it was assumed that pinnipeds extracted only half of their diet from the study areardquo16 It is unclear whether the sensitivity of the model to different percentages of diet allocation was explored
As noted above (332) the Ecopath model was relatively unconstrained and few adjustments to input parameters were required to balance the model This is unusual and the low ecotrophic efficiencies of several functional groups suggest that full accounting of energy flows may not have been achieved (an ecotrophic efficiency of 1 indicates that 100 of the production of that
13 EIS Appendix 10C Section 29 p24 14 EIS Appendix 10D Appendix C p72 15 PMV Response 2016-03-02 p 49 lines 910-912 16 EIS Appendix 10C Section 261 p 20
Pacific Region Science Response Technical Review Assessing
Ecosystem Productivity Model of Roberts Bank
13
particular group is being preyed upon or removed by fishing leaving no individuals to die of old age17) An ldquoexcessrdquo of individuals dying of old age ie ecotrophic efficiencies much less than 1 suggests a potentially large biomass that is not used by the ecosystem and instead is converted to detritus
34 Model validation Model validation is the process by which the model parameters variables and outputs are compared with those from the real ecosystem to ascertain how well the model represents the ecosystem It is an essential step in providing confidence that the projections from the model in this case with and without the Project have relevance to how the real ecosystem may be expected to function with and without the Project In practice validating complex ecosystem models is difficult considering the range of assumptions that must be made when building the model the limited available data and natural variability of the ecosystem at a variety of time and space scales
Many of the standard diagnostics for the Ecopath model have not been evaluated in the EIS The Proponent appears to have assumed that once the Ecopath model was balanced then it was valid and fit for purpose The Proponent should provide all the Ecopath estimates of vital rates including mortality rates As presented questions remain For example many Ecotrophic Efficiencies (which control the transfer of biomass from prey to predators) are less than 1 even for taxa which would be expected to be close to 1 such as carnivorous zooplankton The reason for Ecotrophic Efficiencies less than 1 were not discussed or explained in the EIS
Detailed diagnostics for the Ecospace model should also be presented in order to evaluate model performance In response to criticisms by DFO ECCC and NRCan in discussions with the Proponent the latter provided the biomass of the functional groups from the Ecopath model (before Ecospace) and the Ecospace model after the spin-up period (which involved adjusting the parameters from the Ecopath model to balance the 5468 separate cells of the Ecospace model)18 The Proponents argue that ldquoIt is important to note that changes in biomass values generated during the spin-up period are identical for both with and without Project scenarios and thus do not provide information on the potential Project-related effects on productivity19 However several changes to biomass result from the Ecospace balancing process (spin-up period) This is only given brief attention by the Proponent in its response to the DFO ECCC and NRCan questions An analysis of Table 620 revealed that the biomass of 9 functional groups was larger or smaller than the widest confidence limits allowed for each group21 This requires further discussion and justification
The Proponent used a goodness of fit measure to compare spatial distributions of model outputs with field observations They indicated that ldquono other EwE models were identified which use a goodness-of-fit measure Hence the RB model is potentially the first such EwE model where a goodness of fit measure has been appliedrdquo22 The chosen goodness of fit measure is the percent correct classification (PCC) method23 This method derives a test statistic based on the proportion of locations at which predicted occurrences from the model match observed
17 EIS Appendix 10-B p 11 18 PMV Response 2016-03-02 p 65-66 Table 6 19 PMV Response 2016-03-02 p 64 lines 1205-1207 20 PMV Response 2016-03-02 p 65-66 Table 6 21 PMV Response 2016-03-02 p 45 Table 3 22 PMV Response 2016-03-02 p 78 lines 1481-1483 23 PMV Response 2016-03-02 p 78 lines 1483-1484
Pacific Region Science Response Technical Review Assessing
Ecosystem Productivity Model of Roberts Bank
14
occurrences from data and similarly with predicted and observed absences The Proponent then calculated two additional accuracy of fit measures sensitivity (the model predicts a species to occur in an area where it is known to occur in reality) and specificity (the model predicts a species does not occur in an area it is known not to occur in reality)24 This analysis concluded that the model has high predictability for functional groups such as eelgrass and sea pens with relatively static distributions but lower predictability for functional groups which are more temporally and spatially dynamic such as biofilm and green algae25
There are two problems with this approach The first is that this goodness of fit comparison was done only for habitat-forming functional groups no discussion of how well this analysis applies to mobile functional groups was provided The second problem is that this method does not take into account situations (such as occurs in this study with several groups) in which species occur at only a few locations For example ldquohellipif the test data consist of 95 absences and 5 presences and this reflects the true prevalence of the species on the landscape (a realistic scenario for a rare species) a lsquonullrsquo model that predicted absence in all cases (eg no model at all) would be correct 95 of the timehellipldquo (Franklin 2009 p 151) This latter point is important here as these habitat functional groups (biofilm brown algae native eelgrass green algae Japanese eelgrass tidal marsh biomat and orange sea pens26) appear not to occur over most of the Project area (as portrayed by the model outputs presented in the distribution figures of PMV Response 2016-03-02 Appendix 218) It is therefore important that a robust evaluation of the performance of the Ecospace module is used with preferably more than one measure
In summary the starting point for this modelling analysis matters It is not just about a comparison between results with and without the Project The model has to be considered a sufficient representation of the ecosystem The Proponent has not yet sufficiently validated the model
35 Model results 351 Presentation of model results
As noted above (Section 331) the stated objective of the Roberts Bank ecosystem model was not to provide an assessment of Project impacts for each functional group at a fine temporal scale but to estimate changes in productive potential with and without the Project at the ecosystem level27 However results were presented as comparisons by speciesfunctional group with and without the Project and not as potential changes in total ecosystem productivity The revised figures for each functional group showing distributions without the Project with the Project and their difference indicated impacts were likely to be localized with overall impacts relatively small The range of biomass ratios with and without the Project was 045 ndash 189 with most values slightly less than 1 This is interpreted as indicating slight decreases in the capacity of the study area to support biomass and production with the Project for many functional groups28 (Figure 2)
24 PMV Response 2016-03-02 p 80 lines 1524-1527 25 PMV Response 2016-03-02 p 81 lines 1551-1559 26 PMV Response 2016-03-02 p 82 Table 8 27 PMV Response 2016-03-02 p 99 lines 1914-1917 28 PMV Response 2016-03-02 Appendix 218
Pacific Region Science Response Technical Review Assessing
Ecosystem Productivity Model of Roberts Bank
15
Biomass Ratio
Freq
uenc
y
04 07 10 13 16 19
05
1015
2025
30
Figure 2 Histogram of biomass ratios obtained by comparisons of model runs with and without the project (ie With Without) Values less than 1 indicate reductions in biomass with the Project compared against without the Project) Data from Appendix 218 of PMV Response 2016-03-02
352 Sensitivity and vulnerability analyses Every ecosystem model is only one possible representation of the true ecosystem defined by the modelrsquos structure and the values chosen for its many parameters The key point is how well the model represents the real system how that fit can be measured and the sensitivity of model outputs to variability in the selected parameter values The ideal model should be robust to a wide range of uncertainties in the input data and parameters This robustness is determined by performing sensitivity analyses on the model to see how it responds to variations in the input parameters and determining to which input parameters the model is most sensitive
The vulnerability parameters determine the strength of the feeding interactions between functional groups They set the level of density dependence of each functional group Higher vulnerability settings provide greater top-down (predator) control whereas lower settings provide greater bottom-up (environmental) control29 Several publications have shown that EwE models are very sensitive to the vulnerability parameters and Christensen and Walters (2000) point out that a main pitfall of EwE is that ldquopredation vulnerabilities are often underestimated lessening the modelled impacts of predationrdquo It is usual practice to tune Ecopath models including the vulnerability parameters to time series data such as biomass using the temporal simulation model Ecosim However these data were not available for the RBT2 area so this robust method of fitting the model and estimating vulnerability parameters was not possible Instead a vulnerability setting of 2 was used as the default value for the key model runs which is ldquocommon practice when time series data are not available and estimates of vulnerability in the
29 PMV Response 2016-03-02 p 70 lines 1318-1323
Pacific Region Science Response Technical Review Assessing
Ecosystem Productivity Model of Roberts Bank
16
model cannot be maderdquo30 with sensitivity analyses run for a range of 15 to 3 This narrow range was criticized by DFOECCC in initial discussions about the model with the Proponent The Proponent subsequently reran the model with a larger range of vulnerabilities31 (11 to 10) and concluded this broader vulnerability range produced similar results for the productivity ratio with and without the Project to those in the original EIS and that the EIS was more likely to overestimate than underestimate potential project effects32 The data in Table 7 of the PMV Response33 did indicate changes in productivity ratios ranging from 0 to 50 of the defined key run (which used a vulnerability setting of 2) However the Proponent changed all vulnerability settings to the same value ie all were 2 or all were 10 etc In reality the vulnerability parameters resulting from Ecosim models that are fitted to data as described above vary by functional group which was not explored here Therefore although the results suggest that the original choice of 2 for the default key run seemed reasonable the potential effects of variability in vulnerability settings was not fully explored
Sensitivity analyses are usually based on the range of uncertainty estimated for input data and parameters often called the confidence limits around the model parameters The EwE framework integrates many different data sources and parameters including values from the literature It can therefore be difficult to identify ldquoreasonablerdquo confidence limits when derived from such diverse data sources Standard practice in Ecopath models has been to develop a pedigree for each parameter with default values for uncertainty based on the nature of the source data For example parameter values based on high precision field observations of biomass within the model domain receive default confidence intervals of 10 whereas parameter values based on models developed for elsewhere or professional judgment receive confidence intervals of 8034 Sensitivity analyses are then run using parameter values selected from within these confidence intervals However if these default confidence intervals do not capture the full range of variability then the outputs are not informative of the variability in the lsquorealrsquo ecosystem Field observations were collected for many functional groups within the model domain in 2012 and 2013 as part of studies to support the RBT2 EIS Apparently the purpose of these observations was to document spatial variability (in part for the Ecospace model) and temporal variability (measurements at one location over time) and not to derive confidence intervals around the observations35
The reliance on the pedigree approach to derive confidence intervals for this Roberts Bank model was criticized by DFO ECCC and NRCan in discussions with the Proponent As a result the Proponent reran the model with much larger confidence intervals ranging from 30 to 100 depending on the input parameter and functional group36 The results from this new analysis using the broader confidence intervals were similar to those using the original pedigree approach The Proponent noted that ldquoWhile the production within each helliprun was very different there was little difference in the biomass ratio [with and without the Project] These results further demonstrate that even with a greater range in input values the influence of the Project on the Roberts Bank ecosystem is consistent among allhellipmodel runsrdquo37 This provides confidence that the model may be robust to uncertainty in its input parameters Two concerns
30 PMV Response 2016-03-02 p 70 lines 1321-1322 31 PMV Response 2016-03-02 p 71-74 32 PMV Response 2016-03-02 p 71 lines 1339-1341 33 PMV Response 2016-03-02 p 73 34 EIS Appendix 10-C Section 251 page 18 35 PMV Response 2016-03-02 p 42 lines 772-777 36 PMV Response 2016-03-02 p 44-47 37 PMV Response 2016-03-02 p 47 lines 855-858 and see also PMV Response 2016-03-02 Appendix 27-B
Pacific Region Science Response Technical Review Assessing
Ecosystem Productivity Model of Roberts Bank
17
remain however The quote above indicates that the production among the different model runs was very different although with little difference in the biomass ratios with and without the Project Since biomass is not the same as production it would be informative for understanding model performance and potential impacts to show these production differences This also relates to the point made in Section 34 regarding how well the model represents the real ecosystem and not just within-model comparisons with and without the Project The second question is more technical and relates to how the randomization (Monte Carlo or MC) routine that was used to create multiple model runs used the uncertainty about the diet data Diets are not currently included in the MC routine available to regular users of the Ecosim model how they were handled in this RBT2 model appears not to be explained
Finally the sensitivity analyses indicate that the uncertainty in the input parameters does not lead to much difference between model parameters with or without the project However this conclusion does not describe how the uncertainty in the input parameters affects understanding of the ecosystem
40 Conclusions Overall the main conclusion of the Environmental Impact Statement from the Proponent is stated as ldquohellipafter the implementation of mitigation hellipthe Project is not expected to result in any significant adverse effects on any of the 16 valued componentsrdquo38 In addition ldquohellipapproximately 40 of the functional groups are forecast to change no more than 5 which hellip is judged to be within the uncertainty of the model runsrdquo39 although larger changes were forecast for orange sea pens freshwater biofilm green algae and raptors The conclusions from the modelling studies are that ldquohellipthe proposed project will have an impact on the study area that the effect varies between species and that the findings are robust to parameter uncertaintyrdquo40 Specific outcomes by valued component as derived from the EwE model are presented by functional groups in Table 1
38 PMV March 2015 Roberts Bank Environmental Impact Statement Executive Summary ndash Part 1 page 37 39 EIS Appendix 10-C p ii 40 EIS Appendix 10-D p iv
Pacific Region Science Response Technical Review Assessing
Ecosystem Productivity Model of Roberts Bank
18
Table 1 Changes in productive potential with the Project as derived from the EwE model
Changes in productive potential
Ecosystem category
Number of valued
components
Number with potential
biomass loss
Moderate decrease (31-60 decline)
Minor decrease (6-30 decline)
Negligible (0-5
change)
Minor increase (6-
30 increase)
Moderate increase (31-60 increase)
Source
Marine vegetation
7 7 - 3 2 2 - EIS Vol 3 Section 11 Table 11-17 page 11-65
Marine invertebrates
4 3 1 1 1 1 - EIS Vol 3 Section 12 Table 12-8 page 12-52
Marine fish 13 13 - 2 6 5 - EIS Vol 3 Section 13 Table 13-10 page 13-95
Coastal birds
11 8 - 3 4 3 1 EIS Vol 3 Section 15 Table 15-10 page 15-67
Pacific Region Science Response Technical Review Assessing
Ecosystem Productivity Model of Roberts Bank
19
Most functional groups showed some potential biomass loss with the Project with biomass loss defined as any model run with negative outcomes (ie in which biomass with the project was less than biomass without the Project) The summary of changes in productivity potential are mixed with most (33 out of 35) valued components showing minor decreases to minor increases (defined as 6 to 30 changes in productive potential with the Project compared to without the Project)
The main conclusions of this review in regards to the Terms of Reference are
1 Do the functional groups and abiotic variables used in the model adequately represent the ecosystem at Roberts Bank
o The 58 functional groups and abiotic variables used in the model adequately represent the main components of the Roberts Bank ecosystem however for longer lived species the life stages of the species are not well represented and some of the impacts of the Project may be expected to affect specific life stages
o The abiotic variables adequately represent the physical drivers of this ecosystem on an annual time scale However annual values for these abiotic variables may not adequately capture important sub-annual events such as storms (DFO 2016) the timing of arrival and departure of highly migratory species and whether there may be important sub-annual thresholds or mismatches in timing as a result of the Project
o Biotic factors (eg nutrients) which are particularly important for biofilm and other lower trophic level taxa are not included in this model The model is therefore unable to assess the potential development of eutrophication and benthic organic enrichment events which may affect fish habitats in the study area
2 Are the parameter estimates used by the model valid and defensible for this system
o In general parameter estimates appear to be adequate for this system Field studies were done in two years to provide data in particular on distributions of selected functional groups for the Ecospace module Note the distribution studies focussed on taxa which were relatively immobile and therefore lsquofixedrsquo in space
o the selection of some model parameters would benefit from further explanation for example the choice of fixed diet matrices versus dynamic matrices which can vary with changes in abundances or predators and prey
o the selection of some model parameters would benefit from further explanation for example the link between the diets described in the text of Appendix 10B and the quantities presented in Appendix A of Appendix 10B It is understood that proportions were derived using the ldquofixed selectivityrdquo principle but in order to be fully transparent the derivation of each diet should be provided in an appendix
o discussion and explanation is needed of why ecotrophic efficiencies differ from expected values (eg the ecotrophic efficiency for Pacific herring is listed as 038) and
o the abiotic factor lsquosubstratersquo was limited to ldquohardrdquo or rdquosoftrdquo options which can be restrictive given that they serve as endpoints on a substrate composition continuum These limited options may not provide the sensitivity required to assess substrate preference nor the flexibility for taxa (eg motile organisms) that span hard mixed and soft substrate types In addition it is not clear if changes in the hardsoft categories were considered over time within identified depositional or erosional settings before and after construction
Pacific Region Science Response Technical Review Assessing
Ecosystem Productivity Model of Roberts Bank
20
3 Are the limitations and uncertainties of the model identified and appropriately considered when determining the modelrsquos representation of current and possible future conditions
o the EwE model was not designed to evaluate a range of future conditions It was designed to estimate changes in the productive potential at the ecosystem level with and without the Project Therefore the model was run without the Project and with the Project for a range of plausible abiotic conditions and the results were compared with respect to biomass and productivity by functional group
o the pedigree approach to assessing the uncertainties of model outcomes is unsatisfactory for the purpose here as it relates solely to a qualitative judgment of the value of data based on its source However when the model was rerun with much wider ranges of confidence intervals (uncertainties) the results in general (but not necessarily for each functional group) were similar to the results using the original pedigree approach This suggests that taken overall the model may be robust to wide ranges of uncertainty in these input variables and parameters
o there is inadequate validation of the model This is inadequate for three reasons
(i) the basic Ecopath model is not validated and the Ecospace balancing process (the spin-up period) resulted in some biomass estimates being increased or decreased beyond their confidence limits
(ii) the goodness of fit test used to evaluate how well the model predicted the spatial occurrence functional groups is not fit for purpose (Section 34) and
(iii) validation was provided for only a small number of functional groups (the habitat-forming functional groups) As a consequence the model is currently not validated
o Considering the proportion of open boundaries relative to closed boundaries in the model processes taking place outside the modelled ecosystem are likely to contribute to dynamics within the modelled ecosystem However these external processes may not be well-resolved by the EwE model as currently configured
4 Are the model results related to the potential effects of the Project on fish and fish habitat and migratory birds and their food resources valid and defensible
o this is a very complex ecosystem model constructed for a relatively small and open (in the sense of considerable exchange with adjacent non-modelled areas) system Many assumptions have been made based on poor or missing data Taking all these considerations into account the model does the best job possible of comparing the biomass and productivity of the Roberts Bank ecosystem with and without the Project
o the extent to which the model adequately represents the lsquorealrsquo ecosystem of Roberts Bank as opposed to comparisons of model results with and without the Project is unclear as a number of basic diagnostics are not presented (see point 3 above)
o the EwE model is not capable of and is not designed to represent nutritional and food quality variations in prey functional groups and how these may impact highly migratory predators such as birds with and without the Project
5 Is the EwE model framework a valid method to quantify large scale impacts to fish habitat fish productivity and migratory bird productivity
o the EwE model as implemented in this project and reviewed here is a useful first-order framework to organise information and derive initial estimates of how the system may respond to perturbations
Pacific Region Science Response Technical Review Assessing
Ecosystem Productivity Model of Roberts Bank
21
o the utility of a EWE model for impact purposes is highly dependent on the quality of input data
o each EwE model is highly dependent on local conditions Although appropriate as an overall methodology each application would need to be reviewed for how it may be applied to any new ecosystem and
o the EwE model would need to be substantially reformulated if it was to include considerations of changes in chemical composition or food quality of prey in particular for seasonal migratory species such as birds which may depend on very large biomasses of prey with specific chemical composition to fuel their migrations beyond the ecosystem model boundaries
Contributors Contributor Affiliation Ian Perry Author DFO Science Pacific Region Alida Bundy Author DFO Science Maritimes Region Terri Sutherland Author DFO Science Pacific Region Robert Elner Author ECCC Canadian Wildlife Service Andrew Robinson Author ECCC Canadian Wildlife Service Lesley MacDougall Editor DFO Science Pacific Region
Approved by Carmel Lowe
Regional Director Science Branch Pacific Region Fisheries and Oceans Canada
November 4 2016
Sources of Information Christensen V Coll M Steenbeek J Buszowski J Chagaris D walters CJ 2014
Representing variable habitat quality in a spatial food web model Ecosystems 17 1397-1412
Christensen V and Walters C 2000 Ecopath with Ecosim methods capabilities and limitations Ecological Modelling 172 109-139
Colleacuteter M Valls A Guitton J Gascuel D Pauly D and Christensen V 2015 Global overview of the applications of the Ecopath with Ecosim modeling approach using the EcoBase models repository Ecological Modelling 302 pp42-53
Compass Resource Management Ltd 2013 Roberts Bank Terminal 2 Technical Advisory Group (TAG) Process Report Productive Capacity ndash Final Report 119pp (Accessed November 1 2016)
DFO 2016 Technical Review of Roberts Bank Terminal 2 Environmental Assessment Section 95 ndash Coastal Geomorphology DFO Can Sci Advis Sec Sci Resp 2016045 (Accessed November 4 2016)
Pacific Region Science Response Technical Review Assessing
Ecosystem Productivity Model of Roberts Bank
22
ESSA Technologies 2014a Roberts Bank Terminal 2 Project Roberts Bank Delta BC Environmental Impact Statement Volume 3 Biophysical Effects Assessments Appendix 10-C Roberts Bank Ecosystem Model Development and Key Run Port Metro Vancouver (Accessed November 1 2016)
ESSA Technologies 2014b Roberts Bank Terminal 2 Project Roberts Bank Delta BC Environmental Impact Statement Volume 3 Biophysical Effects Assessments Appendix 10-D Roberts Bank Ecosystem Model Sensitivity Analyses Port Metro Vancouver (Accessed November 1 2016)
Franklin J 2009 Mapping Species Distributions Spatial Inference and Prediction Cambridge University Press Cambridge
Hemmera 2014 Roberts Bank Terminal 2 Project Roberts Bank Delta BC Environmental Impact Statement Volume 3 Biophysical Effects Assessments Appendix 10-B Roberts Bank Ecosystem Model Parameter Estimates Port Metro Vancouver File 302-03503 (Accessed November 1 2016)
Port Metro Vancouver 2015a Roberts Bank Terminal 2 Project Roberts Bank Delta BC Environmental Impact Statement Volume 3 Biophysical Effects Assessments Section 100 Biophysical Setting (Accessed November 1 2016)
Port Metro Vancouver 2015b Roberts Bank Terminal 2 Project Roberts Bank Delta BC Environmental Impact Statement Volume 3 Biophysical Effects Assessments Section 103 Overview of Assessing Ecosystem Productivity (Accessed November 1 2016)
Port Metro Vancouver 2015c Roberts Bank Terminal 2 Project Environmental Assessment Additional Information Requirements (July 31 2015) Responses Response to Information Request 6 IR-73115-06 Canadian Environmental Assessment Agency Reference Number 80054 dated 26 October 2015
Steenbeek J Coll M Gurney L Meacutelin F Hoepffner N Buszowski J and Christensen V 2013 Bridging the gap between ecosystem modeling tools and geographic information systems Driving a food web model with external spatialndashtemporal data Ecological Modelling 263 139ndash 151
Sutherland T Elner R and OrsquoNeill J 2013 Roberts Bank Ecological crucible of the Fraser River estuary Progress in Oceanography 115 171ndash180
Vancouver Fraser Port Authority 2016 From the Vancouver Fraser Port Authority to the Review Panel re Answers to preliminary technical questions submitted during the completeness phase from Fisheries and Oceans Canada Natural Resources Canada and Environment and Climate Change Canada concerning the ecosystem modelling to support the Roberts Bank Terminal 2 Project environmental review CEAR Document 547 (Accessed November 1 2016)
Pacific Region Science Response Technical Review Assessing
Ecosystem Productivity Model of Roberts Bank
23
This Report is Available from the Centre for Science Advice
Pacific Region Fisheries and Oceans Canada
3190 Hammond Bay Road Nanaimo BC V9T 6N7
Telephone (250) 756-7208 E-Mail csapdfo-mpogcca
Internet address wwwdfo-mpogccacsas-sccs
ISSN 1919-3769 copy Her Majesty the Queen in Right of Canada 2016
Correct Citation for this Publication
DFO 2016 Technical review of Roberts Bank Terminal 2 environmental assessment section 103 ndash assessing ecosystem productivity DFO Can Sci Advis Sec Sci Resp 2016050
Aussi disponible en franccedilais
MPO 2016 Examen technique de leacutevaluation environnementale du Terminal 2 agrave Roberts Bank section 103 ndash eacutevaluation de la productiviteacute de leacutecosystegraveme Secr can de consult sci du MPO Reacutep des Sci 2016050
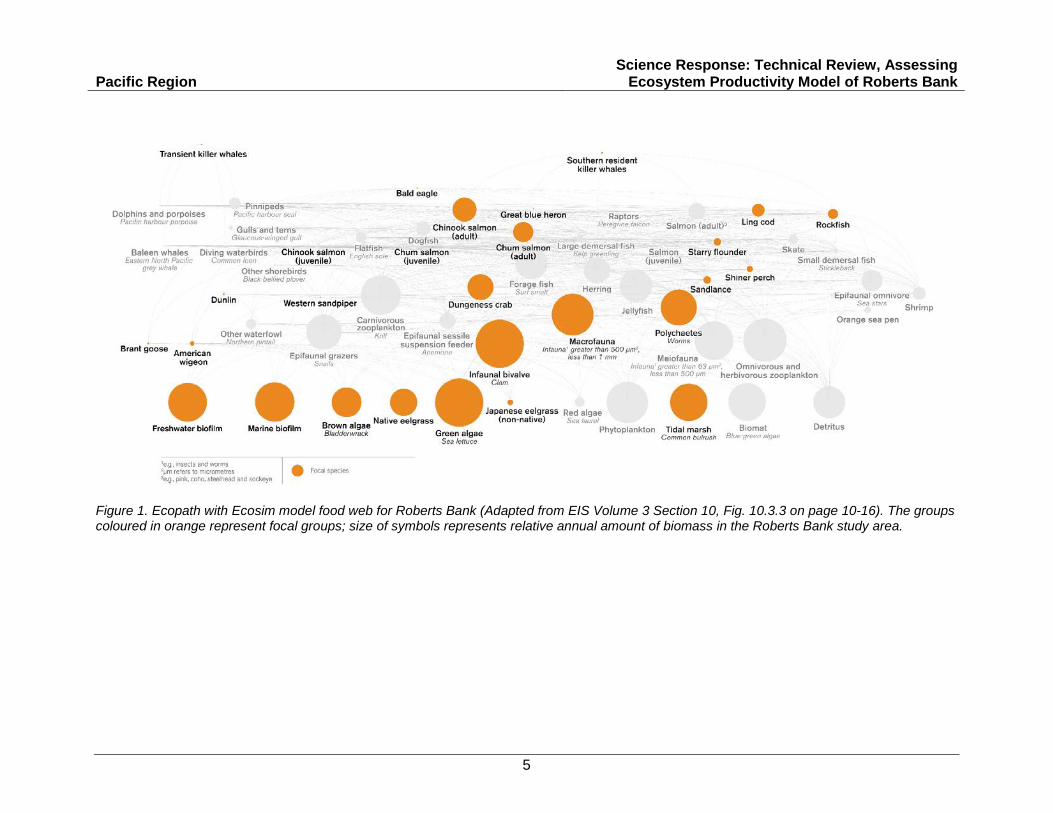
Pacific Region Science Response Technical Review Assessing
Ecosystem Productivity Model of Roberts Bank
5
Figure 1 Ecopath with Ecosim model food web for Roberts Bank (Adapted from EIS Volume 3 Section 10 Fig 1033 on page 10-16) The groups coloured in orange represent focal groups size of symbols represents relative annual amount of biomass in the Roberts Bank study area
Pacific Region Science Response Technical Review Assessing
Ecosystem Productivity Model of Roberts Bank
6
The EwE framework is a common approach to ecosystem modelling which has been developed and expanded over the past two to three decades It currently has three main components
1 Ecopath ndash the core model which provides a mass-balance snapshot of the system
2 Ecosim ndash a module that enables simulation modelling over time
3 Ecospace ndash a module that enables simulation modelling over space
In order to make an EwE model tractable species are aggregated into functional groups based on their similar ecological characteristics (habitat and prey preferences etc) the Roberts Bank models had 58 functional groups The first step (Ecopath) was to obtain input parameters representing biomass production consumption emigration and diet for each functional group These parameters were then tuned in an iterative process until the overall production and consumption was balanced (a mass-balance approach) resulting in a model food web with estimates of energy flow between functional groups (Fig 1)
In the second step Ecosim was combined with the spatial model Ecospace The abiotic variables selected in this EIS (depth salinity bottom current wave height sediment type) were used as external forcings to the Ecospace module These abiotic variables provided the physical forcings for the simulations without and with the Project Since time series data on the functional groups of the model were not available Ecospace was run until the model reached equilibrium using various assumptions of the value of the vulnerability parameter (see Section 352) In this EIS the selected time step was annual with all variables abiotic and biotic expressed as yearly averages As used in this EIS the Ecospace module included a habitat capacity model which estimated the distribution of functional groups based on their environmental preferences for each abiotic variable (depth salinity bottom current wave height) and for substrate type (sand mud etc) The model thus allocated the spatial distribution of functional groups over the model domain based on their environmental preferences and the distributions of these abiotic variables with and without the Project The selected spatial unit size (ldquopixelrdquo) for the Ecospace model was 100 m2 In essence an Ecopath model was constructed for each pixel with particular rules governing how the functional groups interacted and moved among these spatial units The Ecospace module was run until it approached equilibrium (20 model years) to establish the spatial patterns without the Project For the lsquowith the Projectrsquo simulations the model was run for an initial 10 years and then the spatial patterns of the abiotic variables with the project were added and the model run for an additional 10 years1 The model outputs predicted changes in the productive potential of the Roberts Bank ecosystem as a comparison (ratio) with and without the Project rather than an absolute biomass that would be lost or gained as a result of the Project
1 EIS Appendix 10-C p 26
Pacific Region Science Response Technical Review Assessing
Ecosystem Productivity Model of Roberts Bank
7
30 Analysis and Response To prepare this response the following sections of the EIS additional documents were reviewed
DocumentSection Title
EIS Section 10
Including appendices 10B 10C and 10D
(Port Metro Vancouver 2015a Hemmera 2014 ESSA Technologies 2014a ESSA Technologies 2014b)
Biophysical Setting
Appendix 10-B Roberts Bank Ecosystem Model Parameter Estimates Port Metro Vancouver File 302-03503
Appendix 10-C Roberts Bank Ecosystem Model Development and Key Run Port Metro Vancouver
Appendix 10-D Roberts Bank Ecosystem Model Sensitivity Analyses Port Metro Vancouver
CEAR document 547 (Including Appendices) ldquoPMV Response 2016-03-02rdquo and ldquoPMV Response 2016-05-30rdquo
(Vancouver Fraser Port Authority 2016)
Vancouver Fraser Port Authority to the Review Panel re Answers to preliminary technical questions submitted during the completeness phase from Fisheries and Oceans Canada Natural Resources Canada and Environment and Climate Change Canada concerning the ecosystem modelling to support the Roberts Bank Terminal 2 Project environmental review
31 The EwE Team Building this ecosystem model was a complex undertaking which required knowledge of the ecosystem to be modelled how to set initial parameter values determination of reasonable ranges of these parameters how to balance the model and how to recognize when the model outputs were unrealistic These tasks became even more complex when spatial model dynamics were involved such as with Ecospace The team engaged by the Proponent to conduct this ecosystem modelling for the Roberts Bank Terminal 2 (RBT2) EIS was led by scientists at the Institute for Oceans and Fisheries located at the University of British Columbia in Vancouver These scientists are global leaders of the EwE model framework having developed much of its current implementation and who continue to lead its elaborations and extensions Construction and running of the model for this specific ecosystem was done in collaboration with ESSA Technologies of Vancouver Parameter values for the ecosystem model were obtained in part from observational studies conducted in the area by Hemmera of Burnaby BC
32 Overview of assessment results of hydrological and sediment modelling Implementation of the ldquowith the Projectrdquo simulations of the ecosystem model was done by driving the model with the abiotic variables as they were projected to be distributed with the Project footprint In the context of this EIS specifying depth salinity bottom currents wave height and sediment type conditions without the Project and changes with the Project were achieved by construction of hydrodynamical and sediment transport models The outputs from these models in combination with the identified environment preferences for the various biological groups were then used as inputs to the Ecospace model to define the spatial
Pacific Region Science Response Technical Review Assessing
Ecosystem Productivity Model of Roberts Bank
8
distributions of these functional groups The implementation of these hydrological and sediment transport models in this EIS was reviewed by DFO and NRCan (DFO 2016) This review concluded that the implementation of these models for this EIS was adequate for average winter conditions but lacking in validation for summer conditions in particular with strong freshwater flows from the Fraser River Simulations of strong storm events and their impacts on wave conditions and sediment transport were also lacking The effect of wave action and current speeds on sediment transport is non-linear such that increasing winds over short periods of time can impact sediment transport processes bottom topography and water depths beyond that determined under average model conditions Overall the review concluded that a greater range of sensitivity analyses is required to have confidence in the model outputs under lsquonon-averagersquo conditions The implication of this conclusion for the present review of the EwE model is that the full range of variability of abiotic characteristics such as bottom topography bottom current and wave heights and how they may affect relevant functional groups in the model with the Project may not be adequately represented Sensitivity analyses were provided by varying the intensity of abiotic variables and by removing abiotic variables to assess their interactive effects In general the ecosystem model outputs were robust to these sensitivity analyses with most groups varying by less than 5 Larger changes however were observed for primary producer and bird groupings and for some fish groups when various abiotic variables were omitted2
33 Model implementation 331 The purpose of the EwE model
The EwE model was intended to provide one line of evidence to assess the potential impacts of the Project on the Roberts Bank ecosystem which would then be used with other lines of evidence to make the final assessment Specifically ldquohellip the objective of the RB [Roberts Bank] model was not to provide an assessment of Project impacts for each functional group at a fine temporal scale but to estimate changes in productive potential with and without the Project at the ecosystem levelrdquo3 In addition ldquohellipthe primary objective of the RB ecosystem model is to evaluate potential changes in productivity from such abiotic factors with and without the terminal and causewayrdquo4 Results are presented for the selected functional groups no results were presented on potential changes in ecosystem structure or function
332 Applicability of the EwE model framework to the Roberts Bank region EwE models work best when the exchanges within the system being modelled are greater than the exchanges between the modelled system and the lsquooutsidersquo world In practice this means that EwE models work best for larger systems with few external exchanges In a meta-analysis of 433 Ecopath models Colleacuteter et al (2015) concluded that ldquohellipin the last two decades the range of the models area has expanded toward very large areas and the median has shifted accordingly from about 1000 km2 in 1984ndash1993 to about 100000 km2 in 1994ndash2014rdquo The section of the Roberts Bank ecosystem that is included in the EwE model was comparatively small (5468 km2) and complex It is an intertidally-dominated environment that is subject to strong seasonal influences of both freshwater and marine exchanges across relatively large seaward and shoreward boundaries
2 EIS Appendix 10-D p ii - iii 3 PMV Response 2016-03-02 p 99 lines 1914-1917 4 PMV Response 2016-03-02 p 38 lines 689-691
Pacific Region Science Response Technical Review Assessing
Ecosystem Productivity Model of Roberts Bank
9
Processes taking place outside the modelled ecosystem will contribute to dynamics within the modelled ecosystem (eg lsquooutsidersquo food supporting predators which occur in the Roberts Bank ecosystem for only part of the year predators which may feed in the Roberts Bank ecosystem but export this energy when they migrate out of the region) but which may not be well-resolved by the EwE model The Proponent justifies the spatial scale because it was specifically chosen for the questions being asked in regard to assessing productivity changes and because the relative influences of external exchanges are assumed to be identical with and without the project In addition highly mobile species with broad prey bases were assumed in the model to be partially sustained by external energy from outside the model system5 The distributions of organisms may differ however with and without the project which may affect their interactions with areas outside of the modelled system and the use of diets from outside the modelled system may not reflect the impacts of the project Further clarification of how the EwE model captures the exchanges and interactions with adjacent ecosystems are needed For example it could be argued that an ecosystem which is open to frequent exchanges of water and organic matter from beyond its boundaries might be more robust to local disturbances such as the Project
There are some inconsistencies in the information and assumptions used for some of the taxa in this ecosystem model For Dungeness Crab the justification for estimating total adult biomass (including females) from the biomass of fished males is unclear In addition it is unclear if the slower growth of female crabs once they have reached sexual maturity in comparison with male crabs has been considered The diet matrix for spiny dogfish does not represent the actual diet well in particular of euphausiids herring and shrimp and there are more recent references for biomass estimates of spiny dogfish in the study area than what was used in the EIS
Fishing mortality was not included in the model under the assumption that this would not change with or without the project While this assumption may be true the model has been parameterized by ignoring a source of mortality that will influence total production In essence fishing removes biomass from the ecosystem with the result that less biomass will be available for higher trophic levels How this may impact the ecosystem with and without the Project is unclear but it could make noticeable differences if for example there were thresholds in the feeding responses by these higher trophic level species The Ecopath model that was used is relatively unconstrained since many ecological efficiencies are low even for forage species which would be expected to be higher It is not clear how many species are exploited or the levels of exploitation but even if this does not change with the Project these mortality rates should be included in the model in order to add realistic constraints to the exploited functional groups
333 Model documentation Based on questions from DFO ECCC and NRCan following their initial review of the EIS the Proponent provided written responses dated 2 March 2016 to clarify several of the steps in the model development and implementation However several questions remain including questions about the Ecospace module Ecospace has undergone several recent developments such as the inclusion of the spatial-temporal data layer framework (Steenbeek et al 2013) the habitat capacity model (Christensen et al 2014) and the Monte Carlo analysis including the diet matrix As yet there are few published studies using these latest Ecospace developments and their documentation and justification need to be improved in the EIS
5 PMV Response 2016-03-02 p 29 lines 446 - 464
Pacific Region Science Response Technical Review Assessing
Ecosystem Productivity Model of Roberts Bank
10
Questions also remain regarding how the Monte Carlo randomization routine treated diet data The report indicates that the Monte Carlo routine randomly selected input parameters from the input ranges and that only models that were balanced were used This suggests that a high proportion of models were not balanced and therefore were not used (for example the EIS indicates that about one out of 1000 sampled input parameters was balanced6) A table showing the minimum maximum mode average and median values from the Monte Carlo runs for all the parameters would enable an evaluation of how much variation was actually sampled by the balanced model runs This is recommended in the EwE user information ie ldquoUsers should check the range of the input parameters that were actually used in the trials in the output csv file (see below)rdquo7
In addition there are several issues with the documentation of the derivation of the parameters for the functional groups Such documentation should clearly outline how the input parameter was estimated and the range of uncertainty for that parameter For example the input biomass of pinnipeds was defined as 04 t km 2 derived from estimates of 034 for Harbour seals and two estimates for Steller sea lions (012 and 014 t km 2) No explanation was provided for how the overall estimated pinniped biomass of 04 t km 2 was determined The diet of Sand Lance was described in the EIS as consisting mostly of zooplankton8 whereas the diet table for the model runs9 included 20 macrofauna 10 green algae and 10 detritus It is unclear why these additional prey were included in the diet used for the model runs
334 Highly mobile functional groups This implementation of the EwE framework included transient and migratory functional groups This is entirely appropriate and these groups cannot be excluded The approach taken in the Ecospace module was to impose a low (and conservative) dispersal rate among model spatial units (lsquopixelsrsquo) of 1 km yr-1 This may be appropriate for low mobility benthic organisms but it likely underestimates the movements of many other functional groups The effects of using higher and perhaps functional-group-specific dispersal rates was not considered The Proponents argued that higher dispersal rates would reduce impacts since species can move away from less desirable areas more quickly for completeness these runs should be done and evaluated Mobile species will also bring energy (food) captured outside the system into the modelled ecosystem This process was included in the model with the use of a diet import factor reflecting the consumption of prey outside the modelled region with the assumption that groups with high import rates were unlikely to respond to local changes on Roberts Bank10 This assumption needs justification perhaps at the functional group level for example many species of highly migratory birds and Pacific salmon use the Roberts Bank ecosystem to obtain food to continue their migrations Although this food does not compose a large fraction of their annual consumption it can be critical to enable them to continue their migrations
The EwE model is not designed to capture differences in prey quality ie differences in essential fatty acid or nutrient ratios The same species of prey may have greater or lesser nutritional value to predators depending on the conditions under which they are growing and their seasonal variations This is a particular concern with the nutritional quality of the diatom-dominated biofilm Diatomaceous biofilm is important to the highly migratory Western Sandpiper (Calidris mauri) Despite its predictive merits in relation to other ecosystem
6 EIS Appendix 10D Section 24 p5 7 EwE Help file p 151 8 EIS Appendix 10B Section 4133 p 76 9 EIS Appendix A of Appendix 10B 10 PMV Response 2016-03-02 p 28 lines 429 - 436
Pacific Region Science Response Technical Review Assessing
Ecosystem Productivity Model of Roberts Bank
11
components the EwE model is not informative with respect to understanding the potential impacts of the Project on biofilm and the Western Sandpiper While this example is specific to seabirds the potential exists for differences in the quality of biofilm to also be an issue for copepods which feed on biofilm and consequently to juvenile salmon which feed on these copepods (eg Sutherland et al 2013)
The EwE model is also not designed to predict effects of the Project on water quality although the Proponent noted that ldquoOther abiotic factors not included were deemed to be representative of variables that were already included in the modelhelliprdquo11 The Project may cause changes in physical and water quality conditions whether in isolation or in combination which may impact the productivity or nutritional quality of key prey organisms for local and migratory species which will not be captured by the model The EwE model does not assess the production of key nutrients or the implications of changes in important physical and water quality parameters to biofilm community structure and hence to important migratory birds
The model does not include biotic factors for both pelagic and benthic environments to assess the potential development of eutrophication and benthic organic enrichment events respectively Organic and redox indicators traditional measures of environmental assessments that are used to determine changes in functional group responses were included in the recent Deltaport Third environmental assessment (ie Pelagic chlorophyll dissolved nutrients Benthic sediment carbonnitrogen content redox state [sulfide concentration]) Benthic anoxic events based on organic enrichment are known to be strong drivers of community composition and exclusion regardless of substrate type In the absence of biotic factors (eg organic particulates) the model has not considered the potential for benthic organic enrichment which coincides with siltation processes within the upper tidal flats The tidal flat corner bordered by the Delta-dyke and Deltaport causeway has served as a catchment area for Fraser River silt since the development of the original Deltaport causeway (Sutherland et al 2013) The proposed position of the new terminal placed at the seaward termination of the Deltaport causeway may produce a crescent-shaped feature in the wake of the Fraser River Plume This feature may provide a more efficient silt trap that will promote benthic organic enrichment This piece of the environmental assessment seems to be missing and is important for assessing fish habitat in this area
335 Seasonality (model time step) Input data to parameterize the model were available on a range of time scales from hourly (eg physical data on salinity and water flow) to annual (eg species biomass) The Proponents indicated12 that this is a strength of the EwE model although ultimately the model was run with an annual time step with all sub-annual values being averaged to annual values This method therefore did not incorporate important seasonal processes such as winter-summer differences in salinity and storm properties and the seasonal appearances of abundances of predators and prey such as migratory salmon and birds that are much larger than the annual average For example juvenile salmon migrate from the Fraser River and onto Roberts Bank in the spring before moving into deeper waters If these spring abundances are averaged over the entire year these average abundances would be 5-10 times lower than the actual abundances during the spring (ie averaging the biomass that occurs in two months over a 12 month period) Additionally this method did not capture the intensity of processes such as growth and predation which can be focused over periods of a few weeks to a few months There may be important threshold effects at particular times and places which may be missed when using an 11 EIS Section 10 p 10-11 12 PMV Response 2016-03-02 p 86 line 1655
Pacific Region Science Response Technical Review Assessing
Ecosystem Productivity Model of Roberts Bank
12
annual time step for the model The Ecospace module has a monthly time step13 and therefore it is feasible to run this module with a sub-annual time step For example the Proponents submit14 that there are inadequate data to model the potential effects of the Project on the timing of biofilm production which could have implications for the migratory dunlin and Western Sandpiper However this could be modelled in an exploratory way to determine hypotheses about which factors could affect the timing of production of biofilm and the potential impacts on these birds These issues are of major concern to ECCC
336 Life history structure The EwE model did not separate functional groups into life history stages (stanzas) yet for many functional groups the juvenile stages can have very different life history characteristics and habitats than the adults It is unclear in the description of the model how different life history structures were considered and whether for example there were enough juveniles to produce the adults The implications of not including early life stages should be explored at least qualitatively to identify which species might have life stages that may be more vulnerable to project effects
337 Model balancing Balancing an EwE model is the process by which parameters are adjusted so that there is sufficient production for consumption requirements ie there are sufficient prey for all predators Expert opinion was used to examine parameter values and to adjust for errors or inconsistencies in logic ldquoPMV is confident that since the approach taken to balance the model was based on best practices the steps are appropriaterdquo15 Adjustments to initial parameters to ensure an ecologically-feasible model are necessary and to be expected For a few functional groups however very large changes to initial parameter estimates (which were often not based on Roberts Bank specific data) were necessary for example to transient killer whales When such initial parameters were adjusted (often by substantial amounts) by expert opinion to balance the model the confidence intervals around these adjusted parameter values were not increased to reflect this added uncertainty (see for example PMV Response 2016-03-02 p 51 lines 955-956) When expert opinion was used to make very large changes to initial parameter values broader confidence intervals about these parameters should have been applied This does not appear to have been the case and as a consequence may cause the actual uncertainty of the model outputs to be underestimated
Another example is for the pinniped group in which 50 of the diet was assumed to come from outside the model area in order to balance the model The rationale provided was ldquoThe pinnipeds caused excessive predation mortalities on numerous fish functional groups The biomass of pinnipeds was an average for the Strait of Georgia which was likely too high for Roberts Bank Therefore it was assumed that pinnipeds extracted only half of their diet from the study areardquo16 It is unclear whether the sensitivity of the model to different percentages of diet allocation was explored
As noted above (332) the Ecopath model was relatively unconstrained and few adjustments to input parameters were required to balance the model This is unusual and the low ecotrophic efficiencies of several functional groups suggest that full accounting of energy flows may not have been achieved (an ecotrophic efficiency of 1 indicates that 100 of the production of that
13 EIS Appendix 10C Section 29 p24 14 EIS Appendix 10D Appendix C p72 15 PMV Response 2016-03-02 p 49 lines 910-912 16 EIS Appendix 10C Section 261 p 20
Pacific Region Science Response Technical Review Assessing
Ecosystem Productivity Model of Roberts Bank
13
particular group is being preyed upon or removed by fishing leaving no individuals to die of old age17) An ldquoexcessrdquo of individuals dying of old age ie ecotrophic efficiencies much less than 1 suggests a potentially large biomass that is not used by the ecosystem and instead is converted to detritus
34 Model validation Model validation is the process by which the model parameters variables and outputs are compared with those from the real ecosystem to ascertain how well the model represents the ecosystem It is an essential step in providing confidence that the projections from the model in this case with and without the Project have relevance to how the real ecosystem may be expected to function with and without the Project In practice validating complex ecosystem models is difficult considering the range of assumptions that must be made when building the model the limited available data and natural variability of the ecosystem at a variety of time and space scales
Many of the standard diagnostics for the Ecopath model have not been evaluated in the EIS The Proponent appears to have assumed that once the Ecopath model was balanced then it was valid and fit for purpose The Proponent should provide all the Ecopath estimates of vital rates including mortality rates As presented questions remain For example many Ecotrophic Efficiencies (which control the transfer of biomass from prey to predators) are less than 1 even for taxa which would be expected to be close to 1 such as carnivorous zooplankton The reason for Ecotrophic Efficiencies less than 1 were not discussed or explained in the EIS
Detailed diagnostics for the Ecospace model should also be presented in order to evaluate model performance In response to criticisms by DFO ECCC and NRCan in discussions with the Proponent the latter provided the biomass of the functional groups from the Ecopath model (before Ecospace) and the Ecospace model after the spin-up period (which involved adjusting the parameters from the Ecopath model to balance the 5468 separate cells of the Ecospace model)18 The Proponents argue that ldquoIt is important to note that changes in biomass values generated during the spin-up period are identical for both with and without Project scenarios and thus do not provide information on the potential Project-related effects on productivity19 However several changes to biomass result from the Ecospace balancing process (spin-up period) This is only given brief attention by the Proponent in its response to the DFO ECCC and NRCan questions An analysis of Table 620 revealed that the biomass of 9 functional groups was larger or smaller than the widest confidence limits allowed for each group21 This requires further discussion and justification
The Proponent used a goodness of fit measure to compare spatial distributions of model outputs with field observations They indicated that ldquono other EwE models were identified which use a goodness-of-fit measure Hence the RB model is potentially the first such EwE model where a goodness of fit measure has been appliedrdquo22 The chosen goodness of fit measure is the percent correct classification (PCC) method23 This method derives a test statistic based on the proportion of locations at which predicted occurrences from the model match observed
17 EIS Appendix 10-B p 11 18 PMV Response 2016-03-02 p 65-66 Table 6 19 PMV Response 2016-03-02 p 64 lines 1205-1207 20 PMV Response 2016-03-02 p 65-66 Table 6 21 PMV Response 2016-03-02 p 45 Table 3 22 PMV Response 2016-03-02 p 78 lines 1481-1483 23 PMV Response 2016-03-02 p 78 lines 1483-1484
Pacific Region Science Response Technical Review Assessing
Ecosystem Productivity Model of Roberts Bank
14
occurrences from data and similarly with predicted and observed absences The Proponent then calculated two additional accuracy of fit measures sensitivity (the model predicts a species to occur in an area where it is known to occur in reality) and specificity (the model predicts a species does not occur in an area it is known not to occur in reality)24 This analysis concluded that the model has high predictability for functional groups such as eelgrass and sea pens with relatively static distributions but lower predictability for functional groups which are more temporally and spatially dynamic such as biofilm and green algae25
There are two problems with this approach The first is that this goodness of fit comparison was done only for habitat-forming functional groups no discussion of how well this analysis applies to mobile functional groups was provided The second problem is that this method does not take into account situations (such as occurs in this study with several groups) in which species occur at only a few locations For example ldquohellipif the test data consist of 95 absences and 5 presences and this reflects the true prevalence of the species on the landscape (a realistic scenario for a rare species) a lsquonullrsquo model that predicted absence in all cases (eg no model at all) would be correct 95 of the timehellipldquo (Franklin 2009 p 151) This latter point is important here as these habitat functional groups (biofilm brown algae native eelgrass green algae Japanese eelgrass tidal marsh biomat and orange sea pens26) appear not to occur over most of the Project area (as portrayed by the model outputs presented in the distribution figures of PMV Response 2016-03-02 Appendix 218) It is therefore important that a robust evaluation of the performance of the Ecospace module is used with preferably more than one measure
In summary the starting point for this modelling analysis matters It is not just about a comparison between results with and without the Project The model has to be considered a sufficient representation of the ecosystem The Proponent has not yet sufficiently validated the model
35 Model results 351 Presentation of model results
As noted above (Section 331) the stated objective of the Roberts Bank ecosystem model was not to provide an assessment of Project impacts for each functional group at a fine temporal scale but to estimate changes in productive potential with and without the Project at the ecosystem level27 However results were presented as comparisons by speciesfunctional group with and without the Project and not as potential changes in total ecosystem productivity The revised figures for each functional group showing distributions without the Project with the Project and their difference indicated impacts were likely to be localized with overall impacts relatively small The range of biomass ratios with and without the Project was 045 ndash 189 with most values slightly less than 1 This is interpreted as indicating slight decreases in the capacity of the study area to support biomass and production with the Project for many functional groups28 (Figure 2)
24 PMV Response 2016-03-02 p 80 lines 1524-1527 25 PMV Response 2016-03-02 p 81 lines 1551-1559 26 PMV Response 2016-03-02 p 82 Table 8 27 PMV Response 2016-03-02 p 99 lines 1914-1917 28 PMV Response 2016-03-02 Appendix 218
Pacific Region Science Response Technical Review Assessing
Ecosystem Productivity Model of Roberts Bank
15
Biomass Ratio
Freq
uenc
y
04 07 10 13 16 19
05
1015
2025
30
Figure 2 Histogram of biomass ratios obtained by comparisons of model runs with and without the project (ie With Without) Values less than 1 indicate reductions in biomass with the Project compared against without the Project) Data from Appendix 218 of PMV Response 2016-03-02
352 Sensitivity and vulnerability analyses Every ecosystem model is only one possible representation of the true ecosystem defined by the modelrsquos structure and the values chosen for its many parameters The key point is how well the model represents the real system how that fit can be measured and the sensitivity of model outputs to variability in the selected parameter values The ideal model should be robust to a wide range of uncertainties in the input data and parameters This robustness is determined by performing sensitivity analyses on the model to see how it responds to variations in the input parameters and determining to which input parameters the model is most sensitive
The vulnerability parameters determine the strength of the feeding interactions between functional groups They set the level of density dependence of each functional group Higher vulnerability settings provide greater top-down (predator) control whereas lower settings provide greater bottom-up (environmental) control29 Several publications have shown that EwE models are very sensitive to the vulnerability parameters and Christensen and Walters (2000) point out that a main pitfall of EwE is that ldquopredation vulnerabilities are often underestimated lessening the modelled impacts of predationrdquo It is usual practice to tune Ecopath models including the vulnerability parameters to time series data such as biomass using the temporal simulation model Ecosim However these data were not available for the RBT2 area so this robust method of fitting the model and estimating vulnerability parameters was not possible Instead a vulnerability setting of 2 was used as the default value for the key model runs which is ldquocommon practice when time series data are not available and estimates of vulnerability in the
29 PMV Response 2016-03-02 p 70 lines 1318-1323
Pacific Region Science Response Technical Review Assessing
Ecosystem Productivity Model of Roberts Bank
16
model cannot be maderdquo30 with sensitivity analyses run for a range of 15 to 3 This narrow range was criticized by DFOECCC in initial discussions about the model with the Proponent The Proponent subsequently reran the model with a larger range of vulnerabilities31 (11 to 10) and concluded this broader vulnerability range produced similar results for the productivity ratio with and without the Project to those in the original EIS and that the EIS was more likely to overestimate than underestimate potential project effects32 The data in Table 7 of the PMV Response33 did indicate changes in productivity ratios ranging from 0 to 50 of the defined key run (which used a vulnerability setting of 2) However the Proponent changed all vulnerability settings to the same value ie all were 2 or all were 10 etc In reality the vulnerability parameters resulting from Ecosim models that are fitted to data as described above vary by functional group which was not explored here Therefore although the results suggest that the original choice of 2 for the default key run seemed reasonable the potential effects of variability in vulnerability settings was not fully explored
Sensitivity analyses are usually based on the range of uncertainty estimated for input data and parameters often called the confidence limits around the model parameters The EwE framework integrates many different data sources and parameters including values from the literature It can therefore be difficult to identify ldquoreasonablerdquo confidence limits when derived from such diverse data sources Standard practice in Ecopath models has been to develop a pedigree for each parameter with default values for uncertainty based on the nature of the source data For example parameter values based on high precision field observations of biomass within the model domain receive default confidence intervals of 10 whereas parameter values based on models developed for elsewhere or professional judgment receive confidence intervals of 8034 Sensitivity analyses are then run using parameter values selected from within these confidence intervals However if these default confidence intervals do not capture the full range of variability then the outputs are not informative of the variability in the lsquorealrsquo ecosystem Field observations were collected for many functional groups within the model domain in 2012 and 2013 as part of studies to support the RBT2 EIS Apparently the purpose of these observations was to document spatial variability (in part for the Ecospace model) and temporal variability (measurements at one location over time) and not to derive confidence intervals around the observations35
The reliance on the pedigree approach to derive confidence intervals for this Roberts Bank model was criticized by DFO ECCC and NRCan in discussions with the Proponent As a result the Proponent reran the model with much larger confidence intervals ranging from 30 to 100 depending on the input parameter and functional group36 The results from this new analysis using the broader confidence intervals were similar to those using the original pedigree approach The Proponent noted that ldquoWhile the production within each helliprun was very different there was little difference in the biomass ratio [with and without the Project] These results further demonstrate that even with a greater range in input values the influence of the Project on the Roberts Bank ecosystem is consistent among allhellipmodel runsrdquo37 This provides confidence that the model may be robust to uncertainty in its input parameters Two concerns
30 PMV Response 2016-03-02 p 70 lines 1321-1322 31 PMV Response 2016-03-02 p 71-74 32 PMV Response 2016-03-02 p 71 lines 1339-1341 33 PMV Response 2016-03-02 p 73 34 EIS Appendix 10-C Section 251 page 18 35 PMV Response 2016-03-02 p 42 lines 772-777 36 PMV Response 2016-03-02 p 44-47 37 PMV Response 2016-03-02 p 47 lines 855-858 and see also PMV Response 2016-03-02 Appendix 27-B
Pacific Region Science Response Technical Review Assessing
Ecosystem Productivity Model of Roberts Bank
17
remain however The quote above indicates that the production among the different model runs was very different although with little difference in the biomass ratios with and without the Project Since biomass is not the same as production it would be informative for understanding model performance and potential impacts to show these production differences This also relates to the point made in Section 34 regarding how well the model represents the real ecosystem and not just within-model comparisons with and without the Project The second question is more technical and relates to how the randomization (Monte Carlo or MC) routine that was used to create multiple model runs used the uncertainty about the diet data Diets are not currently included in the MC routine available to regular users of the Ecosim model how they were handled in this RBT2 model appears not to be explained
Finally the sensitivity analyses indicate that the uncertainty in the input parameters does not lead to much difference between model parameters with or without the project However this conclusion does not describe how the uncertainty in the input parameters affects understanding of the ecosystem
40 Conclusions Overall the main conclusion of the Environmental Impact Statement from the Proponent is stated as ldquohellipafter the implementation of mitigation hellipthe Project is not expected to result in any significant adverse effects on any of the 16 valued componentsrdquo38 In addition ldquohellipapproximately 40 of the functional groups are forecast to change no more than 5 which hellip is judged to be within the uncertainty of the model runsrdquo39 although larger changes were forecast for orange sea pens freshwater biofilm green algae and raptors The conclusions from the modelling studies are that ldquohellipthe proposed project will have an impact on the study area that the effect varies between species and that the findings are robust to parameter uncertaintyrdquo40 Specific outcomes by valued component as derived from the EwE model are presented by functional groups in Table 1
38 PMV March 2015 Roberts Bank Environmental Impact Statement Executive Summary ndash Part 1 page 37 39 EIS Appendix 10-C p ii 40 EIS Appendix 10-D p iv
Pacific Region Science Response Technical Review Assessing
Ecosystem Productivity Model of Roberts Bank
18
Table 1 Changes in productive potential with the Project as derived from the EwE model
Changes in productive potential
Ecosystem category
Number of valued
components
Number with potential
biomass loss
Moderate decrease (31-60 decline)
Minor decrease (6-30 decline)
Negligible (0-5
change)
Minor increase (6-
30 increase)
Moderate increase (31-60 increase)
Source
Marine vegetation
7 7 - 3 2 2 - EIS Vol 3 Section 11 Table 11-17 page 11-65
Marine invertebrates
4 3 1 1 1 1 - EIS Vol 3 Section 12 Table 12-8 page 12-52
Marine fish 13 13 - 2 6 5 - EIS Vol 3 Section 13 Table 13-10 page 13-95
Coastal birds
11 8 - 3 4 3 1 EIS Vol 3 Section 15 Table 15-10 page 15-67
Pacific Region Science Response Technical Review Assessing
Ecosystem Productivity Model of Roberts Bank
19
Most functional groups showed some potential biomass loss with the Project with biomass loss defined as any model run with negative outcomes (ie in which biomass with the project was less than biomass without the Project) The summary of changes in productivity potential are mixed with most (33 out of 35) valued components showing minor decreases to minor increases (defined as 6 to 30 changes in productive potential with the Project compared to without the Project)
The main conclusions of this review in regards to the Terms of Reference are
1 Do the functional groups and abiotic variables used in the model adequately represent the ecosystem at Roberts Bank
o The 58 functional groups and abiotic variables used in the model adequately represent the main components of the Roberts Bank ecosystem however for longer lived species the life stages of the species are not well represented and some of the impacts of the Project may be expected to affect specific life stages
o The abiotic variables adequately represent the physical drivers of this ecosystem on an annual time scale However annual values for these abiotic variables may not adequately capture important sub-annual events such as storms (DFO 2016) the timing of arrival and departure of highly migratory species and whether there may be important sub-annual thresholds or mismatches in timing as a result of the Project
o Biotic factors (eg nutrients) which are particularly important for biofilm and other lower trophic level taxa are not included in this model The model is therefore unable to assess the potential development of eutrophication and benthic organic enrichment events which may affect fish habitats in the study area
2 Are the parameter estimates used by the model valid and defensible for this system
o In general parameter estimates appear to be adequate for this system Field studies were done in two years to provide data in particular on distributions of selected functional groups for the Ecospace module Note the distribution studies focussed on taxa which were relatively immobile and therefore lsquofixedrsquo in space
o the selection of some model parameters would benefit from further explanation for example the choice of fixed diet matrices versus dynamic matrices which can vary with changes in abundances or predators and prey
o the selection of some model parameters would benefit from further explanation for example the link between the diets described in the text of Appendix 10B and the quantities presented in Appendix A of Appendix 10B It is understood that proportions were derived using the ldquofixed selectivityrdquo principle but in order to be fully transparent the derivation of each diet should be provided in an appendix
o discussion and explanation is needed of why ecotrophic efficiencies differ from expected values (eg the ecotrophic efficiency for Pacific herring is listed as 038) and
o the abiotic factor lsquosubstratersquo was limited to ldquohardrdquo or rdquosoftrdquo options which can be restrictive given that they serve as endpoints on a substrate composition continuum These limited options may not provide the sensitivity required to assess substrate preference nor the flexibility for taxa (eg motile organisms) that span hard mixed and soft substrate types In addition it is not clear if changes in the hardsoft categories were considered over time within identified depositional or erosional settings before and after construction
Pacific Region Science Response Technical Review Assessing
Ecosystem Productivity Model of Roberts Bank
20
3 Are the limitations and uncertainties of the model identified and appropriately considered when determining the modelrsquos representation of current and possible future conditions
o the EwE model was not designed to evaluate a range of future conditions It was designed to estimate changes in the productive potential at the ecosystem level with and without the Project Therefore the model was run without the Project and with the Project for a range of plausible abiotic conditions and the results were compared with respect to biomass and productivity by functional group
o the pedigree approach to assessing the uncertainties of model outcomes is unsatisfactory for the purpose here as it relates solely to a qualitative judgment of the value of data based on its source However when the model was rerun with much wider ranges of confidence intervals (uncertainties) the results in general (but not necessarily for each functional group) were similar to the results using the original pedigree approach This suggests that taken overall the model may be robust to wide ranges of uncertainty in these input variables and parameters
o there is inadequate validation of the model This is inadequate for three reasons
(i) the basic Ecopath model is not validated and the Ecospace balancing process (the spin-up period) resulted in some biomass estimates being increased or decreased beyond their confidence limits
(ii) the goodness of fit test used to evaluate how well the model predicted the spatial occurrence functional groups is not fit for purpose (Section 34) and
(iii) validation was provided for only a small number of functional groups (the habitat-forming functional groups) As a consequence the model is currently not validated
o Considering the proportion of open boundaries relative to closed boundaries in the model processes taking place outside the modelled ecosystem are likely to contribute to dynamics within the modelled ecosystem However these external processes may not be well-resolved by the EwE model as currently configured
4 Are the model results related to the potential effects of the Project on fish and fish habitat and migratory birds and their food resources valid and defensible
o this is a very complex ecosystem model constructed for a relatively small and open (in the sense of considerable exchange with adjacent non-modelled areas) system Many assumptions have been made based on poor or missing data Taking all these considerations into account the model does the best job possible of comparing the biomass and productivity of the Roberts Bank ecosystem with and without the Project
o the extent to which the model adequately represents the lsquorealrsquo ecosystem of Roberts Bank as opposed to comparisons of model results with and without the Project is unclear as a number of basic diagnostics are not presented (see point 3 above)
o the EwE model is not capable of and is not designed to represent nutritional and food quality variations in prey functional groups and how these may impact highly migratory predators such as birds with and without the Project
5 Is the EwE model framework a valid method to quantify large scale impacts to fish habitat fish productivity and migratory bird productivity
o the EwE model as implemented in this project and reviewed here is a useful first-order framework to organise information and derive initial estimates of how the system may respond to perturbations
Pacific Region Science Response Technical Review Assessing
Ecosystem Productivity Model of Roberts Bank
21
o the utility of a EWE model for impact purposes is highly dependent on the quality of input data
o each EwE model is highly dependent on local conditions Although appropriate as an overall methodology each application would need to be reviewed for how it may be applied to any new ecosystem and
o the EwE model would need to be substantially reformulated if it was to include considerations of changes in chemical composition or food quality of prey in particular for seasonal migratory species such as birds which may depend on very large biomasses of prey with specific chemical composition to fuel their migrations beyond the ecosystem model boundaries
Contributors Contributor Affiliation Ian Perry Author DFO Science Pacific Region Alida Bundy Author DFO Science Maritimes Region Terri Sutherland Author DFO Science Pacific Region Robert Elner Author ECCC Canadian Wildlife Service Andrew Robinson Author ECCC Canadian Wildlife Service Lesley MacDougall Editor DFO Science Pacific Region
Approved by Carmel Lowe
Regional Director Science Branch Pacific Region Fisheries and Oceans Canada
November 4 2016
Sources of Information Christensen V Coll M Steenbeek J Buszowski J Chagaris D walters CJ 2014
Representing variable habitat quality in a spatial food web model Ecosystems 17 1397-1412
Christensen V and Walters C 2000 Ecopath with Ecosim methods capabilities and limitations Ecological Modelling 172 109-139
Colleacuteter M Valls A Guitton J Gascuel D Pauly D and Christensen V 2015 Global overview of the applications of the Ecopath with Ecosim modeling approach using the EcoBase models repository Ecological Modelling 302 pp42-53
Compass Resource Management Ltd 2013 Roberts Bank Terminal 2 Technical Advisory Group (TAG) Process Report Productive Capacity ndash Final Report 119pp (Accessed November 1 2016)
DFO 2016 Technical Review of Roberts Bank Terminal 2 Environmental Assessment Section 95 ndash Coastal Geomorphology DFO Can Sci Advis Sec Sci Resp 2016045 (Accessed November 4 2016)
Pacific Region Science Response Technical Review Assessing
Ecosystem Productivity Model of Roberts Bank
22
ESSA Technologies 2014a Roberts Bank Terminal 2 Project Roberts Bank Delta BC Environmental Impact Statement Volume 3 Biophysical Effects Assessments Appendix 10-C Roberts Bank Ecosystem Model Development and Key Run Port Metro Vancouver (Accessed November 1 2016)
ESSA Technologies 2014b Roberts Bank Terminal 2 Project Roberts Bank Delta BC Environmental Impact Statement Volume 3 Biophysical Effects Assessments Appendix 10-D Roberts Bank Ecosystem Model Sensitivity Analyses Port Metro Vancouver (Accessed November 1 2016)
Franklin J 2009 Mapping Species Distributions Spatial Inference and Prediction Cambridge University Press Cambridge
Hemmera 2014 Roberts Bank Terminal 2 Project Roberts Bank Delta BC Environmental Impact Statement Volume 3 Biophysical Effects Assessments Appendix 10-B Roberts Bank Ecosystem Model Parameter Estimates Port Metro Vancouver File 302-03503 (Accessed November 1 2016)
Port Metro Vancouver 2015a Roberts Bank Terminal 2 Project Roberts Bank Delta BC Environmental Impact Statement Volume 3 Biophysical Effects Assessments Section 100 Biophysical Setting (Accessed November 1 2016)
Port Metro Vancouver 2015b Roberts Bank Terminal 2 Project Roberts Bank Delta BC Environmental Impact Statement Volume 3 Biophysical Effects Assessments Section 103 Overview of Assessing Ecosystem Productivity (Accessed November 1 2016)
Port Metro Vancouver 2015c Roberts Bank Terminal 2 Project Environmental Assessment Additional Information Requirements (July 31 2015) Responses Response to Information Request 6 IR-73115-06 Canadian Environmental Assessment Agency Reference Number 80054 dated 26 October 2015
Steenbeek J Coll M Gurney L Meacutelin F Hoepffner N Buszowski J and Christensen V 2013 Bridging the gap between ecosystem modeling tools and geographic information systems Driving a food web model with external spatialndashtemporal data Ecological Modelling 263 139ndash 151
Sutherland T Elner R and OrsquoNeill J 2013 Roberts Bank Ecological crucible of the Fraser River estuary Progress in Oceanography 115 171ndash180
Vancouver Fraser Port Authority 2016 From the Vancouver Fraser Port Authority to the Review Panel re Answers to preliminary technical questions submitted during the completeness phase from Fisheries and Oceans Canada Natural Resources Canada and Environment and Climate Change Canada concerning the ecosystem modelling to support the Roberts Bank Terminal 2 Project environmental review CEAR Document 547 (Accessed November 1 2016)
Pacific Region Science Response Technical Review Assessing
Ecosystem Productivity Model of Roberts Bank
23
This Report is Available from the Centre for Science Advice
Pacific Region Fisheries and Oceans Canada
3190 Hammond Bay Road Nanaimo BC V9T 6N7
Telephone (250) 756-7208 E-Mail csapdfo-mpogcca
Internet address wwwdfo-mpogccacsas-sccs
ISSN 1919-3769 copy Her Majesty the Queen in Right of Canada 2016
Correct Citation for this Publication
DFO 2016 Technical review of Roberts Bank Terminal 2 environmental assessment section 103 ndash assessing ecosystem productivity DFO Can Sci Advis Sec Sci Resp 2016050
Aussi disponible en franccedilais
MPO 2016 Examen technique de leacutevaluation environnementale du Terminal 2 agrave Roberts Bank section 103 ndash eacutevaluation de la productiviteacute de leacutecosystegraveme Secr can de consult sci du MPO Reacutep des Sci 2016050
- TECHNICAL REVIEW OF ROBERTS BANK TERMINAL 2 ENVIRONMENTAL ASSESSMENT SECTION 103 ndash ASSESSING ECOSYSTEM PRODUCTIVITY
-
- 10 Context
- 20 Background
-
- 21 Background and Terms of Reference
- 22 Approach to assessing ecosystem productivity
-
- 30 Analysis and Response
-
- 31 The EwE Team
- 32 Overview of assessment results of hydrological and sediment modelling
- 33 Model implementation
-
- 331 The purpose of the EwE model
- 332 Applicability of the EwE model framework to the Roberts Bank region
- 333 Model documentation
- 334 Highly mobile functional groups
- 335 Seasonality (model time step)
- 336 Life history structure
- 337 Model balancing
-
- 34 Model validation
- 35 Model results
-
- 351 Presentation of model results
- 352 Sensitivity and vulnerability analyses
-
- 40 Conclusions
- Contributors
- Approved by
- Sources of Information
- This Report is Available from the
-
- CSAS 2016-50 - Assessing Ecosystem Productivitypdf
-
- TECHNICAL REVIEW OF ROBERTS BANK TERMINAL 2 ENVIRONMENTAL ASSESSMENT SECTION 103 ndash ASSESSING ECOSYSTEM PRODUCTIVITY
-
- 10 Context
- 20 Background
-
- 21 Background and Terms of Reference
- 22 Approach to assessing ecosystem productivity
-
- 30 Analysis and Response
-
- 31 The EwE Team
- 32 Overview of assessment results of hydrological and sediment modelling
- 33 Model implementation
-
- 331 The purpose of the EwE model
- 332 Applicability of the EwE model framework to the Roberts Bank region
- 333 Model documentation
- 334 Highly mobile functional groups
- 335 Seasonality (model time step)
- 336 Life history structure
- 337 Model balancing
-
- 34 Model validation
- 35 Model results
-
- 351 Presentation of model results
- 352 Sensitivity and vulnerability analyses
-
- 40 Conclusions
- Contributors
- Approved by
- Sources of Information
- This Report is Available from the
-
Canadian Science Advisory Secretariat Pacific Region Science Response 2016050
December 2016
TECHNICAL REVIEW OF ROBERTS BANK TERMINAL 2 ENVIRONMENTAL ASSESSMENT SECTION 103 ndash
ASSESSING ECOSYSTEM PRODUCTIVITY
10 Context Vancouver Fraser Port Authority (VFPA) formerly Port Metro Vancouver (the Proponent) is proposing to construct and operate the Roberts Bank Terminal 2 Project (the Project) a new three-berth marine container terminal at Roberts Bank in Delta British Columbia The proposed terminal is located next to the existing Deltaport and Westshore Terminals In addition to the construction of the new terminal the Proponent has proposed to widen the north side of the existing Roberts Bank causeway from its east-end connection with the mainland to the entrance to the new terminal The existing tug basin connected to the northeast side of Deltaport Terminal is also proposed to be expanded The new marine terminal is predicted by the Proponent to process up to 260 container ship calls per year at full capacity with the assistance of two or three large berthing or escort tugs to manoeuver ships into or away from assigned berths The terminal is designed to operate 24 hours per day year-round
The Roberts Bank Terminal 2 Project is subject to an environmental assessment by a Review Panel pursuant to the Canadian Environmental Assessment Act 2012 As a federal authority in the environmental assessment for the Project Fisheries and Oceans Canada (DFO) will be asked to present information to the review panel and at public hearings in relation to its expertise on the effects of the Project on fish and fish habitat including aquatic species at risk and the adequacy of mitigation and offsetting measures and monitoring and follow-up programs proposed by the Proponent DFOrsquos Pacific Region Fisheries Protection Program (FPP) will coordinate DFOrsquos participation in the environmental assessment
The Proponent assessed future ecosystem productivity at Roberts Bank using the Ecopath with Ecosim and Ecospace (EwE) model framework The potential impacts of the Project to hydrodynamic conditions and sediment transport in the area as a result of changes in wind wave and current patterns and intensities are projected using different model frameworks A companion Science Response (DFO 2016) has been developed by DFO and Natural Resource Canada (NRCan) to review Section 95 ldquoCoastal Geomorphologyrdquo of the Environmental Impact Statement (EIS) which describes the hydrodynamic and sedimentology models that were used to evaluate the effect of the Project on water and sediment movements
Outcomes of the EwE models are incorporated into the analysis of the potential project-related effects on the ongoing productivity of commercial recreational and Aboriginal fisheries Consequently DFO FPP has requested that DFO Science Branch provide an evaluation of the Proponentrsquos characterization of project-related effects as conducted using the Ecopath with Ecosim and Ecospace (EwE) ecosystem model
Pacific Region Science Response Technical Review Assessing
Ecosystem Productivity Model of Roberts Bank
2
The objectives for this Science Response are to
1 Determine if the functional groups and abiotic factors used in the model adequately represent the ecosystem at Roberts Bank
2 Assess whether the parameter estimates used by the model are valid and defensible for this system
3 Assess whether the limitations and uncertainties of the model are identified and appropriately considered when determining the modelrsquos representation of current and possible future conditions
4 Provide advice regarding whether the model results related to the potential effects of the Project on fish and fish habitat and migratory birds and their food resources are valid and defensible
5 If possible provide advice regarding the validity of using the EwE model framework to quantify large scale impacts to fish habitat and fisheries productivity and the productivity of migratory birds
This Science Response evaluates Section 100 ldquoBiophysical Settingrdquo with a focus on Section 103 ldquoOverview of Assessing Ecosystem Productivityrdquo in the EIS as submitted by the Proponent (Port Metro Vancouver 2015) This Section and consequently this Response describes the ecosystem modelling approach that was taken to evaluate the direct and indirect effects of the footprint of the proposed terminal and widened causeway herein referred to as lsquothe Projectrsquo This ecosystem model provides outputs related to potential effects of the project on the study area at an ecosystem level including aquatic species and bird species in the Project area Evaluation of the model and its outputs therefore required expertise in both fishery aquatic species and migratory bird species Consequently this Science Response is the product of a joint review between DFO and Environment and Climate Change Canada (ECCC) Canadian Wildlife Service and Wildlife and Landscape Science to provide a complete evaluation
This Science Response Report results from the Science Response Process of July 2016 on the Technical Review of Ecopath with Ecosim and Ecospace (EwE) Ecosystem Productivity Model application to the Roberts Bank Terminal 2 Environmental Assessment
20 Background
21 Background and Terms of Reference The Projectrsquos main components have a proposed combined marine footprint area of approximately 179 km2 listed below by specific component
bull Marine Terminal 1335 km 2 including terminal (116 km 2) and dredged berth pocket and marine approach areas (0174 km 2)
bull Widened Causeway 0424 km 2
bull Expanded Tug basin 0031 km 2
Roberts Bank in the Fraser River estuary consists of complex intertidal and subtidal habitats including intertidal eelgrass beds and is an important stopover area for migrating shorebirds and productive feeding and rearing habitats for many fish and invertebrate species It also provides habitat for endangered Southern Resident Killer Whales and other marine mammals
Pacific Region Science Response Technical Review Assessing
Ecosystem Productivity Model of Roberts Bank
3
The environmental conditions at Roberts Bank are dynamic and are influenced by a variety of oceanographic and atmospheric factors including the Fraser River freshwater and sediment plume discharge diurnal tidal currents and prevailing and storm-generated wind and wave activity In addition the intercauseway region provides significant drainage from marsh and agricultural areas which have different characteristics from marine waters and which run along the ferry causeway
To provide the required science advice this Science Response focusses on Section 10 ldquoBiophysical Settingrdquo of the Environmental Impact Statement (EIS) (Port Metro Vancouver 2015a) specifically Section 103 ldquoOverview of Assessing Ecosystem Productivityrdquo (Port Metro Vancouver 2015b) and its related Appendices 10-B ldquoRoberts Bank Ecopath with Ecosim and Ecospace model parameter estimatesrdquo (Hemmera 2014) Appendix 10-C ldquoRoberts Bank Ecosystem model development and key runsrdquo(ESSA Technologies 2014a) and Appendix 10-D ldquoRoberts Bank Ecosystem model sensitivity analysesrdquo (ESSA Technologies 2014b) Additional important information was obtained from the Response to Information Request 6 (IR-73115-06 Canadian Environmental Assessment Agency Reference Number 80054 dated 26 October 2015) (Port Metro Vancouver 2015c) and the Written Responses to Coastal Geomorphology and Ecosystem Modelling Questions provided by the Proponent to DFO ECCC and NRCan on 2 March 2016 (Port Metro Vancouver (PMV) Transmittal TRE-01-RBT2-0004A subsequently referred in this Science Response as ldquoPMV Response 2016-03-02rdquo) (Vancouver Fraser Port Authority 2016)
The process followed in preparing this Science Response involved an initial review of the submitted EIS followed by an in-person meeting of the Proponent its contractors and representatives of DFO ECCC and NRCan to discuss and clarify questions arising from the initial review (Vancouver 23 November 2015) DFO and NRCan provided written questions to the Proponent based on preliminary review of the EIS on November 19 2015 ECCC also provided written questions based on its preliminary review of the EIS to the Proponent on December 1 2015 and January 20 2016 This large initial meeting was followed by smaller focussed meetings between the Proponent its contractors and DFO and NRCan on 11 December 2015 to clarify hydrology and sediment modelling questions with DFO on 8 January 2016 to clarify ecosystem modelling questions and with ECCC on 18 February 2016 to clarify questions relating to birds Written responses to all of these meetings and questions were provided by the Proponent to DFO ECCC and NRCan as the ldquoPMV Response 2016-03-02rdquo and ldquoPMV Response 2016-05-30rdquo (Vancouver Fraser Port Authority 2016) VFPArsquos answers to questions posed by DFO and NRCan regarding coastal geomorphology modelling have been posted to the Canadian Environmental Assessment Registry (CEAR)
22 Approach to assessing ecosystem productivity The Proponent adopted an ecosystem approach to evaluate the direct and indirect effects of the Project on the productivity of the Roberts Bank ecosystem A weight of evidence approach was used to assess the potential effects of the project on the productivity of the ecosystem and selected key components in the study area this approach included a spatial ecosystem simulation model (which included a habitat capacity model) a shorebird opportunity model and empirical data An important point is that any effects on the system during the construction phase or from expansion of the tug basin were excluded from this modelling process the focus instead being a comparison of modelled system productivity before and after the proposed terminal and expanded causeway is in place The chosen ecosystem simulation model was
Pacific Region Science Response Technical Review Assessing
Ecosystem Productivity Model of Roberts Bank
4
Ecopath with Ecosim and its spatial version Ecospace (collectively referred to here as the EwE framework or EwE model) This modelling approach was recommended by a prior Productive Capacity Technical Advisory Group comprised of representatives of technical experts from government agencies academia non-governmental organizations Vancouver Fraser Port Authority and its consultants (Compass 2013) convened by the Proponent and which also recommended a selection of focal species for the model The final selection of functional groups and the resulting food web that form the core of this ecosystem model are shown in Figure 1
Pacific Region Science Response Technical Review Assessing
Ecosystem Productivity Model of Roberts Bank
5
Figure 1 Ecopath with Ecosim model food web for Roberts Bank (Adapted from EIS Volume 3 Section 10 Fig 1033 on page 10-16) The groups coloured in orange represent focal groups size of symbols represents relative annual amount of biomass in the Roberts Bank study area
Pacific Region Science Response Technical Review Assessing
Ecosystem Productivity Model of Roberts Bank
6
The EwE framework is a common approach to ecosystem modelling which has been developed and expanded over the past two to three decades It currently has three main components
1 Ecopath ndash the core model which provides a mass-balance snapshot of the system
2 Ecosim ndash a module that enables simulation modelling over time
3 Ecospace ndash a module that enables simulation modelling over space
In order to make an EwE model tractable species are aggregated into functional groups based on their similar ecological characteristics (habitat and prey preferences etc) the Roberts Bank models had 58 functional groups The first step (Ecopath) was to obtain input parameters representing biomass production consumption emigration and diet for each functional group These parameters were then tuned in an iterative process until the overall production and consumption was balanced (a mass-balance approach) resulting in a model food web with estimates of energy flow between functional groups (Fig 1)
In the second step Ecosim was combined with the spatial model Ecospace The abiotic variables selected in this EIS (depth salinity bottom current wave height sediment type) were used as external forcings to the Ecospace module These abiotic variables provided the physical forcings for the simulations without and with the Project Since time series data on the functional groups of the model were not available Ecospace was run until the model reached equilibrium using various assumptions of the value of the vulnerability parameter (see Section 352) In this EIS the selected time step was annual with all variables abiotic and biotic expressed as yearly averages As used in this EIS the Ecospace module included a habitat capacity model which estimated the distribution of functional groups based on their environmental preferences for each abiotic variable (depth salinity bottom current wave height) and for substrate type (sand mud etc) The model thus allocated the spatial distribution of functional groups over the model domain based on their environmental preferences and the distributions of these abiotic variables with and without the Project The selected spatial unit size (ldquopixelrdquo) for the Ecospace model was 100 m2 In essence an Ecopath model was constructed for each pixel with particular rules governing how the functional groups interacted and moved among these spatial units The Ecospace module was run until it approached equilibrium (20 model years) to establish the spatial patterns without the Project For the lsquowith the Projectrsquo simulations the model was run for an initial 10 years and then the spatial patterns of the abiotic variables with the project were added and the model run for an additional 10 years1 The model outputs predicted changes in the productive potential of the Roberts Bank ecosystem as a comparison (ratio) with and without the Project rather than an absolute biomass that would be lost or gained as a result of the Project
1 EIS Appendix 10-C p 26
Pacific Region Science Response Technical Review Assessing
Ecosystem Productivity Model of Roberts Bank
7
30 Analysis and Response To prepare this response the following sections of the EIS additional documents were reviewed
DocumentSection Title
EIS Section 10
Including appendices 10B 10C and 10D
(Port Metro Vancouver 2015a Hemmera 2014 ESSA Technologies 2014a ESSA Technologies 2014b)
Biophysical Setting
Appendix 10-B Roberts Bank Ecosystem Model Parameter Estimates Port Metro Vancouver File 302-03503
Appendix 10-C Roberts Bank Ecosystem Model Development and Key Run Port Metro Vancouver
Appendix 10-D Roberts Bank Ecosystem Model Sensitivity Analyses Port Metro Vancouver
CEAR document 547 (Including Appendices) ldquoPMV Response 2016-03-02rdquo and ldquoPMV Response 2016-05-30rdquo
(Vancouver Fraser Port Authority 2016)
Vancouver Fraser Port Authority to the Review Panel re Answers to preliminary technical questions submitted during the completeness phase from Fisheries and Oceans Canada Natural Resources Canada and Environment and Climate Change Canada concerning the ecosystem modelling to support the Roberts Bank Terminal 2 Project environmental review
31 The EwE Team Building this ecosystem model was a complex undertaking which required knowledge of the ecosystem to be modelled how to set initial parameter values determination of reasonable ranges of these parameters how to balance the model and how to recognize when the model outputs were unrealistic These tasks became even more complex when spatial model dynamics were involved such as with Ecospace The team engaged by the Proponent to conduct this ecosystem modelling for the Roberts Bank Terminal 2 (RBT2) EIS was led by scientists at the Institute for Oceans and Fisheries located at the University of British Columbia in Vancouver These scientists are global leaders of the EwE model framework having developed much of its current implementation and who continue to lead its elaborations and extensions Construction and running of the model for this specific ecosystem was done in collaboration with ESSA Technologies of Vancouver Parameter values for the ecosystem model were obtained in part from observational studies conducted in the area by Hemmera of Burnaby BC
32 Overview of assessment results of hydrological and sediment modelling Implementation of the ldquowith the Projectrdquo simulations of the ecosystem model was done by driving the model with the abiotic variables as they were projected to be distributed with the Project footprint In the context of this EIS specifying depth salinity bottom currents wave height and sediment type conditions without the Project and changes with the Project were achieved by construction of hydrodynamical and sediment transport models The outputs from these models in combination with the identified environment preferences for the various biological groups were then used as inputs to the Ecospace model to define the spatial
Pacific Region Science Response Technical Review Assessing
Ecosystem Productivity Model of Roberts Bank
8
distributions of these functional groups The implementation of these hydrological and sediment transport models in this EIS was reviewed by DFO and NRCan (DFO 2016) This review concluded that the implementation of these models for this EIS was adequate for average winter conditions but lacking in validation for summer conditions in particular with strong freshwater flows from the Fraser River Simulations of strong storm events and their impacts on wave conditions and sediment transport were also lacking The effect of wave action and current speeds on sediment transport is non-linear such that increasing winds over short periods of time can impact sediment transport processes bottom topography and water depths beyond that determined under average model conditions Overall the review concluded that a greater range of sensitivity analyses is required to have confidence in the model outputs under lsquonon-averagersquo conditions The implication of this conclusion for the present review of the EwE model is that the full range of variability of abiotic characteristics such as bottom topography bottom current and wave heights and how they may affect relevant functional groups in the model with the Project may not be adequately represented Sensitivity analyses were provided by varying the intensity of abiotic variables and by removing abiotic variables to assess their interactive effects In general the ecosystem model outputs were robust to these sensitivity analyses with most groups varying by less than 5 Larger changes however were observed for primary producer and bird groupings and for some fish groups when various abiotic variables were omitted2
33 Model implementation 331 The purpose of the EwE model
The EwE model was intended to provide one line of evidence to assess the potential impacts of the Project on the Roberts Bank ecosystem which would then be used with other lines of evidence to make the final assessment Specifically ldquohellip the objective of the RB [Roberts Bank] model was not to provide an assessment of Project impacts for each functional group at a fine temporal scale but to estimate changes in productive potential with and without the Project at the ecosystem levelrdquo3 In addition ldquohellipthe primary objective of the RB ecosystem model is to evaluate potential changes in productivity from such abiotic factors with and without the terminal and causewayrdquo4 Results are presented for the selected functional groups no results were presented on potential changes in ecosystem structure or function
332 Applicability of the EwE model framework to the Roberts Bank region EwE models work best when the exchanges within the system being modelled are greater than the exchanges between the modelled system and the lsquooutsidersquo world In practice this means that EwE models work best for larger systems with few external exchanges In a meta-analysis of 433 Ecopath models Colleacuteter et al (2015) concluded that ldquohellipin the last two decades the range of the models area has expanded toward very large areas and the median has shifted accordingly from about 1000 km2 in 1984ndash1993 to about 100000 km2 in 1994ndash2014rdquo The section of the Roberts Bank ecosystem that is included in the EwE model was comparatively small (5468 km2) and complex It is an intertidally-dominated environment that is subject to strong seasonal influences of both freshwater and marine exchanges across relatively large seaward and shoreward boundaries
2 EIS Appendix 10-D p ii - iii 3 PMV Response 2016-03-02 p 99 lines 1914-1917 4 PMV Response 2016-03-02 p 38 lines 689-691
Pacific Region Science Response Technical Review Assessing
Ecosystem Productivity Model of Roberts Bank
9
Processes taking place outside the modelled ecosystem will contribute to dynamics within the modelled ecosystem (eg lsquooutsidersquo food supporting predators which occur in the Roberts Bank ecosystem for only part of the year predators which may feed in the Roberts Bank ecosystem but export this energy when they migrate out of the region) but which may not be well-resolved by the EwE model The Proponent justifies the spatial scale because it was specifically chosen for the questions being asked in regard to assessing productivity changes and because the relative influences of external exchanges are assumed to be identical with and without the project In addition highly mobile species with broad prey bases were assumed in the model to be partially sustained by external energy from outside the model system5 The distributions of organisms may differ however with and without the project which may affect their interactions with areas outside of the modelled system and the use of diets from outside the modelled system may not reflect the impacts of the project Further clarification of how the EwE model captures the exchanges and interactions with adjacent ecosystems are needed For example it could be argued that an ecosystem which is open to frequent exchanges of water and organic matter from beyond its boundaries might be more robust to local disturbances such as the Project
There are some inconsistencies in the information and assumptions used for some of the taxa in this ecosystem model For Dungeness Crab the justification for estimating total adult biomass (including females) from the biomass of fished males is unclear In addition it is unclear if the slower growth of female crabs once they have reached sexual maturity in comparison with male crabs has been considered The diet matrix for spiny dogfish does not represent the actual diet well in particular of euphausiids herring and shrimp and there are more recent references for biomass estimates of spiny dogfish in the study area than what was used in the EIS
Fishing mortality was not included in the model under the assumption that this would not change with or without the project While this assumption may be true the model has been parameterized by ignoring a source of mortality that will influence total production In essence fishing removes biomass from the ecosystem with the result that less biomass will be available for higher trophic levels How this may impact the ecosystem with and without the Project is unclear but it could make noticeable differences if for example there were thresholds in the feeding responses by these higher trophic level species The Ecopath model that was used is relatively unconstrained since many ecological efficiencies are low even for forage species which would be expected to be higher It is not clear how many species are exploited or the levels of exploitation but even if this does not change with the Project these mortality rates should be included in the model in order to add realistic constraints to the exploited functional groups
333 Model documentation Based on questions from DFO ECCC and NRCan following their initial review of the EIS the Proponent provided written responses dated 2 March 2016 to clarify several of the steps in the model development and implementation However several questions remain including questions about the Ecospace module Ecospace has undergone several recent developments such as the inclusion of the spatial-temporal data layer framework (Steenbeek et al 2013) the habitat capacity model (Christensen et al 2014) and the Monte Carlo analysis including the diet matrix As yet there are few published studies using these latest Ecospace developments and their documentation and justification need to be improved in the EIS
5 PMV Response 2016-03-02 p 29 lines 446 - 464
Pacific Region Science Response Technical Review Assessing
Ecosystem Productivity Model of Roberts Bank
10
Questions also remain regarding how the Monte Carlo randomization routine treated diet data The report indicates that the Monte Carlo routine randomly selected input parameters from the input ranges and that only models that were balanced were used This suggests that a high proportion of models were not balanced and therefore were not used (for example the EIS indicates that about one out of 1000 sampled input parameters was balanced6) A table showing the minimum maximum mode average and median values from the Monte Carlo runs for all the parameters would enable an evaluation of how much variation was actually sampled by the balanced model runs This is recommended in the EwE user information ie ldquoUsers should check the range of the input parameters that were actually used in the trials in the output csv file (see below)rdquo7
In addition there are several issues with the documentation of the derivation of the parameters for the functional groups Such documentation should clearly outline how the input parameter was estimated and the range of uncertainty for that parameter For example the input biomass of pinnipeds was defined as 04 t km 2 derived from estimates of 034 for Harbour seals and two estimates for Steller sea lions (012 and 014 t km 2) No explanation was provided for how the overall estimated pinniped biomass of 04 t km 2 was determined The diet of Sand Lance was described in the EIS as consisting mostly of zooplankton8 whereas the diet table for the model runs9 included 20 macrofauna 10 green algae and 10 detritus It is unclear why these additional prey were included in the diet used for the model runs
334 Highly mobile functional groups This implementation of the EwE framework included transient and migratory functional groups This is entirely appropriate and these groups cannot be excluded The approach taken in the Ecospace module was to impose a low (and conservative) dispersal rate among model spatial units (lsquopixelsrsquo) of 1 km yr-1 This may be appropriate for low mobility benthic organisms but it likely underestimates the movements of many other functional groups The effects of using higher and perhaps functional-group-specific dispersal rates was not considered The Proponents argued that higher dispersal rates would reduce impacts since species can move away from less desirable areas more quickly for completeness these runs should be done and evaluated Mobile species will also bring energy (food) captured outside the system into the modelled ecosystem This process was included in the model with the use of a diet import factor reflecting the consumption of prey outside the modelled region with the assumption that groups with high import rates were unlikely to respond to local changes on Roberts Bank10 This assumption needs justification perhaps at the functional group level for example many species of highly migratory birds and Pacific salmon use the Roberts Bank ecosystem to obtain food to continue their migrations Although this food does not compose a large fraction of their annual consumption it can be critical to enable them to continue their migrations
The EwE model is not designed to capture differences in prey quality ie differences in essential fatty acid or nutrient ratios The same species of prey may have greater or lesser nutritional value to predators depending on the conditions under which they are growing and their seasonal variations This is a particular concern with the nutritional quality of the diatom-dominated biofilm Diatomaceous biofilm is important to the highly migratory Western Sandpiper (Calidris mauri) Despite its predictive merits in relation to other ecosystem
6 EIS Appendix 10D Section 24 p5 7 EwE Help file p 151 8 EIS Appendix 10B Section 4133 p 76 9 EIS Appendix A of Appendix 10B 10 PMV Response 2016-03-02 p 28 lines 429 - 436
Pacific Region Science Response Technical Review Assessing
Ecosystem Productivity Model of Roberts Bank
11
components the EwE model is not informative with respect to understanding the potential impacts of the Project on biofilm and the Western Sandpiper While this example is specific to seabirds the potential exists for differences in the quality of biofilm to also be an issue for copepods which feed on biofilm and consequently to juvenile salmon which feed on these copepods (eg Sutherland et al 2013)
The EwE model is also not designed to predict effects of the Project on water quality although the Proponent noted that ldquoOther abiotic factors not included were deemed to be representative of variables that were already included in the modelhelliprdquo11 The Project may cause changes in physical and water quality conditions whether in isolation or in combination which may impact the productivity or nutritional quality of key prey organisms for local and migratory species which will not be captured by the model The EwE model does not assess the production of key nutrients or the implications of changes in important physical and water quality parameters to biofilm community structure and hence to important migratory birds
The model does not include biotic factors for both pelagic and benthic environments to assess the potential development of eutrophication and benthic organic enrichment events respectively Organic and redox indicators traditional measures of environmental assessments that are used to determine changes in functional group responses were included in the recent Deltaport Third environmental assessment (ie Pelagic chlorophyll dissolved nutrients Benthic sediment carbonnitrogen content redox state [sulfide concentration]) Benthic anoxic events based on organic enrichment are known to be strong drivers of community composition and exclusion regardless of substrate type In the absence of biotic factors (eg organic particulates) the model has not considered the potential for benthic organic enrichment which coincides with siltation processes within the upper tidal flats The tidal flat corner bordered by the Delta-dyke and Deltaport causeway has served as a catchment area for Fraser River silt since the development of the original Deltaport causeway (Sutherland et al 2013) The proposed position of the new terminal placed at the seaward termination of the Deltaport causeway may produce a crescent-shaped feature in the wake of the Fraser River Plume This feature may provide a more efficient silt trap that will promote benthic organic enrichment This piece of the environmental assessment seems to be missing and is important for assessing fish habitat in this area
335 Seasonality (model time step) Input data to parameterize the model were available on a range of time scales from hourly (eg physical data on salinity and water flow) to annual (eg species biomass) The Proponents indicated12 that this is a strength of the EwE model although ultimately the model was run with an annual time step with all sub-annual values being averaged to annual values This method therefore did not incorporate important seasonal processes such as winter-summer differences in salinity and storm properties and the seasonal appearances of abundances of predators and prey such as migratory salmon and birds that are much larger than the annual average For example juvenile salmon migrate from the Fraser River and onto Roberts Bank in the spring before moving into deeper waters If these spring abundances are averaged over the entire year these average abundances would be 5-10 times lower than the actual abundances during the spring (ie averaging the biomass that occurs in two months over a 12 month period) Additionally this method did not capture the intensity of processes such as growth and predation which can be focused over periods of a few weeks to a few months There may be important threshold effects at particular times and places which may be missed when using an 11 EIS Section 10 p 10-11 12 PMV Response 2016-03-02 p 86 line 1655
Pacific Region Science Response Technical Review Assessing
Ecosystem Productivity Model of Roberts Bank
12
annual time step for the model The Ecospace module has a monthly time step13 and therefore it is feasible to run this module with a sub-annual time step For example the Proponents submit14 that there are inadequate data to model the potential effects of the Project on the timing of biofilm production which could have implications for the migratory dunlin and Western Sandpiper However this could be modelled in an exploratory way to determine hypotheses about which factors could affect the timing of production of biofilm and the potential impacts on these birds These issues are of major concern to ECCC
336 Life history structure The EwE model did not separate functional groups into life history stages (stanzas) yet for many functional groups the juvenile stages can have very different life history characteristics and habitats than the adults It is unclear in the description of the model how different life history structures were considered and whether for example there were enough juveniles to produce the adults The implications of not including early life stages should be explored at least qualitatively to identify which species might have life stages that may be more vulnerable to project effects
337 Model balancing Balancing an EwE model is the process by which parameters are adjusted so that there is sufficient production for consumption requirements ie there are sufficient prey for all predators Expert opinion was used to examine parameter values and to adjust for errors or inconsistencies in logic ldquoPMV is confident that since the approach taken to balance the model was based on best practices the steps are appropriaterdquo15 Adjustments to initial parameters to ensure an ecologically-feasible model are necessary and to be expected For a few functional groups however very large changes to initial parameter estimates (which were often not based on Roberts Bank specific data) were necessary for example to transient killer whales When such initial parameters were adjusted (often by substantial amounts) by expert opinion to balance the model the confidence intervals around these adjusted parameter values were not increased to reflect this added uncertainty (see for example PMV Response 2016-03-02 p 51 lines 955-956) When expert opinion was used to make very large changes to initial parameter values broader confidence intervals about these parameters should have been applied This does not appear to have been the case and as a consequence may cause the actual uncertainty of the model outputs to be underestimated
Another example is for the pinniped group in which 50 of the diet was assumed to come from outside the model area in order to balance the model The rationale provided was ldquoThe pinnipeds caused excessive predation mortalities on numerous fish functional groups The biomass of pinnipeds was an average for the Strait of Georgia which was likely too high for Roberts Bank Therefore it was assumed that pinnipeds extracted only half of their diet from the study areardquo16 It is unclear whether the sensitivity of the model to different percentages of diet allocation was explored
As noted above (332) the Ecopath model was relatively unconstrained and few adjustments to input parameters were required to balance the model This is unusual and the low ecotrophic efficiencies of several functional groups suggest that full accounting of energy flows may not have been achieved (an ecotrophic efficiency of 1 indicates that 100 of the production of that
13 EIS Appendix 10C Section 29 p24 14 EIS Appendix 10D Appendix C p72 15 PMV Response 2016-03-02 p 49 lines 910-912 16 EIS Appendix 10C Section 261 p 20
Pacific Region Science Response Technical Review Assessing
Ecosystem Productivity Model of Roberts Bank
13
particular group is being preyed upon or removed by fishing leaving no individuals to die of old age17) An ldquoexcessrdquo of individuals dying of old age ie ecotrophic efficiencies much less than 1 suggests a potentially large biomass that is not used by the ecosystem and instead is converted to detritus
34 Model validation Model validation is the process by which the model parameters variables and outputs are compared with those from the real ecosystem to ascertain how well the model represents the ecosystem It is an essential step in providing confidence that the projections from the model in this case with and without the Project have relevance to how the real ecosystem may be expected to function with and without the Project In practice validating complex ecosystem models is difficult considering the range of assumptions that must be made when building the model the limited available data and natural variability of the ecosystem at a variety of time and space scales
Many of the standard diagnostics for the Ecopath model have not been evaluated in the EIS The Proponent appears to have assumed that once the Ecopath model was balanced then it was valid and fit for purpose The Proponent should provide all the Ecopath estimates of vital rates including mortality rates As presented questions remain For example many Ecotrophic Efficiencies (which control the transfer of biomass from prey to predators) are less than 1 even for taxa which would be expected to be close to 1 such as carnivorous zooplankton The reason for Ecotrophic Efficiencies less than 1 were not discussed or explained in the EIS
Detailed diagnostics for the Ecospace model should also be presented in order to evaluate model performance In response to criticisms by DFO ECCC and NRCan in discussions with the Proponent the latter provided the biomass of the functional groups from the Ecopath model (before Ecospace) and the Ecospace model after the spin-up period (which involved adjusting the parameters from the Ecopath model to balance the 5468 separate cells of the Ecospace model)18 The Proponents argue that ldquoIt is important to note that changes in biomass values generated during the spin-up period are identical for both with and without Project scenarios and thus do not provide information on the potential Project-related effects on productivity19 However several changes to biomass result from the Ecospace balancing process (spin-up period) This is only given brief attention by the Proponent in its response to the DFO ECCC and NRCan questions An analysis of Table 620 revealed that the biomass of 9 functional groups was larger or smaller than the widest confidence limits allowed for each group21 This requires further discussion and justification
The Proponent used a goodness of fit measure to compare spatial distributions of model outputs with field observations They indicated that ldquono other EwE models were identified which use a goodness-of-fit measure Hence the RB model is potentially the first such EwE model where a goodness of fit measure has been appliedrdquo22 The chosen goodness of fit measure is the percent correct classification (PCC) method23 This method derives a test statistic based on the proportion of locations at which predicted occurrences from the model match observed
17 EIS Appendix 10-B p 11 18 PMV Response 2016-03-02 p 65-66 Table 6 19 PMV Response 2016-03-02 p 64 lines 1205-1207 20 PMV Response 2016-03-02 p 65-66 Table 6 21 PMV Response 2016-03-02 p 45 Table 3 22 PMV Response 2016-03-02 p 78 lines 1481-1483 23 PMV Response 2016-03-02 p 78 lines 1483-1484
Pacific Region Science Response Technical Review Assessing
Ecosystem Productivity Model of Roberts Bank
14
occurrences from data and similarly with predicted and observed absences The Proponent then calculated two additional accuracy of fit measures sensitivity (the model predicts a species to occur in an area where it is known to occur in reality) and specificity (the model predicts a species does not occur in an area it is known not to occur in reality)24 This analysis concluded that the model has high predictability for functional groups such as eelgrass and sea pens with relatively static distributions but lower predictability for functional groups which are more temporally and spatially dynamic such as biofilm and green algae25
There are two problems with this approach The first is that this goodness of fit comparison was done only for habitat-forming functional groups no discussion of how well this analysis applies to mobile functional groups was provided The second problem is that this method does not take into account situations (such as occurs in this study with several groups) in which species occur at only a few locations For example ldquohellipif the test data consist of 95 absences and 5 presences and this reflects the true prevalence of the species on the landscape (a realistic scenario for a rare species) a lsquonullrsquo model that predicted absence in all cases (eg no model at all) would be correct 95 of the timehellipldquo (Franklin 2009 p 151) This latter point is important here as these habitat functional groups (biofilm brown algae native eelgrass green algae Japanese eelgrass tidal marsh biomat and orange sea pens26) appear not to occur over most of the Project area (as portrayed by the model outputs presented in the distribution figures of PMV Response 2016-03-02 Appendix 218) It is therefore important that a robust evaluation of the performance of the Ecospace module is used with preferably more than one measure
In summary the starting point for this modelling analysis matters It is not just about a comparison between results with and without the Project The model has to be considered a sufficient representation of the ecosystem The Proponent has not yet sufficiently validated the model
35 Model results 351 Presentation of model results
As noted above (Section 331) the stated objective of the Roberts Bank ecosystem model was not to provide an assessment of Project impacts for each functional group at a fine temporal scale but to estimate changes in productive potential with and without the Project at the ecosystem level27 However results were presented as comparisons by speciesfunctional group with and without the Project and not as potential changes in total ecosystem productivity The revised figures for each functional group showing distributions without the Project with the Project and their difference indicated impacts were likely to be localized with overall impacts relatively small The range of biomass ratios with and without the Project was 045 ndash 189 with most values slightly less than 1 This is interpreted as indicating slight decreases in the capacity of the study area to support biomass and production with the Project for many functional groups28 (Figure 2)
24 PMV Response 2016-03-02 p 80 lines 1524-1527 25 PMV Response 2016-03-02 p 81 lines 1551-1559 26 PMV Response 2016-03-02 p 82 Table 8 27 PMV Response 2016-03-02 p 99 lines 1914-1917 28 PMV Response 2016-03-02 Appendix 218
Pacific Region Science Response Technical Review Assessing
Ecosystem Productivity Model of Roberts Bank
15
Biomass Ratio
Freq
uenc
y
04 07 10 13 16 19
05
1015
2025
30
Figure 2 Histogram of biomass ratios obtained by comparisons of model runs with and without the project (ie With Without) Values less than 1 indicate reductions in biomass with the Project compared against without the Project) Data from Appendix 218 of PMV Response 2016-03-02
352 Sensitivity and vulnerability analyses Every ecosystem model is only one possible representation of the true ecosystem defined by the modelrsquos structure and the values chosen for its many parameters The key point is how well the model represents the real system how that fit can be measured and the sensitivity of model outputs to variability in the selected parameter values The ideal model should be robust to a wide range of uncertainties in the input data and parameters This robustness is determined by performing sensitivity analyses on the model to see how it responds to variations in the input parameters and determining to which input parameters the model is most sensitive
The vulnerability parameters determine the strength of the feeding interactions between functional groups They set the level of density dependence of each functional group Higher vulnerability settings provide greater top-down (predator) control whereas lower settings provide greater bottom-up (environmental) control29 Several publications have shown that EwE models are very sensitive to the vulnerability parameters and Christensen and Walters (2000) point out that a main pitfall of EwE is that ldquopredation vulnerabilities are often underestimated lessening the modelled impacts of predationrdquo It is usual practice to tune Ecopath models including the vulnerability parameters to time series data such as biomass using the temporal simulation model Ecosim However these data were not available for the RBT2 area so this robust method of fitting the model and estimating vulnerability parameters was not possible Instead a vulnerability setting of 2 was used as the default value for the key model runs which is ldquocommon practice when time series data are not available and estimates of vulnerability in the
29 PMV Response 2016-03-02 p 70 lines 1318-1323
Pacific Region Science Response Technical Review Assessing
Ecosystem Productivity Model of Roberts Bank
16
model cannot be maderdquo30 with sensitivity analyses run for a range of 15 to 3 This narrow range was criticized by DFOECCC in initial discussions about the model with the Proponent The Proponent subsequently reran the model with a larger range of vulnerabilities31 (11 to 10) and concluded this broader vulnerability range produced similar results for the productivity ratio with and without the Project to those in the original EIS and that the EIS was more likely to overestimate than underestimate potential project effects32 The data in Table 7 of the PMV Response33 did indicate changes in productivity ratios ranging from 0 to 50 of the defined key run (which used a vulnerability setting of 2) However the Proponent changed all vulnerability settings to the same value ie all were 2 or all were 10 etc In reality the vulnerability parameters resulting from Ecosim models that are fitted to data as described above vary by functional group which was not explored here Therefore although the results suggest that the original choice of 2 for the default key run seemed reasonable the potential effects of variability in vulnerability settings was not fully explored
Sensitivity analyses are usually based on the range of uncertainty estimated for input data and parameters often called the confidence limits around the model parameters The EwE framework integrates many different data sources and parameters including values from the literature It can therefore be difficult to identify ldquoreasonablerdquo confidence limits when derived from such diverse data sources Standard practice in Ecopath models has been to develop a pedigree for each parameter with default values for uncertainty based on the nature of the source data For example parameter values based on high precision field observations of biomass within the model domain receive default confidence intervals of 10 whereas parameter values based on models developed for elsewhere or professional judgment receive confidence intervals of 8034 Sensitivity analyses are then run using parameter values selected from within these confidence intervals However if these default confidence intervals do not capture the full range of variability then the outputs are not informative of the variability in the lsquorealrsquo ecosystem Field observations were collected for many functional groups within the model domain in 2012 and 2013 as part of studies to support the RBT2 EIS Apparently the purpose of these observations was to document spatial variability (in part for the Ecospace model) and temporal variability (measurements at one location over time) and not to derive confidence intervals around the observations35
The reliance on the pedigree approach to derive confidence intervals for this Roberts Bank model was criticized by DFO ECCC and NRCan in discussions with the Proponent As a result the Proponent reran the model with much larger confidence intervals ranging from 30 to 100 depending on the input parameter and functional group36 The results from this new analysis using the broader confidence intervals were similar to those using the original pedigree approach The Proponent noted that ldquoWhile the production within each helliprun was very different there was little difference in the biomass ratio [with and without the Project] These results further demonstrate that even with a greater range in input values the influence of the Project on the Roberts Bank ecosystem is consistent among allhellipmodel runsrdquo37 This provides confidence that the model may be robust to uncertainty in its input parameters Two concerns
30 PMV Response 2016-03-02 p 70 lines 1321-1322 31 PMV Response 2016-03-02 p 71-74 32 PMV Response 2016-03-02 p 71 lines 1339-1341 33 PMV Response 2016-03-02 p 73 34 EIS Appendix 10-C Section 251 page 18 35 PMV Response 2016-03-02 p 42 lines 772-777 36 PMV Response 2016-03-02 p 44-47 37 PMV Response 2016-03-02 p 47 lines 855-858 and see also PMV Response 2016-03-02 Appendix 27-B
Pacific Region Science Response Technical Review Assessing
Ecosystem Productivity Model of Roberts Bank
17
remain however The quote above indicates that the production among the different model runs was very different although with little difference in the biomass ratios with and without the Project Since biomass is not the same as production it would be informative for understanding model performance and potential impacts to show these production differences This also relates to the point made in Section 34 regarding how well the model represents the real ecosystem and not just within-model comparisons with and without the Project The second question is more technical and relates to how the randomization (Monte Carlo or MC) routine that was used to create multiple model runs used the uncertainty about the diet data Diets are not currently included in the MC routine available to regular users of the Ecosim model how they were handled in this RBT2 model appears not to be explained
Finally the sensitivity analyses indicate that the uncertainty in the input parameters does not lead to much difference between model parameters with or without the project However this conclusion does not describe how the uncertainty in the input parameters affects understanding of the ecosystem
40 Conclusions Overall the main conclusion of the Environmental Impact Statement from the Proponent is stated as ldquohellipafter the implementation of mitigation hellipthe Project is not expected to result in any significant adverse effects on any of the 16 valued componentsrdquo38 In addition ldquohellipapproximately 40 of the functional groups are forecast to change no more than 5 which hellip is judged to be within the uncertainty of the model runsrdquo39 although larger changes were forecast for orange sea pens freshwater biofilm green algae and raptors The conclusions from the modelling studies are that ldquohellipthe proposed project will have an impact on the study area that the effect varies between species and that the findings are robust to parameter uncertaintyrdquo40 Specific outcomes by valued component as derived from the EwE model are presented by functional groups in Table 1
38 PMV March 2015 Roberts Bank Environmental Impact Statement Executive Summary ndash Part 1 page 37 39 EIS Appendix 10-C p ii 40 EIS Appendix 10-D p iv
Pacific Region Science Response Technical Review Assessing
Ecosystem Productivity Model of Roberts Bank
18
Table 1 Changes in productive potential with the Project as derived from the EwE model
Changes in productive potential
Ecosystem category
Number of valued
components
Number with potential
biomass loss
Moderate decrease (31-60 decline)
Minor decrease (6-30 decline)
Negligible (0-5
change)
Minor increase (6-
30 increase)
Moderate increase (31-60 increase)
Source
Marine vegetation
7 7 - 3 2 2 - EIS Vol 3 Section 11 Table 11-17 page 11-65
Marine invertebrates
4 3 1 1 1 1 - EIS Vol 3 Section 12 Table 12-8 page 12-52
Marine fish 13 13 - 2 6 5 - EIS Vol 3 Section 13 Table 13-10 page 13-95
Coastal birds
11 8 - 3 4 3 1 EIS Vol 3 Section 15 Table 15-10 page 15-67
Pacific Region Science Response Technical Review Assessing
Ecosystem Productivity Model of Roberts Bank
19
Most functional groups showed some potential biomass loss with the Project with biomass loss defined as any model run with negative outcomes (ie in which biomass with the project was less than biomass without the Project) The summary of changes in productivity potential are mixed with most (33 out of 35) valued components showing minor decreases to minor increases (defined as 6 to 30 changes in productive potential with the Project compared to without the Project)
The main conclusions of this review in regards to the Terms of Reference are
1 Do the functional groups and abiotic variables used in the model adequately represent the ecosystem at Roberts Bank
o The 58 functional groups and abiotic variables used in the model adequately represent the main components of the Roberts Bank ecosystem however for longer lived species the life stages of the species are not well represented and some of the impacts of the Project may be expected to affect specific life stages
o The abiotic variables adequately represent the physical drivers of this ecosystem on an annual time scale However annual values for these abiotic variables may not adequately capture important sub-annual events such as storms (DFO 2016) the timing of arrival and departure of highly migratory species and whether there may be important sub-annual thresholds or mismatches in timing as a result of the Project
o Biotic factors (eg nutrients) which are particularly important for biofilm and other lower trophic level taxa are not included in this model The model is therefore unable to assess the potential development of eutrophication and benthic organic enrichment events which may affect fish habitats in the study area
2 Are the parameter estimates used by the model valid and defensible for this system
o In general parameter estimates appear to be adequate for this system Field studies were done in two years to provide data in particular on distributions of selected functional groups for the Ecospace module Note the distribution studies focussed on taxa which were relatively immobile and therefore lsquofixedrsquo in space
o the selection of some model parameters would benefit from further explanation for example the choice of fixed diet matrices versus dynamic matrices which can vary with changes in abundances or predators and prey
o the selection of some model parameters would benefit from further explanation for example the link between the diets described in the text of Appendix 10B and the quantities presented in Appendix A of Appendix 10B It is understood that proportions were derived using the ldquofixed selectivityrdquo principle but in order to be fully transparent the derivation of each diet should be provided in an appendix
o discussion and explanation is needed of why ecotrophic efficiencies differ from expected values (eg the ecotrophic efficiency for Pacific herring is listed as 038) and
o the abiotic factor lsquosubstratersquo was limited to ldquohardrdquo or rdquosoftrdquo options which can be restrictive given that they serve as endpoints on a substrate composition continuum These limited options may not provide the sensitivity required to assess substrate preference nor the flexibility for taxa (eg motile organisms) that span hard mixed and soft substrate types In addition it is not clear if changes in the hardsoft categories were considered over time within identified depositional or erosional settings before and after construction
Pacific Region Science Response Technical Review Assessing
Ecosystem Productivity Model of Roberts Bank
20
3 Are the limitations and uncertainties of the model identified and appropriately considered when determining the modelrsquos representation of current and possible future conditions
o the EwE model was not designed to evaluate a range of future conditions It was designed to estimate changes in the productive potential at the ecosystem level with and without the Project Therefore the model was run without the Project and with the Project for a range of plausible abiotic conditions and the results were compared with respect to biomass and productivity by functional group
o the pedigree approach to assessing the uncertainties of model outcomes is unsatisfactory for the purpose here as it relates solely to a qualitative judgment of the value of data based on its source However when the model was rerun with much wider ranges of confidence intervals (uncertainties) the results in general (but not necessarily for each functional group) were similar to the results using the original pedigree approach This suggests that taken overall the model may be robust to wide ranges of uncertainty in these input variables and parameters
o there is inadequate validation of the model This is inadequate for three reasons
(i) the basic Ecopath model is not validated and the Ecospace balancing process (the spin-up period) resulted in some biomass estimates being increased or decreased beyond their confidence limits
(ii) the goodness of fit test used to evaluate how well the model predicted the spatial occurrence functional groups is not fit for purpose (Section 34) and
(iii) validation was provided for only a small number of functional groups (the habitat-forming functional groups) As a consequence the model is currently not validated
o Considering the proportion of open boundaries relative to closed boundaries in the model processes taking place outside the modelled ecosystem are likely to contribute to dynamics within the modelled ecosystem However these external processes may not be well-resolved by the EwE model as currently configured
4 Are the model results related to the potential effects of the Project on fish and fish habitat and migratory birds and their food resources valid and defensible
o this is a very complex ecosystem model constructed for a relatively small and open (in the sense of considerable exchange with adjacent non-modelled areas) system Many assumptions have been made based on poor or missing data Taking all these considerations into account the model does the best job possible of comparing the biomass and productivity of the Roberts Bank ecosystem with and without the Project
o the extent to which the model adequately represents the lsquorealrsquo ecosystem of Roberts Bank as opposed to comparisons of model results with and without the Project is unclear as a number of basic diagnostics are not presented (see point 3 above)
o the EwE model is not capable of and is not designed to represent nutritional and food quality variations in prey functional groups and how these may impact highly migratory predators such as birds with and without the Project
5 Is the EwE model framework a valid method to quantify large scale impacts to fish habitat fish productivity and migratory bird productivity
o the EwE model as implemented in this project and reviewed here is a useful first-order framework to organise information and derive initial estimates of how the system may respond to perturbations
Pacific Region Science Response Technical Review Assessing
Ecosystem Productivity Model of Roberts Bank
21
o the utility of a EWE model for impact purposes is highly dependent on the quality of input data
o each EwE model is highly dependent on local conditions Although appropriate as an overall methodology each application would need to be reviewed for how it may be applied to any new ecosystem and
o the EwE model would need to be substantially reformulated if it was to include considerations of changes in chemical composition or food quality of prey in particular for seasonal migratory species such as birds which may depend on very large biomasses of prey with specific chemical composition to fuel their migrations beyond the ecosystem model boundaries
Contributors Contributor Affiliation Ian Perry Author DFO Science Pacific Region Alida Bundy Author DFO Science Maritimes Region Terri Sutherland Author DFO Science Pacific Region Robert Elner Author ECCC Canadian Wildlife Service Andrew Robinson Author ECCC Canadian Wildlife Service Lesley MacDougall Editor DFO Science Pacific Region
Approved by Carmel Lowe
Regional Director Science Branch Pacific Region Fisheries and Oceans Canada
November 4 2016
Sources of Information Christensen V Coll M Steenbeek J Buszowski J Chagaris D walters CJ 2014
Representing variable habitat quality in a spatial food web model Ecosystems 17 1397-1412
Christensen V and Walters C 2000 Ecopath with Ecosim methods capabilities and limitations Ecological Modelling 172 109-139
Colleacuteter M Valls A Guitton J Gascuel D Pauly D and Christensen V 2015 Global overview of the applications of the Ecopath with Ecosim modeling approach using the EcoBase models repository Ecological Modelling 302 pp42-53
Compass Resource Management Ltd 2013 Roberts Bank Terminal 2 Technical Advisory Group (TAG) Process Report Productive Capacity ndash Final Report 119pp (Accessed November 1 2016)
DFO 2016 Technical Review of Roberts Bank Terminal 2 Environmental Assessment Section 95 ndash Coastal Geomorphology DFO Can Sci Advis Sec Sci Resp 2016045 (Accessed November 4 2016)
Pacific Region Science Response Technical Review Assessing
Ecosystem Productivity Model of Roberts Bank
22
ESSA Technologies 2014a Roberts Bank Terminal 2 Project Roberts Bank Delta BC Environmental Impact Statement Volume 3 Biophysical Effects Assessments Appendix 10-C Roberts Bank Ecosystem Model Development and Key Run Port Metro Vancouver (Accessed November 1 2016)
ESSA Technologies 2014b Roberts Bank Terminal 2 Project Roberts Bank Delta BC Environmental Impact Statement Volume 3 Biophysical Effects Assessments Appendix 10-D Roberts Bank Ecosystem Model Sensitivity Analyses Port Metro Vancouver (Accessed November 1 2016)
Franklin J 2009 Mapping Species Distributions Spatial Inference and Prediction Cambridge University Press Cambridge
Hemmera 2014 Roberts Bank Terminal 2 Project Roberts Bank Delta BC Environmental Impact Statement Volume 3 Biophysical Effects Assessments Appendix 10-B Roberts Bank Ecosystem Model Parameter Estimates Port Metro Vancouver File 302-03503 (Accessed November 1 2016)
Port Metro Vancouver 2015a Roberts Bank Terminal 2 Project Roberts Bank Delta BC Environmental Impact Statement Volume 3 Biophysical Effects Assessments Section 100 Biophysical Setting (Accessed November 1 2016)
Port Metro Vancouver 2015b Roberts Bank Terminal 2 Project Roberts Bank Delta BC Environmental Impact Statement Volume 3 Biophysical Effects Assessments Section 103 Overview of Assessing Ecosystem Productivity (Accessed November 1 2016)
Port Metro Vancouver 2015c Roberts Bank Terminal 2 Project Environmental Assessment Additional Information Requirements (July 31 2015) Responses Response to Information Request 6 IR-73115-06 Canadian Environmental Assessment Agency Reference Number 80054 dated 26 October 2015
Steenbeek J Coll M Gurney L Meacutelin F Hoepffner N Buszowski J and Christensen V 2013 Bridging the gap between ecosystem modeling tools and geographic information systems Driving a food web model with external spatialndashtemporal data Ecological Modelling 263 139ndash 151
Sutherland T Elner R and OrsquoNeill J 2013 Roberts Bank Ecological crucible of the Fraser River estuary Progress in Oceanography 115 171ndash180
Vancouver Fraser Port Authority 2016 From the Vancouver Fraser Port Authority to the Review Panel re Answers to preliminary technical questions submitted during the completeness phase from Fisheries and Oceans Canada Natural Resources Canada and Environment and Climate Change Canada concerning the ecosystem modelling to support the Roberts Bank Terminal 2 Project environmental review CEAR Document 547 (Accessed November 1 2016)
Pacific Region Science Response Technical Review Assessing
Ecosystem Productivity Model of Roberts Bank
23
This Report is Available from the Centre for Science Advice
Pacific Region Fisheries and Oceans Canada
3190 Hammond Bay Road Nanaimo BC V9T 6N7
Telephone (250) 756-7208 E-Mail csapdfo-mpogcca
Internet address wwwdfo-mpogccacsas-sccs
ISSN 1919-3769 copy Her Majesty the Queen in Right of Canada 2016
Correct Citation for this Publication
DFO 2016 Technical review of Roberts Bank Terminal 2 environmental assessment section 103 ndash assessing ecosystem productivity DFO Can Sci Advis Sec Sci Resp 2016050
Aussi disponible en franccedilais
MPO 2016 Examen technique de leacutevaluation environnementale du Terminal 2 agrave Roberts Bank section 103 ndash eacutevaluation de la productiviteacute de leacutecosystegraveme Secr can de consult sci du MPO Reacutep des Sci 2016050

Pacific Region Science Response Technical Review Assessing
Ecosystem Productivity Model of Roberts Bank
6
The EwE framework is a common approach to ecosystem modelling which has been developed and expanded over the past two to three decades It currently has three main components
1 Ecopath ndash the core model which provides a mass-balance snapshot of the system
2 Ecosim ndash a module that enables simulation modelling over time
3 Ecospace ndash a module that enables simulation modelling over space
In order to make an EwE model tractable species are aggregated into functional groups based on their similar ecological characteristics (habitat and prey preferences etc) the Roberts Bank models had 58 functional groups The first step (Ecopath) was to obtain input parameters representing biomass production consumption emigration and diet for each functional group These parameters were then tuned in an iterative process until the overall production and consumption was balanced (a mass-balance approach) resulting in a model food web with estimates of energy flow between functional groups (Fig 1)
In the second step Ecosim was combined with the spatial model Ecospace The abiotic variables selected in this EIS (depth salinity bottom current wave height sediment type) were used as external forcings to the Ecospace module These abiotic variables provided the physical forcings for the simulations without and with the Project Since time series data on the functional groups of the model were not available Ecospace was run until the model reached equilibrium using various assumptions of the value of the vulnerability parameter (see Section 352) In this EIS the selected time step was annual with all variables abiotic and biotic expressed as yearly averages As used in this EIS the Ecospace module included a habitat capacity model which estimated the distribution of functional groups based on their environmental preferences for each abiotic variable (depth salinity bottom current wave height) and for substrate type (sand mud etc) The model thus allocated the spatial distribution of functional groups over the model domain based on their environmental preferences and the distributions of these abiotic variables with and without the Project The selected spatial unit size (ldquopixelrdquo) for the Ecospace model was 100 m2 In essence an Ecopath model was constructed for each pixel with particular rules governing how the functional groups interacted and moved among these spatial units The Ecospace module was run until it approached equilibrium (20 model years) to establish the spatial patterns without the Project For the lsquowith the Projectrsquo simulations the model was run for an initial 10 years and then the spatial patterns of the abiotic variables with the project were added and the model run for an additional 10 years1 The model outputs predicted changes in the productive potential of the Roberts Bank ecosystem as a comparison (ratio) with and without the Project rather than an absolute biomass that would be lost or gained as a result of the Project
1 EIS Appendix 10-C p 26
Pacific Region Science Response Technical Review Assessing
Ecosystem Productivity Model of Roberts Bank
7
30 Analysis and Response To prepare this response the following sections of the EIS additional documents were reviewed
DocumentSection Title
EIS Section 10
Including appendices 10B 10C and 10D
(Port Metro Vancouver 2015a Hemmera 2014 ESSA Technologies 2014a ESSA Technologies 2014b)
Biophysical Setting
Appendix 10-B Roberts Bank Ecosystem Model Parameter Estimates Port Metro Vancouver File 302-03503
Appendix 10-C Roberts Bank Ecosystem Model Development and Key Run Port Metro Vancouver
Appendix 10-D Roberts Bank Ecosystem Model Sensitivity Analyses Port Metro Vancouver
CEAR document 547 (Including Appendices) ldquoPMV Response 2016-03-02rdquo and ldquoPMV Response 2016-05-30rdquo
(Vancouver Fraser Port Authority 2016)
Vancouver Fraser Port Authority to the Review Panel re Answers to preliminary technical questions submitted during the completeness phase from Fisheries and Oceans Canada Natural Resources Canada and Environment and Climate Change Canada concerning the ecosystem modelling to support the Roberts Bank Terminal 2 Project environmental review
31 The EwE Team Building this ecosystem model was a complex undertaking which required knowledge of the ecosystem to be modelled how to set initial parameter values determination of reasonable ranges of these parameters how to balance the model and how to recognize when the model outputs were unrealistic These tasks became even more complex when spatial model dynamics were involved such as with Ecospace The team engaged by the Proponent to conduct this ecosystem modelling for the Roberts Bank Terminal 2 (RBT2) EIS was led by scientists at the Institute for Oceans and Fisheries located at the University of British Columbia in Vancouver These scientists are global leaders of the EwE model framework having developed much of its current implementation and who continue to lead its elaborations and extensions Construction and running of the model for this specific ecosystem was done in collaboration with ESSA Technologies of Vancouver Parameter values for the ecosystem model were obtained in part from observational studies conducted in the area by Hemmera of Burnaby BC
32 Overview of assessment results of hydrological and sediment modelling Implementation of the ldquowith the Projectrdquo simulations of the ecosystem model was done by driving the model with the abiotic variables as they were projected to be distributed with the Project footprint In the context of this EIS specifying depth salinity bottom currents wave height and sediment type conditions without the Project and changes with the Project were achieved by construction of hydrodynamical and sediment transport models The outputs from these models in combination with the identified environment preferences for the various biological groups were then used as inputs to the Ecospace model to define the spatial
Pacific Region Science Response Technical Review Assessing
Ecosystem Productivity Model of Roberts Bank
8
distributions of these functional groups The implementation of these hydrological and sediment transport models in this EIS was reviewed by DFO and NRCan (DFO 2016) This review concluded that the implementation of these models for this EIS was adequate for average winter conditions but lacking in validation for summer conditions in particular with strong freshwater flows from the Fraser River Simulations of strong storm events and their impacts on wave conditions and sediment transport were also lacking The effect of wave action and current speeds on sediment transport is non-linear such that increasing winds over short periods of time can impact sediment transport processes bottom topography and water depths beyond that determined under average model conditions Overall the review concluded that a greater range of sensitivity analyses is required to have confidence in the model outputs under lsquonon-averagersquo conditions The implication of this conclusion for the present review of the EwE model is that the full range of variability of abiotic characteristics such as bottom topography bottom current and wave heights and how they may affect relevant functional groups in the model with the Project may not be adequately represented Sensitivity analyses were provided by varying the intensity of abiotic variables and by removing abiotic variables to assess their interactive effects In general the ecosystem model outputs were robust to these sensitivity analyses with most groups varying by less than 5 Larger changes however were observed for primary producer and bird groupings and for some fish groups when various abiotic variables were omitted2
33 Model implementation 331 The purpose of the EwE model
The EwE model was intended to provide one line of evidence to assess the potential impacts of the Project on the Roberts Bank ecosystem which would then be used with other lines of evidence to make the final assessment Specifically ldquohellip the objective of the RB [Roberts Bank] model was not to provide an assessment of Project impacts for each functional group at a fine temporal scale but to estimate changes in productive potential with and without the Project at the ecosystem levelrdquo3 In addition ldquohellipthe primary objective of the RB ecosystem model is to evaluate potential changes in productivity from such abiotic factors with and without the terminal and causewayrdquo4 Results are presented for the selected functional groups no results were presented on potential changes in ecosystem structure or function
332 Applicability of the EwE model framework to the Roberts Bank region EwE models work best when the exchanges within the system being modelled are greater than the exchanges between the modelled system and the lsquooutsidersquo world In practice this means that EwE models work best for larger systems with few external exchanges In a meta-analysis of 433 Ecopath models Colleacuteter et al (2015) concluded that ldquohellipin the last two decades the range of the models area has expanded toward very large areas and the median has shifted accordingly from about 1000 km2 in 1984ndash1993 to about 100000 km2 in 1994ndash2014rdquo The section of the Roberts Bank ecosystem that is included in the EwE model was comparatively small (5468 km2) and complex It is an intertidally-dominated environment that is subject to strong seasonal influences of both freshwater and marine exchanges across relatively large seaward and shoreward boundaries
2 EIS Appendix 10-D p ii - iii 3 PMV Response 2016-03-02 p 99 lines 1914-1917 4 PMV Response 2016-03-02 p 38 lines 689-691
Pacific Region Science Response Technical Review Assessing
Ecosystem Productivity Model of Roberts Bank
9
Processes taking place outside the modelled ecosystem will contribute to dynamics within the modelled ecosystem (eg lsquooutsidersquo food supporting predators which occur in the Roberts Bank ecosystem for only part of the year predators which may feed in the Roberts Bank ecosystem but export this energy when they migrate out of the region) but which may not be well-resolved by the EwE model The Proponent justifies the spatial scale because it was specifically chosen for the questions being asked in regard to assessing productivity changes and because the relative influences of external exchanges are assumed to be identical with and without the project In addition highly mobile species with broad prey bases were assumed in the model to be partially sustained by external energy from outside the model system5 The distributions of organisms may differ however with and without the project which may affect their interactions with areas outside of the modelled system and the use of diets from outside the modelled system may not reflect the impacts of the project Further clarification of how the EwE model captures the exchanges and interactions with adjacent ecosystems are needed For example it could be argued that an ecosystem which is open to frequent exchanges of water and organic matter from beyond its boundaries might be more robust to local disturbances such as the Project
There are some inconsistencies in the information and assumptions used for some of the taxa in this ecosystem model For Dungeness Crab the justification for estimating total adult biomass (including females) from the biomass of fished males is unclear In addition it is unclear if the slower growth of female crabs once they have reached sexual maturity in comparison with male crabs has been considered The diet matrix for spiny dogfish does not represent the actual diet well in particular of euphausiids herring and shrimp and there are more recent references for biomass estimates of spiny dogfish in the study area than what was used in the EIS
Fishing mortality was not included in the model under the assumption that this would not change with or without the project While this assumption may be true the model has been parameterized by ignoring a source of mortality that will influence total production In essence fishing removes biomass from the ecosystem with the result that less biomass will be available for higher trophic levels How this may impact the ecosystem with and without the Project is unclear but it could make noticeable differences if for example there were thresholds in the feeding responses by these higher trophic level species The Ecopath model that was used is relatively unconstrained since many ecological efficiencies are low even for forage species which would be expected to be higher It is not clear how many species are exploited or the levels of exploitation but even if this does not change with the Project these mortality rates should be included in the model in order to add realistic constraints to the exploited functional groups
333 Model documentation Based on questions from DFO ECCC and NRCan following their initial review of the EIS the Proponent provided written responses dated 2 March 2016 to clarify several of the steps in the model development and implementation However several questions remain including questions about the Ecospace module Ecospace has undergone several recent developments such as the inclusion of the spatial-temporal data layer framework (Steenbeek et al 2013) the habitat capacity model (Christensen et al 2014) and the Monte Carlo analysis including the diet matrix As yet there are few published studies using these latest Ecospace developments and their documentation and justification need to be improved in the EIS
5 PMV Response 2016-03-02 p 29 lines 446 - 464
Pacific Region Science Response Technical Review Assessing
Ecosystem Productivity Model of Roberts Bank
10
Questions also remain regarding how the Monte Carlo randomization routine treated diet data The report indicates that the Monte Carlo routine randomly selected input parameters from the input ranges and that only models that were balanced were used This suggests that a high proportion of models were not balanced and therefore were not used (for example the EIS indicates that about one out of 1000 sampled input parameters was balanced6) A table showing the minimum maximum mode average and median values from the Monte Carlo runs for all the parameters would enable an evaluation of how much variation was actually sampled by the balanced model runs This is recommended in the EwE user information ie ldquoUsers should check the range of the input parameters that were actually used in the trials in the output csv file (see below)rdquo7
In addition there are several issues with the documentation of the derivation of the parameters for the functional groups Such documentation should clearly outline how the input parameter was estimated and the range of uncertainty for that parameter For example the input biomass of pinnipeds was defined as 04 t km 2 derived from estimates of 034 for Harbour seals and two estimates for Steller sea lions (012 and 014 t km 2) No explanation was provided for how the overall estimated pinniped biomass of 04 t km 2 was determined The diet of Sand Lance was described in the EIS as consisting mostly of zooplankton8 whereas the diet table for the model runs9 included 20 macrofauna 10 green algae and 10 detritus It is unclear why these additional prey were included in the diet used for the model runs
334 Highly mobile functional groups This implementation of the EwE framework included transient and migratory functional groups This is entirely appropriate and these groups cannot be excluded The approach taken in the Ecospace module was to impose a low (and conservative) dispersal rate among model spatial units (lsquopixelsrsquo) of 1 km yr-1 This may be appropriate for low mobility benthic organisms but it likely underestimates the movements of many other functional groups The effects of using higher and perhaps functional-group-specific dispersal rates was not considered The Proponents argued that higher dispersal rates would reduce impacts since species can move away from less desirable areas more quickly for completeness these runs should be done and evaluated Mobile species will also bring energy (food) captured outside the system into the modelled ecosystem This process was included in the model with the use of a diet import factor reflecting the consumption of prey outside the modelled region with the assumption that groups with high import rates were unlikely to respond to local changes on Roberts Bank10 This assumption needs justification perhaps at the functional group level for example many species of highly migratory birds and Pacific salmon use the Roberts Bank ecosystem to obtain food to continue their migrations Although this food does not compose a large fraction of their annual consumption it can be critical to enable them to continue their migrations
The EwE model is not designed to capture differences in prey quality ie differences in essential fatty acid or nutrient ratios The same species of prey may have greater or lesser nutritional value to predators depending on the conditions under which they are growing and their seasonal variations This is a particular concern with the nutritional quality of the diatom-dominated biofilm Diatomaceous biofilm is important to the highly migratory Western Sandpiper (Calidris mauri) Despite its predictive merits in relation to other ecosystem
6 EIS Appendix 10D Section 24 p5 7 EwE Help file p 151 8 EIS Appendix 10B Section 4133 p 76 9 EIS Appendix A of Appendix 10B 10 PMV Response 2016-03-02 p 28 lines 429 - 436
Pacific Region Science Response Technical Review Assessing
Ecosystem Productivity Model of Roberts Bank
11
components the EwE model is not informative with respect to understanding the potential impacts of the Project on biofilm and the Western Sandpiper While this example is specific to seabirds the potential exists for differences in the quality of biofilm to also be an issue for copepods which feed on biofilm and consequently to juvenile salmon which feed on these copepods (eg Sutherland et al 2013)
The EwE model is also not designed to predict effects of the Project on water quality although the Proponent noted that ldquoOther abiotic factors not included were deemed to be representative of variables that were already included in the modelhelliprdquo11 The Project may cause changes in physical and water quality conditions whether in isolation or in combination which may impact the productivity or nutritional quality of key prey organisms for local and migratory species which will not be captured by the model The EwE model does not assess the production of key nutrients or the implications of changes in important physical and water quality parameters to biofilm community structure and hence to important migratory birds
The model does not include biotic factors for both pelagic and benthic environments to assess the potential development of eutrophication and benthic organic enrichment events respectively Organic and redox indicators traditional measures of environmental assessments that are used to determine changes in functional group responses were included in the recent Deltaport Third environmental assessment (ie Pelagic chlorophyll dissolved nutrients Benthic sediment carbonnitrogen content redox state [sulfide concentration]) Benthic anoxic events based on organic enrichment are known to be strong drivers of community composition and exclusion regardless of substrate type In the absence of biotic factors (eg organic particulates) the model has not considered the potential for benthic organic enrichment which coincides with siltation processes within the upper tidal flats The tidal flat corner bordered by the Delta-dyke and Deltaport causeway has served as a catchment area for Fraser River silt since the development of the original Deltaport causeway (Sutherland et al 2013) The proposed position of the new terminal placed at the seaward termination of the Deltaport causeway may produce a crescent-shaped feature in the wake of the Fraser River Plume This feature may provide a more efficient silt trap that will promote benthic organic enrichment This piece of the environmental assessment seems to be missing and is important for assessing fish habitat in this area
335 Seasonality (model time step) Input data to parameterize the model were available on a range of time scales from hourly (eg physical data on salinity and water flow) to annual (eg species biomass) The Proponents indicated12 that this is a strength of the EwE model although ultimately the model was run with an annual time step with all sub-annual values being averaged to annual values This method therefore did not incorporate important seasonal processes such as winter-summer differences in salinity and storm properties and the seasonal appearances of abundances of predators and prey such as migratory salmon and birds that are much larger than the annual average For example juvenile salmon migrate from the Fraser River and onto Roberts Bank in the spring before moving into deeper waters If these spring abundances are averaged over the entire year these average abundances would be 5-10 times lower than the actual abundances during the spring (ie averaging the biomass that occurs in two months over a 12 month period) Additionally this method did not capture the intensity of processes such as growth and predation which can be focused over periods of a few weeks to a few months There may be important threshold effects at particular times and places which may be missed when using an 11 EIS Section 10 p 10-11 12 PMV Response 2016-03-02 p 86 line 1655
Pacific Region Science Response Technical Review Assessing
Ecosystem Productivity Model of Roberts Bank
12
annual time step for the model The Ecospace module has a monthly time step13 and therefore it is feasible to run this module with a sub-annual time step For example the Proponents submit14 that there are inadequate data to model the potential effects of the Project on the timing of biofilm production which could have implications for the migratory dunlin and Western Sandpiper However this could be modelled in an exploratory way to determine hypotheses about which factors could affect the timing of production of biofilm and the potential impacts on these birds These issues are of major concern to ECCC
336 Life history structure The EwE model did not separate functional groups into life history stages (stanzas) yet for many functional groups the juvenile stages can have very different life history characteristics and habitats than the adults It is unclear in the description of the model how different life history structures were considered and whether for example there were enough juveniles to produce the adults The implications of not including early life stages should be explored at least qualitatively to identify which species might have life stages that may be more vulnerable to project effects
337 Model balancing Balancing an EwE model is the process by which parameters are adjusted so that there is sufficient production for consumption requirements ie there are sufficient prey for all predators Expert opinion was used to examine parameter values and to adjust for errors or inconsistencies in logic ldquoPMV is confident that since the approach taken to balance the model was based on best practices the steps are appropriaterdquo15 Adjustments to initial parameters to ensure an ecologically-feasible model are necessary and to be expected For a few functional groups however very large changes to initial parameter estimates (which were often not based on Roberts Bank specific data) were necessary for example to transient killer whales When such initial parameters were adjusted (often by substantial amounts) by expert opinion to balance the model the confidence intervals around these adjusted parameter values were not increased to reflect this added uncertainty (see for example PMV Response 2016-03-02 p 51 lines 955-956) When expert opinion was used to make very large changes to initial parameter values broader confidence intervals about these parameters should have been applied This does not appear to have been the case and as a consequence may cause the actual uncertainty of the model outputs to be underestimated
Another example is for the pinniped group in which 50 of the diet was assumed to come from outside the model area in order to balance the model The rationale provided was ldquoThe pinnipeds caused excessive predation mortalities on numerous fish functional groups The biomass of pinnipeds was an average for the Strait of Georgia which was likely too high for Roberts Bank Therefore it was assumed that pinnipeds extracted only half of their diet from the study areardquo16 It is unclear whether the sensitivity of the model to different percentages of diet allocation was explored
As noted above (332) the Ecopath model was relatively unconstrained and few adjustments to input parameters were required to balance the model This is unusual and the low ecotrophic efficiencies of several functional groups suggest that full accounting of energy flows may not have been achieved (an ecotrophic efficiency of 1 indicates that 100 of the production of that
13 EIS Appendix 10C Section 29 p24 14 EIS Appendix 10D Appendix C p72 15 PMV Response 2016-03-02 p 49 lines 910-912 16 EIS Appendix 10C Section 261 p 20
Pacific Region Science Response Technical Review Assessing
Ecosystem Productivity Model of Roberts Bank
13
particular group is being preyed upon or removed by fishing leaving no individuals to die of old age17) An ldquoexcessrdquo of individuals dying of old age ie ecotrophic efficiencies much less than 1 suggests a potentially large biomass that is not used by the ecosystem and instead is converted to detritus
34 Model validation Model validation is the process by which the model parameters variables and outputs are compared with those from the real ecosystem to ascertain how well the model represents the ecosystem It is an essential step in providing confidence that the projections from the model in this case with and without the Project have relevance to how the real ecosystem may be expected to function with and without the Project In practice validating complex ecosystem models is difficult considering the range of assumptions that must be made when building the model the limited available data and natural variability of the ecosystem at a variety of time and space scales
Many of the standard diagnostics for the Ecopath model have not been evaluated in the EIS The Proponent appears to have assumed that once the Ecopath model was balanced then it was valid and fit for purpose The Proponent should provide all the Ecopath estimates of vital rates including mortality rates As presented questions remain For example many Ecotrophic Efficiencies (which control the transfer of biomass from prey to predators) are less than 1 even for taxa which would be expected to be close to 1 such as carnivorous zooplankton The reason for Ecotrophic Efficiencies less than 1 were not discussed or explained in the EIS
Detailed diagnostics for the Ecospace model should also be presented in order to evaluate model performance In response to criticisms by DFO ECCC and NRCan in discussions with the Proponent the latter provided the biomass of the functional groups from the Ecopath model (before Ecospace) and the Ecospace model after the spin-up period (which involved adjusting the parameters from the Ecopath model to balance the 5468 separate cells of the Ecospace model)18 The Proponents argue that ldquoIt is important to note that changes in biomass values generated during the spin-up period are identical for both with and without Project scenarios and thus do not provide information on the potential Project-related effects on productivity19 However several changes to biomass result from the Ecospace balancing process (spin-up period) This is only given brief attention by the Proponent in its response to the DFO ECCC and NRCan questions An analysis of Table 620 revealed that the biomass of 9 functional groups was larger or smaller than the widest confidence limits allowed for each group21 This requires further discussion and justification
The Proponent used a goodness of fit measure to compare spatial distributions of model outputs with field observations They indicated that ldquono other EwE models were identified which use a goodness-of-fit measure Hence the RB model is potentially the first such EwE model where a goodness of fit measure has been appliedrdquo22 The chosen goodness of fit measure is the percent correct classification (PCC) method23 This method derives a test statistic based on the proportion of locations at which predicted occurrences from the model match observed
17 EIS Appendix 10-B p 11 18 PMV Response 2016-03-02 p 65-66 Table 6 19 PMV Response 2016-03-02 p 64 lines 1205-1207 20 PMV Response 2016-03-02 p 65-66 Table 6 21 PMV Response 2016-03-02 p 45 Table 3 22 PMV Response 2016-03-02 p 78 lines 1481-1483 23 PMV Response 2016-03-02 p 78 lines 1483-1484
Pacific Region Science Response Technical Review Assessing
Ecosystem Productivity Model of Roberts Bank
14
occurrences from data and similarly with predicted and observed absences The Proponent then calculated two additional accuracy of fit measures sensitivity (the model predicts a species to occur in an area where it is known to occur in reality) and specificity (the model predicts a species does not occur in an area it is known not to occur in reality)24 This analysis concluded that the model has high predictability for functional groups such as eelgrass and sea pens with relatively static distributions but lower predictability for functional groups which are more temporally and spatially dynamic such as biofilm and green algae25
There are two problems with this approach The first is that this goodness of fit comparison was done only for habitat-forming functional groups no discussion of how well this analysis applies to mobile functional groups was provided The second problem is that this method does not take into account situations (such as occurs in this study with several groups) in which species occur at only a few locations For example ldquohellipif the test data consist of 95 absences and 5 presences and this reflects the true prevalence of the species on the landscape (a realistic scenario for a rare species) a lsquonullrsquo model that predicted absence in all cases (eg no model at all) would be correct 95 of the timehellipldquo (Franklin 2009 p 151) This latter point is important here as these habitat functional groups (biofilm brown algae native eelgrass green algae Japanese eelgrass tidal marsh biomat and orange sea pens26) appear not to occur over most of the Project area (as portrayed by the model outputs presented in the distribution figures of PMV Response 2016-03-02 Appendix 218) It is therefore important that a robust evaluation of the performance of the Ecospace module is used with preferably more than one measure
In summary the starting point for this modelling analysis matters It is not just about a comparison between results with and without the Project The model has to be considered a sufficient representation of the ecosystem The Proponent has not yet sufficiently validated the model
35 Model results 351 Presentation of model results
As noted above (Section 331) the stated objective of the Roberts Bank ecosystem model was not to provide an assessment of Project impacts for each functional group at a fine temporal scale but to estimate changes in productive potential with and without the Project at the ecosystem level27 However results were presented as comparisons by speciesfunctional group with and without the Project and not as potential changes in total ecosystem productivity The revised figures for each functional group showing distributions without the Project with the Project and their difference indicated impacts were likely to be localized with overall impacts relatively small The range of biomass ratios with and without the Project was 045 ndash 189 with most values slightly less than 1 This is interpreted as indicating slight decreases in the capacity of the study area to support biomass and production with the Project for many functional groups28 (Figure 2)
24 PMV Response 2016-03-02 p 80 lines 1524-1527 25 PMV Response 2016-03-02 p 81 lines 1551-1559 26 PMV Response 2016-03-02 p 82 Table 8 27 PMV Response 2016-03-02 p 99 lines 1914-1917 28 PMV Response 2016-03-02 Appendix 218
Pacific Region Science Response Technical Review Assessing
Ecosystem Productivity Model of Roberts Bank
15
Biomass Ratio
Freq
uenc
y
04 07 10 13 16 19
05
1015
2025
30
Figure 2 Histogram of biomass ratios obtained by comparisons of model runs with and without the project (ie With Without) Values less than 1 indicate reductions in biomass with the Project compared against without the Project) Data from Appendix 218 of PMV Response 2016-03-02
352 Sensitivity and vulnerability analyses Every ecosystem model is only one possible representation of the true ecosystem defined by the modelrsquos structure and the values chosen for its many parameters The key point is how well the model represents the real system how that fit can be measured and the sensitivity of model outputs to variability in the selected parameter values The ideal model should be robust to a wide range of uncertainties in the input data and parameters This robustness is determined by performing sensitivity analyses on the model to see how it responds to variations in the input parameters and determining to which input parameters the model is most sensitive
The vulnerability parameters determine the strength of the feeding interactions between functional groups They set the level of density dependence of each functional group Higher vulnerability settings provide greater top-down (predator) control whereas lower settings provide greater bottom-up (environmental) control29 Several publications have shown that EwE models are very sensitive to the vulnerability parameters and Christensen and Walters (2000) point out that a main pitfall of EwE is that ldquopredation vulnerabilities are often underestimated lessening the modelled impacts of predationrdquo It is usual practice to tune Ecopath models including the vulnerability parameters to time series data such as biomass using the temporal simulation model Ecosim However these data were not available for the RBT2 area so this robust method of fitting the model and estimating vulnerability parameters was not possible Instead a vulnerability setting of 2 was used as the default value for the key model runs which is ldquocommon practice when time series data are not available and estimates of vulnerability in the
29 PMV Response 2016-03-02 p 70 lines 1318-1323
Pacific Region Science Response Technical Review Assessing
Ecosystem Productivity Model of Roberts Bank
16
model cannot be maderdquo30 with sensitivity analyses run for a range of 15 to 3 This narrow range was criticized by DFOECCC in initial discussions about the model with the Proponent The Proponent subsequently reran the model with a larger range of vulnerabilities31 (11 to 10) and concluded this broader vulnerability range produced similar results for the productivity ratio with and without the Project to those in the original EIS and that the EIS was more likely to overestimate than underestimate potential project effects32 The data in Table 7 of the PMV Response33 did indicate changes in productivity ratios ranging from 0 to 50 of the defined key run (which used a vulnerability setting of 2) However the Proponent changed all vulnerability settings to the same value ie all were 2 or all were 10 etc In reality the vulnerability parameters resulting from Ecosim models that are fitted to data as described above vary by functional group which was not explored here Therefore although the results suggest that the original choice of 2 for the default key run seemed reasonable the potential effects of variability in vulnerability settings was not fully explored
Sensitivity analyses are usually based on the range of uncertainty estimated for input data and parameters often called the confidence limits around the model parameters The EwE framework integrates many different data sources and parameters including values from the literature It can therefore be difficult to identify ldquoreasonablerdquo confidence limits when derived from such diverse data sources Standard practice in Ecopath models has been to develop a pedigree for each parameter with default values for uncertainty based on the nature of the source data For example parameter values based on high precision field observations of biomass within the model domain receive default confidence intervals of 10 whereas parameter values based on models developed for elsewhere or professional judgment receive confidence intervals of 8034 Sensitivity analyses are then run using parameter values selected from within these confidence intervals However if these default confidence intervals do not capture the full range of variability then the outputs are not informative of the variability in the lsquorealrsquo ecosystem Field observations were collected for many functional groups within the model domain in 2012 and 2013 as part of studies to support the RBT2 EIS Apparently the purpose of these observations was to document spatial variability (in part for the Ecospace model) and temporal variability (measurements at one location over time) and not to derive confidence intervals around the observations35
The reliance on the pedigree approach to derive confidence intervals for this Roberts Bank model was criticized by DFO ECCC and NRCan in discussions with the Proponent As a result the Proponent reran the model with much larger confidence intervals ranging from 30 to 100 depending on the input parameter and functional group36 The results from this new analysis using the broader confidence intervals were similar to those using the original pedigree approach The Proponent noted that ldquoWhile the production within each helliprun was very different there was little difference in the biomass ratio [with and without the Project] These results further demonstrate that even with a greater range in input values the influence of the Project on the Roberts Bank ecosystem is consistent among allhellipmodel runsrdquo37 This provides confidence that the model may be robust to uncertainty in its input parameters Two concerns
30 PMV Response 2016-03-02 p 70 lines 1321-1322 31 PMV Response 2016-03-02 p 71-74 32 PMV Response 2016-03-02 p 71 lines 1339-1341 33 PMV Response 2016-03-02 p 73 34 EIS Appendix 10-C Section 251 page 18 35 PMV Response 2016-03-02 p 42 lines 772-777 36 PMV Response 2016-03-02 p 44-47 37 PMV Response 2016-03-02 p 47 lines 855-858 and see also PMV Response 2016-03-02 Appendix 27-B
Pacific Region Science Response Technical Review Assessing
Ecosystem Productivity Model of Roberts Bank
17
remain however The quote above indicates that the production among the different model runs was very different although with little difference in the biomass ratios with and without the Project Since biomass is not the same as production it would be informative for understanding model performance and potential impacts to show these production differences This also relates to the point made in Section 34 regarding how well the model represents the real ecosystem and not just within-model comparisons with and without the Project The second question is more technical and relates to how the randomization (Monte Carlo or MC) routine that was used to create multiple model runs used the uncertainty about the diet data Diets are not currently included in the MC routine available to regular users of the Ecosim model how they were handled in this RBT2 model appears not to be explained
Finally the sensitivity analyses indicate that the uncertainty in the input parameters does not lead to much difference between model parameters with or without the project However this conclusion does not describe how the uncertainty in the input parameters affects understanding of the ecosystem
40 Conclusions Overall the main conclusion of the Environmental Impact Statement from the Proponent is stated as ldquohellipafter the implementation of mitigation hellipthe Project is not expected to result in any significant adverse effects on any of the 16 valued componentsrdquo38 In addition ldquohellipapproximately 40 of the functional groups are forecast to change no more than 5 which hellip is judged to be within the uncertainty of the model runsrdquo39 although larger changes were forecast for orange sea pens freshwater biofilm green algae and raptors The conclusions from the modelling studies are that ldquohellipthe proposed project will have an impact on the study area that the effect varies between species and that the findings are robust to parameter uncertaintyrdquo40 Specific outcomes by valued component as derived from the EwE model are presented by functional groups in Table 1
38 PMV March 2015 Roberts Bank Environmental Impact Statement Executive Summary ndash Part 1 page 37 39 EIS Appendix 10-C p ii 40 EIS Appendix 10-D p iv
Pacific Region Science Response Technical Review Assessing
Ecosystem Productivity Model of Roberts Bank
18
Table 1 Changes in productive potential with the Project as derived from the EwE model
Changes in productive potential
Ecosystem category
Number of valued
components
Number with potential
biomass loss
Moderate decrease (31-60 decline)
Minor decrease (6-30 decline)
Negligible (0-5
change)
Minor increase (6-
30 increase)
Moderate increase (31-60 increase)
Source
Marine vegetation
7 7 - 3 2 2 - EIS Vol 3 Section 11 Table 11-17 page 11-65
Marine invertebrates
4 3 1 1 1 1 - EIS Vol 3 Section 12 Table 12-8 page 12-52
Marine fish 13 13 - 2 6 5 - EIS Vol 3 Section 13 Table 13-10 page 13-95
Coastal birds
11 8 - 3 4 3 1 EIS Vol 3 Section 15 Table 15-10 page 15-67
Pacific Region Science Response Technical Review Assessing
Ecosystem Productivity Model of Roberts Bank
19
Most functional groups showed some potential biomass loss with the Project with biomass loss defined as any model run with negative outcomes (ie in which biomass with the project was less than biomass without the Project) The summary of changes in productivity potential are mixed with most (33 out of 35) valued components showing minor decreases to minor increases (defined as 6 to 30 changes in productive potential with the Project compared to without the Project)
The main conclusions of this review in regards to the Terms of Reference are
1 Do the functional groups and abiotic variables used in the model adequately represent the ecosystem at Roberts Bank
o The 58 functional groups and abiotic variables used in the model adequately represent the main components of the Roberts Bank ecosystem however for longer lived species the life stages of the species are not well represented and some of the impacts of the Project may be expected to affect specific life stages
o The abiotic variables adequately represent the physical drivers of this ecosystem on an annual time scale However annual values for these abiotic variables may not adequately capture important sub-annual events such as storms (DFO 2016) the timing of arrival and departure of highly migratory species and whether there may be important sub-annual thresholds or mismatches in timing as a result of the Project
o Biotic factors (eg nutrients) which are particularly important for biofilm and other lower trophic level taxa are not included in this model The model is therefore unable to assess the potential development of eutrophication and benthic organic enrichment events which may affect fish habitats in the study area
2 Are the parameter estimates used by the model valid and defensible for this system
o In general parameter estimates appear to be adequate for this system Field studies were done in two years to provide data in particular on distributions of selected functional groups for the Ecospace module Note the distribution studies focussed on taxa which were relatively immobile and therefore lsquofixedrsquo in space
o the selection of some model parameters would benefit from further explanation for example the choice of fixed diet matrices versus dynamic matrices which can vary with changes in abundances or predators and prey
o the selection of some model parameters would benefit from further explanation for example the link between the diets described in the text of Appendix 10B and the quantities presented in Appendix A of Appendix 10B It is understood that proportions were derived using the ldquofixed selectivityrdquo principle but in order to be fully transparent the derivation of each diet should be provided in an appendix
o discussion and explanation is needed of why ecotrophic efficiencies differ from expected values (eg the ecotrophic efficiency for Pacific herring is listed as 038) and
o the abiotic factor lsquosubstratersquo was limited to ldquohardrdquo or rdquosoftrdquo options which can be restrictive given that they serve as endpoints on a substrate composition continuum These limited options may not provide the sensitivity required to assess substrate preference nor the flexibility for taxa (eg motile organisms) that span hard mixed and soft substrate types In addition it is not clear if changes in the hardsoft categories were considered over time within identified depositional or erosional settings before and after construction
Pacific Region Science Response Technical Review Assessing
Ecosystem Productivity Model of Roberts Bank
20
3 Are the limitations and uncertainties of the model identified and appropriately considered when determining the modelrsquos representation of current and possible future conditions
o the EwE model was not designed to evaluate a range of future conditions It was designed to estimate changes in the productive potential at the ecosystem level with and without the Project Therefore the model was run without the Project and with the Project for a range of plausible abiotic conditions and the results were compared with respect to biomass and productivity by functional group
o the pedigree approach to assessing the uncertainties of model outcomes is unsatisfactory for the purpose here as it relates solely to a qualitative judgment of the value of data based on its source However when the model was rerun with much wider ranges of confidence intervals (uncertainties) the results in general (but not necessarily for each functional group) were similar to the results using the original pedigree approach This suggests that taken overall the model may be robust to wide ranges of uncertainty in these input variables and parameters
o there is inadequate validation of the model This is inadequate for three reasons
(i) the basic Ecopath model is not validated and the Ecospace balancing process (the spin-up period) resulted in some biomass estimates being increased or decreased beyond their confidence limits
(ii) the goodness of fit test used to evaluate how well the model predicted the spatial occurrence functional groups is not fit for purpose (Section 34) and
(iii) validation was provided for only a small number of functional groups (the habitat-forming functional groups) As a consequence the model is currently not validated
o Considering the proportion of open boundaries relative to closed boundaries in the model processes taking place outside the modelled ecosystem are likely to contribute to dynamics within the modelled ecosystem However these external processes may not be well-resolved by the EwE model as currently configured
4 Are the model results related to the potential effects of the Project on fish and fish habitat and migratory birds and their food resources valid and defensible
o this is a very complex ecosystem model constructed for a relatively small and open (in the sense of considerable exchange with adjacent non-modelled areas) system Many assumptions have been made based on poor or missing data Taking all these considerations into account the model does the best job possible of comparing the biomass and productivity of the Roberts Bank ecosystem with and without the Project
o the extent to which the model adequately represents the lsquorealrsquo ecosystem of Roberts Bank as opposed to comparisons of model results with and without the Project is unclear as a number of basic diagnostics are not presented (see point 3 above)
o the EwE model is not capable of and is not designed to represent nutritional and food quality variations in prey functional groups and how these may impact highly migratory predators such as birds with and without the Project
5 Is the EwE model framework a valid method to quantify large scale impacts to fish habitat fish productivity and migratory bird productivity
o the EwE model as implemented in this project and reviewed here is a useful first-order framework to organise information and derive initial estimates of how the system may respond to perturbations
Pacific Region Science Response Technical Review Assessing
Ecosystem Productivity Model of Roberts Bank
21
o the utility of a EWE model for impact purposes is highly dependent on the quality of input data
o each EwE model is highly dependent on local conditions Although appropriate as an overall methodology each application would need to be reviewed for how it may be applied to any new ecosystem and
o the EwE model would need to be substantially reformulated if it was to include considerations of changes in chemical composition or food quality of prey in particular for seasonal migratory species such as birds which may depend on very large biomasses of prey with specific chemical composition to fuel their migrations beyond the ecosystem model boundaries
Contributors Contributor Affiliation Ian Perry Author DFO Science Pacific Region Alida Bundy Author DFO Science Maritimes Region Terri Sutherland Author DFO Science Pacific Region Robert Elner Author ECCC Canadian Wildlife Service Andrew Robinson Author ECCC Canadian Wildlife Service Lesley MacDougall Editor DFO Science Pacific Region
Approved by Carmel Lowe
Regional Director Science Branch Pacific Region Fisheries and Oceans Canada
November 4 2016
Sources of Information Christensen V Coll M Steenbeek J Buszowski J Chagaris D walters CJ 2014
Representing variable habitat quality in a spatial food web model Ecosystems 17 1397-1412
Christensen V and Walters C 2000 Ecopath with Ecosim methods capabilities and limitations Ecological Modelling 172 109-139
Colleacuteter M Valls A Guitton J Gascuel D Pauly D and Christensen V 2015 Global overview of the applications of the Ecopath with Ecosim modeling approach using the EcoBase models repository Ecological Modelling 302 pp42-53
Compass Resource Management Ltd 2013 Roberts Bank Terminal 2 Technical Advisory Group (TAG) Process Report Productive Capacity ndash Final Report 119pp (Accessed November 1 2016)
DFO 2016 Technical Review of Roberts Bank Terminal 2 Environmental Assessment Section 95 ndash Coastal Geomorphology DFO Can Sci Advis Sec Sci Resp 2016045 (Accessed November 4 2016)
Pacific Region Science Response Technical Review Assessing
Ecosystem Productivity Model of Roberts Bank
22
ESSA Technologies 2014a Roberts Bank Terminal 2 Project Roberts Bank Delta BC Environmental Impact Statement Volume 3 Biophysical Effects Assessments Appendix 10-C Roberts Bank Ecosystem Model Development and Key Run Port Metro Vancouver (Accessed November 1 2016)
ESSA Technologies 2014b Roberts Bank Terminal 2 Project Roberts Bank Delta BC Environmental Impact Statement Volume 3 Biophysical Effects Assessments Appendix 10-D Roberts Bank Ecosystem Model Sensitivity Analyses Port Metro Vancouver (Accessed November 1 2016)
Franklin J 2009 Mapping Species Distributions Spatial Inference and Prediction Cambridge University Press Cambridge
Hemmera 2014 Roberts Bank Terminal 2 Project Roberts Bank Delta BC Environmental Impact Statement Volume 3 Biophysical Effects Assessments Appendix 10-B Roberts Bank Ecosystem Model Parameter Estimates Port Metro Vancouver File 302-03503 (Accessed November 1 2016)
Port Metro Vancouver 2015a Roberts Bank Terminal 2 Project Roberts Bank Delta BC Environmental Impact Statement Volume 3 Biophysical Effects Assessments Section 100 Biophysical Setting (Accessed November 1 2016)
Port Metro Vancouver 2015b Roberts Bank Terminal 2 Project Roberts Bank Delta BC Environmental Impact Statement Volume 3 Biophysical Effects Assessments Section 103 Overview of Assessing Ecosystem Productivity (Accessed November 1 2016)
Port Metro Vancouver 2015c Roberts Bank Terminal 2 Project Environmental Assessment Additional Information Requirements (July 31 2015) Responses Response to Information Request 6 IR-73115-06 Canadian Environmental Assessment Agency Reference Number 80054 dated 26 October 2015
Steenbeek J Coll M Gurney L Meacutelin F Hoepffner N Buszowski J and Christensen V 2013 Bridging the gap between ecosystem modeling tools and geographic information systems Driving a food web model with external spatialndashtemporal data Ecological Modelling 263 139ndash 151
Sutherland T Elner R and OrsquoNeill J 2013 Roberts Bank Ecological crucible of the Fraser River estuary Progress in Oceanography 115 171ndash180
Vancouver Fraser Port Authority 2016 From the Vancouver Fraser Port Authority to the Review Panel re Answers to preliminary technical questions submitted during the completeness phase from Fisheries and Oceans Canada Natural Resources Canada and Environment and Climate Change Canada concerning the ecosystem modelling to support the Roberts Bank Terminal 2 Project environmental review CEAR Document 547 (Accessed November 1 2016)
Pacific Region Science Response Technical Review Assessing
Ecosystem Productivity Model of Roberts Bank
23
This Report is Available from the Centre for Science Advice
Pacific Region Fisheries and Oceans Canada
3190 Hammond Bay Road Nanaimo BC V9T 6N7
Telephone (250) 756-7208 E-Mail csapdfo-mpogcca
Internet address wwwdfo-mpogccacsas-sccs
ISSN 1919-3769 copy Her Majesty the Queen in Right of Canada 2016
Correct Citation for this Publication
DFO 2016 Technical review of Roberts Bank Terminal 2 environmental assessment section 103 ndash assessing ecosystem productivity DFO Can Sci Advis Sec Sci Resp 2016050
Aussi disponible en franccedilais
MPO 2016 Examen technique de leacutevaluation environnementale du Terminal 2 agrave Roberts Bank section 103 ndash eacutevaluation de la productiviteacute de leacutecosystegraveme Secr can de consult sci du MPO Reacutep des Sci 2016050
- TECHNICAL REVIEW OF ROBERTS BANK TERMINAL 2 ENVIRONMENTAL ASSESSMENT SECTION 103 ndash ASSESSING ECOSYSTEM PRODUCTIVITY
-
- 10 Context
- 20 Background
-
- 21 Background and Terms of Reference
- 22 Approach to assessing ecosystem productivity
-
- 30 Analysis and Response
-
- 31 The EwE Team
- 32 Overview of assessment results of hydrological and sediment modelling
- 33 Model implementation
-
- 331 The purpose of the EwE model
- 332 Applicability of the EwE model framework to the Roberts Bank region
- 333 Model documentation
- 334 Highly mobile functional groups
- 335 Seasonality (model time step)
- 336 Life history structure
- 337 Model balancing
-
- 34 Model validation
- 35 Model results
-
- 351 Presentation of model results
- 352 Sensitivity and vulnerability analyses
-
- 40 Conclusions
- Contributors
- Approved by
- Sources of Information
- This Report is Available from the
-
- CSAS 2016-50 - Assessing Ecosystem Productivitypdf
-
- TECHNICAL REVIEW OF ROBERTS BANK TERMINAL 2 ENVIRONMENTAL ASSESSMENT SECTION 103 ndash ASSESSING ECOSYSTEM PRODUCTIVITY
-
- 10 Context
- 20 Background
-
- 21 Background and Terms of Reference
- 22 Approach to assessing ecosystem productivity
-
- 30 Analysis and Response
-
- 31 The EwE Team
- 32 Overview of assessment results of hydrological and sediment modelling
- 33 Model implementation
-
- 331 The purpose of the EwE model
- 332 Applicability of the EwE model framework to the Roberts Bank region
- 333 Model documentation
- 334 Highly mobile functional groups
- 335 Seasonality (model time step)
- 336 Life history structure
- 337 Model balancing
-
- 34 Model validation
- 35 Model results
-
- 351 Presentation of model results
- 352 Sensitivity and vulnerability analyses
-
- 40 Conclusions
- Contributors
- Approved by
- Sources of Information
- This Report is Available from the
-
Canadian Science Advisory Secretariat Pacific Region Science Response 2016050
December 2016
TECHNICAL REVIEW OF ROBERTS BANK TERMINAL 2 ENVIRONMENTAL ASSESSMENT SECTION 103 ndash
ASSESSING ECOSYSTEM PRODUCTIVITY
10 Context Vancouver Fraser Port Authority (VFPA) formerly Port Metro Vancouver (the Proponent) is proposing to construct and operate the Roberts Bank Terminal 2 Project (the Project) a new three-berth marine container terminal at Roberts Bank in Delta British Columbia The proposed terminal is located next to the existing Deltaport and Westshore Terminals In addition to the construction of the new terminal the Proponent has proposed to widen the north side of the existing Roberts Bank causeway from its east-end connection with the mainland to the entrance to the new terminal The existing tug basin connected to the northeast side of Deltaport Terminal is also proposed to be expanded The new marine terminal is predicted by the Proponent to process up to 260 container ship calls per year at full capacity with the assistance of two or three large berthing or escort tugs to manoeuver ships into or away from assigned berths The terminal is designed to operate 24 hours per day year-round
The Roberts Bank Terminal 2 Project is subject to an environmental assessment by a Review Panel pursuant to the Canadian Environmental Assessment Act 2012 As a federal authority in the environmental assessment for the Project Fisheries and Oceans Canada (DFO) will be asked to present information to the review panel and at public hearings in relation to its expertise on the effects of the Project on fish and fish habitat including aquatic species at risk and the adequacy of mitigation and offsetting measures and monitoring and follow-up programs proposed by the Proponent DFOrsquos Pacific Region Fisheries Protection Program (FPP) will coordinate DFOrsquos participation in the environmental assessment
The Proponent assessed future ecosystem productivity at Roberts Bank using the Ecopath with Ecosim and Ecospace (EwE) model framework The potential impacts of the Project to hydrodynamic conditions and sediment transport in the area as a result of changes in wind wave and current patterns and intensities are projected using different model frameworks A companion Science Response (DFO 2016) has been developed by DFO and Natural Resource Canada (NRCan) to review Section 95 ldquoCoastal Geomorphologyrdquo of the Environmental Impact Statement (EIS) which describes the hydrodynamic and sedimentology models that were used to evaluate the effect of the Project on water and sediment movements
Outcomes of the EwE models are incorporated into the analysis of the potential project-related effects on the ongoing productivity of commercial recreational and Aboriginal fisheries Consequently DFO FPP has requested that DFO Science Branch provide an evaluation of the Proponentrsquos characterization of project-related effects as conducted using the Ecopath with Ecosim and Ecospace (EwE) ecosystem model
Pacific Region Science Response Technical Review Assessing
Ecosystem Productivity Model of Roberts Bank
2
The objectives for this Science Response are to
1 Determine if the functional groups and abiotic factors used in the model adequately represent the ecosystem at Roberts Bank
2 Assess whether the parameter estimates used by the model are valid and defensible for this system
3 Assess whether the limitations and uncertainties of the model are identified and appropriately considered when determining the modelrsquos representation of current and possible future conditions
4 Provide advice regarding whether the model results related to the potential effects of the Project on fish and fish habitat and migratory birds and their food resources are valid and defensible
5 If possible provide advice regarding the validity of using the EwE model framework to quantify large scale impacts to fish habitat and fisheries productivity and the productivity of migratory birds
This Science Response evaluates Section 100 ldquoBiophysical Settingrdquo with a focus on Section 103 ldquoOverview of Assessing Ecosystem Productivityrdquo in the EIS as submitted by the Proponent (Port Metro Vancouver 2015) This Section and consequently this Response describes the ecosystem modelling approach that was taken to evaluate the direct and indirect effects of the footprint of the proposed terminal and widened causeway herein referred to as lsquothe Projectrsquo This ecosystem model provides outputs related to potential effects of the project on the study area at an ecosystem level including aquatic species and bird species in the Project area Evaluation of the model and its outputs therefore required expertise in both fishery aquatic species and migratory bird species Consequently this Science Response is the product of a joint review between DFO and Environment and Climate Change Canada (ECCC) Canadian Wildlife Service and Wildlife and Landscape Science to provide a complete evaluation
This Science Response Report results from the Science Response Process of July 2016 on the Technical Review of Ecopath with Ecosim and Ecospace (EwE) Ecosystem Productivity Model application to the Roberts Bank Terminal 2 Environmental Assessment
20 Background
21 Background and Terms of Reference The Projectrsquos main components have a proposed combined marine footprint area of approximately 179 km2 listed below by specific component
bull Marine Terminal 1335 km 2 including terminal (116 km 2) and dredged berth pocket and marine approach areas (0174 km 2)
bull Widened Causeway 0424 km 2
bull Expanded Tug basin 0031 km 2
Roberts Bank in the Fraser River estuary consists of complex intertidal and subtidal habitats including intertidal eelgrass beds and is an important stopover area for migrating shorebirds and productive feeding and rearing habitats for many fish and invertebrate species It also provides habitat for endangered Southern Resident Killer Whales and other marine mammals
Pacific Region Science Response Technical Review Assessing
Ecosystem Productivity Model of Roberts Bank
3
The environmental conditions at Roberts Bank are dynamic and are influenced by a variety of oceanographic and atmospheric factors including the Fraser River freshwater and sediment plume discharge diurnal tidal currents and prevailing and storm-generated wind and wave activity In addition the intercauseway region provides significant drainage from marsh and agricultural areas which have different characteristics from marine waters and which run along the ferry causeway
To provide the required science advice this Science Response focusses on Section 10 ldquoBiophysical Settingrdquo of the Environmental Impact Statement (EIS) (Port Metro Vancouver 2015a) specifically Section 103 ldquoOverview of Assessing Ecosystem Productivityrdquo (Port Metro Vancouver 2015b) and its related Appendices 10-B ldquoRoberts Bank Ecopath with Ecosim and Ecospace model parameter estimatesrdquo (Hemmera 2014) Appendix 10-C ldquoRoberts Bank Ecosystem model development and key runsrdquo(ESSA Technologies 2014a) and Appendix 10-D ldquoRoberts Bank Ecosystem model sensitivity analysesrdquo (ESSA Technologies 2014b) Additional important information was obtained from the Response to Information Request 6 (IR-73115-06 Canadian Environmental Assessment Agency Reference Number 80054 dated 26 October 2015) (Port Metro Vancouver 2015c) and the Written Responses to Coastal Geomorphology and Ecosystem Modelling Questions provided by the Proponent to DFO ECCC and NRCan on 2 March 2016 (Port Metro Vancouver (PMV) Transmittal TRE-01-RBT2-0004A subsequently referred in this Science Response as ldquoPMV Response 2016-03-02rdquo) (Vancouver Fraser Port Authority 2016)
The process followed in preparing this Science Response involved an initial review of the submitted EIS followed by an in-person meeting of the Proponent its contractors and representatives of DFO ECCC and NRCan to discuss and clarify questions arising from the initial review (Vancouver 23 November 2015) DFO and NRCan provided written questions to the Proponent based on preliminary review of the EIS on November 19 2015 ECCC also provided written questions based on its preliminary review of the EIS to the Proponent on December 1 2015 and January 20 2016 This large initial meeting was followed by smaller focussed meetings between the Proponent its contractors and DFO and NRCan on 11 December 2015 to clarify hydrology and sediment modelling questions with DFO on 8 January 2016 to clarify ecosystem modelling questions and with ECCC on 18 February 2016 to clarify questions relating to birds Written responses to all of these meetings and questions were provided by the Proponent to DFO ECCC and NRCan as the ldquoPMV Response 2016-03-02rdquo and ldquoPMV Response 2016-05-30rdquo (Vancouver Fraser Port Authority 2016) VFPArsquos answers to questions posed by DFO and NRCan regarding coastal geomorphology modelling have been posted to the Canadian Environmental Assessment Registry (CEAR)
22 Approach to assessing ecosystem productivity The Proponent adopted an ecosystem approach to evaluate the direct and indirect effects of the Project on the productivity of the Roberts Bank ecosystem A weight of evidence approach was used to assess the potential effects of the project on the productivity of the ecosystem and selected key components in the study area this approach included a spatial ecosystem simulation model (which included a habitat capacity model) a shorebird opportunity model and empirical data An important point is that any effects on the system during the construction phase or from expansion of the tug basin were excluded from this modelling process the focus instead being a comparison of modelled system productivity before and after the proposed terminal and expanded causeway is in place The chosen ecosystem simulation model was
Pacific Region Science Response Technical Review Assessing
Ecosystem Productivity Model of Roberts Bank
4
Ecopath with Ecosim and its spatial version Ecospace (collectively referred to here as the EwE framework or EwE model) This modelling approach was recommended by a prior Productive Capacity Technical Advisory Group comprised of representatives of technical experts from government agencies academia non-governmental organizations Vancouver Fraser Port Authority and its consultants (Compass 2013) convened by the Proponent and which also recommended a selection of focal species for the model The final selection of functional groups and the resulting food web that form the core of this ecosystem model are shown in Figure 1
Pacific Region Science Response Technical Review Assessing
Ecosystem Productivity Model of Roberts Bank
5
Figure 1 Ecopath with Ecosim model food web for Roberts Bank (Adapted from EIS Volume 3 Section 10 Fig 1033 on page 10-16) The groups coloured in orange represent focal groups size of symbols represents relative annual amount of biomass in the Roberts Bank study area
Pacific Region Science Response Technical Review Assessing
Ecosystem Productivity Model of Roberts Bank
6
The EwE framework is a common approach to ecosystem modelling which has been developed and expanded over the past two to three decades It currently has three main components
1 Ecopath ndash the core model which provides a mass-balance snapshot of the system
2 Ecosim ndash a module that enables simulation modelling over time
3 Ecospace ndash a module that enables simulation modelling over space
In order to make an EwE model tractable species are aggregated into functional groups based on their similar ecological characteristics (habitat and prey preferences etc) the Roberts Bank models had 58 functional groups The first step (Ecopath) was to obtain input parameters representing biomass production consumption emigration and diet for each functional group These parameters were then tuned in an iterative process until the overall production and consumption was balanced (a mass-balance approach) resulting in a model food web with estimates of energy flow between functional groups (Fig 1)
In the second step Ecosim was combined with the spatial model Ecospace The abiotic variables selected in this EIS (depth salinity bottom current wave height sediment type) were used as external forcings to the Ecospace module These abiotic variables provided the physical forcings for the simulations without and with the Project Since time series data on the functional groups of the model were not available Ecospace was run until the model reached equilibrium using various assumptions of the value of the vulnerability parameter (see Section 352) In this EIS the selected time step was annual with all variables abiotic and biotic expressed as yearly averages As used in this EIS the Ecospace module included a habitat capacity model which estimated the distribution of functional groups based on their environmental preferences for each abiotic variable (depth salinity bottom current wave height) and for substrate type (sand mud etc) The model thus allocated the spatial distribution of functional groups over the model domain based on their environmental preferences and the distributions of these abiotic variables with and without the Project The selected spatial unit size (ldquopixelrdquo) for the Ecospace model was 100 m2 In essence an Ecopath model was constructed for each pixel with particular rules governing how the functional groups interacted and moved among these spatial units The Ecospace module was run until it approached equilibrium (20 model years) to establish the spatial patterns without the Project For the lsquowith the Projectrsquo simulations the model was run for an initial 10 years and then the spatial patterns of the abiotic variables with the project were added and the model run for an additional 10 years1 The model outputs predicted changes in the productive potential of the Roberts Bank ecosystem as a comparison (ratio) with and without the Project rather than an absolute biomass that would be lost or gained as a result of the Project
1 EIS Appendix 10-C p 26
Pacific Region Science Response Technical Review Assessing
Ecosystem Productivity Model of Roberts Bank
7
30 Analysis and Response To prepare this response the following sections of the EIS additional documents were reviewed
DocumentSection Title
EIS Section 10
Including appendices 10B 10C and 10D
(Port Metro Vancouver 2015a Hemmera 2014 ESSA Technologies 2014a ESSA Technologies 2014b)
Biophysical Setting
Appendix 10-B Roberts Bank Ecosystem Model Parameter Estimates Port Metro Vancouver File 302-03503
Appendix 10-C Roberts Bank Ecosystem Model Development and Key Run Port Metro Vancouver
Appendix 10-D Roberts Bank Ecosystem Model Sensitivity Analyses Port Metro Vancouver
CEAR document 547 (Including Appendices) ldquoPMV Response 2016-03-02rdquo and ldquoPMV Response 2016-05-30rdquo
(Vancouver Fraser Port Authority 2016)
Vancouver Fraser Port Authority to the Review Panel re Answers to preliminary technical questions submitted during the completeness phase from Fisheries and Oceans Canada Natural Resources Canada and Environment and Climate Change Canada concerning the ecosystem modelling to support the Roberts Bank Terminal 2 Project environmental review
31 The EwE Team Building this ecosystem model was a complex undertaking which required knowledge of the ecosystem to be modelled how to set initial parameter values determination of reasonable ranges of these parameters how to balance the model and how to recognize when the model outputs were unrealistic These tasks became even more complex when spatial model dynamics were involved such as with Ecospace The team engaged by the Proponent to conduct this ecosystem modelling for the Roberts Bank Terminal 2 (RBT2) EIS was led by scientists at the Institute for Oceans and Fisheries located at the University of British Columbia in Vancouver These scientists are global leaders of the EwE model framework having developed much of its current implementation and who continue to lead its elaborations and extensions Construction and running of the model for this specific ecosystem was done in collaboration with ESSA Technologies of Vancouver Parameter values for the ecosystem model were obtained in part from observational studies conducted in the area by Hemmera of Burnaby BC
32 Overview of assessment results of hydrological and sediment modelling Implementation of the ldquowith the Projectrdquo simulations of the ecosystem model was done by driving the model with the abiotic variables as they were projected to be distributed with the Project footprint In the context of this EIS specifying depth salinity bottom currents wave height and sediment type conditions without the Project and changes with the Project were achieved by construction of hydrodynamical and sediment transport models The outputs from these models in combination with the identified environment preferences for the various biological groups were then used as inputs to the Ecospace model to define the spatial
Pacific Region Science Response Technical Review Assessing
Ecosystem Productivity Model of Roberts Bank
8
distributions of these functional groups The implementation of these hydrological and sediment transport models in this EIS was reviewed by DFO and NRCan (DFO 2016) This review concluded that the implementation of these models for this EIS was adequate for average winter conditions but lacking in validation for summer conditions in particular with strong freshwater flows from the Fraser River Simulations of strong storm events and their impacts on wave conditions and sediment transport were also lacking The effect of wave action and current speeds on sediment transport is non-linear such that increasing winds over short periods of time can impact sediment transport processes bottom topography and water depths beyond that determined under average model conditions Overall the review concluded that a greater range of sensitivity analyses is required to have confidence in the model outputs under lsquonon-averagersquo conditions The implication of this conclusion for the present review of the EwE model is that the full range of variability of abiotic characteristics such as bottom topography bottom current and wave heights and how they may affect relevant functional groups in the model with the Project may not be adequately represented Sensitivity analyses were provided by varying the intensity of abiotic variables and by removing abiotic variables to assess their interactive effects In general the ecosystem model outputs were robust to these sensitivity analyses with most groups varying by less than 5 Larger changes however were observed for primary producer and bird groupings and for some fish groups when various abiotic variables were omitted2
33 Model implementation 331 The purpose of the EwE model
The EwE model was intended to provide one line of evidence to assess the potential impacts of the Project on the Roberts Bank ecosystem which would then be used with other lines of evidence to make the final assessment Specifically ldquohellip the objective of the RB [Roberts Bank] model was not to provide an assessment of Project impacts for each functional group at a fine temporal scale but to estimate changes in productive potential with and without the Project at the ecosystem levelrdquo3 In addition ldquohellipthe primary objective of the RB ecosystem model is to evaluate potential changes in productivity from such abiotic factors with and without the terminal and causewayrdquo4 Results are presented for the selected functional groups no results were presented on potential changes in ecosystem structure or function
332 Applicability of the EwE model framework to the Roberts Bank region EwE models work best when the exchanges within the system being modelled are greater than the exchanges between the modelled system and the lsquooutsidersquo world In practice this means that EwE models work best for larger systems with few external exchanges In a meta-analysis of 433 Ecopath models Colleacuteter et al (2015) concluded that ldquohellipin the last two decades the range of the models area has expanded toward very large areas and the median has shifted accordingly from about 1000 km2 in 1984ndash1993 to about 100000 km2 in 1994ndash2014rdquo The section of the Roberts Bank ecosystem that is included in the EwE model was comparatively small (5468 km2) and complex It is an intertidally-dominated environment that is subject to strong seasonal influences of both freshwater and marine exchanges across relatively large seaward and shoreward boundaries
2 EIS Appendix 10-D p ii - iii 3 PMV Response 2016-03-02 p 99 lines 1914-1917 4 PMV Response 2016-03-02 p 38 lines 689-691
Pacific Region Science Response Technical Review Assessing
Ecosystem Productivity Model of Roberts Bank
9
Processes taking place outside the modelled ecosystem will contribute to dynamics within the modelled ecosystem (eg lsquooutsidersquo food supporting predators which occur in the Roberts Bank ecosystem for only part of the year predators which may feed in the Roberts Bank ecosystem but export this energy when they migrate out of the region) but which may not be well-resolved by the EwE model The Proponent justifies the spatial scale because it was specifically chosen for the questions being asked in regard to assessing productivity changes and because the relative influences of external exchanges are assumed to be identical with and without the project In addition highly mobile species with broad prey bases were assumed in the model to be partially sustained by external energy from outside the model system5 The distributions of organisms may differ however with and without the project which may affect their interactions with areas outside of the modelled system and the use of diets from outside the modelled system may not reflect the impacts of the project Further clarification of how the EwE model captures the exchanges and interactions with adjacent ecosystems are needed For example it could be argued that an ecosystem which is open to frequent exchanges of water and organic matter from beyond its boundaries might be more robust to local disturbances such as the Project
There are some inconsistencies in the information and assumptions used for some of the taxa in this ecosystem model For Dungeness Crab the justification for estimating total adult biomass (including females) from the biomass of fished males is unclear In addition it is unclear if the slower growth of female crabs once they have reached sexual maturity in comparison with male crabs has been considered The diet matrix for spiny dogfish does not represent the actual diet well in particular of euphausiids herring and shrimp and there are more recent references for biomass estimates of spiny dogfish in the study area than what was used in the EIS
Fishing mortality was not included in the model under the assumption that this would not change with or without the project While this assumption may be true the model has been parameterized by ignoring a source of mortality that will influence total production In essence fishing removes biomass from the ecosystem with the result that less biomass will be available for higher trophic levels How this may impact the ecosystem with and without the Project is unclear but it could make noticeable differences if for example there were thresholds in the feeding responses by these higher trophic level species The Ecopath model that was used is relatively unconstrained since many ecological efficiencies are low even for forage species which would be expected to be higher It is not clear how many species are exploited or the levels of exploitation but even if this does not change with the Project these mortality rates should be included in the model in order to add realistic constraints to the exploited functional groups
333 Model documentation Based on questions from DFO ECCC and NRCan following their initial review of the EIS the Proponent provided written responses dated 2 March 2016 to clarify several of the steps in the model development and implementation However several questions remain including questions about the Ecospace module Ecospace has undergone several recent developments such as the inclusion of the spatial-temporal data layer framework (Steenbeek et al 2013) the habitat capacity model (Christensen et al 2014) and the Monte Carlo analysis including the diet matrix As yet there are few published studies using these latest Ecospace developments and their documentation and justification need to be improved in the EIS
5 PMV Response 2016-03-02 p 29 lines 446 - 464
Pacific Region Science Response Technical Review Assessing
Ecosystem Productivity Model of Roberts Bank
10
Questions also remain regarding how the Monte Carlo randomization routine treated diet data The report indicates that the Monte Carlo routine randomly selected input parameters from the input ranges and that only models that were balanced were used This suggests that a high proportion of models were not balanced and therefore were not used (for example the EIS indicates that about one out of 1000 sampled input parameters was balanced6) A table showing the minimum maximum mode average and median values from the Monte Carlo runs for all the parameters would enable an evaluation of how much variation was actually sampled by the balanced model runs This is recommended in the EwE user information ie ldquoUsers should check the range of the input parameters that were actually used in the trials in the output csv file (see below)rdquo7
In addition there are several issues with the documentation of the derivation of the parameters for the functional groups Such documentation should clearly outline how the input parameter was estimated and the range of uncertainty for that parameter For example the input biomass of pinnipeds was defined as 04 t km 2 derived from estimates of 034 for Harbour seals and two estimates for Steller sea lions (012 and 014 t km 2) No explanation was provided for how the overall estimated pinniped biomass of 04 t km 2 was determined The diet of Sand Lance was described in the EIS as consisting mostly of zooplankton8 whereas the diet table for the model runs9 included 20 macrofauna 10 green algae and 10 detritus It is unclear why these additional prey were included in the diet used for the model runs
334 Highly mobile functional groups This implementation of the EwE framework included transient and migratory functional groups This is entirely appropriate and these groups cannot be excluded The approach taken in the Ecospace module was to impose a low (and conservative) dispersal rate among model spatial units (lsquopixelsrsquo) of 1 km yr-1 This may be appropriate for low mobility benthic organisms but it likely underestimates the movements of many other functional groups The effects of using higher and perhaps functional-group-specific dispersal rates was not considered The Proponents argued that higher dispersal rates would reduce impacts since species can move away from less desirable areas more quickly for completeness these runs should be done and evaluated Mobile species will also bring energy (food) captured outside the system into the modelled ecosystem This process was included in the model with the use of a diet import factor reflecting the consumption of prey outside the modelled region with the assumption that groups with high import rates were unlikely to respond to local changes on Roberts Bank10 This assumption needs justification perhaps at the functional group level for example many species of highly migratory birds and Pacific salmon use the Roberts Bank ecosystem to obtain food to continue their migrations Although this food does not compose a large fraction of their annual consumption it can be critical to enable them to continue their migrations
The EwE model is not designed to capture differences in prey quality ie differences in essential fatty acid or nutrient ratios The same species of prey may have greater or lesser nutritional value to predators depending on the conditions under which they are growing and their seasonal variations This is a particular concern with the nutritional quality of the diatom-dominated biofilm Diatomaceous biofilm is important to the highly migratory Western Sandpiper (Calidris mauri) Despite its predictive merits in relation to other ecosystem
6 EIS Appendix 10D Section 24 p5 7 EwE Help file p 151 8 EIS Appendix 10B Section 4133 p 76 9 EIS Appendix A of Appendix 10B 10 PMV Response 2016-03-02 p 28 lines 429 - 436
Pacific Region Science Response Technical Review Assessing
Ecosystem Productivity Model of Roberts Bank
11
components the EwE model is not informative with respect to understanding the potential impacts of the Project on biofilm and the Western Sandpiper While this example is specific to seabirds the potential exists for differences in the quality of biofilm to also be an issue for copepods which feed on biofilm and consequently to juvenile salmon which feed on these copepods (eg Sutherland et al 2013)
The EwE model is also not designed to predict effects of the Project on water quality although the Proponent noted that ldquoOther abiotic factors not included were deemed to be representative of variables that were already included in the modelhelliprdquo11 The Project may cause changes in physical and water quality conditions whether in isolation or in combination which may impact the productivity or nutritional quality of key prey organisms for local and migratory species which will not be captured by the model The EwE model does not assess the production of key nutrients or the implications of changes in important physical and water quality parameters to biofilm community structure and hence to important migratory birds
The model does not include biotic factors for both pelagic and benthic environments to assess the potential development of eutrophication and benthic organic enrichment events respectively Organic and redox indicators traditional measures of environmental assessments that are used to determine changes in functional group responses were included in the recent Deltaport Third environmental assessment (ie Pelagic chlorophyll dissolved nutrients Benthic sediment carbonnitrogen content redox state [sulfide concentration]) Benthic anoxic events based on organic enrichment are known to be strong drivers of community composition and exclusion regardless of substrate type In the absence of biotic factors (eg organic particulates) the model has not considered the potential for benthic organic enrichment which coincides with siltation processes within the upper tidal flats The tidal flat corner bordered by the Delta-dyke and Deltaport causeway has served as a catchment area for Fraser River silt since the development of the original Deltaport causeway (Sutherland et al 2013) The proposed position of the new terminal placed at the seaward termination of the Deltaport causeway may produce a crescent-shaped feature in the wake of the Fraser River Plume This feature may provide a more efficient silt trap that will promote benthic organic enrichment This piece of the environmental assessment seems to be missing and is important for assessing fish habitat in this area
335 Seasonality (model time step) Input data to parameterize the model were available on a range of time scales from hourly (eg physical data on salinity and water flow) to annual (eg species biomass) The Proponents indicated12 that this is a strength of the EwE model although ultimately the model was run with an annual time step with all sub-annual values being averaged to annual values This method therefore did not incorporate important seasonal processes such as winter-summer differences in salinity and storm properties and the seasonal appearances of abundances of predators and prey such as migratory salmon and birds that are much larger than the annual average For example juvenile salmon migrate from the Fraser River and onto Roberts Bank in the spring before moving into deeper waters If these spring abundances are averaged over the entire year these average abundances would be 5-10 times lower than the actual abundances during the spring (ie averaging the biomass that occurs in two months over a 12 month period) Additionally this method did not capture the intensity of processes such as growth and predation which can be focused over periods of a few weeks to a few months There may be important threshold effects at particular times and places which may be missed when using an 11 EIS Section 10 p 10-11 12 PMV Response 2016-03-02 p 86 line 1655
Pacific Region Science Response Technical Review Assessing
Ecosystem Productivity Model of Roberts Bank
12
annual time step for the model The Ecospace module has a monthly time step13 and therefore it is feasible to run this module with a sub-annual time step For example the Proponents submit14 that there are inadequate data to model the potential effects of the Project on the timing of biofilm production which could have implications for the migratory dunlin and Western Sandpiper However this could be modelled in an exploratory way to determine hypotheses about which factors could affect the timing of production of biofilm and the potential impacts on these birds These issues are of major concern to ECCC
336 Life history structure The EwE model did not separate functional groups into life history stages (stanzas) yet for many functional groups the juvenile stages can have very different life history characteristics and habitats than the adults It is unclear in the description of the model how different life history structures were considered and whether for example there were enough juveniles to produce the adults The implications of not including early life stages should be explored at least qualitatively to identify which species might have life stages that may be more vulnerable to project effects
337 Model balancing Balancing an EwE model is the process by which parameters are adjusted so that there is sufficient production for consumption requirements ie there are sufficient prey for all predators Expert opinion was used to examine parameter values and to adjust for errors or inconsistencies in logic ldquoPMV is confident that since the approach taken to balance the model was based on best practices the steps are appropriaterdquo15 Adjustments to initial parameters to ensure an ecologically-feasible model are necessary and to be expected For a few functional groups however very large changes to initial parameter estimates (which were often not based on Roberts Bank specific data) were necessary for example to transient killer whales When such initial parameters were adjusted (often by substantial amounts) by expert opinion to balance the model the confidence intervals around these adjusted parameter values were not increased to reflect this added uncertainty (see for example PMV Response 2016-03-02 p 51 lines 955-956) When expert opinion was used to make very large changes to initial parameter values broader confidence intervals about these parameters should have been applied This does not appear to have been the case and as a consequence may cause the actual uncertainty of the model outputs to be underestimated
Another example is for the pinniped group in which 50 of the diet was assumed to come from outside the model area in order to balance the model The rationale provided was ldquoThe pinnipeds caused excessive predation mortalities on numerous fish functional groups The biomass of pinnipeds was an average for the Strait of Georgia which was likely too high for Roberts Bank Therefore it was assumed that pinnipeds extracted only half of their diet from the study areardquo16 It is unclear whether the sensitivity of the model to different percentages of diet allocation was explored
As noted above (332) the Ecopath model was relatively unconstrained and few adjustments to input parameters were required to balance the model This is unusual and the low ecotrophic efficiencies of several functional groups suggest that full accounting of energy flows may not have been achieved (an ecotrophic efficiency of 1 indicates that 100 of the production of that
13 EIS Appendix 10C Section 29 p24 14 EIS Appendix 10D Appendix C p72 15 PMV Response 2016-03-02 p 49 lines 910-912 16 EIS Appendix 10C Section 261 p 20
Pacific Region Science Response Technical Review Assessing
Ecosystem Productivity Model of Roberts Bank
13
particular group is being preyed upon or removed by fishing leaving no individuals to die of old age17) An ldquoexcessrdquo of individuals dying of old age ie ecotrophic efficiencies much less than 1 suggests a potentially large biomass that is not used by the ecosystem and instead is converted to detritus
34 Model validation Model validation is the process by which the model parameters variables and outputs are compared with those from the real ecosystem to ascertain how well the model represents the ecosystem It is an essential step in providing confidence that the projections from the model in this case with and without the Project have relevance to how the real ecosystem may be expected to function with and without the Project In practice validating complex ecosystem models is difficult considering the range of assumptions that must be made when building the model the limited available data and natural variability of the ecosystem at a variety of time and space scales
Many of the standard diagnostics for the Ecopath model have not been evaluated in the EIS The Proponent appears to have assumed that once the Ecopath model was balanced then it was valid and fit for purpose The Proponent should provide all the Ecopath estimates of vital rates including mortality rates As presented questions remain For example many Ecotrophic Efficiencies (which control the transfer of biomass from prey to predators) are less than 1 even for taxa which would be expected to be close to 1 such as carnivorous zooplankton The reason for Ecotrophic Efficiencies less than 1 were not discussed or explained in the EIS
Detailed diagnostics for the Ecospace model should also be presented in order to evaluate model performance In response to criticisms by DFO ECCC and NRCan in discussions with the Proponent the latter provided the biomass of the functional groups from the Ecopath model (before Ecospace) and the Ecospace model after the spin-up period (which involved adjusting the parameters from the Ecopath model to balance the 5468 separate cells of the Ecospace model)18 The Proponents argue that ldquoIt is important to note that changes in biomass values generated during the spin-up period are identical for both with and without Project scenarios and thus do not provide information on the potential Project-related effects on productivity19 However several changes to biomass result from the Ecospace balancing process (spin-up period) This is only given brief attention by the Proponent in its response to the DFO ECCC and NRCan questions An analysis of Table 620 revealed that the biomass of 9 functional groups was larger or smaller than the widest confidence limits allowed for each group21 This requires further discussion and justification
The Proponent used a goodness of fit measure to compare spatial distributions of model outputs with field observations They indicated that ldquono other EwE models were identified which use a goodness-of-fit measure Hence the RB model is potentially the first such EwE model where a goodness of fit measure has been appliedrdquo22 The chosen goodness of fit measure is the percent correct classification (PCC) method23 This method derives a test statistic based on the proportion of locations at which predicted occurrences from the model match observed
17 EIS Appendix 10-B p 11 18 PMV Response 2016-03-02 p 65-66 Table 6 19 PMV Response 2016-03-02 p 64 lines 1205-1207 20 PMV Response 2016-03-02 p 65-66 Table 6 21 PMV Response 2016-03-02 p 45 Table 3 22 PMV Response 2016-03-02 p 78 lines 1481-1483 23 PMV Response 2016-03-02 p 78 lines 1483-1484
Pacific Region Science Response Technical Review Assessing
Ecosystem Productivity Model of Roberts Bank
14
occurrences from data and similarly with predicted and observed absences The Proponent then calculated two additional accuracy of fit measures sensitivity (the model predicts a species to occur in an area where it is known to occur in reality) and specificity (the model predicts a species does not occur in an area it is known not to occur in reality)24 This analysis concluded that the model has high predictability for functional groups such as eelgrass and sea pens with relatively static distributions but lower predictability for functional groups which are more temporally and spatially dynamic such as biofilm and green algae25
There are two problems with this approach The first is that this goodness of fit comparison was done only for habitat-forming functional groups no discussion of how well this analysis applies to mobile functional groups was provided The second problem is that this method does not take into account situations (such as occurs in this study with several groups) in which species occur at only a few locations For example ldquohellipif the test data consist of 95 absences and 5 presences and this reflects the true prevalence of the species on the landscape (a realistic scenario for a rare species) a lsquonullrsquo model that predicted absence in all cases (eg no model at all) would be correct 95 of the timehellipldquo (Franklin 2009 p 151) This latter point is important here as these habitat functional groups (biofilm brown algae native eelgrass green algae Japanese eelgrass tidal marsh biomat and orange sea pens26) appear not to occur over most of the Project area (as portrayed by the model outputs presented in the distribution figures of PMV Response 2016-03-02 Appendix 218) It is therefore important that a robust evaluation of the performance of the Ecospace module is used with preferably more than one measure
In summary the starting point for this modelling analysis matters It is not just about a comparison between results with and without the Project The model has to be considered a sufficient representation of the ecosystem The Proponent has not yet sufficiently validated the model
35 Model results 351 Presentation of model results
As noted above (Section 331) the stated objective of the Roberts Bank ecosystem model was not to provide an assessment of Project impacts for each functional group at a fine temporal scale but to estimate changes in productive potential with and without the Project at the ecosystem level27 However results were presented as comparisons by speciesfunctional group with and without the Project and not as potential changes in total ecosystem productivity The revised figures for each functional group showing distributions without the Project with the Project and their difference indicated impacts were likely to be localized with overall impacts relatively small The range of biomass ratios with and without the Project was 045 ndash 189 with most values slightly less than 1 This is interpreted as indicating slight decreases in the capacity of the study area to support biomass and production with the Project for many functional groups28 (Figure 2)
24 PMV Response 2016-03-02 p 80 lines 1524-1527 25 PMV Response 2016-03-02 p 81 lines 1551-1559 26 PMV Response 2016-03-02 p 82 Table 8 27 PMV Response 2016-03-02 p 99 lines 1914-1917 28 PMV Response 2016-03-02 Appendix 218
Pacific Region Science Response Technical Review Assessing
Ecosystem Productivity Model of Roberts Bank
15
Biomass Ratio
Freq
uenc
y
04 07 10 13 16 19
05
1015
2025
30
Figure 2 Histogram of biomass ratios obtained by comparisons of model runs with and without the project (ie With Without) Values less than 1 indicate reductions in biomass with the Project compared against without the Project) Data from Appendix 218 of PMV Response 2016-03-02
352 Sensitivity and vulnerability analyses Every ecosystem model is only one possible representation of the true ecosystem defined by the modelrsquos structure and the values chosen for its many parameters The key point is how well the model represents the real system how that fit can be measured and the sensitivity of model outputs to variability in the selected parameter values The ideal model should be robust to a wide range of uncertainties in the input data and parameters This robustness is determined by performing sensitivity analyses on the model to see how it responds to variations in the input parameters and determining to which input parameters the model is most sensitive
The vulnerability parameters determine the strength of the feeding interactions between functional groups They set the level of density dependence of each functional group Higher vulnerability settings provide greater top-down (predator) control whereas lower settings provide greater bottom-up (environmental) control29 Several publications have shown that EwE models are very sensitive to the vulnerability parameters and Christensen and Walters (2000) point out that a main pitfall of EwE is that ldquopredation vulnerabilities are often underestimated lessening the modelled impacts of predationrdquo It is usual practice to tune Ecopath models including the vulnerability parameters to time series data such as biomass using the temporal simulation model Ecosim However these data were not available for the RBT2 area so this robust method of fitting the model and estimating vulnerability parameters was not possible Instead a vulnerability setting of 2 was used as the default value for the key model runs which is ldquocommon practice when time series data are not available and estimates of vulnerability in the
29 PMV Response 2016-03-02 p 70 lines 1318-1323
Pacific Region Science Response Technical Review Assessing
Ecosystem Productivity Model of Roberts Bank
16
model cannot be maderdquo30 with sensitivity analyses run for a range of 15 to 3 This narrow range was criticized by DFOECCC in initial discussions about the model with the Proponent The Proponent subsequently reran the model with a larger range of vulnerabilities31 (11 to 10) and concluded this broader vulnerability range produced similar results for the productivity ratio with and without the Project to those in the original EIS and that the EIS was more likely to overestimate than underestimate potential project effects32 The data in Table 7 of the PMV Response33 did indicate changes in productivity ratios ranging from 0 to 50 of the defined key run (which used a vulnerability setting of 2) However the Proponent changed all vulnerability settings to the same value ie all were 2 or all were 10 etc In reality the vulnerability parameters resulting from Ecosim models that are fitted to data as described above vary by functional group which was not explored here Therefore although the results suggest that the original choice of 2 for the default key run seemed reasonable the potential effects of variability in vulnerability settings was not fully explored
Sensitivity analyses are usually based on the range of uncertainty estimated for input data and parameters often called the confidence limits around the model parameters The EwE framework integrates many different data sources and parameters including values from the literature It can therefore be difficult to identify ldquoreasonablerdquo confidence limits when derived from such diverse data sources Standard practice in Ecopath models has been to develop a pedigree for each parameter with default values for uncertainty based on the nature of the source data For example parameter values based on high precision field observations of biomass within the model domain receive default confidence intervals of 10 whereas parameter values based on models developed for elsewhere or professional judgment receive confidence intervals of 8034 Sensitivity analyses are then run using parameter values selected from within these confidence intervals However if these default confidence intervals do not capture the full range of variability then the outputs are not informative of the variability in the lsquorealrsquo ecosystem Field observations were collected for many functional groups within the model domain in 2012 and 2013 as part of studies to support the RBT2 EIS Apparently the purpose of these observations was to document spatial variability (in part for the Ecospace model) and temporal variability (measurements at one location over time) and not to derive confidence intervals around the observations35
The reliance on the pedigree approach to derive confidence intervals for this Roberts Bank model was criticized by DFO ECCC and NRCan in discussions with the Proponent As a result the Proponent reran the model with much larger confidence intervals ranging from 30 to 100 depending on the input parameter and functional group36 The results from this new analysis using the broader confidence intervals were similar to those using the original pedigree approach The Proponent noted that ldquoWhile the production within each helliprun was very different there was little difference in the biomass ratio [with and without the Project] These results further demonstrate that even with a greater range in input values the influence of the Project on the Roberts Bank ecosystem is consistent among allhellipmodel runsrdquo37 This provides confidence that the model may be robust to uncertainty in its input parameters Two concerns
30 PMV Response 2016-03-02 p 70 lines 1321-1322 31 PMV Response 2016-03-02 p 71-74 32 PMV Response 2016-03-02 p 71 lines 1339-1341 33 PMV Response 2016-03-02 p 73 34 EIS Appendix 10-C Section 251 page 18 35 PMV Response 2016-03-02 p 42 lines 772-777 36 PMV Response 2016-03-02 p 44-47 37 PMV Response 2016-03-02 p 47 lines 855-858 and see also PMV Response 2016-03-02 Appendix 27-B
Pacific Region Science Response Technical Review Assessing
Ecosystem Productivity Model of Roberts Bank
17
remain however The quote above indicates that the production among the different model runs was very different although with little difference in the biomass ratios with and without the Project Since biomass is not the same as production it would be informative for understanding model performance and potential impacts to show these production differences This also relates to the point made in Section 34 regarding how well the model represents the real ecosystem and not just within-model comparisons with and without the Project The second question is more technical and relates to how the randomization (Monte Carlo or MC) routine that was used to create multiple model runs used the uncertainty about the diet data Diets are not currently included in the MC routine available to regular users of the Ecosim model how they were handled in this RBT2 model appears not to be explained
Finally the sensitivity analyses indicate that the uncertainty in the input parameters does not lead to much difference between model parameters with or without the project However this conclusion does not describe how the uncertainty in the input parameters affects understanding of the ecosystem
40 Conclusions Overall the main conclusion of the Environmental Impact Statement from the Proponent is stated as ldquohellipafter the implementation of mitigation hellipthe Project is not expected to result in any significant adverse effects on any of the 16 valued componentsrdquo38 In addition ldquohellipapproximately 40 of the functional groups are forecast to change no more than 5 which hellip is judged to be within the uncertainty of the model runsrdquo39 although larger changes were forecast for orange sea pens freshwater biofilm green algae and raptors The conclusions from the modelling studies are that ldquohellipthe proposed project will have an impact on the study area that the effect varies between species and that the findings are robust to parameter uncertaintyrdquo40 Specific outcomes by valued component as derived from the EwE model are presented by functional groups in Table 1
38 PMV March 2015 Roberts Bank Environmental Impact Statement Executive Summary ndash Part 1 page 37 39 EIS Appendix 10-C p ii 40 EIS Appendix 10-D p iv
Pacific Region Science Response Technical Review Assessing
Ecosystem Productivity Model of Roberts Bank
18
Table 1 Changes in productive potential with the Project as derived from the EwE model
Changes in productive potential
Ecosystem category
Number of valued
components
Number with potential
biomass loss
Moderate decrease (31-60 decline)
Minor decrease (6-30 decline)
Negligible (0-5
change)
Minor increase (6-
30 increase)
Moderate increase (31-60 increase)
Source
Marine vegetation
7 7 - 3 2 2 - EIS Vol 3 Section 11 Table 11-17 page 11-65
Marine invertebrates
4 3 1 1 1 1 - EIS Vol 3 Section 12 Table 12-8 page 12-52
Marine fish 13 13 - 2 6 5 - EIS Vol 3 Section 13 Table 13-10 page 13-95
Coastal birds
11 8 - 3 4 3 1 EIS Vol 3 Section 15 Table 15-10 page 15-67
Pacific Region Science Response Technical Review Assessing
Ecosystem Productivity Model of Roberts Bank
19
Most functional groups showed some potential biomass loss with the Project with biomass loss defined as any model run with negative outcomes (ie in which biomass with the project was less than biomass without the Project) The summary of changes in productivity potential are mixed with most (33 out of 35) valued components showing minor decreases to minor increases (defined as 6 to 30 changes in productive potential with the Project compared to without the Project)
The main conclusions of this review in regards to the Terms of Reference are
1 Do the functional groups and abiotic variables used in the model adequately represent the ecosystem at Roberts Bank
o The 58 functional groups and abiotic variables used in the model adequately represent the main components of the Roberts Bank ecosystem however for longer lived species the life stages of the species are not well represented and some of the impacts of the Project may be expected to affect specific life stages
o The abiotic variables adequately represent the physical drivers of this ecosystem on an annual time scale However annual values for these abiotic variables may not adequately capture important sub-annual events such as storms (DFO 2016) the timing of arrival and departure of highly migratory species and whether there may be important sub-annual thresholds or mismatches in timing as a result of the Project
o Biotic factors (eg nutrients) which are particularly important for biofilm and other lower trophic level taxa are not included in this model The model is therefore unable to assess the potential development of eutrophication and benthic organic enrichment events which may affect fish habitats in the study area
2 Are the parameter estimates used by the model valid and defensible for this system
o In general parameter estimates appear to be adequate for this system Field studies were done in two years to provide data in particular on distributions of selected functional groups for the Ecospace module Note the distribution studies focussed on taxa which were relatively immobile and therefore lsquofixedrsquo in space
o the selection of some model parameters would benefit from further explanation for example the choice of fixed diet matrices versus dynamic matrices which can vary with changes in abundances or predators and prey
o the selection of some model parameters would benefit from further explanation for example the link between the diets described in the text of Appendix 10B and the quantities presented in Appendix A of Appendix 10B It is understood that proportions were derived using the ldquofixed selectivityrdquo principle but in order to be fully transparent the derivation of each diet should be provided in an appendix
o discussion and explanation is needed of why ecotrophic efficiencies differ from expected values (eg the ecotrophic efficiency for Pacific herring is listed as 038) and
o the abiotic factor lsquosubstratersquo was limited to ldquohardrdquo or rdquosoftrdquo options which can be restrictive given that they serve as endpoints on a substrate composition continuum These limited options may not provide the sensitivity required to assess substrate preference nor the flexibility for taxa (eg motile organisms) that span hard mixed and soft substrate types In addition it is not clear if changes in the hardsoft categories were considered over time within identified depositional or erosional settings before and after construction
Pacific Region Science Response Technical Review Assessing
Ecosystem Productivity Model of Roberts Bank
20
3 Are the limitations and uncertainties of the model identified and appropriately considered when determining the modelrsquos representation of current and possible future conditions
o the EwE model was not designed to evaluate a range of future conditions It was designed to estimate changes in the productive potential at the ecosystem level with and without the Project Therefore the model was run without the Project and with the Project for a range of plausible abiotic conditions and the results were compared with respect to biomass and productivity by functional group
o the pedigree approach to assessing the uncertainties of model outcomes is unsatisfactory for the purpose here as it relates solely to a qualitative judgment of the value of data based on its source However when the model was rerun with much wider ranges of confidence intervals (uncertainties) the results in general (but not necessarily for each functional group) were similar to the results using the original pedigree approach This suggests that taken overall the model may be robust to wide ranges of uncertainty in these input variables and parameters
o there is inadequate validation of the model This is inadequate for three reasons
(i) the basic Ecopath model is not validated and the Ecospace balancing process (the spin-up period) resulted in some biomass estimates being increased or decreased beyond their confidence limits
(ii) the goodness of fit test used to evaluate how well the model predicted the spatial occurrence functional groups is not fit for purpose (Section 34) and
(iii) validation was provided for only a small number of functional groups (the habitat-forming functional groups) As a consequence the model is currently not validated
o Considering the proportion of open boundaries relative to closed boundaries in the model processes taking place outside the modelled ecosystem are likely to contribute to dynamics within the modelled ecosystem However these external processes may not be well-resolved by the EwE model as currently configured
4 Are the model results related to the potential effects of the Project on fish and fish habitat and migratory birds and their food resources valid and defensible
o this is a very complex ecosystem model constructed for a relatively small and open (in the sense of considerable exchange with adjacent non-modelled areas) system Many assumptions have been made based on poor or missing data Taking all these considerations into account the model does the best job possible of comparing the biomass and productivity of the Roberts Bank ecosystem with and without the Project
o the extent to which the model adequately represents the lsquorealrsquo ecosystem of Roberts Bank as opposed to comparisons of model results with and without the Project is unclear as a number of basic diagnostics are not presented (see point 3 above)
o the EwE model is not capable of and is not designed to represent nutritional and food quality variations in prey functional groups and how these may impact highly migratory predators such as birds with and without the Project
5 Is the EwE model framework a valid method to quantify large scale impacts to fish habitat fish productivity and migratory bird productivity
o the EwE model as implemented in this project and reviewed here is a useful first-order framework to organise information and derive initial estimates of how the system may respond to perturbations
Pacific Region Science Response Technical Review Assessing
Ecosystem Productivity Model of Roberts Bank
21
o the utility of a EWE model for impact purposes is highly dependent on the quality of input data
o each EwE model is highly dependent on local conditions Although appropriate as an overall methodology each application would need to be reviewed for how it may be applied to any new ecosystem and
o the EwE model would need to be substantially reformulated if it was to include considerations of changes in chemical composition or food quality of prey in particular for seasonal migratory species such as birds which may depend on very large biomasses of prey with specific chemical composition to fuel their migrations beyond the ecosystem model boundaries
Contributors Contributor Affiliation Ian Perry Author DFO Science Pacific Region Alida Bundy Author DFO Science Maritimes Region Terri Sutherland Author DFO Science Pacific Region Robert Elner Author ECCC Canadian Wildlife Service Andrew Robinson Author ECCC Canadian Wildlife Service Lesley MacDougall Editor DFO Science Pacific Region
Approved by Carmel Lowe
Regional Director Science Branch Pacific Region Fisheries and Oceans Canada
November 4 2016
Sources of Information Christensen V Coll M Steenbeek J Buszowski J Chagaris D walters CJ 2014
Representing variable habitat quality in a spatial food web model Ecosystems 17 1397-1412
Christensen V and Walters C 2000 Ecopath with Ecosim methods capabilities and limitations Ecological Modelling 172 109-139
Colleacuteter M Valls A Guitton J Gascuel D Pauly D and Christensen V 2015 Global overview of the applications of the Ecopath with Ecosim modeling approach using the EcoBase models repository Ecological Modelling 302 pp42-53
Compass Resource Management Ltd 2013 Roberts Bank Terminal 2 Technical Advisory Group (TAG) Process Report Productive Capacity ndash Final Report 119pp (Accessed November 1 2016)
DFO 2016 Technical Review of Roberts Bank Terminal 2 Environmental Assessment Section 95 ndash Coastal Geomorphology DFO Can Sci Advis Sec Sci Resp 2016045 (Accessed November 4 2016)
Pacific Region Science Response Technical Review Assessing
Ecosystem Productivity Model of Roberts Bank
22
ESSA Technologies 2014a Roberts Bank Terminal 2 Project Roberts Bank Delta BC Environmental Impact Statement Volume 3 Biophysical Effects Assessments Appendix 10-C Roberts Bank Ecosystem Model Development and Key Run Port Metro Vancouver (Accessed November 1 2016)
ESSA Technologies 2014b Roberts Bank Terminal 2 Project Roberts Bank Delta BC Environmental Impact Statement Volume 3 Biophysical Effects Assessments Appendix 10-D Roberts Bank Ecosystem Model Sensitivity Analyses Port Metro Vancouver (Accessed November 1 2016)
Franklin J 2009 Mapping Species Distributions Spatial Inference and Prediction Cambridge University Press Cambridge
Hemmera 2014 Roberts Bank Terminal 2 Project Roberts Bank Delta BC Environmental Impact Statement Volume 3 Biophysical Effects Assessments Appendix 10-B Roberts Bank Ecosystem Model Parameter Estimates Port Metro Vancouver File 302-03503 (Accessed November 1 2016)
Port Metro Vancouver 2015a Roberts Bank Terminal 2 Project Roberts Bank Delta BC Environmental Impact Statement Volume 3 Biophysical Effects Assessments Section 100 Biophysical Setting (Accessed November 1 2016)
Port Metro Vancouver 2015b Roberts Bank Terminal 2 Project Roberts Bank Delta BC Environmental Impact Statement Volume 3 Biophysical Effects Assessments Section 103 Overview of Assessing Ecosystem Productivity (Accessed November 1 2016)
Port Metro Vancouver 2015c Roberts Bank Terminal 2 Project Environmental Assessment Additional Information Requirements (July 31 2015) Responses Response to Information Request 6 IR-73115-06 Canadian Environmental Assessment Agency Reference Number 80054 dated 26 October 2015
Steenbeek J Coll M Gurney L Meacutelin F Hoepffner N Buszowski J and Christensen V 2013 Bridging the gap between ecosystem modeling tools and geographic information systems Driving a food web model with external spatialndashtemporal data Ecological Modelling 263 139ndash 151
Sutherland T Elner R and OrsquoNeill J 2013 Roberts Bank Ecological crucible of the Fraser River estuary Progress in Oceanography 115 171ndash180
Vancouver Fraser Port Authority 2016 From the Vancouver Fraser Port Authority to the Review Panel re Answers to preliminary technical questions submitted during the completeness phase from Fisheries and Oceans Canada Natural Resources Canada and Environment and Climate Change Canada concerning the ecosystem modelling to support the Roberts Bank Terminal 2 Project environmental review CEAR Document 547 (Accessed November 1 2016)
Pacific Region Science Response Technical Review Assessing
Ecosystem Productivity Model of Roberts Bank
23
This Report is Available from the Centre for Science Advice
Pacific Region Fisheries and Oceans Canada
3190 Hammond Bay Road Nanaimo BC V9T 6N7
Telephone (250) 756-7208 E-Mail csapdfo-mpogcca
Internet address wwwdfo-mpogccacsas-sccs
ISSN 1919-3769 copy Her Majesty the Queen in Right of Canada 2016
Correct Citation for this Publication
DFO 2016 Technical review of Roberts Bank Terminal 2 environmental assessment section 103 ndash assessing ecosystem productivity DFO Can Sci Advis Sec Sci Resp 2016050
Aussi disponible en franccedilais
MPO 2016 Examen technique de leacutevaluation environnementale du Terminal 2 agrave Roberts Bank section 103 ndash eacutevaluation de la productiviteacute de leacutecosystegraveme Secr can de consult sci du MPO Reacutep des Sci 2016050

Pacific Region Science Response Technical Review Assessing
Ecosystem Productivity Model of Roberts Bank
7
30 Analysis and Response To prepare this response the following sections of the EIS additional documents were reviewed
DocumentSection Title
EIS Section 10
Including appendices 10B 10C and 10D
(Port Metro Vancouver 2015a Hemmera 2014 ESSA Technologies 2014a ESSA Technologies 2014b)
Biophysical Setting
Appendix 10-B Roberts Bank Ecosystem Model Parameter Estimates Port Metro Vancouver File 302-03503
Appendix 10-C Roberts Bank Ecosystem Model Development and Key Run Port Metro Vancouver
Appendix 10-D Roberts Bank Ecosystem Model Sensitivity Analyses Port Metro Vancouver
CEAR document 547 (Including Appendices) ldquoPMV Response 2016-03-02rdquo and ldquoPMV Response 2016-05-30rdquo
(Vancouver Fraser Port Authority 2016)
Vancouver Fraser Port Authority to the Review Panel re Answers to preliminary technical questions submitted during the completeness phase from Fisheries and Oceans Canada Natural Resources Canada and Environment and Climate Change Canada concerning the ecosystem modelling to support the Roberts Bank Terminal 2 Project environmental review
31 The EwE Team Building this ecosystem model was a complex undertaking which required knowledge of the ecosystem to be modelled how to set initial parameter values determination of reasonable ranges of these parameters how to balance the model and how to recognize when the model outputs were unrealistic These tasks became even more complex when spatial model dynamics were involved such as with Ecospace The team engaged by the Proponent to conduct this ecosystem modelling for the Roberts Bank Terminal 2 (RBT2) EIS was led by scientists at the Institute for Oceans and Fisheries located at the University of British Columbia in Vancouver These scientists are global leaders of the EwE model framework having developed much of its current implementation and who continue to lead its elaborations and extensions Construction and running of the model for this specific ecosystem was done in collaboration with ESSA Technologies of Vancouver Parameter values for the ecosystem model were obtained in part from observational studies conducted in the area by Hemmera of Burnaby BC
32 Overview of assessment results of hydrological and sediment modelling Implementation of the ldquowith the Projectrdquo simulations of the ecosystem model was done by driving the model with the abiotic variables as they were projected to be distributed with the Project footprint In the context of this EIS specifying depth salinity bottom currents wave height and sediment type conditions without the Project and changes with the Project were achieved by construction of hydrodynamical and sediment transport models The outputs from these models in combination with the identified environment preferences for the various biological groups were then used as inputs to the Ecospace model to define the spatial
Pacific Region Science Response Technical Review Assessing
Ecosystem Productivity Model of Roberts Bank
8
distributions of these functional groups The implementation of these hydrological and sediment transport models in this EIS was reviewed by DFO and NRCan (DFO 2016) This review concluded that the implementation of these models for this EIS was adequate for average winter conditions but lacking in validation for summer conditions in particular with strong freshwater flows from the Fraser River Simulations of strong storm events and their impacts on wave conditions and sediment transport were also lacking The effect of wave action and current speeds on sediment transport is non-linear such that increasing winds over short periods of time can impact sediment transport processes bottom topography and water depths beyond that determined under average model conditions Overall the review concluded that a greater range of sensitivity analyses is required to have confidence in the model outputs under lsquonon-averagersquo conditions The implication of this conclusion for the present review of the EwE model is that the full range of variability of abiotic characteristics such as bottom topography bottom current and wave heights and how they may affect relevant functional groups in the model with the Project may not be adequately represented Sensitivity analyses were provided by varying the intensity of abiotic variables and by removing abiotic variables to assess their interactive effects In general the ecosystem model outputs were robust to these sensitivity analyses with most groups varying by less than 5 Larger changes however were observed for primary producer and bird groupings and for some fish groups when various abiotic variables were omitted2
33 Model implementation 331 The purpose of the EwE model
The EwE model was intended to provide one line of evidence to assess the potential impacts of the Project on the Roberts Bank ecosystem which would then be used with other lines of evidence to make the final assessment Specifically ldquohellip the objective of the RB [Roberts Bank] model was not to provide an assessment of Project impacts for each functional group at a fine temporal scale but to estimate changes in productive potential with and without the Project at the ecosystem levelrdquo3 In addition ldquohellipthe primary objective of the RB ecosystem model is to evaluate potential changes in productivity from such abiotic factors with and without the terminal and causewayrdquo4 Results are presented for the selected functional groups no results were presented on potential changes in ecosystem structure or function
332 Applicability of the EwE model framework to the Roberts Bank region EwE models work best when the exchanges within the system being modelled are greater than the exchanges between the modelled system and the lsquooutsidersquo world In practice this means that EwE models work best for larger systems with few external exchanges In a meta-analysis of 433 Ecopath models Colleacuteter et al (2015) concluded that ldquohellipin the last two decades the range of the models area has expanded toward very large areas and the median has shifted accordingly from about 1000 km2 in 1984ndash1993 to about 100000 km2 in 1994ndash2014rdquo The section of the Roberts Bank ecosystem that is included in the EwE model was comparatively small (5468 km2) and complex It is an intertidally-dominated environment that is subject to strong seasonal influences of both freshwater and marine exchanges across relatively large seaward and shoreward boundaries
2 EIS Appendix 10-D p ii - iii 3 PMV Response 2016-03-02 p 99 lines 1914-1917 4 PMV Response 2016-03-02 p 38 lines 689-691
Pacific Region Science Response Technical Review Assessing
Ecosystem Productivity Model of Roberts Bank
9
Processes taking place outside the modelled ecosystem will contribute to dynamics within the modelled ecosystem (eg lsquooutsidersquo food supporting predators which occur in the Roberts Bank ecosystem for only part of the year predators which may feed in the Roberts Bank ecosystem but export this energy when they migrate out of the region) but which may not be well-resolved by the EwE model The Proponent justifies the spatial scale because it was specifically chosen for the questions being asked in regard to assessing productivity changes and because the relative influences of external exchanges are assumed to be identical with and without the project In addition highly mobile species with broad prey bases were assumed in the model to be partially sustained by external energy from outside the model system5 The distributions of organisms may differ however with and without the project which may affect their interactions with areas outside of the modelled system and the use of diets from outside the modelled system may not reflect the impacts of the project Further clarification of how the EwE model captures the exchanges and interactions with adjacent ecosystems are needed For example it could be argued that an ecosystem which is open to frequent exchanges of water and organic matter from beyond its boundaries might be more robust to local disturbances such as the Project
There are some inconsistencies in the information and assumptions used for some of the taxa in this ecosystem model For Dungeness Crab the justification for estimating total adult biomass (including females) from the biomass of fished males is unclear In addition it is unclear if the slower growth of female crabs once they have reached sexual maturity in comparison with male crabs has been considered The diet matrix for spiny dogfish does not represent the actual diet well in particular of euphausiids herring and shrimp and there are more recent references for biomass estimates of spiny dogfish in the study area than what was used in the EIS
Fishing mortality was not included in the model under the assumption that this would not change with or without the project While this assumption may be true the model has been parameterized by ignoring a source of mortality that will influence total production In essence fishing removes biomass from the ecosystem with the result that less biomass will be available for higher trophic levels How this may impact the ecosystem with and without the Project is unclear but it could make noticeable differences if for example there were thresholds in the feeding responses by these higher trophic level species The Ecopath model that was used is relatively unconstrained since many ecological efficiencies are low even for forage species which would be expected to be higher It is not clear how many species are exploited or the levels of exploitation but even if this does not change with the Project these mortality rates should be included in the model in order to add realistic constraints to the exploited functional groups
333 Model documentation Based on questions from DFO ECCC and NRCan following their initial review of the EIS the Proponent provided written responses dated 2 March 2016 to clarify several of the steps in the model development and implementation However several questions remain including questions about the Ecospace module Ecospace has undergone several recent developments such as the inclusion of the spatial-temporal data layer framework (Steenbeek et al 2013) the habitat capacity model (Christensen et al 2014) and the Monte Carlo analysis including the diet matrix As yet there are few published studies using these latest Ecospace developments and their documentation and justification need to be improved in the EIS
5 PMV Response 2016-03-02 p 29 lines 446 - 464
Pacific Region Science Response Technical Review Assessing
Ecosystem Productivity Model of Roberts Bank
10
Questions also remain regarding how the Monte Carlo randomization routine treated diet data The report indicates that the Monte Carlo routine randomly selected input parameters from the input ranges and that only models that were balanced were used This suggests that a high proportion of models were not balanced and therefore were not used (for example the EIS indicates that about one out of 1000 sampled input parameters was balanced6) A table showing the minimum maximum mode average and median values from the Monte Carlo runs for all the parameters would enable an evaluation of how much variation was actually sampled by the balanced model runs This is recommended in the EwE user information ie ldquoUsers should check the range of the input parameters that were actually used in the trials in the output csv file (see below)rdquo7
In addition there are several issues with the documentation of the derivation of the parameters for the functional groups Such documentation should clearly outline how the input parameter was estimated and the range of uncertainty for that parameter For example the input biomass of pinnipeds was defined as 04 t km 2 derived from estimates of 034 for Harbour seals and two estimates for Steller sea lions (012 and 014 t km 2) No explanation was provided for how the overall estimated pinniped biomass of 04 t km 2 was determined The diet of Sand Lance was described in the EIS as consisting mostly of zooplankton8 whereas the diet table for the model runs9 included 20 macrofauna 10 green algae and 10 detritus It is unclear why these additional prey were included in the diet used for the model runs
334 Highly mobile functional groups This implementation of the EwE framework included transient and migratory functional groups This is entirely appropriate and these groups cannot be excluded The approach taken in the Ecospace module was to impose a low (and conservative) dispersal rate among model spatial units (lsquopixelsrsquo) of 1 km yr-1 This may be appropriate for low mobility benthic organisms but it likely underestimates the movements of many other functional groups The effects of using higher and perhaps functional-group-specific dispersal rates was not considered The Proponents argued that higher dispersal rates would reduce impacts since species can move away from less desirable areas more quickly for completeness these runs should be done and evaluated Mobile species will also bring energy (food) captured outside the system into the modelled ecosystem This process was included in the model with the use of a diet import factor reflecting the consumption of prey outside the modelled region with the assumption that groups with high import rates were unlikely to respond to local changes on Roberts Bank10 This assumption needs justification perhaps at the functional group level for example many species of highly migratory birds and Pacific salmon use the Roberts Bank ecosystem to obtain food to continue their migrations Although this food does not compose a large fraction of their annual consumption it can be critical to enable them to continue their migrations
The EwE model is not designed to capture differences in prey quality ie differences in essential fatty acid or nutrient ratios The same species of prey may have greater or lesser nutritional value to predators depending on the conditions under which they are growing and their seasonal variations This is a particular concern with the nutritional quality of the diatom-dominated biofilm Diatomaceous biofilm is important to the highly migratory Western Sandpiper (Calidris mauri) Despite its predictive merits in relation to other ecosystem
6 EIS Appendix 10D Section 24 p5 7 EwE Help file p 151 8 EIS Appendix 10B Section 4133 p 76 9 EIS Appendix A of Appendix 10B 10 PMV Response 2016-03-02 p 28 lines 429 - 436
Pacific Region Science Response Technical Review Assessing
Ecosystem Productivity Model of Roberts Bank
11
components the EwE model is not informative with respect to understanding the potential impacts of the Project on biofilm and the Western Sandpiper While this example is specific to seabirds the potential exists for differences in the quality of biofilm to also be an issue for copepods which feed on biofilm and consequently to juvenile salmon which feed on these copepods (eg Sutherland et al 2013)
The EwE model is also not designed to predict effects of the Project on water quality although the Proponent noted that ldquoOther abiotic factors not included were deemed to be representative of variables that were already included in the modelhelliprdquo11 The Project may cause changes in physical and water quality conditions whether in isolation or in combination which may impact the productivity or nutritional quality of key prey organisms for local and migratory species which will not be captured by the model The EwE model does not assess the production of key nutrients or the implications of changes in important physical and water quality parameters to biofilm community structure and hence to important migratory birds
The model does not include biotic factors for both pelagic and benthic environments to assess the potential development of eutrophication and benthic organic enrichment events respectively Organic and redox indicators traditional measures of environmental assessments that are used to determine changes in functional group responses were included in the recent Deltaport Third environmental assessment (ie Pelagic chlorophyll dissolved nutrients Benthic sediment carbonnitrogen content redox state [sulfide concentration]) Benthic anoxic events based on organic enrichment are known to be strong drivers of community composition and exclusion regardless of substrate type In the absence of biotic factors (eg organic particulates) the model has not considered the potential for benthic organic enrichment which coincides with siltation processes within the upper tidal flats The tidal flat corner bordered by the Delta-dyke and Deltaport causeway has served as a catchment area for Fraser River silt since the development of the original Deltaport causeway (Sutherland et al 2013) The proposed position of the new terminal placed at the seaward termination of the Deltaport causeway may produce a crescent-shaped feature in the wake of the Fraser River Plume This feature may provide a more efficient silt trap that will promote benthic organic enrichment This piece of the environmental assessment seems to be missing and is important for assessing fish habitat in this area
335 Seasonality (model time step) Input data to parameterize the model were available on a range of time scales from hourly (eg physical data on salinity and water flow) to annual (eg species biomass) The Proponents indicated12 that this is a strength of the EwE model although ultimately the model was run with an annual time step with all sub-annual values being averaged to annual values This method therefore did not incorporate important seasonal processes such as winter-summer differences in salinity and storm properties and the seasonal appearances of abundances of predators and prey such as migratory salmon and birds that are much larger than the annual average For example juvenile salmon migrate from the Fraser River and onto Roberts Bank in the spring before moving into deeper waters If these spring abundances are averaged over the entire year these average abundances would be 5-10 times lower than the actual abundances during the spring (ie averaging the biomass that occurs in two months over a 12 month period) Additionally this method did not capture the intensity of processes such as growth and predation which can be focused over periods of a few weeks to a few months There may be important threshold effects at particular times and places which may be missed when using an 11 EIS Section 10 p 10-11 12 PMV Response 2016-03-02 p 86 line 1655
Pacific Region Science Response Technical Review Assessing
Ecosystem Productivity Model of Roberts Bank
12
annual time step for the model The Ecospace module has a monthly time step13 and therefore it is feasible to run this module with a sub-annual time step For example the Proponents submit14 that there are inadequate data to model the potential effects of the Project on the timing of biofilm production which could have implications for the migratory dunlin and Western Sandpiper However this could be modelled in an exploratory way to determine hypotheses about which factors could affect the timing of production of biofilm and the potential impacts on these birds These issues are of major concern to ECCC
336 Life history structure The EwE model did not separate functional groups into life history stages (stanzas) yet for many functional groups the juvenile stages can have very different life history characteristics and habitats than the adults It is unclear in the description of the model how different life history structures were considered and whether for example there were enough juveniles to produce the adults The implications of not including early life stages should be explored at least qualitatively to identify which species might have life stages that may be more vulnerable to project effects
337 Model balancing Balancing an EwE model is the process by which parameters are adjusted so that there is sufficient production for consumption requirements ie there are sufficient prey for all predators Expert opinion was used to examine parameter values and to adjust for errors or inconsistencies in logic ldquoPMV is confident that since the approach taken to balance the model was based on best practices the steps are appropriaterdquo15 Adjustments to initial parameters to ensure an ecologically-feasible model are necessary and to be expected For a few functional groups however very large changes to initial parameter estimates (which were often not based on Roberts Bank specific data) were necessary for example to transient killer whales When such initial parameters were adjusted (often by substantial amounts) by expert opinion to balance the model the confidence intervals around these adjusted parameter values were not increased to reflect this added uncertainty (see for example PMV Response 2016-03-02 p 51 lines 955-956) When expert opinion was used to make very large changes to initial parameter values broader confidence intervals about these parameters should have been applied This does not appear to have been the case and as a consequence may cause the actual uncertainty of the model outputs to be underestimated
Another example is for the pinniped group in which 50 of the diet was assumed to come from outside the model area in order to balance the model The rationale provided was ldquoThe pinnipeds caused excessive predation mortalities on numerous fish functional groups The biomass of pinnipeds was an average for the Strait of Georgia which was likely too high for Roberts Bank Therefore it was assumed that pinnipeds extracted only half of their diet from the study areardquo16 It is unclear whether the sensitivity of the model to different percentages of diet allocation was explored
As noted above (332) the Ecopath model was relatively unconstrained and few adjustments to input parameters were required to balance the model This is unusual and the low ecotrophic efficiencies of several functional groups suggest that full accounting of energy flows may not have been achieved (an ecotrophic efficiency of 1 indicates that 100 of the production of that
13 EIS Appendix 10C Section 29 p24 14 EIS Appendix 10D Appendix C p72 15 PMV Response 2016-03-02 p 49 lines 910-912 16 EIS Appendix 10C Section 261 p 20
Pacific Region Science Response Technical Review Assessing
Ecosystem Productivity Model of Roberts Bank
13
particular group is being preyed upon or removed by fishing leaving no individuals to die of old age17) An ldquoexcessrdquo of individuals dying of old age ie ecotrophic efficiencies much less than 1 suggests a potentially large biomass that is not used by the ecosystem and instead is converted to detritus
34 Model validation Model validation is the process by which the model parameters variables and outputs are compared with those from the real ecosystem to ascertain how well the model represents the ecosystem It is an essential step in providing confidence that the projections from the model in this case with and without the Project have relevance to how the real ecosystem may be expected to function with and without the Project In practice validating complex ecosystem models is difficult considering the range of assumptions that must be made when building the model the limited available data and natural variability of the ecosystem at a variety of time and space scales
Many of the standard diagnostics for the Ecopath model have not been evaluated in the EIS The Proponent appears to have assumed that once the Ecopath model was balanced then it was valid and fit for purpose The Proponent should provide all the Ecopath estimates of vital rates including mortality rates As presented questions remain For example many Ecotrophic Efficiencies (which control the transfer of biomass from prey to predators) are less than 1 even for taxa which would be expected to be close to 1 such as carnivorous zooplankton The reason for Ecotrophic Efficiencies less than 1 were not discussed or explained in the EIS
Detailed diagnostics for the Ecospace model should also be presented in order to evaluate model performance In response to criticisms by DFO ECCC and NRCan in discussions with the Proponent the latter provided the biomass of the functional groups from the Ecopath model (before Ecospace) and the Ecospace model after the spin-up period (which involved adjusting the parameters from the Ecopath model to balance the 5468 separate cells of the Ecospace model)18 The Proponents argue that ldquoIt is important to note that changes in biomass values generated during the spin-up period are identical for both with and without Project scenarios and thus do not provide information on the potential Project-related effects on productivity19 However several changes to biomass result from the Ecospace balancing process (spin-up period) This is only given brief attention by the Proponent in its response to the DFO ECCC and NRCan questions An analysis of Table 620 revealed that the biomass of 9 functional groups was larger or smaller than the widest confidence limits allowed for each group21 This requires further discussion and justification
The Proponent used a goodness of fit measure to compare spatial distributions of model outputs with field observations They indicated that ldquono other EwE models were identified which use a goodness-of-fit measure Hence the RB model is potentially the first such EwE model where a goodness of fit measure has been appliedrdquo22 The chosen goodness of fit measure is the percent correct classification (PCC) method23 This method derives a test statistic based on the proportion of locations at which predicted occurrences from the model match observed
17 EIS Appendix 10-B p 11 18 PMV Response 2016-03-02 p 65-66 Table 6 19 PMV Response 2016-03-02 p 64 lines 1205-1207 20 PMV Response 2016-03-02 p 65-66 Table 6 21 PMV Response 2016-03-02 p 45 Table 3 22 PMV Response 2016-03-02 p 78 lines 1481-1483 23 PMV Response 2016-03-02 p 78 lines 1483-1484
Pacific Region Science Response Technical Review Assessing
Ecosystem Productivity Model of Roberts Bank
14
occurrences from data and similarly with predicted and observed absences The Proponent then calculated two additional accuracy of fit measures sensitivity (the model predicts a species to occur in an area where it is known to occur in reality) and specificity (the model predicts a species does not occur in an area it is known not to occur in reality)24 This analysis concluded that the model has high predictability for functional groups such as eelgrass and sea pens with relatively static distributions but lower predictability for functional groups which are more temporally and spatially dynamic such as biofilm and green algae25
There are two problems with this approach The first is that this goodness of fit comparison was done only for habitat-forming functional groups no discussion of how well this analysis applies to mobile functional groups was provided The second problem is that this method does not take into account situations (such as occurs in this study with several groups) in which species occur at only a few locations For example ldquohellipif the test data consist of 95 absences and 5 presences and this reflects the true prevalence of the species on the landscape (a realistic scenario for a rare species) a lsquonullrsquo model that predicted absence in all cases (eg no model at all) would be correct 95 of the timehellipldquo (Franklin 2009 p 151) This latter point is important here as these habitat functional groups (biofilm brown algae native eelgrass green algae Japanese eelgrass tidal marsh biomat and orange sea pens26) appear not to occur over most of the Project area (as portrayed by the model outputs presented in the distribution figures of PMV Response 2016-03-02 Appendix 218) It is therefore important that a robust evaluation of the performance of the Ecospace module is used with preferably more than one measure
In summary the starting point for this modelling analysis matters It is not just about a comparison between results with and without the Project The model has to be considered a sufficient representation of the ecosystem The Proponent has not yet sufficiently validated the model
35 Model results 351 Presentation of model results
As noted above (Section 331) the stated objective of the Roberts Bank ecosystem model was not to provide an assessment of Project impacts for each functional group at a fine temporal scale but to estimate changes in productive potential with and without the Project at the ecosystem level27 However results were presented as comparisons by speciesfunctional group with and without the Project and not as potential changes in total ecosystem productivity The revised figures for each functional group showing distributions without the Project with the Project and their difference indicated impacts were likely to be localized with overall impacts relatively small The range of biomass ratios with and without the Project was 045 ndash 189 with most values slightly less than 1 This is interpreted as indicating slight decreases in the capacity of the study area to support biomass and production with the Project for many functional groups28 (Figure 2)
24 PMV Response 2016-03-02 p 80 lines 1524-1527 25 PMV Response 2016-03-02 p 81 lines 1551-1559 26 PMV Response 2016-03-02 p 82 Table 8 27 PMV Response 2016-03-02 p 99 lines 1914-1917 28 PMV Response 2016-03-02 Appendix 218
Pacific Region Science Response Technical Review Assessing
Ecosystem Productivity Model of Roberts Bank
15
Biomass Ratio
Freq
uenc
y
04 07 10 13 16 19
05
1015
2025
30
Figure 2 Histogram of biomass ratios obtained by comparisons of model runs with and without the project (ie With Without) Values less than 1 indicate reductions in biomass with the Project compared against without the Project) Data from Appendix 218 of PMV Response 2016-03-02
352 Sensitivity and vulnerability analyses Every ecosystem model is only one possible representation of the true ecosystem defined by the modelrsquos structure and the values chosen for its many parameters The key point is how well the model represents the real system how that fit can be measured and the sensitivity of model outputs to variability in the selected parameter values The ideal model should be robust to a wide range of uncertainties in the input data and parameters This robustness is determined by performing sensitivity analyses on the model to see how it responds to variations in the input parameters and determining to which input parameters the model is most sensitive
The vulnerability parameters determine the strength of the feeding interactions between functional groups They set the level of density dependence of each functional group Higher vulnerability settings provide greater top-down (predator) control whereas lower settings provide greater bottom-up (environmental) control29 Several publications have shown that EwE models are very sensitive to the vulnerability parameters and Christensen and Walters (2000) point out that a main pitfall of EwE is that ldquopredation vulnerabilities are often underestimated lessening the modelled impacts of predationrdquo It is usual practice to tune Ecopath models including the vulnerability parameters to time series data such as biomass using the temporal simulation model Ecosim However these data were not available for the RBT2 area so this robust method of fitting the model and estimating vulnerability parameters was not possible Instead a vulnerability setting of 2 was used as the default value for the key model runs which is ldquocommon practice when time series data are not available and estimates of vulnerability in the
29 PMV Response 2016-03-02 p 70 lines 1318-1323
Pacific Region Science Response Technical Review Assessing
Ecosystem Productivity Model of Roberts Bank
16
model cannot be maderdquo30 with sensitivity analyses run for a range of 15 to 3 This narrow range was criticized by DFOECCC in initial discussions about the model with the Proponent The Proponent subsequently reran the model with a larger range of vulnerabilities31 (11 to 10) and concluded this broader vulnerability range produced similar results for the productivity ratio with and without the Project to those in the original EIS and that the EIS was more likely to overestimate than underestimate potential project effects32 The data in Table 7 of the PMV Response33 did indicate changes in productivity ratios ranging from 0 to 50 of the defined key run (which used a vulnerability setting of 2) However the Proponent changed all vulnerability settings to the same value ie all were 2 or all were 10 etc In reality the vulnerability parameters resulting from Ecosim models that are fitted to data as described above vary by functional group which was not explored here Therefore although the results suggest that the original choice of 2 for the default key run seemed reasonable the potential effects of variability in vulnerability settings was not fully explored
Sensitivity analyses are usually based on the range of uncertainty estimated for input data and parameters often called the confidence limits around the model parameters The EwE framework integrates many different data sources and parameters including values from the literature It can therefore be difficult to identify ldquoreasonablerdquo confidence limits when derived from such diverse data sources Standard practice in Ecopath models has been to develop a pedigree for each parameter with default values for uncertainty based on the nature of the source data For example parameter values based on high precision field observations of biomass within the model domain receive default confidence intervals of 10 whereas parameter values based on models developed for elsewhere or professional judgment receive confidence intervals of 8034 Sensitivity analyses are then run using parameter values selected from within these confidence intervals However if these default confidence intervals do not capture the full range of variability then the outputs are not informative of the variability in the lsquorealrsquo ecosystem Field observations were collected for many functional groups within the model domain in 2012 and 2013 as part of studies to support the RBT2 EIS Apparently the purpose of these observations was to document spatial variability (in part for the Ecospace model) and temporal variability (measurements at one location over time) and not to derive confidence intervals around the observations35
The reliance on the pedigree approach to derive confidence intervals for this Roberts Bank model was criticized by DFO ECCC and NRCan in discussions with the Proponent As a result the Proponent reran the model with much larger confidence intervals ranging from 30 to 100 depending on the input parameter and functional group36 The results from this new analysis using the broader confidence intervals were similar to those using the original pedigree approach The Proponent noted that ldquoWhile the production within each helliprun was very different there was little difference in the biomass ratio [with and without the Project] These results further demonstrate that even with a greater range in input values the influence of the Project on the Roberts Bank ecosystem is consistent among allhellipmodel runsrdquo37 This provides confidence that the model may be robust to uncertainty in its input parameters Two concerns
30 PMV Response 2016-03-02 p 70 lines 1321-1322 31 PMV Response 2016-03-02 p 71-74 32 PMV Response 2016-03-02 p 71 lines 1339-1341 33 PMV Response 2016-03-02 p 73 34 EIS Appendix 10-C Section 251 page 18 35 PMV Response 2016-03-02 p 42 lines 772-777 36 PMV Response 2016-03-02 p 44-47 37 PMV Response 2016-03-02 p 47 lines 855-858 and see also PMV Response 2016-03-02 Appendix 27-B
Pacific Region Science Response Technical Review Assessing
Ecosystem Productivity Model of Roberts Bank
17
remain however The quote above indicates that the production among the different model runs was very different although with little difference in the biomass ratios with and without the Project Since biomass is not the same as production it would be informative for understanding model performance and potential impacts to show these production differences This also relates to the point made in Section 34 regarding how well the model represents the real ecosystem and not just within-model comparisons with and without the Project The second question is more technical and relates to how the randomization (Monte Carlo or MC) routine that was used to create multiple model runs used the uncertainty about the diet data Diets are not currently included in the MC routine available to regular users of the Ecosim model how they were handled in this RBT2 model appears not to be explained
Finally the sensitivity analyses indicate that the uncertainty in the input parameters does not lead to much difference between model parameters with or without the project However this conclusion does not describe how the uncertainty in the input parameters affects understanding of the ecosystem
40 Conclusions Overall the main conclusion of the Environmental Impact Statement from the Proponent is stated as ldquohellipafter the implementation of mitigation hellipthe Project is not expected to result in any significant adverse effects on any of the 16 valued componentsrdquo38 In addition ldquohellipapproximately 40 of the functional groups are forecast to change no more than 5 which hellip is judged to be within the uncertainty of the model runsrdquo39 although larger changes were forecast for orange sea pens freshwater biofilm green algae and raptors The conclusions from the modelling studies are that ldquohellipthe proposed project will have an impact on the study area that the effect varies between species and that the findings are robust to parameter uncertaintyrdquo40 Specific outcomes by valued component as derived from the EwE model are presented by functional groups in Table 1
38 PMV March 2015 Roberts Bank Environmental Impact Statement Executive Summary ndash Part 1 page 37 39 EIS Appendix 10-C p ii 40 EIS Appendix 10-D p iv
Pacific Region Science Response Technical Review Assessing
Ecosystem Productivity Model of Roberts Bank
18
Table 1 Changes in productive potential with the Project as derived from the EwE model
Changes in productive potential
Ecosystem category
Number of valued
components
Number with potential
biomass loss
Moderate decrease (31-60 decline)
Minor decrease (6-30 decline)
Negligible (0-5
change)
Minor increase (6-
30 increase)
Moderate increase (31-60 increase)
Source
Marine vegetation
7 7 - 3 2 2 - EIS Vol 3 Section 11 Table 11-17 page 11-65
Marine invertebrates
4 3 1 1 1 1 - EIS Vol 3 Section 12 Table 12-8 page 12-52
Marine fish 13 13 - 2 6 5 - EIS Vol 3 Section 13 Table 13-10 page 13-95
Coastal birds
11 8 - 3 4 3 1 EIS Vol 3 Section 15 Table 15-10 page 15-67
Pacific Region Science Response Technical Review Assessing
Ecosystem Productivity Model of Roberts Bank
19
Most functional groups showed some potential biomass loss with the Project with biomass loss defined as any model run with negative outcomes (ie in which biomass with the project was less than biomass without the Project) The summary of changes in productivity potential are mixed with most (33 out of 35) valued components showing minor decreases to minor increases (defined as 6 to 30 changes in productive potential with the Project compared to without the Project)
The main conclusions of this review in regards to the Terms of Reference are
1 Do the functional groups and abiotic variables used in the model adequately represent the ecosystem at Roberts Bank
o The 58 functional groups and abiotic variables used in the model adequately represent the main components of the Roberts Bank ecosystem however for longer lived species the life stages of the species are not well represented and some of the impacts of the Project may be expected to affect specific life stages
o The abiotic variables adequately represent the physical drivers of this ecosystem on an annual time scale However annual values for these abiotic variables may not adequately capture important sub-annual events such as storms (DFO 2016) the timing of arrival and departure of highly migratory species and whether there may be important sub-annual thresholds or mismatches in timing as a result of the Project
o Biotic factors (eg nutrients) which are particularly important for biofilm and other lower trophic level taxa are not included in this model The model is therefore unable to assess the potential development of eutrophication and benthic organic enrichment events which may affect fish habitats in the study area
2 Are the parameter estimates used by the model valid and defensible for this system
o In general parameter estimates appear to be adequate for this system Field studies were done in two years to provide data in particular on distributions of selected functional groups for the Ecospace module Note the distribution studies focussed on taxa which were relatively immobile and therefore lsquofixedrsquo in space
o the selection of some model parameters would benefit from further explanation for example the choice of fixed diet matrices versus dynamic matrices which can vary with changes in abundances or predators and prey
o the selection of some model parameters would benefit from further explanation for example the link between the diets described in the text of Appendix 10B and the quantities presented in Appendix A of Appendix 10B It is understood that proportions were derived using the ldquofixed selectivityrdquo principle but in order to be fully transparent the derivation of each diet should be provided in an appendix
o discussion and explanation is needed of why ecotrophic efficiencies differ from expected values (eg the ecotrophic efficiency for Pacific herring is listed as 038) and
o the abiotic factor lsquosubstratersquo was limited to ldquohardrdquo or rdquosoftrdquo options which can be restrictive given that they serve as endpoints on a substrate composition continuum These limited options may not provide the sensitivity required to assess substrate preference nor the flexibility for taxa (eg motile organisms) that span hard mixed and soft substrate types In addition it is not clear if changes in the hardsoft categories were considered over time within identified depositional or erosional settings before and after construction
Pacific Region Science Response Technical Review Assessing
Ecosystem Productivity Model of Roberts Bank
20
3 Are the limitations and uncertainties of the model identified and appropriately considered when determining the modelrsquos representation of current and possible future conditions
o the EwE model was not designed to evaluate a range of future conditions It was designed to estimate changes in the productive potential at the ecosystem level with and without the Project Therefore the model was run without the Project and with the Project for a range of plausible abiotic conditions and the results were compared with respect to biomass and productivity by functional group
o the pedigree approach to assessing the uncertainties of model outcomes is unsatisfactory for the purpose here as it relates solely to a qualitative judgment of the value of data based on its source However when the model was rerun with much wider ranges of confidence intervals (uncertainties) the results in general (but not necessarily for each functional group) were similar to the results using the original pedigree approach This suggests that taken overall the model may be robust to wide ranges of uncertainty in these input variables and parameters
o there is inadequate validation of the model This is inadequate for three reasons
(i) the basic Ecopath model is not validated and the Ecospace balancing process (the spin-up period) resulted in some biomass estimates being increased or decreased beyond their confidence limits
(ii) the goodness of fit test used to evaluate how well the model predicted the spatial occurrence functional groups is not fit for purpose (Section 34) and
(iii) validation was provided for only a small number of functional groups (the habitat-forming functional groups) As a consequence the model is currently not validated
o Considering the proportion of open boundaries relative to closed boundaries in the model processes taking place outside the modelled ecosystem are likely to contribute to dynamics within the modelled ecosystem However these external processes may not be well-resolved by the EwE model as currently configured
4 Are the model results related to the potential effects of the Project on fish and fish habitat and migratory birds and their food resources valid and defensible
o this is a very complex ecosystem model constructed for a relatively small and open (in the sense of considerable exchange with adjacent non-modelled areas) system Many assumptions have been made based on poor or missing data Taking all these considerations into account the model does the best job possible of comparing the biomass and productivity of the Roberts Bank ecosystem with and without the Project
o the extent to which the model adequately represents the lsquorealrsquo ecosystem of Roberts Bank as opposed to comparisons of model results with and without the Project is unclear as a number of basic diagnostics are not presented (see point 3 above)
o the EwE model is not capable of and is not designed to represent nutritional and food quality variations in prey functional groups and how these may impact highly migratory predators such as birds with and without the Project
5 Is the EwE model framework a valid method to quantify large scale impacts to fish habitat fish productivity and migratory bird productivity
o the EwE model as implemented in this project and reviewed here is a useful first-order framework to organise information and derive initial estimates of how the system may respond to perturbations
Pacific Region Science Response Technical Review Assessing
Ecosystem Productivity Model of Roberts Bank
21
o the utility of a EWE model for impact purposes is highly dependent on the quality of input data
o each EwE model is highly dependent on local conditions Although appropriate as an overall methodology each application would need to be reviewed for how it may be applied to any new ecosystem and
o the EwE model would need to be substantially reformulated if it was to include considerations of changes in chemical composition or food quality of prey in particular for seasonal migratory species such as birds which may depend on very large biomasses of prey with specific chemical composition to fuel their migrations beyond the ecosystem model boundaries
Contributors Contributor Affiliation Ian Perry Author DFO Science Pacific Region Alida Bundy Author DFO Science Maritimes Region Terri Sutherland Author DFO Science Pacific Region Robert Elner Author ECCC Canadian Wildlife Service Andrew Robinson Author ECCC Canadian Wildlife Service Lesley MacDougall Editor DFO Science Pacific Region
Approved by Carmel Lowe
Regional Director Science Branch Pacific Region Fisheries and Oceans Canada
November 4 2016
Sources of Information Christensen V Coll M Steenbeek J Buszowski J Chagaris D walters CJ 2014
Representing variable habitat quality in a spatial food web model Ecosystems 17 1397-1412
Christensen V and Walters C 2000 Ecopath with Ecosim methods capabilities and limitations Ecological Modelling 172 109-139
Colleacuteter M Valls A Guitton J Gascuel D Pauly D and Christensen V 2015 Global overview of the applications of the Ecopath with Ecosim modeling approach using the EcoBase models repository Ecological Modelling 302 pp42-53
Compass Resource Management Ltd 2013 Roberts Bank Terminal 2 Technical Advisory Group (TAG) Process Report Productive Capacity ndash Final Report 119pp (Accessed November 1 2016)
DFO 2016 Technical Review of Roberts Bank Terminal 2 Environmental Assessment Section 95 ndash Coastal Geomorphology DFO Can Sci Advis Sec Sci Resp 2016045 (Accessed November 4 2016)
Pacific Region Science Response Technical Review Assessing
Ecosystem Productivity Model of Roberts Bank
22
ESSA Technologies 2014a Roberts Bank Terminal 2 Project Roberts Bank Delta BC Environmental Impact Statement Volume 3 Biophysical Effects Assessments Appendix 10-C Roberts Bank Ecosystem Model Development and Key Run Port Metro Vancouver (Accessed November 1 2016)
ESSA Technologies 2014b Roberts Bank Terminal 2 Project Roberts Bank Delta BC Environmental Impact Statement Volume 3 Biophysical Effects Assessments Appendix 10-D Roberts Bank Ecosystem Model Sensitivity Analyses Port Metro Vancouver (Accessed November 1 2016)
Franklin J 2009 Mapping Species Distributions Spatial Inference and Prediction Cambridge University Press Cambridge
Hemmera 2014 Roberts Bank Terminal 2 Project Roberts Bank Delta BC Environmental Impact Statement Volume 3 Biophysical Effects Assessments Appendix 10-B Roberts Bank Ecosystem Model Parameter Estimates Port Metro Vancouver File 302-03503 (Accessed November 1 2016)
Port Metro Vancouver 2015a Roberts Bank Terminal 2 Project Roberts Bank Delta BC Environmental Impact Statement Volume 3 Biophysical Effects Assessments Section 100 Biophysical Setting (Accessed November 1 2016)
Port Metro Vancouver 2015b Roberts Bank Terminal 2 Project Roberts Bank Delta BC Environmental Impact Statement Volume 3 Biophysical Effects Assessments Section 103 Overview of Assessing Ecosystem Productivity (Accessed November 1 2016)
Port Metro Vancouver 2015c Roberts Bank Terminal 2 Project Environmental Assessment Additional Information Requirements (July 31 2015) Responses Response to Information Request 6 IR-73115-06 Canadian Environmental Assessment Agency Reference Number 80054 dated 26 October 2015
Steenbeek J Coll M Gurney L Meacutelin F Hoepffner N Buszowski J and Christensen V 2013 Bridging the gap between ecosystem modeling tools and geographic information systems Driving a food web model with external spatialndashtemporal data Ecological Modelling 263 139ndash 151
Sutherland T Elner R and OrsquoNeill J 2013 Roberts Bank Ecological crucible of the Fraser River estuary Progress in Oceanography 115 171ndash180
Vancouver Fraser Port Authority 2016 From the Vancouver Fraser Port Authority to the Review Panel re Answers to preliminary technical questions submitted during the completeness phase from Fisheries and Oceans Canada Natural Resources Canada and Environment and Climate Change Canada concerning the ecosystem modelling to support the Roberts Bank Terminal 2 Project environmental review CEAR Document 547 (Accessed November 1 2016)
Pacific Region Science Response Technical Review Assessing
Ecosystem Productivity Model of Roberts Bank
23
This Report is Available from the Centre for Science Advice
Pacific Region Fisheries and Oceans Canada
3190 Hammond Bay Road Nanaimo BC V9T 6N7
Telephone (250) 756-7208 E-Mail csapdfo-mpogcca
Internet address wwwdfo-mpogccacsas-sccs
ISSN 1919-3769 copy Her Majesty the Queen in Right of Canada 2016
Correct Citation for this Publication
DFO 2016 Technical review of Roberts Bank Terminal 2 environmental assessment section 103 ndash assessing ecosystem productivity DFO Can Sci Advis Sec Sci Resp 2016050
Aussi disponible en franccedilais
MPO 2016 Examen technique de leacutevaluation environnementale du Terminal 2 agrave Roberts Bank section 103 ndash eacutevaluation de la productiviteacute de leacutecosystegraveme Secr can de consult sci du MPO Reacutep des Sci 2016050
- TECHNICAL REVIEW OF ROBERTS BANK TERMINAL 2 ENVIRONMENTAL ASSESSMENT SECTION 103 ndash ASSESSING ECOSYSTEM PRODUCTIVITY
-
- 10 Context
- 20 Background
-
- 21 Background and Terms of Reference
- 22 Approach to assessing ecosystem productivity
-
- 30 Analysis and Response
-
- 31 The EwE Team
- 32 Overview of assessment results of hydrological and sediment modelling
- 33 Model implementation
-
- 331 The purpose of the EwE model
- 332 Applicability of the EwE model framework to the Roberts Bank region
- 333 Model documentation
- 334 Highly mobile functional groups
- 335 Seasonality (model time step)
- 336 Life history structure
- 337 Model balancing
-
- 34 Model validation
- 35 Model results
-
- 351 Presentation of model results
- 352 Sensitivity and vulnerability analyses
-
- 40 Conclusions
- Contributors
- Approved by
- Sources of Information
- This Report is Available from the
-
- CSAS 2016-50 - Assessing Ecosystem Productivitypdf
-
- TECHNICAL REVIEW OF ROBERTS BANK TERMINAL 2 ENVIRONMENTAL ASSESSMENT SECTION 103 ndash ASSESSING ECOSYSTEM PRODUCTIVITY
-
- 10 Context
- 20 Background
-
- 21 Background and Terms of Reference
- 22 Approach to assessing ecosystem productivity
-
- 30 Analysis and Response
-
- 31 The EwE Team
- 32 Overview of assessment results of hydrological and sediment modelling
- 33 Model implementation
-
- 331 The purpose of the EwE model
- 332 Applicability of the EwE model framework to the Roberts Bank region
- 333 Model documentation
- 334 Highly mobile functional groups
- 335 Seasonality (model time step)
- 336 Life history structure
- 337 Model balancing
-
- 34 Model validation
- 35 Model results
-
- 351 Presentation of model results
- 352 Sensitivity and vulnerability analyses
-
- 40 Conclusions
- Contributors
- Approved by
- Sources of Information
- This Report is Available from the
-
Canadian Science Advisory Secretariat Pacific Region Science Response 2016050
December 2016
TECHNICAL REVIEW OF ROBERTS BANK TERMINAL 2 ENVIRONMENTAL ASSESSMENT SECTION 103 ndash
ASSESSING ECOSYSTEM PRODUCTIVITY
10 Context Vancouver Fraser Port Authority (VFPA) formerly Port Metro Vancouver (the Proponent) is proposing to construct and operate the Roberts Bank Terminal 2 Project (the Project) a new three-berth marine container terminal at Roberts Bank in Delta British Columbia The proposed terminal is located next to the existing Deltaport and Westshore Terminals In addition to the construction of the new terminal the Proponent has proposed to widen the north side of the existing Roberts Bank causeway from its east-end connection with the mainland to the entrance to the new terminal The existing tug basin connected to the northeast side of Deltaport Terminal is also proposed to be expanded The new marine terminal is predicted by the Proponent to process up to 260 container ship calls per year at full capacity with the assistance of two or three large berthing or escort tugs to manoeuver ships into or away from assigned berths The terminal is designed to operate 24 hours per day year-round
The Roberts Bank Terminal 2 Project is subject to an environmental assessment by a Review Panel pursuant to the Canadian Environmental Assessment Act 2012 As a federal authority in the environmental assessment for the Project Fisheries and Oceans Canada (DFO) will be asked to present information to the review panel and at public hearings in relation to its expertise on the effects of the Project on fish and fish habitat including aquatic species at risk and the adequacy of mitigation and offsetting measures and monitoring and follow-up programs proposed by the Proponent DFOrsquos Pacific Region Fisheries Protection Program (FPP) will coordinate DFOrsquos participation in the environmental assessment
The Proponent assessed future ecosystem productivity at Roberts Bank using the Ecopath with Ecosim and Ecospace (EwE) model framework The potential impacts of the Project to hydrodynamic conditions and sediment transport in the area as a result of changes in wind wave and current patterns and intensities are projected using different model frameworks A companion Science Response (DFO 2016) has been developed by DFO and Natural Resource Canada (NRCan) to review Section 95 ldquoCoastal Geomorphologyrdquo of the Environmental Impact Statement (EIS) which describes the hydrodynamic and sedimentology models that were used to evaluate the effect of the Project on water and sediment movements
Outcomes of the EwE models are incorporated into the analysis of the potential project-related effects on the ongoing productivity of commercial recreational and Aboriginal fisheries Consequently DFO FPP has requested that DFO Science Branch provide an evaluation of the Proponentrsquos characterization of project-related effects as conducted using the Ecopath with Ecosim and Ecospace (EwE) ecosystem model
Pacific Region Science Response Technical Review Assessing
Ecosystem Productivity Model of Roberts Bank
2
The objectives for this Science Response are to
1 Determine if the functional groups and abiotic factors used in the model adequately represent the ecosystem at Roberts Bank
2 Assess whether the parameter estimates used by the model are valid and defensible for this system
3 Assess whether the limitations and uncertainties of the model are identified and appropriately considered when determining the modelrsquos representation of current and possible future conditions
4 Provide advice regarding whether the model results related to the potential effects of the Project on fish and fish habitat and migratory birds and their food resources are valid and defensible
5 If possible provide advice regarding the validity of using the EwE model framework to quantify large scale impacts to fish habitat and fisheries productivity and the productivity of migratory birds
This Science Response evaluates Section 100 ldquoBiophysical Settingrdquo with a focus on Section 103 ldquoOverview of Assessing Ecosystem Productivityrdquo in the EIS as submitted by the Proponent (Port Metro Vancouver 2015) This Section and consequently this Response describes the ecosystem modelling approach that was taken to evaluate the direct and indirect effects of the footprint of the proposed terminal and widened causeway herein referred to as lsquothe Projectrsquo This ecosystem model provides outputs related to potential effects of the project on the study area at an ecosystem level including aquatic species and bird species in the Project area Evaluation of the model and its outputs therefore required expertise in both fishery aquatic species and migratory bird species Consequently this Science Response is the product of a joint review between DFO and Environment and Climate Change Canada (ECCC) Canadian Wildlife Service and Wildlife and Landscape Science to provide a complete evaluation
This Science Response Report results from the Science Response Process of July 2016 on the Technical Review of Ecopath with Ecosim and Ecospace (EwE) Ecosystem Productivity Model application to the Roberts Bank Terminal 2 Environmental Assessment
20 Background
21 Background and Terms of Reference The Projectrsquos main components have a proposed combined marine footprint area of approximately 179 km2 listed below by specific component
bull Marine Terminal 1335 km 2 including terminal (116 km 2) and dredged berth pocket and marine approach areas (0174 km 2)
bull Widened Causeway 0424 km 2
bull Expanded Tug basin 0031 km 2
Roberts Bank in the Fraser River estuary consists of complex intertidal and subtidal habitats including intertidal eelgrass beds and is an important stopover area for migrating shorebirds and productive feeding and rearing habitats for many fish and invertebrate species It also provides habitat for endangered Southern Resident Killer Whales and other marine mammals
Pacific Region Science Response Technical Review Assessing
Ecosystem Productivity Model of Roberts Bank
3
The environmental conditions at Roberts Bank are dynamic and are influenced by a variety of oceanographic and atmospheric factors including the Fraser River freshwater and sediment plume discharge diurnal tidal currents and prevailing and storm-generated wind and wave activity In addition the intercauseway region provides significant drainage from marsh and agricultural areas which have different characteristics from marine waters and which run along the ferry causeway
To provide the required science advice this Science Response focusses on Section 10 ldquoBiophysical Settingrdquo of the Environmental Impact Statement (EIS) (Port Metro Vancouver 2015a) specifically Section 103 ldquoOverview of Assessing Ecosystem Productivityrdquo (Port Metro Vancouver 2015b) and its related Appendices 10-B ldquoRoberts Bank Ecopath with Ecosim and Ecospace model parameter estimatesrdquo (Hemmera 2014) Appendix 10-C ldquoRoberts Bank Ecosystem model development and key runsrdquo(ESSA Technologies 2014a) and Appendix 10-D ldquoRoberts Bank Ecosystem model sensitivity analysesrdquo (ESSA Technologies 2014b) Additional important information was obtained from the Response to Information Request 6 (IR-73115-06 Canadian Environmental Assessment Agency Reference Number 80054 dated 26 October 2015) (Port Metro Vancouver 2015c) and the Written Responses to Coastal Geomorphology and Ecosystem Modelling Questions provided by the Proponent to DFO ECCC and NRCan on 2 March 2016 (Port Metro Vancouver (PMV) Transmittal TRE-01-RBT2-0004A subsequently referred in this Science Response as ldquoPMV Response 2016-03-02rdquo) (Vancouver Fraser Port Authority 2016)
The process followed in preparing this Science Response involved an initial review of the submitted EIS followed by an in-person meeting of the Proponent its contractors and representatives of DFO ECCC and NRCan to discuss and clarify questions arising from the initial review (Vancouver 23 November 2015) DFO and NRCan provided written questions to the Proponent based on preliminary review of the EIS on November 19 2015 ECCC also provided written questions based on its preliminary review of the EIS to the Proponent on December 1 2015 and January 20 2016 This large initial meeting was followed by smaller focussed meetings between the Proponent its contractors and DFO and NRCan on 11 December 2015 to clarify hydrology and sediment modelling questions with DFO on 8 January 2016 to clarify ecosystem modelling questions and with ECCC on 18 February 2016 to clarify questions relating to birds Written responses to all of these meetings and questions were provided by the Proponent to DFO ECCC and NRCan as the ldquoPMV Response 2016-03-02rdquo and ldquoPMV Response 2016-05-30rdquo (Vancouver Fraser Port Authority 2016) VFPArsquos answers to questions posed by DFO and NRCan regarding coastal geomorphology modelling have been posted to the Canadian Environmental Assessment Registry (CEAR)
22 Approach to assessing ecosystem productivity The Proponent adopted an ecosystem approach to evaluate the direct and indirect effects of the Project on the productivity of the Roberts Bank ecosystem A weight of evidence approach was used to assess the potential effects of the project on the productivity of the ecosystem and selected key components in the study area this approach included a spatial ecosystem simulation model (which included a habitat capacity model) a shorebird opportunity model and empirical data An important point is that any effects on the system during the construction phase or from expansion of the tug basin were excluded from this modelling process the focus instead being a comparison of modelled system productivity before and after the proposed terminal and expanded causeway is in place The chosen ecosystem simulation model was
Pacific Region Science Response Technical Review Assessing
Ecosystem Productivity Model of Roberts Bank
4
Ecopath with Ecosim and its spatial version Ecospace (collectively referred to here as the EwE framework or EwE model) This modelling approach was recommended by a prior Productive Capacity Technical Advisory Group comprised of representatives of technical experts from government agencies academia non-governmental organizations Vancouver Fraser Port Authority and its consultants (Compass 2013) convened by the Proponent and which also recommended a selection of focal species for the model The final selection of functional groups and the resulting food web that form the core of this ecosystem model are shown in Figure 1
Pacific Region Science Response Technical Review Assessing
Ecosystem Productivity Model of Roberts Bank
5
Figure 1 Ecopath with Ecosim model food web for Roberts Bank (Adapted from EIS Volume 3 Section 10 Fig 1033 on page 10-16) The groups coloured in orange represent focal groups size of symbols represents relative annual amount of biomass in the Roberts Bank study area
Pacific Region Science Response Technical Review Assessing
Ecosystem Productivity Model of Roberts Bank
6
The EwE framework is a common approach to ecosystem modelling which has been developed and expanded over the past two to three decades It currently has three main components
1 Ecopath ndash the core model which provides a mass-balance snapshot of the system
2 Ecosim ndash a module that enables simulation modelling over time
3 Ecospace ndash a module that enables simulation modelling over space
In order to make an EwE model tractable species are aggregated into functional groups based on their similar ecological characteristics (habitat and prey preferences etc) the Roberts Bank models had 58 functional groups The first step (Ecopath) was to obtain input parameters representing biomass production consumption emigration and diet for each functional group These parameters were then tuned in an iterative process until the overall production and consumption was balanced (a mass-balance approach) resulting in a model food web with estimates of energy flow between functional groups (Fig 1)
In the second step Ecosim was combined with the spatial model Ecospace The abiotic variables selected in this EIS (depth salinity bottom current wave height sediment type) were used as external forcings to the Ecospace module These abiotic variables provided the physical forcings for the simulations without and with the Project Since time series data on the functional groups of the model were not available Ecospace was run until the model reached equilibrium using various assumptions of the value of the vulnerability parameter (see Section 352) In this EIS the selected time step was annual with all variables abiotic and biotic expressed as yearly averages As used in this EIS the Ecospace module included a habitat capacity model which estimated the distribution of functional groups based on their environmental preferences for each abiotic variable (depth salinity bottom current wave height) and for substrate type (sand mud etc) The model thus allocated the spatial distribution of functional groups over the model domain based on their environmental preferences and the distributions of these abiotic variables with and without the Project The selected spatial unit size (ldquopixelrdquo) for the Ecospace model was 100 m2 In essence an Ecopath model was constructed for each pixel with particular rules governing how the functional groups interacted and moved among these spatial units The Ecospace module was run until it approached equilibrium (20 model years) to establish the spatial patterns without the Project For the lsquowith the Projectrsquo simulations the model was run for an initial 10 years and then the spatial patterns of the abiotic variables with the project were added and the model run for an additional 10 years1 The model outputs predicted changes in the productive potential of the Roberts Bank ecosystem as a comparison (ratio) with and without the Project rather than an absolute biomass that would be lost or gained as a result of the Project
1 EIS Appendix 10-C p 26
Pacific Region Science Response Technical Review Assessing
Ecosystem Productivity Model of Roberts Bank
7
30 Analysis and Response To prepare this response the following sections of the EIS additional documents were reviewed
DocumentSection Title
EIS Section 10
Including appendices 10B 10C and 10D
(Port Metro Vancouver 2015a Hemmera 2014 ESSA Technologies 2014a ESSA Technologies 2014b)
Biophysical Setting
Appendix 10-B Roberts Bank Ecosystem Model Parameter Estimates Port Metro Vancouver File 302-03503
Appendix 10-C Roberts Bank Ecosystem Model Development and Key Run Port Metro Vancouver
Appendix 10-D Roberts Bank Ecosystem Model Sensitivity Analyses Port Metro Vancouver
CEAR document 547 (Including Appendices) ldquoPMV Response 2016-03-02rdquo and ldquoPMV Response 2016-05-30rdquo
(Vancouver Fraser Port Authority 2016)
Vancouver Fraser Port Authority to the Review Panel re Answers to preliminary technical questions submitted during the completeness phase from Fisheries and Oceans Canada Natural Resources Canada and Environment and Climate Change Canada concerning the ecosystem modelling to support the Roberts Bank Terminal 2 Project environmental review
31 The EwE Team Building this ecosystem model was a complex undertaking which required knowledge of the ecosystem to be modelled how to set initial parameter values determination of reasonable ranges of these parameters how to balance the model and how to recognize when the model outputs were unrealistic These tasks became even more complex when spatial model dynamics were involved such as with Ecospace The team engaged by the Proponent to conduct this ecosystem modelling for the Roberts Bank Terminal 2 (RBT2) EIS was led by scientists at the Institute for Oceans and Fisheries located at the University of British Columbia in Vancouver These scientists are global leaders of the EwE model framework having developed much of its current implementation and who continue to lead its elaborations and extensions Construction and running of the model for this specific ecosystem was done in collaboration with ESSA Technologies of Vancouver Parameter values for the ecosystem model were obtained in part from observational studies conducted in the area by Hemmera of Burnaby BC
32 Overview of assessment results of hydrological and sediment modelling Implementation of the ldquowith the Projectrdquo simulations of the ecosystem model was done by driving the model with the abiotic variables as they were projected to be distributed with the Project footprint In the context of this EIS specifying depth salinity bottom currents wave height and sediment type conditions without the Project and changes with the Project were achieved by construction of hydrodynamical and sediment transport models The outputs from these models in combination with the identified environment preferences for the various biological groups were then used as inputs to the Ecospace model to define the spatial
Pacific Region Science Response Technical Review Assessing
Ecosystem Productivity Model of Roberts Bank
8
distributions of these functional groups The implementation of these hydrological and sediment transport models in this EIS was reviewed by DFO and NRCan (DFO 2016) This review concluded that the implementation of these models for this EIS was adequate for average winter conditions but lacking in validation for summer conditions in particular with strong freshwater flows from the Fraser River Simulations of strong storm events and their impacts on wave conditions and sediment transport were also lacking The effect of wave action and current speeds on sediment transport is non-linear such that increasing winds over short periods of time can impact sediment transport processes bottom topography and water depths beyond that determined under average model conditions Overall the review concluded that a greater range of sensitivity analyses is required to have confidence in the model outputs under lsquonon-averagersquo conditions The implication of this conclusion for the present review of the EwE model is that the full range of variability of abiotic characteristics such as bottom topography bottom current and wave heights and how they may affect relevant functional groups in the model with the Project may not be adequately represented Sensitivity analyses were provided by varying the intensity of abiotic variables and by removing abiotic variables to assess their interactive effects In general the ecosystem model outputs were robust to these sensitivity analyses with most groups varying by less than 5 Larger changes however were observed for primary producer and bird groupings and for some fish groups when various abiotic variables were omitted2
33 Model implementation 331 The purpose of the EwE model
The EwE model was intended to provide one line of evidence to assess the potential impacts of the Project on the Roberts Bank ecosystem which would then be used with other lines of evidence to make the final assessment Specifically ldquohellip the objective of the RB [Roberts Bank] model was not to provide an assessment of Project impacts for each functional group at a fine temporal scale but to estimate changes in productive potential with and without the Project at the ecosystem levelrdquo3 In addition ldquohellipthe primary objective of the RB ecosystem model is to evaluate potential changes in productivity from such abiotic factors with and without the terminal and causewayrdquo4 Results are presented for the selected functional groups no results were presented on potential changes in ecosystem structure or function
332 Applicability of the EwE model framework to the Roberts Bank region EwE models work best when the exchanges within the system being modelled are greater than the exchanges between the modelled system and the lsquooutsidersquo world In practice this means that EwE models work best for larger systems with few external exchanges In a meta-analysis of 433 Ecopath models Colleacuteter et al (2015) concluded that ldquohellipin the last two decades the range of the models area has expanded toward very large areas and the median has shifted accordingly from about 1000 km2 in 1984ndash1993 to about 100000 km2 in 1994ndash2014rdquo The section of the Roberts Bank ecosystem that is included in the EwE model was comparatively small (5468 km2) and complex It is an intertidally-dominated environment that is subject to strong seasonal influences of both freshwater and marine exchanges across relatively large seaward and shoreward boundaries
2 EIS Appendix 10-D p ii - iii 3 PMV Response 2016-03-02 p 99 lines 1914-1917 4 PMV Response 2016-03-02 p 38 lines 689-691
Pacific Region Science Response Technical Review Assessing
Ecosystem Productivity Model of Roberts Bank
9
Processes taking place outside the modelled ecosystem will contribute to dynamics within the modelled ecosystem (eg lsquooutsidersquo food supporting predators which occur in the Roberts Bank ecosystem for only part of the year predators which may feed in the Roberts Bank ecosystem but export this energy when they migrate out of the region) but which may not be well-resolved by the EwE model The Proponent justifies the spatial scale because it was specifically chosen for the questions being asked in regard to assessing productivity changes and because the relative influences of external exchanges are assumed to be identical with and without the project In addition highly mobile species with broad prey bases were assumed in the model to be partially sustained by external energy from outside the model system5 The distributions of organisms may differ however with and without the project which may affect their interactions with areas outside of the modelled system and the use of diets from outside the modelled system may not reflect the impacts of the project Further clarification of how the EwE model captures the exchanges and interactions with adjacent ecosystems are needed For example it could be argued that an ecosystem which is open to frequent exchanges of water and organic matter from beyond its boundaries might be more robust to local disturbances such as the Project
There are some inconsistencies in the information and assumptions used for some of the taxa in this ecosystem model For Dungeness Crab the justification for estimating total adult biomass (including females) from the biomass of fished males is unclear In addition it is unclear if the slower growth of female crabs once they have reached sexual maturity in comparison with male crabs has been considered The diet matrix for spiny dogfish does not represent the actual diet well in particular of euphausiids herring and shrimp and there are more recent references for biomass estimates of spiny dogfish in the study area than what was used in the EIS
Fishing mortality was not included in the model under the assumption that this would not change with or without the project While this assumption may be true the model has been parameterized by ignoring a source of mortality that will influence total production In essence fishing removes biomass from the ecosystem with the result that less biomass will be available for higher trophic levels How this may impact the ecosystem with and without the Project is unclear but it could make noticeable differences if for example there were thresholds in the feeding responses by these higher trophic level species The Ecopath model that was used is relatively unconstrained since many ecological efficiencies are low even for forage species which would be expected to be higher It is not clear how many species are exploited or the levels of exploitation but even if this does not change with the Project these mortality rates should be included in the model in order to add realistic constraints to the exploited functional groups
333 Model documentation Based on questions from DFO ECCC and NRCan following their initial review of the EIS the Proponent provided written responses dated 2 March 2016 to clarify several of the steps in the model development and implementation However several questions remain including questions about the Ecospace module Ecospace has undergone several recent developments such as the inclusion of the spatial-temporal data layer framework (Steenbeek et al 2013) the habitat capacity model (Christensen et al 2014) and the Monte Carlo analysis including the diet matrix As yet there are few published studies using these latest Ecospace developments and their documentation and justification need to be improved in the EIS
5 PMV Response 2016-03-02 p 29 lines 446 - 464
Pacific Region Science Response Technical Review Assessing
Ecosystem Productivity Model of Roberts Bank
10
Questions also remain regarding how the Monte Carlo randomization routine treated diet data The report indicates that the Monte Carlo routine randomly selected input parameters from the input ranges and that only models that were balanced were used This suggests that a high proportion of models were not balanced and therefore were not used (for example the EIS indicates that about one out of 1000 sampled input parameters was balanced6) A table showing the minimum maximum mode average and median values from the Monte Carlo runs for all the parameters would enable an evaluation of how much variation was actually sampled by the balanced model runs This is recommended in the EwE user information ie ldquoUsers should check the range of the input parameters that were actually used in the trials in the output csv file (see below)rdquo7
In addition there are several issues with the documentation of the derivation of the parameters for the functional groups Such documentation should clearly outline how the input parameter was estimated and the range of uncertainty for that parameter For example the input biomass of pinnipeds was defined as 04 t km 2 derived from estimates of 034 for Harbour seals and two estimates for Steller sea lions (012 and 014 t km 2) No explanation was provided for how the overall estimated pinniped biomass of 04 t km 2 was determined The diet of Sand Lance was described in the EIS as consisting mostly of zooplankton8 whereas the diet table for the model runs9 included 20 macrofauna 10 green algae and 10 detritus It is unclear why these additional prey were included in the diet used for the model runs
334 Highly mobile functional groups This implementation of the EwE framework included transient and migratory functional groups This is entirely appropriate and these groups cannot be excluded The approach taken in the Ecospace module was to impose a low (and conservative) dispersal rate among model spatial units (lsquopixelsrsquo) of 1 km yr-1 This may be appropriate for low mobility benthic organisms but it likely underestimates the movements of many other functional groups The effects of using higher and perhaps functional-group-specific dispersal rates was not considered The Proponents argued that higher dispersal rates would reduce impacts since species can move away from less desirable areas more quickly for completeness these runs should be done and evaluated Mobile species will also bring energy (food) captured outside the system into the modelled ecosystem This process was included in the model with the use of a diet import factor reflecting the consumption of prey outside the modelled region with the assumption that groups with high import rates were unlikely to respond to local changes on Roberts Bank10 This assumption needs justification perhaps at the functional group level for example many species of highly migratory birds and Pacific salmon use the Roberts Bank ecosystem to obtain food to continue their migrations Although this food does not compose a large fraction of their annual consumption it can be critical to enable them to continue their migrations
The EwE model is not designed to capture differences in prey quality ie differences in essential fatty acid or nutrient ratios The same species of prey may have greater or lesser nutritional value to predators depending on the conditions under which they are growing and their seasonal variations This is a particular concern with the nutritional quality of the diatom-dominated biofilm Diatomaceous biofilm is important to the highly migratory Western Sandpiper (Calidris mauri) Despite its predictive merits in relation to other ecosystem
6 EIS Appendix 10D Section 24 p5 7 EwE Help file p 151 8 EIS Appendix 10B Section 4133 p 76 9 EIS Appendix A of Appendix 10B 10 PMV Response 2016-03-02 p 28 lines 429 - 436
Pacific Region Science Response Technical Review Assessing
Ecosystem Productivity Model of Roberts Bank
11
components the EwE model is not informative with respect to understanding the potential impacts of the Project on biofilm and the Western Sandpiper While this example is specific to seabirds the potential exists for differences in the quality of biofilm to also be an issue for copepods which feed on biofilm and consequently to juvenile salmon which feed on these copepods (eg Sutherland et al 2013)
The EwE model is also not designed to predict effects of the Project on water quality although the Proponent noted that ldquoOther abiotic factors not included were deemed to be representative of variables that were already included in the modelhelliprdquo11 The Project may cause changes in physical and water quality conditions whether in isolation or in combination which may impact the productivity or nutritional quality of key prey organisms for local and migratory species which will not be captured by the model The EwE model does not assess the production of key nutrients or the implications of changes in important physical and water quality parameters to biofilm community structure and hence to important migratory birds
The model does not include biotic factors for both pelagic and benthic environments to assess the potential development of eutrophication and benthic organic enrichment events respectively Organic and redox indicators traditional measures of environmental assessments that are used to determine changes in functional group responses were included in the recent Deltaport Third environmental assessment (ie Pelagic chlorophyll dissolved nutrients Benthic sediment carbonnitrogen content redox state [sulfide concentration]) Benthic anoxic events based on organic enrichment are known to be strong drivers of community composition and exclusion regardless of substrate type In the absence of biotic factors (eg organic particulates) the model has not considered the potential for benthic organic enrichment which coincides with siltation processes within the upper tidal flats The tidal flat corner bordered by the Delta-dyke and Deltaport causeway has served as a catchment area for Fraser River silt since the development of the original Deltaport causeway (Sutherland et al 2013) The proposed position of the new terminal placed at the seaward termination of the Deltaport causeway may produce a crescent-shaped feature in the wake of the Fraser River Plume This feature may provide a more efficient silt trap that will promote benthic organic enrichment This piece of the environmental assessment seems to be missing and is important for assessing fish habitat in this area
335 Seasonality (model time step) Input data to parameterize the model were available on a range of time scales from hourly (eg physical data on salinity and water flow) to annual (eg species biomass) The Proponents indicated12 that this is a strength of the EwE model although ultimately the model was run with an annual time step with all sub-annual values being averaged to annual values This method therefore did not incorporate important seasonal processes such as winter-summer differences in salinity and storm properties and the seasonal appearances of abundances of predators and prey such as migratory salmon and birds that are much larger than the annual average For example juvenile salmon migrate from the Fraser River and onto Roberts Bank in the spring before moving into deeper waters If these spring abundances are averaged over the entire year these average abundances would be 5-10 times lower than the actual abundances during the spring (ie averaging the biomass that occurs in two months over a 12 month period) Additionally this method did not capture the intensity of processes such as growth and predation which can be focused over periods of a few weeks to a few months There may be important threshold effects at particular times and places which may be missed when using an 11 EIS Section 10 p 10-11 12 PMV Response 2016-03-02 p 86 line 1655
Pacific Region Science Response Technical Review Assessing
Ecosystem Productivity Model of Roberts Bank
12
annual time step for the model The Ecospace module has a monthly time step13 and therefore it is feasible to run this module with a sub-annual time step For example the Proponents submit14 that there are inadequate data to model the potential effects of the Project on the timing of biofilm production which could have implications for the migratory dunlin and Western Sandpiper However this could be modelled in an exploratory way to determine hypotheses about which factors could affect the timing of production of biofilm and the potential impacts on these birds These issues are of major concern to ECCC
336 Life history structure The EwE model did not separate functional groups into life history stages (stanzas) yet for many functional groups the juvenile stages can have very different life history characteristics and habitats than the adults It is unclear in the description of the model how different life history structures were considered and whether for example there were enough juveniles to produce the adults The implications of not including early life stages should be explored at least qualitatively to identify which species might have life stages that may be more vulnerable to project effects
337 Model balancing Balancing an EwE model is the process by which parameters are adjusted so that there is sufficient production for consumption requirements ie there are sufficient prey for all predators Expert opinion was used to examine parameter values and to adjust for errors or inconsistencies in logic ldquoPMV is confident that since the approach taken to balance the model was based on best practices the steps are appropriaterdquo15 Adjustments to initial parameters to ensure an ecologically-feasible model are necessary and to be expected For a few functional groups however very large changes to initial parameter estimates (which were often not based on Roberts Bank specific data) were necessary for example to transient killer whales When such initial parameters were adjusted (often by substantial amounts) by expert opinion to balance the model the confidence intervals around these adjusted parameter values were not increased to reflect this added uncertainty (see for example PMV Response 2016-03-02 p 51 lines 955-956) When expert opinion was used to make very large changes to initial parameter values broader confidence intervals about these parameters should have been applied This does not appear to have been the case and as a consequence may cause the actual uncertainty of the model outputs to be underestimated
Another example is for the pinniped group in which 50 of the diet was assumed to come from outside the model area in order to balance the model The rationale provided was ldquoThe pinnipeds caused excessive predation mortalities on numerous fish functional groups The biomass of pinnipeds was an average for the Strait of Georgia which was likely too high for Roberts Bank Therefore it was assumed that pinnipeds extracted only half of their diet from the study areardquo16 It is unclear whether the sensitivity of the model to different percentages of diet allocation was explored
As noted above (332) the Ecopath model was relatively unconstrained and few adjustments to input parameters were required to balance the model This is unusual and the low ecotrophic efficiencies of several functional groups suggest that full accounting of energy flows may not have been achieved (an ecotrophic efficiency of 1 indicates that 100 of the production of that
13 EIS Appendix 10C Section 29 p24 14 EIS Appendix 10D Appendix C p72 15 PMV Response 2016-03-02 p 49 lines 910-912 16 EIS Appendix 10C Section 261 p 20
Pacific Region Science Response Technical Review Assessing
Ecosystem Productivity Model of Roberts Bank
13
particular group is being preyed upon or removed by fishing leaving no individuals to die of old age17) An ldquoexcessrdquo of individuals dying of old age ie ecotrophic efficiencies much less than 1 suggests a potentially large biomass that is not used by the ecosystem and instead is converted to detritus
34 Model validation Model validation is the process by which the model parameters variables and outputs are compared with those from the real ecosystem to ascertain how well the model represents the ecosystem It is an essential step in providing confidence that the projections from the model in this case with and without the Project have relevance to how the real ecosystem may be expected to function with and without the Project In practice validating complex ecosystem models is difficult considering the range of assumptions that must be made when building the model the limited available data and natural variability of the ecosystem at a variety of time and space scales
Many of the standard diagnostics for the Ecopath model have not been evaluated in the EIS The Proponent appears to have assumed that once the Ecopath model was balanced then it was valid and fit for purpose The Proponent should provide all the Ecopath estimates of vital rates including mortality rates As presented questions remain For example many Ecotrophic Efficiencies (which control the transfer of biomass from prey to predators) are less than 1 even for taxa which would be expected to be close to 1 such as carnivorous zooplankton The reason for Ecotrophic Efficiencies less than 1 were not discussed or explained in the EIS
Detailed diagnostics for the Ecospace model should also be presented in order to evaluate model performance In response to criticisms by DFO ECCC and NRCan in discussions with the Proponent the latter provided the biomass of the functional groups from the Ecopath model (before Ecospace) and the Ecospace model after the spin-up period (which involved adjusting the parameters from the Ecopath model to balance the 5468 separate cells of the Ecospace model)18 The Proponents argue that ldquoIt is important to note that changes in biomass values generated during the spin-up period are identical for both with and without Project scenarios and thus do not provide information on the potential Project-related effects on productivity19 However several changes to biomass result from the Ecospace balancing process (spin-up period) This is only given brief attention by the Proponent in its response to the DFO ECCC and NRCan questions An analysis of Table 620 revealed that the biomass of 9 functional groups was larger or smaller than the widest confidence limits allowed for each group21 This requires further discussion and justification
The Proponent used a goodness of fit measure to compare spatial distributions of model outputs with field observations They indicated that ldquono other EwE models were identified which use a goodness-of-fit measure Hence the RB model is potentially the first such EwE model where a goodness of fit measure has been appliedrdquo22 The chosen goodness of fit measure is the percent correct classification (PCC) method23 This method derives a test statistic based on the proportion of locations at which predicted occurrences from the model match observed
17 EIS Appendix 10-B p 11 18 PMV Response 2016-03-02 p 65-66 Table 6 19 PMV Response 2016-03-02 p 64 lines 1205-1207 20 PMV Response 2016-03-02 p 65-66 Table 6 21 PMV Response 2016-03-02 p 45 Table 3 22 PMV Response 2016-03-02 p 78 lines 1481-1483 23 PMV Response 2016-03-02 p 78 lines 1483-1484
Pacific Region Science Response Technical Review Assessing
Ecosystem Productivity Model of Roberts Bank
14
occurrences from data and similarly with predicted and observed absences The Proponent then calculated two additional accuracy of fit measures sensitivity (the model predicts a species to occur in an area where it is known to occur in reality) and specificity (the model predicts a species does not occur in an area it is known not to occur in reality)24 This analysis concluded that the model has high predictability for functional groups such as eelgrass and sea pens with relatively static distributions but lower predictability for functional groups which are more temporally and spatially dynamic such as biofilm and green algae25
There are two problems with this approach The first is that this goodness of fit comparison was done only for habitat-forming functional groups no discussion of how well this analysis applies to mobile functional groups was provided The second problem is that this method does not take into account situations (such as occurs in this study with several groups) in which species occur at only a few locations For example ldquohellipif the test data consist of 95 absences and 5 presences and this reflects the true prevalence of the species on the landscape (a realistic scenario for a rare species) a lsquonullrsquo model that predicted absence in all cases (eg no model at all) would be correct 95 of the timehellipldquo (Franklin 2009 p 151) This latter point is important here as these habitat functional groups (biofilm brown algae native eelgrass green algae Japanese eelgrass tidal marsh biomat and orange sea pens26) appear not to occur over most of the Project area (as portrayed by the model outputs presented in the distribution figures of PMV Response 2016-03-02 Appendix 218) It is therefore important that a robust evaluation of the performance of the Ecospace module is used with preferably more than one measure
In summary the starting point for this modelling analysis matters It is not just about a comparison between results with and without the Project The model has to be considered a sufficient representation of the ecosystem The Proponent has not yet sufficiently validated the model
35 Model results 351 Presentation of model results
As noted above (Section 331) the stated objective of the Roberts Bank ecosystem model was not to provide an assessment of Project impacts for each functional group at a fine temporal scale but to estimate changes in productive potential with and without the Project at the ecosystem level27 However results were presented as comparisons by speciesfunctional group with and without the Project and not as potential changes in total ecosystem productivity The revised figures for each functional group showing distributions without the Project with the Project and their difference indicated impacts were likely to be localized with overall impacts relatively small The range of biomass ratios with and without the Project was 045 ndash 189 with most values slightly less than 1 This is interpreted as indicating slight decreases in the capacity of the study area to support biomass and production with the Project for many functional groups28 (Figure 2)
24 PMV Response 2016-03-02 p 80 lines 1524-1527 25 PMV Response 2016-03-02 p 81 lines 1551-1559 26 PMV Response 2016-03-02 p 82 Table 8 27 PMV Response 2016-03-02 p 99 lines 1914-1917 28 PMV Response 2016-03-02 Appendix 218
Pacific Region Science Response Technical Review Assessing
Ecosystem Productivity Model of Roberts Bank
15
Biomass Ratio
Freq
uenc
y
04 07 10 13 16 19
05
1015
2025
30
Figure 2 Histogram of biomass ratios obtained by comparisons of model runs with and without the project (ie With Without) Values less than 1 indicate reductions in biomass with the Project compared against without the Project) Data from Appendix 218 of PMV Response 2016-03-02
352 Sensitivity and vulnerability analyses Every ecosystem model is only one possible representation of the true ecosystem defined by the modelrsquos structure and the values chosen for its many parameters The key point is how well the model represents the real system how that fit can be measured and the sensitivity of model outputs to variability in the selected parameter values The ideal model should be robust to a wide range of uncertainties in the input data and parameters This robustness is determined by performing sensitivity analyses on the model to see how it responds to variations in the input parameters and determining to which input parameters the model is most sensitive
The vulnerability parameters determine the strength of the feeding interactions between functional groups They set the level of density dependence of each functional group Higher vulnerability settings provide greater top-down (predator) control whereas lower settings provide greater bottom-up (environmental) control29 Several publications have shown that EwE models are very sensitive to the vulnerability parameters and Christensen and Walters (2000) point out that a main pitfall of EwE is that ldquopredation vulnerabilities are often underestimated lessening the modelled impacts of predationrdquo It is usual practice to tune Ecopath models including the vulnerability parameters to time series data such as biomass using the temporal simulation model Ecosim However these data were not available for the RBT2 area so this robust method of fitting the model and estimating vulnerability parameters was not possible Instead a vulnerability setting of 2 was used as the default value for the key model runs which is ldquocommon practice when time series data are not available and estimates of vulnerability in the
29 PMV Response 2016-03-02 p 70 lines 1318-1323
Pacific Region Science Response Technical Review Assessing
Ecosystem Productivity Model of Roberts Bank
16
model cannot be maderdquo30 with sensitivity analyses run for a range of 15 to 3 This narrow range was criticized by DFOECCC in initial discussions about the model with the Proponent The Proponent subsequently reran the model with a larger range of vulnerabilities31 (11 to 10) and concluded this broader vulnerability range produced similar results for the productivity ratio with and without the Project to those in the original EIS and that the EIS was more likely to overestimate than underestimate potential project effects32 The data in Table 7 of the PMV Response33 did indicate changes in productivity ratios ranging from 0 to 50 of the defined key run (which used a vulnerability setting of 2) However the Proponent changed all vulnerability settings to the same value ie all were 2 or all were 10 etc In reality the vulnerability parameters resulting from Ecosim models that are fitted to data as described above vary by functional group which was not explored here Therefore although the results suggest that the original choice of 2 for the default key run seemed reasonable the potential effects of variability in vulnerability settings was not fully explored
Sensitivity analyses are usually based on the range of uncertainty estimated for input data and parameters often called the confidence limits around the model parameters The EwE framework integrates many different data sources and parameters including values from the literature It can therefore be difficult to identify ldquoreasonablerdquo confidence limits when derived from such diverse data sources Standard practice in Ecopath models has been to develop a pedigree for each parameter with default values for uncertainty based on the nature of the source data For example parameter values based on high precision field observations of biomass within the model domain receive default confidence intervals of 10 whereas parameter values based on models developed for elsewhere or professional judgment receive confidence intervals of 8034 Sensitivity analyses are then run using parameter values selected from within these confidence intervals However if these default confidence intervals do not capture the full range of variability then the outputs are not informative of the variability in the lsquorealrsquo ecosystem Field observations were collected for many functional groups within the model domain in 2012 and 2013 as part of studies to support the RBT2 EIS Apparently the purpose of these observations was to document spatial variability (in part for the Ecospace model) and temporal variability (measurements at one location over time) and not to derive confidence intervals around the observations35
The reliance on the pedigree approach to derive confidence intervals for this Roberts Bank model was criticized by DFO ECCC and NRCan in discussions with the Proponent As a result the Proponent reran the model with much larger confidence intervals ranging from 30 to 100 depending on the input parameter and functional group36 The results from this new analysis using the broader confidence intervals were similar to those using the original pedigree approach The Proponent noted that ldquoWhile the production within each helliprun was very different there was little difference in the biomass ratio [with and without the Project] These results further demonstrate that even with a greater range in input values the influence of the Project on the Roberts Bank ecosystem is consistent among allhellipmodel runsrdquo37 This provides confidence that the model may be robust to uncertainty in its input parameters Two concerns
30 PMV Response 2016-03-02 p 70 lines 1321-1322 31 PMV Response 2016-03-02 p 71-74 32 PMV Response 2016-03-02 p 71 lines 1339-1341 33 PMV Response 2016-03-02 p 73 34 EIS Appendix 10-C Section 251 page 18 35 PMV Response 2016-03-02 p 42 lines 772-777 36 PMV Response 2016-03-02 p 44-47 37 PMV Response 2016-03-02 p 47 lines 855-858 and see also PMV Response 2016-03-02 Appendix 27-B
Pacific Region Science Response Technical Review Assessing
Ecosystem Productivity Model of Roberts Bank
17
remain however The quote above indicates that the production among the different model runs was very different although with little difference in the biomass ratios with and without the Project Since biomass is not the same as production it would be informative for understanding model performance and potential impacts to show these production differences This also relates to the point made in Section 34 regarding how well the model represents the real ecosystem and not just within-model comparisons with and without the Project The second question is more technical and relates to how the randomization (Monte Carlo or MC) routine that was used to create multiple model runs used the uncertainty about the diet data Diets are not currently included in the MC routine available to regular users of the Ecosim model how they were handled in this RBT2 model appears not to be explained
Finally the sensitivity analyses indicate that the uncertainty in the input parameters does not lead to much difference between model parameters with or without the project However this conclusion does not describe how the uncertainty in the input parameters affects understanding of the ecosystem
40 Conclusions Overall the main conclusion of the Environmental Impact Statement from the Proponent is stated as ldquohellipafter the implementation of mitigation hellipthe Project is not expected to result in any significant adverse effects on any of the 16 valued componentsrdquo38 In addition ldquohellipapproximately 40 of the functional groups are forecast to change no more than 5 which hellip is judged to be within the uncertainty of the model runsrdquo39 although larger changes were forecast for orange sea pens freshwater biofilm green algae and raptors The conclusions from the modelling studies are that ldquohellipthe proposed project will have an impact on the study area that the effect varies between species and that the findings are robust to parameter uncertaintyrdquo40 Specific outcomes by valued component as derived from the EwE model are presented by functional groups in Table 1
38 PMV March 2015 Roberts Bank Environmental Impact Statement Executive Summary ndash Part 1 page 37 39 EIS Appendix 10-C p ii 40 EIS Appendix 10-D p iv
Pacific Region Science Response Technical Review Assessing
Ecosystem Productivity Model of Roberts Bank
18
Table 1 Changes in productive potential with the Project as derived from the EwE model
Changes in productive potential
Ecosystem category
Number of valued
components
Number with potential
biomass loss
Moderate decrease (31-60 decline)
Minor decrease (6-30 decline)
Negligible (0-5
change)
Minor increase (6-
30 increase)
Moderate increase (31-60 increase)
Source
Marine vegetation
7 7 - 3 2 2 - EIS Vol 3 Section 11 Table 11-17 page 11-65
Marine invertebrates
4 3 1 1 1 1 - EIS Vol 3 Section 12 Table 12-8 page 12-52
Marine fish 13 13 - 2 6 5 - EIS Vol 3 Section 13 Table 13-10 page 13-95
Coastal birds
11 8 - 3 4 3 1 EIS Vol 3 Section 15 Table 15-10 page 15-67
Pacific Region Science Response Technical Review Assessing
Ecosystem Productivity Model of Roberts Bank
19
Most functional groups showed some potential biomass loss with the Project with biomass loss defined as any model run with negative outcomes (ie in which biomass with the project was less than biomass without the Project) The summary of changes in productivity potential are mixed with most (33 out of 35) valued components showing minor decreases to minor increases (defined as 6 to 30 changes in productive potential with the Project compared to without the Project)
The main conclusions of this review in regards to the Terms of Reference are
1 Do the functional groups and abiotic variables used in the model adequately represent the ecosystem at Roberts Bank
o The 58 functional groups and abiotic variables used in the model adequately represent the main components of the Roberts Bank ecosystem however for longer lived species the life stages of the species are not well represented and some of the impacts of the Project may be expected to affect specific life stages
o The abiotic variables adequately represent the physical drivers of this ecosystem on an annual time scale However annual values for these abiotic variables may not adequately capture important sub-annual events such as storms (DFO 2016) the timing of arrival and departure of highly migratory species and whether there may be important sub-annual thresholds or mismatches in timing as a result of the Project
o Biotic factors (eg nutrients) which are particularly important for biofilm and other lower trophic level taxa are not included in this model The model is therefore unable to assess the potential development of eutrophication and benthic organic enrichment events which may affect fish habitats in the study area
2 Are the parameter estimates used by the model valid and defensible for this system
o In general parameter estimates appear to be adequate for this system Field studies were done in two years to provide data in particular on distributions of selected functional groups for the Ecospace module Note the distribution studies focussed on taxa which were relatively immobile and therefore lsquofixedrsquo in space
o the selection of some model parameters would benefit from further explanation for example the choice of fixed diet matrices versus dynamic matrices which can vary with changes in abundances or predators and prey
o the selection of some model parameters would benefit from further explanation for example the link between the diets described in the text of Appendix 10B and the quantities presented in Appendix A of Appendix 10B It is understood that proportions were derived using the ldquofixed selectivityrdquo principle but in order to be fully transparent the derivation of each diet should be provided in an appendix
o discussion and explanation is needed of why ecotrophic efficiencies differ from expected values (eg the ecotrophic efficiency for Pacific herring is listed as 038) and
o the abiotic factor lsquosubstratersquo was limited to ldquohardrdquo or rdquosoftrdquo options which can be restrictive given that they serve as endpoints on a substrate composition continuum These limited options may not provide the sensitivity required to assess substrate preference nor the flexibility for taxa (eg motile organisms) that span hard mixed and soft substrate types In addition it is not clear if changes in the hardsoft categories were considered over time within identified depositional or erosional settings before and after construction
Pacific Region Science Response Technical Review Assessing
Ecosystem Productivity Model of Roberts Bank
20
3 Are the limitations and uncertainties of the model identified and appropriately considered when determining the modelrsquos representation of current and possible future conditions
o the EwE model was not designed to evaluate a range of future conditions It was designed to estimate changes in the productive potential at the ecosystem level with and without the Project Therefore the model was run without the Project and with the Project for a range of plausible abiotic conditions and the results were compared with respect to biomass and productivity by functional group
o the pedigree approach to assessing the uncertainties of model outcomes is unsatisfactory for the purpose here as it relates solely to a qualitative judgment of the value of data based on its source However when the model was rerun with much wider ranges of confidence intervals (uncertainties) the results in general (but not necessarily for each functional group) were similar to the results using the original pedigree approach This suggests that taken overall the model may be robust to wide ranges of uncertainty in these input variables and parameters
o there is inadequate validation of the model This is inadequate for three reasons
(i) the basic Ecopath model is not validated and the Ecospace balancing process (the spin-up period) resulted in some biomass estimates being increased or decreased beyond their confidence limits
(ii) the goodness of fit test used to evaluate how well the model predicted the spatial occurrence functional groups is not fit for purpose (Section 34) and
(iii) validation was provided for only a small number of functional groups (the habitat-forming functional groups) As a consequence the model is currently not validated
o Considering the proportion of open boundaries relative to closed boundaries in the model processes taking place outside the modelled ecosystem are likely to contribute to dynamics within the modelled ecosystem However these external processes may not be well-resolved by the EwE model as currently configured
4 Are the model results related to the potential effects of the Project on fish and fish habitat and migratory birds and their food resources valid and defensible
o this is a very complex ecosystem model constructed for a relatively small and open (in the sense of considerable exchange with adjacent non-modelled areas) system Many assumptions have been made based on poor or missing data Taking all these considerations into account the model does the best job possible of comparing the biomass and productivity of the Roberts Bank ecosystem with and without the Project
o the extent to which the model adequately represents the lsquorealrsquo ecosystem of Roberts Bank as opposed to comparisons of model results with and without the Project is unclear as a number of basic diagnostics are not presented (see point 3 above)
o the EwE model is not capable of and is not designed to represent nutritional and food quality variations in prey functional groups and how these may impact highly migratory predators such as birds with and without the Project
5 Is the EwE model framework a valid method to quantify large scale impacts to fish habitat fish productivity and migratory bird productivity
o the EwE model as implemented in this project and reviewed here is a useful first-order framework to organise information and derive initial estimates of how the system may respond to perturbations
Pacific Region Science Response Technical Review Assessing
Ecosystem Productivity Model of Roberts Bank
21
o the utility of a EWE model for impact purposes is highly dependent on the quality of input data
o each EwE model is highly dependent on local conditions Although appropriate as an overall methodology each application would need to be reviewed for how it may be applied to any new ecosystem and
o the EwE model would need to be substantially reformulated if it was to include considerations of changes in chemical composition or food quality of prey in particular for seasonal migratory species such as birds which may depend on very large biomasses of prey with specific chemical composition to fuel their migrations beyond the ecosystem model boundaries
Contributors Contributor Affiliation Ian Perry Author DFO Science Pacific Region Alida Bundy Author DFO Science Maritimes Region Terri Sutherland Author DFO Science Pacific Region Robert Elner Author ECCC Canadian Wildlife Service Andrew Robinson Author ECCC Canadian Wildlife Service Lesley MacDougall Editor DFO Science Pacific Region
Approved by Carmel Lowe
Regional Director Science Branch Pacific Region Fisheries and Oceans Canada
November 4 2016
Sources of Information Christensen V Coll M Steenbeek J Buszowski J Chagaris D walters CJ 2014
Representing variable habitat quality in a spatial food web model Ecosystems 17 1397-1412
Christensen V and Walters C 2000 Ecopath with Ecosim methods capabilities and limitations Ecological Modelling 172 109-139
Colleacuteter M Valls A Guitton J Gascuel D Pauly D and Christensen V 2015 Global overview of the applications of the Ecopath with Ecosim modeling approach using the EcoBase models repository Ecological Modelling 302 pp42-53
Compass Resource Management Ltd 2013 Roberts Bank Terminal 2 Technical Advisory Group (TAG) Process Report Productive Capacity ndash Final Report 119pp (Accessed November 1 2016)
DFO 2016 Technical Review of Roberts Bank Terminal 2 Environmental Assessment Section 95 ndash Coastal Geomorphology DFO Can Sci Advis Sec Sci Resp 2016045 (Accessed November 4 2016)
Pacific Region Science Response Technical Review Assessing
Ecosystem Productivity Model of Roberts Bank
22
ESSA Technologies 2014a Roberts Bank Terminal 2 Project Roberts Bank Delta BC Environmental Impact Statement Volume 3 Biophysical Effects Assessments Appendix 10-C Roberts Bank Ecosystem Model Development and Key Run Port Metro Vancouver (Accessed November 1 2016)
ESSA Technologies 2014b Roberts Bank Terminal 2 Project Roberts Bank Delta BC Environmental Impact Statement Volume 3 Biophysical Effects Assessments Appendix 10-D Roberts Bank Ecosystem Model Sensitivity Analyses Port Metro Vancouver (Accessed November 1 2016)
Franklin J 2009 Mapping Species Distributions Spatial Inference and Prediction Cambridge University Press Cambridge
Hemmera 2014 Roberts Bank Terminal 2 Project Roberts Bank Delta BC Environmental Impact Statement Volume 3 Biophysical Effects Assessments Appendix 10-B Roberts Bank Ecosystem Model Parameter Estimates Port Metro Vancouver File 302-03503 (Accessed November 1 2016)
Port Metro Vancouver 2015a Roberts Bank Terminal 2 Project Roberts Bank Delta BC Environmental Impact Statement Volume 3 Biophysical Effects Assessments Section 100 Biophysical Setting (Accessed November 1 2016)
Port Metro Vancouver 2015b Roberts Bank Terminal 2 Project Roberts Bank Delta BC Environmental Impact Statement Volume 3 Biophysical Effects Assessments Section 103 Overview of Assessing Ecosystem Productivity (Accessed November 1 2016)
Port Metro Vancouver 2015c Roberts Bank Terminal 2 Project Environmental Assessment Additional Information Requirements (July 31 2015) Responses Response to Information Request 6 IR-73115-06 Canadian Environmental Assessment Agency Reference Number 80054 dated 26 October 2015
Steenbeek J Coll M Gurney L Meacutelin F Hoepffner N Buszowski J and Christensen V 2013 Bridging the gap between ecosystem modeling tools and geographic information systems Driving a food web model with external spatialndashtemporal data Ecological Modelling 263 139ndash 151
Sutherland T Elner R and OrsquoNeill J 2013 Roberts Bank Ecological crucible of the Fraser River estuary Progress in Oceanography 115 171ndash180
Vancouver Fraser Port Authority 2016 From the Vancouver Fraser Port Authority to the Review Panel re Answers to preliminary technical questions submitted during the completeness phase from Fisheries and Oceans Canada Natural Resources Canada and Environment and Climate Change Canada concerning the ecosystem modelling to support the Roberts Bank Terminal 2 Project environmental review CEAR Document 547 (Accessed November 1 2016)
Pacific Region Science Response Technical Review Assessing
Ecosystem Productivity Model of Roberts Bank
23
This Report is Available from the Centre for Science Advice
Pacific Region Fisheries and Oceans Canada
3190 Hammond Bay Road Nanaimo BC V9T 6N7
Telephone (250) 756-7208 E-Mail csapdfo-mpogcca
Internet address wwwdfo-mpogccacsas-sccs
ISSN 1919-3769 copy Her Majesty the Queen in Right of Canada 2016
Correct Citation for this Publication
DFO 2016 Technical review of Roberts Bank Terminal 2 environmental assessment section 103 ndash assessing ecosystem productivity DFO Can Sci Advis Sec Sci Resp 2016050
Aussi disponible en franccedilais
MPO 2016 Examen technique de leacutevaluation environnementale du Terminal 2 agrave Roberts Bank section 103 ndash eacutevaluation de la productiviteacute de leacutecosystegraveme Secr can de consult sci du MPO Reacutep des Sci 2016050

Pacific Region Science Response Technical Review Assessing
Ecosystem Productivity Model of Roberts Bank
8
distributions of these functional groups The implementation of these hydrological and sediment transport models in this EIS was reviewed by DFO and NRCan (DFO 2016) This review concluded that the implementation of these models for this EIS was adequate for average winter conditions but lacking in validation for summer conditions in particular with strong freshwater flows from the Fraser River Simulations of strong storm events and their impacts on wave conditions and sediment transport were also lacking The effect of wave action and current speeds on sediment transport is non-linear such that increasing winds over short periods of time can impact sediment transport processes bottom topography and water depths beyond that determined under average model conditions Overall the review concluded that a greater range of sensitivity analyses is required to have confidence in the model outputs under lsquonon-averagersquo conditions The implication of this conclusion for the present review of the EwE model is that the full range of variability of abiotic characteristics such as bottom topography bottom current and wave heights and how they may affect relevant functional groups in the model with the Project may not be adequately represented Sensitivity analyses were provided by varying the intensity of abiotic variables and by removing abiotic variables to assess their interactive effects In general the ecosystem model outputs were robust to these sensitivity analyses with most groups varying by less than 5 Larger changes however were observed for primary producer and bird groupings and for some fish groups when various abiotic variables were omitted2
33 Model implementation 331 The purpose of the EwE model
The EwE model was intended to provide one line of evidence to assess the potential impacts of the Project on the Roberts Bank ecosystem which would then be used with other lines of evidence to make the final assessment Specifically ldquohellip the objective of the RB [Roberts Bank] model was not to provide an assessment of Project impacts for each functional group at a fine temporal scale but to estimate changes in productive potential with and without the Project at the ecosystem levelrdquo3 In addition ldquohellipthe primary objective of the RB ecosystem model is to evaluate potential changes in productivity from such abiotic factors with and without the terminal and causewayrdquo4 Results are presented for the selected functional groups no results were presented on potential changes in ecosystem structure or function
332 Applicability of the EwE model framework to the Roberts Bank region EwE models work best when the exchanges within the system being modelled are greater than the exchanges between the modelled system and the lsquooutsidersquo world In practice this means that EwE models work best for larger systems with few external exchanges In a meta-analysis of 433 Ecopath models Colleacuteter et al (2015) concluded that ldquohellipin the last two decades the range of the models area has expanded toward very large areas and the median has shifted accordingly from about 1000 km2 in 1984ndash1993 to about 100000 km2 in 1994ndash2014rdquo The section of the Roberts Bank ecosystem that is included in the EwE model was comparatively small (5468 km2) and complex It is an intertidally-dominated environment that is subject to strong seasonal influences of both freshwater and marine exchanges across relatively large seaward and shoreward boundaries
2 EIS Appendix 10-D p ii - iii 3 PMV Response 2016-03-02 p 99 lines 1914-1917 4 PMV Response 2016-03-02 p 38 lines 689-691
Pacific Region Science Response Technical Review Assessing
Ecosystem Productivity Model of Roberts Bank
9
Processes taking place outside the modelled ecosystem will contribute to dynamics within the modelled ecosystem (eg lsquooutsidersquo food supporting predators which occur in the Roberts Bank ecosystem for only part of the year predators which may feed in the Roberts Bank ecosystem but export this energy when they migrate out of the region) but which may not be well-resolved by the EwE model The Proponent justifies the spatial scale because it was specifically chosen for the questions being asked in regard to assessing productivity changes and because the relative influences of external exchanges are assumed to be identical with and without the project In addition highly mobile species with broad prey bases were assumed in the model to be partially sustained by external energy from outside the model system5 The distributions of organisms may differ however with and without the project which may affect their interactions with areas outside of the modelled system and the use of diets from outside the modelled system may not reflect the impacts of the project Further clarification of how the EwE model captures the exchanges and interactions with adjacent ecosystems are needed For example it could be argued that an ecosystem which is open to frequent exchanges of water and organic matter from beyond its boundaries might be more robust to local disturbances such as the Project
There are some inconsistencies in the information and assumptions used for some of the taxa in this ecosystem model For Dungeness Crab the justification for estimating total adult biomass (including females) from the biomass of fished males is unclear In addition it is unclear if the slower growth of female crabs once they have reached sexual maturity in comparison with male crabs has been considered The diet matrix for spiny dogfish does not represent the actual diet well in particular of euphausiids herring and shrimp and there are more recent references for biomass estimates of spiny dogfish in the study area than what was used in the EIS
Fishing mortality was not included in the model under the assumption that this would not change with or without the project While this assumption may be true the model has been parameterized by ignoring a source of mortality that will influence total production In essence fishing removes biomass from the ecosystem with the result that less biomass will be available for higher trophic levels How this may impact the ecosystem with and without the Project is unclear but it could make noticeable differences if for example there were thresholds in the feeding responses by these higher trophic level species The Ecopath model that was used is relatively unconstrained since many ecological efficiencies are low even for forage species which would be expected to be higher It is not clear how many species are exploited or the levels of exploitation but even if this does not change with the Project these mortality rates should be included in the model in order to add realistic constraints to the exploited functional groups
333 Model documentation Based on questions from DFO ECCC and NRCan following their initial review of the EIS the Proponent provided written responses dated 2 March 2016 to clarify several of the steps in the model development and implementation However several questions remain including questions about the Ecospace module Ecospace has undergone several recent developments such as the inclusion of the spatial-temporal data layer framework (Steenbeek et al 2013) the habitat capacity model (Christensen et al 2014) and the Monte Carlo analysis including the diet matrix As yet there are few published studies using these latest Ecospace developments and their documentation and justification need to be improved in the EIS
5 PMV Response 2016-03-02 p 29 lines 446 - 464
Pacific Region Science Response Technical Review Assessing
Ecosystem Productivity Model of Roberts Bank
10
Questions also remain regarding how the Monte Carlo randomization routine treated diet data The report indicates that the Monte Carlo routine randomly selected input parameters from the input ranges and that only models that were balanced were used This suggests that a high proportion of models were not balanced and therefore were not used (for example the EIS indicates that about one out of 1000 sampled input parameters was balanced6) A table showing the minimum maximum mode average and median values from the Monte Carlo runs for all the parameters would enable an evaluation of how much variation was actually sampled by the balanced model runs This is recommended in the EwE user information ie ldquoUsers should check the range of the input parameters that were actually used in the trials in the output csv file (see below)rdquo7
In addition there are several issues with the documentation of the derivation of the parameters for the functional groups Such documentation should clearly outline how the input parameter was estimated and the range of uncertainty for that parameter For example the input biomass of pinnipeds was defined as 04 t km 2 derived from estimates of 034 for Harbour seals and two estimates for Steller sea lions (012 and 014 t km 2) No explanation was provided for how the overall estimated pinniped biomass of 04 t km 2 was determined The diet of Sand Lance was described in the EIS as consisting mostly of zooplankton8 whereas the diet table for the model runs9 included 20 macrofauna 10 green algae and 10 detritus It is unclear why these additional prey were included in the diet used for the model runs
334 Highly mobile functional groups This implementation of the EwE framework included transient and migratory functional groups This is entirely appropriate and these groups cannot be excluded The approach taken in the Ecospace module was to impose a low (and conservative) dispersal rate among model spatial units (lsquopixelsrsquo) of 1 km yr-1 This may be appropriate for low mobility benthic organisms but it likely underestimates the movements of many other functional groups The effects of using higher and perhaps functional-group-specific dispersal rates was not considered The Proponents argued that higher dispersal rates would reduce impacts since species can move away from less desirable areas more quickly for completeness these runs should be done and evaluated Mobile species will also bring energy (food) captured outside the system into the modelled ecosystem This process was included in the model with the use of a diet import factor reflecting the consumption of prey outside the modelled region with the assumption that groups with high import rates were unlikely to respond to local changes on Roberts Bank10 This assumption needs justification perhaps at the functional group level for example many species of highly migratory birds and Pacific salmon use the Roberts Bank ecosystem to obtain food to continue their migrations Although this food does not compose a large fraction of their annual consumption it can be critical to enable them to continue their migrations
The EwE model is not designed to capture differences in prey quality ie differences in essential fatty acid or nutrient ratios The same species of prey may have greater or lesser nutritional value to predators depending on the conditions under which they are growing and their seasonal variations This is a particular concern with the nutritional quality of the diatom-dominated biofilm Diatomaceous biofilm is important to the highly migratory Western Sandpiper (Calidris mauri) Despite its predictive merits in relation to other ecosystem
6 EIS Appendix 10D Section 24 p5 7 EwE Help file p 151 8 EIS Appendix 10B Section 4133 p 76 9 EIS Appendix A of Appendix 10B 10 PMV Response 2016-03-02 p 28 lines 429 - 436
Pacific Region Science Response Technical Review Assessing
Ecosystem Productivity Model of Roberts Bank
11
components the EwE model is not informative with respect to understanding the potential impacts of the Project on biofilm and the Western Sandpiper While this example is specific to seabirds the potential exists for differences in the quality of biofilm to also be an issue for copepods which feed on biofilm and consequently to juvenile salmon which feed on these copepods (eg Sutherland et al 2013)
The EwE model is also not designed to predict effects of the Project on water quality although the Proponent noted that ldquoOther abiotic factors not included were deemed to be representative of variables that were already included in the modelhelliprdquo11 The Project may cause changes in physical and water quality conditions whether in isolation or in combination which may impact the productivity or nutritional quality of key prey organisms for local and migratory species which will not be captured by the model The EwE model does not assess the production of key nutrients or the implications of changes in important physical and water quality parameters to biofilm community structure and hence to important migratory birds
The model does not include biotic factors for both pelagic and benthic environments to assess the potential development of eutrophication and benthic organic enrichment events respectively Organic and redox indicators traditional measures of environmental assessments that are used to determine changes in functional group responses were included in the recent Deltaport Third environmental assessment (ie Pelagic chlorophyll dissolved nutrients Benthic sediment carbonnitrogen content redox state [sulfide concentration]) Benthic anoxic events based on organic enrichment are known to be strong drivers of community composition and exclusion regardless of substrate type In the absence of biotic factors (eg organic particulates) the model has not considered the potential for benthic organic enrichment which coincides with siltation processes within the upper tidal flats The tidal flat corner bordered by the Delta-dyke and Deltaport causeway has served as a catchment area for Fraser River silt since the development of the original Deltaport causeway (Sutherland et al 2013) The proposed position of the new terminal placed at the seaward termination of the Deltaport causeway may produce a crescent-shaped feature in the wake of the Fraser River Plume This feature may provide a more efficient silt trap that will promote benthic organic enrichment This piece of the environmental assessment seems to be missing and is important for assessing fish habitat in this area
335 Seasonality (model time step) Input data to parameterize the model were available on a range of time scales from hourly (eg physical data on salinity and water flow) to annual (eg species biomass) The Proponents indicated12 that this is a strength of the EwE model although ultimately the model was run with an annual time step with all sub-annual values being averaged to annual values This method therefore did not incorporate important seasonal processes such as winter-summer differences in salinity and storm properties and the seasonal appearances of abundances of predators and prey such as migratory salmon and birds that are much larger than the annual average For example juvenile salmon migrate from the Fraser River and onto Roberts Bank in the spring before moving into deeper waters If these spring abundances are averaged over the entire year these average abundances would be 5-10 times lower than the actual abundances during the spring (ie averaging the biomass that occurs in two months over a 12 month period) Additionally this method did not capture the intensity of processes such as growth and predation which can be focused over periods of a few weeks to a few months There may be important threshold effects at particular times and places which may be missed when using an 11 EIS Section 10 p 10-11 12 PMV Response 2016-03-02 p 86 line 1655
Pacific Region Science Response Technical Review Assessing
Ecosystem Productivity Model of Roberts Bank
12
annual time step for the model The Ecospace module has a monthly time step13 and therefore it is feasible to run this module with a sub-annual time step For example the Proponents submit14 that there are inadequate data to model the potential effects of the Project on the timing of biofilm production which could have implications for the migratory dunlin and Western Sandpiper However this could be modelled in an exploratory way to determine hypotheses about which factors could affect the timing of production of biofilm and the potential impacts on these birds These issues are of major concern to ECCC
336 Life history structure The EwE model did not separate functional groups into life history stages (stanzas) yet for many functional groups the juvenile stages can have very different life history characteristics and habitats than the adults It is unclear in the description of the model how different life history structures were considered and whether for example there were enough juveniles to produce the adults The implications of not including early life stages should be explored at least qualitatively to identify which species might have life stages that may be more vulnerable to project effects
337 Model balancing Balancing an EwE model is the process by which parameters are adjusted so that there is sufficient production for consumption requirements ie there are sufficient prey for all predators Expert opinion was used to examine parameter values and to adjust for errors or inconsistencies in logic ldquoPMV is confident that since the approach taken to balance the model was based on best practices the steps are appropriaterdquo15 Adjustments to initial parameters to ensure an ecologically-feasible model are necessary and to be expected For a few functional groups however very large changes to initial parameter estimates (which were often not based on Roberts Bank specific data) were necessary for example to transient killer whales When such initial parameters were adjusted (often by substantial amounts) by expert opinion to balance the model the confidence intervals around these adjusted parameter values were not increased to reflect this added uncertainty (see for example PMV Response 2016-03-02 p 51 lines 955-956) When expert opinion was used to make very large changes to initial parameter values broader confidence intervals about these parameters should have been applied This does not appear to have been the case and as a consequence may cause the actual uncertainty of the model outputs to be underestimated
Another example is for the pinniped group in which 50 of the diet was assumed to come from outside the model area in order to balance the model The rationale provided was ldquoThe pinnipeds caused excessive predation mortalities on numerous fish functional groups The biomass of pinnipeds was an average for the Strait of Georgia which was likely too high for Roberts Bank Therefore it was assumed that pinnipeds extracted only half of their diet from the study areardquo16 It is unclear whether the sensitivity of the model to different percentages of diet allocation was explored
As noted above (332) the Ecopath model was relatively unconstrained and few adjustments to input parameters were required to balance the model This is unusual and the low ecotrophic efficiencies of several functional groups suggest that full accounting of energy flows may not have been achieved (an ecotrophic efficiency of 1 indicates that 100 of the production of that
13 EIS Appendix 10C Section 29 p24 14 EIS Appendix 10D Appendix C p72 15 PMV Response 2016-03-02 p 49 lines 910-912 16 EIS Appendix 10C Section 261 p 20
Pacific Region Science Response Technical Review Assessing
Ecosystem Productivity Model of Roberts Bank
13
particular group is being preyed upon or removed by fishing leaving no individuals to die of old age17) An ldquoexcessrdquo of individuals dying of old age ie ecotrophic efficiencies much less than 1 suggests a potentially large biomass that is not used by the ecosystem and instead is converted to detritus
34 Model validation Model validation is the process by which the model parameters variables and outputs are compared with those from the real ecosystem to ascertain how well the model represents the ecosystem It is an essential step in providing confidence that the projections from the model in this case with and without the Project have relevance to how the real ecosystem may be expected to function with and without the Project In practice validating complex ecosystem models is difficult considering the range of assumptions that must be made when building the model the limited available data and natural variability of the ecosystem at a variety of time and space scales
Many of the standard diagnostics for the Ecopath model have not been evaluated in the EIS The Proponent appears to have assumed that once the Ecopath model was balanced then it was valid and fit for purpose The Proponent should provide all the Ecopath estimates of vital rates including mortality rates As presented questions remain For example many Ecotrophic Efficiencies (which control the transfer of biomass from prey to predators) are less than 1 even for taxa which would be expected to be close to 1 such as carnivorous zooplankton The reason for Ecotrophic Efficiencies less than 1 were not discussed or explained in the EIS
Detailed diagnostics for the Ecospace model should also be presented in order to evaluate model performance In response to criticisms by DFO ECCC and NRCan in discussions with the Proponent the latter provided the biomass of the functional groups from the Ecopath model (before Ecospace) and the Ecospace model after the spin-up period (which involved adjusting the parameters from the Ecopath model to balance the 5468 separate cells of the Ecospace model)18 The Proponents argue that ldquoIt is important to note that changes in biomass values generated during the spin-up period are identical for both with and without Project scenarios and thus do not provide information on the potential Project-related effects on productivity19 However several changes to biomass result from the Ecospace balancing process (spin-up period) This is only given brief attention by the Proponent in its response to the DFO ECCC and NRCan questions An analysis of Table 620 revealed that the biomass of 9 functional groups was larger or smaller than the widest confidence limits allowed for each group21 This requires further discussion and justification
The Proponent used a goodness of fit measure to compare spatial distributions of model outputs with field observations They indicated that ldquono other EwE models were identified which use a goodness-of-fit measure Hence the RB model is potentially the first such EwE model where a goodness of fit measure has been appliedrdquo22 The chosen goodness of fit measure is the percent correct classification (PCC) method23 This method derives a test statistic based on the proportion of locations at which predicted occurrences from the model match observed
17 EIS Appendix 10-B p 11 18 PMV Response 2016-03-02 p 65-66 Table 6 19 PMV Response 2016-03-02 p 64 lines 1205-1207 20 PMV Response 2016-03-02 p 65-66 Table 6 21 PMV Response 2016-03-02 p 45 Table 3 22 PMV Response 2016-03-02 p 78 lines 1481-1483 23 PMV Response 2016-03-02 p 78 lines 1483-1484
Pacific Region Science Response Technical Review Assessing
Ecosystem Productivity Model of Roberts Bank
14
occurrences from data and similarly with predicted and observed absences The Proponent then calculated two additional accuracy of fit measures sensitivity (the model predicts a species to occur in an area where it is known to occur in reality) and specificity (the model predicts a species does not occur in an area it is known not to occur in reality)24 This analysis concluded that the model has high predictability for functional groups such as eelgrass and sea pens with relatively static distributions but lower predictability for functional groups which are more temporally and spatially dynamic such as biofilm and green algae25
There are two problems with this approach The first is that this goodness of fit comparison was done only for habitat-forming functional groups no discussion of how well this analysis applies to mobile functional groups was provided The second problem is that this method does not take into account situations (such as occurs in this study with several groups) in which species occur at only a few locations For example ldquohellipif the test data consist of 95 absences and 5 presences and this reflects the true prevalence of the species on the landscape (a realistic scenario for a rare species) a lsquonullrsquo model that predicted absence in all cases (eg no model at all) would be correct 95 of the timehellipldquo (Franklin 2009 p 151) This latter point is important here as these habitat functional groups (biofilm brown algae native eelgrass green algae Japanese eelgrass tidal marsh biomat and orange sea pens26) appear not to occur over most of the Project area (as portrayed by the model outputs presented in the distribution figures of PMV Response 2016-03-02 Appendix 218) It is therefore important that a robust evaluation of the performance of the Ecospace module is used with preferably more than one measure
In summary the starting point for this modelling analysis matters It is not just about a comparison between results with and without the Project The model has to be considered a sufficient representation of the ecosystem The Proponent has not yet sufficiently validated the model
35 Model results 351 Presentation of model results
As noted above (Section 331) the stated objective of the Roberts Bank ecosystem model was not to provide an assessment of Project impacts for each functional group at a fine temporal scale but to estimate changes in productive potential with and without the Project at the ecosystem level27 However results were presented as comparisons by speciesfunctional group with and without the Project and not as potential changes in total ecosystem productivity The revised figures for each functional group showing distributions without the Project with the Project and their difference indicated impacts were likely to be localized with overall impacts relatively small The range of biomass ratios with and without the Project was 045 ndash 189 with most values slightly less than 1 This is interpreted as indicating slight decreases in the capacity of the study area to support biomass and production with the Project for many functional groups28 (Figure 2)
24 PMV Response 2016-03-02 p 80 lines 1524-1527 25 PMV Response 2016-03-02 p 81 lines 1551-1559 26 PMV Response 2016-03-02 p 82 Table 8 27 PMV Response 2016-03-02 p 99 lines 1914-1917 28 PMV Response 2016-03-02 Appendix 218
Pacific Region Science Response Technical Review Assessing
Ecosystem Productivity Model of Roberts Bank
15
Biomass Ratio
Freq
uenc
y
04 07 10 13 16 19
05
1015
2025
30
Figure 2 Histogram of biomass ratios obtained by comparisons of model runs with and without the project (ie With Without) Values less than 1 indicate reductions in biomass with the Project compared against without the Project) Data from Appendix 218 of PMV Response 2016-03-02
352 Sensitivity and vulnerability analyses Every ecosystem model is only one possible representation of the true ecosystem defined by the modelrsquos structure and the values chosen for its many parameters The key point is how well the model represents the real system how that fit can be measured and the sensitivity of model outputs to variability in the selected parameter values The ideal model should be robust to a wide range of uncertainties in the input data and parameters This robustness is determined by performing sensitivity analyses on the model to see how it responds to variations in the input parameters and determining to which input parameters the model is most sensitive
The vulnerability parameters determine the strength of the feeding interactions between functional groups They set the level of density dependence of each functional group Higher vulnerability settings provide greater top-down (predator) control whereas lower settings provide greater bottom-up (environmental) control29 Several publications have shown that EwE models are very sensitive to the vulnerability parameters and Christensen and Walters (2000) point out that a main pitfall of EwE is that ldquopredation vulnerabilities are often underestimated lessening the modelled impacts of predationrdquo It is usual practice to tune Ecopath models including the vulnerability parameters to time series data such as biomass using the temporal simulation model Ecosim However these data were not available for the RBT2 area so this robust method of fitting the model and estimating vulnerability parameters was not possible Instead a vulnerability setting of 2 was used as the default value for the key model runs which is ldquocommon practice when time series data are not available and estimates of vulnerability in the
29 PMV Response 2016-03-02 p 70 lines 1318-1323
Pacific Region Science Response Technical Review Assessing
Ecosystem Productivity Model of Roberts Bank
16
model cannot be maderdquo30 with sensitivity analyses run for a range of 15 to 3 This narrow range was criticized by DFOECCC in initial discussions about the model with the Proponent The Proponent subsequently reran the model with a larger range of vulnerabilities31 (11 to 10) and concluded this broader vulnerability range produced similar results for the productivity ratio with and without the Project to those in the original EIS and that the EIS was more likely to overestimate than underestimate potential project effects32 The data in Table 7 of the PMV Response33 did indicate changes in productivity ratios ranging from 0 to 50 of the defined key run (which used a vulnerability setting of 2) However the Proponent changed all vulnerability settings to the same value ie all were 2 or all were 10 etc In reality the vulnerability parameters resulting from Ecosim models that are fitted to data as described above vary by functional group which was not explored here Therefore although the results suggest that the original choice of 2 for the default key run seemed reasonable the potential effects of variability in vulnerability settings was not fully explored
Sensitivity analyses are usually based on the range of uncertainty estimated for input data and parameters often called the confidence limits around the model parameters The EwE framework integrates many different data sources and parameters including values from the literature It can therefore be difficult to identify ldquoreasonablerdquo confidence limits when derived from such diverse data sources Standard practice in Ecopath models has been to develop a pedigree for each parameter with default values for uncertainty based on the nature of the source data For example parameter values based on high precision field observations of biomass within the model domain receive default confidence intervals of 10 whereas parameter values based on models developed for elsewhere or professional judgment receive confidence intervals of 8034 Sensitivity analyses are then run using parameter values selected from within these confidence intervals However if these default confidence intervals do not capture the full range of variability then the outputs are not informative of the variability in the lsquorealrsquo ecosystem Field observations were collected for many functional groups within the model domain in 2012 and 2013 as part of studies to support the RBT2 EIS Apparently the purpose of these observations was to document spatial variability (in part for the Ecospace model) and temporal variability (measurements at one location over time) and not to derive confidence intervals around the observations35
The reliance on the pedigree approach to derive confidence intervals for this Roberts Bank model was criticized by DFO ECCC and NRCan in discussions with the Proponent As a result the Proponent reran the model with much larger confidence intervals ranging from 30 to 100 depending on the input parameter and functional group36 The results from this new analysis using the broader confidence intervals were similar to those using the original pedigree approach The Proponent noted that ldquoWhile the production within each helliprun was very different there was little difference in the biomass ratio [with and without the Project] These results further demonstrate that even with a greater range in input values the influence of the Project on the Roberts Bank ecosystem is consistent among allhellipmodel runsrdquo37 This provides confidence that the model may be robust to uncertainty in its input parameters Two concerns
30 PMV Response 2016-03-02 p 70 lines 1321-1322 31 PMV Response 2016-03-02 p 71-74 32 PMV Response 2016-03-02 p 71 lines 1339-1341 33 PMV Response 2016-03-02 p 73 34 EIS Appendix 10-C Section 251 page 18 35 PMV Response 2016-03-02 p 42 lines 772-777 36 PMV Response 2016-03-02 p 44-47 37 PMV Response 2016-03-02 p 47 lines 855-858 and see also PMV Response 2016-03-02 Appendix 27-B
Pacific Region Science Response Technical Review Assessing
Ecosystem Productivity Model of Roberts Bank
17
remain however The quote above indicates that the production among the different model runs was very different although with little difference in the biomass ratios with and without the Project Since biomass is not the same as production it would be informative for understanding model performance and potential impacts to show these production differences This also relates to the point made in Section 34 regarding how well the model represents the real ecosystem and not just within-model comparisons with and without the Project The second question is more technical and relates to how the randomization (Monte Carlo or MC) routine that was used to create multiple model runs used the uncertainty about the diet data Diets are not currently included in the MC routine available to regular users of the Ecosim model how they were handled in this RBT2 model appears not to be explained
Finally the sensitivity analyses indicate that the uncertainty in the input parameters does not lead to much difference between model parameters with or without the project However this conclusion does not describe how the uncertainty in the input parameters affects understanding of the ecosystem
40 Conclusions Overall the main conclusion of the Environmental Impact Statement from the Proponent is stated as ldquohellipafter the implementation of mitigation hellipthe Project is not expected to result in any significant adverse effects on any of the 16 valued componentsrdquo38 In addition ldquohellipapproximately 40 of the functional groups are forecast to change no more than 5 which hellip is judged to be within the uncertainty of the model runsrdquo39 although larger changes were forecast for orange sea pens freshwater biofilm green algae and raptors The conclusions from the modelling studies are that ldquohellipthe proposed project will have an impact on the study area that the effect varies between species and that the findings are robust to parameter uncertaintyrdquo40 Specific outcomes by valued component as derived from the EwE model are presented by functional groups in Table 1
38 PMV March 2015 Roberts Bank Environmental Impact Statement Executive Summary ndash Part 1 page 37 39 EIS Appendix 10-C p ii 40 EIS Appendix 10-D p iv
Pacific Region Science Response Technical Review Assessing
Ecosystem Productivity Model of Roberts Bank
18
Table 1 Changes in productive potential with the Project as derived from the EwE model
Changes in productive potential
Ecosystem category
Number of valued
components
Number with potential
biomass loss
Moderate decrease (31-60 decline)
Minor decrease (6-30 decline)
Negligible (0-5
change)
Minor increase (6-
30 increase)
Moderate increase (31-60 increase)
Source
Marine vegetation
7 7 - 3 2 2 - EIS Vol 3 Section 11 Table 11-17 page 11-65
Marine invertebrates
4 3 1 1 1 1 - EIS Vol 3 Section 12 Table 12-8 page 12-52
Marine fish 13 13 - 2 6 5 - EIS Vol 3 Section 13 Table 13-10 page 13-95
Coastal birds
11 8 - 3 4 3 1 EIS Vol 3 Section 15 Table 15-10 page 15-67
Pacific Region Science Response Technical Review Assessing
Ecosystem Productivity Model of Roberts Bank
19
Most functional groups showed some potential biomass loss with the Project with biomass loss defined as any model run with negative outcomes (ie in which biomass with the project was less than biomass without the Project) The summary of changes in productivity potential are mixed with most (33 out of 35) valued components showing minor decreases to minor increases (defined as 6 to 30 changes in productive potential with the Project compared to without the Project)
The main conclusions of this review in regards to the Terms of Reference are
1 Do the functional groups and abiotic variables used in the model adequately represent the ecosystem at Roberts Bank
o The 58 functional groups and abiotic variables used in the model adequately represent the main components of the Roberts Bank ecosystem however for longer lived species the life stages of the species are not well represented and some of the impacts of the Project may be expected to affect specific life stages
o The abiotic variables adequately represent the physical drivers of this ecosystem on an annual time scale However annual values for these abiotic variables may not adequately capture important sub-annual events such as storms (DFO 2016) the timing of arrival and departure of highly migratory species and whether there may be important sub-annual thresholds or mismatches in timing as a result of the Project
o Biotic factors (eg nutrients) which are particularly important for biofilm and other lower trophic level taxa are not included in this model The model is therefore unable to assess the potential development of eutrophication and benthic organic enrichment events which may affect fish habitats in the study area
2 Are the parameter estimates used by the model valid and defensible for this system
o In general parameter estimates appear to be adequate for this system Field studies were done in two years to provide data in particular on distributions of selected functional groups for the Ecospace module Note the distribution studies focussed on taxa which were relatively immobile and therefore lsquofixedrsquo in space
o the selection of some model parameters would benefit from further explanation for example the choice of fixed diet matrices versus dynamic matrices which can vary with changes in abundances or predators and prey
o the selection of some model parameters would benefit from further explanation for example the link between the diets described in the text of Appendix 10B and the quantities presented in Appendix A of Appendix 10B It is understood that proportions were derived using the ldquofixed selectivityrdquo principle but in order to be fully transparent the derivation of each diet should be provided in an appendix
o discussion and explanation is needed of why ecotrophic efficiencies differ from expected values (eg the ecotrophic efficiency for Pacific herring is listed as 038) and
o the abiotic factor lsquosubstratersquo was limited to ldquohardrdquo or rdquosoftrdquo options which can be restrictive given that they serve as endpoints on a substrate composition continuum These limited options may not provide the sensitivity required to assess substrate preference nor the flexibility for taxa (eg motile organisms) that span hard mixed and soft substrate types In addition it is not clear if changes in the hardsoft categories were considered over time within identified depositional or erosional settings before and after construction
Pacific Region Science Response Technical Review Assessing
Ecosystem Productivity Model of Roberts Bank
20
3 Are the limitations and uncertainties of the model identified and appropriately considered when determining the modelrsquos representation of current and possible future conditions
o the EwE model was not designed to evaluate a range of future conditions It was designed to estimate changes in the productive potential at the ecosystem level with and without the Project Therefore the model was run without the Project and with the Project for a range of plausible abiotic conditions and the results were compared with respect to biomass and productivity by functional group
o the pedigree approach to assessing the uncertainties of model outcomes is unsatisfactory for the purpose here as it relates solely to a qualitative judgment of the value of data based on its source However when the model was rerun with much wider ranges of confidence intervals (uncertainties) the results in general (but not necessarily for each functional group) were similar to the results using the original pedigree approach This suggests that taken overall the model may be robust to wide ranges of uncertainty in these input variables and parameters
o there is inadequate validation of the model This is inadequate for three reasons
(i) the basic Ecopath model is not validated and the Ecospace balancing process (the spin-up period) resulted in some biomass estimates being increased or decreased beyond their confidence limits
(ii) the goodness of fit test used to evaluate how well the model predicted the spatial occurrence functional groups is not fit for purpose (Section 34) and
(iii) validation was provided for only a small number of functional groups (the habitat-forming functional groups) As a consequence the model is currently not validated
o Considering the proportion of open boundaries relative to closed boundaries in the model processes taking place outside the modelled ecosystem are likely to contribute to dynamics within the modelled ecosystem However these external processes may not be well-resolved by the EwE model as currently configured
4 Are the model results related to the potential effects of the Project on fish and fish habitat and migratory birds and their food resources valid and defensible
o this is a very complex ecosystem model constructed for a relatively small and open (in the sense of considerable exchange with adjacent non-modelled areas) system Many assumptions have been made based on poor or missing data Taking all these considerations into account the model does the best job possible of comparing the biomass and productivity of the Roberts Bank ecosystem with and without the Project
o the extent to which the model adequately represents the lsquorealrsquo ecosystem of Roberts Bank as opposed to comparisons of model results with and without the Project is unclear as a number of basic diagnostics are not presented (see point 3 above)
o the EwE model is not capable of and is not designed to represent nutritional and food quality variations in prey functional groups and how these may impact highly migratory predators such as birds with and without the Project
5 Is the EwE model framework a valid method to quantify large scale impacts to fish habitat fish productivity and migratory bird productivity
o the EwE model as implemented in this project and reviewed here is a useful first-order framework to organise information and derive initial estimates of how the system may respond to perturbations
Pacific Region Science Response Technical Review Assessing
Ecosystem Productivity Model of Roberts Bank
21
o the utility of a EWE model for impact purposes is highly dependent on the quality of input data
o each EwE model is highly dependent on local conditions Although appropriate as an overall methodology each application would need to be reviewed for how it may be applied to any new ecosystem and
o the EwE model would need to be substantially reformulated if it was to include considerations of changes in chemical composition or food quality of prey in particular for seasonal migratory species such as birds which may depend on very large biomasses of prey with specific chemical composition to fuel their migrations beyond the ecosystem model boundaries
Contributors Contributor Affiliation Ian Perry Author DFO Science Pacific Region Alida Bundy Author DFO Science Maritimes Region Terri Sutherland Author DFO Science Pacific Region Robert Elner Author ECCC Canadian Wildlife Service Andrew Robinson Author ECCC Canadian Wildlife Service Lesley MacDougall Editor DFO Science Pacific Region
Approved by Carmel Lowe
Regional Director Science Branch Pacific Region Fisheries and Oceans Canada
November 4 2016
Sources of Information Christensen V Coll M Steenbeek J Buszowski J Chagaris D walters CJ 2014
Representing variable habitat quality in a spatial food web model Ecosystems 17 1397-1412
Christensen V and Walters C 2000 Ecopath with Ecosim methods capabilities and limitations Ecological Modelling 172 109-139
Colleacuteter M Valls A Guitton J Gascuel D Pauly D and Christensen V 2015 Global overview of the applications of the Ecopath with Ecosim modeling approach using the EcoBase models repository Ecological Modelling 302 pp42-53
Compass Resource Management Ltd 2013 Roberts Bank Terminal 2 Technical Advisory Group (TAG) Process Report Productive Capacity ndash Final Report 119pp (Accessed November 1 2016)
DFO 2016 Technical Review of Roberts Bank Terminal 2 Environmental Assessment Section 95 ndash Coastal Geomorphology DFO Can Sci Advis Sec Sci Resp 2016045 (Accessed November 4 2016)
Pacific Region Science Response Technical Review Assessing
Ecosystem Productivity Model of Roberts Bank
22
ESSA Technologies 2014a Roberts Bank Terminal 2 Project Roberts Bank Delta BC Environmental Impact Statement Volume 3 Biophysical Effects Assessments Appendix 10-C Roberts Bank Ecosystem Model Development and Key Run Port Metro Vancouver (Accessed November 1 2016)
ESSA Technologies 2014b Roberts Bank Terminal 2 Project Roberts Bank Delta BC Environmental Impact Statement Volume 3 Biophysical Effects Assessments Appendix 10-D Roberts Bank Ecosystem Model Sensitivity Analyses Port Metro Vancouver (Accessed November 1 2016)
Franklin J 2009 Mapping Species Distributions Spatial Inference and Prediction Cambridge University Press Cambridge
Hemmera 2014 Roberts Bank Terminal 2 Project Roberts Bank Delta BC Environmental Impact Statement Volume 3 Biophysical Effects Assessments Appendix 10-B Roberts Bank Ecosystem Model Parameter Estimates Port Metro Vancouver File 302-03503 (Accessed November 1 2016)
Port Metro Vancouver 2015a Roberts Bank Terminal 2 Project Roberts Bank Delta BC Environmental Impact Statement Volume 3 Biophysical Effects Assessments Section 100 Biophysical Setting (Accessed November 1 2016)
Port Metro Vancouver 2015b Roberts Bank Terminal 2 Project Roberts Bank Delta BC Environmental Impact Statement Volume 3 Biophysical Effects Assessments Section 103 Overview of Assessing Ecosystem Productivity (Accessed November 1 2016)
Port Metro Vancouver 2015c Roberts Bank Terminal 2 Project Environmental Assessment Additional Information Requirements (July 31 2015) Responses Response to Information Request 6 IR-73115-06 Canadian Environmental Assessment Agency Reference Number 80054 dated 26 October 2015
Steenbeek J Coll M Gurney L Meacutelin F Hoepffner N Buszowski J and Christensen V 2013 Bridging the gap between ecosystem modeling tools and geographic information systems Driving a food web model with external spatialndashtemporal data Ecological Modelling 263 139ndash 151
Sutherland T Elner R and OrsquoNeill J 2013 Roberts Bank Ecological crucible of the Fraser River estuary Progress in Oceanography 115 171ndash180
Vancouver Fraser Port Authority 2016 From the Vancouver Fraser Port Authority to the Review Panel re Answers to preliminary technical questions submitted during the completeness phase from Fisheries and Oceans Canada Natural Resources Canada and Environment and Climate Change Canada concerning the ecosystem modelling to support the Roberts Bank Terminal 2 Project environmental review CEAR Document 547 (Accessed November 1 2016)
Pacific Region Science Response Technical Review Assessing
Ecosystem Productivity Model of Roberts Bank
23
This Report is Available from the Centre for Science Advice
Pacific Region Fisheries and Oceans Canada
3190 Hammond Bay Road Nanaimo BC V9T 6N7
Telephone (250) 756-7208 E-Mail csapdfo-mpogcca
Internet address wwwdfo-mpogccacsas-sccs
ISSN 1919-3769 copy Her Majesty the Queen in Right of Canada 2016
Correct Citation for this Publication
DFO 2016 Technical review of Roberts Bank Terminal 2 environmental assessment section 103 ndash assessing ecosystem productivity DFO Can Sci Advis Sec Sci Resp 2016050
Aussi disponible en franccedilais
MPO 2016 Examen technique de leacutevaluation environnementale du Terminal 2 agrave Roberts Bank section 103 ndash eacutevaluation de la productiviteacute de leacutecosystegraveme Secr can de consult sci du MPO Reacutep des Sci 2016050
- TECHNICAL REVIEW OF ROBERTS BANK TERMINAL 2 ENVIRONMENTAL ASSESSMENT SECTION 103 ndash ASSESSING ECOSYSTEM PRODUCTIVITY
-
- 10 Context
- 20 Background
-
- 21 Background and Terms of Reference
- 22 Approach to assessing ecosystem productivity
-
- 30 Analysis and Response
-
- 31 The EwE Team
- 32 Overview of assessment results of hydrological and sediment modelling
- 33 Model implementation
-
- 331 The purpose of the EwE model
- 332 Applicability of the EwE model framework to the Roberts Bank region
- 333 Model documentation
- 334 Highly mobile functional groups
- 335 Seasonality (model time step)
- 336 Life history structure
- 337 Model balancing
-
- 34 Model validation
- 35 Model results
-
- 351 Presentation of model results
- 352 Sensitivity and vulnerability analyses
-
- 40 Conclusions
- Contributors
- Approved by
- Sources of Information
- This Report is Available from the
-
- CSAS 2016-50 - Assessing Ecosystem Productivitypdf
-
- TECHNICAL REVIEW OF ROBERTS BANK TERMINAL 2 ENVIRONMENTAL ASSESSMENT SECTION 103 ndash ASSESSING ECOSYSTEM PRODUCTIVITY
-
- 10 Context
- 20 Background
-
- 21 Background and Terms of Reference
- 22 Approach to assessing ecosystem productivity
-
- 30 Analysis and Response
-
- 31 The EwE Team
- 32 Overview of assessment results of hydrological and sediment modelling
- 33 Model implementation
-
- 331 The purpose of the EwE model
- 332 Applicability of the EwE model framework to the Roberts Bank region
- 333 Model documentation
- 334 Highly mobile functional groups
- 335 Seasonality (model time step)
- 336 Life history structure
- 337 Model balancing
-
- 34 Model validation
- 35 Model results
-
- 351 Presentation of model results
- 352 Sensitivity and vulnerability analyses
-
- 40 Conclusions
- Contributors
- Approved by
- Sources of Information
- This Report is Available from the
-
Canadian Science Advisory Secretariat Pacific Region Science Response 2016050
December 2016
TECHNICAL REVIEW OF ROBERTS BANK TERMINAL 2 ENVIRONMENTAL ASSESSMENT SECTION 103 ndash
ASSESSING ECOSYSTEM PRODUCTIVITY
10 Context Vancouver Fraser Port Authority (VFPA) formerly Port Metro Vancouver (the Proponent) is proposing to construct and operate the Roberts Bank Terminal 2 Project (the Project) a new three-berth marine container terminal at Roberts Bank in Delta British Columbia The proposed terminal is located next to the existing Deltaport and Westshore Terminals In addition to the construction of the new terminal the Proponent has proposed to widen the north side of the existing Roberts Bank causeway from its east-end connection with the mainland to the entrance to the new terminal The existing tug basin connected to the northeast side of Deltaport Terminal is also proposed to be expanded The new marine terminal is predicted by the Proponent to process up to 260 container ship calls per year at full capacity with the assistance of two or three large berthing or escort tugs to manoeuver ships into or away from assigned berths The terminal is designed to operate 24 hours per day year-round
The Roberts Bank Terminal 2 Project is subject to an environmental assessment by a Review Panel pursuant to the Canadian Environmental Assessment Act 2012 As a federal authority in the environmental assessment for the Project Fisheries and Oceans Canada (DFO) will be asked to present information to the review panel and at public hearings in relation to its expertise on the effects of the Project on fish and fish habitat including aquatic species at risk and the adequacy of mitigation and offsetting measures and monitoring and follow-up programs proposed by the Proponent DFOrsquos Pacific Region Fisheries Protection Program (FPP) will coordinate DFOrsquos participation in the environmental assessment
The Proponent assessed future ecosystem productivity at Roberts Bank using the Ecopath with Ecosim and Ecospace (EwE) model framework The potential impacts of the Project to hydrodynamic conditions and sediment transport in the area as a result of changes in wind wave and current patterns and intensities are projected using different model frameworks A companion Science Response (DFO 2016) has been developed by DFO and Natural Resource Canada (NRCan) to review Section 95 ldquoCoastal Geomorphologyrdquo of the Environmental Impact Statement (EIS) which describes the hydrodynamic and sedimentology models that were used to evaluate the effect of the Project on water and sediment movements
Outcomes of the EwE models are incorporated into the analysis of the potential project-related effects on the ongoing productivity of commercial recreational and Aboriginal fisheries Consequently DFO FPP has requested that DFO Science Branch provide an evaluation of the Proponentrsquos characterization of project-related effects as conducted using the Ecopath with Ecosim and Ecospace (EwE) ecosystem model
Pacific Region Science Response Technical Review Assessing
Ecosystem Productivity Model of Roberts Bank
2
The objectives for this Science Response are to
1 Determine if the functional groups and abiotic factors used in the model adequately represent the ecosystem at Roberts Bank
2 Assess whether the parameter estimates used by the model are valid and defensible for this system
3 Assess whether the limitations and uncertainties of the model are identified and appropriately considered when determining the modelrsquos representation of current and possible future conditions
4 Provide advice regarding whether the model results related to the potential effects of the Project on fish and fish habitat and migratory birds and their food resources are valid and defensible
5 If possible provide advice regarding the validity of using the EwE model framework to quantify large scale impacts to fish habitat and fisheries productivity and the productivity of migratory birds
This Science Response evaluates Section 100 ldquoBiophysical Settingrdquo with a focus on Section 103 ldquoOverview of Assessing Ecosystem Productivityrdquo in the EIS as submitted by the Proponent (Port Metro Vancouver 2015) This Section and consequently this Response describes the ecosystem modelling approach that was taken to evaluate the direct and indirect effects of the footprint of the proposed terminal and widened causeway herein referred to as lsquothe Projectrsquo This ecosystem model provides outputs related to potential effects of the project on the study area at an ecosystem level including aquatic species and bird species in the Project area Evaluation of the model and its outputs therefore required expertise in both fishery aquatic species and migratory bird species Consequently this Science Response is the product of a joint review between DFO and Environment and Climate Change Canada (ECCC) Canadian Wildlife Service and Wildlife and Landscape Science to provide a complete evaluation
This Science Response Report results from the Science Response Process of July 2016 on the Technical Review of Ecopath with Ecosim and Ecospace (EwE) Ecosystem Productivity Model application to the Roberts Bank Terminal 2 Environmental Assessment
20 Background
21 Background and Terms of Reference The Projectrsquos main components have a proposed combined marine footprint area of approximately 179 km2 listed below by specific component
bull Marine Terminal 1335 km 2 including terminal (116 km 2) and dredged berth pocket and marine approach areas (0174 km 2)
bull Widened Causeway 0424 km 2
bull Expanded Tug basin 0031 km 2
Roberts Bank in the Fraser River estuary consists of complex intertidal and subtidal habitats including intertidal eelgrass beds and is an important stopover area for migrating shorebirds and productive feeding and rearing habitats for many fish and invertebrate species It also provides habitat for endangered Southern Resident Killer Whales and other marine mammals
Pacific Region Science Response Technical Review Assessing
Ecosystem Productivity Model of Roberts Bank
3
The environmental conditions at Roberts Bank are dynamic and are influenced by a variety of oceanographic and atmospheric factors including the Fraser River freshwater and sediment plume discharge diurnal tidal currents and prevailing and storm-generated wind and wave activity In addition the intercauseway region provides significant drainage from marsh and agricultural areas which have different characteristics from marine waters and which run along the ferry causeway
To provide the required science advice this Science Response focusses on Section 10 ldquoBiophysical Settingrdquo of the Environmental Impact Statement (EIS) (Port Metro Vancouver 2015a) specifically Section 103 ldquoOverview of Assessing Ecosystem Productivityrdquo (Port Metro Vancouver 2015b) and its related Appendices 10-B ldquoRoberts Bank Ecopath with Ecosim and Ecospace model parameter estimatesrdquo (Hemmera 2014) Appendix 10-C ldquoRoberts Bank Ecosystem model development and key runsrdquo(ESSA Technologies 2014a) and Appendix 10-D ldquoRoberts Bank Ecosystem model sensitivity analysesrdquo (ESSA Technologies 2014b) Additional important information was obtained from the Response to Information Request 6 (IR-73115-06 Canadian Environmental Assessment Agency Reference Number 80054 dated 26 October 2015) (Port Metro Vancouver 2015c) and the Written Responses to Coastal Geomorphology and Ecosystem Modelling Questions provided by the Proponent to DFO ECCC and NRCan on 2 March 2016 (Port Metro Vancouver (PMV) Transmittal TRE-01-RBT2-0004A subsequently referred in this Science Response as ldquoPMV Response 2016-03-02rdquo) (Vancouver Fraser Port Authority 2016)
The process followed in preparing this Science Response involved an initial review of the submitted EIS followed by an in-person meeting of the Proponent its contractors and representatives of DFO ECCC and NRCan to discuss and clarify questions arising from the initial review (Vancouver 23 November 2015) DFO and NRCan provided written questions to the Proponent based on preliminary review of the EIS on November 19 2015 ECCC also provided written questions based on its preliminary review of the EIS to the Proponent on December 1 2015 and January 20 2016 This large initial meeting was followed by smaller focussed meetings between the Proponent its contractors and DFO and NRCan on 11 December 2015 to clarify hydrology and sediment modelling questions with DFO on 8 January 2016 to clarify ecosystem modelling questions and with ECCC on 18 February 2016 to clarify questions relating to birds Written responses to all of these meetings and questions were provided by the Proponent to DFO ECCC and NRCan as the ldquoPMV Response 2016-03-02rdquo and ldquoPMV Response 2016-05-30rdquo (Vancouver Fraser Port Authority 2016) VFPArsquos answers to questions posed by DFO and NRCan regarding coastal geomorphology modelling have been posted to the Canadian Environmental Assessment Registry (CEAR)
22 Approach to assessing ecosystem productivity The Proponent adopted an ecosystem approach to evaluate the direct and indirect effects of the Project on the productivity of the Roberts Bank ecosystem A weight of evidence approach was used to assess the potential effects of the project on the productivity of the ecosystem and selected key components in the study area this approach included a spatial ecosystem simulation model (which included a habitat capacity model) a shorebird opportunity model and empirical data An important point is that any effects on the system during the construction phase or from expansion of the tug basin were excluded from this modelling process the focus instead being a comparison of modelled system productivity before and after the proposed terminal and expanded causeway is in place The chosen ecosystem simulation model was
Pacific Region Science Response Technical Review Assessing
Ecosystem Productivity Model of Roberts Bank
4
Ecopath with Ecosim and its spatial version Ecospace (collectively referred to here as the EwE framework or EwE model) This modelling approach was recommended by a prior Productive Capacity Technical Advisory Group comprised of representatives of technical experts from government agencies academia non-governmental organizations Vancouver Fraser Port Authority and its consultants (Compass 2013) convened by the Proponent and which also recommended a selection of focal species for the model The final selection of functional groups and the resulting food web that form the core of this ecosystem model are shown in Figure 1
Pacific Region Science Response Technical Review Assessing
Ecosystem Productivity Model of Roberts Bank
5
Figure 1 Ecopath with Ecosim model food web for Roberts Bank (Adapted from EIS Volume 3 Section 10 Fig 1033 on page 10-16) The groups coloured in orange represent focal groups size of symbols represents relative annual amount of biomass in the Roberts Bank study area
Pacific Region Science Response Technical Review Assessing
Ecosystem Productivity Model of Roberts Bank
6
The EwE framework is a common approach to ecosystem modelling which has been developed and expanded over the past two to three decades It currently has three main components
1 Ecopath ndash the core model which provides a mass-balance snapshot of the system
2 Ecosim ndash a module that enables simulation modelling over time
3 Ecospace ndash a module that enables simulation modelling over space
In order to make an EwE model tractable species are aggregated into functional groups based on their similar ecological characteristics (habitat and prey preferences etc) the Roberts Bank models had 58 functional groups The first step (Ecopath) was to obtain input parameters representing biomass production consumption emigration and diet for each functional group These parameters were then tuned in an iterative process until the overall production and consumption was balanced (a mass-balance approach) resulting in a model food web with estimates of energy flow between functional groups (Fig 1)
In the second step Ecosim was combined with the spatial model Ecospace The abiotic variables selected in this EIS (depth salinity bottom current wave height sediment type) were used as external forcings to the Ecospace module These abiotic variables provided the physical forcings for the simulations without and with the Project Since time series data on the functional groups of the model were not available Ecospace was run until the model reached equilibrium using various assumptions of the value of the vulnerability parameter (see Section 352) In this EIS the selected time step was annual with all variables abiotic and biotic expressed as yearly averages As used in this EIS the Ecospace module included a habitat capacity model which estimated the distribution of functional groups based on their environmental preferences for each abiotic variable (depth salinity bottom current wave height) and for substrate type (sand mud etc) The model thus allocated the spatial distribution of functional groups over the model domain based on their environmental preferences and the distributions of these abiotic variables with and without the Project The selected spatial unit size (ldquopixelrdquo) for the Ecospace model was 100 m2 In essence an Ecopath model was constructed for each pixel with particular rules governing how the functional groups interacted and moved among these spatial units The Ecospace module was run until it approached equilibrium (20 model years) to establish the spatial patterns without the Project For the lsquowith the Projectrsquo simulations the model was run for an initial 10 years and then the spatial patterns of the abiotic variables with the project were added and the model run for an additional 10 years1 The model outputs predicted changes in the productive potential of the Roberts Bank ecosystem as a comparison (ratio) with and without the Project rather than an absolute biomass that would be lost or gained as a result of the Project
1 EIS Appendix 10-C p 26
Pacific Region Science Response Technical Review Assessing
Ecosystem Productivity Model of Roberts Bank
7
30 Analysis and Response To prepare this response the following sections of the EIS additional documents were reviewed
DocumentSection Title
EIS Section 10
Including appendices 10B 10C and 10D
(Port Metro Vancouver 2015a Hemmera 2014 ESSA Technologies 2014a ESSA Technologies 2014b)
Biophysical Setting
Appendix 10-B Roberts Bank Ecosystem Model Parameter Estimates Port Metro Vancouver File 302-03503
Appendix 10-C Roberts Bank Ecosystem Model Development and Key Run Port Metro Vancouver
Appendix 10-D Roberts Bank Ecosystem Model Sensitivity Analyses Port Metro Vancouver
CEAR document 547 (Including Appendices) ldquoPMV Response 2016-03-02rdquo and ldquoPMV Response 2016-05-30rdquo
(Vancouver Fraser Port Authority 2016)
Vancouver Fraser Port Authority to the Review Panel re Answers to preliminary technical questions submitted during the completeness phase from Fisheries and Oceans Canada Natural Resources Canada and Environment and Climate Change Canada concerning the ecosystem modelling to support the Roberts Bank Terminal 2 Project environmental review
31 The EwE Team Building this ecosystem model was a complex undertaking which required knowledge of the ecosystem to be modelled how to set initial parameter values determination of reasonable ranges of these parameters how to balance the model and how to recognize when the model outputs were unrealistic These tasks became even more complex when spatial model dynamics were involved such as with Ecospace The team engaged by the Proponent to conduct this ecosystem modelling for the Roberts Bank Terminal 2 (RBT2) EIS was led by scientists at the Institute for Oceans and Fisheries located at the University of British Columbia in Vancouver These scientists are global leaders of the EwE model framework having developed much of its current implementation and who continue to lead its elaborations and extensions Construction and running of the model for this specific ecosystem was done in collaboration with ESSA Technologies of Vancouver Parameter values for the ecosystem model were obtained in part from observational studies conducted in the area by Hemmera of Burnaby BC
32 Overview of assessment results of hydrological and sediment modelling Implementation of the ldquowith the Projectrdquo simulations of the ecosystem model was done by driving the model with the abiotic variables as they were projected to be distributed with the Project footprint In the context of this EIS specifying depth salinity bottom currents wave height and sediment type conditions without the Project and changes with the Project were achieved by construction of hydrodynamical and sediment transport models The outputs from these models in combination with the identified environment preferences for the various biological groups were then used as inputs to the Ecospace model to define the spatial
Pacific Region Science Response Technical Review Assessing
Ecosystem Productivity Model of Roberts Bank
8
distributions of these functional groups The implementation of these hydrological and sediment transport models in this EIS was reviewed by DFO and NRCan (DFO 2016) This review concluded that the implementation of these models for this EIS was adequate for average winter conditions but lacking in validation for summer conditions in particular with strong freshwater flows from the Fraser River Simulations of strong storm events and their impacts on wave conditions and sediment transport were also lacking The effect of wave action and current speeds on sediment transport is non-linear such that increasing winds over short periods of time can impact sediment transport processes bottom topography and water depths beyond that determined under average model conditions Overall the review concluded that a greater range of sensitivity analyses is required to have confidence in the model outputs under lsquonon-averagersquo conditions The implication of this conclusion for the present review of the EwE model is that the full range of variability of abiotic characteristics such as bottom topography bottom current and wave heights and how they may affect relevant functional groups in the model with the Project may not be adequately represented Sensitivity analyses were provided by varying the intensity of abiotic variables and by removing abiotic variables to assess their interactive effects In general the ecosystem model outputs were robust to these sensitivity analyses with most groups varying by less than 5 Larger changes however were observed for primary producer and bird groupings and for some fish groups when various abiotic variables were omitted2
33 Model implementation 331 The purpose of the EwE model
The EwE model was intended to provide one line of evidence to assess the potential impacts of the Project on the Roberts Bank ecosystem which would then be used with other lines of evidence to make the final assessment Specifically ldquohellip the objective of the RB [Roberts Bank] model was not to provide an assessment of Project impacts for each functional group at a fine temporal scale but to estimate changes in productive potential with and without the Project at the ecosystem levelrdquo3 In addition ldquohellipthe primary objective of the RB ecosystem model is to evaluate potential changes in productivity from such abiotic factors with and without the terminal and causewayrdquo4 Results are presented for the selected functional groups no results were presented on potential changes in ecosystem structure or function
332 Applicability of the EwE model framework to the Roberts Bank region EwE models work best when the exchanges within the system being modelled are greater than the exchanges between the modelled system and the lsquooutsidersquo world In practice this means that EwE models work best for larger systems with few external exchanges In a meta-analysis of 433 Ecopath models Colleacuteter et al (2015) concluded that ldquohellipin the last two decades the range of the models area has expanded toward very large areas and the median has shifted accordingly from about 1000 km2 in 1984ndash1993 to about 100000 km2 in 1994ndash2014rdquo The section of the Roberts Bank ecosystem that is included in the EwE model was comparatively small (5468 km2) and complex It is an intertidally-dominated environment that is subject to strong seasonal influences of both freshwater and marine exchanges across relatively large seaward and shoreward boundaries
2 EIS Appendix 10-D p ii - iii 3 PMV Response 2016-03-02 p 99 lines 1914-1917 4 PMV Response 2016-03-02 p 38 lines 689-691
Pacific Region Science Response Technical Review Assessing
Ecosystem Productivity Model of Roberts Bank
9
Processes taking place outside the modelled ecosystem will contribute to dynamics within the modelled ecosystem (eg lsquooutsidersquo food supporting predators which occur in the Roberts Bank ecosystem for only part of the year predators which may feed in the Roberts Bank ecosystem but export this energy when they migrate out of the region) but which may not be well-resolved by the EwE model The Proponent justifies the spatial scale because it was specifically chosen for the questions being asked in regard to assessing productivity changes and because the relative influences of external exchanges are assumed to be identical with and without the project In addition highly mobile species with broad prey bases were assumed in the model to be partially sustained by external energy from outside the model system5 The distributions of organisms may differ however with and without the project which may affect their interactions with areas outside of the modelled system and the use of diets from outside the modelled system may not reflect the impacts of the project Further clarification of how the EwE model captures the exchanges and interactions with adjacent ecosystems are needed For example it could be argued that an ecosystem which is open to frequent exchanges of water and organic matter from beyond its boundaries might be more robust to local disturbances such as the Project
There are some inconsistencies in the information and assumptions used for some of the taxa in this ecosystem model For Dungeness Crab the justification for estimating total adult biomass (including females) from the biomass of fished males is unclear In addition it is unclear if the slower growth of female crabs once they have reached sexual maturity in comparison with male crabs has been considered The diet matrix for spiny dogfish does not represent the actual diet well in particular of euphausiids herring and shrimp and there are more recent references for biomass estimates of spiny dogfish in the study area than what was used in the EIS
Fishing mortality was not included in the model under the assumption that this would not change with or without the project While this assumption may be true the model has been parameterized by ignoring a source of mortality that will influence total production In essence fishing removes biomass from the ecosystem with the result that less biomass will be available for higher trophic levels How this may impact the ecosystem with and without the Project is unclear but it could make noticeable differences if for example there were thresholds in the feeding responses by these higher trophic level species The Ecopath model that was used is relatively unconstrained since many ecological efficiencies are low even for forage species which would be expected to be higher It is not clear how many species are exploited or the levels of exploitation but even if this does not change with the Project these mortality rates should be included in the model in order to add realistic constraints to the exploited functional groups
333 Model documentation Based on questions from DFO ECCC and NRCan following their initial review of the EIS the Proponent provided written responses dated 2 March 2016 to clarify several of the steps in the model development and implementation However several questions remain including questions about the Ecospace module Ecospace has undergone several recent developments such as the inclusion of the spatial-temporal data layer framework (Steenbeek et al 2013) the habitat capacity model (Christensen et al 2014) and the Monte Carlo analysis including the diet matrix As yet there are few published studies using these latest Ecospace developments and their documentation and justification need to be improved in the EIS
5 PMV Response 2016-03-02 p 29 lines 446 - 464
Pacific Region Science Response Technical Review Assessing
Ecosystem Productivity Model of Roberts Bank
10
Questions also remain regarding how the Monte Carlo randomization routine treated diet data The report indicates that the Monte Carlo routine randomly selected input parameters from the input ranges and that only models that were balanced were used This suggests that a high proportion of models were not balanced and therefore were not used (for example the EIS indicates that about one out of 1000 sampled input parameters was balanced6) A table showing the minimum maximum mode average and median values from the Monte Carlo runs for all the parameters would enable an evaluation of how much variation was actually sampled by the balanced model runs This is recommended in the EwE user information ie ldquoUsers should check the range of the input parameters that were actually used in the trials in the output csv file (see below)rdquo7
In addition there are several issues with the documentation of the derivation of the parameters for the functional groups Such documentation should clearly outline how the input parameter was estimated and the range of uncertainty for that parameter For example the input biomass of pinnipeds was defined as 04 t km 2 derived from estimates of 034 for Harbour seals and two estimates for Steller sea lions (012 and 014 t km 2) No explanation was provided for how the overall estimated pinniped biomass of 04 t km 2 was determined The diet of Sand Lance was described in the EIS as consisting mostly of zooplankton8 whereas the diet table for the model runs9 included 20 macrofauna 10 green algae and 10 detritus It is unclear why these additional prey were included in the diet used for the model runs
334 Highly mobile functional groups This implementation of the EwE framework included transient and migratory functional groups This is entirely appropriate and these groups cannot be excluded The approach taken in the Ecospace module was to impose a low (and conservative) dispersal rate among model spatial units (lsquopixelsrsquo) of 1 km yr-1 This may be appropriate for low mobility benthic organisms but it likely underestimates the movements of many other functional groups The effects of using higher and perhaps functional-group-specific dispersal rates was not considered The Proponents argued that higher dispersal rates would reduce impacts since species can move away from less desirable areas more quickly for completeness these runs should be done and evaluated Mobile species will also bring energy (food) captured outside the system into the modelled ecosystem This process was included in the model with the use of a diet import factor reflecting the consumption of prey outside the modelled region with the assumption that groups with high import rates were unlikely to respond to local changes on Roberts Bank10 This assumption needs justification perhaps at the functional group level for example many species of highly migratory birds and Pacific salmon use the Roberts Bank ecosystem to obtain food to continue their migrations Although this food does not compose a large fraction of their annual consumption it can be critical to enable them to continue their migrations
The EwE model is not designed to capture differences in prey quality ie differences in essential fatty acid or nutrient ratios The same species of prey may have greater or lesser nutritional value to predators depending on the conditions under which they are growing and their seasonal variations This is a particular concern with the nutritional quality of the diatom-dominated biofilm Diatomaceous biofilm is important to the highly migratory Western Sandpiper (Calidris mauri) Despite its predictive merits in relation to other ecosystem
6 EIS Appendix 10D Section 24 p5 7 EwE Help file p 151 8 EIS Appendix 10B Section 4133 p 76 9 EIS Appendix A of Appendix 10B 10 PMV Response 2016-03-02 p 28 lines 429 - 436
Pacific Region Science Response Technical Review Assessing
Ecosystem Productivity Model of Roberts Bank
11
components the EwE model is not informative with respect to understanding the potential impacts of the Project on biofilm and the Western Sandpiper While this example is specific to seabirds the potential exists for differences in the quality of biofilm to also be an issue for copepods which feed on biofilm and consequently to juvenile salmon which feed on these copepods (eg Sutherland et al 2013)
The EwE model is also not designed to predict effects of the Project on water quality although the Proponent noted that ldquoOther abiotic factors not included were deemed to be representative of variables that were already included in the modelhelliprdquo11 The Project may cause changes in physical and water quality conditions whether in isolation or in combination which may impact the productivity or nutritional quality of key prey organisms for local and migratory species which will not be captured by the model The EwE model does not assess the production of key nutrients or the implications of changes in important physical and water quality parameters to biofilm community structure and hence to important migratory birds
The model does not include biotic factors for both pelagic and benthic environments to assess the potential development of eutrophication and benthic organic enrichment events respectively Organic and redox indicators traditional measures of environmental assessments that are used to determine changes in functional group responses were included in the recent Deltaport Third environmental assessment (ie Pelagic chlorophyll dissolved nutrients Benthic sediment carbonnitrogen content redox state [sulfide concentration]) Benthic anoxic events based on organic enrichment are known to be strong drivers of community composition and exclusion regardless of substrate type In the absence of biotic factors (eg organic particulates) the model has not considered the potential for benthic organic enrichment which coincides with siltation processes within the upper tidal flats The tidal flat corner bordered by the Delta-dyke and Deltaport causeway has served as a catchment area for Fraser River silt since the development of the original Deltaport causeway (Sutherland et al 2013) The proposed position of the new terminal placed at the seaward termination of the Deltaport causeway may produce a crescent-shaped feature in the wake of the Fraser River Plume This feature may provide a more efficient silt trap that will promote benthic organic enrichment This piece of the environmental assessment seems to be missing and is important for assessing fish habitat in this area
335 Seasonality (model time step) Input data to parameterize the model were available on a range of time scales from hourly (eg physical data on salinity and water flow) to annual (eg species biomass) The Proponents indicated12 that this is a strength of the EwE model although ultimately the model was run with an annual time step with all sub-annual values being averaged to annual values This method therefore did not incorporate important seasonal processes such as winter-summer differences in salinity and storm properties and the seasonal appearances of abundances of predators and prey such as migratory salmon and birds that are much larger than the annual average For example juvenile salmon migrate from the Fraser River and onto Roberts Bank in the spring before moving into deeper waters If these spring abundances are averaged over the entire year these average abundances would be 5-10 times lower than the actual abundances during the spring (ie averaging the biomass that occurs in two months over a 12 month period) Additionally this method did not capture the intensity of processes such as growth and predation which can be focused over periods of a few weeks to a few months There may be important threshold effects at particular times and places which may be missed when using an 11 EIS Section 10 p 10-11 12 PMV Response 2016-03-02 p 86 line 1655
Pacific Region Science Response Technical Review Assessing
Ecosystem Productivity Model of Roberts Bank
12
annual time step for the model The Ecospace module has a monthly time step13 and therefore it is feasible to run this module with a sub-annual time step For example the Proponents submit14 that there are inadequate data to model the potential effects of the Project on the timing of biofilm production which could have implications for the migratory dunlin and Western Sandpiper However this could be modelled in an exploratory way to determine hypotheses about which factors could affect the timing of production of biofilm and the potential impacts on these birds These issues are of major concern to ECCC
336 Life history structure The EwE model did not separate functional groups into life history stages (stanzas) yet for many functional groups the juvenile stages can have very different life history characteristics and habitats than the adults It is unclear in the description of the model how different life history structures were considered and whether for example there were enough juveniles to produce the adults The implications of not including early life stages should be explored at least qualitatively to identify which species might have life stages that may be more vulnerable to project effects
337 Model balancing Balancing an EwE model is the process by which parameters are adjusted so that there is sufficient production for consumption requirements ie there are sufficient prey for all predators Expert opinion was used to examine parameter values and to adjust for errors or inconsistencies in logic ldquoPMV is confident that since the approach taken to balance the model was based on best practices the steps are appropriaterdquo15 Adjustments to initial parameters to ensure an ecologically-feasible model are necessary and to be expected For a few functional groups however very large changes to initial parameter estimates (which were often not based on Roberts Bank specific data) were necessary for example to transient killer whales When such initial parameters were adjusted (often by substantial amounts) by expert opinion to balance the model the confidence intervals around these adjusted parameter values were not increased to reflect this added uncertainty (see for example PMV Response 2016-03-02 p 51 lines 955-956) When expert opinion was used to make very large changes to initial parameter values broader confidence intervals about these parameters should have been applied This does not appear to have been the case and as a consequence may cause the actual uncertainty of the model outputs to be underestimated
Another example is for the pinniped group in which 50 of the diet was assumed to come from outside the model area in order to balance the model The rationale provided was ldquoThe pinnipeds caused excessive predation mortalities on numerous fish functional groups The biomass of pinnipeds was an average for the Strait of Georgia which was likely too high for Roberts Bank Therefore it was assumed that pinnipeds extracted only half of their diet from the study areardquo16 It is unclear whether the sensitivity of the model to different percentages of diet allocation was explored
As noted above (332) the Ecopath model was relatively unconstrained and few adjustments to input parameters were required to balance the model This is unusual and the low ecotrophic efficiencies of several functional groups suggest that full accounting of energy flows may not have been achieved (an ecotrophic efficiency of 1 indicates that 100 of the production of that
13 EIS Appendix 10C Section 29 p24 14 EIS Appendix 10D Appendix C p72 15 PMV Response 2016-03-02 p 49 lines 910-912 16 EIS Appendix 10C Section 261 p 20
Pacific Region Science Response Technical Review Assessing
Ecosystem Productivity Model of Roberts Bank
13
particular group is being preyed upon or removed by fishing leaving no individuals to die of old age17) An ldquoexcessrdquo of individuals dying of old age ie ecotrophic efficiencies much less than 1 suggests a potentially large biomass that is not used by the ecosystem and instead is converted to detritus
34 Model validation Model validation is the process by which the model parameters variables and outputs are compared with those from the real ecosystem to ascertain how well the model represents the ecosystem It is an essential step in providing confidence that the projections from the model in this case with and without the Project have relevance to how the real ecosystem may be expected to function with and without the Project In practice validating complex ecosystem models is difficult considering the range of assumptions that must be made when building the model the limited available data and natural variability of the ecosystem at a variety of time and space scales
Many of the standard diagnostics for the Ecopath model have not been evaluated in the EIS The Proponent appears to have assumed that once the Ecopath model was balanced then it was valid and fit for purpose The Proponent should provide all the Ecopath estimates of vital rates including mortality rates As presented questions remain For example many Ecotrophic Efficiencies (which control the transfer of biomass from prey to predators) are less than 1 even for taxa which would be expected to be close to 1 such as carnivorous zooplankton The reason for Ecotrophic Efficiencies less than 1 were not discussed or explained in the EIS
Detailed diagnostics for the Ecospace model should also be presented in order to evaluate model performance In response to criticisms by DFO ECCC and NRCan in discussions with the Proponent the latter provided the biomass of the functional groups from the Ecopath model (before Ecospace) and the Ecospace model after the spin-up period (which involved adjusting the parameters from the Ecopath model to balance the 5468 separate cells of the Ecospace model)18 The Proponents argue that ldquoIt is important to note that changes in biomass values generated during the spin-up period are identical for both with and without Project scenarios and thus do not provide information on the potential Project-related effects on productivity19 However several changes to biomass result from the Ecospace balancing process (spin-up period) This is only given brief attention by the Proponent in its response to the DFO ECCC and NRCan questions An analysis of Table 620 revealed that the biomass of 9 functional groups was larger or smaller than the widest confidence limits allowed for each group21 This requires further discussion and justification
The Proponent used a goodness of fit measure to compare spatial distributions of model outputs with field observations They indicated that ldquono other EwE models were identified which use a goodness-of-fit measure Hence the RB model is potentially the first such EwE model where a goodness of fit measure has been appliedrdquo22 The chosen goodness of fit measure is the percent correct classification (PCC) method23 This method derives a test statistic based on the proportion of locations at which predicted occurrences from the model match observed
17 EIS Appendix 10-B p 11 18 PMV Response 2016-03-02 p 65-66 Table 6 19 PMV Response 2016-03-02 p 64 lines 1205-1207 20 PMV Response 2016-03-02 p 65-66 Table 6 21 PMV Response 2016-03-02 p 45 Table 3 22 PMV Response 2016-03-02 p 78 lines 1481-1483 23 PMV Response 2016-03-02 p 78 lines 1483-1484
Pacific Region Science Response Technical Review Assessing
Ecosystem Productivity Model of Roberts Bank
14
occurrences from data and similarly with predicted and observed absences The Proponent then calculated two additional accuracy of fit measures sensitivity (the model predicts a species to occur in an area where it is known to occur in reality) and specificity (the model predicts a species does not occur in an area it is known not to occur in reality)24 This analysis concluded that the model has high predictability for functional groups such as eelgrass and sea pens with relatively static distributions but lower predictability for functional groups which are more temporally and spatially dynamic such as biofilm and green algae25
There are two problems with this approach The first is that this goodness of fit comparison was done only for habitat-forming functional groups no discussion of how well this analysis applies to mobile functional groups was provided The second problem is that this method does not take into account situations (such as occurs in this study with several groups) in which species occur at only a few locations For example ldquohellipif the test data consist of 95 absences and 5 presences and this reflects the true prevalence of the species on the landscape (a realistic scenario for a rare species) a lsquonullrsquo model that predicted absence in all cases (eg no model at all) would be correct 95 of the timehellipldquo (Franklin 2009 p 151) This latter point is important here as these habitat functional groups (biofilm brown algae native eelgrass green algae Japanese eelgrass tidal marsh biomat and orange sea pens26) appear not to occur over most of the Project area (as portrayed by the model outputs presented in the distribution figures of PMV Response 2016-03-02 Appendix 218) It is therefore important that a robust evaluation of the performance of the Ecospace module is used with preferably more than one measure
In summary the starting point for this modelling analysis matters It is not just about a comparison between results with and without the Project The model has to be considered a sufficient representation of the ecosystem The Proponent has not yet sufficiently validated the model
35 Model results 351 Presentation of model results
As noted above (Section 331) the stated objective of the Roberts Bank ecosystem model was not to provide an assessment of Project impacts for each functional group at a fine temporal scale but to estimate changes in productive potential with and without the Project at the ecosystem level27 However results were presented as comparisons by speciesfunctional group with and without the Project and not as potential changes in total ecosystem productivity The revised figures for each functional group showing distributions without the Project with the Project and their difference indicated impacts were likely to be localized with overall impacts relatively small The range of biomass ratios with and without the Project was 045 ndash 189 with most values slightly less than 1 This is interpreted as indicating slight decreases in the capacity of the study area to support biomass and production with the Project for many functional groups28 (Figure 2)
24 PMV Response 2016-03-02 p 80 lines 1524-1527 25 PMV Response 2016-03-02 p 81 lines 1551-1559 26 PMV Response 2016-03-02 p 82 Table 8 27 PMV Response 2016-03-02 p 99 lines 1914-1917 28 PMV Response 2016-03-02 Appendix 218
Pacific Region Science Response Technical Review Assessing
Ecosystem Productivity Model of Roberts Bank
15
Biomass Ratio
Freq
uenc
y
04 07 10 13 16 19
05
1015
2025
30
Figure 2 Histogram of biomass ratios obtained by comparisons of model runs with and without the project (ie With Without) Values less than 1 indicate reductions in biomass with the Project compared against without the Project) Data from Appendix 218 of PMV Response 2016-03-02
352 Sensitivity and vulnerability analyses Every ecosystem model is only one possible representation of the true ecosystem defined by the modelrsquos structure and the values chosen for its many parameters The key point is how well the model represents the real system how that fit can be measured and the sensitivity of model outputs to variability in the selected parameter values The ideal model should be robust to a wide range of uncertainties in the input data and parameters This robustness is determined by performing sensitivity analyses on the model to see how it responds to variations in the input parameters and determining to which input parameters the model is most sensitive
The vulnerability parameters determine the strength of the feeding interactions between functional groups They set the level of density dependence of each functional group Higher vulnerability settings provide greater top-down (predator) control whereas lower settings provide greater bottom-up (environmental) control29 Several publications have shown that EwE models are very sensitive to the vulnerability parameters and Christensen and Walters (2000) point out that a main pitfall of EwE is that ldquopredation vulnerabilities are often underestimated lessening the modelled impacts of predationrdquo It is usual practice to tune Ecopath models including the vulnerability parameters to time series data such as biomass using the temporal simulation model Ecosim However these data were not available for the RBT2 area so this robust method of fitting the model and estimating vulnerability parameters was not possible Instead a vulnerability setting of 2 was used as the default value for the key model runs which is ldquocommon practice when time series data are not available and estimates of vulnerability in the
29 PMV Response 2016-03-02 p 70 lines 1318-1323
Pacific Region Science Response Technical Review Assessing
Ecosystem Productivity Model of Roberts Bank
16
model cannot be maderdquo30 with sensitivity analyses run for a range of 15 to 3 This narrow range was criticized by DFOECCC in initial discussions about the model with the Proponent The Proponent subsequently reran the model with a larger range of vulnerabilities31 (11 to 10) and concluded this broader vulnerability range produced similar results for the productivity ratio with and without the Project to those in the original EIS and that the EIS was more likely to overestimate than underestimate potential project effects32 The data in Table 7 of the PMV Response33 did indicate changes in productivity ratios ranging from 0 to 50 of the defined key run (which used a vulnerability setting of 2) However the Proponent changed all vulnerability settings to the same value ie all were 2 or all were 10 etc In reality the vulnerability parameters resulting from Ecosim models that are fitted to data as described above vary by functional group which was not explored here Therefore although the results suggest that the original choice of 2 for the default key run seemed reasonable the potential effects of variability in vulnerability settings was not fully explored
Sensitivity analyses are usually based on the range of uncertainty estimated for input data and parameters often called the confidence limits around the model parameters The EwE framework integrates many different data sources and parameters including values from the literature It can therefore be difficult to identify ldquoreasonablerdquo confidence limits when derived from such diverse data sources Standard practice in Ecopath models has been to develop a pedigree for each parameter with default values for uncertainty based on the nature of the source data For example parameter values based on high precision field observations of biomass within the model domain receive default confidence intervals of 10 whereas parameter values based on models developed for elsewhere or professional judgment receive confidence intervals of 8034 Sensitivity analyses are then run using parameter values selected from within these confidence intervals However if these default confidence intervals do not capture the full range of variability then the outputs are not informative of the variability in the lsquorealrsquo ecosystem Field observations were collected for many functional groups within the model domain in 2012 and 2013 as part of studies to support the RBT2 EIS Apparently the purpose of these observations was to document spatial variability (in part for the Ecospace model) and temporal variability (measurements at one location over time) and not to derive confidence intervals around the observations35
The reliance on the pedigree approach to derive confidence intervals for this Roberts Bank model was criticized by DFO ECCC and NRCan in discussions with the Proponent As a result the Proponent reran the model with much larger confidence intervals ranging from 30 to 100 depending on the input parameter and functional group36 The results from this new analysis using the broader confidence intervals were similar to those using the original pedigree approach The Proponent noted that ldquoWhile the production within each helliprun was very different there was little difference in the biomass ratio [with and without the Project] These results further demonstrate that even with a greater range in input values the influence of the Project on the Roberts Bank ecosystem is consistent among allhellipmodel runsrdquo37 This provides confidence that the model may be robust to uncertainty in its input parameters Two concerns
30 PMV Response 2016-03-02 p 70 lines 1321-1322 31 PMV Response 2016-03-02 p 71-74 32 PMV Response 2016-03-02 p 71 lines 1339-1341 33 PMV Response 2016-03-02 p 73 34 EIS Appendix 10-C Section 251 page 18 35 PMV Response 2016-03-02 p 42 lines 772-777 36 PMV Response 2016-03-02 p 44-47 37 PMV Response 2016-03-02 p 47 lines 855-858 and see also PMV Response 2016-03-02 Appendix 27-B
Pacific Region Science Response Technical Review Assessing
Ecosystem Productivity Model of Roberts Bank
17
remain however The quote above indicates that the production among the different model runs was very different although with little difference in the biomass ratios with and without the Project Since biomass is not the same as production it would be informative for understanding model performance and potential impacts to show these production differences This also relates to the point made in Section 34 regarding how well the model represents the real ecosystem and not just within-model comparisons with and without the Project The second question is more technical and relates to how the randomization (Monte Carlo or MC) routine that was used to create multiple model runs used the uncertainty about the diet data Diets are not currently included in the MC routine available to regular users of the Ecosim model how they were handled in this RBT2 model appears not to be explained
Finally the sensitivity analyses indicate that the uncertainty in the input parameters does not lead to much difference between model parameters with or without the project However this conclusion does not describe how the uncertainty in the input parameters affects understanding of the ecosystem
40 Conclusions Overall the main conclusion of the Environmental Impact Statement from the Proponent is stated as ldquohellipafter the implementation of mitigation hellipthe Project is not expected to result in any significant adverse effects on any of the 16 valued componentsrdquo38 In addition ldquohellipapproximately 40 of the functional groups are forecast to change no more than 5 which hellip is judged to be within the uncertainty of the model runsrdquo39 although larger changes were forecast for orange sea pens freshwater biofilm green algae and raptors The conclusions from the modelling studies are that ldquohellipthe proposed project will have an impact on the study area that the effect varies between species and that the findings are robust to parameter uncertaintyrdquo40 Specific outcomes by valued component as derived from the EwE model are presented by functional groups in Table 1
38 PMV March 2015 Roberts Bank Environmental Impact Statement Executive Summary ndash Part 1 page 37 39 EIS Appendix 10-C p ii 40 EIS Appendix 10-D p iv
Pacific Region Science Response Technical Review Assessing
Ecosystem Productivity Model of Roberts Bank
18
Table 1 Changes in productive potential with the Project as derived from the EwE model
Changes in productive potential
Ecosystem category
Number of valued
components
Number with potential
biomass loss
Moderate decrease (31-60 decline)
Minor decrease (6-30 decline)
Negligible (0-5
change)
Minor increase (6-
30 increase)
Moderate increase (31-60 increase)
Source
Marine vegetation
7 7 - 3 2 2 - EIS Vol 3 Section 11 Table 11-17 page 11-65
Marine invertebrates
4 3 1 1 1 1 - EIS Vol 3 Section 12 Table 12-8 page 12-52
Marine fish 13 13 - 2 6 5 - EIS Vol 3 Section 13 Table 13-10 page 13-95
Coastal birds
11 8 - 3 4 3 1 EIS Vol 3 Section 15 Table 15-10 page 15-67
Pacific Region Science Response Technical Review Assessing
Ecosystem Productivity Model of Roberts Bank
19
Most functional groups showed some potential biomass loss with the Project with biomass loss defined as any model run with negative outcomes (ie in which biomass with the project was less than biomass without the Project) The summary of changes in productivity potential are mixed with most (33 out of 35) valued components showing minor decreases to minor increases (defined as 6 to 30 changes in productive potential with the Project compared to without the Project)
The main conclusions of this review in regards to the Terms of Reference are
1 Do the functional groups and abiotic variables used in the model adequately represent the ecosystem at Roberts Bank
o The 58 functional groups and abiotic variables used in the model adequately represent the main components of the Roberts Bank ecosystem however for longer lived species the life stages of the species are not well represented and some of the impacts of the Project may be expected to affect specific life stages
o The abiotic variables adequately represent the physical drivers of this ecosystem on an annual time scale However annual values for these abiotic variables may not adequately capture important sub-annual events such as storms (DFO 2016) the timing of arrival and departure of highly migratory species and whether there may be important sub-annual thresholds or mismatches in timing as a result of the Project
o Biotic factors (eg nutrients) which are particularly important for biofilm and other lower trophic level taxa are not included in this model The model is therefore unable to assess the potential development of eutrophication and benthic organic enrichment events which may affect fish habitats in the study area
2 Are the parameter estimates used by the model valid and defensible for this system
o In general parameter estimates appear to be adequate for this system Field studies were done in two years to provide data in particular on distributions of selected functional groups for the Ecospace module Note the distribution studies focussed on taxa which were relatively immobile and therefore lsquofixedrsquo in space
o the selection of some model parameters would benefit from further explanation for example the choice of fixed diet matrices versus dynamic matrices which can vary with changes in abundances or predators and prey
o the selection of some model parameters would benefit from further explanation for example the link between the diets described in the text of Appendix 10B and the quantities presented in Appendix A of Appendix 10B It is understood that proportions were derived using the ldquofixed selectivityrdquo principle but in order to be fully transparent the derivation of each diet should be provided in an appendix
o discussion and explanation is needed of why ecotrophic efficiencies differ from expected values (eg the ecotrophic efficiency for Pacific herring is listed as 038) and
o the abiotic factor lsquosubstratersquo was limited to ldquohardrdquo or rdquosoftrdquo options which can be restrictive given that they serve as endpoints on a substrate composition continuum These limited options may not provide the sensitivity required to assess substrate preference nor the flexibility for taxa (eg motile organisms) that span hard mixed and soft substrate types In addition it is not clear if changes in the hardsoft categories were considered over time within identified depositional or erosional settings before and after construction
Pacific Region Science Response Technical Review Assessing
Ecosystem Productivity Model of Roberts Bank
20
3 Are the limitations and uncertainties of the model identified and appropriately considered when determining the modelrsquos representation of current and possible future conditions
o the EwE model was not designed to evaluate a range of future conditions It was designed to estimate changes in the productive potential at the ecosystem level with and without the Project Therefore the model was run without the Project and with the Project for a range of plausible abiotic conditions and the results were compared with respect to biomass and productivity by functional group
o the pedigree approach to assessing the uncertainties of model outcomes is unsatisfactory for the purpose here as it relates solely to a qualitative judgment of the value of data based on its source However when the model was rerun with much wider ranges of confidence intervals (uncertainties) the results in general (but not necessarily for each functional group) were similar to the results using the original pedigree approach This suggests that taken overall the model may be robust to wide ranges of uncertainty in these input variables and parameters
o there is inadequate validation of the model This is inadequate for three reasons
(i) the basic Ecopath model is not validated and the Ecospace balancing process (the spin-up period) resulted in some biomass estimates being increased or decreased beyond their confidence limits
(ii) the goodness of fit test used to evaluate how well the model predicted the spatial occurrence functional groups is not fit for purpose (Section 34) and
(iii) validation was provided for only a small number of functional groups (the habitat-forming functional groups) As a consequence the model is currently not validated
o Considering the proportion of open boundaries relative to closed boundaries in the model processes taking place outside the modelled ecosystem are likely to contribute to dynamics within the modelled ecosystem However these external processes may not be well-resolved by the EwE model as currently configured
4 Are the model results related to the potential effects of the Project on fish and fish habitat and migratory birds and their food resources valid and defensible
o this is a very complex ecosystem model constructed for a relatively small and open (in the sense of considerable exchange with adjacent non-modelled areas) system Many assumptions have been made based on poor or missing data Taking all these considerations into account the model does the best job possible of comparing the biomass and productivity of the Roberts Bank ecosystem with and without the Project
o the extent to which the model adequately represents the lsquorealrsquo ecosystem of Roberts Bank as opposed to comparisons of model results with and without the Project is unclear as a number of basic diagnostics are not presented (see point 3 above)
o the EwE model is not capable of and is not designed to represent nutritional and food quality variations in prey functional groups and how these may impact highly migratory predators such as birds with and without the Project
5 Is the EwE model framework a valid method to quantify large scale impacts to fish habitat fish productivity and migratory bird productivity
o the EwE model as implemented in this project and reviewed here is a useful first-order framework to organise information and derive initial estimates of how the system may respond to perturbations
Pacific Region Science Response Technical Review Assessing
Ecosystem Productivity Model of Roberts Bank
21
o the utility of a EWE model for impact purposes is highly dependent on the quality of input data
o each EwE model is highly dependent on local conditions Although appropriate as an overall methodology each application would need to be reviewed for how it may be applied to any new ecosystem and
o the EwE model would need to be substantially reformulated if it was to include considerations of changes in chemical composition or food quality of prey in particular for seasonal migratory species such as birds which may depend on very large biomasses of prey with specific chemical composition to fuel their migrations beyond the ecosystem model boundaries
Contributors Contributor Affiliation Ian Perry Author DFO Science Pacific Region Alida Bundy Author DFO Science Maritimes Region Terri Sutherland Author DFO Science Pacific Region Robert Elner Author ECCC Canadian Wildlife Service Andrew Robinson Author ECCC Canadian Wildlife Service Lesley MacDougall Editor DFO Science Pacific Region
Approved by Carmel Lowe
Regional Director Science Branch Pacific Region Fisheries and Oceans Canada
November 4 2016
Sources of Information Christensen V Coll M Steenbeek J Buszowski J Chagaris D walters CJ 2014
Representing variable habitat quality in a spatial food web model Ecosystems 17 1397-1412
Christensen V and Walters C 2000 Ecopath with Ecosim methods capabilities and limitations Ecological Modelling 172 109-139
Colleacuteter M Valls A Guitton J Gascuel D Pauly D and Christensen V 2015 Global overview of the applications of the Ecopath with Ecosim modeling approach using the EcoBase models repository Ecological Modelling 302 pp42-53
Compass Resource Management Ltd 2013 Roberts Bank Terminal 2 Technical Advisory Group (TAG) Process Report Productive Capacity ndash Final Report 119pp (Accessed November 1 2016)
DFO 2016 Technical Review of Roberts Bank Terminal 2 Environmental Assessment Section 95 ndash Coastal Geomorphology DFO Can Sci Advis Sec Sci Resp 2016045 (Accessed November 4 2016)
Pacific Region Science Response Technical Review Assessing
Ecosystem Productivity Model of Roberts Bank
22
ESSA Technologies 2014a Roberts Bank Terminal 2 Project Roberts Bank Delta BC Environmental Impact Statement Volume 3 Biophysical Effects Assessments Appendix 10-C Roberts Bank Ecosystem Model Development and Key Run Port Metro Vancouver (Accessed November 1 2016)
ESSA Technologies 2014b Roberts Bank Terminal 2 Project Roberts Bank Delta BC Environmental Impact Statement Volume 3 Biophysical Effects Assessments Appendix 10-D Roberts Bank Ecosystem Model Sensitivity Analyses Port Metro Vancouver (Accessed November 1 2016)
Franklin J 2009 Mapping Species Distributions Spatial Inference and Prediction Cambridge University Press Cambridge
Hemmera 2014 Roberts Bank Terminal 2 Project Roberts Bank Delta BC Environmental Impact Statement Volume 3 Biophysical Effects Assessments Appendix 10-B Roberts Bank Ecosystem Model Parameter Estimates Port Metro Vancouver File 302-03503 (Accessed November 1 2016)
Port Metro Vancouver 2015a Roberts Bank Terminal 2 Project Roberts Bank Delta BC Environmental Impact Statement Volume 3 Biophysical Effects Assessments Section 100 Biophysical Setting (Accessed November 1 2016)
Port Metro Vancouver 2015b Roberts Bank Terminal 2 Project Roberts Bank Delta BC Environmental Impact Statement Volume 3 Biophysical Effects Assessments Section 103 Overview of Assessing Ecosystem Productivity (Accessed November 1 2016)
Port Metro Vancouver 2015c Roberts Bank Terminal 2 Project Environmental Assessment Additional Information Requirements (July 31 2015) Responses Response to Information Request 6 IR-73115-06 Canadian Environmental Assessment Agency Reference Number 80054 dated 26 October 2015
Steenbeek J Coll M Gurney L Meacutelin F Hoepffner N Buszowski J and Christensen V 2013 Bridging the gap between ecosystem modeling tools and geographic information systems Driving a food web model with external spatialndashtemporal data Ecological Modelling 263 139ndash 151
Sutherland T Elner R and OrsquoNeill J 2013 Roberts Bank Ecological crucible of the Fraser River estuary Progress in Oceanography 115 171ndash180
Vancouver Fraser Port Authority 2016 From the Vancouver Fraser Port Authority to the Review Panel re Answers to preliminary technical questions submitted during the completeness phase from Fisheries and Oceans Canada Natural Resources Canada and Environment and Climate Change Canada concerning the ecosystem modelling to support the Roberts Bank Terminal 2 Project environmental review CEAR Document 547 (Accessed November 1 2016)
Pacific Region Science Response Technical Review Assessing
Ecosystem Productivity Model of Roberts Bank
23
This Report is Available from the Centre for Science Advice
Pacific Region Fisheries and Oceans Canada
3190 Hammond Bay Road Nanaimo BC V9T 6N7
Telephone (250) 756-7208 E-Mail csapdfo-mpogcca
Internet address wwwdfo-mpogccacsas-sccs
ISSN 1919-3769 copy Her Majesty the Queen in Right of Canada 2016
Correct Citation for this Publication
DFO 2016 Technical review of Roberts Bank Terminal 2 environmental assessment section 103 ndash assessing ecosystem productivity DFO Can Sci Advis Sec Sci Resp 2016050
Aussi disponible en franccedilais
MPO 2016 Examen technique de leacutevaluation environnementale du Terminal 2 agrave Roberts Bank section 103 ndash eacutevaluation de la productiviteacute de leacutecosystegraveme Secr can de consult sci du MPO Reacutep des Sci 2016050
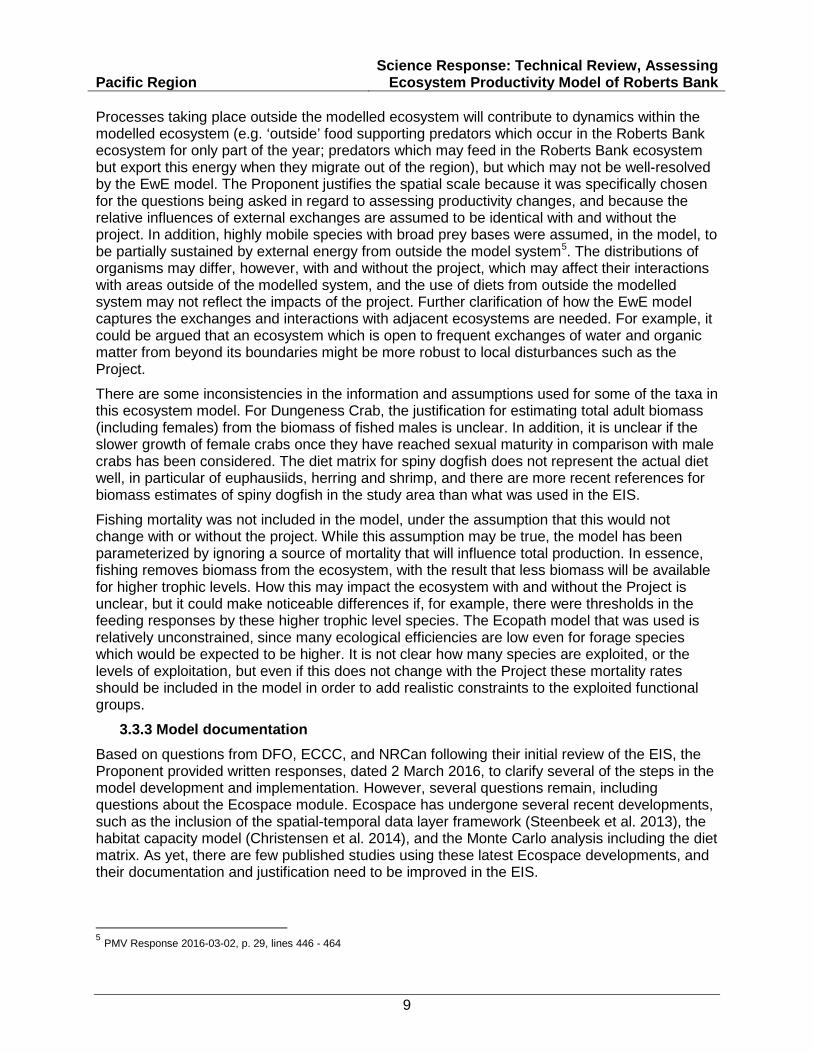
Pacific Region Science Response Technical Review Assessing
Ecosystem Productivity Model of Roberts Bank
9
Processes taking place outside the modelled ecosystem will contribute to dynamics within the modelled ecosystem (eg lsquooutsidersquo food supporting predators which occur in the Roberts Bank ecosystem for only part of the year predators which may feed in the Roberts Bank ecosystem but export this energy when they migrate out of the region) but which may not be well-resolved by the EwE model The Proponent justifies the spatial scale because it was specifically chosen for the questions being asked in regard to assessing productivity changes and because the relative influences of external exchanges are assumed to be identical with and without the project In addition highly mobile species with broad prey bases were assumed in the model to be partially sustained by external energy from outside the model system5 The distributions of organisms may differ however with and without the project which may affect their interactions with areas outside of the modelled system and the use of diets from outside the modelled system may not reflect the impacts of the project Further clarification of how the EwE model captures the exchanges and interactions with adjacent ecosystems are needed For example it could be argued that an ecosystem which is open to frequent exchanges of water and organic matter from beyond its boundaries might be more robust to local disturbances such as the Project
There are some inconsistencies in the information and assumptions used for some of the taxa in this ecosystem model For Dungeness Crab the justification for estimating total adult biomass (including females) from the biomass of fished males is unclear In addition it is unclear if the slower growth of female crabs once they have reached sexual maturity in comparison with male crabs has been considered The diet matrix for spiny dogfish does not represent the actual diet well in particular of euphausiids herring and shrimp and there are more recent references for biomass estimates of spiny dogfish in the study area than what was used in the EIS
Fishing mortality was not included in the model under the assumption that this would not change with or without the project While this assumption may be true the model has been parameterized by ignoring a source of mortality that will influence total production In essence fishing removes biomass from the ecosystem with the result that less biomass will be available for higher trophic levels How this may impact the ecosystem with and without the Project is unclear but it could make noticeable differences if for example there were thresholds in the feeding responses by these higher trophic level species The Ecopath model that was used is relatively unconstrained since many ecological efficiencies are low even for forage species which would be expected to be higher It is not clear how many species are exploited or the levels of exploitation but even if this does not change with the Project these mortality rates should be included in the model in order to add realistic constraints to the exploited functional groups
333 Model documentation Based on questions from DFO ECCC and NRCan following their initial review of the EIS the Proponent provided written responses dated 2 March 2016 to clarify several of the steps in the model development and implementation However several questions remain including questions about the Ecospace module Ecospace has undergone several recent developments such as the inclusion of the spatial-temporal data layer framework (Steenbeek et al 2013) the habitat capacity model (Christensen et al 2014) and the Monte Carlo analysis including the diet matrix As yet there are few published studies using these latest Ecospace developments and their documentation and justification need to be improved in the EIS
5 PMV Response 2016-03-02 p 29 lines 446 - 464
Pacific Region Science Response Technical Review Assessing
Ecosystem Productivity Model of Roberts Bank
10
Questions also remain regarding how the Monte Carlo randomization routine treated diet data The report indicates that the Monte Carlo routine randomly selected input parameters from the input ranges and that only models that were balanced were used This suggests that a high proportion of models were not balanced and therefore were not used (for example the EIS indicates that about one out of 1000 sampled input parameters was balanced6) A table showing the minimum maximum mode average and median values from the Monte Carlo runs for all the parameters would enable an evaluation of how much variation was actually sampled by the balanced model runs This is recommended in the EwE user information ie ldquoUsers should check the range of the input parameters that were actually used in the trials in the output csv file (see below)rdquo7
In addition there are several issues with the documentation of the derivation of the parameters for the functional groups Such documentation should clearly outline how the input parameter was estimated and the range of uncertainty for that parameter For example the input biomass of pinnipeds was defined as 04 t km 2 derived from estimates of 034 for Harbour seals and two estimates for Steller sea lions (012 and 014 t km 2) No explanation was provided for how the overall estimated pinniped biomass of 04 t km 2 was determined The diet of Sand Lance was described in the EIS as consisting mostly of zooplankton8 whereas the diet table for the model runs9 included 20 macrofauna 10 green algae and 10 detritus It is unclear why these additional prey were included in the diet used for the model runs
334 Highly mobile functional groups This implementation of the EwE framework included transient and migratory functional groups This is entirely appropriate and these groups cannot be excluded The approach taken in the Ecospace module was to impose a low (and conservative) dispersal rate among model spatial units (lsquopixelsrsquo) of 1 km yr-1 This may be appropriate for low mobility benthic organisms but it likely underestimates the movements of many other functional groups The effects of using higher and perhaps functional-group-specific dispersal rates was not considered The Proponents argued that higher dispersal rates would reduce impacts since species can move away from less desirable areas more quickly for completeness these runs should be done and evaluated Mobile species will also bring energy (food) captured outside the system into the modelled ecosystem This process was included in the model with the use of a diet import factor reflecting the consumption of prey outside the modelled region with the assumption that groups with high import rates were unlikely to respond to local changes on Roberts Bank10 This assumption needs justification perhaps at the functional group level for example many species of highly migratory birds and Pacific salmon use the Roberts Bank ecosystem to obtain food to continue their migrations Although this food does not compose a large fraction of their annual consumption it can be critical to enable them to continue their migrations
The EwE model is not designed to capture differences in prey quality ie differences in essential fatty acid or nutrient ratios The same species of prey may have greater or lesser nutritional value to predators depending on the conditions under which they are growing and their seasonal variations This is a particular concern with the nutritional quality of the diatom-dominated biofilm Diatomaceous biofilm is important to the highly migratory Western Sandpiper (Calidris mauri) Despite its predictive merits in relation to other ecosystem
6 EIS Appendix 10D Section 24 p5 7 EwE Help file p 151 8 EIS Appendix 10B Section 4133 p 76 9 EIS Appendix A of Appendix 10B 10 PMV Response 2016-03-02 p 28 lines 429 - 436
Pacific Region Science Response Technical Review Assessing
Ecosystem Productivity Model of Roberts Bank
11
components the EwE model is not informative with respect to understanding the potential impacts of the Project on biofilm and the Western Sandpiper While this example is specific to seabirds the potential exists for differences in the quality of biofilm to also be an issue for copepods which feed on biofilm and consequently to juvenile salmon which feed on these copepods (eg Sutherland et al 2013)
The EwE model is also not designed to predict effects of the Project on water quality although the Proponent noted that ldquoOther abiotic factors not included were deemed to be representative of variables that were already included in the modelhelliprdquo11 The Project may cause changes in physical and water quality conditions whether in isolation or in combination which may impact the productivity or nutritional quality of key prey organisms for local and migratory species which will not be captured by the model The EwE model does not assess the production of key nutrients or the implications of changes in important physical and water quality parameters to biofilm community structure and hence to important migratory birds
The model does not include biotic factors for both pelagic and benthic environments to assess the potential development of eutrophication and benthic organic enrichment events respectively Organic and redox indicators traditional measures of environmental assessments that are used to determine changes in functional group responses were included in the recent Deltaport Third environmental assessment (ie Pelagic chlorophyll dissolved nutrients Benthic sediment carbonnitrogen content redox state [sulfide concentration]) Benthic anoxic events based on organic enrichment are known to be strong drivers of community composition and exclusion regardless of substrate type In the absence of biotic factors (eg organic particulates) the model has not considered the potential for benthic organic enrichment which coincides with siltation processes within the upper tidal flats The tidal flat corner bordered by the Delta-dyke and Deltaport causeway has served as a catchment area for Fraser River silt since the development of the original Deltaport causeway (Sutherland et al 2013) The proposed position of the new terminal placed at the seaward termination of the Deltaport causeway may produce a crescent-shaped feature in the wake of the Fraser River Plume This feature may provide a more efficient silt trap that will promote benthic organic enrichment This piece of the environmental assessment seems to be missing and is important for assessing fish habitat in this area
335 Seasonality (model time step) Input data to parameterize the model were available on a range of time scales from hourly (eg physical data on salinity and water flow) to annual (eg species biomass) The Proponents indicated12 that this is a strength of the EwE model although ultimately the model was run with an annual time step with all sub-annual values being averaged to annual values This method therefore did not incorporate important seasonal processes such as winter-summer differences in salinity and storm properties and the seasonal appearances of abundances of predators and prey such as migratory salmon and birds that are much larger than the annual average For example juvenile salmon migrate from the Fraser River and onto Roberts Bank in the spring before moving into deeper waters If these spring abundances are averaged over the entire year these average abundances would be 5-10 times lower than the actual abundances during the spring (ie averaging the biomass that occurs in two months over a 12 month period) Additionally this method did not capture the intensity of processes such as growth and predation which can be focused over periods of a few weeks to a few months There may be important threshold effects at particular times and places which may be missed when using an 11 EIS Section 10 p 10-11 12 PMV Response 2016-03-02 p 86 line 1655
Pacific Region Science Response Technical Review Assessing
Ecosystem Productivity Model of Roberts Bank
12
annual time step for the model The Ecospace module has a monthly time step13 and therefore it is feasible to run this module with a sub-annual time step For example the Proponents submit14 that there are inadequate data to model the potential effects of the Project on the timing of biofilm production which could have implications for the migratory dunlin and Western Sandpiper However this could be modelled in an exploratory way to determine hypotheses about which factors could affect the timing of production of biofilm and the potential impacts on these birds These issues are of major concern to ECCC
336 Life history structure The EwE model did not separate functional groups into life history stages (stanzas) yet for many functional groups the juvenile stages can have very different life history characteristics and habitats than the adults It is unclear in the description of the model how different life history structures were considered and whether for example there were enough juveniles to produce the adults The implications of not including early life stages should be explored at least qualitatively to identify which species might have life stages that may be more vulnerable to project effects
337 Model balancing Balancing an EwE model is the process by which parameters are adjusted so that there is sufficient production for consumption requirements ie there are sufficient prey for all predators Expert opinion was used to examine parameter values and to adjust for errors or inconsistencies in logic ldquoPMV is confident that since the approach taken to balance the model was based on best practices the steps are appropriaterdquo15 Adjustments to initial parameters to ensure an ecologically-feasible model are necessary and to be expected For a few functional groups however very large changes to initial parameter estimates (which were often not based on Roberts Bank specific data) were necessary for example to transient killer whales When such initial parameters were adjusted (often by substantial amounts) by expert opinion to balance the model the confidence intervals around these adjusted parameter values were not increased to reflect this added uncertainty (see for example PMV Response 2016-03-02 p 51 lines 955-956) When expert opinion was used to make very large changes to initial parameter values broader confidence intervals about these parameters should have been applied This does not appear to have been the case and as a consequence may cause the actual uncertainty of the model outputs to be underestimated
Another example is for the pinniped group in which 50 of the diet was assumed to come from outside the model area in order to balance the model The rationale provided was ldquoThe pinnipeds caused excessive predation mortalities on numerous fish functional groups The biomass of pinnipeds was an average for the Strait of Georgia which was likely too high for Roberts Bank Therefore it was assumed that pinnipeds extracted only half of their diet from the study areardquo16 It is unclear whether the sensitivity of the model to different percentages of diet allocation was explored
As noted above (332) the Ecopath model was relatively unconstrained and few adjustments to input parameters were required to balance the model This is unusual and the low ecotrophic efficiencies of several functional groups suggest that full accounting of energy flows may not have been achieved (an ecotrophic efficiency of 1 indicates that 100 of the production of that
13 EIS Appendix 10C Section 29 p24 14 EIS Appendix 10D Appendix C p72 15 PMV Response 2016-03-02 p 49 lines 910-912 16 EIS Appendix 10C Section 261 p 20
Pacific Region Science Response Technical Review Assessing
Ecosystem Productivity Model of Roberts Bank
13
particular group is being preyed upon or removed by fishing leaving no individuals to die of old age17) An ldquoexcessrdquo of individuals dying of old age ie ecotrophic efficiencies much less than 1 suggests a potentially large biomass that is not used by the ecosystem and instead is converted to detritus
34 Model validation Model validation is the process by which the model parameters variables and outputs are compared with those from the real ecosystem to ascertain how well the model represents the ecosystem It is an essential step in providing confidence that the projections from the model in this case with and without the Project have relevance to how the real ecosystem may be expected to function with and without the Project In practice validating complex ecosystem models is difficult considering the range of assumptions that must be made when building the model the limited available data and natural variability of the ecosystem at a variety of time and space scales
Many of the standard diagnostics for the Ecopath model have not been evaluated in the EIS The Proponent appears to have assumed that once the Ecopath model was balanced then it was valid and fit for purpose The Proponent should provide all the Ecopath estimates of vital rates including mortality rates As presented questions remain For example many Ecotrophic Efficiencies (which control the transfer of biomass from prey to predators) are less than 1 even for taxa which would be expected to be close to 1 such as carnivorous zooplankton The reason for Ecotrophic Efficiencies less than 1 were not discussed or explained in the EIS
Detailed diagnostics for the Ecospace model should also be presented in order to evaluate model performance In response to criticisms by DFO ECCC and NRCan in discussions with the Proponent the latter provided the biomass of the functional groups from the Ecopath model (before Ecospace) and the Ecospace model after the spin-up period (which involved adjusting the parameters from the Ecopath model to balance the 5468 separate cells of the Ecospace model)18 The Proponents argue that ldquoIt is important to note that changes in biomass values generated during the spin-up period are identical for both with and without Project scenarios and thus do not provide information on the potential Project-related effects on productivity19 However several changes to biomass result from the Ecospace balancing process (spin-up period) This is only given brief attention by the Proponent in its response to the DFO ECCC and NRCan questions An analysis of Table 620 revealed that the biomass of 9 functional groups was larger or smaller than the widest confidence limits allowed for each group21 This requires further discussion and justification
The Proponent used a goodness of fit measure to compare spatial distributions of model outputs with field observations They indicated that ldquono other EwE models were identified which use a goodness-of-fit measure Hence the RB model is potentially the first such EwE model where a goodness of fit measure has been appliedrdquo22 The chosen goodness of fit measure is the percent correct classification (PCC) method23 This method derives a test statistic based on the proportion of locations at which predicted occurrences from the model match observed
17 EIS Appendix 10-B p 11 18 PMV Response 2016-03-02 p 65-66 Table 6 19 PMV Response 2016-03-02 p 64 lines 1205-1207 20 PMV Response 2016-03-02 p 65-66 Table 6 21 PMV Response 2016-03-02 p 45 Table 3 22 PMV Response 2016-03-02 p 78 lines 1481-1483 23 PMV Response 2016-03-02 p 78 lines 1483-1484
Pacific Region Science Response Technical Review Assessing
Ecosystem Productivity Model of Roberts Bank
14
occurrences from data and similarly with predicted and observed absences The Proponent then calculated two additional accuracy of fit measures sensitivity (the model predicts a species to occur in an area where it is known to occur in reality) and specificity (the model predicts a species does not occur in an area it is known not to occur in reality)24 This analysis concluded that the model has high predictability for functional groups such as eelgrass and sea pens with relatively static distributions but lower predictability for functional groups which are more temporally and spatially dynamic such as biofilm and green algae25
There are two problems with this approach The first is that this goodness of fit comparison was done only for habitat-forming functional groups no discussion of how well this analysis applies to mobile functional groups was provided The second problem is that this method does not take into account situations (such as occurs in this study with several groups) in which species occur at only a few locations For example ldquohellipif the test data consist of 95 absences and 5 presences and this reflects the true prevalence of the species on the landscape (a realistic scenario for a rare species) a lsquonullrsquo model that predicted absence in all cases (eg no model at all) would be correct 95 of the timehellipldquo (Franklin 2009 p 151) This latter point is important here as these habitat functional groups (biofilm brown algae native eelgrass green algae Japanese eelgrass tidal marsh biomat and orange sea pens26) appear not to occur over most of the Project area (as portrayed by the model outputs presented in the distribution figures of PMV Response 2016-03-02 Appendix 218) It is therefore important that a robust evaluation of the performance of the Ecospace module is used with preferably more than one measure
In summary the starting point for this modelling analysis matters It is not just about a comparison between results with and without the Project The model has to be considered a sufficient representation of the ecosystem The Proponent has not yet sufficiently validated the model
35 Model results 351 Presentation of model results
As noted above (Section 331) the stated objective of the Roberts Bank ecosystem model was not to provide an assessment of Project impacts for each functional group at a fine temporal scale but to estimate changes in productive potential with and without the Project at the ecosystem level27 However results were presented as comparisons by speciesfunctional group with and without the Project and not as potential changes in total ecosystem productivity The revised figures for each functional group showing distributions without the Project with the Project and their difference indicated impacts were likely to be localized with overall impacts relatively small The range of biomass ratios with and without the Project was 045 ndash 189 with most values slightly less than 1 This is interpreted as indicating slight decreases in the capacity of the study area to support biomass and production with the Project for many functional groups28 (Figure 2)
24 PMV Response 2016-03-02 p 80 lines 1524-1527 25 PMV Response 2016-03-02 p 81 lines 1551-1559 26 PMV Response 2016-03-02 p 82 Table 8 27 PMV Response 2016-03-02 p 99 lines 1914-1917 28 PMV Response 2016-03-02 Appendix 218
Pacific Region Science Response Technical Review Assessing
Ecosystem Productivity Model of Roberts Bank
15
Biomass Ratio
Freq
uenc
y
04 07 10 13 16 19
05
1015
2025
30
Figure 2 Histogram of biomass ratios obtained by comparisons of model runs with and without the project (ie With Without) Values less than 1 indicate reductions in biomass with the Project compared against without the Project) Data from Appendix 218 of PMV Response 2016-03-02
352 Sensitivity and vulnerability analyses Every ecosystem model is only one possible representation of the true ecosystem defined by the modelrsquos structure and the values chosen for its many parameters The key point is how well the model represents the real system how that fit can be measured and the sensitivity of model outputs to variability in the selected parameter values The ideal model should be robust to a wide range of uncertainties in the input data and parameters This robustness is determined by performing sensitivity analyses on the model to see how it responds to variations in the input parameters and determining to which input parameters the model is most sensitive
The vulnerability parameters determine the strength of the feeding interactions between functional groups They set the level of density dependence of each functional group Higher vulnerability settings provide greater top-down (predator) control whereas lower settings provide greater bottom-up (environmental) control29 Several publications have shown that EwE models are very sensitive to the vulnerability parameters and Christensen and Walters (2000) point out that a main pitfall of EwE is that ldquopredation vulnerabilities are often underestimated lessening the modelled impacts of predationrdquo It is usual practice to tune Ecopath models including the vulnerability parameters to time series data such as biomass using the temporal simulation model Ecosim However these data were not available for the RBT2 area so this robust method of fitting the model and estimating vulnerability parameters was not possible Instead a vulnerability setting of 2 was used as the default value for the key model runs which is ldquocommon practice when time series data are not available and estimates of vulnerability in the
29 PMV Response 2016-03-02 p 70 lines 1318-1323
Pacific Region Science Response Technical Review Assessing
Ecosystem Productivity Model of Roberts Bank
16
model cannot be maderdquo30 with sensitivity analyses run for a range of 15 to 3 This narrow range was criticized by DFOECCC in initial discussions about the model with the Proponent The Proponent subsequently reran the model with a larger range of vulnerabilities31 (11 to 10) and concluded this broader vulnerability range produced similar results for the productivity ratio with and without the Project to those in the original EIS and that the EIS was more likely to overestimate than underestimate potential project effects32 The data in Table 7 of the PMV Response33 did indicate changes in productivity ratios ranging from 0 to 50 of the defined key run (which used a vulnerability setting of 2) However the Proponent changed all vulnerability settings to the same value ie all were 2 or all were 10 etc In reality the vulnerability parameters resulting from Ecosim models that are fitted to data as described above vary by functional group which was not explored here Therefore although the results suggest that the original choice of 2 for the default key run seemed reasonable the potential effects of variability in vulnerability settings was not fully explored
Sensitivity analyses are usually based on the range of uncertainty estimated for input data and parameters often called the confidence limits around the model parameters The EwE framework integrates many different data sources and parameters including values from the literature It can therefore be difficult to identify ldquoreasonablerdquo confidence limits when derived from such diverse data sources Standard practice in Ecopath models has been to develop a pedigree for each parameter with default values for uncertainty based on the nature of the source data For example parameter values based on high precision field observations of biomass within the model domain receive default confidence intervals of 10 whereas parameter values based on models developed for elsewhere or professional judgment receive confidence intervals of 8034 Sensitivity analyses are then run using parameter values selected from within these confidence intervals However if these default confidence intervals do not capture the full range of variability then the outputs are not informative of the variability in the lsquorealrsquo ecosystem Field observations were collected for many functional groups within the model domain in 2012 and 2013 as part of studies to support the RBT2 EIS Apparently the purpose of these observations was to document spatial variability (in part for the Ecospace model) and temporal variability (measurements at one location over time) and not to derive confidence intervals around the observations35
The reliance on the pedigree approach to derive confidence intervals for this Roberts Bank model was criticized by DFO ECCC and NRCan in discussions with the Proponent As a result the Proponent reran the model with much larger confidence intervals ranging from 30 to 100 depending on the input parameter and functional group36 The results from this new analysis using the broader confidence intervals were similar to those using the original pedigree approach The Proponent noted that ldquoWhile the production within each helliprun was very different there was little difference in the biomass ratio [with and without the Project] These results further demonstrate that even with a greater range in input values the influence of the Project on the Roberts Bank ecosystem is consistent among allhellipmodel runsrdquo37 This provides confidence that the model may be robust to uncertainty in its input parameters Two concerns
30 PMV Response 2016-03-02 p 70 lines 1321-1322 31 PMV Response 2016-03-02 p 71-74 32 PMV Response 2016-03-02 p 71 lines 1339-1341 33 PMV Response 2016-03-02 p 73 34 EIS Appendix 10-C Section 251 page 18 35 PMV Response 2016-03-02 p 42 lines 772-777 36 PMV Response 2016-03-02 p 44-47 37 PMV Response 2016-03-02 p 47 lines 855-858 and see also PMV Response 2016-03-02 Appendix 27-B
Pacific Region Science Response Technical Review Assessing
Ecosystem Productivity Model of Roberts Bank
17
remain however The quote above indicates that the production among the different model runs was very different although with little difference in the biomass ratios with and without the Project Since biomass is not the same as production it would be informative for understanding model performance and potential impacts to show these production differences This also relates to the point made in Section 34 regarding how well the model represents the real ecosystem and not just within-model comparisons with and without the Project The second question is more technical and relates to how the randomization (Monte Carlo or MC) routine that was used to create multiple model runs used the uncertainty about the diet data Diets are not currently included in the MC routine available to regular users of the Ecosim model how they were handled in this RBT2 model appears not to be explained
Finally the sensitivity analyses indicate that the uncertainty in the input parameters does not lead to much difference between model parameters with or without the project However this conclusion does not describe how the uncertainty in the input parameters affects understanding of the ecosystem
40 Conclusions Overall the main conclusion of the Environmental Impact Statement from the Proponent is stated as ldquohellipafter the implementation of mitigation hellipthe Project is not expected to result in any significant adverse effects on any of the 16 valued componentsrdquo38 In addition ldquohellipapproximately 40 of the functional groups are forecast to change no more than 5 which hellip is judged to be within the uncertainty of the model runsrdquo39 although larger changes were forecast for orange sea pens freshwater biofilm green algae and raptors The conclusions from the modelling studies are that ldquohellipthe proposed project will have an impact on the study area that the effect varies between species and that the findings are robust to parameter uncertaintyrdquo40 Specific outcomes by valued component as derived from the EwE model are presented by functional groups in Table 1
38 PMV March 2015 Roberts Bank Environmental Impact Statement Executive Summary ndash Part 1 page 37 39 EIS Appendix 10-C p ii 40 EIS Appendix 10-D p iv
Pacific Region Science Response Technical Review Assessing
Ecosystem Productivity Model of Roberts Bank
18
Table 1 Changes in productive potential with the Project as derived from the EwE model
Changes in productive potential
Ecosystem category
Number of valued
components
Number with potential
biomass loss
Moderate decrease (31-60 decline)
Minor decrease (6-30 decline)
Negligible (0-5
change)
Minor increase (6-
30 increase)
Moderate increase (31-60 increase)
Source
Marine vegetation
7 7 - 3 2 2 - EIS Vol 3 Section 11 Table 11-17 page 11-65
Marine invertebrates
4 3 1 1 1 1 - EIS Vol 3 Section 12 Table 12-8 page 12-52
Marine fish 13 13 - 2 6 5 - EIS Vol 3 Section 13 Table 13-10 page 13-95
Coastal birds
11 8 - 3 4 3 1 EIS Vol 3 Section 15 Table 15-10 page 15-67
Pacific Region Science Response Technical Review Assessing
Ecosystem Productivity Model of Roberts Bank
19
Most functional groups showed some potential biomass loss with the Project with biomass loss defined as any model run with negative outcomes (ie in which biomass with the project was less than biomass without the Project) The summary of changes in productivity potential are mixed with most (33 out of 35) valued components showing minor decreases to minor increases (defined as 6 to 30 changes in productive potential with the Project compared to without the Project)
The main conclusions of this review in regards to the Terms of Reference are
1 Do the functional groups and abiotic variables used in the model adequately represent the ecosystem at Roberts Bank
o The 58 functional groups and abiotic variables used in the model adequately represent the main components of the Roberts Bank ecosystem however for longer lived species the life stages of the species are not well represented and some of the impacts of the Project may be expected to affect specific life stages
o The abiotic variables adequately represent the physical drivers of this ecosystem on an annual time scale However annual values for these abiotic variables may not adequately capture important sub-annual events such as storms (DFO 2016) the timing of arrival and departure of highly migratory species and whether there may be important sub-annual thresholds or mismatches in timing as a result of the Project
o Biotic factors (eg nutrients) which are particularly important for biofilm and other lower trophic level taxa are not included in this model The model is therefore unable to assess the potential development of eutrophication and benthic organic enrichment events which may affect fish habitats in the study area
2 Are the parameter estimates used by the model valid and defensible for this system
o In general parameter estimates appear to be adequate for this system Field studies were done in two years to provide data in particular on distributions of selected functional groups for the Ecospace module Note the distribution studies focussed on taxa which were relatively immobile and therefore lsquofixedrsquo in space
o the selection of some model parameters would benefit from further explanation for example the choice of fixed diet matrices versus dynamic matrices which can vary with changes in abundances or predators and prey
o the selection of some model parameters would benefit from further explanation for example the link between the diets described in the text of Appendix 10B and the quantities presented in Appendix A of Appendix 10B It is understood that proportions were derived using the ldquofixed selectivityrdquo principle but in order to be fully transparent the derivation of each diet should be provided in an appendix
o discussion and explanation is needed of why ecotrophic efficiencies differ from expected values (eg the ecotrophic efficiency for Pacific herring is listed as 038) and
o the abiotic factor lsquosubstratersquo was limited to ldquohardrdquo or rdquosoftrdquo options which can be restrictive given that they serve as endpoints on a substrate composition continuum These limited options may not provide the sensitivity required to assess substrate preference nor the flexibility for taxa (eg motile organisms) that span hard mixed and soft substrate types In addition it is not clear if changes in the hardsoft categories were considered over time within identified depositional or erosional settings before and after construction
Pacific Region Science Response Technical Review Assessing
Ecosystem Productivity Model of Roberts Bank
20
3 Are the limitations and uncertainties of the model identified and appropriately considered when determining the modelrsquos representation of current and possible future conditions
o the EwE model was not designed to evaluate a range of future conditions It was designed to estimate changes in the productive potential at the ecosystem level with and without the Project Therefore the model was run without the Project and with the Project for a range of plausible abiotic conditions and the results were compared with respect to biomass and productivity by functional group
o the pedigree approach to assessing the uncertainties of model outcomes is unsatisfactory for the purpose here as it relates solely to a qualitative judgment of the value of data based on its source However when the model was rerun with much wider ranges of confidence intervals (uncertainties) the results in general (but not necessarily for each functional group) were similar to the results using the original pedigree approach This suggests that taken overall the model may be robust to wide ranges of uncertainty in these input variables and parameters
o there is inadequate validation of the model This is inadequate for three reasons
(i) the basic Ecopath model is not validated and the Ecospace balancing process (the spin-up period) resulted in some biomass estimates being increased or decreased beyond their confidence limits
(ii) the goodness of fit test used to evaluate how well the model predicted the spatial occurrence functional groups is not fit for purpose (Section 34) and
(iii) validation was provided for only a small number of functional groups (the habitat-forming functional groups) As a consequence the model is currently not validated
o Considering the proportion of open boundaries relative to closed boundaries in the model processes taking place outside the modelled ecosystem are likely to contribute to dynamics within the modelled ecosystem However these external processes may not be well-resolved by the EwE model as currently configured
4 Are the model results related to the potential effects of the Project on fish and fish habitat and migratory birds and their food resources valid and defensible
o this is a very complex ecosystem model constructed for a relatively small and open (in the sense of considerable exchange with adjacent non-modelled areas) system Many assumptions have been made based on poor or missing data Taking all these considerations into account the model does the best job possible of comparing the biomass and productivity of the Roberts Bank ecosystem with and without the Project
o the extent to which the model adequately represents the lsquorealrsquo ecosystem of Roberts Bank as opposed to comparisons of model results with and without the Project is unclear as a number of basic diagnostics are not presented (see point 3 above)
o the EwE model is not capable of and is not designed to represent nutritional and food quality variations in prey functional groups and how these may impact highly migratory predators such as birds with and without the Project
5 Is the EwE model framework a valid method to quantify large scale impacts to fish habitat fish productivity and migratory bird productivity
o the EwE model as implemented in this project and reviewed here is a useful first-order framework to organise information and derive initial estimates of how the system may respond to perturbations
Pacific Region Science Response Technical Review Assessing
Ecosystem Productivity Model of Roberts Bank
21
o the utility of a EWE model for impact purposes is highly dependent on the quality of input data
o each EwE model is highly dependent on local conditions Although appropriate as an overall methodology each application would need to be reviewed for how it may be applied to any new ecosystem and
o the EwE model would need to be substantially reformulated if it was to include considerations of changes in chemical composition or food quality of prey in particular for seasonal migratory species such as birds which may depend on very large biomasses of prey with specific chemical composition to fuel their migrations beyond the ecosystem model boundaries
Contributors Contributor Affiliation Ian Perry Author DFO Science Pacific Region Alida Bundy Author DFO Science Maritimes Region Terri Sutherland Author DFO Science Pacific Region Robert Elner Author ECCC Canadian Wildlife Service Andrew Robinson Author ECCC Canadian Wildlife Service Lesley MacDougall Editor DFO Science Pacific Region
Approved by Carmel Lowe
Regional Director Science Branch Pacific Region Fisheries and Oceans Canada
November 4 2016
Sources of Information Christensen V Coll M Steenbeek J Buszowski J Chagaris D walters CJ 2014
Representing variable habitat quality in a spatial food web model Ecosystems 17 1397-1412
Christensen V and Walters C 2000 Ecopath with Ecosim methods capabilities and limitations Ecological Modelling 172 109-139
Colleacuteter M Valls A Guitton J Gascuel D Pauly D and Christensen V 2015 Global overview of the applications of the Ecopath with Ecosim modeling approach using the EcoBase models repository Ecological Modelling 302 pp42-53
Compass Resource Management Ltd 2013 Roberts Bank Terminal 2 Technical Advisory Group (TAG) Process Report Productive Capacity ndash Final Report 119pp (Accessed November 1 2016)
DFO 2016 Technical Review of Roberts Bank Terminal 2 Environmental Assessment Section 95 ndash Coastal Geomorphology DFO Can Sci Advis Sec Sci Resp 2016045 (Accessed November 4 2016)
Pacific Region Science Response Technical Review Assessing
Ecosystem Productivity Model of Roberts Bank
22
ESSA Technologies 2014a Roberts Bank Terminal 2 Project Roberts Bank Delta BC Environmental Impact Statement Volume 3 Biophysical Effects Assessments Appendix 10-C Roberts Bank Ecosystem Model Development and Key Run Port Metro Vancouver (Accessed November 1 2016)
ESSA Technologies 2014b Roberts Bank Terminal 2 Project Roberts Bank Delta BC Environmental Impact Statement Volume 3 Biophysical Effects Assessments Appendix 10-D Roberts Bank Ecosystem Model Sensitivity Analyses Port Metro Vancouver (Accessed November 1 2016)
Franklin J 2009 Mapping Species Distributions Spatial Inference and Prediction Cambridge University Press Cambridge
Hemmera 2014 Roberts Bank Terminal 2 Project Roberts Bank Delta BC Environmental Impact Statement Volume 3 Biophysical Effects Assessments Appendix 10-B Roberts Bank Ecosystem Model Parameter Estimates Port Metro Vancouver File 302-03503 (Accessed November 1 2016)
Port Metro Vancouver 2015a Roberts Bank Terminal 2 Project Roberts Bank Delta BC Environmental Impact Statement Volume 3 Biophysical Effects Assessments Section 100 Biophysical Setting (Accessed November 1 2016)
Port Metro Vancouver 2015b Roberts Bank Terminal 2 Project Roberts Bank Delta BC Environmental Impact Statement Volume 3 Biophysical Effects Assessments Section 103 Overview of Assessing Ecosystem Productivity (Accessed November 1 2016)
Port Metro Vancouver 2015c Roberts Bank Terminal 2 Project Environmental Assessment Additional Information Requirements (July 31 2015) Responses Response to Information Request 6 IR-73115-06 Canadian Environmental Assessment Agency Reference Number 80054 dated 26 October 2015
Steenbeek J Coll M Gurney L Meacutelin F Hoepffner N Buszowski J and Christensen V 2013 Bridging the gap between ecosystem modeling tools and geographic information systems Driving a food web model with external spatialndashtemporal data Ecological Modelling 263 139ndash 151
Sutherland T Elner R and OrsquoNeill J 2013 Roberts Bank Ecological crucible of the Fraser River estuary Progress in Oceanography 115 171ndash180
Vancouver Fraser Port Authority 2016 From the Vancouver Fraser Port Authority to the Review Panel re Answers to preliminary technical questions submitted during the completeness phase from Fisheries and Oceans Canada Natural Resources Canada and Environment and Climate Change Canada concerning the ecosystem modelling to support the Roberts Bank Terminal 2 Project environmental review CEAR Document 547 (Accessed November 1 2016)
Pacific Region Science Response Technical Review Assessing
Ecosystem Productivity Model of Roberts Bank
23
This Report is Available from the Centre for Science Advice
Pacific Region Fisheries and Oceans Canada
3190 Hammond Bay Road Nanaimo BC V9T 6N7
Telephone (250) 756-7208 E-Mail csapdfo-mpogcca
Internet address wwwdfo-mpogccacsas-sccs
ISSN 1919-3769 copy Her Majesty the Queen in Right of Canada 2016
Correct Citation for this Publication
DFO 2016 Technical review of Roberts Bank Terminal 2 environmental assessment section 103 ndash assessing ecosystem productivity DFO Can Sci Advis Sec Sci Resp 2016050
Aussi disponible en franccedilais
MPO 2016 Examen technique de leacutevaluation environnementale du Terminal 2 agrave Roberts Bank section 103 ndash eacutevaluation de la productiviteacute de leacutecosystegraveme Secr can de consult sci du MPO Reacutep des Sci 2016050
- TECHNICAL REVIEW OF ROBERTS BANK TERMINAL 2 ENVIRONMENTAL ASSESSMENT SECTION 103 ndash ASSESSING ECOSYSTEM PRODUCTIVITY
-
- 10 Context
- 20 Background
-
- 21 Background and Terms of Reference
- 22 Approach to assessing ecosystem productivity
-
- 30 Analysis and Response
-
- 31 The EwE Team
- 32 Overview of assessment results of hydrological and sediment modelling
- 33 Model implementation
-
- 331 The purpose of the EwE model
- 332 Applicability of the EwE model framework to the Roberts Bank region
- 333 Model documentation
- 334 Highly mobile functional groups
- 335 Seasonality (model time step)
- 336 Life history structure
- 337 Model balancing
-
- 34 Model validation
- 35 Model results
-
- 351 Presentation of model results
- 352 Sensitivity and vulnerability analyses
-
- 40 Conclusions
- Contributors
- Approved by
- Sources of Information
- This Report is Available from the
-
- CSAS 2016-50 - Assessing Ecosystem Productivitypdf
-
- TECHNICAL REVIEW OF ROBERTS BANK TERMINAL 2 ENVIRONMENTAL ASSESSMENT SECTION 103 ndash ASSESSING ECOSYSTEM PRODUCTIVITY
-
- 10 Context
- 20 Background
-
- 21 Background and Terms of Reference
- 22 Approach to assessing ecosystem productivity
-
- 30 Analysis and Response
-
- 31 The EwE Team
- 32 Overview of assessment results of hydrological and sediment modelling
- 33 Model implementation
-
- 331 The purpose of the EwE model
- 332 Applicability of the EwE model framework to the Roberts Bank region
- 333 Model documentation
- 334 Highly mobile functional groups
- 335 Seasonality (model time step)
- 336 Life history structure
- 337 Model balancing
-
- 34 Model validation
- 35 Model results
-
- 351 Presentation of model results
- 352 Sensitivity and vulnerability analyses
-
- 40 Conclusions
- Contributors
- Approved by
- Sources of Information
- This Report is Available from the
-
Canadian Science Advisory Secretariat Pacific Region Science Response 2016050
December 2016
TECHNICAL REVIEW OF ROBERTS BANK TERMINAL 2 ENVIRONMENTAL ASSESSMENT SECTION 103 ndash
ASSESSING ECOSYSTEM PRODUCTIVITY
10 Context Vancouver Fraser Port Authority (VFPA) formerly Port Metro Vancouver (the Proponent) is proposing to construct and operate the Roberts Bank Terminal 2 Project (the Project) a new three-berth marine container terminal at Roberts Bank in Delta British Columbia The proposed terminal is located next to the existing Deltaport and Westshore Terminals In addition to the construction of the new terminal the Proponent has proposed to widen the north side of the existing Roberts Bank causeway from its east-end connection with the mainland to the entrance to the new terminal The existing tug basin connected to the northeast side of Deltaport Terminal is also proposed to be expanded The new marine terminal is predicted by the Proponent to process up to 260 container ship calls per year at full capacity with the assistance of two or three large berthing or escort tugs to manoeuver ships into or away from assigned berths The terminal is designed to operate 24 hours per day year-round
The Roberts Bank Terminal 2 Project is subject to an environmental assessment by a Review Panel pursuant to the Canadian Environmental Assessment Act 2012 As a federal authority in the environmental assessment for the Project Fisheries and Oceans Canada (DFO) will be asked to present information to the review panel and at public hearings in relation to its expertise on the effects of the Project on fish and fish habitat including aquatic species at risk and the adequacy of mitigation and offsetting measures and monitoring and follow-up programs proposed by the Proponent DFOrsquos Pacific Region Fisheries Protection Program (FPP) will coordinate DFOrsquos participation in the environmental assessment
The Proponent assessed future ecosystem productivity at Roberts Bank using the Ecopath with Ecosim and Ecospace (EwE) model framework The potential impacts of the Project to hydrodynamic conditions and sediment transport in the area as a result of changes in wind wave and current patterns and intensities are projected using different model frameworks A companion Science Response (DFO 2016) has been developed by DFO and Natural Resource Canada (NRCan) to review Section 95 ldquoCoastal Geomorphologyrdquo of the Environmental Impact Statement (EIS) which describes the hydrodynamic and sedimentology models that were used to evaluate the effect of the Project on water and sediment movements
Outcomes of the EwE models are incorporated into the analysis of the potential project-related effects on the ongoing productivity of commercial recreational and Aboriginal fisheries Consequently DFO FPP has requested that DFO Science Branch provide an evaluation of the Proponentrsquos characterization of project-related effects as conducted using the Ecopath with Ecosim and Ecospace (EwE) ecosystem model
Pacific Region Science Response Technical Review Assessing
Ecosystem Productivity Model of Roberts Bank
2
The objectives for this Science Response are to
1 Determine if the functional groups and abiotic factors used in the model adequately represent the ecosystem at Roberts Bank
2 Assess whether the parameter estimates used by the model are valid and defensible for this system
3 Assess whether the limitations and uncertainties of the model are identified and appropriately considered when determining the modelrsquos representation of current and possible future conditions
4 Provide advice regarding whether the model results related to the potential effects of the Project on fish and fish habitat and migratory birds and their food resources are valid and defensible
5 If possible provide advice regarding the validity of using the EwE model framework to quantify large scale impacts to fish habitat and fisheries productivity and the productivity of migratory birds
This Science Response evaluates Section 100 ldquoBiophysical Settingrdquo with a focus on Section 103 ldquoOverview of Assessing Ecosystem Productivityrdquo in the EIS as submitted by the Proponent (Port Metro Vancouver 2015) This Section and consequently this Response describes the ecosystem modelling approach that was taken to evaluate the direct and indirect effects of the footprint of the proposed terminal and widened causeway herein referred to as lsquothe Projectrsquo This ecosystem model provides outputs related to potential effects of the project on the study area at an ecosystem level including aquatic species and bird species in the Project area Evaluation of the model and its outputs therefore required expertise in both fishery aquatic species and migratory bird species Consequently this Science Response is the product of a joint review between DFO and Environment and Climate Change Canada (ECCC) Canadian Wildlife Service and Wildlife and Landscape Science to provide a complete evaluation
This Science Response Report results from the Science Response Process of July 2016 on the Technical Review of Ecopath with Ecosim and Ecospace (EwE) Ecosystem Productivity Model application to the Roberts Bank Terminal 2 Environmental Assessment
20 Background
21 Background and Terms of Reference The Projectrsquos main components have a proposed combined marine footprint area of approximately 179 km2 listed below by specific component
bull Marine Terminal 1335 km 2 including terminal (116 km 2) and dredged berth pocket and marine approach areas (0174 km 2)
bull Widened Causeway 0424 km 2
bull Expanded Tug basin 0031 km 2
Roberts Bank in the Fraser River estuary consists of complex intertidal and subtidal habitats including intertidal eelgrass beds and is an important stopover area for migrating shorebirds and productive feeding and rearing habitats for many fish and invertebrate species It also provides habitat for endangered Southern Resident Killer Whales and other marine mammals
Pacific Region Science Response Technical Review Assessing
Ecosystem Productivity Model of Roberts Bank
3
The environmental conditions at Roberts Bank are dynamic and are influenced by a variety of oceanographic and atmospheric factors including the Fraser River freshwater and sediment plume discharge diurnal tidal currents and prevailing and storm-generated wind and wave activity In addition the intercauseway region provides significant drainage from marsh and agricultural areas which have different characteristics from marine waters and which run along the ferry causeway
To provide the required science advice this Science Response focusses on Section 10 ldquoBiophysical Settingrdquo of the Environmental Impact Statement (EIS) (Port Metro Vancouver 2015a) specifically Section 103 ldquoOverview of Assessing Ecosystem Productivityrdquo (Port Metro Vancouver 2015b) and its related Appendices 10-B ldquoRoberts Bank Ecopath with Ecosim and Ecospace model parameter estimatesrdquo (Hemmera 2014) Appendix 10-C ldquoRoberts Bank Ecosystem model development and key runsrdquo(ESSA Technologies 2014a) and Appendix 10-D ldquoRoberts Bank Ecosystem model sensitivity analysesrdquo (ESSA Technologies 2014b) Additional important information was obtained from the Response to Information Request 6 (IR-73115-06 Canadian Environmental Assessment Agency Reference Number 80054 dated 26 October 2015) (Port Metro Vancouver 2015c) and the Written Responses to Coastal Geomorphology and Ecosystem Modelling Questions provided by the Proponent to DFO ECCC and NRCan on 2 March 2016 (Port Metro Vancouver (PMV) Transmittal TRE-01-RBT2-0004A subsequently referred in this Science Response as ldquoPMV Response 2016-03-02rdquo) (Vancouver Fraser Port Authority 2016)
The process followed in preparing this Science Response involved an initial review of the submitted EIS followed by an in-person meeting of the Proponent its contractors and representatives of DFO ECCC and NRCan to discuss and clarify questions arising from the initial review (Vancouver 23 November 2015) DFO and NRCan provided written questions to the Proponent based on preliminary review of the EIS on November 19 2015 ECCC also provided written questions based on its preliminary review of the EIS to the Proponent on December 1 2015 and January 20 2016 This large initial meeting was followed by smaller focussed meetings between the Proponent its contractors and DFO and NRCan on 11 December 2015 to clarify hydrology and sediment modelling questions with DFO on 8 January 2016 to clarify ecosystem modelling questions and with ECCC on 18 February 2016 to clarify questions relating to birds Written responses to all of these meetings and questions were provided by the Proponent to DFO ECCC and NRCan as the ldquoPMV Response 2016-03-02rdquo and ldquoPMV Response 2016-05-30rdquo (Vancouver Fraser Port Authority 2016) VFPArsquos answers to questions posed by DFO and NRCan regarding coastal geomorphology modelling have been posted to the Canadian Environmental Assessment Registry (CEAR)
22 Approach to assessing ecosystem productivity The Proponent adopted an ecosystem approach to evaluate the direct and indirect effects of the Project on the productivity of the Roberts Bank ecosystem A weight of evidence approach was used to assess the potential effects of the project on the productivity of the ecosystem and selected key components in the study area this approach included a spatial ecosystem simulation model (which included a habitat capacity model) a shorebird opportunity model and empirical data An important point is that any effects on the system during the construction phase or from expansion of the tug basin were excluded from this modelling process the focus instead being a comparison of modelled system productivity before and after the proposed terminal and expanded causeway is in place The chosen ecosystem simulation model was
Pacific Region Science Response Technical Review Assessing
Ecosystem Productivity Model of Roberts Bank
4
Ecopath with Ecosim and its spatial version Ecospace (collectively referred to here as the EwE framework or EwE model) This modelling approach was recommended by a prior Productive Capacity Technical Advisory Group comprised of representatives of technical experts from government agencies academia non-governmental organizations Vancouver Fraser Port Authority and its consultants (Compass 2013) convened by the Proponent and which also recommended a selection of focal species for the model The final selection of functional groups and the resulting food web that form the core of this ecosystem model are shown in Figure 1
Pacific Region Science Response Technical Review Assessing
Ecosystem Productivity Model of Roberts Bank
5
Figure 1 Ecopath with Ecosim model food web for Roberts Bank (Adapted from EIS Volume 3 Section 10 Fig 1033 on page 10-16) The groups coloured in orange represent focal groups size of symbols represents relative annual amount of biomass in the Roberts Bank study area
Pacific Region Science Response Technical Review Assessing
Ecosystem Productivity Model of Roberts Bank
6
The EwE framework is a common approach to ecosystem modelling which has been developed and expanded over the past two to three decades It currently has three main components
1 Ecopath ndash the core model which provides a mass-balance snapshot of the system
2 Ecosim ndash a module that enables simulation modelling over time
3 Ecospace ndash a module that enables simulation modelling over space
In order to make an EwE model tractable species are aggregated into functional groups based on their similar ecological characteristics (habitat and prey preferences etc) the Roberts Bank models had 58 functional groups The first step (Ecopath) was to obtain input parameters representing biomass production consumption emigration and diet for each functional group These parameters were then tuned in an iterative process until the overall production and consumption was balanced (a mass-balance approach) resulting in a model food web with estimates of energy flow between functional groups (Fig 1)
In the second step Ecosim was combined with the spatial model Ecospace The abiotic variables selected in this EIS (depth salinity bottom current wave height sediment type) were used as external forcings to the Ecospace module These abiotic variables provided the physical forcings for the simulations without and with the Project Since time series data on the functional groups of the model were not available Ecospace was run until the model reached equilibrium using various assumptions of the value of the vulnerability parameter (see Section 352) In this EIS the selected time step was annual with all variables abiotic and biotic expressed as yearly averages As used in this EIS the Ecospace module included a habitat capacity model which estimated the distribution of functional groups based on their environmental preferences for each abiotic variable (depth salinity bottom current wave height) and for substrate type (sand mud etc) The model thus allocated the spatial distribution of functional groups over the model domain based on their environmental preferences and the distributions of these abiotic variables with and without the Project The selected spatial unit size (ldquopixelrdquo) for the Ecospace model was 100 m2 In essence an Ecopath model was constructed for each pixel with particular rules governing how the functional groups interacted and moved among these spatial units The Ecospace module was run until it approached equilibrium (20 model years) to establish the spatial patterns without the Project For the lsquowith the Projectrsquo simulations the model was run for an initial 10 years and then the spatial patterns of the abiotic variables with the project were added and the model run for an additional 10 years1 The model outputs predicted changes in the productive potential of the Roberts Bank ecosystem as a comparison (ratio) with and without the Project rather than an absolute biomass that would be lost or gained as a result of the Project
1 EIS Appendix 10-C p 26
Pacific Region Science Response Technical Review Assessing
Ecosystem Productivity Model of Roberts Bank
7
30 Analysis and Response To prepare this response the following sections of the EIS additional documents were reviewed
DocumentSection Title
EIS Section 10
Including appendices 10B 10C and 10D
(Port Metro Vancouver 2015a Hemmera 2014 ESSA Technologies 2014a ESSA Technologies 2014b)
Biophysical Setting
Appendix 10-B Roberts Bank Ecosystem Model Parameter Estimates Port Metro Vancouver File 302-03503
Appendix 10-C Roberts Bank Ecosystem Model Development and Key Run Port Metro Vancouver
Appendix 10-D Roberts Bank Ecosystem Model Sensitivity Analyses Port Metro Vancouver
CEAR document 547 (Including Appendices) ldquoPMV Response 2016-03-02rdquo and ldquoPMV Response 2016-05-30rdquo
(Vancouver Fraser Port Authority 2016)
Vancouver Fraser Port Authority to the Review Panel re Answers to preliminary technical questions submitted during the completeness phase from Fisheries and Oceans Canada Natural Resources Canada and Environment and Climate Change Canada concerning the ecosystem modelling to support the Roberts Bank Terminal 2 Project environmental review
31 The EwE Team Building this ecosystem model was a complex undertaking which required knowledge of the ecosystem to be modelled how to set initial parameter values determination of reasonable ranges of these parameters how to balance the model and how to recognize when the model outputs were unrealistic These tasks became even more complex when spatial model dynamics were involved such as with Ecospace The team engaged by the Proponent to conduct this ecosystem modelling for the Roberts Bank Terminal 2 (RBT2) EIS was led by scientists at the Institute for Oceans and Fisheries located at the University of British Columbia in Vancouver These scientists are global leaders of the EwE model framework having developed much of its current implementation and who continue to lead its elaborations and extensions Construction and running of the model for this specific ecosystem was done in collaboration with ESSA Technologies of Vancouver Parameter values for the ecosystem model were obtained in part from observational studies conducted in the area by Hemmera of Burnaby BC
32 Overview of assessment results of hydrological and sediment modelling Implementation of the ldquowith the Projectrdquo simulations of the ecosystem model was done by driving the model with the abiotic variables as they were projected to be distributed with the Project footprint In the context of this EIS specifying depth salinity bottom currents wave height and sediment type conditions without the Project and changes with the Project were achieved by construction of hydrodynamical and sediment transport models The outputs from these models in combination with the identified environment preferences for the various biological groups were then used as inputs to the Ecospace model to define the spatial
Pacific Region Science Response Technical Review Assessing
Ecosystem Productivity Model of Roberts Bank
8
distributions of these functional groups The implementation of these hydrological and sediment transport models in this EIS was reviewed by DFO and NRCan (DFO 2016) This review concluded that the implementation of these models for this EIS was adequate for average winter conditions but lacking in validation for summer conditions in particular with strong freshwater flows from the Fraser River Simulations of strong storm events and their impacts on wave conditions and sediment transport were also lacking The effect of wave action and current speeds on sediment transport is non-linear such that increasing winds over short periods of time can impact sediment transport processes bottom topography and water depths beyond that determined under average model conditions Overall the review concluded that a greater range of sensitivity analyses is required to have confidence in the model outputs under lsquonon-averagersquo conditions The implication of this conclusion for the present review of the EwE model is that the full range of variability of abiotic characteristics such as bottom topography bottom current and wave heights and how they may affect relevant functional groups in the model with the Project may not be adequately represented Sensitivity analyses were provided by varying the intensity of abiotic variables and by removing abiotic variables to assess their interactive effects In general the ecosystem model outputs were robust to these sensitivity analyses with most groups varying by less than 5 Larger changes however were observed for primary producer and bird groupings and for some fish groups when various abiotic variables were omitted2
33 Model implementation 331 The purpose of the EwE model
The EwE model was intended to provide one line of evidence to assess the potential impacts of the Project on the Roberts Bank ecosystem which would then be used with other lines of evidence to make the final assessment Specifically ldquohellip the objective of the RB [Roberts Bank] model was not to provide an assessment of Project impacts for each functional group at a fine temporal scale but to estimate changes in productive potential with and without the Project at the ecosystem levelrdquo3 In addition ldquohellipthe primary objective of the RB ecosystem model is to evaluate potential changes in productivity from such abiotic factors with and without the terminal and causewayrdquo4 Results are presented for the selected functional groups no results were presented on potential changes in ecosystem structure or function
332 Applicability of the EwE model framework to the Roberts Bank region EwE models work best when the exchanges within the system being modelled are greater than the exchanges between the modelled system and the lsquooutsidersquo world In practice this means that EwE models work best for larger systems with few external exchanges In a meta-analysis of 433 Ecopath models Colleacuteter et al (2015) concluded that ldquohellipin the last two decades the range of the models area has expanded toward very large areas and the median has shifted accordingly from about 1000 km2 in 1984ndash1993 to about 100000 km2 in 1994ndash2014rdquo The section of the Roberts Bank ecosystem that is included in the EwE model was comparatively small (5468 km2) and complex It is an intertidally-dominated environment that is subject to strong seasonal influences of both freshwater and marine exchanges across relatively large seaward and shoreward boundaries
2 EIS Appendix 10-D p ii - iii 3 PMV Response 2016-03-02 p 99 lines 1914-1917 4 PMV Response 2016-03-02 p 38 lines 689-691
Pacific Region Science Response Technical Review Assessing
Ecosystem Productivity Model of Roberts Bank
9
Processes taking place outside the modelled ecosystem will contribute to dynamics within the modelled ecosystem (eg lsquooutsidersquo food supporting predators which occur in the Roberts Bank ecosystem for only part of the year predators which may feed in the Roberts Bank ecosystem but export this energy when they migrate out of the region) but which may not be well-resolved by the EwE model The Proponent justifies the spatial scale because it was specifically chosen for the questions being asked in regard to assessing productivity changes and because the relative influences of external exchanges are assumed to be identical with and without the project In addition highly mobile species with broad prey bases were assumed in the model to be partially sustained by external energy from outside the model system5 The distributions of organisms may differ however with and without the project which may affect their interactions with areas outside of the modelled system and the use of diets from outside the modelled system may not reflect the impacts of the project Further clarification of how the EwE model captures the exchanges and interactions with adjacent ecosystems are needed For example it could be argued that an ecosystem which is open to frequent exchanges of water and organic matter from beyond its boundaries might be more robust to local disturbances such as the Project
There are some inconsistencies in the information and assumptions used for some of the taxa in this ecosystem model For Dungeness Crab the justification for estimating total adult biomass (including females) from the biomass of fished males is unclear In addition it is unclear if the slower growth of female crabs once they have reached sexual maturity in comparison with male crabs has been considered The diet matrix for spiny dogfish does not represent the actual diet well in particular of euphausiids herring and shrimp and there are more recent references for biomass estimates of spiny dogfish in the study area than what was used in the EIS
Fishing mortality was not included in the model under the assumption that this would not change with or without the project While this assumption may be true the model has been parameterized by ignoring a source of mortality that will influence total production In essence fishing removes biomass from the ecosystem with the result that less biomass will be available for higher trophic levels How this may impact the ecosystem with and without the Project is unclear but it could make noticeable differences if for example there were thresholds in the feeding responses by these higher trophic level species The Ecopath model that was used is relatively unconstrained since many ecological efficiencies are low even for forage species which would be expected to be higher It is not clear how many species are exploited or the levels of exploitation but even if this does not change with the Project these mortality rates should be included in the model in order to add realistic constraints to the exploited functional groups
333 Model documentation Based on questions from DFO ECCC and NRCan following their initial review of the EIS the Proponent provided written responses dated 2 March 2016 to clarify several of the steps in the model development and implementation However several questions remain including questions about the Ecospace module Ecospace has undergone several recent developments such as the inclusion of the spatial-temporal data layer framework (Steenbeek et al 2013) the habitat capacity model (Christensen et al 2014) and the Monte Carlo analysis including the diet matrix As yet there are few published studies using these latest Ecospace developments and their documentation and justification need to be improved in the EIS
5 PMV Response 2016-03-02 p 29 lines 446 - 464
Pacific Region Science Response Technical Review Assessing
Ecosystem Productivity Model of Roberts Bank
10
Questions also remain regarding how the Monte Carlo randomization routine treated diet data The report indicates that the Monte Carlo routine randomly selected input parameters from the input ranges and that only models that were balanced were used This suggests that a high proportion of models were not balanced and therefore were not used (for example the EIS indicates that about one out of 1000 sampled input parameters was balanced6) A table showing the minimum maximum mode average and median values from the Monte Carlo runs for all the parameters would enable an evaluation of how much variation was actually sampled by the balanced model runs This is recommended in the EwE user information ie ldquoUsers should check the range of the input parameters that were actually used in the trials in the output csv file (see below)rdquo7
In addition there are several issues with the documentation of the derivation of the parameters for the functional groups Such documentation should clearly outline how the input parameter was estimated and the range of uncertainty for that parameter For example the input biomass of pinnipeds was defined as 04 t km 2 derived from estimates of 034 for Harbour seals and two estimates for Steller sea lions (012 and 014 t km 2) No explanation was provided for how the overall estimated pinniped biomass of 04 t km 2 was determined The diet of Sand Lance was described in the EIS as consisting mostly of zooplankton8 whereas the diet table for the model runs9 included 20 macrofauna 10 green algae and 10 detritus It is unclear why these additional prey were included in the diet used for the model runs
334 Highly mobile functional groups This implementation of the EwE framework included transient and migratory functional groups This is entirely appropriate and these groups cannot be excluded The approach taken in the Ecospace module was to impose a low (and conservative) dispersal rate among model spatial units (lsquopixelsrsquo) of 1 km yr-1 This may be appropriate for low mobility benthic organisms but it likely underestimates the movements of many other functional groups The effects of using higher and perhaps functional-group-specific dispersal rates was not considered The Proponents argued that higher dispersal rates would reduce impacts since species can move away from less desirable areas more quickly for completeness these runs should be done and evaluated Mobile species will also bring energy (food) captured outside the system into the modelled ecosystem This process was included in the model with the use of a diet import factor reflecting the consumption of prey outside the modelled region with the assumption that groups with high import rates were unlikely to respond to local changes on Roberts Bank10 This assumption needs justification perhaps at the functional group level for example many species of highly migratory birds and Pacific salmon use the Roberts Bank ecosystem to obtain food to continue their migrations Although this food does not compose a large fraction of their annual consumption it can be critical to enable them to continue their migrations
The EwE model is not designed to capture differences in prey quality ie differences in essential fatty acid or nutrient ratios The same species of prey may have greater or lesser nutritional value to predators depending on the conditions under which they are growing and their seasonal variations This is a particular concern with the nutritional quality of the diatom-dominated biofilm Diatomaceous biofilm is important to the highly migratory Western Sandpiper (Calidris mauri) Despite its predictive merits in relation to other ecosystem
6 EIS Appendix 10D Section 24 p5 7 EwE Help file p 151 8 EIS Appendix 10B Section 4133 p 76 9 EIS Appendix A of Appendix 10B 10 PMV Response 2016-03-02 p 28 lines 429 - 436
Pacific Region Science Response Technical Review Assessing
Ecosystem Productivity Model of Roberts Bank
11
components the EwE model is not informative with respect to understanding the potential impacts of the Project on biofilm and the Western Sandpiper While this example is specific to seabirds the potential exists for differences in the quality of biofilm to also be an issue for copepods which feed on biofilm and consequently to juvenile salmon which feed on these copepods (eg Sutherland et al 2013)
The EwE model is also not designed to predict effects of the Project on water quality although the Proponent noted that ldquoOther abiotic factors not included were deemed to be representative of variables that were already included in the modelhelliprdquo11 The Project may cause changes in physical and water quality conditions whether in isolation or in combination which may impact the productivity or nutritional quality of key prey organisms for local and migratory species which will not be captured by the model The EwE model does not assess the production of key nutrients or the implications of changes in important physical and water quality parameters to biofilm community structure and hence to important migratory birds
The model does not include biotic factors for both pelagic and benthic environments to assess the potential development of eutrophication and benthic organic enrichment events respectively Organic and redox indicators traditional measures of environmental assessments that are used to determine changes in functional group responses were included in the recent Deltaport Third environmental assessment (ie Pelagic chlorophyll dissolved nutrients Benthic sediment carbonnitrogen content redox state [sulfide concentration]) Benthic anoxic events based on organic enrichment are known to be strong drivers of community composition and exclusion regardless of substrate type In the absence of biotic factors (eg organic particulates) the model has not considered the potential for benthic organic enrichment which coincides with siltation processes within the upper tidal flats The tidal flat corner bordered by the Delta-dyke and Deltaport causeway has served as a catchment area for Fraser River silt since the development of the original Deltaport causeway (Sutherland et al 2013) The proposed position of the new terminal placed at the seaward termination of the Deltaport causeway may produce a crescent-shaped feature in the wake of the Fraser River Plume This feature may provide a more efficient silt trap that will promote benthic organic enrichment This piece of the environmental assessment seems to be missing and is important for assessing fish habitat in this area
335 Seasonality (model time step) Input data to parameterize the model were available on a range of time scales from hourly (eg physical data on salinity and water flow) to annual (eg species biomass) The Proponents indicated12 that this is a strength of the EwE model although ultimately the model was run with an annual time step with all sub-annual values being averaged to annual values This method therefore did not incorporate important seasonal processes such as winter-summer differences in salinity and storm properties and the seasonal appearances of abundances of predators and prey such as migratory salmon and birds that are much larger than the annual average For example juvenile salmon migrate from the Fraser River and onto Roberts Bank in the spring before moving into deeper waters If these spring abundances are averaged over the entire year these average abundances would be 5-10 times lower than the actual abundances during the spring (ie averaging the biomass that occurs in two months over a 12 month period) Additionally this method did not capture the intensity of processes such as growth and predation which can be focused over periods of a few weeks to a few months There may be important threshold effects at particular times and places which may be missed when using an 11 EIS Section 10 p 10-11 12 PMV Response 2016-03-02 p 86 line 1655
Pacific Region Science Response Technical Review Assessing
Ecosystem Productivity Model of Roberts Bank
12
annual time step for the model The Ecospace module has a monthly time step13 and therefore it is feasible to run this module with a sub-annual time step For example the Proponents submit14 that there are inadequate data to model the potential effects of the Project on the timing of biofilm production which could have implications for the migratory dunlin and Western Sandpiper However this could be modelled in an exploratory way to determine hypotheses about which factors could affect the timing of production of biofilm and the potential impacts on these birds These issues are of major concern to ECCC
336 Life history structure The EwE model did not separate functional groups into life history stages (stanzas) yet for many functional groups the juvenile stages can have very different life history characteristics and habitats than the adults It is unclear in the description of the model how different life history structures were considered and whether for example there were enough juveniles to produce the adults The implications of not including early life stages should be explored at least qualitatively to identify which species might have life stages that may be more vulnerable to project effects
337 Model balancing Balancing an EwE model is the process by which parameters are adjusted so that there is sufficient production for consumption requirements ie there are sufficient prey for all predators Expert opinion was used to examine parameter values and to adjust for errors or inconsistencies in logic ldquoPMV is confident that since the approach taken to balance the model was based on best practices the steps are appropriaterdquo15 Adjustments to initial parameters to ensure an ecologically-feasible model are necessary and to be expected For a few functional groups however very large changes to initial parameter estimates (which were often not based on Roberts Bank specific data) were necessary for example to transient killer whales When such initial parameters were adjusted (often by substantial amounts) by expert opinion to balance the model the confidence intervals around these adjusted parameter values were not increased to reflect this added uncertainty (see for example PMV Response 2016-03-02 p 51 lines 955-956) When expert opinion was used to make very large changes to initial parameter values broader confidence intervals about these parameters should have been applied This does not appear to have been the case and as a consequence may cause the actual uncertainty of the model outputs to be underestimated
Another example is for the pinniped group in which 50 of the diet was assumed to come from outside the model area in order to balance the model The rationale provided was ldquoThe pinnipeds caused excessive predation mortalities on numerous fish functional groups The biomass of pinnipeds was an average for the Strait of Georgia which was likely too high for Roberts Bank Therefore it was assumed that pinnipeds extracted only half of their diet from the study areardquo16 It is unclear whether the sensitivity of the model to different percentages of diet allocation was explored
As noted above (332) the Ecopath model was relatively unconstrained and few adjustments to input parameters were required to balance the model This is unusual and the low ecotrophic efficiencies of several functional groups suggest that full accounting of energy flows may not have been achieved (an ecotrophic efficiency of 1 indicates that 100 of the production of that
13 EIS Appendix 10C Section 29 p24 14 EIS Appendix 10D Appendix C p72 15 PMV Response 2016-03-02 p 49 lines 910-912 16 EIS Appendix 10C Section 261 p 20
Pacific Region Science Response Technical Review Assessing
Ecosystem Productivity Model of Roberts Bank
13
particular group is being preyed upon or removed by fishing leaving no individuals to die of old age17) An ldquoexcessrdquo of individuals dying of old age ie ecotrophic efficiencies much less than 1 suggests a potentially large biomass that is not used by the ecosystem and instead is converted to detritus
34 Model validation Model validation is the process by which the model parameters variables and outputs are compared with those from the real ecosystem to ascertain how well the model represents the ecosystem It is an essential step in providing confidence that the projections from the model in this case with and without the Project have relevance to how the real ecosystem may be expected to function with and without the Project In practice validating complex ecosystem models is difficult considering the range of assumptions that must be made when building the model the limited available data and natural variability of the ecosystem at a variety of time and space scales
Many of the standard diagnostics for the Ecopath model have not been evaluated in the EIS The Proponent appears to have assumed that once the Ecopath model was balanced then it was valid and fit for purpose The Proponent should provide all the Ecopath estimates of vital rates including mortality rates As presented questions remain For example many Ecotrophic Efficiencies (which control the transfer of biomass from prey to predators) are less than 1 even for taxa which would be expected to be close to 1 such as carnivorous zooplankton The reason for Ecotrophic Efficiencies less than 1 were not discussed or explained in the EIS
Detailed diagnostics for the Ecospace model should also be presented in order to evaluate model performance In response to criticisms by DFO ECCC and NRCan in discussions with the Proponent the latter provided the biomass of the functional groups from the Ecopath model (before Ecospace) and the Ecospace model after the spin-up period (which involved adjusting the parameters from the Ecopath model to balance the 5468 separate cells of the Ecospace model)18 The Proponents argue that ldquoIt is important to note that changes in biomass values generated during the spin-up period are identical for both with and without Project scenarios and thus do not provide information on the potential Project-related effects on productivity19 However several changes to biomass result from the Ecospace balancing process (spin-up period) This is only given brief attention by the Proponent in its response to the DFO ECCC and NRCan questions An analysis of Table 620 revealed that the biomass of 9 functional groups was larger or smaller than the widest confidence limits allowed for each group21 This requires further discussion and justification
The Proponent used a goodness of fit measure to compare spatial distributions of model outputs with field observations They indicated that ldquono other EwE models were identified which use a goodness-of-fit measure Hence the RB model is potentially the first such EwE model where a goodness of fit measure has been appliedrdquo22 The chosen goodness of fit measure is the percent correct classification (PCC) method23 This method derives a test statistic based on the proportion of locations at which predicted occurrences from the model match observed
17 EIS Appendix 10-B p 11 18 PMV Response 2016-03-02 p 65-66 Table 6 19 PMV Response 2016-03-02 p 64 lines 1205-1207 20 PMV Response 2016-03-02 p 65-66 Table 6 21 PMV Response 2016-03-02 p 45 Table 3 22 PMV Response 2016-03-02 p 78 lines 1481-1483 23 PMV Response 2016-03-02 p 78 lines 1483-1484
Pacific Region Science Response Technical Review Assessing
Ecosystem Productivity Model of Roberts Bank
14
occurrences from data and similarly with predicted and observed absences The Proponent then calculated two additional accuracy of fit measures sensitivity (the model predicts a species to occur in an area where it is known to occur in reality) and specificity (the model predicts a species does not occur in an area it is known not to occur in reality)24 This analysis concluded that the model has high predictability for functional groups such as eelgrass and sea pens with relatively static distributions but lower predictability for functional groups which are more temporally and spatially dynamic such as biofilm and green algae25
There are two problems with this approach The first is that this goodness of fit comparison was done only for habitat-forming functional groups no discussion of how well this analysis applies to mobile functional groups was provided The second problem is that this method does not take into account situations (such as occurs in this study with several groups) in which species occur at only a few locations For example ldquohellipif the test data consist of 95 absences and 5 presences and this reflects the true prevalence of the species on the landscape (a realistic scenario for a rare species) a lsquonullrsquo model that predicted absence in all cases (eg no model at all) would be correct 95 of the timehellipldquo (Franklin 2009 p 151) This latter point is important here as these habitat functional groups (biofilm brown algae native eelgrass green algae Japanese eelgrass tidal marsh biomat and orange sea pens26) appear not to occur over most of the Project area (as portrayed by the model outputs presented in the distribution figures of PMV Response 2016-03-02 Appendix 218) It is therefore important that a robust evaluation of the performance of the Ecospace module is used with preferably more than one measure
In summary the starting point for this modelling analysis matters It is not just about a comparison between results with and without the Project The model has to be considered a sufficient representation of the ecosystem The Proponent has not yet sufficiently validated the model
35 Model results 351 Presentation of model results
As noted above (Section 331) the stated objective of the Roberts Bank ecosystem model was not to provide an assessment of Project impacts for each functional group at a fine temporal scale but to estimate changes in productive potential with and without the Project at the ecosystem level27 However results were presented as comparisons by speciesfunctional group with and without the Project and not as potential changes in total ecosystem productivity The revised figures for each functional group showing distributions without the Project with the Project and their difference indicated impacts were likely to be localized with overall impacts relatively small The range of biomass ratios with and without the Project was 045 ndash 189 with most values slightly less than 1 This is interpreted as indicating slight decreases in the capacity of the study area to support biomass and production with the Project for many functional groups28 (Figure 2)
24 PMV Response 2016-03-02 p 80 lines 1524-1527 25 PMV Response 2016-03-02 p 81 lines 1551-1559 26 PMV Response 2016-03-02 p 82 Table 8 27 PMV Response 2016-03-02 p 99 lines 1914-1917 28 PMV Response 2016-03-02 Appendix 218
Pacific Region Science Response Technical Review Assessing
Ecosystem Productivity Model of Roberts Bank
15
Biomass Ratio
Freq
uenc
y
04 07 10 13 16 19
05
1015
2025
30
Figure 2 Histogram of biomass ratios obtained by comparisons of model runs with and without the project (ie With Without) Values less than 1 indicate reductions in biomass with the Project compared against without the Project) Data from Appendix 218 of PMV Response 2016-03-02
352 Sensitivity and vulnerability analyses Every ecosystem model is only one possible representation of the true ecosystem defined by the modelrsquos structure and the values chosen for its many parameters The key point is how well the model represents the real system how that fit can be measured and the sensitivity of model outputs to variability in the selected parameter values The ideal model should be robust to a wide range of uncertainties in the input data and parameters This robustness is determined by performing sensitivity analyses on the model to see how it responds to variations in the input parameters and determining to which input parameters the model is most sensitive
The vulnerability parameters determine the strength of the feeding interactions between functional groups They set the level of density dependence of each functional group Higher vulnerability settings provide greater top-down (predator) control whereas lower settings provide greater bottom-up (environmental) control29 Several publications have shown that EwE models are very sensitive to the vulnerability parameters and Christensen and Walters (2000) point out that a main pitfall of EwE is that ldquopredation vulnerabilities are often underestimated lessening the modelled impacts of predationrdquo It is usual practice to tune Ecopath models including the vulnerability parameters to time series data such as biomass using the temporal simulation model Ecosim However these data were not available for the RBT2 area so this robust method of fitting the model and estimating vulnerability parameters was not possible Instead a vulnerability setting of 2 was used as the default value for the key model runs which is ldquocommon practice when time series data are not available and estimates of vulnerability in the
29 PMV Response 2016-03-02 p 70 lines 1318-1323
Pacific Region Science Response Technical Review Assessing
Ecosystem Productivity Model of Roberts Bank
16
model cannot be maderdquo30 with sensitivity analyses run for a range of 15 to 3 This narrow range was criticized by DFOECCC in initial discussions about the model with the Proponent The Proponent subsequently reran the model with a larger range of vulnerabilities31 (11 to 10) and concluded this broader vulnerability range produced similar results for the productivity ratio with and without the Project to those in the original EIS and that the EIS was more likely to overestimate than underestimate potential project effects32 The data in Table 7 of the PMV Response33 did indicate changes in productivity ratios ranging from 0 to 50 of the defined key run (which used a vulnerability setting of 2) However the Proponent changed all vulnerability settings to the same value ie all were 2 or all were 10 etc In reality the vulnerability parameters resulting from Ecosim models that are fitted to data as described above vary by functional group which was not explored here Therefore although the results suggest that the original choice of 2 for the default key run seemed reasonable the potential effects of variability in vulnerability settings was not fully explored
Sensitivity analyses are usually based on the range of uncertainty estimated for input data and parameters often called the confidence limits around the model parameters The EwE framework integrates many different data sources and parameters including values from the literature It can therefore be difficult to identify ldquoreasonablerdquo confidence limits when derived from such diverse data sources Standard practice in Ecopath models has been to develop a pedigree for each parameter with default values for uncertainty based on the nature of the source data For example parameter values based on high precision field observations of biomass within the model domain receive default confidence intervals of 10 whereas parameter values based on models developed for elsewhere or professional judgment receive confidence intervals of 8034 Sensitivity analyses are then run using parameter values selected from within these confidence intervals However if these default confidence intervals do not capture the full range of variability then the outputs are not informative of the variability in the lsquorealrsquo ecosystem Field observations were collected for many functional groups within the model domain in 2012 and 2013 as part of studies to support the RBT2 EIS Apparently the purpose of these observations was to document spatial variability (in part for the Ecospace model) and temporal variability (measurements at one location over time) and not to derive confidence intervals around the observations35
The reliance on the pedigree approach to derive confidence intervals for this Roberts Bank model was criticized by DFO ECCC and NRCan in discussions with the Proponent As a result the Proponent reran the model with much larger confidence intervals ranging from 30 to 100 depending on the input parameter and functional group36 The results from this new analysis using the broader confidence intervals were similar to those using the original pedigree approach The Proponent noted that ldquoWhile the production within each helliprun was very different there was little difference in the biomass ratio [with and without the Project] These results further demonstrate that even with a greater range in input values the influence of the Project on the Roberts Bank ecosystem is consistent among allhellipmodel runsrdquo37 This provides confidence that the model may be robust to uncertainty in its input parameters Two concerns
30 PMV Response 2016-03-02 p 70 lines 1321-1322 31 PMV Response 2016-03-02 p 71-74 32 PMV Response 2016-03-02 p 71 lines 1339-1341 33 PMV Response 2016-03-02 p 73 34 EIS Appendix 10-C Section 251 page 18 35 PMV Response 2016-03-02 p 42 lines 772-777 36 PMV Response 2016-03-02 p 44-47 37 PMV Response 2016-03-02 p 47 lines 855-858 and see also PMV Response 2016-03-02 Appendix 27-B
Pacific Region Science Response Technical Review Assessing
Ecosystem Productivity Model of Roberts Bank
17
remain however The quote above indicates that the production among the different model runs was very different although with little difference in the biomass ratios with and without the Project Since biomass is not the same as production it would be informative for understanding model performance and potential impacts to show these production differences This also relates to the point made in Section 34 regarding how well the model represents the real ecosystem and not just within-model comparisons with and without the Project The second question is more technical and relates to how the randomization (Monte Carlo or MC) routine that was used to create multiple model runs used the uncertainty about the diet data Diets are not currently included in the MC routine available to regular users of the Ecosim model how they were handled in this RBT2 model appears not to be explained
Finally the sensitivity analyses indicate that the uncertainty in the input parameters does not lead to much difference between model parameters with or without the project However this conclusion does not describe how the uncertainty in the input parameters affects understanding of the ecosystem
40 Conclusions Overall the main conclusion of the Environmental Impact Statement from the Proponent is stated as ldquohellipafter the implementation of mitigation hellipthe Project is not expected to result in any significant adverse effects on any of the 16 valued componentsrdquo38 In addition ldquohellipapproximately 40 of the functional groups are forecast to change no more than 5 which hellip is judged to be within the uncertainty of the model runsrdquo39 although larger changes were forecast for orange sea pens freshwater biofilm green algae and raptors The conclusions from the modelling studies are that ldquohellipthe proposed project will have an impact on the study area that the effect varies between species and that the findings are robust to parameter uncertaintyrdquo40 Specific outcomes by valued component as derived from the EwE model are presented by functional groups in Table 1
38 PMV March 2015 Roberts Bank Environmental Impact Statement Executive Summary ndash Part 1 page 37 39 EIS Appendix 10-C p ii 40 EIS Appendix 10-D p iv
Pacific Region Science Response Technical Review Assessing
Ecosystem Productivity Model of Roberts Bank
18
Table 1 Changes in productive potential with the Project as derived from the EwE model
Changes in productive potential
Ecosystem category
Number of valued
components
Number with potential
biomass loss
Moderate decrease (31-60 decline)
Minor decrease (6-30 decline)
Negligible (0-5
change)
Minor increase (6-
30 increase)
Moderate increase (31-60 increase)
Source
Marine vegetation
7 7 - 3 2 2 - EIS Vol 3 Section 11 Table 11-17 page 11-65
Marine invertebrates
4 3 1 1 1 1 - EIS Vol 3 Section 12 Table 12-8 page 12-52
Marine fish 13 13 - 2 6 5 - EIS Vol 3 Section 13 Table 13-10 page 13-95
Coastal birds
11 8 - 3 4 3 1 EIS Vol 3 Section 15 Table 15-10 page 15-67
Pacific Region Science Response Technical Review Assessing
Ecosystem Productivity Model of Roberts Bank
19
Most functional groups showed some potential biomass loss with the Project with biomass loss defined as any model run with negative outcomes (ie in which biomass with the project was less than biomass without the Project) The summary of changes in productivity potential are mixed with most (33 out of 35) valued components showing minor decreases to minor increases (defined as 6 to 30 changes in productive potential with the Project compared to without the Project)
The main conclusions of this review in regards to the Terms of Reference are
1 Do the functional groups and abiotic variables used in the model adequately represent the ecosystem at Roberts Bank
o The 58 functional groups and abiotic variables used in the model adequately represent the main components of the Roberts Bank ecosystem however for longer lived species the life stages of the species are not well represented and some of the impacts of the Project may be expected to affect specific life stages
o The abiotic variables adequately represent the physical drivers of this ecosystem on an annual time scale However annual values for these abiotic variables may not adequately capture important sub-annual events such as storms (DFO 2016) the timing of arrival and departure of highly migratory species and whether there may be important sub-annual thresholds or mismatches in timing as a result of the Project
o Biotic factors (eg nutrients) which are particularly important for biofilm and other lower trophic level taxa are not included in this model The model is therefore unable to assess the potential development of eutrophication and benthic organic enrichment events which may affect fish habitats in the study area
2 Are the parameter estimates used by the model valid and defensible for this system
o In general parameter estimates appear to be adequate for this system Field studies were done in two years to provide data in particular on distributions of selected functional groups for the Ecospace module Note the distribution studies focussed on taxa which were relatively immobile and therefore lsquofixedrsquo in space
o the selection of some model parameters would benefit from further explanation for example the choice of fixed diet matrices versus dynamic matrices which can vary with changes in abundances or predators and prey
o the selection of some model parameters would benefit from further explanation for example the link between the diets described in the text of Appendix 10B and the quantities presented in Appendix A of Appendix 10B It is understood that proportions were derived using the ldquofixed selectivityrdquo principle but in order to be fully transparent the derivation of each diet should be provided in an appendix
o discussion and explanation is needed of why ecotrophic efficiencies differ from expected values (eg the ecotrophic efficiency for Pacific herring is listed as 038) and
o the abiotic factor lsquosubstratersquo was limited to ldquohardrdquo or rdquosoftrdquo options which can be restrictive given that they serve as endpoints on a substrate composition continuum These limited options may not provide the sensitivity required to assess substrate preference nor the flexibility for taxa (eg motile organisms) that span hard mixed and soft substrate types In addition it is not clear if changes in the hardsoft categories were considered over time within identified depositional or erosional settings before and after construction
Pacific Region Science Response Technical Review Assessing
Ecosystem Productivity Model of Roberts Bank
20
3 Are the limitations and uncertainties of the model identified and appropriately considered when determining the modelrsquos representation of current and possible future conditions
o the EwE model was not designed to evaluate a range of future conditions It was designed to estimate changes in the productive potential at the ecosystem level with and without the Project Therefore the model was run without the Project and with the Project for a range of plausible abiotic conditions and the results were compared with respect to biomass and productivity by functional group
o the pedigree approach to assessing the uncertainties of model outcomes is unsatisfactory for the purpose here as it relates solely to a qualitative judgment of the value of data based on its source However when the model was rerun with much wider ranges of confidence intervals (uncertainties) the results in general (but not necessarily for each functional group) were similar to the results using the original pedigree approach This suggests that taken overall the model may be robust to wide ranges of uncertainty in these input variables and parameters
o there is inadequate validation of the model This is inadequate for three reasons
(i) the basic Ecopath model is not validated and the Ecospace balancing process (the spin-up period) resulted in some biomass estimates being increased or decreased beyond their confidence limits
(ii) the goodness of fit test used to evaluate how well the model predicted the spatial occurrence functional groups is not fit for purpose (Section 34) and
(iii) validation was provided for only a small number of functional groups (the habitat-forming functional groups) As a consequence the model is currently not validated
o Considering the proportion of open boundaries relative to closed boundaries in the model processes taking place outside the modelled ecosystem are likely to contribute to dynamics within the modelled ecosystem However these external processes may not be well-resolved by the EwE model as currently configured
4 Are the model results related to the potential effects of the Project on fish and fish habitat and migratory birds and their food resources valid and defensible
o this is a very complex ecosystem model constructed for a relatively small and open (in the sense of considerable exchange with adjacent non-modelled areas) system Many assumptions have been made based on poor or missing data Taking all these considerations into account the model does the best job possible of comparing the biomass and productivity of the Roberts Bank ecosystem with and without the Project
o the extent to which the model adequately represents the lsquorealrsquo ecosystem of Roberts Bank as opposed to comparisons of model results with and without the Project is unclear as a number of basic diagnostics are not presented (see point 3 above)
o the EwE model is not capable of and is not designed to represent nutritional and food quality variations in prey functional groups and how these may impact highly migratory predators such as birds with and without the Project
5 Is the EwE model framework a valid method to quantify large scale impacts to fish habitat fish productivity and migratory bird productivity
o the EwE model as implemented in this project and reviewed here is a useful first-order framework to organise information and derive initial estimates of how the system may respond to perturbations
Pacific Region Science Response Technical Review Assessing
Ecosystem Productivity Model of Roberts Bank
21
o the utility of a EWE model for impact purposes is highly dependent on the quality of input data
o each EwE model is highly dependent on local conditions Although appropriate as an overall methodology each application would need to be reviewed for how it may be applied to any new ecosystem and
o the EwE model would need to be substantially reformulated if it was to include considerations of changes in chemical composition or food quality of prey in particular for seasonal migratory species such as birds which may depend on very large biomasses of prey with specific chemical composition to fuel their migrations beyond the ecosystem model boundaries
Contributors Contributor Affiliation Ian Perry Author DFO Science Pacific Region Alida Bundy Author DFO Science Maritimes Region Terri Sutherland Author DFO Science Pacific Region Robert Elner Author ECCC Canadian Wildlife Service Andrew Robinson Author ECCC Canadian Wildlife Service Lesley MacDougall Editor DFO Science Pacific Region
Approved by Carmel Lowe
Regional Director Science Branch Pacific Region Fisheries and Oceans Canada
November 4 2016
Sources of Information Christensen V Coll M Steenbeek J Buszowski J Chagaris D walters CJ 2014
Representing variable habitat quality in a spatial food web model Ecosystems 17 1397-1412
Christensen V and Walters C 2000 Ecopath with Ecosim methods capabilities and limitations Ecological Modelling 172 109-139
Colleacuteter M Valls A Guitton J Gascuel D Pauly D and Christensen V 2015 Global overview of the applications of the Ecopath with Ecosim modeling approach using the EcoBase models repository Ecological Modelling 302 pp42-53
Compass Resource Management Ltd 2013 Roberts Bank Terminal 2 Technical Advisory Group (TAG) Process Report Productive Capacity ndash Final Report 119pp (Accessed November 1 2016)
DFO 2016 Technical Review of Roberts Bank Terminal 2 Environmental Assessment Section 95 ndash Coastal Geomorphology DFO Can Sci Advis Sec Sci Resp 2016045 (Accessed November 4 2016)
Pacific Region Science Response Technical Review Assessing
Ecosystem Productivity Model of Roberts Bank
22
ESSA Technologies 2014a Roberts Bank Terminal 2 Project Roberts Bank Delta BC Environmental Impact Statement Volume 3 Biophysical Effects Assessments Appendix 10-C Roberts Bank Ecosystem Model Development and Key Run Port Metro Vancouver (Accessed November 1 2016)
ESSA Technologies 2014b Roberts Bank Terminal 2 Project Roberts Bank Delta BC Environmental Impact Statement Volume 3 Biophysical Effects Assessments Appendix 10-D Roberts Bank Ecosystem Model Sensitivity Analyses Port Metro Vancouver (Accessed November 1 2016)
Franklin J 2009 Mapping Species Distributions Spatial Inference and Prediction Cambridge University Press Cambridge
Hemmera 2014 Roberts Bank Terminal 2 Project Roberts Bank Delta BC Environmental Impact Statement Volume 3 Biophysical Effects Assessments Appendix 10-B Roberts Bank Ecosystem Model Parameter Estimates Port Metro Vancouver File 302-03503 (Accessed November 1 2016)
Port Metro Vancouver 2015a Roberts Bank Terminal 2 Project Roberts Bank Delta BC Environmental Impact Statement Volume 3 Biophysical Effects Assessments Section 100 Biophysical Setting (Accessed November 1 2016)
Port Metro Vancouver 2015b Roberts Bank Terminal 2 Project Roberts Bank Delta BC Environmental Impact Statement Volume 3 Biophysical Effects Assessments Section 103 Overview of Assessing Ecosystem Productivity (Accessed November 1 2016)
Port Metro Vancouver 2015c Roberts Bank Terminal 2 Project Environmental Assessment Additional Information Requirements (July 31 2015) Responses Response to Information Request 6 IR-73115-06 Canadian Environmental Assessment Agency Reference Number 80054 dated 26 October 2015
Steenbeek J Coll M Gurney L Meacutelin F Hoepffner N Buszowski J and Christensen V 2013 Bridging the gap between ecosystem modeling tools and geographic information systems Driving a food web model with external spatialndashtemporal data Ecological Modelling 263 139ndash 151
Sutherland T Elner R and OrsquoNeill J 2013 Roberts Bank Ecological crucible of the Fraser River estuary Progress in Oceanography 115 171ndash180
Vancouver Fraser Port Authority 2016 From the Vancouver Fraser Port Authority to the Review Panel re Answers to preliminary technical questions submitted during the completeness phase from Fisheries and Oceans Canada Natural Resources Canada and Environment and Climate Change Canada concerning the ecosystem modelling to support the Roberts Bank Terminal 2 Project environmental review CEAR Document 547 (Accessed November 1 2016)
Pacific Region Science Response Technical Review Assessing
Ecosystem Productivity Model of Roberts Bank
23
This Report is Available from the Centre for Science Advice
Pacific Region Fisheries and Oceans Canada
3190 Hammond Bay Road Nanaimo BC V9T 6N7
Telephone (250) 756-7208 E-Mail csapdfo-mpogcca
Internet address wwwdfo-mpogccacsas-sccs
ISSN 1919-3769 copy Her Majesty the Queen in Right of Canada 2016
Correct Citation for this Publication
DFO 2016 Technical review of Roberts Bank Terminal 2 environmental assessment section 103 ndash assessing ecosystem productivity DFO Can Sci Advis Sec Sci Resp 2016050
Aussi disponible en franccedilais
MPO 2016 Examen technique de leacutevaluation environnementale du Terminal 2 agrave Roberts Bank section 103 ndash eacutevaluation de la productiviteacute de leacutecosystegraveme Secr can de consult sci du MPO Reacutep des Sci 2016050

Pacific Region Science Response Technical Review Assessing
Ecosystem Productivity Model of Roberts Bank
10
Questions also remain regarding how the Monte Carlo randomization routine treated diet data The report indicates that the Monte Carlo routine randomly selected input parameters from the input ranges and that only models that were balanced were used This suggests that a high proportion of models were not balanced and therefore were not used (for example the EIS indicates that about one out of 1000 sampled input parameters was balanced6) A table showing the minimum maximum mode average and median values from the Monte Carlo runs for all the parameters would enable an evaluation of how much variation was actually sampled by the balanced model runs This is recommended in the EwE user information ie ldquoUsers should check the range of the input parameters that were actually used in the trials in the output csv file (see below)rdquo7
In addition there are several issues with the documentation of the derivation of the parameters for the functional groups Such documentation should clearly outline how the input parameter was estimated and the range of uncertainty for that parameter For example the input biomass of pinnipeds was defined as 04 t km 2 derived from estimates of 034 for Harbour seals and two estimates for Steller sea lions (012 and 014 t km 2) No explanation was provided for how the overall estimated pinniped biomass of 04 t km 2 was determined The diet of Sand Lance was described in the EIS as consisting mostly of zooplankton8 whereas the diet table for the model runs9 included 20 macrofauna 10 green algae and 10 detritus It is unclear why these additional prey were included in the diet used for the model runs
334 Highly mobile functional groups This implementation of the EwE framework included transient and migratory functional groups This is entirely appropriate and these groups cannot be excluded The approach taken in the Ecospace module was to impose a low (and conservative) dispersal rate among model spatial units (lsquopixelsrsquo) of 1 km yr-1 This may be appropriate for low mobility benthic organisms but it likely underestimates the movements of many other functional groups The effects of using higher and perhaps functional-group-specific dispersal rates was not considered The Proponents argued that higher dispersal rates would reduce impacts since species can move away from less desirable areas more quickly for completeness these runs should be done and evaluated Mobile species will also bring energy (food) captured outside the system into the modelled ecosystem This process was included in the model with the use of a diet import factor reflecting the consumption of prey outside the modelled region with the assumption that groups with high import rates were unlikely to respond to local changes on Roberts Bank10 This assumption needs justification perhaps at the functional group level for example many species of highly migratory birds and Pacific salmon use the Roberts Bank ecosystem to obtain food to continue their migrations Although this food does not compose a large fraction of their annual consumption it can be critical to enable them to continue their migrations
The EwE model is not designed to capture differences in prey quality ie differences in essential fatty acid or nutrient ratios The same species of prey may have greater or lesser nutritional value to predators depending on the conditions under which they are growing and their seasonal variations This is a particular concern with the nutritional quality of the diatom-dominated biofilm Diatomaceous biofilm is important to the highly migratory Western Sandpiper (Calidris mauri) Despite its predictive merits in relation to other ecosystem
6 EIS Appendix 10D Section 24 p5 7 EwE Help file p 151 8 EIS Appendix 10B Section 4133 p 76 9 EIS Appendix A of Appendix 10B 10 PMV Response 2016-03-02 p 28 lines 429 - 436
Pacific Region Science Response Technical Review Assessing
Ecosystem Productivity Model of Roberts Bank
11
components the EwE model is not informative with respect to understanding the potential impacts of the Project on biofilm and the Western Sandpiper While this example is specific to seabirds the potential exists for differences in the quality of biofilm to also be an issue for copepods which feed on biofilm and consequently to juvenile salmon which feed on these copepods (eg Sutherland et al 2013)
The EwE model is also not designed to predict effects of the Project on water quality although the Proponent noted that ldquoOther abiotic factors not included were deemed to be representative of variables that were already included in the modelhelliprdquo11 The Project may cause changes in physical and water quality conditions whether in isolation or in combination which may impact the productivity or nutritional quality of key prey organisms for local and migratory species which will not be captured by the model The EwE model does not assess the production of key nutrients or the implications of changes in important physical and water quality parameters to biofilm community structure and hence to important migratory birds
The model does not include biotic factors for both pelagic and benthic environments to assess the potential development of eutrophication and benthic organic enrichment events respectively Organic and redox indicators traditional measures of environmental assessments that are used to determine changes in functional group responses were included in the recent Deltaport Third environmental assessment (ie Pelagic chlorophyll dissolved nutrients Benthic sediment carbonnitrogen content redox state [sulfide concentration]) Benthic anoxic events based on organic enrichment are known to be strong drivers of community composition and exclusion regardless of substrate type In the absence of biotic factors (eg organic particulates) the model has not considered the potential for benthic organic enrichment which coincides with siltation processes within the upper tidal flats The tidal flat corner bordered by the Delta-dyke and Deltaport causeway has served as a catchment area for Fraser River silt since the development of the original Deltaport causeway (Sutherland et al 2013) The proposed position of the new terminal placed at the seaward termination of the Deltaport causeway may produce a crescent-shaped feature in the wake of the Fraser River Plume This feature may provide a more efficient silt trap that will promote benthic organic enrichment This piece of the environmental assessment seems to be missing and is important for assessing fish habitat in this area
335 Seasonality (model time step) Input data to parameterize the model were available on a range of time scales from hourly (eg physical data on salinity and water flow) to annual (eg species biomass) The Proponents indicated12 that this is a strength of the EwE model although ultimately the model was run with an annual time step with all sub-annual values being averaged to annual values This method therefore did not incorporate important seasonal processes such as winter-summer differences in salinity and storm properties and the seasonal appearances of abundances of predators and prey such as migratory salmon and birds that are much larger than the annual average For example juvenile salmon migrate from the Fraser River and onto Roberts Bank in the spring before moving into deeper waters If these spring abundances are averaged over the entire year these average abundances would be 5-10 times lower than the actual abundances during the spring (ie averaging the biomass that occurs in two months over a 12 month period) Additionally this method did not capture the intensity of processes such as growth and predation which can be focused over periods of a few weeks to a few months There may be important threshold effects at particular times and places which may be missed when using an 11 EIS Section 10 p 10-11 12 PMV Response 2016-03-02 p 86 line 1655
Pacific Region Science Response Technical Review Assessing
Ecosystem Productivity Model of Roberts Bank
12
annual time step for the model The Ecospace module has a monthly time step13 and therefore it is feasible to run this module with a sub-annual time step For example the Proponents submit14 that there are inadequate data to model the potential effects of the Project on the timing of biofilm production which could have implications for the migratory dunlin and Western Sandpiper However this could be modelled in an exploratory way to determine hypotheses about which factors could affect the timing of production of biofilm and the potential impacts on these birds These issues are of major concern to ECCC
336 Life history structure The EwE model did not separate functional groups into life history stages (stanzas) yet for many functional groups the juvenile stages can have very different life history characteristics and habitats than the adults It is unclear in the description of the model how different life history structures were considered and whether for example there were enough juveniles to produce the adults The implications of not including early life stages should be explored at least qualitatively to identify which species might have life stages that may be more vulnerable to project effects
337 Model balancing Balancing an EwE model is the process by which parameters are adjusted so that there is sufficient production for consumption requirements ie there are sufficient prey for all predators Expert opinion was used to examine parameter values and to adjust for errors or inconsistencies in logic ldquoPMV is confident that since the approach taken to balance the model was based on best practices the steps are appropriaterdquo15 Adjustments to initial parameters to ensure an ecologically-feasible model are necessary and to be expected For a few functional groups however very large changes to initial parameter estimates (which were often not based on Roberts Bank specific data) were necessary for example to transient killer whales When such initial parameters were adjusted (often by substantial amounts) by expert opinion to balance the model the confidence intervals around these adjusted parameter values were not increased to reflect this added uncertainty (see for example PMV Response 2016-03-02 p 51 lines 955-956) When expert opinion was used to make very large changes to initial parameter values broader confidence intervals about these parameters should have been applied This does not appear to have been the case and as a consequence may cause the actual uncertainty of the model outputs to be underestimated
Another example is for the pinniped group in which 50 of the diet was assumed to come from outside the model area in order to balance the model The rationale provided was ldquoThe pinnipeds caused excessive predation mortalities on numerous fish functional groups The biomass of pinnipeds was an average for the Strait of Georgia which was likely too high for Roberts Bank Therefore it was assumed that pinnipeds extracted only half of their diet from the study areardquo16 It is unclear whether the sensitivity of the model to different percentages of diet allocation was explored
As noted above (332) the Ecopath model was relatively unconstrained and few adjustments to input parameters were required to balance the model This is unusual and the low ecotrophic efficiencies of several functional groups suggest that full accounting of energy flows may not have been achieved (an ecotrophic efficiency of 1 indicates that 100 of the production of that
13 EIS Appendix 10C Section 29 p24 14 EIS Appendix 10D Appendix C p72 15 PMV Response 2016-03-02 p 49 lines 910-912 16 EIS Appendix 10C Section 261 p 20
Pacific Region Science Response Technical Review Assessing
Ecosystem Productivity Model of Roberts Bank
13
particular group is being preyed upon or removed by fishing leaving no individuals to die of old age17) An ldquoexcessrdquo of individuals dying of old age ie ecotrophic efficiencies much less than 1 suggests a potentially large biomass that is not used by the ecosystem and instead is converted to detritus
34 Model validation Model validation is the process by which the model parameters variables and outputs are compared with those from the real ecosystem to ascertain how well the model represents the ecosystem It is an essential step in providing confidence that the projections from the model in this case with and without the Project have relevance to how the real ecosystem may be expected to function with and without the Project In practice validating complex ecosystem models is difficult considering the range of assumptions that must be made when building the model the limited available data and natural variability of the ecosystem at a variety of time and space scales
Many of the standard diagnostics for the Ecopath model have not been evaluated in the EIS The Proponent appears to have assumed that once the Ecopath model was balanced then it was valid and fit for purpose The Proponent should provide all the Ecopath estimates of vital rates including mortality rates As presented questions remain For example many Ecotrophic Efficiencies (which control the transfer of biomass from prey to predators) are less than 1 even for taxa which would be expected to be close to 1 such as carnivorous zooplankton The reason for Ecotrophic Efficiencies less than 1 were not discussed or explained in the EIS
Detailed diagnostics for the Ecospace model should also be presented in order to evaluate model performance In response to criticisms by DFO ECCC and NRCan in discussions with the Proponent the latter provided the biomass of the functional groups from the Ecopath model (before Ecospace) and the Ecospace model after the spin-up period (which involved adjusting the parameters from the Ecopath model to balance the 5468 separate cells of the Ecospace model)18 The Proponents argue that ldquoIt is important to note that changes in biomass values generated during the spin-up period are identical for both with and without Project scenarios and thus do not provide information on the potential Project-related effects on productivity19 However several changes to biomass result from the Ecospace balancing process (spin-up period) This is only given brief attention by the Proponent in its response to the DFO ECCC and NRCan questions An analysis of Table 620 revealed that the biomass of 9 functional groups was larger or smaller than the widest confidence limits allowed for each group21 This requires further discussion and justification
The Proponent used a goodness of fit measure to compare spatial distributions of model outputs with field observations They indicated that ldquono other EwE models were identified which use a goodness-of-fit measure Hence the RB model is potentially the first such EwE model where a goodness of fit measure has been appliedrdquo22 The chosen goodness of fit measure is the percent correct classification (PCC) method23 This method derives a test statistic based on the proportion of locations at which predicted occurrences from the model match observed
17 EIS Appendix 10-B p 11 18 PMV Response 2016-03-02 p 65-66 Table 6 19 PMV Response 2016-03-02 p 64 lines 1205-1207 20 PMV Response 2016-03-02 p 65-66 Table 6 21 PMV Response 2016-03-02 p 45 Table 3 22 PMV Response 2016-03-02 p 78 lines 1481-1483 23 PMV Response 2016-03-02 p 78 lines 1483-1484
Pacific Region Science Response Technical Review Assessing
Ecosystem Productivity Model of Roberts Bank
14
occurrences from data and similarly with predicted and observed absences The Proponent then calculated two additional accuracy of fit measures sensitivity (the model predicts a species to occur in an area where it is known to occur in reality) and specificity (the model predicts a species does not occur in an area it is known not to occur in reality)24 This analysis concluded that the model has high predictability for functional groups such as eelgrass and sea pens with relatively static distributions but lower predictability for functional groups which are more temporally and spatially dynamic such as biofilm and green algae25
There are two problems with this approach The first is that this goodness of fit comparison was done only for habitat-forming functional groups no discussion of how well this analysis applies to mobile functional groups was provided The second problem is that this method does not take into account situations (such as occurs in this study with several groups) in which species occur at only a few locations For example ldquohellipif the test data consist of 95 absences and 5 presences and this reflects the true prevalence of the species on the landscape (a realistic scenario for a rare species) a lsquonullrsquo model that predicted absence in all cases (eg no model at all) would be correct 95 of the timehellipldquo (Franklin 2009 p 151) This latter point is important here as these habitat functional groups (biofilm brown algae native eelgrass green algae Japanese eelgrass tidal marsh biomat and orange sea pens26) appear not to occur over most of the Project area (as portrayed by the model outputs presented in the distribution figures of PMV Response 2016-03-02 Appendix 218) It is therefore important that a robust evaluation of the performance of the Ecospace module is used with preferably more than one measure
In summary the starting point for this modelling analysis matters It is not just about a comparison between results with and without the Project The model has to be considered a sufficient representation of the ecosystem The Proponent has not yet sufficiently validated the model
35 Model results 351 Presentation of model results
As noted above (Section 331) the stated objective of the Roberts Bank ecosystem model was not to provide an assessment of Project impacts for each functional group at a fine temporal scale but to estimate changes in productive potential with and without the Project at the ecosystem level27 However results were presented as comparisons by speciesfunctional group with and without the Project and not as potential changes in total ecosystem productivity The revised figures for each functional group showing distributions without the Project with the Project and their difference indicated impacts were likely to be localized with overall impacts relatively small The range of biomass ratios with and without the Project was 045 ndash 189 with most values slightly less than 1 This is interpreted as indicating slight decreases in the capacity of the study area to support biomass and production with the Project for many functional groups28 (Figure 2)
24 PMV Response 2016-03-02 p 80 lines 1524-1527 25 PMV Response 2016-03-02 p 81 lines 1551-1559 26 PMV Response 2016-03-02 p 82 Table 8 27 PMV Response 2016-03-02 p 99 lines 1914-1917 28 PMV Response 2016-03-02 Appendix 218
Pacific Region Science Response Technical Review Assessing
Ecosystem Productivity Model of Roberts Bank
15
Biomass Ratio
Freq
uenc
y
04 07 10 13 16 19
05
1015
2025
30
Figure 2 Histogram of biomass ratios obtained by comparisons of model runs with and without the project (ie With Without) Values less than 1 indicate reductions in biomass with the Project compared against without the Project) Data from Appendix 218 of PMV Response 2016-03-02
352 Sensitivity and vulnerability analyses Every ecosystem model is only one possible representation of the true ecosystem defined by the modelrsquos structure and the values chosen for its many parameters The key point is how well the model represents the real system how that fit can be measured and the sensitivity of model outputs to variability in the selected parameter values The ideal model should be robust to a wide range of uncertainties in the input data and parameters This robustness is determined by performing sensitivity analyses on the model to see how it responds to variations in the input parameters and determining to which input parameters the model is most sensitive
The vulnerability parameters determine the strength of the feeding interactions between functional groups They set the level of density dependence of each functional group Higher vulnerability settings provide greater top-down (predator) control whereas lower settings provide greater bottom-up (environmental) control29 Several publications have shown that EwE models are very sensitive to the vulnerability parameters and Christensen and Walters (2000) point out that a main pitfall of EwE is that ldquopredation vulnerabilities are often underestimated lessening the modelled impacts of predationrdquo It is usual practice to tune Ecopath models including the vulnerability parameters to time series data such as biomass using the temporal simulation model Ecosim However these data were not available for the RBT2 area so this robust method of fitting the model and estimating vulnerability parameters was not possible Instead a vulnerability setting of 2 was used as the default value for the key model runs which is ldquocommon practice when time series data are not available and estimates of vulnerability in the
29 PMV Response 2016-03-02 p 70 lines 1318-1323
Pacific Region Science Response Technical Review Assessing
Ecosystem Productivity Model of Roberts Bank
16
model cannot be maderdquo30 with sensitivity analyses run for a range of 15 to 3 This narrow range was criticized by DFOECCC in initial discussions about the model with the Proponent The Proponent subsequently reran the model with a larger range of vulnerabilities31 (11 to 10) and concluded this broader vulnerability range produced similar results for the productivity ratio with and without the Project to those in the original EIS and that the EIS was more likely to overestimate than underestimate potential project effects32 The data in Table 7 of the PMV Response33 did indicate changes in productivity ratios ranging from 0 to 50 of the defined key run (which used a vulnerability setting of 2) However the Proponent changed all vulnerability settings to the same value ie all were 2 or all were 10 etc In reality the vulnerability parameters resulting from Ecosim models that are fitted to data as described above vary by functional group which was not explored here Therefore although the results suggest that the original choice of 2 for the default key run seemed reasonable the potential effects of variability in vulnerability settings was not fully explored
Sensitivity analyses are usually based on the range of uncertainty estimated for input data and parameters often called the confidence limits around the model parameters The EwE framework integrates many different data sources and parameters including values from the literature It can therefore be difficult to identify ldquoreasonablerdquo confidence limits when derived from such diverse data sources Standard practice in Ecopath models has been to develop a pedigree for each parameter with default values for uncertainty based on the nature of the source data For example parameter values based on high precision field observations of biomass within the model domain receive default confidence intervals of 10 whereas parameter values based on models developed for elsewhere or professional judgment receive confidence intervals of 8034 Sensitivity analyses are then run using parameter values selected from within these confidence intervals However if these default confidence intervals do not capture the full range of variability then the outputs are not informative of the variability in the lsquorealrsquo ecosystem Field observations were collected for many functional groups within the model domain in 2012 and 2013 as part of studies to support the RBT2 EIS Apparently the purpose of these observations was to document spatial variability (in part for the Ecospace model) and temporal variability (measurements at one location over time) and not to derive confidence intervals around the observations35
The reliance on the pedigree approach to derive confidence intervals for this Roberts Bank model was criticized by DFO ECCC and NRCan in discussions with the Proponent As a result the Proponent reran the model with much larger confidence intervals ranging from 30 to 100 depending on the input parameter and functional group36 The results from this new analysis using the broader confidence intervals were similar to those using the original pedigree approach The Proponent noted that ldquoWhile the production within each helliprun was very different there was little difference in the biomass ratio [with and without the Project] These results further demonstrate that even with a greater range in input values the influence of the Project on the Roberts Bank ecosystem is consistent among allhellipmodel runsrdquo37 This provides confidence that the model may be robust to uncertainty in its input parameters Two concerns
30 PMV Response 2016-03-02 p 70 lines 1321-1322 31 PMV Response 2016-03-02 p 71-74 32 PMV Response 2016-03-02 p 71 lines 1339-1341 33 PMV Response 2016-03-02 p 73 34 EIS Appendix 10-C Section 251 page 18 35 PMV Response 2016-03-02 p 42 lines 772-777 36 PMV Response 2016-03-02 p 44-47 37 PMV Response 2016-03-02 p 47 lines 855-858 and see also PMV Response 2016-03-02 Appendix 27-B
Pacific Region Science Response Technical Review Assessing
Ecosystem Productivity Model of Roberts Bank
17
remain however The quote above indicates that the production among the different model runs was very different although with little difference in the biomass ratios with and without the Project Since biomass is not the same as production it would be informative for understanding model performance and potential impacts to show these production differences This also relates to the point made in Section 34 regarding how well the model represents the real ecosystem and not just within-model comparisons with and without the Project The second question is more technical and relates to how the randomization (Monte Carlo or MC) routine that was used to create multiple model runs used the uncertainty about the diet data Diets are not currently included in the MC routine available to regular users of the Ecosim model how they were handled in this RBT2 model appears not to be explained
Finally the sensitivity analyses indicate that the uncertainty in the input parameters does not lead to much difference between model parameters with or without the project However this conclusion does not describe how the uncertainty in the input parameters affects understanding of the ecosystem
40 Conclusions Overall the main conclusion of the Environmental Impact Statement from the Proponent is stated as ldquohellipafter the implementation of mitigation hellipthe Project is not expected to result in any significant adverse effects on any of the 16 valued componentsrdquo38 In addition ldquohellipapproximately 40 of the functional groups are forecast to change no more than 5 which hellip is judged to be within the uncertainty of the model runsrdquo39 although larger changes were forecast for orange sea pens freshwater biofilm green algae and raptors The conclusions from the modelling studies are that ldquohellipthe proposed project will have an impact on the study area that the effect varies between species and that the findings are robust to parameter uncertaintyrdquo40 Specific outcomes by valued component as derived from the EwE model are presented by functional groups in Table 1
38 PMV March 2015 Roberts Bank Environmental Impact Statement Executive Summary ndash Part 1 page 37 39 EIS Appendix 10-C p ii 40 EIS Appendix 10-D p iv
Pacific Region Science Response Technical Review Assessing
Ecosystem Productivity Model of Roberts Bank
18
Table 1 Changes in productive potential with the Project as derived from the EwE model
Changes in productive potential
Ecosystem category
Number of valued
components
Number with potential
biomass loss
Moderate decrease (31-60 decline)
Minor decrease (6-30 decline)
Negligible (0-5
change)
Minor increase (6-
30 increase)
Moderate increase (31-60 increase)
Source
Marine vegetation
7 7 - 3 2 2 - EIS Vol 3 Section 11 Table 11-17 page 11-65
Marine invertebrates
4 3 1 1 1 1 - EIS Vol 3 Section 12 Table 12-8 page 12-52
Marine fish 13 13 - 2 6 5 - EIS Vol 3 Section 13 Table 13-10 page 13-95
Coastal birds
11 8 - 3 4 3 1 EIS Vol 3 Section 15 Table 15-10 page 15-67
Pacific Region Science Response Technical Review Assessing
Ecosystem Productivity Model of Roberts Bank
19
Most functional groups showed some potential biomass loss with the Project with biomass loss defined as any model run with negative outcomes (ie in which biomass with the project was less than biomass without the Project) The summary of changes in productivity potential are mixed with most (33 out of 35) valued components showing minor decreases to minor increases (defined as 6 to 30 changes in productive potential with the Project compared to without the Project)
The main conclusions of this review in regards to the Terms of Reference are
1 Do the functional groups and abiotic variables used in the model adequately represent the ecosystem at Roberts Bank
o The 58 functional groups and abiotic variables used in the model adequately represent the main components of the Roberts Bank ecosystem however for longer lived species the life stages of the species are not well represented and some of the impacts of the Project may be expected to affect specific life stages
o The abiotic variables adequately represent the physical drivers of this ecosystem on an annual time scale However annual values for these abiotic variables may not adequately capture important sub-annual events such as storms (DFO 2016) the timing of arrival and departure of highly migratory species and whether there may be important sub-annual thresholds or mismatches in timing as a result of the Project
o Biotic factors (eg nutrients) which are particularly important for biofilm and other lower trophic level taxa are not included in this model The model is therefore unable to assess the potential development of eutrophication and benthic organic enrichment events which may affect fish habitats in the study area
2 Are the parameter estimates used by the model valid and defensible for this system
o In general parameter estimates appear to be adequate for this system Field studies were done in two years to provide data in particular on distributions of selected functional groups for the Ecospace module Note the distribution studies focussed on taxa which were relatively immobile and therefore lsquofixedrsquo in space
o the selection of some model parameters would benefit from further explanation for example the choice of fixed diet matrices versus dynamic matrices which can vary with changes in abundances or predators and prey
o the selection of some model parameters would benefit from further explanation for example the link between the diets described in the text of Appendix 10B and the quantities presented in Appendix A of Appendix 10B It is understood that proportions were derived using the ldquofixed selectivityrdquo principle but in order to be fully transparent the derivation of each diet should be provided in an appendix
o discussion and explanation is needed of why ecotrophic efficiencies differ from expected values (eg the ecotrophic efficiency for Pacific herring is listed as 038) and
o the abiotic factor lsquosubstratersquo was limited to ldquohardrdquo or rdquosoftrdquo options which can be restrictive given that they serve as endpoints on a substrate composition continuum These limited options may not provide the sensitivity required to assess substrate preference nor the flexibility for taxa (eg motile organisms) that span hard mixed and soft substrate types In addition it is not clear if changes in the hardsoft categories were considered over time within identified depositional or erosional settings before and after construction
Pacific Region Science Response Technical Review Assessing
Ecosystem Productivity Model of Roberts Bank
20
3 Are the limitations and uncertainties of the model identified and appropriately considered when determining the modelrsquos representation of current and possible future conditions
o the EwE model was not designed to evaluate a range of future conditions It was designed to estimate changes in the productive potential at the ecosystem level with and without the Project Therefore the model was run without the Project and with the Project for a range of plausible abiotic conditions and the results were compared with respect to biomass and productivity by functional group
o the pedigree approach to assessing the uncertainties of model outcomes is unsatisfactory for the purpose here as it relates solely to a qualitative judgment of the value of data based on its source However when the model was rerun with much wider ranges of confidence intervals (uncertainties) the results in general (but not necessarily for each functional group) were similar to the results using the original pedigree approach This suggests that taken overall the model may be robust to wide ranges of uncertainty in these input variables and parameters
o there is inadequate validation of the model This is inadequate for three reasons
(i) the basic Ecopath model is not validated and the Ecospace balancing process (the spin-up period) resulted in some biomass estimates being increased or decreased beyond their confidence limits
(ii) the goodness of fit test used to evaluate how well the model predicted the spatial occurrence functional groups is not fit for purpose (Section 34) and
(iii) validation was provided for only a small number of functional groups (the habitat-forming functional groups) As a consequence the model is currently not validated
o Considering the proportion of open boundaries relative to closed boundaries in the model processes taking place outside the modelled ecosystem are likely to contribute to dynamics within the modelled ecosystem However these external processes may not be well-resolved by the EwE model as currently configured
4 Are the model results related to the potential effects of the Project on fish and fish habitat and migratory birds and their food resources valid and defensible
o this is a very complex ecosystem model constructed for a relatively small and open (in the sense of considerable exchange with adjacent non-modelled areas) system Many assumptions have been made based on poor or missing data Taking all these considerations into account the model does the best job possible of comparing the biomass and productivity of the Roberts Bank ecosystem with and without the Project
o the extent to which the model adequately represents the lsquorealrsquo ecosystem of Roberts Bank as opposed to comparisons of model results with and without the Project is unclear as a number of basic diagnostics are not presented (see point 3 above)
o the EwE model is not capable of and is not designed to represent nutritional and food quality variations in prey functional groups and how these may impact highly migratory predators such as birds with and without the Project
5 Is the EwE model framework a valid method to quantify large scale impacts to fish habitat fish productivity and migratory bird productivity
o the EwE model as implemented in this project and reviewed here is a useful first-order framework to organise information and derive initial estimates of how the system may respond to perturbations
Pacific Region Science Response Technical Review Assessing
Ecosystem Productivity Model of Roberts Bank
21
o the utility of a EWE model for impact purposes is highly dependent on the quality of input data
o each EwE model is highly dependent on local conditions Although appropriate as an overall methodology each application would need to be reviewed for how it may be applied to any new ecosystem and
o the EwE model would need to be substantially reformulated if it was to include considerations of changes in chemical composition or food quality of prey in particular for seasonal migratory species such as birds which may depend on very large biomasses of prey with specific chemical composition to fuel their migrations beyond the ecosystem model boundaries
Contributors Contributor Affiliation Ian Perry Author DFO Science Pacific Region Alida Bundy Author DFO Science Maritimes Region Terri Sutherland Author DFO Science Pacific Region Robert Elner Author ECCC Canadian Wildlife Service Andrew Robinson Author ECCC Canadian Wildlife Service Lesley MacDougall Editor DFO Science Pacific Region
Approved by Carmel Lowe
Regional Director Science Branch Pacific Region Fisheries and Oceans Canada
November 4 2016
Sources of Information Christensen V Coll M Steenbeek J Buszowski J Chagaris D walters CJ 2014
Representing variable habitat quality in a spatial food web model Ecosystems 17 1397-1412
Christensen V and Walters C 2000 Ecopath with Ecosim methods capabilities and limitations Ecological Modelling 172 109-139
Colleacuteter M Valls A Guitton J Gascuel D Pauly D and Christensen V 2015 Global overview of the applications of the Ecopath with Ecosim modeling approach using the EcoBase models repository Ecological Modelling 302 pp42-53
Compass Resource Management Ltd 2013 Roberts Bank Terminal 2 Technical Advisory Group (TAG) Process Report Productive Capacity ndash Final Report 119pp (Accessed November 1 2016)
DFO 2016 Technical Review of Roberts Bank Terminal 2 Environmental Assessment Section 95 ndash Coastal Geomorphology DFO Can Sci Advis Sec Sci Resp 2016045 (Accessed November 4 2016)
Pacific Region Science Response Technical Review Assessing
Ecosystem Productivity Model of Roberts Bank
22
ESSA Technologies 2014a Roberts Bank Terminal 2 Project Roberts Bank Delta BC Environmental Impact Statement Volume 3 Biophysical Effects Assessments Appendix 10-C Roberts Bank Ecosystem Model Development and Key Run Port Metro Vancouver (Accessed November 1 2016)
ESSA Technologies 2014b Roberts Bank Terminal 2 Project Roberts Bank Delta BC Environmental Impact Statement Volume 3 Biophysical Effects Assessments Appendix 10-D Roberts Bank Ecosystem Model Sensitivity Analyses Port Metro Vancouver (Accessed November 1 2016)
Franklin J 2009 Mapping Species Distributions Spatial Inference and Prediction Cambridge University Press Cambridge
Hemmera 2014 Roberts Bank Terminal 2 Project Roberts Bank Delta BC Environmental Impact Statement Volume 3 Biophysical Effects Assessments Appendix 10-B Roberts Bank Ecosystem Model Parameter Estimates Port Metro Vancouver File 302-03503 (Accessed November 1 2016)
Port Metro Vancouver 2015a Roberts Bank Terminal 2 Project Roberts Bank Delta BC Environmental Impact Statement Volume 3 Biophysical Effects Assessments Section 100 Biophysical Setting (Accessed November 1 2016)
Port Metro Vancouver 2015b Roberts Bank Terminal 2 Project Roberts Bank Delta BC Environmental Impact Statement Volume 3 Biophysical Effects Assessments Section 103 Overview of Assessing Ecosystem Productivity (Accessed November 1 2016)
Port Metro Vancouver 2015c Roberts Bank Terminal 2 Project Environmental Assessment Additional Information Requirements (July 31 2015) Responses Response to Information Request 6 IR-73115-06 Canadian Environmental Assessment Agency Reference Number 80054 dated 26 October 2015
Steenbeek J Coll M Gurney L Meacutelin F Hoepffner N Buszowski J and Christensen V 2013 Bridging the gap between ecosystem modeling tools and geographic information systems Driving a food web model with external spatialndashtemporal data Ecological Modelling 263 139ndash 151
Sutherland T Elner R and OrsquoNeill J 2013 Roberts Bank Ecological crucible of the Fraser River estuary Progress in Oceanography 115 171ndash180
Vancouver Fraser Port Authority 2016 From the Vancouver Fraser Port Authority to the Review Panel re Answers to preliminary technical questions submitted during the completeness phase from Fisheries and Oceans Canada Natural Resources Canada and Environment and Climate Change Canada concerning the ecosystem modelling to support the Roberts Bank Terminal 2 Project environmental review CEAR Document 547 (Accessed November 1 2016)
Pacific Region Science Response Technical Review Assessing
Ecosystem Productivity Model of Roberts Bank
23
This Report is Available from the Centre for Science Advice
Pacific Region Fisheries and Oceans Canada
3190 Hammond Bay Road Nanaimo BC V9T 6N7
Telephone (250) 756-7208 E-Mail csapdfo-mpogcca
Internet address wwwdfo-mpogccacsas-sccs
ISSN 1919-3769 copy Her Majesty the Queen in Right of Canada 2016
Correct Citation for this Publication
DFO 2016 Technical review of Roberts Bank Terminal 2 environmental assessment section 103 ndash assessing ecosystem productivity DFO Can Sci Advis Sec Sci Resp 2016050
Aussi disponible en franccedilais
MPO 2016 Examen technique de leacutevaluation environnementale du Terminal 2 agrave Roberts Bank section 103 ndash eacutevaluation de la productiviteacute de leacutecosystegraveme Secr can de consult sci du MPO Reacutep des Sci 2016050
- TECHNICAL REVIEW OF ROBERTS BANK TERMINAL 2 ENVIRONMENTAL ASSESSMENT SECTION 103 ndash ASSESSING ECOSYSTEM PRODUCTIVITY
-
- 10 Context
- 20 Background
-
- 21 Background and Terms of Reference
- 22 Approach to assessing ecosystem productivity
-
- 30 Analysis and Response
-
- 31 The EwE Team
- 32 Overview of assessment results of hydrological and sediment modelling
- 33 Model implementation
-
- 331 The purpose of the EwE model
- 332 Applicability of the EwE model framework to the Roberts Bank region
- 333 Model documentation
- 334 Highly mobile functional groups
- 335 Seasonality (model time step)
- 336 Life history structure
- 337 Model balancing
-
- 34 Model validation
- 35 Model results
-
- 351 Presentation of model results
- 352 Sensitivity and vulnerability analyses
-
- 40 Conclusions
- Contributors
- Approved by
- Sources of Information
- This Report is Available from the
-
- CSAS 2016-50 - Assessing Ecosystem Productivitypdf
-
- TECHNICAL REVIEW OF ROBERTS BANK TERMINAL 2 ENVIRONMENTAL ASSESSMENT SECTION 103 ndash ASSESSING ECOSYSTEM PRODUCTIVITY
-
- 10 Context
- 20 Background
-
- 21 Background and Terms of Reference
- 22 Approach to assessing ecosystem productivity
-
- 30 Analysis and Response
-
- 31 The EwE Team
- 32 Overview of assessment results of hydrological and sediment modelling
- 33 Model implementation
-
- 331 The purpose of the EwE model
- 332 Applicability of the EwE model framework to the Roberts Bank region
- 333 Model documentation
- 334 Highly mobile functional groups
- 335 Seasonality (model time step)
- 336 Life history structure
- 337 Model balancing
-
- 34 Model validation
- 35 Model results
-
- 351 Presentation of model results
- 352 Sensitivity and vulnerability analyses
-
- 40 Conclusions
- Contributors
- Approved by
- Sources of Information
- This Report is Available from the
-
Canadian Science Advisory Secretariat Pacific Region Science Response 2016050
December 2016
TECHNICAL REVIEW OF ROBERTS BANK TERMINAL 2 ENVIRONMENTAL ASSESSMENT SECTION 103 ndash
ASSESSING ECOSYSTEM PRODUCTIVITY
10 Context Vancouver Fraser Port Authority (VFPA) formerly Port Metro Vancouver (the Proponent) is proposing to construct and operate the Roberts Bank Terminal 2 Project (the Project) a new three-berth marine container terminal at Roberts Bank in Delta British Columbia The proposed terminal is located next to the existing Deltaport and Westshore Terminals In addition to the construction of the new terminal the Proponent has proposed to widen the north side of the existing Roberts Bank causeway from its east-end connection with the mainland to the entrance to the new terminal The existing tug basin connected to the northeast side of Deltaport Terminal is also proposed to be expanded The new marine terminal is predicted by the Proponent to process up to 260 container ship calls per year at full capacity with the assistance of two or three large berthing or escort tugs to manoeuver ships into or away from assigned berths The terminal is designed to operate 24 hours per day year-round
The Roberts Bank Terminal 2 Project is subject to an environmental assessment by a Review Panel pursuant to the Canadian Environmental Assessment Act 2012 As a federal authority in the environmental assessment for the Project Fisheries and Oceans Canada (DFO) will be asked to present information to the review panel and at public hearings in relation to its expertise on the effects of the Project on fish and fish habitat including aquatic species at risk and the adequacy of mitigation and offsetting measures and monitoring and follow-up programs proposed by the Proponent DFOrsquos Pacific Region Fisheries Protection Program (FPP) will coordinate DFOrsquos participation in the environmental assessment
The Proponent assessed future ecosystem productivity at Roberts Bank using the Ecopath with Ecosim and Ecospace (EwE) model framework The potential impacts of the Project to hydrodynamic conditions and sediment transport in the area as a result of changes in wind wave and current patterns and intensities are projected using different model frameworks A companion Science Response (DFO 2016) has been developed by DFO and Natural Resource Canada (NRCan) to review Section 95 ldquoCoastal Geomorphologyrdquo of the Environmental Impact Statement (EIS) which describes the hydrodynamic and sedimentology models that were used to evaluate the effect of the Project on water and sediment movements
Outcomes of the EwE models are incorporated into the analysis of the potential project-related effects on the ongoing productivity of commercial recreational and Aboriginal fisheries Consequently DFO FPP has requested that DFO Science Branch provide an evaluation of the Proponentrsquos characterization of project-related effects as conducted using the Ecopath with Ecosim and Ecospace (EwE) ecosystem model
Pacific Region Science Response Technical Review Assessing
Ecosystem Productivity Model of Roberts Bank
2
The objectives for this Science Response are to
1 Determine if the functional groups and abiotic factors used in the model adequately represent the ecosystem at Roberts Bank
2 Assess whether the parameter estimates used by the model are valid and defensible for this system
3 Assess whether the limitations and uncertainties of the model are identified and appropriately considered when determining the modelrsquos representation of current and possible future conditions
4 Provide advice regarding whether the model results related to the potential effects of the Project on fish and fish habitat and migratory birds and their food resources are valid and defensible
5 If possible provide advice regarding the validity of using the EwE model framework to quantify large scale impacts to fish habitat and fisheries productivity and the productivity of migratory birds
This Science Response evaluates Section 100 ldquoBiophysical Settingrdquo with a focus on Section 103 ldquoOverview of Assessing Ecosystem Productivityrdquo in the EIS as submitted by the Proponent (Port Metro Vancouver 2015) This Section and consequently this Response describes the ecosystem modelling approach that was taken to evaluate the direct and indirect effects of the footprint of the proposed terminal and widened causeway herein referred to as lsquothe Projectrsquo This ecosystem model provides outputs related to potential effects of the project on the study area at an ecosystem level including aquatic species and bird species in the Project area Evaluation of the model and its outputs therefore required expertise in both fishery aquatic species and migratory bird species Consequently this Science Response is the product of a joint review between DFO and Environment and Climate Change Canada (ECCC) Canadian Wildlife Service and Wildlife and Landscape Science to provide a complete evaluation
This Science Response Report results from the Science Response Process of July 2016 on the Technical Review of Ecopath with Ecosim and Ecospace (EwE) Ecosystem Productivity Model application to the Roberts Bank Terminal 2 Environmental Assessment
20 Background
21 Background and Terms of Reference The Projectrsquos main components have a proposed combined marine footprint area of approximately 179 km2 listed below by specific component
bull Marine Terminal 1335 km 2 including terminal (116 km 2) and dredged berth pocket and marine approach areas (0174 km 2)
bull Widened Causeway 0424 km 2
bull Expanded Tug basin 0031 km 2
Roberts Bank in the Fraser River estuary consists of complex intertidal and subtidal habitats including intertidal eelgrass beds and is an important stopover area for migrating shorebirds and productive feeding and rearing habitats for many fish and invertebrate species It also provides habitat for endangered Southern Resident Killer Whales and other marine mammals
Pacific Region Science Response Technical Review Assessing
Ecosystem Productivity Model of Roberts Bank
3
The environmental conditions at Roberts Bank are dynamic and are influenced by a variety of oceanographic and atmospheric factors including the Fraser River freshwater and sediment plume discharge diurnal tidal currents and prevailing and storm-generated wind and wave activity In addition the intercauseway region provides significant drainage from marsh and agricultural areas which have different characteristics from marine waters and which run along the ferry causeway
To provide the required science advice this Science Response focusses on Section 10 ldquoBiophysical Settingrdquo of the Environmental Impact Statement (EIS) (Port Metro Vancouver 2015a) specifically Section 103 ldquoOverview of Assessing Ecosystem Productivityrdquo (Port Metro Vancouver 2015b) and its related Appendices 10-B ldquoRoberts Bank Ecopath with Ecosim and Ecospace model parameter estimatesrdquo (Hemmera 2014) Appendix 10-C ldquoRoberts Bank Ecosystem model development and key runsrdquo(ESSA Technologies 2014a) and Appendix 10-D ldquoRoberts Bank Ecosystem model sensitivity analysesrdquo (ESSA Technologies 2014b) Additional important information was obtained from the Response to Information Request 6 (IR-73115-06 Canadian Environmental Assessment Agency Reference Number 80054 dated 26 October 2015) (Port Metro Vancouver 2015c) and the Written Responses to Coastal Geomorphology and Ecosystem Modelling Questions provided by the Proponent to DFO ECCC and NRCan on 2 March 2016 (Port Metro Vancouver (PMV) Transmittal TRE-01-RBT2-0004A subsequently referred in this Science Response as ldquoPMV Response 2016-03-02rdquo) (Vancouver Fraser Port Authority 2016)
The process followed in preparing this Science Response involved an initial review of the submitted EIS followed by an in-person meeting of the Proponent its contractors and representatives of DFO ECCC and NRCan to discuss and clarify questions arising from the initial review (Vancouver 23 November 2015) DFO and NRCan provided written questions to the Proponent based on preliminary review of the EIS on November 19 2015 ECCC also provided written questions based on its preliminary review of the EIS to the Proponent on December 1 2015 and January 20 2016 This large initial meeting was followed by smaller focussed meetings between the Proponent its contractors and DFO and NRCan on 11 December 2015 to clarify hydrology and sediment modelling questions with DFO on 8 January 2016 to clarify ecosystem modelling questions and with ECCC on 18 February 2016 to clarify questions relating to birds Written responses to all of these meetings and questions were provided by the Proponent to DFO ECCC and NRCan as the ldquoPMV Response 2016-03-02rdquo and ldquoPMV Response 2016-05-30rdquo (Vancouver Fraser Port Authority 2016) VFPArsquos answers to questions posed by DFO and NRCan regarding coastal geomorphology modelling have been posted to the Canadian Environmental Assessment Registry (CEAR)
22 Approach to assessing ecosystem productivity The Proponent adopted an ecosystem approach to evaluate the direct and indirect effects of the Project on the productivity of the Roberts Bank ecosystem A weight of evidence approach was used to assess the potential effects of the project on the productivity of the ecosystem and selected key components in the study area this approach included a spatial ecosystem simulation model (which included a habitat capacity model) a shorebird opportunity model and empirical data An important point is that any effects on the system during the construction phase or from expansion of the tug basin were excluded from this modelling process the focus instead being a comparison of modelled system productivity before and after the proposed terminal and expanded causeway is in place The chosen ecosystem simulation model was
Pacific Region Science Response Technical Review Assessing
Ecosystem Productivity Model of Roberts Bank
4
Ecopath with Ecosim and its spatial version Ecospace (collectively referred to here as the EwE framework or EwE model) This modelling approach was recommended by a prior Productive Capacity Technical Advisory Group comprised of representatives of technical experts from government agencies academia non-governmental organizations Vancouver Fraser Port Authority and its consultants (Compass 2013) convened by the Proponent and which also recommended a selection of focal species for the model The final selection of functional groups and the resulting food web that form the core of this ecosystem model are shown in Figure 1
Pacific Region Science Response Technical Review Assessing
Ecosystem Productivity Model of Roberts Bank
5
Figure 1 Ecopath with Ecosim model food web for Roberts Bank (Adapted from EIS Volume 3 Section 10 Fig 1033 on page 10-16) The groups coloured in orange represent focal groups size of symbols represents relative annual amount of biomass in the Roberts Bank study area
Pacific Region Science Response Technical Review Assessing
Ecosystem Productivity Model of Roberts Bank
6
The EwE framework is a common approach to ecosystem modelling which has been developed and expanded over the past two to three decades It currently has three main components
1 Ecopath ndash the core model which provides a mass-balance snapshot of the system
2 Ecosim ndash a module that enables simulation modelling over time
3 Ecospace ndash a module that enables simulation modelling over space
In order to make an EwE model tractable species are aggregated into functional groups based on their similar ecological characteristics (habitat and prey preferences etc) the Roberts Bank models had 58 functional groups The first step (Ecopath) was to obtain input parameters representing biomass production consumption emigration and diet for each functional group These parameters were then tuned in an iterative process until the overall production and consumption was balanced (a mass-balance approach) resulting in a model food web with estimates of energy flow between functional groups (Fig 1)
In the second step Ecosim was combined with the spatial model Ecospace The abiotic variables selected in this EIS (depth salinity bottom current wave height sediment type) were used as external forcings to the Ecospace module These abiotic variables provided the physical forcings for the simulations without and with the Project Since time series data on the functional groups of the model were not available Ecospace was run until the model reached equilibrium using various assumptions of the value of the vulnerability parameter (see Section 352) In this EIS the selected time step was annual with all variables abiotic and biotic expressed as yearly averages As used in this EIS the Ecospace module included a habitat capacity model which estimated the distribution of functional groups based on their environmental preferences for each abiotic variable (depth salinity bottom current wave height) and for substrate type (sand mud etc) The model thus allocated the spatial distribution of functional groups over the model domain based on their environmental preferences and the distributions of these abiotic variables with and without the Project The selected spatial unit size (ldquopixelrdquo) for the Ecospace model was 100 m2 In essence an Ecopath model was constructed for each pixel with particular rules governing how the functional groups interacted and moved among these spatial units The Ecospace module was run until it approached equilibrium (20 model years) to establish the spatial patterns without the Project For the lsquowith the Projectrsquo simulations the model was run for an initial 10 years and then the spatial patterns of the abiotic variables with the project were added and the model run for an additional 10 years1 The model outputs predicted changes in the productive potential of the Roberts Bank ecosystem as a comparison (ratio) with and without the Project rather than an absolute biomass that would be lost or gained as a result of the Project
1 EIS Appendix 10-C p 26
Pacific Region Science Response Technical Review Assessing
Ecosystem Productivity Model of Roberts Bank
7
30 Analysis and Response To prepare this response the following sections of the EIS additional documents were reviewed
DocumentSection Title
EIS Section 10
Including appendices 10B 10C and 10D
(Port Metro Vancouver 2015a Hemmera 2014 ESSA Technologies 2014a ESSA Technologies 2014b)
Biophysical Setting
Appendix 10-B Roberts Bank Ecosystem Model Parameter Estimates Port Metro Vancouver File 302-03503
Appendix 10-C Roberts Bank Ecosystem Model Development and Key Run Port Metro Vancouver
Appendix 10-D Roberts Bank Ecosystem Model Sensitivity Analyses Port Metro Vancouver
CEAR document 547 (Including Appendices) ldquoPMV Response 2016-03-02rdquo and ldquoPMV Response 2016-05-30rdquo
(Vancouver Fraser Port Authority 2016)
Vancouver Fraser Port Authority to the Review Panel re Answers to preliminary technical questions submitted during the completeness phase from Fisheries and Oceans Canada Natural Resources Canada and Environment and Climate Change Canada concerning the ecosystem modelling to support the Roberts Bank Terminal 2 Project environmental review
31 The EwE Team Building this ecosystem model was a complex undertaking which required knowledge of the ecosystem to be modelled how to set initial parameter values determination of reasonable ranges of these parameters how to balance the model and how to recognize when the model outputs were unrealistic These tasks became even more complex when spatial model dynamics were involved such as with Ecospace The team engaged by the Proponent to conduct this ecosystem modelling for the Roberts Bank Terminal 2 (RBT2) EIS was led by scientists at the Institute for Oceans and Fisheries located at the University of British Columbia in Vancouver These scientists are global leaders of the EwE model framework having developed much of its current implementation and who continue to lead its elaborations and extensions Construction and running of the model for this specific ecosystem was done in collaboration with ESSA Technologies of Vancouver Parameter values for the ecosystem model were obtained in part from observational studies conducted in the area by Hemmera of Burnaby BC
32 Overview of assessment results of hydrological and sediment modelling Implementation of the ldquowith the Projectrdquo simulations of the ecosystem model was done by driving the model with the abiotic variables as they were projected to be distributed with the Project footprint In the context of this EIS specifying depth salinity bottom currents wave height and sediment type conditions without the Project and changes with the Project were achieved by construction of hydrodynamical and sediment transport models The outputs from these models in combination with the identified environment preferences for the various biological groups were then used as inputs to the Ecospace model to define the spatial
Pacific Region Science Response Technical Review Assessing
Ecosystem Productivity Model of Roberts Bank
8
distributions of these functional groups The implementation of these hydrological and sediment transport models in this EIS was reviewed by DFO and NRCan (DFO 2016) This review concluded that the implementation of these models for this EIS was adequate for average winter conditions but lacking in validation for summer conditions in particular with strong freshwater flows from the Fraser River Simulations of strong storm events and their impacts on wave conditions and sediment transport were also lacking The effect of wave action and current speeds on sediment transport is non-linear such that increasing winds over short periods of time can impact sediment transport processes bottom topography and water depths beyond that determined under average model conditions Overall the review concluded that a greater range of sensitivity analyses is required to have confidence in the model outputs under lsquonon-averagersquo conditions The implication of this conclusion for the present review of the EwE model is that the full range of variability of abiotic characteristics such as bottom topography bottom current and wave heights and how they may affect relevant functional groups in the model with the Project may not be adequately represented Sensitivity analyses were provided by varying the intensity of abiotic variables and by removing abiotic variables to assess their interactive effects In general the ecosystem model outputs were robust to these sensitivity analyses with most groups varying by less than 5 Larger changes however were observed for primary producer and bird groupings and for some fish groups when various abiotic variables were omitted2
33 Model implementation 331 The purpose of the EwE model
The EwE model was intended to provide one line of evidence to assess the potential impacts of the Project on the Roberts Bank ecosystem which would then be used with other lines of evidence to make the final assessment Specifically ldquohellip the objective of the RB [Roberts Bank] model was not to provide an assessment of Project impacts for each functional group at a fine temporal scale but to estimate changes in productive potential with and without the Project at the ecosystem levelrdquo3 In addition ldquohellipthe primary objective of the RB ecosystem model is to evaluate potential changes in productivity from such abiotic factors with and without the terminal and causewayrdquo4 Results are presented for the selected functional groups no results were presented on potential changes in ecosystem structure or function
332 Applicability of the EwE model framework to the Roberts Bank region EwE models work best when the exchanges within the system being modelled are greater than the exchanges between the modelled system and the lsquooutsidersquo world In practice this means that EwE models work best for larger systems with few external exchanges In a meta-analysis of 433 Ecopath models Colleacuteter et al (2015) concluded that ldquohellipin the last two decades the range of the models area has expanded toward very large areas and the median has shifted accordingly from about 1000 km2 in 1984ndash1993 to about 100000 km2 in 1994ndash2014rdquo The section of the Roberts Bank ecosystem that is included in the EwE model was comparatively small (5468 km2) and complex It is an intertidally-dominated environment that is subject to strong seasonal influences of both freshwater and marine exchanges across relatively large seaward and shoreward boundaries
2 EIS Appendix 10-D p ii - iii 3 PMV Response 2016-03-02 p 99 lines 1914-1917 4 PMV Response 2016-03-02 p 38 lines 689-691
Pacific Region Science Response Technical Review Assessing
Ecosystem Productivity Model of Roberts Bank
9
Processes taking place outside the modelled ecosystem will contribute to dynamics within the modelled ecosystem (eg lsquooutsidersquo food supporting predators which occur in the Roberts Bank ecosystem for only part of the year predators which may feed in the Roberts Bank ecosystem but export this energy when they migrate out of the region) but which may not be well-resolved by the EwE model The Proponent justifies the spatial scale because it was specifically chosen for the questions being asked in regard to assessing productivity changes and because the relative influences of external exchanges are assumed to be identical with and without the project In addition highly mobile species with broad prey bases were assumed in the model to be partially sustained by external energy from outside the model system5 The distributions of organisms may differ however with and without the project which may affect their interactions with areas outside of the modelled system and the use of diets from outside the modelled system may not reflect the impacts of the project Further clarification of how the EwE model captures the exchanges and interactions with adjacent ecosystems are needed For example it could be argued that an ecosystem which is open to frequent exchanges of water and organic matter from beyond its boundaries might be more robust to local disturbances such as the Project
There are some inconsistencies in the information and assumptions used for some of the taxa in this ecosystem model For Dungeness Crab the justification for estimating total adult biomass (including females) from the biomass of fished males is unclear In addition it is unclear if the slower growth of female crabs once they have reached sexual maturity in comparison with male crabs has been considered The diet matrix for spiny dogfish does not represent the actual diet well in particular of euphausiids herring and shrimp and there are more recent references for biomass estimates of spiny dogfish in the study area than what was used in the EIS
Fishing mortality was not included in the model under the assumption that this would not change with or without the project While this assumption may be true the model has been parameterized by ignoring a source of mortality that will influence total production In essence fishing removes biomass from the ecosystem with the result that less biomass will be available for higher trophic levels How this may impact the ecosystem with and without the Project is unclear but it could make noticeable differences if for example there were thresholds in the feeding responses by these higher trophic level species The Ecopath model that was used is relatively unconstrained since many ecological efficiencies are low even for forage species which would be expected to be higher It is not clear how many species are exploited or the levels of exploitation but even if this does not change with the Project these mortality rates should be included in the model in order to add realistic constraints to the exploited functional groups
333 Model documentation Based on questions from DFO ECCC and NRCan following their initial review of the EIS the Proponent provided written responses dated 2 March 2016 to clarify several of the steps in the model development and implementation However several questions remain including questions about the Ecospace module Ecospace has undergone several recent developments such as the inclusion of the spatial-temporal data layer framework (Steenbeek et al 2013) the habitat capacity model (Christensen et al 2014) and the Monte Carlo analysis including the diet matrix As yet there are few published studies using these latest Ecospace developments and their documentation and justification need to be improved in the EIS
5 PMV Response 2016-03-02 p 29 lines 446 - 464
Pacific Region Science Response Technical Review Assessing
Ecosystem Productivity Model of Roberts Bank
10
Questions also remain regarding how the Monte Carlo randomization routine treated diet data The report indicates that the Monte Carlo routine randomly selected input parameters from the input ranges and that only models that were balanced were used This suggests that a high proportion of models were not balanced and therefore were not used (for example the EIS indicates that about one out of 1000 sampled input parameters was balanced6) A table showing the minimum maximum mode average and median values from the Monte Carlo runs for all the parameters would enable an evaluation of how much variation was actually sampled by the balanced model runs This is recommended in the EwE user information ie ldquoUsers should check the range of the input parameters that were actually used in the trials in the output csv file (see below)rdquo7
In addition there are several issues with the documentation of the derivation of the parameters for the functional groups Such documentation should clearly outline how the input parameter was estimated and the range of uncertainty for that parameter For example the input biomass of pinnipeds was defined as 04 t km 2 derived from estimates of 034 for Harbour seals and two estimates for Steller sea lions (012 and 014 t km 2) No explanation was provided for how the overall estimated pinniped biomass of 04 t km 2 was determined The diet of Sand Lance was described in the EIS as consisting mostly of zooplankton8 whereas the diet table for the model runs9 included 20 macrofauna 10 green algae and 10 detritus It is unclear why these additional prey were included in the diet used for the model runs
334 Highly mobile functional groups This implementation of the EwE framework included transient and migratory functional groups This is entirely appropriate and these groups cannot be excluded The approach taken in the Ecospace module was to impose a low (and conservative) dispersal rate among model spatial units (lsquopixelsrsquo) of 1 km yr-1 This may be appropriate for low mobility benthic organisms but it likely underestimates the movements of many other functional groups The effects of using higher and perhaps functional-group-specific dispersal rates was not considered The Proponents argued that higher dispersal rates would reduce impacts since species can move away from less desirable areas more quickly for completeness these runs should be done and evaluated Mobile species will also bring energy (food) captured outside the system into the modelled ecosystem This process was included in the model with the use of a diet import factor reflecting the consumption of prey outside the modelled region with the assumption that groups with high import rates were unlikely to respond to local changes on Roberts Bank10 This assumption needs justification perhaps at the functional group level for example many species of highly migratory birds and Pacific salmon use the Roberts Bank ecosystem to obtain food to continue their migrations Although this food does not compose a large fraction of their annual consumption it can be critical to enable them to continue their migrations
The EwE model is not designed to capture differences in prey quality ie differences in essential fatty acid or nutrient ratios The same species of prey may have greater or lesser nutritional value to predators depending on the conditions under which they are growing and their seasonal variations This is a particular concern with the nutritional quality of the diatom-dominated biofilm Diatomaceous biofilm is important to the highly migratory Western Sandpiper (Calidris mauri) Despite its predictive merits in relation to other ecosystem
6 EIS Appendix 10D Section 24 p5 7 EwE Help file p 151 8 EIS Appendix 10B Section 4133 p 76 9 EIS Appendix A of Appendix 10B 10 PMV Response 2016-03-02 p 28 lines 429 - 436
Pacific Region Science Response Technical Review Assessing
Ecosystem Productivity Model of Roberts Bank
11
components the EwE model is not informative with respect to understanding the potential impacts of the Project on biofilm and the Western Sandpiper While this example is specific to seabirds the potential exists for differences in the quality of biofilm to also be an issue for copepods which feed on biofilm and consequently to juvenile salmon which feed on these copepods (eg Sutherland et al 2013)
The EwE model is also not designed to predict effects of the Project on water quality although the Proponent noted that ldquoOther abiotic factors not included were deemed to be representative of variables that were already included in the modelhelliprdquo11 The Project may cause changes in physical and water quality conditions whether in isolation or in combination which may impact the productivity or nutritional quality of key prey organisms for local and migratory species which will not be captured by the model The EwE model does not assess the production of key nutrients or the implications of changes in important physical and water quality parameters to biofilm community structure and hence to important migratory birds
The model does not include biotic factors for both pelagic and benthic environments to assess the potential development of eutrophication and benthic organic enrichment events respectively Organic and redox indicators traditional measures of environmental assessments that are used to determine changes in functional group responses were included in the recent Deltaport Third environmental assessment (ie Pelagic chlorophyll dissolved nutrients Benthic sediment carbonnitrogen content redox state [sulfide concentration]) Benthic anoxic events based on organic enrichment are known to be strong drivers of community composition and exclusion regardless of substrate type In the absence of biotic factors (eg organic particulates) the model has not considered the potential for benthic organic enrichment which coincides with siltation processes within the upper tidal flats The tidal flat corner bordered by the Delta-dyke and Deltaport causeway has served as a catchment area for Fraser River silt since the development of the original Deltaport causeway (Sutherland et al 2013) The proposed position of the new terminal placed at the seaward termination of the Deltaport causeway may produce a crescent-shaped feature in the wake of the Fraser River Plume This feature may provide a more efficient silt trap that will promote benthic organic enrichment This piece of the environmental assessment seems to be missing and is important for assessing fish habitat in this area
335 Seasonality (model time step) Input data to parameterize the model were available on a range of time scales from hourly (eg physical data on salinity and water flow) to annual (eg species biomass) The Proponents indicated12 that this is a strength of the EwE model although ultimately the model was run with an annual time step with all sub-annual values being averaged to annual values This method therefore did not incorporate important seasonal processes such as winter-summer differences in salinity and storm properties and the seasonal appearances of abundances of predators and prey such as migratory salmon and birds that are much larger than the annual average For example juvenile salmon migrate from the Fraser River and onto Roberts Bank in the spring before moving into deeper waters If these spring abundances are averaged over the entire year these average abundances would be 5-10 times lower than the actual abundances during the spring (ie averaging the biomass that occurs in two months over a 12 month period) Additionally this method did not capture the intensity of processes such as growth and predation which can be focused over periods of a few weeks to a few months There may be important threshold effects at particular times and places which may be missed when using an 11 EIS Section 10 p 10-11 12 PMV Response 2016-03-02 p 86 line 1655
Pacific Region Science Response Technical Review Assessing
Ecosystem Productivity Model of Roberts Bank
12
annual time step for the model The Ecospace module has a monthly time step13 and therefore it is feasible to run this module with a sub-annual time step For example the Proponents submit14 that there are inadequate data to model the potential effects of the Project on the timing of biofilm production which could have implications for the migratory dunlin and Western Sandpiper However this could be modelled in an exploratory way to determine hypotheses about which factors could affect the timing of production of biofilm and the potential impacts on these birds These issues are of major concern to ECCC
336 Life history structure The EwE model did not separate functional groups into life history stages (stanzas) yet for many functional groups the juvenile stages can have very different life history characteristics and habitats than the adults It is unclear in the description of the model how different life history structures were considered and whether for example there were enough juveniles to produce the adults The implications of not including early life stages should be explored at least qualitatively to identify which species might have life stages that may be more vulnerable to project effects
337 Model balancing Balancing an EwE model is the process by which parameters are adjusted so that there is sufficient production for consumption requirements ie there are sufficient prey for all predators Expert opinion was used to examine parameter values and to adjust for errors or inconsistencies in logic ldquoPMV is confident that since the approach taken to balance the model was based on best practices the steps are appropriaterdquo15 Adjustments to initial parameters to ensure an ecologically-feasible model are necessary and to be expected For a few functional groups however very large changes to initial parameter estimates (which were often not based on Roberts Bank specific data) were necessary for example to transient killer whales When such initial parameters were adjusted (often by substantial amounts) by expert opinion to balance the model the confidence intervals around these adjusted parameter values were not increased to reflect this added uncertainty (see for example PMV Response 2016-03-02 p 51 lines 955-956) When expert opinion was used to make very large changes to initial parameter values broader confidence intervals about these parameters should have been applied This does not appear to have been the case and as a consequence may cause the actual uncertainty of the model outputs to be underestimated
Another example is for the pinniped group in which 50 of the diet was assumed to come from outside the model area in order to balance the model The rationale provided was ldquoThe pinnipeds caused excessive predation mortalities on numerous fish functional groups The biomass of pinnipeds was an average for the Strait of Georgia which was likely too high for Roberts Bank Therefore it was assumed that pinnipeds extracted only half of their diet from the study areardquo16 It is unclear whether the sensitivity of the model to different percentages of diet allocation was explored
As noted above (332) the Ecopath model was relatively unconstrained and few adjustments to input parameters were required to balance the model This is unusual and the low ecotrophic efficiencies of several functional groups suggest that full accounting of energy flows may not have been achieved (an ecotrophic efficiency of 1 indicates that 100 of the production of that
13 EIS Appendix 10C Section 29 p24 14 EIS Appendix 10D Appendix C p72 15 PMV Response 2016-03-02 p 49 lines 910-912 16 EIS Appendix 10C Section 261 p 20
Pacific Region Science Response Technical Review Assessing
Ecosystem Productivity Model of Roberts Bank
13
particular group is being preyed upon or removed by fishing leaving no individuals to die of old age17) An ldquoexcessrdquo of individuals dying of old age ie ecotrophic efficiencies much less than 1 suggests a potentially large biomass that is not used by the ecosystem and instead is converted to detritus
34 Model validation Model validation is the process by which the model parameters variables and outputs are compared with those from the real ecosystem to ascertain how well the model represents the ecosystem It is an essential step in providing confidence that the projections from the model in this case with and without the Project have relevance to how the real ecosystem may be expected to function with and without the Project In practice validating complex ecosystem models is difficult considering the range of assumptions that must be made when building the model the limited available data and natural variability of the ecosystem at a variety of time and space scales
Many of the standard diagnostics for the Ecopath model have not been evaluated in the EIS The Proponent appears to have assumed that once the Ecopath model was balanced then it was valid and fit for purpose The Proponent should provide all the Ecopath estimates of vital rates including mortality rates As presented questions remain For example many Ecotrophic Efficiencies (which control the transfer of biomass from prey to predators) are less than 1 even for taxa which would be expected to be close to 1 such as carnivorous zooplankton The reason for Ecotrophic Efficiencies less than 1 were not discussed or explained in the EIS
Detailed diagnostics for the Ecospace model should also be presented in order to evaluate model performance In response to criticisms by DFO ECCC and NRCan in discussions with the Proponent the latter provided the biomass of the functional groups from the Ecopath model (before Ecospace) and the Ecospace model after the spin-up period (which involved adjusting the parameters from the Ecopath model to balance the 5468 separate cells of the Ecospace model)18 The Proponents argue that ldquoIt is important to note that changes in biomass values generated during the spin-up period are identical for both with and without Project scenarios and thus do not provide information on the potential Project-related effects on productivity19 However several changes to biomass result from the Ecospace balancing process (spin-up period) This is only given brief attention by the Proponent in its response to the DFO ECCC and NRCan questions An analysis of Table 620 revealed that the biomass of 9 functional groups was larger or smaller than the widest confidence limits allowed for each group21 This requires further discussion and justification
The Proponent used a goodness of fit measure to compare spatial distributions of model outputs with field observations They indicated that ldquono other EwE models were identified which use a goodness-of-fit measure Hence the RB model is potentially the first such EwE model where a goodness of fit measure has been appliedrdquo22 The chosen goodness of fit measure is the percent correct classification (PCC) method23 This method derives a test statistic based on the proportion of locations at which predicted occurrences from the model match observed
17 EIS Appendix 10-B p 11 18 PMV Response 2016-03-02 p 65-66 Table 6 19 PMV Response 2016-03-02 p 64 lines 1205-1207 20 PMV Response 2016-03-02 p 65-66 Table 6 21 PMV Response 2016-03-02 p 45 Table 3 22 PMV Response 2016-03-02 p 78 lines 1481-1483 23 PMV Response 2016-03-02 p 78 lines 1483-1484
Pacific Region Science Response Technical Review Assessing
Ecosystem Productivity Model of Roberts Bank
14
occurrences from data and similarly with predicted and observed absences The Proponent then calculated two additional accuracy of fit measures sensitivity (the model predicts a species to occur in an area where it is known to occur in reality) and specificity (the model predicts a species does not occur in an area it is known not to occur in reality)24 This analysis concluded that the model has high predictability for functional groups such as eelgrass and sea pens with relatively static distributions but lower predictability for functional groups which are more temporally and spatially dynamic such as biofilm and green algae25
There are two problems with this approach The first is that this goodness of fit comparison was done only for habitat-forming functional groups no discussion of how well this analysis applies to mobile functional groups was provided The second problem is that this method does not take into account situations (such as occurs in this study with several groups) in which species occur at only a few locations For example ldquohellipif the test data consist of 95 absences and 5 presences and this reflects the true prevalence of the species on the landscape (a realistic scenario for a rare species) a lsquonullrsquo model that predicted absence in all cases (eg no model at all) would be correct 95 of the timehellipldquo (Franklin 2009 p 151) This latter point is important here as these habitat functional groups (biofilm brown algae native eelgrass green algae Japanese eelgrass tidal marsh biomat and orange sea pens26) appear not to occur over most of the Project area (as portrayed by the model outputs presented in the distribution figures of PMV Response 2016-03-02 Appendix 218) It is therefore important that a robust evaluation of the performance of the Ecospace module is used with preferably more than one measure
In summary the starting point for this modelling analysis matters It is not just about a comparison between results with and without the Project The model has to be considered a sufficient representation of the ecosystem The Proponent has not yet sufficiently validated the model
35 Model results 351 Presentation of model results
As noted above (Section 331) the stated objective of the Roberts Bank ecosystem model was not to provide an assessment of Project impacts for each functional group at a fine temporal scale but to estimate changes in productive potential with and without the Project at the ecosystem level27 However results were presented as comparisons by speciesfunctional group with and without the Project and not as potential changes in total ecosystem productivity The revised figures for each functional group showing distributions without the Project with the Project and their difference indicated impacts were likely to be localized with overall impacts relatively small The range of biomass ratios with and without the Project was 045 ndash 189 with most values slightly less than 1 This is interpreted as indicating slight decreases in the capacity of the study area to support biomass and production with the Project for many functional groups28 (Figure 2)
24 PMV Response 2016-03-02 p 80 lines 1524-1527 25 PMV Response 2016-03-02 p 81 lines 1551-1559 26 PMV Response 2016-03-02 p 82 Table 8 27 PMV Response 2016-03-02 p 99 lines 1914-1917 28 PMV Response 2016-03-02 Appendix 218
Pacific Region Science Response Technical Review Assessing
Ecosystem Productivity Model of Roberts Bank
15
Biomass Ratio
Freq
uenc
y
04 07 10 13 16 19
05
1015
2025
30
Figure 2 Histogram of biomass ratios obtained by comparisons of model runs with and without the project (ie With Without) Values less than 1 indicate reductions in biomass with the Project compared against without the Project) Data from Appendix 218 of PMV Response 2016-03-02
352 Sensitivity and vulnerability analyses Every ecosystem model is only one possible representation of the true ecosystem defined by the modelrsquos structure and the values chosen for its many parameters The key point is how well the model represents the real system how that fit can be measured and the sensitivity of model outputs to variability in the selected parameter values The ideal model should be robust to a wide range of uncertainties in the input data and parameters This robustness is determined by performing sensitivity analyses on the model to see how it responds to variations in the input parameters and determining to which input parameters the model is most sensitive
The vulnerability parameters determine the strength of the feeding interactions between functional groups They set the level of density dependence of each functional group Higher vulnerability settings provide greater top-down (predator) control whereas lower settings provide greater bottom-up (environmental) control29 Several publications have shown that EwE models are very sensitive to the vulnerability parameters and Christensen and Walters (2000) point out that a main pitfall of EwE is that ldquopredation vulnerabilities are often underestimated lessening the modelled impacts of predationrdquo It is usual practice to tune Ecopath models including the vulnerability parameters to time series data such as biomass using the temporal simulation model Ecosim However these data were not available for the RBT2 area so this robust method of fitting the model and estimating vulnerability parameters was not possible Instead a vulnerability setting of 2 was used as the default value for the key model runs which is ldquocommon practice when time series data are not available and estimates of vulnerability in the
29 PMV Response 2016-03-02 p 70 lines 1318-1323
Pacific Region Science Response Technical Review Assessing
Ecosystem Productivity Model of Roberts Bank
16
model cannot be maderdquo30 with sensitivity analyses run for a range of 15 to 3 This narrow range was criticized by DFOECCC in initial discussions about the model with the Proponent The Proponent subsequently reran the model with a larger range of vulnerabilities31 (11 to 10) and concluded this broader vulnerability range produced similar results for the productivity ratio with and without the Project to those in the original EIS and that the EIS was more likely to overestimate than underestimate potential project effects32 The data in Table 7 of the PMV Response33 did indicate changes in productivity ratios ranging from 0 to 50 of the defined key run (which used a vulnerability setting of 2) However the Proponent changed all vulnerability settings to the same value ie all were 2 or all were 10 etc In reality the vulnerability parameters resulting from Ecosim models that are fitted to data as described above vary by functional group which was not explored here Therefore although the results suggest that the original choice of 2 for the default key run seemed reasonable the potential effects of variability in vulnerability settings was not fully explored
Sensitivity analyses are usually based on the range of uncertainty estimated for input data and parameters often called the confidence limits around the model parameters The EwE framework integrates many different data sources and parameters including values from the literature It can therefore be difficult to identify ldquoreasonablerdquo confidence limits when derived from such diverse data sources Standard practice in Ecopath models has been to develop a pedigree for each parameter with default values for uncertainty based on the nature of the source data For example parameter values based on high precision field observations of biomass within the model domain receive default confidence intervals of 10 whereas parameter values based on models developed for elsewhere or professional judgment receive confidence intervals of 8034 Sensitivity analyses are then run using parameter values selected from within these confidence intervals However if these default confidence intervals do not capture the full range of variability then the outputs are not informative of the variability in the lsquorealrsquo ecosystem Field observations were collected for many functional groups within the model domain in 2012 and 2013 as part of studies to support the RBT2 EIS Apparently the purpose of these observations was to document spatial variability (in part for the Ecospace model) and temporal variability (measurements at one location over time) and not to derive confidence intervals around the observations35
The reliance on the pedigree approach to derive confidence intervals for this Roberts Bank model was criticized by DFO ECCC and NRCan in discussions with the Proponent As a result the Proponent reran the model with much larger confidence intervals ranging from 30 to 100 depending on the input parameter and functional group36 The results from this new analysis using the broader confidence intervals were similar to those using the original pedigree approach The Proponent noted that ldquoWhile the production within each helliprun was very different there was little difference in the biomass ratio [with and without the Project] These results further demonstrate that even with a greater range in input values the influence of the Project on the Roberts Bank ecosystem is consistent among allhellipmodel runsrdquo37 This provides confidence that the model may be robust to uncertainty in its input parameters Two concerns
30 PMV Response 2016-03-02 p 70 lines 1321-1322 31 PMV Response 2016-03-02 p 71-74 32 PMV Response 2016-03-02 p 71 lines 1339-1341 33 PMV Response 2016-03-02 p 73 34 EIS Appendix 10-C Section 251 page 18 35 PMV Response 2016-03-02 p 42 lines 772-777 36 PMV Response 2016-03-02 p 44-47 37 PMV Response 2016-03-02 p 47 lines 855-858 and see also PMV Response 2016-03-02 Appendix 27-B
Pacific Region Science Response Technical Review Assessing
Ecosystem Productivity Model of Roberts Bank
17
remain however The quote above indicates that the production among the different model runs was very different although with little difference in the biomass ratios with and without the Project Since biomass is not the same as production it would be informative for understanding model performance and potential impacts to show these production differences This also relates to the point made in Section 34 regarding how well the model represents the real ecosystem and not just within-model comparisons with and without the Project The second question is more technical and relates to how the randomization (Monte Carlo or MC) routine that was used to create multiple model runs used the uncertainty about the diet data Diets are not currently included in the MC routine available to regular users of the Ecosim model how they were handled in this RBT2 model appears not to be explained
Finally the sensitivity analyses indicate that the uncertainty in the input parameters does not lead to much difference between model parameters with or without the project However this conclusion does not describe how the uncertainty in the input parameters affects understanding of the ecosystem
40 Conclusions Overall the main conclusion of the Environmental Impact Statement from the Proponent is stated as ldquohellipafter the implementation of mitigation hellipthe Project is not expected to result in any significant adverse effects on any of the 16 valued componentsrdquo38 In addition ldquohellipapproximately 40 of the functional groups are forecast to change no more than 5 which hellip is judged to be within the uncertainty of the model runsrdquo39 although larger changes were forecast for orange sea pens freshwater biofilm green algae and raptors The conclusions from the modelling studies are that ldquohellipthe proposed project will have an impact on the study area that the effect varies between species and that the findings are robust to parameter uncertaintyrdquo40 Specific outcomes by valued component as derived from the EwE model are presented by functional groups in Table 1
38 PMV March 2015 Roberts Bank Environmental Impact Statement Executive Summary ndash Part 1 page 37 39 EIS Appendix 10-C p ii 40 EIS Appendix 10-D p iv
Pacific Region Science Response Technical Review Assessing
Ecosystem Productivity Model of Roberts Bank
18
Table 1 Changes in productive potential with the Project as derived from the EwE model
Changes in productive potential
Ecosystem category
Number of valued
components
Number with potential
biomass loss
Moderate decrease (31-60 decline)
Minor decrease (6-30 decline)
Negligible (0-5
change)
Minor increase (6-
30 increase)
Moderate increase (31-60 increase)
Source
Marine vegetation
7 7 - 3 2 2 - EIS Vol 3 Section 11 Table 11-17 page 11-65
Marine invertebrates
4 3 1 1 1 1 - EIS Vol 3 Section 12 Table 12-8 page 12-52
Marine fish 13 13 - 2 6 5 - EIS Vol 3 Section 13 Table 13-10 page 13-95
Coastal birds
11 8 - 3 4 3 1 EIS Vol 3 Section 15 Table 15-10 page 15-67
Pacific Region Science Response Technical Review Assessing
Ecosystem Productivity Model of Roberts Bank
19
Most functional groups showed some potential biomass loss with the Project with biomass loss defined as any model run with negative outcomes (ie in which biomass with the project was less than biomass without the Project) The summary of changes in productivity potential are mixed with most (33 out of 35) valued components showing minor decreases to minor increases (defined as 6 to 30 changes in productive potential with the Project compared to without the Project)
The main conclusions of this review in regards to the Terms of Reference are
1 Do the functional groups and abiotic variables used in the model adequately represent the ecosystem at Roberts Bank
o The 58 functional groups and abiotic variables used in the model adequately represent the main components of the Roberts Bank ecosystem however for longer lived species the life stages of the species are not well represented and some of the impacts of the Project may be expected to affect specific life stages
o The abiotic variables adequately represent the physical drivers of this ecosystem on an annual time scale However annual values for these abiotic variables may not adequately capture important sub-annual events such as storms (DFO 2016) the timing of arrival and departure of highly migratory species and whether there may be important sub-annual thresholds or mismatches in timing as a result of the Project
o Biotic factors (eg nutrients) which are particularly important for biofilm and other lower trophic level taxa are not included in this model The model is therefore unable to assess the potential development of eutrophication and benthic organic enrichment events which may affect fish habitats in the study area
2 Are the parameter estimates used by the model valid and defensible for this system
o In general parameter estimates appear to be adequate for this system Field studies were done in two years to provide data in particular on distributions of selected functional groups for the Ecospace module Note the distribution studies focussed on taxa which were relatively immobile and therefore lsquofixedrsquo in space
o the selection of some model parameters would benefit from further explanation for example the choice of fixed diet matrices versus dynamic matrices which can vary with changes in abundances or predators and prey
o the selection of some model parameters would benefit from further explanation for example the link between the diets described in the text of Appendix 10B and the quantities presented in Appendix A of Appendix 10B It is understood that proportions were derived using the ldquofixed selectivityrdquo principle but in order to be fully transparent the derivation of each diet should be provided in an appendix
o discussion and explanation is needed of why ecotrophic efficiencies differ from expected values (eg the ecotrophic efficiency for Pacific herring is listed as 038) and
o the abiotic factor lsquosubstratersquo was limited to ldquohardrdquo or rdquosoftrdquo options which can be restrictive given that they serve as endpoints on a substrate composition continuum These limited options may not provide the sensitivity required to assess substrate preference nor the flexibility for taxa (eg motile organisms) that span hard mixed and soft substrate types In addition it is not clear if changes in the hardsoft categories were considered over time within identified depositional or erosional settings before and after construction
Pacific Region Science Response Technical Review Assessing
Ecosystem Productivity Model of Roberts Bank
20
3 Are the limitations and uncertainties of the model identified and appropriately considered when determining the modelrsquos representation of current and possible future conditions
o the EwE model was not designed to evaluate a range of future conditions It was designed to estimate changes in the productive potential at the ecosystem level with and without the Project Therefore the model was run without the Project and with the Project for a range of plausible abiotic conditions and the results were compared with respect to biomass and productivity by functional group
o the pedigree approach to assessing the uncertainties of model outcomes is unsatisfactory for the purpose here as it relates solely to a qualitative judgment of the value of data based on its source However when the model was rerun with much wider ranges of confidence intervals (uncertainties) the results in general (but not necessarily for each functional group) were similar to the results using the original pedigree approach This suggests that taken overall the model may be robust to wide ranges of uncertainty in these input variables and parameters
o there is inadequate validation of the model This is inadequate for three reasons
(i) the basic Ecopath model is not validated and the Ecospace balancing process (the spin-up period) resulted in some biomass estimates being increased or decreased beyond their confidence limits
(ii) the goodness of fit test used to evaluate how well the model predicted the spatial occurrence functional groups is not fit for purpose (Section 34) and
(iii) validation was provided for only a small number of functional groups (the habitat-forming functional groups) As a consequence the model is currently not validated
o Considering the proportion of open boundaries relative to closed boundaries in the model processes taking place outside the modelled ecosystem are likely to contribute to dynamics within the modelled ecosystem However these external processes may not be well-resolved by the EwE model as currently configured
4 Are the model results related to the potential effects of the Project on fish and fish habitat and migratory birds and their food resources valid and defensible
o this is a very complex ecosystem model constructed for a relatively small and open (in the sense of considerable exchange with adjacent non-modelled areas) system Many assumptions have been made based on poor or missing data Taking all these considerations into account the model does the best job possible of comparing the biomass and productivity of the Roberts Bank ecosystem with and without the Project
o the extent to which the model adequately represents the lsquorealrsquo ecosystem of Roberts Bank as opposed to comparisons of model results with and without the Project is unclear as a number of basic diagnostics are not presented (see point 3 above)
o the EwE model is not capable of and is not designed to represent nutritional and food quality variations in prey functional groups and how these may impact highly migratory predators such as birds with and without the Project
5 Is the EwE model framework a valid method to quantify large scale impacts to fish habitat fish productivity and migratory bird productivity
o the EwE model as implemented in this project and reviewed here is a useful first-order framework to organise information and derive initial estimates of how the system may respond to perturbations
Pacific Region Science Response Technical Review Assessing
Ecosystem Productivity Model of Roberts Bank
21
o the utility of a EWE model for impact purposes is highly dependent on the quality of input data
o each EwE model is highly dependent on local conditions Although appropriate as an overall methodology each application would need to be reviewed for how it may be applied to any new ecosystem and
o the EwE model would need to be substantially reformulated if it was to include considerations of changes in chemical composition or food quality of prey in particular for seasonal migratory species such as birds which may depend on very large biomasses of prey with specific chemical composition to fuel their migrations beyond the ecosystem model boundaries
Contributors Contributor Affiliation Ian Perry Author DFO Science Pacific Region Alida Bundy Author DFO Science Maritimes Region Terri Sutherland Author DFO Science Pacific Region Robert Elner Author ECCC Canadian Wildlife Service Andrew Robinson Author ECCC Canadian Wildlife Service Lesley MacDougall Editor DFO Science Pacific Region
Approved by Carmel Lowe
Regional Director Science Branch Pacific Region Fisheries and Oceans Canada
November 4 2016
Sources of Information Christensen V Coll M Steenbeek J Buszowski J Chagaris D walters CJ 2014
Representing variable habitat quality in a spatial food web model Ecosystems 17 1397-1412
Christensen V and Walters C 2000 Ecopath with Ecosim methods capabilities and limitations Ecological Modelling 172 109-139
Colleacuteter M Valls A Guitton J Gascuel D Pauly D and Christensen V 2015 Global overview of the applications of the Ecopath with Ecosim modeling approach using the EcoBase models repository Ecological Modelling 302 pp42-53
Compass Resource Management Ltd 2013 Roberts Bank Terminal 2 Technical Advisory Group (TAG) Process Report Productive Capacity ndash Final Report 119pp (Accessed November 1 2016)
DFO 2016 Technical Review of Roberts Bank Terminal 2 Environmental Assessment Section 95 ndash Coastal Geomorphology DFO Can Sci Advis Sec Sci Resp 2016045 (Accessed November 4 2016)
Pacific Region Science Response Technical Review Assessing
Ecosystem Productivity Model of Roberts Bank
22
ESSA Technologies 2014a Roberts Bank Terminal 2 Project Roberts Bank Delta BC Environmental Impact Statement Volume 3 Biophysical Effects Assessments Appendix 10-C Roberts Bank Ecosystem Model Development and Key Run Port Metro Vancouver (Accessed November 1 2016)
ESSA Technologies 2014b Roberts Bank Terminal 2 Project Roberts Bank Delta BC Environmental Impact Statement Volume 3 Biophysical Effects Assessments Appendix 10-D Roberts Bank Ecosystem Model Sensitivity Analyses Port Metro Vancouver (Accessed November 1 2016)
Franklin J 2009 Mapping Species Distributions Spatial Inference and Prediction Cambridge University Press Cambridge
Hemmera 2014 Roberts Bank Terminal 2 Project Roberts Bank Delta BC Environmental Impact Statement Volume 3 Biophysical Effects Assessments Appendix 10-B Roberts Bank Ecosystem Model Parameter Estimates Port Metro Vancouver File 302-03503 (Accessed November 1 2016)
Port Metro Vancouver 2015a Roberts Bank Terminal 2 Project Roberts Bank Delta BC Environmental Impact Statement Volume 3 Biophysical Effects Assessments Section 100 Biophysical Setting (Accessed November 1 2016)
Port Metro Vancouver 2015b Roberts Bank Terminal 2 Project Roberts Bank Delta BC Environmental Impact Statement Volume 3 Biophysical Effects Assessments Section 103 Overview of Assessing Ecosystem Productivity (Accessed November 1 2016)
Port Metro Vancouver 2015c Roberts Bank Terminal 2 Project Environmental Assessment Additional Information Requirements (July 31 2015) Responses Response to Information Request 6 IR-73115-06 Canadian Environmental Assessment Agency Reference Number 80054 dated 26 October 2015
Steenbeek J Coll M Gurney L Meacutelin F Hoepffner N Buszowski J and Christensen V 2013 Bridging the gap between ecosystem modeling tools and geographic information systems Driving a food web model with external spatialndashtemporal data Ecological Modelling 263 139ndash 151
Sutherland T Elner R and OrsquoNeill J 2013 Roberts Bank Ecological crucible of the Fraser River estuary Progress in Oceanography 115 171ndash180
Vancouver Fraser Port Authority 2016 From the Vancouver Fraser Port Authority to the Review Panel re Answers to preliminary technical questions submitted during the completeness phase from Fisheries and Oceans Canada Natural Resources Canada and Environment and Climate Change Canada concerning the ecosystem modelling to support the Roberts Bank Terminal 2 Project environmental review CEAR Document 547 (Accessed November 1 2016)
Pacific Region Science Response Technical Review Assessing
Ecosystem Productivity Model of Roberts Bank
23
This Report is Available from the Centre for Science Advice
Pacific Region Fisheries and Oceans Canada
3190 Hammond Bay Road Nanaimo BC V9T 6N7
Telephone (250) 756-7208 E-Mail csapdfo-mpogcca
Internet address wwwdfo-mpogccacsas-sccs
ISSN 1919-3769 copy Her Majesty the Queen in Right of Canada 2016
Correct Citation for this Publication
DFO 2016 Technical review of Roberts Bank Terminal 2 environmental assessment section 103 ndash assessing ecosystem productivity DFO Can Sci Advis Sec Sci Resp 2016050
Aussi disponible en franccedilais
MPO 2016 Examen technique de leacutevaluation environnementale du Terminal 2 agrave Roberts Bank section 103 ndash eacutevaluation de la productiviteacute de leacutecosystegraveme Secr can de consult sci du MPO Reacutep des Sci 2016050

Pacific Region Science Response Technical Review Assessing
Ecosystem Productivity Model of Roberts Bank
11
components the EwE model is not informative with respect to understanding the potential impacts of the Project on biofilm and the Western Sandpiper While this example is specific to seabirds the potential exists for differences in the quality of biofilm to also be an issue for copepods which feed on biofilm and consequently to juvenile salmon which feed on these copepods (eg Sutherland et al 2013)
The EwE model is also not designed to predict effects of the Project on water quality although the Proponent noted that ldquoOther abiotic factors not included were deemed to be representative of variables that were already included in the modelhelliprdquo11 The Project may cause changes in physical and water quality conditions whether in isolation or in combination which may impact the productivity or nutritional quality of key prey organisms for local and migratory species which will not be captured by the model The EwE model does not assess the production of key nutrients or the implications of changes in important physical and water quality parameters to biofilm community structure and hence to important migratory birds
The model does not include biotic factors for both pelagic and benthic environments to assess the potential development of eutrophication and benthic organic enrichment events respectively Organic and redox indicators traditional measures of environmental assessments that are used to determine changes in functional group responses were included in the recent Deltaport Third environmental assessment (ie Pelagic chlorophyll dissolved nutrients Benthic sediment carbonnitrogen content redox state [sulfide concentration]) Benthic anoxic events based on organic enrichment are known to be strong drivers of community composition and exclusion regardless of substrate type In the absence of biotic factors (eg organic particulates) the model has not considered the potential for benthic organic enrichment which coincides with siltation processes within the upper tidal flats The tidal flat corner bordered by the Delta-dyke and Deltaport causeway has served as a catchment area for Fraser River silt since the development of the original Deltaport causeway (Sutherland et al 2013) The proposed position of the new terminal placed at the seaward termination of the Deltaport causeway may produce a crescent-shaped feature in the wake of the Fraser River Plume This feature may provide a more efficient silt trap that will promote benthic organic enrichment This piece of the environmental assessment seems to be missing and is important for assessing fish habitat in this area
335 Seasonality (model time step) Input data to parameterize the model were available on a range of time scales from hourly (eg physical data on salinity and water flow) to annual (eg species biomass) The Proponents indicated12 that this is a strength of the EwE model although ultimately the model was run with an annual time step with all sub-annual values being averaged to annual values This method therefore did not incorporate important seasonal processes such as winter-summer differences in salinity and storm properties and the seasonal appearances of abundances of predators and prey such as migratory salmon and birds that are much larger than the annual average For example juvenile salmon migrate from the Fraser River and onto Roberts Bank in the spring before moving into deeper waters If these spring abundances are averaged over the entire year these average abundances would be 5-10 times lower than the actual abundances during the spring (ie averaging the biomass that occurs in two months over a 12 month period) Additionally this method did not capture the intensity of processes such as growth and predation which can be focused over periods of a few weeks to a few months There may be important threshold effects at particular times and places which may be missed when using an 11 EIS Section 10 p 10-11 12 PMV Response 2016-03-02 p 86 line 1655
Pacific Region Science Response Technical Review Assessing
Ecosystem Productivity Model of Roberts Bank
12
annual time step for the model The Ecospace module has a monthly time step13 and therefore it is feasible to run this module with a sub-annual time step For example the Proponents submit14 that there are inadequate data to model the potential effects of the Project on the timing of biofilm production which could have implications for the migratory dunlin and Western Sandpiper However this could be modelled in an exploratory way to determine hypotheses about which factors could affect the timing of production of biofilm and the potential impacts on these birds These issues are of major concern to ECCC
336 Life history structure The EwE model did not separate functional groups into life history stages (stanzas) yet for many functional groups the juvenile stages can have very different life history characteristics and habitats than the adults It is unclear in the description of the model how different life history structures were considered and whether for example there were enough juveniles to produce the adults The implications of not including early life stages should be explored at least qualitatively to identify which species might have life stages that may be more vulnerable to project effects
337 Model balancing Balancing an EwE model is the process by which parameters are adjusted so that there is sufficient production for consumption requirements ie there are sufficient prey for all predators Expert opinion was used to examine parameter values and to adjust for errors or inconsistencies in logic ldquoPMV is confident that since the approach taken to balance the model was based on best practices the steps are appropriaterdquo15 Adjustments to initial parameters to ensure an ecologically-feasible model are necessary and to be expected For a few functional groups however very large changes to initial parameter estimates (which were often not based on Roberts Bank specific data) were necessary for example to transient killer whales When such initial parameters were adjusted (often by substantial amounts) by expert opinion to balance the model the confidence intervals around these adjusted parameter values were not increased to reflect this added uncertainty (see for example PMV Response 2016-03-02 p 51 lines 955-956) When expert opinion was used to make very large changes to initial parameter values broader confidence intervals about these parameters should have been applied This does not appear to have been the case and as a consequence may cause the actual uncertainty of the model outputs to be underestimated
Another example is for the pinniped group in which 50 of the diet was assumed to come from outside the model area in order to balance the model The rationale provided was ldquoThe pinnipeds caused excessive predation mortalities on numerous fish functional groups The biomass of pinnipeds was an average for the Strait of Georgia which was likely too high for Roberts Bank Therefore it was assumed that pinnipeds extracted only half of their diet from the study areardquo16 It is unclear whether the sensitivity of the model to different percentages of diet allocation was explored
As noted above (332) the Ecopath model was relatively unconstrained and few adjustments to input parameters were required to balance the model This is unusual and the low ecotrophic efficiencies of several functional groups suggest that full accounting of energy flows may not have been achieved (an ecotrophic efficiency of 1 indicates that 100 of the production of that
13 EIS Appendix 10C Section 29 p24 14 EIS Appendix 10D Appendix C p72 15 PMV Response 2016-03-02 p 49 lines 910-912 16 EIS Appendix 10C Section 261 p 20
Pacific Region Science Response Technical Review Assessing
Ecosystem Productivity Model of Roberts Bank
13
particular group is being preyed upon or removed by fishing leaving no individuals to die of old age17) An ldquoexcessrdquo of individuals dying of old age ie ecotrophic efficiencies much less than 1 suggests a potentially large biomass that is not used by the ecosystem and instead is converted to detritus
34 Model validation Model validation is the process by which the model parameters variables and outputs are compared with those from the real ecosystem to ascertain how well the model represents the ecosystem It is an essential step in providing confidence that the projections from the model in this case with and without the Project have relevance to how the real ecosystem may be expected to function with and without the Project In practice validating complex ecosystem models is difficult considering the range of assumptions that must be made when building the model the limited available data and natural variability of the ecosystem at a variety of time and space scales
Many of the standard diagnostics for the Ecopath model have not been evaluated in the EIS The Proponent appears to have assumed that once the Ecopath model was balanced then it was valid and fit for purpose The Proponent should provide all the Ecopath estimates of vital rates including mortality rates As presented questions remain For example many Ecotrophic Efficiencies (which control the transfer of biomass from prey to predators) are less than 1 even for taxa which would be expected to be close to 1 such as carnivorous zooplankton The reason for Ecotrophic Efficiencies less than 1 were not discussed or explained in the EIS
Detailed diagnostics for the Ecospace model should also be presented in order to evaluate model performance In response to criticisms by DFO ECCC and NRCan in discussions with the Proponent the latter provided the biomass of the functional groups from the Ecopath model (before Ecospace) and the Ecospace model after the spin-up period (which involved adjusting the parameters from the Ecopath model to balance the 5468 separate cells of the Ecospace model)18 The Proponents argue that ldquoIt is important to note that changes in biomass values generated during the spin-up period are identical for both with and without Project scenarios and thus do not provide information on the potential Project-related effects on productivity19 However several changes to biomass result from the Ecospace balancing process (spin-up period) This is only given brief attention by the Proponent in its response to the DFO ECCC and NRCan questions An analysis of Table 620 revealed that the biomass of 9 functional groups was larger or smaller than the widest confidence limits allowed for each group21 This requires further discussion and justification
The Proponent used a goodness of fit measure to compare spatial distributions of model outputs with field observations They indicated that ldquono other EwE models were identified which use a goodness-of-fit measure Hence the RB model is potentially the first such EwE model where a goodness of fit measure has been appliedrdquo22 The chosen goodness of fit measure is the percent correct classification (PCC) method23 This method derives a test statistic based on the proportion of locations at which predicted occurrences from the model match observed
17 EIS Appendix 10-B p 11 18 PMV Response 2016-03-02 p 65-66 Table 6 19 PMV Response 2016-03-02 p 64 lines 1205-1207 20 PMV Response 2016-03-02 p 65-66 Table 6 21 PMV Response 2016-03-02 p 45 Table 3 22 PMV Response 2016-03-02 p 78 lines 1481-1483 23 PMV Response 2016-03-02 p 78 lines 1483-1484
Pacific Region Science Response Technical Review Assessing
Ecosystem Productivity Model of Roberts Bank
14
occurrences from data and similarly with predicted and observed absences The Proponent then calculated two additional accuracy of fit measures sensitivity (the model predicts a species to occur in an area where it is known to occur in reality) and specificity (the model predicts a species does not occur in an area it is known not to occur in reality)24 This analysis concluded that the model has high predictability for functional groups such as eelgrass and sea pens with relatively static distributions but lower predictability for functional groups which are more temporally and spatially dynamic such as biofilm and green algae25
There are two problems with this approach The first is that this goodness of fit comparison was done only for habitat-forming functional groups no discussion of how well this analysis applies to mobile functional groups was provided The second problem is that this method does not take into account situations (such as occurs in this study with several groups) in which species occur at only a few locations For example ldquohellipif the test data consist of 95 absences and 5 presences and this reflects the true prevalence of the species on the landscape (a realistic scenario for a rare species) a lsquonullrsquo model that predicted absence in all cases (eg no model at all) would be correct 95 of the timehellipldquo (Franklin 2009 p 151) This latter point is important here as these habitat functional groups (biofilm brown algae native eelgrass green algae Japanese eelgrass tidal marsh biomat and orange sea pens26) appear not to occur over most of the Project area (as portrayed by the model outputs presented in the distribution figures of PMV Response 2016-03-02 Appendix 218) It is therefore important that a robust evaluation of the performance of the Ecospace module is used with preferably more than one measure
In summary the starting point for this modelling analysis matters It is not just about a comparison between results with and without the Project The model has to be considered a sufficient representation of the ecosystem The Proponent has not yet sufficiently validated the model
35 Model results 351 Presentation of model results
As noted above (Section 331) the stated objective of the Roberts Bank ecosystem model was not to provide an assessment of Project impacts for each functional group at a fine temporal scale but to estimate changes in productive potential with and without the Project at the ecosystem level27 However results were presented as comparisons by speciesfunctional group with and without the Project and not as potential changes in total ecosystem productivity The revised figures for each functional group showing distributions without the Project with the Project and their difference indicated impacts were likely to be localized with overall impacts relatively small The range of biomass ratios with and without the Project was 045 ndash 189 with most values slightly less than 1 This is interpreted as indicating slight decreases in the capacity of the study area to support biomass and production with the Project for many functional groups28 (Figure 2)
24 PMV Response 2016-03-02 p 80 lines 1524-1527 25 PMV Response 2016-03-02 p 81 lines 1551-1559 26 PMV Response 2016-03-02 p 82 Table 8 27 PMV Response 2016-03-02 p 99 lines 1914-1917 28 PMV Response 2016-03-02 Appendix 218
Pacific Region Science Response Technical Review Assessing
Ecosystem Productivity Model of Roberts Bank
15
Biomass Ratio
Freq
uenc
y
04 07 10 13 16 19
05
1015
2025
30
Figure 2 Histogram of biomass ratios obtained by comparisons of model runs with and without the project (ie With Without) Values less than 1 indicate reductions in biomass with the Project compared against without the Project) Data from Appendix 218 of PMV Response 2016-03-02
352 Sensitivity and vulnerability analyses Every ecosystem model is only one possible representation of the true ecosystem defined by the modelrsquos structure and the values chosen for its many parameters The key point is how well the model represents the real system how that fit can be measured and the sensitivity of model outputs to variability in the selected parameter values The ideal model should be robust to a wide range of uncertainties in the input data and parameters This robustness is determined by performing sensitivity analyses on the model to see how it responds to variations in the input parameters and determining to which input parameters the model is most sensitive
The vulnerability parameters determine the strength of the feeding interactions between functional groups They set the level of density dependence of each functional group Higher vulnerability settings provide greater top-down (predator) control whereas lower settings provide greater bottom-up (environmental) control29 Several publications have shown that EwE models are very sensitive to the vulnerability parameters and Christensen and Walters (2000) point out that a main pitfall of EwE is that ldquopredation vulnerabilities are often underestimated lessening the modelled impacts of predationrdquo It is usual practice to tune Ecopath models including the vulnerability parameters to time series data such as biomass using the temporal simulation model Ecosim However these data were not available for the RBT2 area so this robust method of fitting the model and estimating vulnerability parameters was not possible Instead a vulnerability setting of 2 was used as the default value for the key model runs which is ldquocommon practice when time series data are not available and estimates of vulnerability in the
29 PMV Response 2016-03-02 p 70 lines 1318-1323
Pacific Region Science Response Technical Review Assessing
Ecosystem Productivity Model of Roberts Bank
16
model cannot be maderdquo30 with sensitivity analyses run for a range of 15 to 3 This narrow range was criticized by DFOECCC in initial discussions about the model with the Proponent The Proponent subsequently reran the model with a larger range of vulnerabilities31 (11 to 10) and concluded this broader vulnerability range produced similar results for the productivity ratio with and without the Project to those in the original EIS and that the EIS was more likely to overestimate than underestimate potential project effects32 The data in Table 7 of the PMV Response33 did indicate changes in productivity ratios ranging from 0 to 50 of the defined key run (which used a vulnerability setting of 2) However the Proponent changed all vulnerability settings to the same value ie all were 2 or all were 10 etc In reality the vulnerability parameters resulting from Ecosim models that are fitted to data as described above vary by functional group which was not explored here Therefore although the results suggest that the original choice of 2 for the default key run seemed reasonable the potential effects of variability in vulnerability settings was not fully explored
Sensitivity analyses are usually based on the range of uncertainty estimated for input data and parameters often called the confidence limits around the model parameters The EwE framework integrates many different data sources and parameters including values from the literature It can therefore be difficult to identify ldquoreasonablerdquo confidence limits when derived from such diverse data sources Standard practice in Ecopath models has been to develop a pedigree for each parameter with default values for uncertainty based on the nature of the source data For example parameter values based on high precision field observations of biomass within the model domain receive default confidence intervals of 10 whereas parameter values based on models developed for elsewhere or professional judgment receive confidence intervals of 8034 Sensitivity analyses are then run using parameter values selected from within these confidence intervals However if these default confidence intervals do not capture the full range of variability then the outputs are not informative of the variability in the lsquorealrsquo ecosystem Field observations were collected for many functional groups within the model domain in 2012 and 2013 as part of studies to support the RBT2 EIS Apparently the purpose of these observations was to document spatial variability (in part for the Ecospace model) and temporal variability (measurements at one location over time) and not to derive confidence intervals around the observations35
The reliance on the pedigree approach to derive confidence intervals for this Roberts Bank model was criticized by DFO ECCC and NRCan in discussions with the Proponent As a result the Proponent reran the model with much larger confidence intervals ranging from 30 to 100 depending on the input parameter and functional group36 The results from this new analysis using the broader confidence intervals were similar to those using the original pedigree approach The Proponent noted that ldquoWhile the production within each helliprun was very different there was little difference in the biomass ratio [with and without the Project] These results further demonstrate that even with a greater range in input values the influence of the Project on the Roberts Bank ecosystem is consistent among allhellipmodel runsrdquo37 This provides confidence that the model may be robust to uncertainty in its input parameters Two concerns
30 PMV Response 2016-03-02 p 70 lines 1321-1322 31 PMV Response 2016-03-02 p 71-74 32 PMV Response 2016-03-02 p 71 lines 1339-1341 33 PMV Response 2016-03-02 p 73 34 EIS Appendix 10-C Section 251 page 18 35 PMV Response 2016-03-02 p 42 lines 772-777 36 PMV Response 2016-03-02 p 44-47 37 PMV Response 2016-03-02 p 47 lines 855-858 and see also PMV Response 2016-03-02 Appendix 27-B
Pacific Region Science Response Technical Review Assessing
Ecosystem Productivity Model of Roberts Bank
17
remain however The quote above indicates that the production among the different model runs was very different although with little difference in the biomass ratios with and without the Project Since biomass is not the same as production it would be informative for understanding model performance and potential impacts to show these production differences This also relates to the point made in Section 34 regarding how well the model represents the real ecosystem and not just within-model comparisons with and without the Project The second question is more technical and relates to how the randomization (Monte Carlo or MC) routine that was used to create multiple model runs used the uncertainty about the diet data Diets are not currently included in the MC routine available to regular users of the Ecosim model how they were handled in this RBT2 model appears not to be explained
Finally the sensitivity analyses indicate that the uncertainty in the input parameters does not lead to much difference between model parameters with or without the project However this conclusion does not describe how the uncertainty in the input parameters affects understanding of the ecosystem
40 Conclusions Overall the main conclusion of the Environmental Impact Statement from the Proponent is stated as ldquohellipafter the implementation of mitigation hellipthe Project is not expected to result in any significant adverse effects on any of the 16 valued componentsrdquo38 In addition ldquohellipapproximately 40 of the functional groups are forecast to change no more than 5 which hellip is judged to be within the uncertainty of the model runsrdquo39 although larger changes were forecast for orange sea pens freshwater biofilm green algae and raptors The conclusions from the modelling studies are that ldquohellipthe proposed project will have an impact on the study area that the effect varies between species and that the findings are robust to parameter uncertaintyrdquo40 Specific outcomes by valued component as derived from the EwE model are presented by functional groups in Table 1
38 PMV March 2015 Roberts Bank Environmental Impact Statement Executive Summary ndash Part 1 page 37 39 EIS Appendix 10-C p ii 40 EIS Appendix 10-D p iv
Pacific Region Science Response Technical Review Assessing
Ecosystem Productivity Model of Roberts Bank
18
Table 1 Changes in productive potential with the Project as derived from the EwE model
Changes in productive potential
Ecosystem category
Number of valued
components
Number with potential
biomass loss
Moderate decrease (31-60 decline)
Minor decrease (6-30 decline)
Negligible (0-5
change)
Minor increase (6-
30 increase)
Moderate increase (31-60 increase)
Source
Marine vegetation
7 7 - 3 2 2 - EIS Vol 3 Section 11 Table 11-17 page 11-65
Marine invertebrates
4 3 1 1 1 1 - EIS Vol 3 Section 12 Table 12-8 page 12-52
Marine fish 13 13 - 2 6 5 - EIS Vol 3 Section 13 Table 13-10 page 13-95
Coastal birds
11 8 - 3 4 3 1 EIS Vol 3 Section 15 Table 15-10 page 15-67
Pacific Region Science Response Technical Review Assessing
Ecosystem Productivity Model of Roberts Bank
19
Most functional groups showed some potential biomass loss with the Project with biomass loss defined as any model run with negative outcomes (ie in which biomass with the project was less than biomass without the Project) The summary of changes in productivity potential are mixed with most (33 out of 35) valued components showing minor decreases to minor increases (defined as 6 to 30 changes in productive potential with the Project compared to without the Project)
The main conclusions of this review in regards to the Terms of Reference are
1 Do the functional groups and abiotic variables used in the model adequately represent the ecosystem at Roberts Bank
o The 58 functional groups and abiotic variables used in the model adequately represent the main components of the Roberts Bank ecosystem however for longer lived species the life stages of the species are not well represented and some of the impacts of the Project may be expected to affect specific life stages
o The abiotic variables adequately represent the physical drivers of this ecosystem on an annual time scale However annual values for these abiotic variables may not adequately capture important sub-annual events such as storms (DFO 2016) the timing of arrival and departure of highly migratory species and whether there may be important sub-annual thresholds or mismatches in timing as a result of the Project
o Biotic factors (eg nutrients) which are particularly important for biofilm and other lower trophic level taxa are not included in this model The model is therefore unable to assess the potential development of eutrophication and benthic organic enrichment events which may affect fish habitats in the study area
2 Are the parameter estimates used by the model valid and defensible for this system
o In general parameter estimates appear to be adequate for this system Field studies were done in two years to provide data in particular on distributions of selected functional groups for the Ecospace module Note the distribution studies focussed on taxa which were relatively immobile and therefore lsquofixedrsquo in space
o the selection of some model parameters would benefit from further explanation for example the choice of fixed diet matrices versus dynamic matrices which can vary with changes in abundances or predators and prey
o the selection of some model parameters would benefit from further explanation for example the link between the diets described in the text of Appendix 10B and the quantities presented in Appendix A of Appendix 10B It is understood that proportions were derived using the ldquofixed selectivityrdquo principle but in order to be fully transparent the derivation of each diet should be provided in an appendix
o discussion and explanation is needed of why ecotrophic efficiencies differ from expected values (eg the ecotrophic efficiency for Pacific herring is listed as 038) and
o the abiotic factor lsquosubstratersquo was limited to ldquohardrdquo or rdquosoftrdquo options which can be restrictive given that they serve as endpoints on a substrate composition continuum These limited options may not provide the sensitivity required to assess substrate preference nor the flexibility for taxa (eg motile organisms) that span hard mixed and soft substrate types In addition it is not clear if changes in the hardsoft categories were considered over time within identified depositional or erosional settings before and after construction
Pacific Region Science Response Technical Review Assessing
Ecosystem Productivity Model of Roberts Bank
20
3 Are the limitations and uncertainties of the model identified and appropriately considered when determining the modelrsquos representation of current and possible future conditions
o the EwE model was not designed to evaluate a range of future conditions It was designed to estimate changes in the productive potential at the ecosystem level with and without the Project Therefore the model was run without the Project and with the Project for a range of plausible abiotic conditions and the results were compared with respect to biomass and productivity by functional group
o the pedigree approach to assessing the uncertainties of model outcomes is unsatisfactory for the purpose here as it relates solely to a qualitative judgment of the value of data based on its source However when the model was rerun with much wider ranges of confidence intervals (uncertainties) the results in general (but not necessarily for each functional group) were similar to the results using the original pedigree approach This suggests that taken overall the model may be robust to wide ranges of uncertainty in these input variables and parameters
o there is inadequate validation of the model This is inadequate for three reasons
(i) the basic Ecopath model is not validated and the Ecospace balancing process (the spin-up period) resulted in some biomass estimates being increased or decreased beyond their confidence limits
(ii) the goodness of fit test used to evaluate how well the model predicted the spatial occurrence functional groups is not fit for purpose (Section 34) and
(iii) validation was provided for only a small number of functional groups (the habitat-forming functional groups) As a consequence the model is currently not validated
o Considering the proportion of open boundaries relative to closed boundaries in the model processes taking place outside the modelled ecosystem are likely to contribute to dynamics within the modelled ecosystem However these external processes may not be well-resolved by the EwE model as currently configured
4 Are the model results related to the potential effects of the Project on fish and fish habitat and migratory birds and their food resources valid and defensible
o this is a very complex ecosystem model constructed for a relatively small and open (in the sense of considerable exchange with adjacent non-modelled areas) system Many assumptions have been made based on poor or missing data Taking all these considerations into account the model does the best job possible of comparing the biomass and productivity of the Roberts Bank ecosystem with and without the Project
o the extent to which the model adequately represents the lsquorealrsquo ecosystem of Roberts Bank as opposed to comparisons of model results with and without the Project is unclear as a number of basic diagnostics are not presented (see point 3 above)
o the EwE model is not capable of and is not designed to represent nutritional and food quality variations in prey functional groups and how these may impact highly migratory predators such as birds with and without the Project
5 Is the EwE model framework a valid method to quantify large scale impacts to fish habitat fish productivity and migratory bird productivity
o the EwE model as implemented in this project and reviewed here is a useful first-order framework to organise information and derive initial estimates of how the system may respond to perturbations
Pacific Region Science Response Technical Review Assessing
Ecosystem Productivity Model of Roberts Bank
21
o the utility of a EWE model for impact purposes is highly dependent on the quality of input data
o each EwE model is highly dependent on local conditions Although appropriate as an overall methodology each application would need to be reviewed for how it may be applied to any new ecosystem and
o the EwE model would need to be substantially reformulated if it was to include considerations of changes in chemical composition or food quality of prey in particular for seasonal migratory species such as birds which may depend on very large biomasses of prey with specific chemical composition to fuel their migrations beyond the ecosystem model boundaries
Contributors Contributor Affiliation Ian Perry Author DFO Science Pacific Region Alida Bundy Author DFO Science Maritimes Region Terri Sutherland Author DFO Science Pacific Region Robert Elner Author ECCC Canadian Wildlife Service Andrew Robinson Author ECCC Canadian Wildlife Service Lesley MacDougall Editor DFO Science Pacific Region
Approved by Carmel Lowe
Regional Director Science Branch Pacific Region Fisheries and Oceans Canada
November 4 2016
Sources of Information Christensen V Coll M Steenbeek J Buszowski J Chagaris D walters CJ 2014
Representing variable habitat quality in a spatial food web model Ecosystems 17 1397-1412
Christensen V and Walters C 2000 Ecopath with Ecosim methods capabilities and limitations Ecological Modelling 172 109-139
Colleacuteter M Valls A Guitton J Gascuel D Pauly D and Christensen V 2015 Global overview of the applications of the Ecopath with Ecosim modeling approach using the EcoBase models repository Ecological Modelling 302 pp42-53
Compass Resource Management Ltd 2013 Roberts Bank Terminal 2 Technical Advisory Group (TAG) Process Report Productive Capacity ndash Final Report 119pp (Accessed November 1 2016)
DFO 2016 Technical Review of Roberts Bank Terminal 2 Environmental Assessment Section 95 ndash Coastal Geomorphology DFO Can Sci Advis Sec Sci Resp 2016045 (Accessed November 4 2016)
Pacific Region Science Response Technical Review Assessing
Ecosystem Productivity Model of Roberts Bank
22
ESSA Technologies 2014a Roberts Bank Terminal 2 Project Roberts Bank Delta BC Environmental Impact Statement Volume 3 Biophysical Effects Assessments Appendix 10-C Roberts Bank Ecosystem Model Development and Key Run Port Metro Vancouver (Accessed November 1 2016)
ESSA Technologies 2014b Roberts Bank Terminal 2 Project Roberts Bank Delta BC Environmental Impact Statement Volume 3 Biophysical Effects Assessments Appendix 10-D Roberts Bank Ecosystem Model Sensitivity Analyses Port Metro Vancouver (Accessed November 1 2016)
Franklin J 2009 Mapping Species Distributions Spatial Inference and Prediction Cambridge University Press Cambridge
Hemmera 2014 Roberts Bank Terminal 2 Project Roberts Bank Delta BC Environmental Impact Statement Volume 3 Biophysical Effects Assessments Appendix 10-B Roberts Bank Ecosystem Model Parameter Estimates Port Metro Vancouver File 302-03503 (Accessed November 1 2016)
Port Metro Vancouver 2015a Roberts Bank Terminal 2 Project Roberts Bank Delta BC Environmental Impact Statement Volume 3 Biophysical Effects Assessments Section 100 Biophysical Setting (Accessed November 1 2016)
Port Metro Vancouver 2015b Roberts Bank Terminal 2 Project Roberts Bank Delta BC Environmental Impact Statement Volume 3 Biophysical Effects Assessments Section 103 Overview of Assessing Ecosystem Productivity (Accessed November 1 2016)
Port Metro Vancouver 2015c Roberts Bank Terminal 2 Project Environmental Assessment Additional Information Requirements (July 31 2015) Responses Response to Information Request 6 IR-73115-06 Canadian Environmental Assessment Agency Reference Number 80054 dated 26 October 2015
Steenbeek J Coll M Gurney L Meacutelin F Hoepffner N Buszowski J and Christensen V 2013 Bridging the gap between ecosystem modeling tools and geographic information systems Driving a food web model with external spatialndashtemporal data Ecological Modelling 263 139ndash 151
Sutherland T Elner R and OrsquoNeill J 2013 Roberts Bank Ecological crucible of the Fraser River estuary Progress in Oceanography 115 171ndash180
Vancouver Fraser Port Authority 2016 From the Vancouver Fraser Port Authority to the Review Panel re Answers to preliminary technical questions submitted during the completeness phase from Fisheries and Oceans Canada Natural Resources Canada and Environment and Climate Change Canada concerning the ecosystem modelling to support the Roberts Bank Terminal 2 Project environmental review CEAR Document 547 (Accessed November 1 2016)
Pacific Region Science Response Technical Review Assessing
Ecosystem Productivity Model of Roberts Bank
23
This Report is Available from the Centre for Science Advice
Pacific Region Fisheries and Oceans Canada
3190 Hammond Bay Road Nanaimo BC V9T 6N7
Telephone (250) 756-7208 E-Mail csapdfo-mpogcca
Internet address wwwdfo-mpogccacsas-sccs
ISSN 1919-3769 copy Her Majesty the Queen in Right of Canada 2016
Correct Citation for this Publication
DFO 2016 Technical review of Roberts Bank Terminal 2 environmental assessment section 103 ndash assessing ecosystem productivity DFO Can Sci Advis Sec Sci Resp 2016050
Aussi disponible en franccedilais
MPO 2016 Examen technique de leacutevaluation environnementale du Terminal 2 agrave Roberts Bank section 103 ndash eacutevaluation de la productiviteacute de leacutecosystegraveme Secr can de consult sci du MPO Reacutep des Sci 2016050
- TECHNICAL REVIEW OF ROBERTS BANK TERMINAL 2 ENVIRONMENTAL ASSESSMENT SECTION 103 ndash ASSESSING ECOSYSTEM PRODUCTIVITY
-
- 10 Context
- 20 Background
-
- 21 Background and Terms of Reference
- 22 Approach to assessing ecosystem productivity
-
- 30 Analysis and Response
-
- 31 The EwE Team
- 32 Overview of assessment results of hydrological and sediment modelling
- 33 Model implementation
-
- 331 The purpose of the EwE model
- 332 Applicability of the EwE model framework to the Roberts Bank region
- 333 Model documentation
- 334 Highly mobile functional groups
- 335 Seasonality (model time step)
- 336 Life history structure
- 337 Model balancing
-
- 34 Model validation
- 35 Model results
-
- 351 Presentation of model results
- 352 Sensitivity and vulnerability analyses
-
- 40 Conclusions
- Contributors
- Approved by
- Sources of Information
- This Report is Available from the
-
- CSAS 2016-50 - Assessing Ecosystem Productivitypdf
-
- TECHNICAL REVIEW OF ROBERTS BANK TERMINAL 2 ENVIRONMENTAL ASSESSMENT SECTION 103 ndash ASSESSING ECOSYSTEM PRODUCTIVITY
-
- 10 Context
- 20 Background
-
- 21 Background and Terms of Reference
- 22 Approach to assessing ecosystem productivity
-
- 30 Analysis and Response
-
- 31 The EwE Team
- 32 Overview of assessment results of hydrological and sediment modelling
- 33 Model implementation
-
- 331 The purpose of the EwE model
- 332 Applicability of the EwE model framework to the Roberts Bank region
- 333 Model documentation
- 334 Highly mobile functional groups
- 335 Seasonality (model time step)
- 336 Life history structure
- 337 Model balancing
-
- 34 Model validation
- 35 Model results
-
- 351 Presentation of model results
- 352 Sensitivity and vulnerability analyses
-
- 40 Conclusions
- Contributors
- Approved by
- Sources of Information
- This Report is Available from the
-
Canadian Science Advisory Secretariat Pacific Region Science Response 2016050
December 2016
TECHNICAL REVIEW OF ROBERTS BANK TERMINAL 2 ENVIRONMENTAL ASSESSMENT SECTION 103 ndash
ASSESSING ECOSYSTEM PRODUCTIVITY
10 Context Vancouver Fraser Port Authority (VFPA) formerly Port Metro Vancouver (the Proponent) is proposing to construct and operate the Roberts Bank Terminal 2 Project (the Project) a new three-berth marine container terminal at Roberts Bank in Delta British Columbia The proposed terminal is located next to the existing Deltaport and Westshore Terminals In addition to the construction of the new terminal the Proponent has proposed to widen the north side of the existing Roberts Bank causeway from its east-end connection with the mainland to the entrance to the new terminal The existing tug basin connected to the northeast side of Deltaport Terminal is also proposed to be expanded The new marine terminal is predicted by the Proponent to process up to 260 container ship calls per year at full capacity with the assistance of two or three large berthing or escort tugs to manoeuver ships into or away from assigned berths The terminal is designed to operate 24 hours per day year-round
The Roberts Bank Terminal 2 Project is subject to an environmental assessment by a Review Panel pursuant to the Canadian Environmental Assessment Act 2012 As a federal authority in the environmental assessment for the Project Fisheries and Oceans Canada (DFO) will be asked to present information to the review panel and at public hearings in relation to its expertise on the effects of the Project on fish and fish habitat including aquatic species at risk and the adequacy of mitigation and offsetting measures and monitoring and follow-up programs proposed by the Proponent DFOrsquos Pacific Region Fisheries Protection Program (FPP) will coordinate DFOrsquos participation in the environmental assessment
The Proponent assessed future ecosystem productivity at Roberts Bank using the Ecopath with Ecosim and Ecospace (EwE) model framework The potential impacts of the Project to hydrodynamic conditions and sediment transport in the area as a result of changes in wind wave and current patterns and intensities are projected using different model frameworks A companion Science Response (DFO 2016) has been developed by DFO and Natural Resource Canada (NRCan) to review Section 95 ldquoCoastal Geomorphologyrdquo of the Environmental Impact Statement (EIS) which describes the hydrodynamic and sedimentology models that were used to evaluate the effect of the Project on water and sediment movements
Outcomes of the EwE models are incorporated into the analysis of the potential project-related effects on the ongoing productivity of commercial recreational and Aboriginal fisheries Consequently DFO FPP has requested that DFO Science Branch provide an evaluation of the Proponentrsquos characterization of project-related effects as conducted using the Ecopath with Ecosim and Ecospace (EwE) ecosystem model
Pacific Region Science Response Technical Review Assessing
Ecosystem Productivity Model of Roberts Bank
2
The objectives for this Science Response are to
1 Determine if the functional groups and abiotic factors used in the model adequately represent the ecosystem at Roberts Bank
2 Assess whether the parameter estimates used by the model are valid and defensible for this system
3 Assess whether the limitations and uncertainties of the model are identified and appropriately considered when determining the modelrsquos representation of current and possible future conditions
4 Provide advice regarding whether the model results related to the potential effects of the Project on fish and fish habitat and migratory birds and their food resources are valid and defensible
5 If possible provide advice regarding the validity of using the EwE model framework to quantify large scale impacts to fish habitat and fisheries productivity and the productivity of migratory birds
This Science Response evaluates Section 100 ldquoBiophysical Settingrdquo with a focus on Section 103 ldquoOverview of Assessing Ecosystem Productivityrdquo in the EIS as submitted by the Proponent (Port Metro Vancouver 2015) This Section and consequently this Response describes the ecosystem modelling approach that was taken to evaluate the direct and indirect effects of the footprint of the proposed terminal and widened causeway herein referred to as lsquothe Projectrsquo This ecosystem model provides outputs related to potential effects of the project on the study area at an ecosystem level including aquatic species and bird species in the Project area Evaluation of the model and its outputs therefore required expertise in both fishery aquatic species and migratory bird species Consequently this Science Response is the product of a joint review between DFO and Environment and Climate Change Canada (ECCC) Canadian Wildlife Service and Wildlife and Landscape Science to provide a complete evaluation
This Science Response Report results from the Science Response Process of July 2016 on the Technical Review of Ecopath with Ecosim and Ecospace (EwE) Ecosystem Productivity Model application to the Roberts Bank Terminal 2 Environmental Assessment
20 Background
21 Background and Terms of Reference The Projectrsquos main components have a proposed combined marine footprint area of approximately 179 km2 listed below by specific component
bull Marine Terminal 1335 km 2 including terminal (116 km 2) and dredged berth pocket and marine approach areas (0174 km 2)
bull Widened Causeway 0424 km 2
bull Expanded Tug basin 0031 km 2
Roberts Bank in the Fraser River estuary consists of complex intertidal and subtidal habitats including intertidal eelgrass beds and is an important stopover area for migrating shorebirds and productive feeding and rearing habitats for many fish and invertebrate species It also provides habitat for endangered Southern Resident Killer Whales and other marine mammals
Pacific Region Science Response Technical Review Assessing
Ecosystem Productivity Model of Roberts Bank
3
The environmental conditions at Roberts Bank are dynamic and are influenced by a variety of oceanographic and atmospheric factors including the Fraser River freshwater and sediment plume discharge diurnal tidal currents and prevailing and storm-generated wind and wave activity In addition the intercauseway region provides significant drainage from marsh and agricultural areas which have different characteristics from marine waters and which run along the ferry causeway
To provide the required science advice this Science Response focusses on Section 10 ldquoBiophysical Settingrdquo of the Environmental Impact Statement (EIS) (Port Metro Vancouver 2015a) specifically Section 103 ldquoOverview of Assessing Ecosystem Productivityrdquo (Port Metro Vancouver 2015b) and its related Appendices 10-B ldquoRoberts Bank Ecopath with Ecosim and Ecospace model parameter estimatesrdquo (Hemmera 2014) Appendix 10-C ldquoRoberts Bank Ecosystem model development and key runsrdquo(ESSA Technologies 2014a) and Appendix 10-D ldquoRoberts Bank Ecosystem model sensitivity analysesrdquo (ESSA Technologies 2014b) Additional important information was obtained from the Response to Information Request 6 (IR-73115-06 Canadian Environmental Assessment Agency Reference Number 80054 dated 26 October 2015) (Port Metro Vancouver 2015c) and the Written Responses to Coastal Geomorphology and Ecosystem Modelling Questions provided by the Proponent to DFO ECCC and NRCan on 2 March 2016 (Port Metro Vancouver (PMV) Transmittal TRE-01-RBT2-0004A subsequently referred in this Science Response as ldquoPMV Response 2016-03-02rdquo) (Vancouver Fraser Port Authority 2016)
The process followed in preparing this Science Response involved an initial review of the submitted EIS followed by an in-person meeting of the Proponent its contractors and representatives of DFO ECCC and NRCan to discuss and clarify questions arising from the initial review (Vancouver 23 November 2015) DFO and NRCan provided written questions to the Proponent based on preliminary review of the EIS on November 19 2015 ECCC also provided written questions based on its preliminary review of the EIS to the Proponent on December 1 2015 and January 20 2016 This large initial meeting was followed by smaller focussed meetings between the Proponent its contractors and DFO and NRCan on 11 December 2015 to clarify hydrology and sediment modelling questions with DFO on 8 January 2016 to clarify ecosystem modelling questions and with ECCC on 18 February 2016 to clarify questions relating to birds Written responses to all of these meetings and questions were provided by the Proponent to DFO ECCC and NRCan as the ldquoPMV Response 2016-03-02rdquo and ldquoPMV Response 2016-05-30rdquo (Vancouver Fraser Port Authority 2016) VFPArsquos answers to questions posed by DFO and NRCan regarding coastal geomorphology modelling have been posted to the Canadian Environmental Assessment Registry (CEAR)
22 Approach to assessing ecosystem productivity The Proponent adopted an ecosystem approach to evaluate the direct and indirect effects of the Project on the productivity of the Roberts Bank ecosystem A weight of evidence approach was used to assess the potential effects of the project on the productivity of the ecosystem and selected key components in the study area this approach included a spatial ecosystem simulation model (which included a habitat capacity model) a shorebird opportunity model and empirical data An important point is that any effects on the system during the construction phase or from expansion of the tug basin were excluded from this modelling process the focus instead being a comparison of modelled system productivity before and after the proposed terminal and expanded causeway is in place The chosen ecosystem simulation model was
Pacific Region Science Response Technical Review Assessing
Ecosystem Productivity Model of Roberts Bank
4
Ecopath with Ecosim and its spatial version Ecospace (collectively referred to here as the EwE framework or EwE model) This modelling approach was recommended by a prior Productive Capacity Technical Advisory Group comprised of representatives of technical experts from government agencies academia non-governmental organizations Vancouver Fraser Port Authority and its consultants (Compass 2013) convened by the Proponent and which also recommended a selection of focal species for the model The final selection of functional groups and the resulting food web that form the core of this ecosystem model are shown in Figure 1
Pacific Region Science Response Technical Review Assessing
Ecosystem Productivity Model of Roberts Bank
5
Figure 1 Ecopath with Ecosim model food web for Roberts Bank (Adapted from EIS Volume 3 Section 10 Fig 1033 on page 10-16) The groups coloured in orange represent focal groups size of symbols represents relative annual amount of biomass in the Roberts Bank study area
Pacific Region Science Response Technical Review Assessing
Ecosystem Productivity Model of Roberts Bank
6
The EwE framework is a common approach to ecosystem modelling which has been developed and expanded over the past two to three decades It currently has three main components
1 Ecopath ndash the core model which provides a mass-balance snapshot of the system
2 Ecosim ndash a module that enables simulation modelling over time
3 Ecospace ndash a module that enables simulation modelling over space
In order to make an EwE model tractable species are aggregated into functional groups based on their similar ecological characteristics (habitat and prey preferences etc) the Roberts Bank models had 58 functional groups The first step (Ecopath) was to obtain input parameters representing biomass production consumption emigration and diet for each functional group These parameters were then tuned in an iterative process until the overall production and consumption was balanced (a mass-balance approach) resulting in a model food web with estimates of energy flow between functional groups (Fig 1)
In the second step Ecosim was combined with the spatial model Ecospace The abiotic variables selected in this EIS (depth salinity bottom current wave height sediment type) were used as external forcings to the Ecospace module These abiotic variables provided the physical forcings for the simulations without and with the Project Since time series data on the functional groups of the model were not available Ecospace was run until the model reached equilibrium using various assumptions of the value of the vulnerability parameter (see Section 352) In this EIS the selected time step was annual with all variables abiotic and biotic expressed as yearly averages As used in this EIS the Ecospace module included a habitat capacity model which estimated the distribution of functional groups based on their environmental preferences for each abiotic variable (depth salinity bottom current wave height) and for substrate type (sand mud etc) The model thus allocated the spatial distribution of functional groups over the model domain based on their environmental preferences and the distributions of these abiotic variables with and without the Project The selected spatial unit size (ldquopixelrdquo) for the Ecospace model was 100 m2 In essence an Ecopath model was constructed for each pixel with particular rules governing how the functional groups interacted and moved among these spatial units The Ecospace module was run until it approached equilibrium (20 model years) to establish the spatial patterns without the Project For the lsquowith the Projectrsquo simulations the model was run for an initial 10 years and then the spatial patterns of the abiotic variables with the project were added and the model run for an additional 10 years1 The model outputs predicted changes in the productive potential of the Roberts Bank ecosystem as a comparison (ratio) with and without the Project rather than an absolute biomass that would be lost or gained as a result of the Project
1 EIS Appendix 10-C p 26
Pacific Region Science Response Technical Review Assessing
Ecosystem Productivity Model of Roberts Bank
7
30 Analysis and Response To prepare this response the following sections of the EIS additional documents were reviewed
DocumentSection Title
EIS Section 10
Including appendices 10B 10C and 10D
(Port Metro Vancouver 2015a Hemmera 2014 ESSA Technologies 2014a ESSA Technologies 2014b)
Biophysical Setting
Appendix 10-B Roberts Bank Ecosystem Model Parameter Estimates Port Metro Vancouver File 302-03503
Appendix 10-C Roberts Bank Ecosystem Model Development and Key Run Port Metro Vancouver
Appendix 10-D Roberts Bank Ecosystem Model Sensitivity Analyses Port Metro Vancouver
CEAR document 547 (Including Appendices) ldquoPMV Response 2016-03-02rdquo and ldquoPMV Response 2016-05-30rdquo
(Vancouver Fraser Port Authority 2016)
Vancouver Fraser Port Authority to the Review Panel re Answers to preliminary technical questions submitted during the completeness phase from Fisheries and Oceans Canada Natural Resources Canada and Environment and Climate Change Canada concerning the ecosystem modelling to support the Roberts Bank Terminal 2 Project environmental review
31 The EwE Team Building this ecosystem model was a complex undertaking which required knowledge of the ecosystem to be modelled how to set initial parameter values determination of reasonable ranges of these parameters how to balance the model and how to recognize when the model outputs were unrealistic These tasks became even more complex when spatial model dynamics were involved such as with Ecospace The team engaged by the Proponent to conduct this ecosystem modelling for the Roberts Bank Terminal 2 (RBT2) EIS was led by scientists at the Institute for Oceans and Fisheries located at the University of British Columbia in Vancouver These scientists are global leaders of the EwE model framework having developed much of its current implementation and who continue to lead its elaborations and extensions Construction and running of the model for this specific ecosystem was done in collaboration with ESSA Technologies of Vancouver Parameter values for the ecosystem model were obtained in part from observational studies conducted in the area by Hemmera of Burnaby BC
32 Overview of assessment results of hydrological and sediment modelling Implementation of the ldquowith the Projectrdquo simulations of the ecosystem model was done by driving the model with the abiotic variables as they were projected to be distributed with the Project footprint In the context of this EIS specifying depth salinity bottom currents wave height and sediment type conditions without the Project and changes with the Project were achieved by construction of hydrodynamical and sediment transport models The outputs from these models in combination with the identified environment preferences for the various biological groups were then used as inputs to the Ecospace model to define the spatial
Pacific Region Science Response Technical Review Assessing
Ecosystem Productivity Model of Roberts Bank
8
distributions of these functional groups The implementation of these hydrological and sediment transport models in this EIS was reviewed by DFO and NRCan (DFO 2016) This review concluded that the implementation of these models for this EIS was adequate for average winter conditions but lacking in validation for summer conditions in particular with strong freshwater flows from the Fraser River Simulations of strong storm events and their impacts on wave conditions and sediment transport were also lacking The effect of wave action and current speeds on sediment transport is non-linear such that increasing winds over short periods of time can impact sediment transport processes bottom topography and water depths beyond that determined under average model conditions Overall the review concluded that a greater range of sensitivity analyses is required to have confidence in the model outputs under lsquonon-averagersquo conditions The implication of this conclusion for the present review of the EwE model is that the full range of variability of abiotic characteristics such as bottom topography bottom current and wave heights and how they may affect relevant functional groups in the model with the Project may not be adequately represented Sensitivity analyses were provided by varying the intensity of abiotic variables and by removing abiotic variables to assess their interactive effects In general the ecosystem model outputs were robust to these sensitivity analyses with most groups varying by less than 5 Larger changes however were observed for primary producer and bird groupings and for some fish groups when various abiotic variables were omitted2
33 Model implementation 331 The purpose of the EwE model
The EwE model was intended to provide one line of evidence to assess the potential impacts of the Project on the Roberts Bank ecosystem which would then be used with other lines of evidence to make the final assessment Specifically ldquohellip the objective of the RB [Roberts Bank] model was not to provide an assessment of Project impacts for each functional group at a fine temporal scale but to estimate changes in productive potential with and without the Project at the ecosystem levelrdquo3 In addition ldquohellipthe primary objective of the RB ecosystem model is to evaluate potential changes in productivity from such abiotic factors with and without the terminal and causewayrdquo4 Results are presented for the selected functional groups no results were presented on potential changes in ecosystem structure or function
332 Applicability of the EwE model framework to the Roberts Bank region EwE models work best when the exchanges within the system being modelled are greater than the exchanges between the modelled system and the lsquooutsidersquo world In practice this means that EwE models work best for larger systems with few external exchanges In a meta-analysis of 433 Ecopath models Colleacuteter et al (2015) concluded that ldquohellipin the last two decades the range of the models area has expanded toward very large areas and the median has shifted accordingly from about 1000 km2 in 1984ndash1993 to about 100000 km2 in 1994ndash2014rdquo The section of the Roberts Bank ecosystem that is included in the EwE model was comparatively small (5468 km2) and complex It is an intertidally-dominated environment that is subject to strong seasonal influences of both freshwater and marine exchanges across relatively large seaward and shoreward boundaries
2 EIS Appendix 10-D p ii - iii 3 PMV Response 2016-03-02 p 99 lines 1914-1917 4 PMV Response 2016-03-02 p 38 lines 689-691
Pacific Region Science Response Technical Review Assessing
Ecosystem Productivity Model of Roberts Bank
9
Processes taking place outside the modelled ecosystem will contribute to dynamics within the modelled ecosystem (eg lsquooutsidersquo food supporting predators which occur in the Roberts Bank ecosystem for only part of the year predators which may feed in the Roberts Bank ecosystem but export this energy when they migrate out of the region) but which may not be well-resolved by the EwE model The Proponent justifies the spatial scale because it was specifically chosen for the questions being asked in regard to assessing productivity changes and because the relative influences of external exchanges are assumed to be identical with and without the project In addition highly mobile species with broad prey bases were assumed in the model to be partially sustained by external energy from outside the model system5 The distributions of organisms may differ however with and without the project which may affect their interactions with areas outside of the modelled system and the use of diets from outside the modelled system may not reflect the impacts of the project Further clarification of how the EwE model captures the exchanges and interactions with adjacent ecosystems are needed For example it could be argued that an ecosystem which is open to frequent exchanges of water and organic matter from beyond its boundaries might be more robust to local disturbances such as the Project
There are some inconsistencies in the information and assumptions used for some of the taxa in this ecosystem model For Dungeness Crab the justification for estimating total adult biomass (including females) from the biomass of fished males is unclear In addition it is unclear if the slower growth of female crabs once they have reached sexual maturity in comparison with male crabs has been considered The diet matrix for spiny dogfish does not represent the actual diet well in particular of euphausiids herring and shrimp and there are more recent references for biomass estimates of spiny dogfish in the study area than what was used in the EIS
Fishing mortality was not included in the model under the assumption that this would not change with or without the project While this assumption may be true the model has been parameterized by ignoring a source of mortality that will influence total production In essence fishing removes biomass from the ecosystem with the result that less biomass will be available for higher trophic levels How this may impact the ecosystem with and without the Project is unclear but it could make noticeable differences if for example there were thresholds in the feeding responses by these higher trophic level species The Ecopath model that was used is relatively unconstrained since many ecological efficiencies are low even for forage species which would be expected to be higher It is not clear how many species are exploited or the levels of exploitation but even if this does not change with the Project these mortality rates should be included in the model in order to add realistic constraints to the exploited functional groups
333 Model documentation Based on questions from DFO ECCC and NRCan following their initial review of the EIS the Proponent provided written responses dated 2 March 2016 to clarify several of the steps in the model development and implementation However several questions remain including questions about the Ecospace module Ecospace has undergone several recent developments such as the inclusion of the spatial-temporal data layer framework (Steenbeek et al 2013) the habitat capacity model (Christensen et al 2014) and the Monte Carlo analysis including the diet matrix As yet there are few published studies using these latest Ecospace developments and their documentation and justification need to be improved in the EIS
5 PMV Response 2016-03-02 p 29 lines 446 - 464
Pacific Region Science Response Technical Review Assessing
Ecosystem Productivity Model of Roberts Bank
10
Questions also remain regarding how the Monte Carlo randomization routine treated diet data The report indicates that the Monte Carlo routine randomly selected input parameters from the input ranges and that only models that were balanced were used This suggests that a high proportion of models were not balanced and therefore were not used (for example the EIS indicates that about one out of 1000 sampled input parameters was balanced6) A table showing the minimum maximum mode average and median values from the Monte Carlo runs for all the parameters would enable an evaluation of how much variation was actually sampled by the balanced model runs This is recommended in the EwE user information ie ldquoUsers should check the range of the input parameters that were actually used in the trials in the output csv file (see below)rdquo7
In addition there are several issues with the documentation of the derivation of the parameters for the functional groups Such documentation should clearly outline how the input parameter was estimated and the range of uncertainty for that parameter For example the input biomass of pinnipeds was defined as 04 t km 2 derived from estimates of 034 for Harbour seals and two estimates for Steller sea lions (012 and 014 t km 2) No explanation was provided for how the overall estimated pinniped biomass of 04 t km 2 was determined The diet of Sand Lance was described in the EIS as consisting mostly of zooplankton8 whereas the diet table for the model runs9 included 20 macrofauna 10 green algae and 10 detritus It is unclear why these additional prey were included in the diet used for the model runs
334 Highly mobile functional groups This implementation of the EwE framework included transient and migratory functional groups This is entirely appropriate and these groups cannot be excluded The approach taken in the Ecospace module was to impose a low (and conservative) dispersal rate among model spatial units (lsquopixelsrsquo) of 1 km yr-1 This may be appropriate for low mobility benthic organisms but it likely underestimates the movements of many other functional groups The effects of using higher and perhaps functional-group-specific dispersal rates was not considered The Proponents argued that higher dispersal rates would reduce impacts since species can move away from less desirable areas more quickly for completeness these runs should be done and evaluated Mobile species will also bring energy (food) captured outside the system into the modelled ecosystem This process was included in the model with the use of a diet import factor reflecting the consumption of prey outside the modelled region with the assumption that groups with high import rates were unlikely to respond to local changes on Roberts Bank10 This assumption needs justification perhaps at the functional group level for example many species of highly migratory birds and Pacific salmon use the Roberts Bank ecosystem to obtain food to continue their migrations Although this food does not compose a large fraction of their annual consumption it can be critical to enable them to continue their migrations
The EwE model is not designed to capture differences in prey quality ie differences in essential fatty acid or nutrient ratios The same species of prey may have greater or lesser nutritional value to predators depending on the conditions under which they are growing and their seasonal variations This is a particular concern with the nutritional quality of the diatom-dominated biofilm Diatomaceous biofilm is important to the highly migratory Western Sandpiper (Calidris mauri) Despite its predictive merits in relation to other ecosystem
6 EIS Appendix 10D Section 24 p5 7 EwE Help file p 151 8 EIS Appendix 10B Section 4133 p 76 9 EIS Appendix A of Appendix 10B 10 PMV Response 2016-03-02 p 28 lines 429 - 436
Pacific Region Science Response Technical Review Assessing
Ecosystem Productivity Model of Roberts Bank
11
components the EwE model is not informative with respect to understanding the potential impacts of the Project on biofilm and the Western Sandpiper While this example is specific to seabirds the potential exists for differences in the quality of biofilm to also be an issue for copepods which feed on biofilm and consequently to juvenile salmon which feed on these copepods (eg Sutherland et al 2013)
The EwE model is also not designed to predict effects of the Project on water quality although the Proponent noted that ldquoOther abiotic factors not included were deemed to be representative of variables that were already included in the modelhelliprdquo11 The Project may cause changes in physical and water quality conditions whether in isolation or in combination which may impact the productivity or nutritional quality of key prey organisms for local and migratory species which will not be captured by the model The EwE model does not assess the production of key nutrients or the implications of changes in important physical and water quality parameters to biofilm community structure and hence to important migratory birds
The model does not include biotic factors for both pelagic and benthic environments to assess the potential development of eutrophication and benthic organic enrichment events respectively Organic and redox indicators traditional measures of environmental assessments that are used to determine changes in functional group responses were included in the recent Deltaport Third environmental assessment (ie Pelagic chlorophyll dissolved nutrients Benthic sediment carbonnitrogen content redox state [sulfide concentration]) Benthic anoxic events based on organic enrichment are known to be strong drivers of community composition and exclusion regardless of substrate type In the absence of biotic factors (eg organic particulates) the model has not considered the potential for benthic organic enrichment which coincides with siltation processes within the upper tidal flats The tidal flat corner bordered by the Delta-dyke and Deltaport causeway has served as a catchment area for Fraser River silt since the development of the original Deltaport causeway (Sutherland et al 2013) The proposed position of the new terminal placed at the seaward termination of the Deltaport causeway may produce a crescent-shaped feature in the wake of the Fraser River Plume This feature may provide a more efficient silt trap that will promote benthic organic enrichment This piece of the environmental assessment seems to be missing and is important for assessing fish habitat in this area
335 Seasonality (model time step) Input data to parameterize the model were available on a range of time scales from hourly (eg physical data on salinity and water flow) to annual (eg species biomass) The Proponents indicated12 that this is a strength of the EwE model although ultimately the model was run with an annual time step with all sub-annual values being averaged to annual values This method therefore did not incorporate important seasonal processes such as winter-summer differences in salinity and storm properties and the seasonal appearances of abundances of predators and prey such as migratory salmon and birds that are much larger than the annual average For example juvenile salmon migrate from the Fraser River and onto Roberts Bank in the spring before moving into deeper waters If these spring abundances are averaged over the entire year these average abundances would be 5-10 times lower than the actual abundances during the spring (ie averaging the biomass that occurs in two months over a 12 month period) Additionally this method did not capture the intensity of processes such as growth and predation which can be focused over periods of a few weeks to a few months There may be important threshold effects at particular times and places which may be missed when using an 11 EIS Section 10 p 10-11 12 PMV Response 2016-03-02 p 86 line 1655
Pacific Region Science Response Technical Review Assessing
Ecosystem Productivity Model of Roberts Bank
12
annual time step for the model The Ecospace module has a monthly time step13 and therefore it is feasible to run this module with a sub-annual time step For example the Proponents submit14 that there are inadequate data to model the potential effects of the Project on the timing of biofilm production which could have implications for the migratory dunlin and Western Sandpiper However this could be modelled in an exploratory way to determine hypotheses about which factors could affect the timing of production of biofilm and the potential impacts on these birds These issues are of major concern to ECCC
336 Life history structure The EwE model did not separate functional groups into life history stages (stanzas) yet for many functional groups the juvenile stages can have very different life history characteristics and habitats than the adults It is unclear in the description of the model how different life history structures were considered and whether for example there were enough juveniles to produce the adults The implications of not including early life stages should be explored at least qualitatively to identify which species might have life stages that may be more vulnerable to project effects
337 Model balancing Balancing an EwE model is the process by which parameters are adjusted so that there is sufficient production for consumption requirements ie there are sufficient prey for all predators Expert opinion was used to examine parameter values and to adjust for errors or inconsistencies in logic ldquoPMV is confident that since the approach taken to balance the model was based on best practices the steps are appropriaterdquo15 Adjustments to initial parameters to ensure an ecologically-feasible model are necessary and to be expected For a few functional groups however very large changes to initial parameter estimates (which were often not based on Roberts Bank specific data) were necessary for example to transient killer whales When such initial parameters were adjusted (often by substantial amounts) by expert opinion to balance the model the confidence intervals around these adjusted parameter values were not increased to reflect this added uncertainty (see for example PMV Response 2016-03-02 p 51 lines 955-956) When expert opinion was used to make very large changes to initial parameter values broader confidence intervals about these parameters should have been applied This does not appear to have been the case and as a consequence may cause the actual uncertainty of the model outputs to be underestimated
Another example is for the pinniped group in which 50 of the diet was assumed to come from outside the model area in order to balance the model The rationale provided was ldquoThe pinnipeds caused excessive predation mortalities on numerous fish functional groups The biomass of pinnipeds was an average for the Strait of Georgia which was likely too high for Roberts Bank Therefore it was assumed that pinnipeds extracted only half of their diet from the study areardquo16 It is unclear whether the sensitivity of the model to different percentages of diet allocation was explored
As noted above (332) the Ecopath model was relatively unconstrained and few adjustments to input parameters were required to balance the model This is unusual and the low ecotrophic efficiencies of several functional groups suggest that full accounting of energy flows may not have been achieved (an ecotrophic efficiency of 1 indicates that 100 of the production of that
13 EIS Appendix 10C Section 29 p24 14 EIS Appendix 10D Appendix C p72 15 PMV Response 2016-03-02 p 49 lines 910-912 16 EIS Appendix 10C Section 261 p 20
Pacific Region Science Response Technical Review Assessing
Ecosystem Productivity Model of Roberts Bank
13
particular group is being preyed upon or removed by fishing leaving no individuals to die of old age17) An ldquoexcessrdquo of individuals dying of old age ie ecotrophic efficiencies much less than 1 suggests a potentially large biomass that is not used by the ecosystem and instead is converted to detritus
34 Model validation Model validation is the process by which the model parameters variables and outputs are compared with those from the real ecosystem to ascertain how well the model represents the ecosystem It is an essential step in providing confidence that the projections from the model in this case with and without the Project have relevance to how the real ecosystem may be expected to function with and without the Project In practice validating complex ecosystem models is difficult considering the range of assumptions that must be made when building the model the limited available data and natural variability of the ecosystem at a variety of time and space scales
Many of the standard diagnostics for the Ecopath model have not been evaluated in the EIS The Proponent appears to have assumed that once the Ecopath model was balanced then it was valid and fit for purpose The Proponent should provide all the Ecopath estimates of vital rates including mortality rates As presented questions remain For example many Ecotrophic Efficiencies (which control the transfer of biomass from prey to predators) are less than 1 even for taxa which would be expected to be close to 1 such as carnivorous zooplankton The reason for Ecotrophic Efficiencies less than 1 were not discussed or explained in the EIS
Detailed diagnostics for the Ecospace model should also be presented in order to evaluate model performance In response to criticisms by DFO ECCC and NRCan in discussions with the Proponent the latter provided the biomass of the functional groups from the Ecopath model (before Ecospace) and the Ecospace model after the spin-up period (which involved adjusting the parameters from the Ecopath model to balance the 5468 separate cells of the Ecospace model)18 The Proponents argue that ldquoIt is important to note that changes in biomass values generated during the spin-up period are identical for both with and without Project scenarios and thus do not provide information on the potential Project-related effects on productivity19 However several changes to biomass result from the Ecospace balancing process (spin-up period) This is only given brief attention by the Proponent in its response to the DFO ECCC and NRCan questions An analysis of Table 620 revealed that the biomass of 9 functional groups was larger or smaller than the widest confidence limits allowed for each group21 This requires further discussion and justification
The Proponent used a goodness of fit measure to compare spatial distributions of model outputs with field observations They indicated that ldquono other EwE models were identified which use a goodness-of-fit measure Hence the RB model is potentially the first such EwE model where a goodness of fit measure has been appliedrdquo22 The chosen goodness of fit measure is the percent correct classification (PCC) method23 This method derives a test statistic based on the proportion of locations at which predicted occurrences from the model match observed
17 EIS Appendix 10-B p 11 18 PMV Response 2016-03-02 p 65-66 Table 6 19 PMV Response 2016-03-02 p 64 lines 1205-1207 20 PMV Response 2016-03-02 p 65-66 Table 6 21 PMV Response 2016-03-02 p 45 Table 3 22 PMV Response 2016-03-02 p 78 lines 1481-1483 23 PMV Response 2016-03-02 p 78 lines 1483-1484
Pacific Region Science Response Technical Review Assessing
Ecosystem Productivity Model of Roberts Bank
14
occurrences from data and similarly with predicted and observed absences The Proponent then calculated two additional accuracy of fit measures sensitivity (the model predicts a species to occur in an area where it is known to occur in reality) and specificity (the model predicts a species does not occur in an area it is known not to occur in reality)24 This analysis concluded that the model has high predictability for functional groups such as eelgrass and sea pens with relatively static distributions but lower predictability for functional groups which are more temporally and spatially dynamic such as biofilm and green algae25
There are two problems with this approach The first is that this goodness of fit comparison was done only for habitat-forming functional groups no discussion of how well this analysis applies to mobile functional groups was provided The second problem is that this method does not take into account situations (such as occurs in this study with several groups) in which species occur at only a few locations For example ldquohellipif the test data consist of 95 absences and 5 presences and this reflects the true prevalence of the species on the landscape (a realistic scenario for a rare species) a lsquonullrsquo model that predicted absence in all cases (eg no model at all) would be correct 95 of the timehellipldquo (Franklin 2009 p 151) This latter point is important here as these habitat functional groups (biofilm brown algae native eelgrass green algae Japanese eelgrass tidal marsh biomat and orange sea pens26) appear not to occur over most of the Project area (as portrayed by the model outputs presented in the distribution figures of PMV Response 2016-03-02 Appendix 218) It is therefore important that a robust evaluation of the performance of the Ecospace module is used with preferably more than one measure
In summary the starting point for this modelling analysis matters It is not just about a comparison between results with and without the Project The model has to be considered a sufficient representation of the ecosystem The Proponent has not yet sufficiently validated the model
35 Model results 351 Presentation of model results
As noted above (Section 331) the stated objective of the Roberts Bank ecosystem model was not to provide an assessment of Project impacts for each functional group at a fine temporal scale but to estimate changes in productive potential with and without the Project at the ecosystem level27 However results were presented as comparisons by speciesfunctional group with and without the Project and not as potential changes in total ecosystem productivity The revised figures for each functional group showing distributions without the Project with the Project and their difference indicated impacts were likely to be localized with overall impacts relatively small The range of biomass ratios with and without the Project was 045 ndash 189 with most values slightly less than 1 This is interpreted as indicating slight decreases in the capacity of the study area to support biomass and production with the Project for many functional groups28 (Figure 2)
24 PMV Response 2016-03-02 p 80 lines 1524-1527 25 PMV Response 2016-03-02 p 81 lines 1551-1559 26 PMV Response 2016-03-02 p 82 Table 8 27 PMV Response 2016-03-02 p 99 lines 1914-1917 28 PMV Response 2016-03-02 Appendix 218
Pacific Region Science Response Technical Review Assessing
Ecosystem Productivity Model of Roberts Bank
15
Biomass Ratio
Freq
uenc
y
04 07 10 13 16 19
05
1015
2025
30
Figure 2 Histogram of biomass ratios obtained by comparisons of model runs with and without the project (ie With Without) Values less than 1 indicate reductions in biomass with the Project compared against without the Project) Data from Appendix 218 of PMV Response 2016-03-02
352 Sensitivity and vulnerability analyses Every ecosystem model is only one possible representation of the true ecosystem defined by the modelrsquos structure and the values chosen for its many parameters The key point is how well the model represents the real system how that fit can be measured and the sensitivity of model outputs to variability in the selected parameter values The ideal model should be robust to a wide range of uncertainties in the input data and parameters This robustness is determined by performing sensitivity analyses on the model to see how it responds to variations in the input parameters and determining to which input parameters the model is most sensitive
The vulnerability parameters determine the strength of the feeding interactions between functional groups They set the level of density dependence of each functional group Higher vulnerability settings provide greater top-down (predator) control whereas lower settings provide greater bottom-up (environmental) control29 Several publications have shown that EwE models are very sensitive to the vulnerability parameters and Christensen and Walters (2000) point out that a main pitfall of EwE is that ldquopredation vulnerabilities are often underestimated lessening the modelled impacts of predationrdquo It is usual practice to tune Ecopath models including the vulnerability parameters to time series data such as biomass using the temporal simulation model Ecosim However these data were not available for the RBT2 area so this robust method of fitting the model and estimating vulnerability parameters was not possible Instead a vulnerability setting of 2 was used as the default value for the key model runs which is ldquocommon practice when time series data are not available and estimates of vulnerability in the
29 PMV Response 2016-03-02 p 70 lines 1318-1323
Pacific Region Science Response Technical Review Assessing
Ecosystem Productivity Model of Roberts Bank
16
model cannot be maderdquo30 with sensitivity analyses run for a range of 15 to 3 This narrow range was criticized by DFOECCC in initial discussions about the model with the Proponent The Proponent subsequently reran the model with a larger range of vulnerabilities31 (11 to 10) and concluded this broader vulnerability range produced similar results for the productivity ratio with and without the Project to those in the original EIS and that the EIS was more likely to overestimate than underestimate potential project effects32 The data in Table 7 of the PMV Response33 did indicate changes in productivity ratios ranging from 0 to 50 of the defined key run (which used a vulnerability setting of 2) However the Proponent changed all vulnerability settings to the same value ie all were 2 or all were 10 etc In reality the vulnerability parameters resulting from Ecosim models that are fitted to data as described above vary by functional group which was not explored here Therefore although the results suggest that the original choice of 2 for the default key run seemed reasonable the potential effects of variability in vulnerability settings was not fully explored
Sensitivity analyses are usually based on the range of uncertainty estimated for input data and parameters often called the confidence limits around the model parameters The EwE framework integrates many different data sources and parameters including values from the literature It can therefore be difficult to identify ldquoreasonablerdquo confidence limits when derived from such diverse data sources Standard practice in Ecopath models has been to develop a pedigree for each parameter with default values for uncertainty based on the nature of the source data For example parameter values based on high precision field observations of biomass within the model domain receive default confidence intervals of 10 whereas parameter values based on models developed for elsewhere or professional judgment receive confidence intervals of 8034 Sensitivity analyses are then run using parameter values selected from within these confidence intervals However if these default confidence intervals do not capture the full range of variability then the outputs are not informative of the variability in the lsquorealrsquo ecosystem Field observations were collected for many functional groups within the model domain in 2012 and 2013 as part of studies to support the RBT2 EIS Apparently the purpose of these observations was to document spatial variability (in part for the Ecospace model) and temporal variability (measurements at one location over time) and not to derive confidence intervals around the observations35
The reliance on the pedigree approach to derive confidence intervals for this Roberts Bank model was criticized by DFO ECCC and NRCan in discussions with the Proponent As a result the Proponent reran the model with much larger confidence intervals ranging from 30 to 100 depending on the input parameter and functional group36 The results from this new analysis using the broader confidence intervals were similar to those using the original pedigree approach The Proponent noted that ldquoWhile the production within each helliprun was very different there was little difference in the biomass ratio [with and without the Project] These results further demonstrate that even with a greater range in input values the influence of the Project on the Roberts Bank ecosystem is consistent among allhellipmodel runsrdquo37 This provides confidence that the model may be robust to uncertainty in its input parameters Two concerns
30 PMV Response 2016-03-02 p 70 lines 1321-1322 31 PMV Response 2016-03-02 p 71-74 32 PMV Response 2016-03-02 p 71 lines 1339-1341 33 PMV Response 2016-03-02 p 73 34 EIS Appendix 10-C Section 251 page 18 35 PMV Response 2016-03-02 p 42 lines 772-777 36 PMV Response 2016-03-02 p 44-47 37 PMV Response 2016-03-02 p 47 lines 855-858 and see also PMV Response 2016-03-02 Appendix 27-B
Pacific Region Science Response Technical Review Assessing
Ecosystem Productivity Model of Roberts Bank
17
remain however The quote above indicates that the production among the different model runs was very different although with little difference in the biomass ratios with and without the Project Since biomass is not the same as production it would be informative for understanding model performance and potential impacts to show these production differences This also relates to the point made in Section 34 regarding how well the model represents the real ecosystem and not just within-model comparisons with and without the Project The second question is more technical and relates to how the randomization (Monte Carlo or MC) routine that was used to create multiple model runs used the uncertainty about the diet data Diets are not currently included in the MC routine available to regular users of the Ecosim model how they were handled in this RBT2 model appears not to be explained
Finally the sensitivity analyses indicate that the uncertainty in the input parameters does not lead to much difference between model parameters with or without the project However this conclusion does not describe how the uncertainty in the input parameters affects understanding of the ecosystem
40 Conclusions Overall the main conclusion of the Environmental Impact Statement from the Proponent is stated as ldquohellipafter the implementation of mitigation hellipthe Project is not expected to result in any significant adverse effects on any of the 16 valued componentsrdquo38 In addition ldquohellipapproximately 40 of the functional groups are forecast to change no more than 5 which hellip is judged to be within the uncertainty of the model runsrdquo39 although larger changes were forecast for orange sea pens freshwater biofilm green algae and raptors The conclusions from the modelling studies are that ldquohellipthe proposed project will have an impact on the study area that the effect varies between species and that the findings are robust to parameter uncertaintyrdquo40 Specific outcomes by valued component as derived from the EwE model are presented by functional groups in Table 1
38 PMV March 2015 Roberts Bank Environmental Impact Statement Executive Summary ndash Part 1 page 37 39 EIS Appendix 10-C p ii 40 EIS Appendix 10-D p iv
Pacific Region Science Response Technical Review Assessing
Ecosystem Productivity Model of Roberts Bank
18
Table 1 Changes in productive potential with the Project as derived from the EwE model
Changes in productive potential
Ecosystem category
Number of valued
components
Number with potential
biomass loss
Moderate decrease (31-60 decline)
Minor decrease (6-30 decline)
Negligible (0-5
change)
Minor increase (6-
30 increase)
Moderate increase (31-60 increase)
Source
Marine vegetation
7 7 - 3 2 2 - EIS Vol 3 Section 11 Table 11-17 page 11-65
Marine invertebrates
4 3 1 1 1 1 - EIS Vol 3 Section 12 Table 12-8 page 12-52
Marine fish 13 13 - 2 6 5 - EIS Vol 3 Section 13 Table 13-10 page 13-95
Coastal birds
11 8 - 3 4 3 1 EIS Vol 3 Section 15 Table 15-10 page 15-67
Pacific Region Science Response Technical Review Assessing
Ecosystem Productivity Model of Roberts Bank
19
Most functional groups showed some potential biomass loss with the Project with biomass loss defined as any model run with negative outcomes (ie in which biomass with the project was less than biomass without the Project) The summary of changes in productivity potential are mixed with most (33 out of 35) valued components showing minor decreases to minor increases (defined as 6 to 30 changes in productive potential with the Project compared to without the Project)
The main conclusions of this review in regards to the Terms of Reference are
1 Do the functional groups and abiotic variables used in the model adequately represent the ecosystem at Roberts Bank
o The 58 functional groups and abiotic variables used in the model adequately represent the main components of the Roberts Bank ecosystem however for longer lived species the life stages of the species are not well represented and some of the impacts of the Project may be expected to affect specific life stages
o The abiotic variables adequately represent the physical drivers of this ecosystem on an annual time scale However annual values for these abiotic variables may not adequately capture important sub-annual events such as storms (DFO 2016) the timing of arrival and departure of highly migratory species and whether there may be important sub-annual thresholds or mismatches in timing as a result of the Project
o Biotic factors (eg nutrients) which are particularly important for biofilm and other lower trophic level taxa are not included in this model The model is therefore unable to assess the potential development of eutrophication and benthic organic enrichment events which may affect fish habitats in the study area
2 Are the parameter estimates used by the model valid and defensible for this system
o In general parameter estimates appear to be adequate for this system Field studies were done in two years to provide data in particular on distributions of selected functional groups for the Ecospace module Note the distribution studies focussed on taxa which were relatively immobile and therefore lsquofixedrsquo in space
o the selection of some model parameters would benefit from further explanation for example the choice of fixed diet matrices versus dynamic matrices which can vary with changes in abundances or predators and prey
o the selection of some model parameters would benefit from further explanation for example the link between the diets described in the text of Appendix 10B and the quantities presented in Appendix A of Appendix 10B It is understood that proportions were derived using the ldquofixed selectivityrdquo principle but in order to be fully transparent the derivation of each diet should be provided in an appendix
o discussion and explanation is needed of why ecotrophic efficiencies differ from expected values (eg the ecotrophic efficiency for Pacific herring is listed as 038) and
o the abiotic factor lsquosubstratersquo was limited to ldquohardrdquo or rdquosoftrdquo options which can be restrictive given that they serve as endpoints on a substrate composition continuum These limited options may not provide the sensitivity required to assess substrate preference nor the flexibility for taxa (eg motile organisms) that span hard mixed and soft substrate types In addition it is not clear if changes in the hardsoft categories were considered over time within identified depositional or erosional settings before and after construction
Pacific Region Science Response Technical Review Assessing
Ecosystem Productivity Model of Roberts Bank
20
3 Are the limitations and uncertainties of the model identified and appropriately considered when determining the modelrsquos representation of current and possible future conditions
o the EwE model was not designed to evaluate a range of future conditions It was designed to estimate changes in the productive potential at the ecosystem level with and without the Project Therefore the model was run without the Project and with the Project for a range of plausible abiotic conditions and the results were compared with respect to biomass and productivity by functional group
o the pedigree approach to assessing the uncertainties of model outcomes is unsatisfactory for the purpose here as it relates solely to a qualitative judgment of the value of data based on its source However when the model was rerun with much wider ranges of confidence intervals (uncertainties) the results in general (but not necessarily for each functional group) were similar to the results using the original pedigree approach This suggests that taken overall the model may be robust to wide ranges of uncertainty in these input variables and parameters
o there is inadequate validation of the model This is inadequate for three reasons
(i) the basic Ecopath model is not validated and the Ecospace balancing process (the spin-up period) resulted in some biomass estimates being increased or decreased beyond their confidence limits
(ii) the goodness of fit test used to evaluate how well the model predicted the spatial occurrence functional groups is not fit for purpose (Section 34) and
(iii) validation was provided for only a small number of functional groups (the habitat-forming functional groups) As a consequence the model is currently not validated
o Considering the proportion of open boundaries relative to closed boundaries in the model processes taking place outside the modelled ecosystem are likely to contribute to dynamics within the modelled ecosystem However these external processes may not be well-resolved by the EwE model as currently configured
4 Are the model results related to the potential effects of the Project on fish and fish habitat and migratory birds and their food resources valid and defensible
o this is a very complex ecosystem model constructed for a relatively small and open (in the sense of considerable exchange with adjacent non-modelled areas) system Many assumptions have been made based on poor or missing data Taking all these considerations into account the model does the best job possible of comparing the biomass and productivity of the Roberts Bank ecosystem with and without the Project
o the extent to which the model adequately represents the lsquorealrsquo ecosystem of Roberts Bank as opposed to comparisons of model results with and without the Project is unclear as a number of basic diagnostics are not presented (see point 3 above)
o the EwE model is not capable of and is not designed to represent nutritional and food quality variations in prey functional groups and how these may impact highly migratory predators such as birds with and without the Project
5 Is the EwE model framework a valid method to quantify large scale impacts to fish habitat fish productivity and migratory bird productivity
o the EwE model as implemented in this project and reviewed here is a useful first-order framework to organise information and derive initial estimates of how the system may respond to perturbations
Pacific Region Science Response Technical Review Assessing
Ecosystem Productivity Model of Roberts Bank
21
o the utility of a EWE model for impact purposes is highly dependent on the quality of input data
o each EwE model is highly dependent on local conditions Although appropriate as an overall methodology each application would need to be reviewed for how it may be applied to any new ecosystem and
o the EwE model would need to be substantially reformulated if it was to include considerations of changes in chemical composition or food quality of prey in particular for seasonal migratory species such as birds which may depend on very large biomasses of prey with specific chemical composition to fuel their migrations beyond the ecosystem model boundaries
Contributors Contributor Affiliation Ian Perry Author DFO Science Pacific Region Alida Bundy Author DFO Science Maritimes Region Terri Sutherland Author DFO Science Pacific Region Robert Elner Author ECCC Canadian Wildlife Service Andrew Robinson Author ECCC Canadian Wildlife Service Lesley MacDougall Editor DFO Science Pacific Region
Approved by Carmel Lowe
Regional Director Science Branch Pacific Region Fisheries and Oceans Canada
November 4 2016
Sources of Information Christensen V Coll M Steenbeek J Buszowski J Chagaris D walters CJ 2014
Representing variable habitat quality in a spatial food web model Ecosystems 17 1397-1412
Christensen V and Walters C 2000 Ecopath with Ecosim methods capabilities and limitations Ecological Modelling 172 109-139
Colleacuteter M Valls A Guitton J Gascuel D Pauly D and Christensen V 2015 Global overview of the applications of the Ecopath with Ecosim modeling approach using the EcoBase models repository Ecological Modelling 302 pp42-53
Compass Resource Management Ltd 2013 Roberts Bank Terminal 2 Technical Advisory Group (TAG) Process Report Productive Capacity ndash Final Report 119pp (Accessed November 1 2016)
DFO 2016 Technical Review of Roberts Bank Terminal 2 Environmental Assessment Section 95 ndash Coastal Geomorphology DFO Can Sci Advis Sec Sci Resp 2016045 (Accessed November 4 2016)
Pacific Region Science Response Technical Review Assessing
Ecosystem Productivity Model of Roberts Bank
22
ESSA Technologies 2014a Roberts Bank Terminal 2 Project Roberts Bank Delta BC Environmental Impact Statement Volume 3 Biophysical Effects Assessments Appendix 10-C Roberts Bank Ecosystem Model Development and Key Run Port Metro Vancouver (Accessed November 1 2016)
ESSA Technologies 2014b Roberts Bank Terminal 2 Project Roberts Bank Delta BC Environmental Impact Statement Volume 3 Biophysical Effects Assessments Appendix 10-D Roberts Bank Ecosystem Model Sensitivity Analyses Port Metro Vancouver (Accessed November 1 2016)
Franklin J 2009 Mapping Species Distributions Spatial Inference and Prediction Cambridge University Press Cambridge
Hemmera 2014 Roberts Bank Terminal 2 Project Roberts Bank Delta BC Environmental Impact Statement Volume 3 Biophysical Effects Assessments Appendix 10-B Roberts Bank Ecosystem Model Parameter Estimates Port Metro Vancouver File 302-03503 (Accessed November 1 2016)
Port Metro Vancouver 2015a Roberts Bank Terminal 2 Project Roberts Bank Delta BC Environmental Impact Statement Volume 3 Biophysical Effects Assessments Section 100 Biophysical Setting (Accessed November 1 2016)
Port Metro Vancouver 2015b Roberts Bank Terminal 2 Project Roberts Bank Delta BC Environmental Impact Statement Volume 3 Biophysical Effects Assessments Section 103 Overview of Assessing Ecosystem Productivity (Accessed November 1 2016)
Port Metro Vancouver 2015c Roberts Bank Terminal 2 Project Environmental Assessment Additional Information Requirements (July 31 2015) Responses Response to Information Request 6 IR-73115-06 Canadian Environmental Assessment Agency Reference Number 80054 dated 26 October 2015
Steenbeek J Coll M Gurney L Meacutelin F Hoepffner N Buszowski J and Christensen V 2013 Bridging the gap between ecosystem modeling tools and geographic information systems Driving a food web model with external spatialndashtemporal data Ecological Modelling 263 139ndash 151
Sutherland T Elner R and OrsquoNeill J 2013 Roberts Bank Ecological crucible of the Fraser River estuary Progress in Oceanography 115 171ndash180
Vancouver Fraser Port Authority 2016 From the Vancouver Fraser Port Authority to the Review Panel re Answers to preliminary technical questions submitted during the completeness phase from Fisheries and Oceans Canada Natural Resources Canada and Environment and Climate Change Canada concerning the ecosystem modelling to support the Roberts Bank Terminal 2 Project environmental review CEAR Document 547 (Accessed November 1 2016)
Pacific Region Science Response Technical Review Assessing
Ecosystem Productivity Model of Roberts Bank
23
This Report is Available from the Centre for Science Advice
Pacific Region Fisheries and Oceans Canada
3190 Hammond Bay Road Nanaimo BC V9T 6N7
Telephone (250) 756-7208 E-Mail csapdfo-mpogcca
Internet address wwwdfo-mpogccacsas-sccs
ISSN 1919-3769 copy Her Majesty the Queen in Right of Canada 2016
Correct Citation for this Publication
DFO 2016 Technical review of Roberts Bank Terminal 2 environmental assessment section 103 ndash assessing ecosystem productivity DFO Can Sci Advis Sec Sci Resp 2016050
Aussi disponible en franccedilais
MPO 2016 Examen technique de leacutevaluation environnementale du Terminal 2 agrave Roberts Bank section 103 ndash eacutevaluation de la productiviteacute de leacutecosystegraveme Secr can de consult sci du MPO Reacutep des Sci 2016050

Pacific Region Science Response Technical Review Assessing
Ecosystem Productivity Model of Roberts Bank
12
annual time step for the model The Ecospace module has a monthly time step13 and therefore it is feasible to run this module with a sub-annual time step For example the Proponents submit14 that there are inadequate data to model the potential effects of the Project on the timing of biofilm production which could have implications for the migratory dunlin and Western Sandpiper However this could be modelled in an exploratory way to determine hypotheses about which factors could affect the timing of production of biofilm and the potential impacts on these birds These issues are of major concern to ECCC
336 Life history structure The EwE model did not separate functional groups into life history stages (stanzas) yet for many functional groups the juvenile stages can have very different life history characteristics and habitats than the adults It is unclear in the description of the model how different life history structures were considered and whether for example there were enough juveniles to produce the adults The implications of not including early life stages should be explored at least qualitatively to identify which species might have life stages that may be more vulnerable to project effects
337 Model balancing Balancing an EwE model is the process by which parameters are adjusted so that there is sufficient production for consumption requirements ie there are sufficient prey for all predators Expert opinion was used to examine parameter values and to adjust for errors or inconsistencies in logic ldquoPMV is confident that since the approach taken to balance the model was based on best practices the steps are appropriaterdquo15 Adjustments to initial parameters to ensure an ecologically-feasible model are necessary and to be expected For a few functional groups however very large changes to initial parameter estimates (which were often not based on Roberts Bank specific data) were necessary for example to transient killer whales When such initial parameters were adjusted (often by substantial amounts) by expert opinion to balance the model the confidence intervals around these adjusted parameter values were not increased to reflect this added uncertainty (see for example PMV Response 2016-03-02 p 51 lines 955-956) When expert opinion was used to make very large changes to initial parameter values broader confidence intervals about these parameters should have been applied This does not appear to have been the case and as a consequence may cause the actual uncertainty of the model outputs to be underestimated
Another example is for the pinniped group in which 50 of the diet was assumed to come from outside the model area in order to balance the model The rationale provided was ldquoThe pinnipeds caused excessive predation mortalities on numerous fish functional groups The biomass of pinnipeds was an average for the Strait of Georgia which was likely too high for Roberts Bank Therefore it was assumed that pinnipeds extracted only half of their diet from the study areardquo16 It is unclear whether the sensitivity of the model to different percentages of diet allocation was explored
As noted above (332) the Ecopath model was relatively unconstrained and few adjustments to input parameters were required to balance the model This is unusual and the low ecotrophic efficiencies of several functional groups suggest that full accounting of energy flows may not have been achieved (an ecotrophic efficiency of 1 indicates that 100 of the production of that
13 EIS Appendix 10C Section 29 p24 14 EIS Appendix 10D Appendix C p72 15 PMV Response 2016-03-02 p 49 lines 910-912 16 EIS Appendix 10C Section 261 p 20
Pacific Region Science Response Technical Review Assessing
Ecosystem Productivity Model of Roberts Bank
13
particular group is being preyed upon or removed by fishing leaving no individuals to die of old age17) An ldquoexcessrdquo of individuals dying of old age ie ecotrophic efficiencies much less than 1 suggests a potentially large biomass that is not used by the ecosystem and instead is converted to detritus
34 Model validation Model validation is the process by which the model parameters variables and outputs are compared with those from the real ecosystem to ascertain how well the model represents the ecosystem It is an essential step in providing confidence that the projections from the model in this case with and without the Project have relevance to how the real ecosystem may be expected to function with and without the Project In practice validating complex ecosystem models is difficult considering the range of assumptions that must be made when building the model the limited available data and natural variability of the ecosystem at a variety of time and space scales
Many of the standard diagnostics for the Ecopath model have not been evaluated in the EIS The Proponent appears to have assumed that once the Ecopath model was balanced then it was valid and fit for purpose The Proponent should provide all the Ecopath estimates of vital rates including mortality rates As presented questions remain For example many Ecotrophic Efficiencies (which control the transfer of biomass from prey to predators) are less than 1 even for taxa which would be expected to be close to 1 such as carnivorous zooplankton The reason for Ecotrophic Efficiencies less than 1 were not discussed or explained in the EIS
Detailed diagnostics for the Ecospace model should also be presented in order to evaluate model performance In response to criticisms by DFO ECCC and NRCan in discussions with the Proponent the latter provided the biomass of the functional groups from the Ecopath model (before Ecospace) and the Ecospace model after the spin-up period (which involved adjusting the parameters from the Ecopath model to balance the 5468 separate cells of the Ecospace model)18 The Proponents argue that ldquoIt is important to note that changes in biomass values generated during the spin-up period are identical for both with and without Project scenarios and thus do not provide information on the potential Project-related effects on productivity19 However several changes to biomass result from the Ecospace balancing process (spin-up period) This is only given brief attention by the Proponent in its response to the DFO ECCC and NRCan questions An analysis of Table 620 revealed that the biomass of 9 functional groups was larger or smaller than the widest confidence limits allowed for each group21 This requires further discussion and justification
The Proponent used a goodness of fit measure to compare spatial distributions of model outputs with field observations They indicated that ldquono other EwE models were identified which use a goodness-of-fit measure Hence the RB model is potentially the first such EwE model where a goodness of fit measure has been appliedrdquo22 The chosen goodness of fit measure is the percent correct classification (PCC) method23 This method derives a test statistic based on the proportion of locations at which predicted occurrences from the model match observed
17 EIS Appendix 10-B p 11 18 PMV Response 2016-03-02 p 65-66 Table 6 19 PMV Response 2016-03-02 p 64 lines 1205-1207 20 PMV Response 2016-03-02 p 65-66 Table 6 21 PMV Response 2016-03-02 p 45 Table 3 22 PMV Response 2016-03-02 p 78 lines 1481-1483 23 PMV Response 2016-03-02 p 78 lines 1483-1484
Pacific Region Science Response Technical Review Assessing
Ecosystem Productivity Model of Roberts Bank
14
occurrences from data and similarly with predicted and observed absences The Proponent then calculated two additional accuracy of fit measures sensitivity (the model predicts a species to occur in an area where it is known to occur in reality) and specificity (the model predicts a species does not occur in an area it is known not to occur in reality)24 This analysis concluded that the model has high predictability for functional groups such as eelgrass and sea pens with relatively static distributions but lower predictability for functional groups which are more temporally and spatially dynamic such as biofilm and green algae25
There are two problems with this approach The first is that this goodness of fit comparison was done only for habitat-forming functional groups no discussion of how well this analysis applies to mobile functional groups was provided The second problem is that this method does not take into account situations (such as occurs in this study with several groups) in which species occur at only a few locations For example ldquohellipif the test data consist of 95 absences and 5 presences and this reflects the true prevalence of the species on the landscape (a realistic scenario for a rare species) a lsquonullrsquo model that predicted absence in all cases (eg no model at all) would be correct 95 of the timehellipldquo (Franklin 2009 p 151) This latter point is important here as these habitat functional groups (biofilm brown algae native eelgrass green algae Japanese eelgrass tidal marsh biomat and orange sea pens26) appear not to occur over most of the Project area (as portrayed by the model outputs presented in the distribution figures of PMV Response 2016-03-02 Appendix 218) It is therefore important that a robust evaluation of the performance of the Ecospace module is used with preferably more than one measure
In summary the starting point for this modelling analysis matters It is not just about a comparison between results with and without the Project The model has to be considered a sufficient representation of the ecosystem The Proponent has not yet sufficiently validated the model
35 Model results 351 Presentation of model results
As noted above (Section 331) the stated objective of the Roberts Bank ecosystem model was not to provide an assessment of Project impacts for each functional group at a fine temporal scale but to estimate changes in productive potential with and without the Project at the ecosystem level27 However results were presented as comparisons by speciesfunctional group with and without the Project and not as potential changes in total ecosystem productivity The revised figures for each functional group showing distributions without the Project with the Project and their difference indicated impacts were likely to be localized with overall impacts relatively small The range of biomass ratios with and without the Project was 045 ndash 189 with most values slightly less than 1 This is interpreted as indicating slight decreases in the capacity of the study area to support biomass and production with the Project for many functional groups28 (Figure 2)
24 PMV Response 2016-03-02 p 80 lines 1524-1527 25 PMV Response 2016-03-02 p 81 lines 1551-1559 26 PMV Response 2016-03-02 p 82 Table 8 27 PMV Response 2016-03-02 p 99 lines 1914-1917 28 PMV Response 2016-03-02 Appendix 218
Pacific Region Science Response Technical Review Assessing
Ecosystem Productivity Model of Roberts Bank
15
Biomass Ratio
Freq
uenc
y
04 07 10 13 16 19
05
1015
2025
30
Figure 2 Histogram of biomass ratios obtained by comparisons of model runs with and without the project (ie With Without) Values less than 1 indicate reductions in biomass with the Project compared against without the Project) Data from Appendix 218 of PMV Response 2016-03-02
352 Sensitivity and vulnerability analyses Every ecosystem model is only one possible representation of the true ecosystem defined by the modelrsquos structure and the values chosen for its many parameters The key point is how well the model represents the real system how that fit can be measured and the sensitivity of model outputs to variability in the selected parameter values The ideal model should be robust to a wide range of uncertainties in the input data and parameters This robustness is determined by performing sensitivity analyses on the model to see how it responds to variations in the input parameters and determining to which input parameters the model is most sensitive
The vulnerability parameters determine the strength of the feeding interactions between functional groups They set the level of density dependence of each functional group Higher vulnerability settings provide greater top-down (predator) control whereas lower settings provide greater bottom-up (environmental) control29 Several publications have shown that EwE models are very sensitive to the vulnerability parameters and Christensen and Walters (2000) point out that a main pitfall of EwE is that ldquopredation vulnerabilities are often underestimated lessening the modelled impacts of predationrdquo It is usual practice to tune Ecopath models including the vulnerability parameters to time series data such as biomass using the temporal simulation model Ecosim However these data were not available for the RBT2 area so this robust method of fitting the model and estimating vulnerability parameters was not possible Instead a vulnerability setting of 2 was used as the default value for the key model runs which is ldquocommon practice when time series data are not available and estimates of vulnerability in the
29 PMV Response 2016-03-02 p 70 lines 1318-1323
Pacific Region Science Response Technical Review Assessing
Ecosystem Productivity Model of Roberts Bank
16
model cannot be maderdquo30 with sensitivity analyses run for a range of 15 to 3 This narrow range was criticized by DFOECCC in initial discussions about the model with the Proponent The Proponent subsequently reran the model with a larger range of vulnerabilities31 (11 to 10) and concluded this broader vulnerability range produced similar results for the productivity ratio with and without the Project to those in the original EIS and that the EIS was more likely to overestimate than underestimate potential project effects32 The data in Table 7 of the PMV Response33 did indicate changes in productivity ratios ranging from 0 to 50 of the defined key run (which used a vulnerability setting of 2) However the Proponent changed all vulnerability settings to the same value ie all were 2 or all were 10 etc In reality the vulnerability parameters resulting from Ecosim models that are fitted to data as described above vary by functional group which was not explored here Therefore although the results suggest that the original choice of 2 for the default key run seemed reasonable the potential effects of variability in vulnerability settings was not fully explored
Sensitivity analyses are usually based on the range of uncertainty estimated for input data and parameters often called the confidence limits around the model parameters The EwE framework integrates many different data sources and parameters including values from the literature It can therefore be difficult to identify ldquoreasonablerdquo confidence limits when derived from such diverse data sources Standard practice in Ecopath models has been to develop a pedigree for each parameter with default values for uncertainty based on the nature of the source data For example parameter values based on high precision field observations of biomass within the model domain receive default confidence intervals of 10 whereas parameter values based on models developed for elsewhere or professional judgment receive confidence intervals of 8034 Sensitivity analyses are then run using parameter values selected from within these confidence intervals However if these default confidence intervals do not capture the full range of variability then the outputs are not informative of the variability in the lsquorealrsquo ecosystem Field observations were collected for many functional groups within the model domain in 2012 and 2013 as part of studies to support the RBT2 EIS Apparently the purpose of these observations was to document spatial variability (in part for the Ecospace model) and temporal variability (measurements at one location over time) and not to derive confidence intervals around the observations35
The reliance on the pedigree approach to derive confidence intervals for this Roberts Bank model was criticized by DFO ECCC and NRCan in discussions with the Proponent As a result the Proponent reran the model with much larger confidence intervals ranging from 30 to 100 depending on the input parameter and functional group36 The results from this new analysis using the broader confidence intervals were similar to those using the original pedigree approach The Proponent noted that ldquoWhile the production within each helliprun was very different there was little difference in the biomass ratio [with and without the Project] These results further demonstrate that even with a greater range in input values the influence of the Project on the Roberts Bank ecosystem is consistent among allhellipmodel runsrdquo37 This provides confidence that the model may be robust to uncertainty in its input parameters Two concerns
30 PMV Response 2016-03-02 p 70 lines 1321-1322 31 PMV Response 2016-03-02 p 71-74 32 PMV Response 2016-03-02 p 71 lines 1339-1341 33 PMV Response 2016-03-02 p 73 34 EIS Appendix 10-C Section 251 page 18 35 PMV Response 2016-03-02 p 42 lines 772-777 36 PMV Response 2016-03-02 p 44-47 37 PMV Response 2016-03-02 p 47 lines 855-858 and see also PMV Response 2016-03-02 Appendix 27-B
Pacific Region Science Response Technical Review Assessing
Ecosystem Productivity Model of Roberts Bank
17
remain however The quote above indicates that the production among the different model runs was very different although with little difference in the biomass ratios with and without the Project Since biomass is not the same as production it would be informative for understanding model performance and potential impacts to show these production differences This also relates to the point made in Section 34 regarding how well the model represents the real ecosystem and not just within-model comparisons with and without the Project The second question is more technical and relates to how the randomization (Monte Carlo or MC) routine that was used to create multiple model runs used the uncertainty about the diet data Diets are not currently included in the MC routine available to regular users of the Ecosim model how they were handled in this RBT2 model appears not to be explained
Finally the sensitivity analyses indicate that the uncertainty in the input parameters does not lead to much difference between model parameters with or without the project However this conclusion does not describe how the uncertainty in the input parameters affects understanding of the ecosystem
40 Conclusions Overall the main conclusion of the Environmental Impact Statement from the Proponent is stated as ldquohellipafter the implementation of mitigation hellipthe Project is not expected to result in any significant adverse effects on any of the 16 valued componentsrdquo38 In addition ldquohellipapproximately 40 of the functional groups are forecast to change no more than 5 which hellip is judged to be within the uncertainty of the model runsrdquo39 although larger changes were forecast for orange sea pens freshwater biofilm green algae and raptors The conclusions from the modelling studies are that ldquohellipthe proposed project will have an impact on the study area that the effect varies between species and that the findings are robust to parameter uncertaintyrdquo40 Specific outcomes by valued component as derived from the EwE model are presented by functional groups in Table 1
38 PMV March 2015 Roberts Bank Environmental Impact Statement Executive Summary ndash Part 1 page 37 39 EIS Appendix 10-C p ii 40 EIS Appendix 10-D p iv
Pacific Region Science Response Technical Review Assessing
Ecosystem Productivity Model of Roberts Bank
18
Table 1 Changes in productive potential with the Project as derived from the EwE model
Changes in productive potential
Ecosystem category
Number of valued
components
Number with potential
biomass loss
Moderate decrease (31-60 decline)
Minor decrease (6-30 decline)
Negligible (0-5
change)
Minor increase (6-
30 increase)
Moderate increase (31-60 increase)
Source
Marine vegetation
7 7 - 3 2 2 - EIS Vol 3 Section 11 Table 11-17 page 11-65
Marine invertebrates
4 3 1 1 1 1 - EIS Vol 3 Section 12 Table 12-8 page 12-52
Marine fish 13 13 - 2 6 5 - EIS Vol 3 Section 13 Table 13-10 page 13-95
Coastal birds
11 8 - 3 4 3 1 EIS Vol 3 Section 15 Table 15-10 page 15-67
Pacific Region Science Response Technical Review Assessing
Ecosystem Productivity Model of Roberts Bank
19
Most functional groups showed some potential biomass loss with the Project with biomass loss defined as any model run with negative outcomes (ie in which biomass with the project was less than biomass without the Project) The summary of changes in productivity potential are mixed with most (33 out of 35) valued components showing minor decreases to minor increases (defined as 6 to 30 changes in productive potential with the Project compared to without the Project)
The main conclusions of this review in regards to the Terms of Reference are
1 Do the functional groups and abiotic variables used in the model adequately represent the ecosystem at Roberts Bank
o The 58 functional groups and abiotic variables used in the model adequately represent the main components of the Roberts Bank ecosystem however for longer lived species the life stages of the species are not well represented and some of the impacts of the Project may be expected to affect specific life stages
o The abiotic variables adequately represent the physical drivers of this ecosystem on an annual time scale However annual values for these abiotic variables may not adequately capture important sub-annual events such as storms (DFO 2016) the timing of arrival and departure of highly migratory species and whether there may be important sub-annual thresholds or mismatches in timing as a result of the Project
o Biotic factors (eg nutrients) which are particularly important for biofilm and other lower trophic level taxa are not included in this model The model is therefore unable to assess the potential development of eutrophication and benthic organic enrichment events which may affect fish habitats in the study area
2 Are the parameter estimates used by the model valid and defensible for this system
o In general parameter estimates appear to be adequate for this system Field studies were done in two years to provide data in particular on distributions of selected functional groups for the Ecospace module Note the distribution studies focussed on taxa which were relatively immobile and therefore lsquofixedrsquo in space
o the selection of some model parameters would benefit from further explanation for example the choice of fixed diet matrices versus dynamic matrices which can vary with changes in abundances or predators and prey
o the selection of some model parameters would benefit from further explanation for example the link between the diets described in the text of Appendix 10B and the quantities presented in Appendix A of Appendix 10B It is understood that proportions were derived using the ldquofixed selectivityrdquo principle but in order to be fully transparent the derivation of each diet should be provided in an appendix
o discussion and explanation is needed of why ecotrophic efficiencies differ from expected values (eg the ecotrophic efficiency for Pacific herring is listed as 038) and
o the abiotic factor lsquosubstratersquo was limited to ldquohardrdquo or rdquosoftrdquo options which can be restrictive given that they serve as endpoints on a substrate composition continuum These limited options may not provide the sensitivity required to assess substrate preference nor the flexibility for taxa (eg motile organisms) that span hard mixed and soft substrate types In addition it is not clear if changes in the hardsoft categories were considered over time within identified depositional or erosional settings before and after construction
Pacific Region Science Response Technical Review Assessing
Ecosystem Productivity Model of Roberts Bank
20
3 Are the limitations and uncertainties of the model identified and appropriately considered when determining the modelrsquos representation of current and possible future conditions
o the EwE model was not designed to evaluate a range of future conditions It was designed to estimate changes in the productive potential at the ecosystem level with and without the Project Therefore the model was run without the Project and with the Project for a range of plausible abiotic conditions and the results were compared with respect to biomass and productivity by functional group
o the pedigree approach to assessing the uncertainties of model outcomes is unsatisfactory for the purpose here as it relates solely to a qualitative judgment of the value of data based on its source However when the model was rerun with much wider ranges of confidence intervals (uncertainties) the results in general (but not necessarily for each functional group) were similar to the results using the original pedigree approach This suggests that taken overall the model may be robust to wide ranges of uncertainty in these input variables and parameters
o there is inadequate validation of the model This is inadequate for three reasons
(i) the basic Ecopath model is not validated and the Ecospace balancing process (the spin-up period) resulted in some biomass estimates being increased or decreased beyond their confidence limits
(ii) the goodness of fit test used to evaluate how well the model predicted the spatial occurrence functional groups is not fit for purpose (Section 34) and
(iii) validation was provided for only a small number of functional groups (the habitat-forming functional groups) As a consequence the model is currently not validated
o Considering the proportion of open boundaries relative to closed boundaries in the model processes taking place outside the modelled ecosystem are likely to contribute to dynamics within the modelled ecosystem However these external processes may not be well-resolved by the EwE model as currently configured
4 Are the model results related to the potential effects of the Project on fish and fish habitat and migratory birds and their food resources valid and defensible
o this is a very complex ecosystem model constructed for a relatively small and open (in the sense of considerable exchange with adjacent non-modelled areas) system Many assumptions have been made based on poor or missing data Taking all these considerations into account the model does the best job possible of comparing the biomass and productivity of the Roberts Bank ecosystem with and without the Project
o the extent to which the model adequately represents the lsquorealrsquo ecosystem of Roberts Bank as opposed to comparisons of model results with and without the Project is unclear as a number of basic diagnostics are not presented (see point 3 above)
o the EwE model is not capable of and is not designed to represent nutritional and food quality variations in prey functional groups and how these may impact highly migratory predators such as birds with and without the Project
5 Is the EwE model framework a valid method to quantify large scale impacts to fish habitat fish productivity and migratory bird productivity
o the EwE model as implemented in this project and reviewed here is a useful first-order framework to organise information and derive initial estimates of how the system may respond to perturbations
Pacific Region Science Response Technical Review Assessing
Ecosystem Productivity Model of Roberts Bank
21
o the utility of a EWE model for impact purposes is highly dependent on the quality of input data
o each EwE model is highly dependent on local conditions Although appropriate as an overall methodology each application would need to be reviewed for how it may be applied to any new ecosystem and
o the EwE model would need to be substantially reformulated if it was to include considerations of changes in chemical composition or food quality of prey in particular for seasonal migratory species such as birds which may depend on very large biomasses of prey with specific chemical composition to fuel their migrations beyond the ecosystem model boundaries
Contributors Contributor Affiliation Ian Perry Author DFO Science Pacific Region Alida Bundy Author DFO Science Maritimes Region Terri Sutherland Author DFO Science Pacific Region Robert Elner Author ECCC Canadian Wildlife Service Andrew Robinson Author ECCC Canadian Wildlife Service Lesley MacDougall Editor DFO Science Pacific Region
Approved by Carmel Lowe
Regional Director Science Branch Pacific Region Fisheries and Oceans Canada
November 4 2016
Sources of Information Christensen V Coll M Steenbeek J Buszowski J Chagaris D walters CJ 2014
Representing variable habitat quality in a spatial food web model Ecosystems 17 1397-1412
Christensen V and Walters C 2000 Ecopath with Ecosim methods capabilities and limitations Ecological Modelling 172 109-139
Colleacuteter M Valls A Guitton J Gascuel D Pauly D and Christensen V 2015 Global overview of the applications of the Ecopath with Ecosim modeling approach using the EcoBase models repository Ecological Modelling 302 pp42-53
Compass Resource Management Ltd 2013 Roberts Bank Terminal 2 Technical Advisory Group (TAG) Process Report Productive Capacity ndash Final Report 119pp (Accessed November 1 2016)
DFO 2016 Technical Review of Roberts Bank Terminal 2 Environmental Assessment Section 95 ndash Coastal Geomorphology DFO Can Sci Advis Sec Sci Resp 2016045 (Accessed November 4 2016)
Pacific Region Science Response Technical Review Assessing
Ecosystem Productivity Model of Roberts Bank
22
ESSA Technologies 2014a Roberts Bank Terminal 2 Project Roberts Bank Delta BC Environmental Impact Statement Volume 3 Biophysical Effects Assessments Appendix 10-C Roberts Bank Ecosystem Model Development and Key Run Port Metro Vancouver (Accessed November 1 2016)
ESSA Technologies 2014b Roberts Bank Terminal 2 Project Roberts Bank Delta BC Environmental Impact Statement Volume 3 Biophysical Effects Assessments Appendix 10-D Roberts Bank Ecosystem Model Sensitivity Analyses Port Metro Vancouver (Accessed November 1 2016)
Franklin J 2009 Mapping Species Distributions Spatial Inference and Prediction Cambridge University Press Cambridge
Hemmera 2014 Roberts Bank Terminal 2 Project Roberts Bank Delta BC Environmental Impact Statement Volume 3 Biophysical Effects Assessments Appendix 10-B Roberts Bank Ecosystem Model Parameter Estimates Port Metro Vancouver File 302-03503 (Accessed November 1 2016)
Port Metro Vancouver 2015a Roberts Bank Terminal 2 Project Roberts Bank Delta BC Environmental Impact Statement Volume 3 Biophysical Effects Assessments Section 100 Biophysical Setting (Accessed November 1 2016)
Port Metro Vancouver 2015b Roberts Bank Terminal 2 Project Roberts Bank Delta BC Environmental Impact Statement Volume 3 Biophysical Effects Assessments Section 103 Overview of Assessing Ecosystem Productivity (Accessed November 1 2016)
Port Metro Vancouver 2015c Roberts Bank Terminal 2 Project Environmental Assessment Additional Information Requirements (July 31 2015) Responses Response to Information Request 6 IR-73115-06 Canadian Environmental Assessment Agency Reference Number 80054 dated 26 October 2015
Steenbeek J Coll M Gurney L Meacutelin F Hoepffner N Buszowski J and Christensen V 2013 Bridging the gap between ecosystem modeling tools and geographic information systems Driving a food web model with external spatialndashtemporal data Ecological Modelling 263 139ndash 151
Sutherland T Elner R and OrsquoNeill J 2013 Roberts Bank Ecological crucible of the Fraser River estuary Progress in Oceanography 115 171ndash180
Vancouver Fraser Port Authority 2016 From the Vancouver Fraser Port Authority to the Review Panel re Answers to preliminary technical questions submitted during the completeness phase from Fisheries and Oceans Canada Natural Resources Canada and Environment and Climate Change Canada concerning the ecosystem modelling to support the Roberts Bank Terminal 2 Project environmental review CEAR Document 547 (Accessed November 1 2016)
Pacific Region Science Response Technical Review Assessing
Ecosystem Productivity Model of Roberts Bank
23
This Report is Available from the Centre for Science Advice
Pacific Region Fisheries and Oceans Canada
3190 Hammond Bay Road Nanaimo BC V9T 6N7
Telephone (250) 756-7208 E-Mail csapdfo-mpogcca
Internet address wwwdfo-mpogccacsas-sccs
ISSN 1919-3769 copy Her Majesty the Queen in Right of Canada 2016
Correct Citation for this Publication
DFO 2016 Technical review of Roberts Bank Terminal 2 environmental assessment section 103 ndash assessing ecosystem productivity DFO Can Sci Advis Sec Sci Resp 2016050
Aussi disponible en franccedilais
MPO 2016 Examen technique de leacutevaluation environnementale du Terminal 2 agrave Roberts Bank section 103 ndash eacutevaluation de la productiviteacute de leacutecosystegraveme Secr can de consult sci du MPO Reacutep des Sci 2016050
- TECHNICAL REVIEW OF ROBERTS BANK TERMINAL 2 ENVIRONMENTAL ASSESSMENT SECTION 103 ndash ASSESSING ECOSYSTEM PRODUCTIVITY
-
- 10 Context
- 20 Background
-
- 21 Background and Terms of Reference
- 22 Approach to assessing ecosystem productivity
-
- 30 Analysis and Response
-
- 31 The EwE Team
- 32 Overview of assessment results of hydrological and sediment modelling
- 33 Model implementation
-
- 331 The purpose of the EwE model
- 332 Applicability of the EwE model framework to the Roberts Bank region
- 333 Model documentation
- 334 Highly mobile functional groups
- 335 Seasonality (model time step)
- 336 Life history structure
- 337 Model balancing
-
- 34 Model validation
- 35 Model results
-
- 351 Presentation of model results
- 352 Sensitivity and vulnerability analyses
-
- 40 Conclusions
- Contributors
- Approved by
- Sources of Information
- This Report is Available from the
-
- CSAS 2016-50 - Assessing Ecosystem Productivitypdf
-
- TECHNICAL REVIEW OF ROBERTS BANK TERMINAL 2 ENVIRONMENTAL ASSESSMENT SECTION 103 ndash ASSESSING ECOSYSTEM PRODUCTIVITY
-
- 10 Context
- 20 Background
-
- 21 Background and Terms of Reference
- 22 Approach to assessing ecosystem productivity
-
- 30 Analysis and Response
-
- 31 The EwE Team
- 32 Overview of assessment results of hydrological and sediment modelling
- 33 Model implementation
-
- 331 The purpose of the EwE model
- 332 Applicability of the EwE model framework to the Roberts Bank region
- 333 Model documentation
- 334 Highly mobile functional groups
- 335 Seasonality (model time step)
- 336 Life history structure
- 337 Model balancing
-
- 34 Model validation
- 35 Model results
-
- 351 Presentation of model results
- 352 Sensitivity and vulnerability analyses
-
- 40 Conclusions
- Contributors
- Approved by
- Sources of Information
- This Report is Available from the
-
Canadian Science Advisory Secretariat Pacific Region Science Response 2016050
December 2016
TECHNICAL REVIEW OF ROBERTS BANK TERMINAL 2 ENVIRONMENTAL ASSESSMENT SECTION 103 ndash
ASSESSING ECOSYSTEM PRODUCTIVITY
10 Context Vancouver Fraser Port Authority (VFPA) formerly Port Metro Vancouver (the Proponent) is proposing to construct and operate the Roberts Bank Terminal 2 Project (the Project) a new three-berth marine container terminal at Roberts Bank in Delta British Columbia The proposed terminal is located next to the existing Deltaport and Westshore Terminals In addition to the construction of the new terminal the Proponent has proposed to widen the north side of the existing Roberts Bank causeway from its east-end connection with the mainland to the entrance to the new terminal The existing tug basin connected to the northeast side of Deltaport Terminal is also proposed to be expanded The new marine terminal is predicted by the Proponent to process up to 260 container ship calls per year at full capacity with the assistance of two or three large berthing or escort tugs to manoeuver ships into or away from assigned berths The terminal is designed to operate 24 hours per day year-round
The Roberts Bank Terminal 2 Project is subject to an environmental assessment by a Review Panel pursuant to the Canadian Environmental Assessment Act 2012 As a federal authority in the environmental assessment for the Project Fisheries and Oceans Canada (DFO) will be asked to present information to the review panel and at public hearings in relation to its expertise on the effects of the Project on fish and fish habitat including aquatic species at risk and the adequacy of mitigation and offsetting measures and monitoring and follow-up programs proposed by the Proponent DFOrsquos Pacific Region Fisheries Protection Program (FPP) will coordinate DFOrsquos participation in the environmental assessment
The Proponent assessed future ecosystem productivity at Roberts Bank using the Ecopath with Ecosim and Ecospace (EwE) model framework The potential impacts of the Project to hydrodynamic conditions and sediment transport in the area as a result of changes in wind wave and current patterns and intensities are projected using different model frameworks A companion Science Response (DFO 2016) has been developed by DFO and Natural Resource Canada (NRCan) to review Section 95 ldquoCoastal Geomorphologyrdquo of the Environmental Impact Statement (EIS) which describes the hydrodynamic and sedimentology models that were used to evaluate the effect of the Project on water and sediment movements
Outcomes of the EwE models are incorporated into the analysis of the potential project-related effects on the ongoing productivity of commercial recreational and Aboriginal fisheries Consequently DFO FPP has requested that DFO Science Branch provide an evaluation of the Proponentrsquos characterization of project-related effects as conducted using the Ecopath with Ecosim and Ecospace (EwE) ecosystem model
Pacific Region Science Response Technical Review Assessing
Ecosystem Productivity Model of Roberts Bank
2
The objectives for this Science Response are to
1 Determine if the functional groups and abiotic factors used in the model adequately represent the ecosystem at Roberts Bank
2 Assess whether the parameter estimates used by the model are valid and defensible for this system
3 Assess whether the limitations and uncertainties of the model are identified and appropriately considered when determining the modelrsquos representation of current and possible future conditions
4 Provide advice regarding whether the model results related to the potential effects of the Project on fish and fish habitat and migratory birds and their food resources are valid and defensible
5 If possible provide advice regarding the validity of using the EwE model framework to quantify large scale impacts to fish habitat and fisheries productivity and the productivity of migratory birds
This Science Response evaluates Section 100 ldquoBiophysical Settingrdquo with a focus on Section 103 ldquoOverview of Assessing Ecosystem Productivityrdquo in the EIS as submitted by the Proponent (Port Metro Vancouver 2015) This Section and consequently this Response describes the ecosystem modelling approach that was taken to evaluate the direct and indirect effects of the footprint of the proposed terminal and widened causeway herein referred to as lsquothe Projectrsquo This ecosystem model provides outputs related to potential effects of the project on the study area at an ecosystem level including aquatic species and bird species in the Project area Evaluation of the model and its outputs therefore required expertise in both fishery aquatic species and migratory bird species Consequently this Science Response is the product of a joint review between DFO and Environment and Climate Change Canada (ECCC) Canadian Wildlife Service and Wildlife and Landscape Science to provide a complete evaluation
This Science Response Report results from the Science Response Process of July 2016 on the Technical Review of Ecopath with Ecosim and Ecospace (EwE) Ecosystem Productivity Model application to the Roberts Bank Terminal 2 Environmental Assessment
20 Background
21 Background and Terms of Reference The Projectrsquos main components have a proposed combined marine footprint area of approximately 179 km2 listed below by specific component
bull Marine Terminal 1335 km 2 including terminal (116 km 2) and dredged berth pocket and marine approach areas (0174 km 2)
bull Widened Causeway 0424 km 2
bull Expanded Tug basin 0031 km 2
Roberts Bank in the Fraser River estuary consists of complex intertidal and subtidal habitats including intertidal eelgrass beds and is an important stopover area for migrating shorebirds and productive feeding and rearing habitats for many fish and invertebrate species It also provides habitat for endangered Southern Resident Killer Whales and other marine mammals
Pacific Region Science Response Technical Review Assessing
Ecosystem Productivity Model of Roberts Bank
3
The environmental conditions at Roberts Bank are dynamic and are influenced by a variety of oceanographic and atmospheric factors including the Fraser River freshwater and sediment plume discharge diurnal tidal currents and prevailing and storm-generated wind and wave activity In addition the intercauseway region provides significant drainage from marsh and agricultural areas which have different characteristics from marine waters and which run along the ferry causeway
To provide the required science advice this Science Response focusses on Section 10 ldquoBiophysical Settingrdquo of the Environmental Impact Statement (EIS) (Port Metro Vancouver 2015a) specifically Section 103 ldquoOverview of Assessing Ecosystem Productivityrdquo (Port Metro Vancouver 2015b) and its related Appendices 10-B ldquoRoberts Bank Ecopath with Ecosim and Ecospace model parameter estimatesrdquo (Hemmera 2014) Appendix 10-C ldquoRoberts Bank Ecosystem model development and key runsrdquo(ESSA Technologies 2014a) and Appendix 10-D ldquoRoberts Bank Ecosystem model sensitivity analysesrdquo (ESSA Technologies 2014b) Additional important information was obtained from the Response to Information Request 6 (IR-73115-06 Canadian Environmental Assessment Agency Reference Number 80054 dated 26 October 2015) (Port Metro Vancouver 2015c) and the Written Responses to Coastal Geomorphology and Ecosystem Modelling Questions provided by the Proponent to DFO ECCC and NRCan on 2 March 2016 (Port Metro Vancouver (PMV) Transmittal TRE-01-RBT2-0004A subsequently referred in this Science Response as ldquoPMV Response 2016-03-02rdquo) (Vancouver Fraser Port Authority 2016)
The process followed in preparing this Science Response involved an initial review of the submitted EIS followed by an in-person meeting of the Proponent its contractors and representatives of DFO ECCC and NRCan to discuss and clarify questions arising from the initial review (Vancouver 23 November 2015) DFO and NRCan provided written questions to the Proponent based on preliminary review of the EIS on November 19 2015 ECCC also provided written questions based on its preliminary review of the EIS to the Proponent on December 1 2015 and January 20 2016 This large initial meeting was followed by smaller focussed meetings between the Proponent its contractors and DFO and NRCan on 11 December 2015 to clarify hydrology and sediment modelling questions with DFO on 8 January 2016 to clarify ecosystem modelling questions and with ECCC on 18 February 2016 to clarify questions relating to birds Written responses to all of these meetings and questions were provided by the Proponent to DFO ECCC and NRCan as the ldquoPMV Response 2016-03-02rdquo and ldquoPMV Response 2016-05-30rdquo (Vancouver Fraser Port Authority 2016) VFPArsquos answers to questions posed by DFO and NRCan regarding coastal geomorphology modelling have been posted to the Canadian Environmental Assessment Registry (CEAR)
22 Approach to assessing ecosystem productivity The Proponent adopted an ecosystem approach to evaluate the direct and indirect effects of the Project on the productivity of the Roberts Bank ecosystem A weight of evidence approach was used to assess the potential effects of the project on the productivity of the ecosystem and selected key components in the study area this approach included a spatial ecosystem simulation model (which included a habitat capacity model) a shorebird opportunity model and empirical data An important point is that any effects on the system during the construction phase or from expansion of the tug basin were excluded from this modelling process the focus instead being a comparison of modelled system productivity before and after the proposed terminal and expanded causeway is in place The chosen ecosystem simulation model was
Pacific Region Science Response Technical Review Assessing
Ecosystem Productivity Model of Roberts Bank
4
Ecopath with Ecosim and its spatial version Ecospace (collectively referred to here as the EwE framework or EwE model) This modelling approach was recommended by a prior Productive Capacity Technical Advisory Group comprised of representatives of technical experts from government agencies academia non-governmental organizations Vancouver Fraser Port Authority and its consultants (Compass 2013) convened by the Proponent and which also recommended a selection of focal species for the model The final selection of functional groups and the resulting food web that form the core of this ecosystem model are shown in Figure 1
Pacific Region Science Response Technical Review Assessing
Ecosystem Productivity Model of Roberts Bank
5
Figure 1 Ecopath with Ecosim model food web for Roberts Bank (Adapted from EIS Volume 3 Section 10 Fig 1033 on page 10-16) The groups coloured in orange represent focal groups size of symbols represents relative annual amount of biomass in the Roberts Bank study area
Pacific Region Science Response Technical Review Assessing
Ecosystem Productivity Model of Roberts Bank
6
The EwE framework is a common approach to ecosystem modelling which has been developed and expanded over the past two to three decades It currently has three main components
1 Ecopath ndash the core model which provides a mass-balance snapshot of the system
2 Ecosim ndash a module that enables simulation modelling over time
3 Ecospace ndash a module that enables simulation modelling over space
In order to make an EwE model tractable species are aggregated into functional groups based on their similar ecological characteristics (habitat and prey preferences etc) the Roberts Bank models had 58 functional groups The first step (Ecopath) was to obtain input parameters representing biomass production consumption emigration and diet for each functional group These parameters were then tuned in an iterative process until the overall production and consumption was balanced (a mass-balance approach) resulting in a model food web with estimates of energy flow between functional groups (Fig 1)
In the second step Ecosim was combined with the spatial model Ecospace The abiotic variables selected in this EIS (depth salinity bottom current wave height sediment type) were used as external forcings to the Ecospace module These abiotic variables provided the physical forcings for the simulations without and with the Project Since time series data on the functional groups of the model were not available Ecospace was run until the model reached equilibrium using various assumptions of the value of the vulnerability parameter (see Section 352) In this EIS the selected time step was annual with all variables abiotic and biotic expressed as yearly averages As used in this EIS the Ecospace module included a habitat capacity model which estimated the distribution of functional groups based on their environmental preferences for each abiotic variable (depth salinity bottom current wave height) and for substrate type (sand mud etc) The model thus allocated the spatial distribution of functional groups over the model domain based on their environmental preferences and the distributions of these abiotic variables with and without the Project The selected spatial unit size (ldquopixelrdquo) for the Ecospace model was 100 m2 In essence an Ecopath model was constructed for each pixel with particular rules governing how the functional groups interacted and moved among these spatial units The Ecospace module was run until it approached equilibrium (20 model years) to establish the spatial patterns without the Project For the lsquowith the Projectrsquo simulations the model was run for an initial 10 years and then the spatial patterns of the abiotic variables with the project were added and the model run for an additional 10 years1 The model outputs predicted changes in the productive potential of the Roberts Bank ecosystem as a comparison (ratio) with and without the Project rather than an absolute biomass that would be lost or gained as a result of the Project
1 EIS Appendix 10-C p 26
Pacific Region Science Response Technical Review Assessing
Ecosystem Productivity Model of Roberts Bank
7
30 Analysis and Response To prepare this response the following sections of the EIS additional documents were reviewed
DocumentSection Title
EIS Section 10
Including appendices 10B 10C and 10D
(Port Metro Vancouver 2015a Hemmera 2014 ESSA Technologies 2014a ESSA Technologies 2014b)
Biophysical Setting
Appendix 10-B Roberts Bank Ecosystem Model Parameter Estimates Port Metro Vancouver File 302-03503
Appendix 10-C Roberts Bank Ecosystem Model Development and Key Run Port Metro Vancouver
Appendix 10-D Roberts Bank Ecosystem Model Sensitivity Analyses Port Metro Vancouver
CEAR document 547 (Including Appendices) ldquoPMV Response 2016-03-02rdquo and ldquoPMV Response 2016-05-30rdquo
(Vancouver Fraser Port Authority 2016)
Vancouver Fraser Port Authority to the Review Panel re Answers to preliminary technical questions submitted during the completeness phase from Fisheries and Oceans Canada Natural Resources Canada and Environment and Climate Change Canada concerning the ecosystem modelling to support the Roberts Bank Terminal 2 Project environmental review
31 The EwE Team Building this ecosystem model was a complex undertaking which required knowledge of the ecosystem to be modelled how to set initial parameter values determination of reasonable ranges of these parameters how to balance the model and how to recognize when the model outputs were unrealistic These tasks became even more complex when spatial model dynamics were involved such as with Ecospace The team engaged by the Proponent to conduct this ecosystem modelling for the Roberts Bank Terminal 2 (RBT2) EIS was led by scientists at the Institute for Oceans and Fisheries located at the University of British Columbia in Vancouver These scientists are global leaders of the EwE model framework having developed much of its current implementation and who continue to lead its elaborations and extensions Construction and running of the model for this specific ecosystem was done in collaboration with ESSA Technologies of Vancouver Parameter values for the ecosystem model were obtained in part from observational studies conducted in the area by Hemmera of Burnaby BC
32 Overview of assessment results of hydrological and sediment modelling Implementation of the ldquowith the Projectrdquo simulations of the ecosystem model was done by driving the model with the abiotic variables as they were projected to be distributed with the Project footprint In the context of this EIS specifying depth salinity bottom currents wave height and sediment type conditions without the Project and changes with the Project were achieved by construction of hydrodynamical and sediment transport models The outputs from these models in combination with the identified environment preferences for the various biological groups were then used as inputs to the Ecospace model to define the spatial
Pacific Region Science Response Technical Review Assessing
Ecosystem Productivity Model of Roberts Bank
8
distributions of these functional groups The implementation of these hydrological and sediment transport models in this EIS was reviewed by DFO and NRCan (DFO 2016) This review concluded that the implementation of these models for this EIS was adequate for average winter conditions but lacking in validation for summer conditions in particular with strong freshwater flows from the Fraser River Simulations of strong storm events and their impacts on wave conditions and sediment transport were also lacking The effect of wave action and current speeds on sediment transport is non-linear such that increasing winds over short periods of time can impact sediment transport processes bottom topography and water depths beyond that determined under average model conditions Overall the review concluded that a greater range of sensitivity analyses is required to have confidence in the model outputs under lsquonon-averagersquo conditions The implication of this conclusion for the present review of the EwE model is that the full range of variability of abiotic characteristics such as bottom topography bottom current and wave heights and how they may affect relevant functional groups in the model with the Project may not be adequately represented Sensitivity analyses were provided by varying the intensity of abiotic variables and by removing abiotic variables to assess their interactive effects In general the ecosystem model outputs were robust to these sensitivity analyses with most groups varying by less than 5 Larger changes however were observed for primary producer and bird groupings and for some fish groups when various abiotic variables were omitted2
33 Model implementation 331 The purpose of the EwE model
The EwE model was intended to provide one line of evidence to assess the potential impacts of the Project on the Roberts Bank ecosystem which would then be used with other lines of evidence to make the final assessment Specifically ldquohellip the objective of the RB [Roberts Bank] model was not to provide an assessment of Project impacts for each functional group at a fine temporal scale but to estimate changes in productive potential with and without the Project at the ecosystem levelrdquo3 In addition ldquohellipthe primary objective of the RB ecosystem model is to evaluate potential changes in productivity from such abiotic factors with and without the terminal and causewayrdquo4 Results are presented for the selected functional groups no results were presented on potential changes in ecosystem structure or function
332 Applicability of the EwE model framework to the Roberts Bank region EwE models work best when the exchanges within the system being modelled are greater than the exchanges between the modelled system and the lsquooutsidersquo world In practice this means that EwE models work best for larger systems with few external exchanges In a meta-analysis of 433 Ecopath models Colleacuteter et al (2015) concluded that ldquohellipin the last two decades the range of the models area has expanded toward very large areas and the median has shifted accordingly from about 1000 km2 in 1984ndash1993 to about 100000 km2 in 1994ndash2014rdquo The section of the Roberts Bank ecosystem that is included in the EwE model was comparatively small (5468 km2) and complex It is an intertidally-dominated environment that is subject to strong seasonal influences of both freshwater and marine exchanges across relatively large seaward and shoreward boundaries
2 EIS Appendix 10-D p ii - iii 3 PMV Response 2016-03-02 p 99 lines 1914-1917 4 PMV Response 2016-03-02 p 38 lines 689-691
Pacific Region Science Response Technical Review Assessing
Ecosystem Productivity Model of Roberts Bank
9
Processes taking place outside the modelled ecosystem will contribute to dynamics within the modelled ecosystem (eg lsquooutsidersquo food supporting predators which occur in the Roberts Bank ecosystem for only part of the year predators which may feed in the Roberts Bank ecosystem but export this energy when they migrate out of the region) but which may not be well-resolved by the EwE model The Proponent justifies the spatial scale because it was specifically chosen for the questions being asked in regard to assessing productivity changes and because the relative influences of external exchanges are assumed to be identical with and without the project In addition highly mobile species with broad prey bases were assumed in the model to be partially sustained by external energy from outside the model system5 The distributions of organisms may differ however with and without the project which may affect their interactions with areas outside of the modelled system and the use of diets from outside the modelled system may not reflect the impacts of the project Further clarification of how the EwE model captures the exchanges and interactions with adjacent ecosystems are needed For example it could be argued that an ecosystem which is open to frequent exchanges of water and organic matter from beyond its boundaries might be more robust to local disturbances such as the Project
There are some inconsistencies in the information and assumptions used for some of the taxa in this ecosystem model For Dungeness Crab the justification for estimating total adult biomass (including females) from the biomass of fished males is unclear In addition it is unclear if the slower growth of female crabs once they have reached sexual maturity in comparison with male crabs has been considered The diet matrix for spiny dogfish does not represent the actual diet well in particular of euphausiids herring and shrimp and there are more recent references for biomass estimates of spiny dogfish in the study area than what was used in the EIS
Fishing mortality was not included in the model under the assumption that this would not change with or without the project While this assumption may be true the model has been parameterized by ignoring a source of mortality that will influence total production In essence fishing removes biomass from the ecosystem with the result that less biomass will be available for higher trophic levels How this may impact the ecosystem with and without the Project is unclear but it could make noticeable differences if for example there were thresholds in the feeding responses by these higher trophic level species The Ecopath model that was used is relatively unconstrained since many ecological efficiencies are low even for forage species which would be expected to be higher It is not clear how many species are exploited or the levels of exploitation but even if this does not change with the Project these mortality rates should be included in the model in order to add realistic constraints to the exploited functional groups
333 Model documentation Based on questions from DFO ECCC and NRCan following their initial review of the EIS the Proponent provided written responses dated 2 March 2016 to clarify several of the steps in the model development and implementation However several questions remain including questions about the Ecospace module Ecospace has undergone several recent developments such as the inclusion of the spatial-temporal data layer framework (Steenbeek et al 2013) the habitat capacity model (Christensen et al 2014) and the Monte Carlo analysis including the diet matrix As yet there are few published studies using these latest Ecospace developments and their documentation and justification need to be improved in the EIS
5 PMV Response 2016-03-02 p 29 lines 446 - 464
Pacific Region Science Response Technical Review Assessing
Ecosystem Productivity Model of Roberts Bank
10
Questions also remain regarding how the Monte Carlo randomization routine treated diet data The report indicates that the Monte Carlo routine randomly selected input parameters from the input ranges and that only models that were balanced were used This suggests that a high proportion of models were not balanced and therefore were not used (for example the EIS indicates that about one out of 1000 sampled input parameters was balanced6) A table showing the minimum maximum mode average and median values from the Monte Carlo runs for all the parameters would enable an evaluation of how much variation was actually sampled by the balanced model runs This is recommended in the EwE user information ie ldquoUsers should check the range of the input parameters that were actually used in the trials in the output csv file (see below)rdquo7
In addition there are several issues with the documentation of the derivation of the parameters for the functional groups Such documentation should clearly outline how the input parameter was estimated and the range of uncertainty for that parameter For example the input biomass of pinnipeds was defined as 04 t km 2 derived from estimates of 034 for Harbour seals and two estimates for Steller sea lions (012 and 014 t km 2) No explanation was provided for how the overall estimated pinniped biomass of 04 t km 2 was determined The diet of Sand Lance was described in the EIS as consisting mostly of zooplankton8 whereas the diet table for the model runs9 included 20 macrofauna 10 green algae and 10 detritus It is unclear why these additional prey were included in the diet used for the model runs
334 Highly mobile functional groups This implementation of the EwE framework included transient and migratory functional groups This is entirely appropriate and these groups cannot be excluded The approach taken in the Ecospace module was to impose a low (and conservative) dispersal rate among model spatial units (lsquopixelsrsquo) of 1 km yr-1 This may be appropriate for low mobility benthic organisms but it likely underestimates the movements of many other functional groups The effects of using higher and perhaps functional-group-specific dispersal rates was not considered The Proponents argued that higher dispersal rates would reduce impacts since species can move away from less desirable areas more quickly for completeness these runs should be done and evaluated Mobile species will also bring energy (food) captured outside the system into the modelled ecosystem This process was included in the model with the use of a diet import factor reflecting the consumption of prey outside the modelled region with the assumption that groups with high import rates were unlikely to respond to local changes on Roberts Bank10 This assumption needs justification perhaps at the functional group level for example many species of highly migratory birds and Pacific salmon use the Roberts Bank ecosystem to obtain food to continue their migrations Although this food does not compose a large fraction of their annual consumption it can be critical to enable them to continue their migrations
The EwE model is not designed to capture differences in prey quality ie differences in essential fatty acid or nutrient ratios The same species of prey may have greater or lesser nutritional value to predators depending on the conditions under which they are growing and their seasonal variations This is a particular concern with the nutritional quality of the diatom-dominated biofilm Diatomaceous biofilm is important to the highly migratory Western Sandpiper (Calidris mauri) Despite its predictive merits in relation to other ecosystem
6 EIS Appendix 10D Section 24 p5 7 EwE Help file p 151 8 EIS Appendix 10B Section 4133 p 76 9 EIS Appendix A of Appendix 10B 10 PMV Response 2016-03-02 p 28 lines 429 - 436
Pacific Region Science Response Technical Review Assessing
Ecosystem Productivity Model of Roberts Bank
11
components the EwE model is not informative with respect to understanding the potential impacts of the Project on biofilm and the Western Sandpiper While this example is specific to seabirds the potential exists for differences in the quality of biofilm to also be an issue for copepods which feed on biofilm and consequently to juvenile salmon which feed on these copepods (eg Sutherland et al 2013)
The EwE model is also not designed to predict effects of the Project on water quality although the Proponent noted that ldquoOther abiotic factors not included were deemed to be representative of variables that were already included in the modelhelliprdquo11 The Project may cause changes in physical and water quality conditions whether in isolation or in combination which may impact the productivity or nutritional quality of key prey organisms for local and migratory species which will not be captured by the model The EwE model does not assess the production of key nutrients or the implications of changes in important physical and water quality parameters to biofilm community structure and hence to important migratory birds
The model does not include biotic factors for both pelagic and benthic environments to assess the potential development of eutrophication and benthic organic enrichment events respectively Organic and redox indicators traditional measures of environmental assessments that are used to determine changes in functional group responses were included in the recent Deltaport Third environmental assessment (ie Pelagic chlorophyll dissolved nutrients Benthic sediment carbonnitrogen content redox state [sulfide concentration]) Benthic anoxic events based on organic enrichment are known to be strong drivers of community composition and exclusion regardless of substrate type In the absence of biotic factors (eg organic particulates) the model has not considered the potential for benthic organic enrichment which coincides with siltation processes within the upper tidal flats The tidal flat corner bordered by the Delta-dyke and Deltaport causeway has served as a catchment area for Fraser River silt since the development of the original Deltaport causeway (Sutherland et al 2013) The proposed position of the new terminal placed at the seaward termination of the Deltaport causeway may produce a crescent-shaped feature in the wake of the Fraser River Plume This feature may provide a more efficient silt trap that will promote benthic organic enrichment This piece of the environmental assessment seems to be missing and is important for assessing fish habitat in this area
335 Seasonality (model time step) Input data to parameterize the model were available on a range of time scales from hourly (eg physical data on salinity and water flow) to annual (eg species biomass) The Proponents indicated12 that this is a strength of the EwE model although ultimately the model was run with an annual time step with all sub-annual values being averaged to annual values This method therefore did not incorporate important seasonal processes such as winter-summer differences in salinity and storm properties and the seasonal appearances of abundances of predators and prey such as migratory salmon and birds that are much larger than the annual average For example juvenile salmon migrate from the Fraser River and onto Roberts Bank in the spring before moving into deeper waters If these spring abundances are averaged over the entire year these average abundances would be 5-10 times lower than the actual abundances during the spring (ie averaging the biomass that occurs in two months over a 12 month period) Additionally this method did not capture the intensity of processes such as growth and predation which can be focused over periods of a few weeks to a few months There may be important threshold effects at particular times and places which may be missed when using an 11 EIS Section 10 p 10-11 12 PMV Response 2016-03-02 p 86 line 1655
Pacific Region Science Response Technical Review Assessing
Ecosystem Productivity Model of Roberts Bank
12
annual time step for the model The Ecospace module has a monthly time step13 and therefore it is feasible to run this module with a sub-annual time step For example the Proponents submit14 that there are inadequate data to model the potential effects of the Project on the timing of biofilm production which could have implications for the migratory dunlin and Western Sandpiper However this could be modelled in an exploratory way to determine hypotheses about which factors could affect the timing of production of biofilm and the potential impacts on these birds These issues are of major concern to ECCC
336 Life history structure The EwE model did not separate functional groups into life history stages (stanzas) yet for many functional groups the juvenile stages can have very different life history characteristics and habitats than the adults It is unclear in the description of the model how different life history structures were considered and whether for example there were enough juveniles to produce the adults The implications of not including early life stages should be explored at least qualitatively to identify which species might have life stages that may be more vulnerable to project effects
337 Model balancing Balancing an EwE model is the process by which parameters are adjusted so that there is sufficient production for consumption requirements ie there are sufficient prey for all predators Expert opinion was used to examine parameter values and to adjust for errors or inconsistencies in logic ldquoPMV is confident that since the approach taken to balance the model was based on best practices the steps are appropriaterdquo15 Adjustments to initial parameters to ensure an ecologically-feasible model are necessary and to be expected For a few functional groups however very large changes to initial parameter estimates (which were often not based on Roberts Bank specific data) were necessary for example to transient killer whales When such initial parameters were adjusted (often by substantial amounts) by expert opinion to balance the model the confidence intervals around these adjusted parameter values were not increased to reflect this added uncertainty (see for example PMV Response 2016-03-02 p 51 lines 955-956) When expert opinion was used to make very large changes to initial parameter values broader confidence intervals about these parameters should have been applied This does not appear to have been the case and as a consequence may cause the actual uncertainty of the model outputs to be underestimated
Another example is for the pinniped group in which 50 of the diet was assumed to come from outside the model area in order to balance the model The rationale provided was ldquoThe pinnipeds caused excessive predation mortalities on numerous fish functional groups The biomass of pinnipeds was an average for the Strait of Georgia which was likely too high for Roberts Bank Therefore it was assumed that pinnipeds extracted only half of their diet from the study areardquo16 It is unclear whether the sensitivity of the model to different percentages of diet allocation was explored
As noted above (332) the Ecopath model was relatively unconstrained and few adjustments to input parameters were required to balance the model This is unusual and the low ecotrophic efficiencies of several functional groups suggest that full accounting of energy flows may not have been achieved (an ecotrophic efficiency of 1 indicates that 100 of the production of that
13 EIS Appendix 10C Section 29 p24 14 EIS Appendix 10D Appendix C p72 15 PMV Response 2016-03-02 p 49 lines 910-912 16 EIS Appendix 10C Section 261 p 20
Pacific Region Science Response Technical Review Assessing
Ecosystem Productivity Model of Roberts Bank
13
particular group is being preyed upon or removed by fishing leaving no individuals to die of old age17) An ldquoexcessrdquo of individuals dying of old age ie ecotrophic efficiencies much less than 1 suggests a potentially large biomass that is not used by the ecosystem and instead is converted to detritus
34 Model validation Model validation is the process by which the model parameters variables and outputs are compared with those from the real ecosystem to ascertain how well the model represents the ecosystem It is an essential step in providing confidence that the projections from the model in this case with and without the Project have relevance to how the real ecosystem may be expected to function with and without the Project In practice validating complex ecosystem models is difficult considering the range of assumptions that must be made when building the model the limited available data and natural variability of the ecosystem at a variety of time and space scales
Many of the standard diagnostics for the Ecopath model have not been evaluated in the EIS The Proponent appears to have assumed that once the Ecopath model was balanced then it was valid and fit for purpose The Proponent should provide all the Ecopath estimates of vital rates including mortality rates As presented questions remain For example many Ecotrophic Efficiencies (which control the transfer of biomass from prey to predators) are less than 1 even for taxa which would be expected to be close to 1 such as carnivorous zooplankton The reason for Ecotrophic Efficiencies less than 1 were not discussed or explained in the EIS
Detailed diagnostics for the Ecospace model should also be presented in order to evaluate model performance In response to criticisms by DFO ECCC and NRCan in discussions with the Proponent the latter provided the biomass of the functional groups from the Ecopath model (before Ecospace) and the Ecospace model after the spin-up period (which involved adjusting the parameters from the Ecopath model to balance the 5468 separate cells of the Ecospace model)18 The Proponents argue that ldquoIt is important to note that changes in biomass values generated during the spin-up period are identical for both with and without Project scenarios and thus do not provide information on the potential Project-related effects on productivity19 However several changes to biomass result from the Ecospace balancing process (spin-up period) This is only given brief attention by the Proponent in its response to the DFO ECCC and NRCan questions An analysis of Table 620 revealed that the biomass of 9 functional groups was larger or smaller than the widest confidence limits allowed for each group21 This requires further discussion and justification
The Proponent used a goodness of fit measure to compare spatial distributions of model outputs with field observations They indicated that ldquono other EwE models were identified which use a goodness-of-fit measure Hence the RB model is potentially the first such EwE model where a goodness of fit measure has been appliedrdquo22 The chosen goodness of fit measure is the percent correct classification (PCC) method23 This method derives a test statistic based on the proportion of locations at which predicted occurrences from the model match observed
17 EIS Appendix 10-B p 11 18 PMV Response 2016-03-02 p 65-66 Table 6 19 PMV Response 2016-03-02 p 64 lines 1205-1207 20 PMV Response 2016-03-02 p 65-66 Table 6 21 PMV Response 2016-03-02 p 45 Table 3 22 PMV Response 2016-03-02 p 78 lines 1481-1483 23 PMV Response 2016-03-02 p 78 lines 1483-1484
Pacific Region Science Response Technical Review Assessing
Ecosystem Productivity Model of Roberts Bank
14
occurrences from data and similarly with predicted and observed absences The Proponent then calculated two additional accuracy of fit measures sensitivity (the model predicts a species to occur in an area where it is known to occur in reality) and specificity (the model predicts a species does not occur in an area it is known not to occur in reality)24 This analysis concluded that the model has high predictability for functional groups such as eelgrass and sea pens with relatively static distributions but lower predictability for functional groups which are more temporally and spatially dynamic such as biofilm and green algae25
There are two problems with this approach The first is that this goodness of fit comparison was done only for habitat-forming functional groups no discussion of how well this analysis applies to mobile functional groups was provided The second problem is that this method does not take into account situations (such as occurs in this study with several groups) in which species occur at only a few locations For example ldquohellipif the test data consist of 95 absences and 5 presences and this reflects the true prevalence of the species on the landscape (a realistic scenario for a rare species) a lsquonullrsquo model that predicted absence in all cases (eg no model at all) would be correct 95 of the timehellipldquo (Franklin 2009 p 151) This latter point is important here as these habitat functional groups (biofilm brown algae native eelgrass green algae Japanese eelgrass tidal marsh biomat and orange sea pens26) appear not to occur over most of the Project area (as portrayed by the model outputs presented in the distribution figures of PMV Response 2016-03-02 Appendix 218) It is therefore important that a robust evaluation of the performance of the Ecospace module is used with preferably more than one measure
In summary the starting point for this modelling analysis matters It is not just about a comparison between results with and without the Project The model has to be considered a sufficient representation of the ecosystem The Proponent has not yet sufficiently validated the model
35 Model results 351 Presentation of model results
As noted above (Section 331) the stated objective of the Roberts Bank ecosystem model was not to provide an assessment of Project impacts for each functional group at a fine temporal scale but to estimate changes in productive potential with and without the Project at the ecosystem level27 However results were presented as comparisons by speciesfunctional group with and without the Project and not as potential changes in total ecosystem productivity The revised figures for each functional group showing distributions without the Project with the Project and their difference indicated impacts were likely to be localized with overall impacts relatively small The range of biomass ratios with and without the Project was 045 ndash 189 with most values slightly less than 1 This is interpreted as indicating slight decreases in the capacity of the study area to support biomass and production with the Project for many functional groups28 (Figure 2)
24 PMV Response 2016-03-02 p 80 lines 1524-1527 25 PMV Response 2016-03-02 p 81 lines 1551-1559 26 PMV Response 2016-03-02 p 82 Table 8 27 PMV Response 2016-03-02 p 99 lines 1914-1917 28 PMV Response 2016-03-02 Appendix 218
Pacific Region Science Response Technical Review Assessing
Ecosystem Productivity Model of Roberts Bank
15
Biomass Ratio
Freq
uenc
y
04 07 10 13 16 19
05
1015
2025
30
Figure 2 Histogram of biomass ratios obtained by comparisons of model runs with and without the project (ie With Without) Values less than 1 indicate reductions in biomass with the Project compared against without the Project) Data from Appendix 218 of PMV Response 2016-03-02
352 Sensitivity and vulnerability analyses Every ecosystem model is only one possible representation of the true ecosystem defined by the modelrsquos structure and the values chosen for its many parameters The key point is how well the model represents the real system how that fit can be measured and the sensitivity of model outputs to variability in the selected parameter values The ideal model should be robust to a wide range of uncertainties in the input data and parameters This robustness is determined by performing sensitivity analyses on the model to see how it responds to variations in the input parameters and determining to which input parameters the model is most sensitive
The vulnerability parameters determine the strength of the feeding interactions between functional groups They set the level of density dependence of each functional group Higher vulnerability settings provide greater top-down (predator) control whereas lower settings provide greater bottom-up (environmental) control29 Several publications have shown that EwE models are very sensitive to the vulnerability parameters and Christensen and Walters (2000) point out that a main pitfall of EwE is that ldquopredation vulnerabilities are often underestimated lessening the modelled impacts of predationrdquo It is usual practice to tune Ecopath models including the vulnerability parameters to time series data such as biomass using the temporal simulation model Ecosim However these data were not available for the RBT2 area so this robust method of fitting the model and estimating vulnerability parameters was not possible Instead a vulnerability setting of 2 was used as the default value for the key model runs which is ldquocommon practice when time series data are not available and estimates of vulnerability in the
29 PMV Response 2016-03-02 p 70 lines 1318-1323
Pacific Region Science Response Technical Review Assessing
Ecosystem Productivity Model of Roberts Bank
16
model cannot be maderdquo30 with sensitivity analyses run for a range of 15 to 3 This narrow range was criticized by DFOECCC in initial discussions about the model with the Proponent The Proponent subsequently reran the model with a larger range of vulnerabilities31 (11 to 10) and concluded this broader vulnerability range produced similar results for the productivity ratio with and without the Project to those in the original EIS and that the EIS was more likely to overestimate than underestimate potential project effects32 The data in Table 7 of the PMV Response33 did indicate changes in productivity ratios ranging from 0 to 50 of the defined key run (which used a vulnerability setting of 2) However the Proponent changed all vulnerability settings to the same value ie all were 2 or all were 10 etc In reality the vulnerability parameters resulting from Ecosim models that are fitted to data as described above vary by functional group which was not explored here Therefore although the results suggest that the original choice of 2 for the default key run seemed reasonable the potential effects of variability in vulnerability settings was not fully explored
Sensitivity analyses are usually based on the range of uncertainty estimated for input data and parameters often called the confidence limits around the model parameters The EwE framework integrates many different data sources and parameters including values from the literature It can therefore be difficult to identify ldquoreasonablerdquo confidence limits when derived from such diverse data sources Standard practice in Ecopath models has been to develop a pedigree for each parameter with default values for uncertainty based on the nature of the source data For example parameter values based on high precision field observations of biomass within the model domain receive default confidence intervals of 10 whereas parameter values based on models developed for elsewhere or professional judgment receive confidence intervals of 8034 Sensitivity analyses are then run using parameter values selected from within these confidence intervals However if these default confidence intervals do not capture the full range of variability then the outputs are not informative of the variability in the lsquorealrsquo ecosystem Field observations were collected for many functional groups within the model domain in 2012 and 2013 as part of studies to support the RBT2 EIS Apparently the purpose of these observations was to document spatial variability (in part for the Ecospace model) and temporal variability (measurements at one location over time) and not to derive confidence intervals around the observations35
The reliance on the pedigree approach to derive confidence intervals for this Roberts Bank model was criticized by DFO ECCC and NRCan in discussions with the Proponent As a result the Proponent reran the model with much larger confidence intervals ranging from 30 to 100 depending on the input parameter and functional group36 The results from this new analysis using the broader confidence intervals were similar to those using the original pedigree approach The Proponent noted that ldquoWhile the production within each helliprun was very different there was little difference in the biomass ratio [with and without the Project] These results further demonstrate that even with a greater range in input values the influence of the Project on the Roberts Bank ecosystem is consistent among allhellipmodel runsrdquo37 This provides confidence that the model may be robust to uncertainty in its input parameters Two concerns
30 PMV Response 2016-03-02 p 70 lines 1321-1322 31 PMV Response 2016-03-02 p 71-74 32 PMV Response 2016-03-02 p 71 lines 1339-1341 33 PMV Response 2016-03-02 p 73 34 EIS Appendix 10-C Section 251 page 18 35 PMV Response 2016-03-02 p 42 lines 772-777 36 PMV Response 2016-03-02 p 44-47 37 PMV Response 2016-03-02 p 47 lines 855-858 and see also PMV Response 2016-03-02 Appendix 27-B
Pacific Region Science Response Technical Review Assessing
Ecosystem Productivity Model of Roberts Bank
17
remain however The quote above indicates that the production among the different model runs was very different although with little difference in the biomass ratios with and without the Project Since biomass is not the same as production it would be informative for understanding model performance and potential impacts to show these production differences This also relates to the point made in Section 34 regarding how well the model represents the real ecosystem and not just within-model comparisons with and without the Project The second question is more technical and relates to how the randomization (Monte Carlo or MC) routine that was used to create multiple model runs used the uncertainty about the diet data Diets are not currently included in the MC routine available to regular users of the Ecosim model how they were handled in this RBT2 model appears not to be explained
Finally the sensitivity analyses indicate that the uncertainty in the input parameters does not lead to much difference between model parameters with or without the project However this conclusion does not describe how the uncertainty in the input parameters affects understanding of the ecosystem
40 Conclusions Overall the main conclusion of the Environmental Impact Statement from the Proponent is stated as ldquohellipafter the implementation of mitigation hellipthe Project is not expected to result in any significant adverse effects on any of the 16 valued componentsrdquo38 In addition ldquohellipapproximately 40 of the functional groups are forecast to change no more than 5 which hellip is judged to be within the uncertainty of the model runsrdquo39 although larger changes were forecast for orange sea pens freshwater biofilm green algae and raptors The conclusions from the modelling studies are that ldquohellipthe proposed project will have an impact on the study area that the effect varies between species and that the findings are robust to parameter uncertaintyrdquo40 Specific outcomes by valued component as derived from the EwE model are presented by functional groups in Table 1
38 PMV March 2015 Roberts Bank Environmental Impact Statement Executive Summary ndash Part 1 page 37 39 EIS Appendix 10-C p ii 40 EIS Appendix 10-D p iv
Pacific Region Science Response Technical Review Assessing
Ecosystem Productivity Model of Roberts Bank
18
Table 1 Changes in productive potential with the Project as derived from the EwE model
Changes in productive potential
Ecosystem category
Number of valued
components
Number with potential
biomass loss
Moderate decrease (31-60 decline)
Minor decrease (6-30 decline)
Negligible (0-5
change)
Minor increase (6-
30 increase)
Moderate increase (31-60 increase)
Source
Marine vegetation
7 7 - 3 2 2 - EIS Vol 3 Section 11 Table 11-17 page 11-65
Marine invertebrates
4 3 1 1 1 1 - EIS Vol 3 Section 12 Table 12-8 page 12-52
Marine fish 13 13 - 2 6 5 - EIS Vol 3 Section 13 Table 13-10 page 13-95
Coastal birds
11 8 - 3 4 3 1 EIS Vol 3 Section 15 Table 15-10 page 15-67
Pacific Region Science Response Technical Review Assessing
Ecosystem Productivity Model of Roberts Bank
19
Most functional groups showed some potential biomass loss with the Project with biomass loss defined as any model run with negative outcomes (ie in which biomass with the project was less than biomass without the Project) The summary of changes in productivity potential are mixed with most (33 out of 35) valued components showing minor decreases to minor increases (defined as 6 to 30 changes in productive potential with the Project compared to without the Project)
The main conclusions of this review in regards to the Terms of Reference are
1 Do the functional groups and abiotic variables used in the model adequately represent the ecosystem at Roberts Bank
o The 58 functional groups and abiotic variables used in the model adequately represent the main components of the Roberts Bank ecosystem however for longer lived species the life stages of the species are not well represented and some of the impacts of the Project may be expected to affect specific life stages
o The abiotic variables adequately represent the physical drivers of this ecosystem on an annual time scale However annual values for these abiotic variables may not adequately capture important sub-annual events such as storms (DFO 2016) the timing of arrival and departure of highly migratory species and whether there may be important sub-annual thresholds or mismatches in timing as a result of the Project
o Biotic factors (eg nutrients) which are particularly important for biofilm and other lower trophic level taxa are not included in this model The model is therefore unable to assess the potential development of eutrophication and benthic organic enrichment events which may affect fish habitats in the study area
2 Are the parameter estimates used by the model valid and defensible for this system
o In general parameter estimates appear to be adequate for this system Field studies were done in two years to provide data in particular on distributions of selected functional groups for the Ecospace module Note the distribution studies focussed on taxa which were relatively immobile and therefore lsquofixedrsquo in space
o the selection of some model parameters would benefit from further explanation for example the choice of fixed diet matrices versus dynamic matrices which can vary with changes in abundances or predators and prey
o the selection of some model parameters would benefit from further explanation for example the link between the diets described in the text of Appendix 10B and the quantities presented in Appendix A of Appendix 10B It is understood that proportions were derived using the ldquofixed selectivityrdquo principle but in order to be fully transparent the derivation of each diet should be provided in an appendix
o discussion and explanation is needed of why ecotrophic efficiencies differ from expected values (eg the ecotrophic efficiency for Pacific herring is listed as 038) and
o the abiotic factor lsquosubstratersquo was limited to ldquohardrdquo or rdquosoftrdquo options which can be restrictive given that they serve as endpoints on a substrate composition continuum These limited options may not provide the sensitivity required to assess substrate preference nor the flexibility for taxa (eg motile organisms) that span hard mixed and soft substrate types In addition it is not clear if changes in the hardsoft categories were considered over time within identified depositional or erosional settings before and after construction
Pacific Region Science Response Technical Review Assessing
Ecosystem Productivity Model of Roberts Bank
20
3 Are the limitations and uncertainties of the model identified and appropriately considered when determining the modelrsquos representation of current and possible future conditions
o the EwE model was not designed to evaluate a range of future conditions It was designed to estimate changes in the productive potential at the ecosystem level with and without the Project Therefore the model was run without the Project and with the Project for a range of plausible abiotic conditions and the results were compared with respect to biomass and productivity by functional group
o the pedigree approach to assessing the uncertainties of model outcomes is unsatisfactory for the purpose here as it relates solely to a qualitative judgment of the value of data based on its source However when the model was rerun with much wider ranges of confidence intervals (uncertainties) the results in general (but not necessarily for each functional group) were similar to the results using the original pedigree approach This suggests that taken overall the model may be robust to wide ranges of uncertainty in these input variables and parameters
o there is inadequate validation of the model This is inadequate for three reasons
(i) the basic Ecopath model is not validated and the Ecospace balancing process (the spin-up period) resulted in some biomass estimates being increased or decreased beyond their confidence limits
(ii) the goodness of fit test used to evaluate how well the model predicted the spatial occurrence functional groups is not fit for purpose (Section 34) and
(iii) validation was provided for only a small number of functional groups (the habitat-forming functional groups) As a consequence the model is currently not validated
o Considering the proportion of open boundaries relative to closed boundaries in the model processes taking place outside the modelled ecosystem are likely to contribute to dynamics within the modelled ecosystem However these external processes may not be well-resolved by the EwE model as currently configured
4 Are the model results related to the potential effects of the Project on fish and fish habitat and migratory birds and their food resources valid and defensible
o this is a very complex ecosystem model constructed for a relatively small and open (in the sense of considerable exchange with adjacent non-modelled areas) system Many assumptions have been made based on poor or missing data Taking all these considerations into account the model does the best job possible of comparing the biomass and productivity of the Roberts Bank ecosystem with and without the Project
o the extent to which the model adequately represents the lsquorealrsquo ecosystem of Roberts Bank as opposed to comparisons of model results with and without the Project is unclear as a number of basic diagnostics are not presented (see point 3 above)
o the EwE model is not capable of and is not designed to represent nutritional and food quality variations in prey functional groups and how these may impact highly migratory predators such as birds with and without the Project
5 Is the EwE model framework a valid method to quantify large scale impacts to fish habitat fish productivity and migratory bird productivity
o the EwE model as implemented in this project and reviewed here is a useful first-order framework to organise information and derive initial estimates of how the system may respond to perturbations
Pacific Region Science Response Technical Review Assessing
Ecosystem Productivity Model of Roberts Bank
21
o the utility of a EWE model for impact purposes is highly dependent on the quality of input data
o each EwE model is highly dependent on local conditions Although appropriate as an overall methodology each application would need to be reviewed for how it may be applied to any new ecosystem and
o the EwE model would need to be substantially reformulated if it was to include considerations of changes in chemical composition or food quality of prey in particular for seasonal migratory species such as birds which may depend on very large biomasses of prey with specific chemical composition to fuel their migrations beyond the ecosystem model boundaries
Contributors Contributor Affiliation Ian Perry Author DFO Science Pacific Region Alida Bundy Author DFO Science Maritimes Region Terri Sutherland Author DFO Science Pacific Region Robert Elner Author ECCC Canadian Wildlife Service Andrew Robinson Author ECCC Canadian Wildlife Service Lesley MacDougall Editor DFO Science Pacific Region
Approved by Carmel Lowe
Regional Director Science Branch Pacific Region Fisheries and Oceans Canada
November 4 2016
Sources of Information Christensen V Coll M Steenbeek J Buszowski J Chagaris D walters CJ 2014
Representing variable habitat quality in a spatial food web model Ecosystems 17 1397-1412
Christensen V and Walters C 2000 Ecopath with Ecosim methods capabilities and limitations Ecological Modelling 172 109-139
Colleacuteter M Valls A Guitton J Gascuel D Pauly D and Christensen V 2015 Global overview of the applications of the Ecopath with Ecosim modeling approach using the EcoBase models repository Ecological Modelling 302 pp42-53
Compass Resource Management Ltd 2013 Roberts Bank Terminal 2 Technical Advisory Group (TAG) Process Report Productive Capacity ndash Final Report 119pp (Accessed November 1 2016)
DFO 2016 Technical Review of Roberts Bank Terminal 2 Environmental Assessment Section 95 ndash Coastal Geomorphology DFO Can Sci Advis Sec Sci Resp 2016045 (Accessed November 4 2016)
Pacific Region Science Response Technical Review Assessing
Ecosystem Productivity Model of Roberts Bank
22
ESSA Technologies 2014a Roberts Bank Terminal 2 Project Roberts Bank Delta BC Environmental Impact Statement Volume 3 Biophysical Effects Assessments Appendix 10-C Roberts Bank Ecosystem Model Development and Key Run Port Metro Vancouver (Accessed November 1 2016)
ESSA Technologies 2014b Roberts Bank Terminal 2 Project Roberts Bank Delta BC Environmental Impact Statement Volume 3 Biophysical Effects Assessments Appendix 10-D Roberts Bank Ecosystem Model Sensitivity Analyses Port Metro Vancouver (Accessed November 1 2016)
Franklin J 2009 Mapping Species Distributions Spatial Inference and Prediction Cambridge University Press Cambridge
Hemmera 2014 Roberts Bank Terminal 2 Project Roberts Bank Delta BC Environmental Impact Statement Volume 3 Biophysical Effects Assessments Appendix 10-B Roberts Bank Ecosystem Model Parameter Estimates Port Metro Vancouver File 302-03503 (Accessed November 1 2016)
Port Metro Vancouver 2015a Roberts Bank Terminal 2 Project Roberts Bank Delta BC Environmental Impact Statement Volume 3 Biophysical Effects Assessments Section 100 Biophysical Setting (Accessed November 1 2016)
Port Metro Vancouver 2015b Roberts Bank Terminal 2 Project Roberts Bank Delta BC Environmental Impact Statement Volume 3 Biophysical Effects Assessments Section 103 Overview of Assessing Ecosystem Productivity (Accessed November 1 2016)
Port Metro Vancouver 2015c Roberts Bank Terminal 2 Project Environmental Assessment Additional Information Requirements (July 31 2015) Responses Response to Information Request 6 IR-73115-06 Canadian Environmental Assessment Agency Reference Number 80054 dated 26 October 2015
Steenbeek J Coll M Gurney L Meacutelin F Hoepffner N Buszowski J and Christensen V 2013 Bridging the gap between ecosystem modeling tools and geographic information systems Driving a food web model with external spatialndashtemporal data Ecological Modelling 263 139ndash 151
Sutherland T Elner R and OrsquoNeill J 2013 Roberts Bank Ecological crucible of the Fraser River estuary Progress in Oceanography 115 171ndash180
Vancouver Fraser Port Authority 2016 From the Vancouver Fraser Port Authority to the Review Panel re Answers to preliminary technical questions submitted during the completeness phase from Fisheries and Oceans Canada Natural Resources Canada and Environment and Climate Change Canada concerning the ecosystem modelling to support the Roberts Bank Terminal 2 Project environmental review CEAR Document 547 (Accessed November 1 2016)
Pacific Region Science Response Technical Review Assessing
Ecosystem Productivity Model of Roberts Bank
23
This Report is Available from the Centre for Science Advice
Pacific Region Fisheries and Oceans Canada
3190 Hammond Bay Road Nanaimo BC V9T 6N7
Telephone (250) 756-7208 E-Mail csapdfo-mpogcca
Internet address wwwdfo-mpogccacsas-sccs
ISSN 1919-3769 copy Her Majesty the Queen in Right of Canada 2016
Correct Citation for this Publication
DFO 2016 Technical review of Roberts Bank Terminal 2 environmental assessment section 103 ndash assessing ecosystem productivity DFO Can Sci Advis Sec Sci Resp 2016050
Aussi disponible en franccedilais
MPO 2016 Examen technique de leacutevaluation environnementale du Terminal 2 agrave Roberts Bank section 103 ndash eacutevaluation de la productiviteacute de leacutecosystegraveme Secr can de consult sci du MPO Reacutep des Sci 2016050
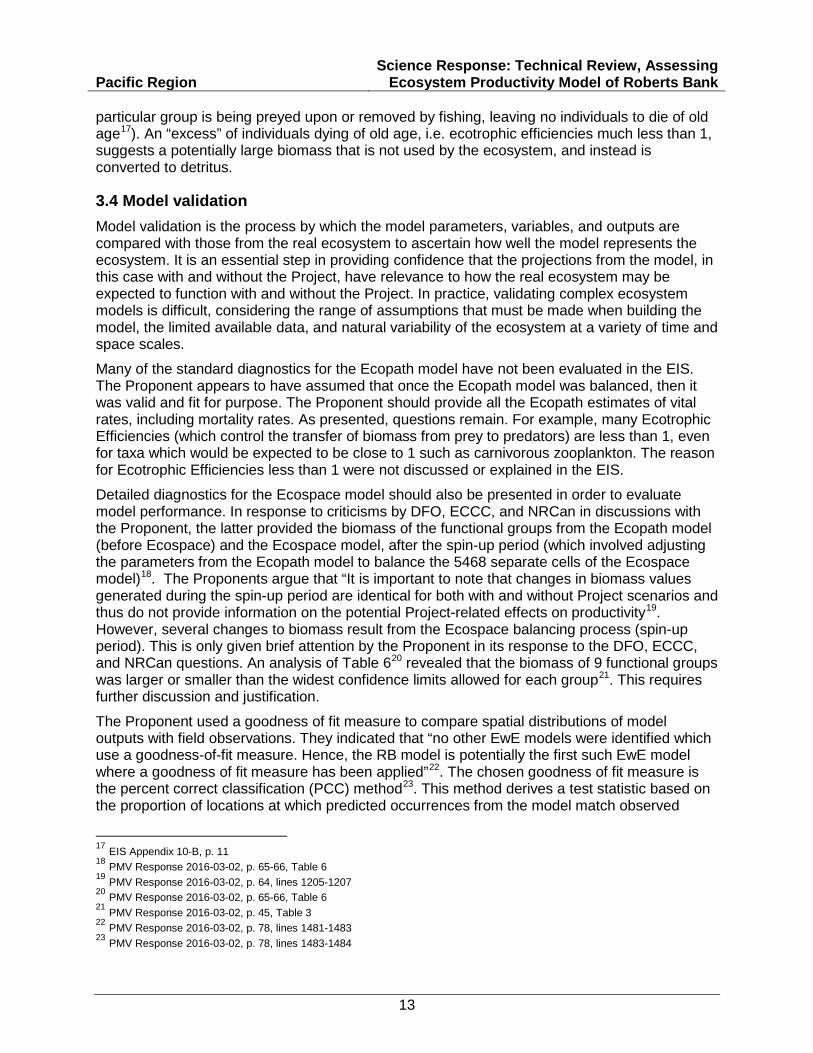
Pacific Region Science Response Technical Review Assessing
Ecosystem Productivity Model of Roberts Bank
13
particular group is being preyed upon or removed by fishing leaving no individuals to die of old age17) An ldquoexcessrdquo of individuals dying of old age ie ecotrophic efficiencies much less than 1 suggests a potentially large biomass that is not used by the ecosystem and instead is converted to detritus
34 Model validation Model validation is the process by which the model parameters variables and outputs are compared with those from the real ecosystem to ascertain how well the model represents the ecosystem It is an essential step in providing confidence that the projections from the model in this case with and without the Project have relevance to how the real ecosystem may be expected to function with and without the Project In practice validating complex ecosystem models is difficult considering the range of assumptions that must be made when building the model the limited available data and natural variability of the ecosystem at a variety of time and space scales
Many of the standard diagnostics for the Ecopath model have not been evaluated in the EIS The Proponent appears to have assumed that once the Ecopath model was balanced then it was valid and fit for purpose The Proponent should provide all the Ecopath estimates of vital rates including mortality rates As presented questions remain For example many Ecotrophic Efficiencies (which control the transfer of biomass from prey to predators) are less than 1 even for taxa which would be expected to be close to 1 such as carnivorous zooplankton The reason for Ecotrophic Efficiencies less than 1 were not discussed or explained in the EIS
Detailed diagnostics for the Ecospace model should also be presented in order to evaluate model performance In response to criticisms by DFO ECCC and NRCan in discussions with the Proponent the latter provided the biomass of the functional groups from the Ecopath model (before Ecospace) and the Ecospace model after the spin-up period (which involved adjusting the parameters from the Ecopath model to balance the 5468 separate cells of the Ecospace model)18 The Proponents argue that ldquoIt is important to note that changes in biomass values generated during the spin-up period are identical for both with and without Project scenarios and thus do not provide information on the potential Project-related effects on productivity19 However several changes to biomass result from the Ecospace balancing process (spin-up period) This is only given brief attention by the Proponent in its response to the DFO ECCC and NRCan questions An analysis of Table 620 revealed that the biomass of 9 functional groups was larger or smaller than the widest confidence limits allowed for each group21 This requires further discussion and justification
The Proponent used a goodness of fit measure to compare spatial distributions of model outputs with field observations They indicated that ldquono other EwE models were identified which use a goodness-of-fit measure Hence the RB model is potentially the first such EwE model where a goodness of fit measure has been appliedrdquo22 The chosen goodness of fit measure is the percent correct classification (PCC) method23 This method derives a test statistic based on the proportion of locations at which predicted occurrences from the model match observed
17 EIS Appendix 10-B p 11 18 PMV Response 2016-03-02 p 65-66 Table 6 19 PMV Response 2016-03-02 p 64 lines 1205-1207 20 PMV Response 2016-03-02 p 65-66 Table 6 21 PMV Response 2016-03-02 p 45 Table 3 22 PMV Response 2016-03-02 p 78 lines 1481-1483 23 PMV Response 2016-03-02 p 78 lines 1483-1484
Pacific Region Science Response Technical Review Assessing
Ecosystem Productivity Model of Roberts Bank
14
occurrences from data and similarly with predicted and observed absences The Proponent then calculated two additional accuracy of fit measures sensitivity (the model predicts a species to occur in an area where it is known to occur in reality) and specificity (the model predicts a species does not occur in an area it is known not to occur in reality)24 This analysis concluded that the model has high predictability for functional groups such as eelgrass and sea pens with relatively static distributions but lower predictability for functional groups which are more temporally and spatially dynamic such as biofilm and green algae25
There are two problems with this approach The first is that this goodness of fit comparison was done only for habitat-forming functional groups no discussion of how well this analysis applies to mobile functional groups was provided The second problem is that this method does not take into account situations (such as occurs in this study with several groups) in which species occur at only a few locations For example ldquohellipif the test data consist of 95 absences and 5 presences and this reflects the true prevalence of the species on the landscape (a realistic scenario for a rare species) a lsquonullrsquo model that predicted absence in all cases (eg no model at all) would be correct 95 of the timehellipldquo (Franklin 2009 p 151) This latter point is important here as these habitat functional groups (biofilm brown algae native eelgrass green algae Japanese eelgrass tidal marsh biomat and orange sea pens26) appear not to occur over most of the Project area (as portrayed by the model outputs presented in the distribution figures of PMV Response 2016-03-02 Appendix 218) It is therefore important that a robust evaluation of the performance of the Ecospace module is used with preferably more than one measure
In summary the starting point for this modelling analysis matters It is not just about a comparison between results with and without the Project The model has to be considered a sufficient representation of the ecosystem The Proponent has not yet sufficiently validated the model
35 Model results 351 Presentation of model results
As noted above (Section 331) the stated objective of the Roberts Bank ecosystem model was not to provide an assessment of Project impacts for each functional group at a fine temporal scale but to estimate changes in productive potential with and without the Project at the ecosystem level27 However results were presented as comparisons by speciesfunctional group with and without the Project and not as potential changes in total ecosystem productivity The revised figures for each functional group showing distributions without the Project with the Project and their difference indicated impacts were likely to be localized with overall impacts relatively small The range of biomass ratios with and without the Project was 045 ndash 189 with most values slightly less than 1 This is interpreted as indicating slight decreases in the capacity of the study area to support biomass and production with the Project for many functional groups28 (Figure 2)
24 PMV Response 2016-03-02 p 80 lines 1524-1527 25 PMV Response 2016-03-02 p 81 lines 1551-1559 26 PMV Response 2016-03-02 p 82 Table 8 27 PMV Response 2016-03-02 p 99 lines 1914-1917 28 PMV Response 2016-03-02 Appendix 218
Pacific Region Science Response Technical Review Assessing
Ecosystem Productivity Model of Roberts Bank
15
Biomass Ratio
Freq
uenc
y
04 07 10 13 16 19
05
1015
2025
30
Figure 2 Histogram of biomass ratios obtained by comparisons of model runs with and without the project (ie With Without) Values less than 1 indicate reductions in biomass with the Project compared against without the Project) Data from Appendix 218 of PMV Response 2016-03-02
352 Sensitivity and vulnerability analyses Every ecosystem model is only one possible representation of the true ecosystem defined by the modelrsquos structure and the values chosen for its many parameters The key point is how well the model represents the real system how that fit can be measured and the sensitivity of model outputs to variability in the selected parameter values The ideal model should be robust to a wide range of uncertainties in the input data and parameters This robustness is determined by performing sensitivity analyses on the model to see how it responds to variations in the input parameters and determining to which input parameters the model is most sensitive
The vulnerability parameters determine the strength of the feeding interactions between functional groups They set the level of density dependence of each functional group Higher vulnerability settings provide greater top-down (predator) control whereas lower settings provide greater bottom-up (environmental) control29 Several publications have shown that EwE models are very sensitive to the vulnerability parameters and Christensen and Walters (2000) point out that a main pitfall of EwE is that ldquopredation vulnerabilities are often underestimated lessening the modelled impacts of predationrdquo It is usual practice to tune Ecopath models including the vulnerability parameters to time series data such as biomass using the temporal simulation model Ecosim However these data were not available for the RBT2 area so this robust method of fitting the model and estimating vulnerability parameters was not possible Instead a vulnerability setting of 2 was used as the default value for the key model runs which is ldquocommon practice when time series data are not available and estimates of vulnerability in the
29 PMV Response 2016-03-02 p 70 lines 1318-1323
Pacific Region Science Response Technical Review Assessing
Ecosystem Productivity Model of Roberts Bank
16
model cannot be maderdquo30 with sensitivity analyses run for a range of 15 to 3 This narrow range was criticized by DFOECCC in initial discussions about the model with the Proponent The Proponent subsequently reran the model with a larger range of vulnerabilities31 (11 to 10) and concluded this broader vulnerability range produced similar results for the productivity ratio with and without the Project to those in the original EIS and that the EIS was more likely to overestimate than underestimate potential project effects32 The data in Table 7 of the PMV Response33 did indicate changes in productivity ratios ranging from 0 to 50 of the defined key run (which used a vulnerability setting of 2) However the Proponent changed all vulnerability settings to the same value ie all were 2 or all were 10 etc In reality the vulnerability parameters resulting from Ecosim models that are fitted to data as described above vary by functional group which was not explored here Therefore although the results suggest that the original choice of 2 for the default key run seemed reasonable the potential effects of variability in vulnerability settings was not fully explored
Sensitivity analyses are usually based on the range of uncertainty estimated for input data and parameters often called the confidence limits around the model parameters The EwE framework integrates many different data sources and parameters including values from the literature It can therefore be difficult to identify ldquoreasonablerdquo confidence limits when derived from such diverse data sources Standard practice in Ecopath models has been to develop a pedigree for each parameter with default values for uncertainty based on the nature of the source data For example parameter values based on high precision field observations of biomass within the model domain receive default confidence intervals of 10 whereas parameter values based on models developed for elsewhere or professional judgment receive confidence intervals of 8034 Sensitivity analyses are then run using parameter values selected from within these confidence intervals However if these default confidence intervals do not capture the full range of variability then the outputs are not informative of the variability in the lsquorealrsquo ecosystem Field observations were collected for many functional groups within the model domain in 2012 and 2013 as part of studies to support the RBT2 EIS Apparently the purpose of these observations was to document spatial variability (in part for the Ecospace model) and temporal variability (measurements at one location over time) and not to derive confidence intervals around the observations35
The reliance on the pedigree approach to derive confidence intervals for this Roberts Bank model was criticized by DFO ECCC and NRCan in discussions with the Proponent As a result the Proponent reran the model with much larger confidence intervals ranging from 30 to 100 depending on the input parameter and functional group36 The results from this new analysis using the broader confidence intervals were similar to those using the original pedigree approach The Proponent noted that ldquoWhile the production within each helliprun was very different there was little difference in the biomass ratio [with and without the Project] These results further demonstrate that even with a greater range in input values the influence of the Project on the Roberts Bank ecosystem is consistent among allhellipmodel runsrdquo37 This provides confidence that the model may be robust to uncertainty in its input parameters Two concerns
30 PMV Response 2016-03-02 p 70 lines 1321-1322 31 PMV Response 2016-03-02 p 71-74 32 PMV Response 2016-03-02 p 71 lines 1339-1341 33 PMV Response 2016-03-02 p 73 34 EIS Appendix 10-C Section 251 page 18 35 PMV Response 2016-03-02 p 42 lines 772-777 36 PMV Response 2016-03-02 p 44-47 37 PMV Response 2016-03-02 p 47 lines 855-858 and see also PMV Response 2016-03-02 Appendix 27-B
Pacific Region Science Response Technical Review Assessing
Ecosystem Productivity Model of Roberts Bank
17
remain however The quote above indicates that the production among the different model runs was very different although with little difference in the biomass ratios with and without the Project Since biomass is not the same as production it would be informative for understanding model performance and potential impacts to show these production differences This also relates to the point made in Section 34 regarding how well the model represents the real ecosystem and not just within-model comparisons with and without the Project The second question is more technical and relates to how the randomization (Monte Carlo or MC) routine that was used to create multiple model runs used the uncertainty about the diet data Diets are not currently included in the MC routine available to regular users of the Ecosim model how they were handled in this RBT2 model appears not to be explained
Finally the sensitivity analyses indicate that the uncertainty in the input parameters does not lead to much difference between model parameters with or without the project However this conclusion does not describe how the uncertainty in the input parameters affects understanding of the ecosystem
40 Conclusions Overall the main conclusion of the Environmental Impact Statement from the Proponent is stated as ldquohellipafter the implementation of mitigation hellipthe Project is not expected to result in any significant adverse effects on any of the 16 valued componentsrdquo38 In addition ldquohellipapproximately 40 of the functional groups are forecast to change no more than 5 which hellip is judged to be within the uncertainty of the model runsrdquo39 although larger changes were forecast for orange sea pens freshwater biofilm green algae and raptors The conclusions from the modelling studies are that ldquohellipthe proposed project will have an impact on the study area that the effect varies between species and that the findings are robust to parameter uncertaintyrdquo40 Specific outcomes by valued component as derived from the EwE model are presented by functional groups in Table 1
38 PMV March 2015 Roberts Bank Environmental Impact Statement Executive Summary ndash Part 1 page 37 39 EIS Appendix 10-C p ii 40 EIS Appendix 10-D p iv
Pacific Region Science Response Technical Review Assessing
Ecosystem Productivity Model of Roberts Bank
18
Table 1 Changes in productive potential with the Project as derived from the EwE model
Changes in productive potential
Ecosystem category
Number of valued
components
Number with potential
biomass loss
Moderate decrease (31-60 decline)
Minor decrease (6-30 decline)
Negligible (0-5
change)
Minor increase (6-
30 increase)
Moderate increase (31-60 increase)
Source
Marine vegetation
7 7 - 3 2 2 - EIS Vol 3 Section 11 Table 11-17 page 11-65
Marine invertebrates
4 3 1 1 1 1 - EIS Vol 3 Section 12 Table 12-8 page 12-52
Marine fish 13 13 - 2 6 5 - EIS Vol 3 Section 13 Table 13-10 page 13-95
Coastal birds
11 8 - 3 4 3 1 EIS Vol 3 Section 15 Table 15-10 page 15-67
Pacific Region Science Response Technical Review Assessing
Ecosystem Productivity Model of Roberts Bank
19
Most functional groups showed some potential biomass loss with the Project with biomass loss defined as any model run with negative outcomes (ie in which biomass with the project was less than biomass without the Project) The summary of changes in productivity potential are mixed with most (33 out of 35) valued components showing minor decreases to minor increases (defined as 6 to 30 changes in productive potential with the Project compared to without the Project)
The main conclusions of this review in regards to the Terms of Reference are
1 Do the functional groups and abiotic variables used in the model adequately represent the ecosystem at Roberts Bank
o The 58 functional groups and abiotic variables used in the model adequately represent the main components of the Roberts Bank ecosystem however for longer lived species the life stages of the species are not well represented and some of the impacts of the Project may be expected to affect specific life stages
o The abiotic variables adequately represent the physical drivers of this ecosystem on an annual time scale However annual values for these abiotic variables may not adequately capture important sub-annual events such as storms (DFO 2016) the timing of arrival and departure of highly migratory species and whether there may be important sub-annual thresholds or mismatches in timing as a result of the Project
o Biotic factors (eg nutrients) which are particularly important for biofilm and other lower trophic level taxa are not included in this model The model is therefore unable to assess the potential development of eutrophication and benthic organic enrichment events which may affect fish habitats in the study area
2 Are the parameter estimates used by the model valid and defensible for this system
o In general parameter estimates appear to be adequate for this system Field studies were done in two years to provide data in particular on distributions of selected functional groups for the Ecospace module Note the distribution studies focussed on taxa which were relatively immobile and therefore lsquofixedrsquo in space
o the selection of some model parameters would benefit from further explanation for example the choice of fixed diet matrices versus dynamic matrices which can vary with changes in abundances or predators and prey
o the selection of some model parameters would benefit from further explanation for example the link between the diets described in the text of Appendix 10B and the quantities presented in Appendix A of Appendix 10B It is understood that proportions were derived using the ldquofixed selectivityrdquo principle but in order to be fully transparent the derivation of each diet should be provided in an appendix
o discussion and explanation is needed of why ecotrophic efficiencies differ from expected values (eg the ecotrophic efficiency for Pacific herring is listed as 038) and
o the abiotic factor lsquosubstratersquo was limited to ldquohardrdquo or rdquosoftrdquo options which can be restrictive given that they serve as endpoints on a substrate composition continuum These limited options may not provide the sensitivity required to assess substrate preference nor the flexibility for taxa (eg motile organisms) that span hard mixed and soft substrate types In addition it is not clear if changes in the hardsoft categories were considered over time within identified depositional or erosional settings before and after construction
Pacific Region Science Response Technical Review Assessing
Ecosystem Productivity Model of Roberts Bank
20
3 Are the limitations and uncertainties of the model identified and appropriately considered when determining the modelrsquos representation of current and possible future conditions
o the EwE model was not designed to evaluate a range of future conditions It was designed to estimate changes in the productive potential at the ecosystem level with and without the Project Therefore the model was run without the Project and with the Project for a range of plausible abiotic conditions and the results were compared with respect to biomass and productivity by functional group
o the pedigree approach to assessing the uncertainties of model outcomes is unsatisfactory for the purpose here as it relates solely to a qualitative judgment of the value of data based on its source However when the model was rerun with much wider ranges of confidence intervals (uncertainties) the results in general (but not necessarily for each functional group) were similar to the results using the original pedigree approach This suggests that taken overall the model may be robust to wide ranges of uncertainty in these input variables and parameters
o there is inadequate validation of the model This is inadequate for three reasons
(i) the basic Ecopath model is not validated and the Ecospace balancing process (the spin-up period) resulted in some biomass estimates being increased or decreased beyond their confidence limits
(ii) the goodness of fit test used to evaluate how well the model predicted the spatial occurrence functional groups is not fit for purpose (Section 34) and
(iii) validation was provided for only a small number of functional groups (the habitat-forming functional groups) As a consequence the model is currently not validated
o Considering the proportion of open boundaries relative to closed boundaries in the model processes taking place outside the modelled ecosystem are likely to contribute to dynamics within the modelled ecosystem However these external processes may not be well-resolved by the EwE model as currently configured
4 Are the model results related to the potential effects of the Project on fish and fish habitat and migratory birds and their food resources valid and defensible
o this is a very complex ecosystem model constructed for a relatively small and open (in the sense of considerable exchange with adjacent non-modelled areas) system Many assumptions have been made based on poor or missing data Taking all these considerations into account the model does the best job possible of comparing the biomass and productivity of the Roberts Bank ecosystem with and without the Project
o the extent to which the model adequately represents the lsquorealrsquo ecosystem of Roberts Bank as opposed to comparisons of model results with and without the Project is unclear as a number of basic diagnostics are not presented (see point 3 above)
o the EwE model is not capable of and is not designed to represent nutritional and food quality variations in prey functional groups and how these may impact highly migratory predators such as birds with and without the Project
5 Is the EwE model framework a valid method to quantify large scale impacts to fish habitat fish productivity and migratory bird productivity
o the EwE model as implemented in this project and reviewed here is a useful first-order framework to organise information and derive initial estimates of how the system may respond to perturbations
Pacific Region Science Response Technical Review Assessing
Ecosystem Productivity Model of Roberts Bank
21
o the utility of a EWE model for impact purposes is highly dependent on the quality of input data
o each EwE model is highly dependent on local conditions Although appropriate as an overall methodology each application would need to be reviewed for how it may be applied to any new ecosystem and
o the EwE model would need to be substantially reformulated if it was to include considerations of changes in chemical composition or food quality of prey in particular for seasonal migratory species such as birds which may depend on very large biomasses of prey with specific chemical composition to fuel their migrations beyond the ecosystem model boundaries
Contributors Contributor Affiliation Ian Perry Author DFO Science Pacific Region Alida Bundy Author DFO Science Maritimes Region Terri Sutherland Author DFO Science Pacific Region Robert Elner Author ECCC Canadian Wildlife Service Andrew Robinson Author ECCC Canadian Wildlife Service Lesley MacDougall Editor DFO Science Pacific Region
Approved by Carmel Lowe
Regional Director Science Branch Pacific Region Fisheries and Oceans Canada
November 4 2016
Sources of Information Christensen V Coll M Steenbeek J Buszowski J Chagaris D walters CJ 2014
Representing variable habitat quality in a spatial food web model Ecosystems 17 1397-1412
Christensen V and Walters C 2000 Ecopath with Ecosim methods capabilities and limitations Ecological Modelling 172 109-139
Colleacuteter M Valls A Guitton J Gascuel D Pauly D and Christensen V 2015 Global overview of the applications of the Ecopath with Ecosim modeling approach using the EcoBase models repository Ecological Modelling 302 pp42-53
Compass Resource Management Ltd 2013 Roberts Bank Terminal 2 Technical Advisory Group (TAG) Process Report Productive Capacity ndash Final Report 119pp (Accessed November 1 2016)
DFO 2016 Technical Review of Roberts Bank Terminal 2 Environmental Assessment Section 95 ndash Coastal Geomorphology DFO Can Sci Advis Sec Sci Resp 2016045 (Accessed November 4 2016)
Pacific Region Science Response Technical Review Assessing
Ecosystem Productivity Model of Roberts Bank
22
ESSA Technologies 2014a Roberts Bank Terminal 2 Project Roberts Bank Delta BC Environmental Impact Statement Volume 3 Biophysical Effects Assessments Appendix 10-C Roberts Bank Ecosystem Model Development and Key Run Port Metro Vancouver (Accessed November 1 2016)
ESSA Technologies 2014b Roberts Bank Terminal 2 Project Roberts Bank Delta BC Environmental Impact Statement Volume 3 Biophysical Effects Assessments Appendix 10-D Roberts Bank Ecosystem Model Sensitivity Analyses Port Metro Vancouver (Accessed November 1 2016)
Franklin J 2009 Mapping Species Distributions Spatial Inference and Prediction Cambridge University Press Cambridge
Hemmera 2014 Roberts Bank Terminal 2 Project Roberts Bank Delta BC Environmental Impact Statement Volume 3 Biophysical Effects Assessments Appendix 10-B Roberts Bank Ecosystem Model Parameter Estimates Port Metro Vancouver File 302-03503 (Accessed November 1 2016)
Port Metro Vancouver 2015a Roberts Bank Terminal 2 Project Roberts Bank Delta BC Environmental Impact Statement Volume 3 Biophysical Effects Assessments Section 100 Biophysical Setting (Accessed November 1 2016)
Port Metro Vancouver 2015b Roberts Bank Terminal 2 Project Roberts Bank Delta BC Environmental Impact Statement Volume 3 Biophysical Effects Assessments Section 103 Overview of Assessing Ecosystem Productivity (Accessed November 1 2016)
Port Metro Vancouver 2015c Roberts Bank Terminal 2 Project Environmental Assessment Additional Information Requirements (July 31 2015) Responses Response to Information Request 6 IR-73115-06 Canadian Environmental Assessment Agency Reference Number 80054 dated 26 October 2015
Steenbeek J Coll M Gurney L Meacutelin F Hoepffner N Buszowski J and Christensen V 2013 Bridging the gap between ecosystem modeling tools and geographic information systems Driving a food web model with external spatialndashtemporal data Ecological Modelling 263 139ndash 151
Sutherland T Elner R and OrsquoNeill J 2013 Roberts Bank Ecological crucible of the Fraser River estuary Progress in Oceanography 115 171ndash180
Vancouver Fraser Port Authority 2016 From the Vancouver Fraser Port Authority to the Review Panel re Answers to preliminary technical questions submitted during the completeness phase from Fisheries and Oceans Canada Natural Resources Canada and Environment and Climate Change Canada concerning the ecosystem modelling to support the Roberts Bank Terminal 2 Project environmental review CEAR Document 547 (Accessed November 1 2016)
Pacific Region Science Response Technical Review Assessing
Ecosystem Productivity Model of Roberts Bank
23
This Report is Available from the Centre for Science Advice
Pacific Region Fisheries and Oceans Canada
3190 Hammond Bay Road Nanaimo BC V9T 6N7
Telephone (250) 756-7208 E-Mail csapdfo-mpogcca
Internet address wwwdfo-mpogccacsas-sccs
ISSN 1919-3769 copy Her Majesty the Queen in Right of Canada 2016
Correct Citation for this Publication
DFO 2016 Technical review of Roberts Bank Terminal 2 environmental assessment section 103 ndash assessing ecosystem productivity DFO Can Sci Advis Sec Sci Resp 2016050
Aussi disponible en franccedilais
MPO 2016 Examen technique de leacutevaluation environnementale du Terminal 2 agrave Roberts Bank section 103 ndash eacutevaluation de la productiviteacute de leacutecosystegraveme Secr can de consult sci du MPO Reacutep des Sci 2016050
- TECHNICAL REVIEW OF ROBERTS BANK TERMINAL 2 ENVIRONMENTAL ASSESSMENT SECTION 103 ndash ASSESSING ECOSYSTEM PRODUCTIVITY
-
- 10 Context
- 20 Background
-
- 21 Background and Terms of Reference
- 22 Approach to assessing ecosystem productivity
-
- 30 Analysis and Response
-
- 31 The EwE Team
- 32 Overview of assessment results of hydrological and sediment modelling
- 33 Model implementation
-
- 331 The purpose of the EwE model
- 332 Applicability of the EwE model framework to the Roberts Bank region
- 333 Model documentation
- 334 Highly mobile functional groups
- 335 Seasonality (model time step)
- 336 Life history structure
- 337 Model balancing
-
- 34 Model validation
- 35 Model results
-
- 351 Presentation of model results
- 352 Sensitivity and vulnerability analyses
-
- 40 Conclusions
- Contributors
- Approved by
- Sources of Information
- This Report is Available from the
-
- CSAS 2016-50 - Assessing Ecosystem Productivitypdf
-
- TECHNICAL REVIEW OF ROBERTS BANK TERMINAL 2 ENVIRONMENTAL ASSESSMENT SECTION 103 ndash ASSESSING ECOSYSTEM PRODUCTIVITY
-
- 10 Context
- 20 Background
-
- 21 Background and Terms of Reference
- 22 Approach to assessing ecosystem productivity
-
- 30 Analysis and Response
-
- 31 The EwE Team
- 32 Overview of assessment results of hydrological and sediment modelling
- 33 Model implementation
-
- 331 The purpose of the EwE model
- 332 Applicability of the EwE model framework to the Roberts Bank region
- 333 Model documentation
- 334 Highly mobile functional groups
- 335 Seasonality (model time step)
- 336 Life history structure
- 337 Model balancing
-
- 34 Model validation
- 35 Model results
-
- 351 Presentation of model results
- 352 Sensitivity and vulnerability analyses
-
- 40 Conclusions
- Contributors
- Approved by
- Sources of Information
- This Report is Available from the
-
Canadian Science Advisory Secretariat Pacific Region Science Response 2016050
December 2016
TECHNICAL REVIEW OF ROBERTS BANK TERMINAL 2 ENVIRONMENTAL ASSESSMENT SECTION 103 ndash
ASSESSING ECOSYSTEM PRODUCTIVITY
10 Context Vancouver Fraser Port Authority (VFPA) formerly Port Metro Vancouver (the Proponent) is proposing to construct and operate the Roberts Bank Terminal 2 Project (the Project) a new three-berth marine container terminal at Roberts Bank in Delta British Columbia The proposed terminal is located next to the existing Deltaport and Westshore Terminals In addition to the construction of the new terminal the Proponent has proposed to widen the north side of the existing Roberts Bank causeway from its east-end connection with the mainland to the entrance to the new terminal The existing tug basin connected to the northeast side of Deltaport Terminal is also proposed to be expanded The new marine terminal is predicted by the Proponent to process up to 260 container ship calls per year at full capacity with the assistance of two or three large berthing or escort tugs to manoeuver ships into or away from assigned berths The terminal is designed to operate 24 hours per day year-round
The Roberts Bank Terminal 2 Project is subject to an environmental assessment by a Review Panel pursuant to the Canadian Environmental Assessment Act 2012 As a federal authority in the environmental assessment for the Project Fisheries and Oceans Canada (DFO) will be asked to present information to the review panel and at public hearings in relation to its expertise on the effects of the Project on fish and fish habitat including aquatic species at risk and the adequacy of mitigation and offsetting measures and monitoring and follow-up programs proposed by the Proponent DFOrsquos Pacific Region Fisheries Protection Program (FPP) will coordinate DFOrsquos participation in the environmental assessment
The Proponent assessed future ecosystem productivity at Roberts Bank using the Ecopath with Ecosim and Ecospace (EwE) model framework The potential impacts of the Project to hydrodynamic conditions and sediment transport in the area as a result of changes in wind wave and current patterns and intensities are projected using different model frameworks A companion Science Response (DFO 2016) has been developed by DFO and Natural Resource Canada (NRCan) to review Section 95 ldquoCoastal Geomorphologyrdquo of the Environmental Impact Statement (EIS) which describes the hydrodynamic and sedimentology models that were used to evaluate the effect of the Project on water and sediment movements
Outcomes of the EwE models are incorporated into the analysis of the potential project-related effects on the ongoing productivity of commercial recreational and Aboriginal fisheries Consequently DFO FPP has requested that DFO Science Branch provide an evaluation of the Proponentrsquos characterization of project-related effects as conducted using the Ecopath with Ecosim and Ecospace (EwE) ecosystem model
Pacific Region Science Response Technical Review Assessing
Ecosystem Productivity Model of Roberts Bank
2
The objectives for this Science Response are to
1 Determine if the functional groups and abiotic factors used in the model adequately represent the ecosystem at Roberts Bank
2 Assess whether the parameter estimates used by the model are valid and defensible for this system
3 Assess whether the limitations and uncertainties of the model are identified and appropriately considered when determining the modelrsquos representation of current and possible future conditions
4 Provide advice regarding whether the model results related to the potential effects of the Project on fish and fish habitat and migratory birds and their food resources are valid and defensible
5 If possible provide advice regarding the validity of using the EwE model framework to quantify large scale impacts to fish habitat and fisheries productivity and the productivity of migratory birds
This Science Response evaluates Section 100 ldquoBiophysical Settingrdquo with a focus on Section 103 ldquoOverview of Assessing Ecosystem Productivityrdquo in the EIS as submitted by the Proponent (Port Metro Vancouver 2015) This Section and consequently this Response describes the ecosystem modelling approach that was taken to evaluate the direct and indirect effects of the footprint of the proposed terminal and widened causeway herein referred to as lsquothe Projectrsquo This ecosystem model provides outputs related to potential effects of the project on the study area at an ecosystem level including aquatic species and bird species in the Project area Evaluation of the model and its outputs therefore required expertise in both fishery aquatic species and migratory bird species Consequently this Science Response is the product of a joint review between DFO and Environment and Climate Change Canada (ECCC) Canadian Wildlife Service and Wildlife and Landscape Science to provide a complete evaluation
This Science Response Report results from the Science Response Process of July 2016 on the Technical Review of Ecopath with Ecosim and Ecospace (EwE) Ecosystem Productivity Model application to the Roberts Bank Terminal 2 Environmental Assessment
20 Background
21 Background and Terms of Reference The Projectrsquos main components have a proposed combined marine footprint area of approximately 179 km2 listed below by specific component
bull Marine Terminal 1335 km 2 including terminal (116 km 2) and dredged berth pocket and marine approach areas (0174 km 2)
bull Widened Causeway 0424 km 2
bull Expanded Tug basin 0031 km 2
Roberts Bank in the Fraser River estuary consists of complex intertidal and subtidal habitats including intertidal eelgrass beds and is an important stopover area for migrating shorebirds and productive feeding and rearing habitats for many fish and invertebrate species It also provides habitat for endangered Southern Resident Killer Whales and other marine mammals
Pacific Region Science Response Technical Review Assessing
Ecosystem Productivity Model of Roberts Bank
3
The environmental conditions at Roberts Bank are dynamic and are influenced by a variety of oceanographic and atmospheric factors including the Fraser River freshwater and sediment plume discharge diurnal tidal currents and prevailing and storm-generated wind and wave activity In addition the intercauseway region provides significant drainage from marsh and agricultural areas which have different characteristics from marine waters and which run along the ferry causeway
To provide the required science advice this Science Response focusses on Section 10 ldquoBiophysical Settingrdquo of the Environmental Impact Statement (EIS) (Port Metro Vancouver 2015a) specifically Section 103 ldquoOverview of Assessing Ecosystem Productivityrdquo (Port Metro Vancouver 2015b) and its related Appendices 10-B ldquoRoberts Bank Ecopath with Ecosim and Ecospace model parameter estimatesrdquo (Hemmera 2014) Appendix 10-C ldquoRoberts Bank Ecosystem model development and key runsrdquo(ESSA Technologies 2014a) and Appendix 10-D ldquoRoberts Bank Ecosystem model sensitivity analysesrdquo (ESSA Technologies 2014b) Additional important information was obtained from the Response to Information Request 6 (IR-73115-06 Canadian Environmental Assessment Agency Reference Number 80054 dated 26 October 2015) (Port Metro Vancouver 2015c) and the Written Responses to Coastal Geomorphology and Ecosystem Modelling Questions provided by the Proponent to DFO ECCC and NRCan on 2 March 2016 (Port Metro Vancouver (PMV) Transmittal TRE-01-RBT2-0004A subsequently referred in this Science Response as ldquoPMV Response 2016-03-02rdquo) (Vancouver Fraser Port Authority 2016)
The process followed in preparing this Science Response involved an initial review of the submitted EIS followed by an in-person meeting of the Proponent its contractors and representatives of DFO ECCC and NRCan to discuss and clarify questions arising from the initial review (Vancouver 23 November 2015) DFO and NRCan provided written questions to the Proponent based on preliminary review of the EIS on November 19 2015 ECCC also provided written questions based on its preliminary review of the EIS to the Proponent on December 1 2015 and January 20 2016 This large initial meeting was followed by smaller focussed meetings between the Proponent its contractors and DFO and NRCan on 11 December 2015 to clarify hydrology and sediment modelling questions with DFO on 8 January 2016 to clarify ecosystem modelling questions and with ECCC on 18 February 2016 to clarify questions relating to birds Written responses to all of these meetings and questions were provided by the Proponent to DFO ECCC and NRCan as the ldquoPMV Response 2016-03-02rdquo and ldquoPMV Response 2016-05-30rdquo (Vancouver Fraser Port Authority 2016) VFPArsquos answers to questions posed by DFO and NRCan regarding coastal geomorphology modelling have been posted to the Canadian Environmental Assessment Registry (CEAR)
22 Approach to assessing ecosystem productivity The Proponent adopted an ecosystem approach to evaluate the direct and indirect effects of the Project on the productivity of the Roberts Bank ecosystem A weight of evidence approach was used to assess the potential effects of the project on the productivity of the ecosystem and selected key components in the study area this approach included a spatial ecosystem simulation model (which included a habitat capacity model) a shorebird opportunity model and empirical data An important point is that any effects on the system during the construction phase or from expansion of the tug basin were excluded from this modelling process the focus instead being a comparison of modelled system productivity before and after the proposed terminal and expanded causeway is in place The chosen ecosystem simulation model was
Pacific Region Science Response Technical Review Assessing
Ecosystem Productivity Model of Roberts Bank
4
Ecopath with Ecosim and its spatial version Ecospace (collectively referred to here as the EwE framework or EwE model) This modelling approach was recommended by a prior Productive Capacity Technical Advisory Group comprised of representatives of technical experts from government agencies academia non-governmental organizations Vancouver Fraser Port Authority and its consultants (Compass 2013) convened by the Proponent and which also recommended a selection of focal species for the model The final selection of functional groups and the resulting food web that form the core of this ecosystem model are shown in Figure 1
Pacific Region Science Response Technical Review Assessing
Ecosystem Productivity Model of Roberts Bank
5
Figure 1 Ecopath with Ecosim model food web for Roberts Bank (Adapted from EIS Volume 3 Section 10 Fig 1033 on page 10-16) The groups coloured in orange represent focal groups size of symbols represents relative annual amount of biomass in the Roberts Bank study area
Pacific Region Science Response Technical Review Assessing
Ecosystem Productivity Model of Roberts Bank
6
The EwE framework is a common approach to ecosystem modelling which has been developed and expanded over the past two to three decades It currently has three main components
1 Ecopath ndash the core model which provides a mass-balance snapshot of the system
2 Ecosim ndash a module that enables simulation modelling over time
3 Ecospace ndash a module that enables simulation modelling over space
In order to make an EwE model tractable species are aggregated into functional groups based on their similar ecological characteristics (habitat and prey preferences etc) the Roberts Bank models had 58 functional groups The first step (Ecopath) was to obtain input parameters representing biomass production consumption emigration and diet for each functional group These parameters were then tuned in an iterative process until the overall production and consumption was balanced (a mass-balance approach) resulting in a model food web with estimates of energy flow between functional groups (Fig 1)
In the second step Ecosim was combined with the spatial model Ecospace The abiotic variables selected in this EIS (depth salinity bottom current wave height sediment type) were used as external forcings to the Ecospace module These abiotic variables provided the physical forcings for the simulations without and with the Project Since time series data on the functional groups of the model were not available Ecospace was run until the model reached equilibrium using various assumptions of the value of the vulnerability parameter (see Section 352) In this EIS the selected time step was annual with all variables abiotic and biotic expressed as yearly averages As used in this EIS the Ecospace module included a habitat capacity model which estimated the distribution of functional groups based on their environmental preferences for each abiotic variable (depth salinity bottom current wave height) and for substrate type (sand mud etc) The model thus allocated the spatial distribution of functional groups over the model domain based on their environmental preferences and the distributions of these abiotic variables with and without the Project The selected spatial unit size (ldquopixelrdquo) for the Ecospace model was 100 m2 In essence an Ecopath model was constructed for each pixel with particular rules governing how the functional groups interacted and moved among these spatial units The Ecospace module was run until it approached equilibrium (20 model years) to establish the spatial patterns without the Project For the lsquowith the Projectrsquo simulations the model was run for an initial 10 years and then the spatial patterns of the abiotic variables with the project were added and the model run for an additional 10 years1 The model outputs predicted changes in the productive potential of the Roberts Bank ecosystem as a comparison (ratio) with and without the Project rather than an absolute biomass that would be lost or gained as a result of the Project
1 EIS Appendix 10-C p 26
Pacific Region Science Response Technical Review Assessing
Ecosystem Productivity Model of Roberts Bank
7
30 Analysis and Response To prepare this response the following sections of the EIS additional documents were reviewed
DocumentSection Title
EIS Section 10
Including appendices 10B 10C and 10D
(Port Metro Vancouver 2015a Hemmera 2014 ESSA Technologies 2014a ESSA Technologies 2014b)
Biophysical Setting
Appendix 10-B Roberts Bank Ecosystem Model Parameter Estimates Port Metro Vancouver File 302-03503
Appendix 10-C Roberts Bank Ecosystem Model Development and Key Run Port Metro Vancouver
Appendix 10-D Roberts Bank Ecosystem Model Sensitivity Analyses Port Metro Vancouver
CEAR document 547 (Including Appendices) ldquoPMV Response 2016-03-02rdquo and ldquoPMV Response 2016-05-30rdquo
(Vancouver Fraser Port Authority 2016)
Vancouver Fraser Port Authority to the Review Panel re Answers to preliminary technical questions submitted during the completeness phase from Fisheries and Oceans Canada Natural Resources Canada and Environment and Climate Change Canada concerning the ecosystem modelling to support the Roberts Bank Terminal 2 Project environmental review
31 The EwE Team Building this ecosystem model was a complex undertaking which required knowledge of the ecosystem to be modelled how to set initial parameter values determination of reasonable ranges of these parameters how to balance the model and how to recognize when the model outputs were unrealistic These tasks became even more complex when spatial model dynamics were involved such as with Ecospace The team engaged by the Proponent to conduct this ecosystem modelling for the Roberts Bank Terminal 2 (RBT2) EIS was led by scientists at the Institute for Oceans and Fisheries located at the University of British Columbia in Vancouver These scientists are global leaders of the EwE model framework having developed much of its current implementation and who continue to lead its elaborations and extensions Construction and running of the model for this specific ecosystem was done in collaboration with ESSA Technologies of Vancouver Parameter values for the ecosystem model were obtained in part from observational studies conducted in the area by Hemmera of Burnaby BC
32 Overview of assessment results of hydrological and sediment modelling Implementation of the ldquowith the Projectrdquo simulations of the ecosystem model was done by driving the model with the abiotic variables as they were projected to be distributed with the Project footprint In the context of this EIS specifying depth salinity bottom currents wave height and sediment type conditions without the Project and changes with the Project were achieved by construction of hydrodynamical and sediment transport models The outputs from these models in combination with the identified environment preferences for the various biological groups were then used as inputs to the Ecospace model to define the spatial
Pacific Region Science Response Technical Review Assessing
Ecosystem Productivity Model of Roberts Bank
8
distributions of these functional groups The implementation of these hydrological and sediment transport models in this EIS was reviewed by DFO and NRCan (DFO 2016) This review concluded that the implementation of these models for this EIS was adequate for average winter conditions but lacking in validation for summer conditions in particular with strong freshwater flows from the Fraser River Simulations of strong storm events and their impacts on wave conditions and sediment transport were also lacking The effect of wave action and current speeds on sediment transport is non-linear such that increasing winds over short periods of time can impact sediment transport processes bottom topography and water depths beyond that determined under average model conditions Overall the review concluded that a greater range of sensitivity analyses is required to have confidence in the model outputs under lsquonon-averagersquo conditions The implication of this conclusion for the present review of the EwE model is that the full range of variability of abiotic characteristics such as bottom topography bottom current and wave heights and how they may affect relevant functional groups in the model with the Project may not be adequately represented Sensitivity analyses were provided by varying the intensity of abiotic variables and by removing abiotic variables to assess their interactive effects In general the ecosystem model outputs were robust to these sensitivity analyses with most groups varying by less than 5 Larger changes however were observed for primary producer and bird groupings and for some fish groups when various abiotic variables were omitted2
33 Model implementation 331 The purpose of the EwE model
The EwE model was intended to provide one line of evidence to assess the potential impacts of the Project on the Roberts Bank ecosystem which would then be used with other lines of evidence to make the final assessment Specifically ldquohellip the objective of the RB [Roberts Bank] model was not to provide an assessment of Project impacts for each functional group at a fine temporal scale but to estimate changes in productive potential with and without the Project at the ecosystem levelrdquo3 In addition ldquohellipthe primary objective of the RB ecosystem model is to evaluate potential changes in productivity from such abiotic factors with and without the terminal and causewayrdquo4 Results are presented for the selected functional groups no results were presented on potential changes in ecosystem structure or function
332 Applicability of the EwE model framework to the Roberts Bank region EwE models work best when the exchanges within the system being modelled are greater than the exchanges between the modelled system and the lsquooutsidersquo world In practice this means that EwE models work best for larger systems with few external exchanges In a meta-analysis of 433 Ecopath models Colleacuteter et al (2015) concluded that ldquohellipin the last two decades the range of the models area has expanded toward very large areas and the median has shifted accordingly from about 1000 km2 in 1984ndash1993 to about 100000 km2 in 1994ndash2014rdquo The section of the Roberts Bank ecosystem that is included in the EwE model was comparatively small (5468 km2) and complex It is an intertidally-dominated environment that is subject to strong seasonal influences of both freshwater and marine exchanges across relatively large seaward and shoreward boundaries
2 EIS Appendix 10-D p ii - iii 3 PMV Response 2016-03-02 p 99 lines 1914-1917 4 PMV Response 2016-03-02 p 38 lines 689-691
Pacific Region Science Response Technical Review Assessing
Ecosystem Productivity Model of Roberts Bank
9
Processes taking place outside the modelled ecosystem will contribute to dynamics within the modelled ecosystem (eg lsquooutsidersquo food supporting predators which occur in the Roberts Bank ecosystem for only part of the year predators which may feed in the Roberts Bank ecosystem but export this energy when they migrate out of the region) but which may not be well-resolved by the EwE model The Proponent justifies the spatial scale because it was specifically chosen for the questions being asked in regard to assessing productivity changes and because the relative influences of external exchanges are assumed to be identical with and without the project In addition highly mobile species with broad prey bases were assumed in the model to be partially sustained by external energy from outside the model system5 The distributions of organisms may differ however with and without the project which may affect their interactions with areas outside of the modelled system and the use of diets from outside the modelled system may not reflect the impacts of the project Further clarification of how the EwE model captures the exchanges and interactions with adjacent ecosystems are needed For example it could be argued that an ecosystem which is open to frequent exchanges of water and organic matter from beyond its boundaries might be more robust to local disturbances such as the Project
There are some inconsistencies in the information and assumptions used for some of the taxa in this ecosystem model For Dungeness Crab the justification for estimating total adult biomass (including females) from the biomass of fished males is unclear In addition it is unclear if the slower growth of female crabs once they have reached sexual maturity in comparison with male crabs has been considered The diet matrix for spiny dogfish does not represent the actual diet well in particular of euphausiids herring and shrimp and there are more recent references for biomass estimates of spiny dogfish in the study area than what was used in the EIS
Fishing mortality was not included in the model under the assumption that this would not change with or without the project While this assumption may be true the model has been parameterized by ignoring a source of mortality that will influence total production In essence fishing removes biomass from the ecosystem with the result that less biomass will be available for higher trophic levels How this may impact the ecosystem with and without the Project is unclear but it could make noticeable differences if for example there were thresholds in the feeding responses by these higher trophic level species The Ecopath model that was used is relatively unconstrained since many ecological efficiencies are low even for forage species which would be expected to be higher It is not clear how many species are exploited or the levels of exploitation but even if this does not change with the Project these mortality rates should be included in the model in order to add realistic constraints to the exploited functional groups
333 Model documentation Based on questions from DFO ECCC and NRCan following their initial review of the EIS the Proponent provided written responses dated 2 March 2016 to clarify several of the steps in the model development and implementation However several questions remain including questions about the Ecospace module Ecospace has undergone several recent developments such as the inclusion of the spatial-temporal data layer framework (Steenbeek et al 2013) the habitat capacity model (Christensen et al 2014) and the Monte Carlo analysis including the diet matrix As yet there are few published studies using these latest Ecospace developments and their documentation and justification need to be improved in the EIS
5 PMV Response 2016-03-02 p 29 lines 446 - 464
Pacific Region Science Response Technical Review Assessing
Ecosystem Productivity Model of Roberts Bank
10
Questions also remain regarding how the Monte Carlo randomization routine treated diet data The report indicates that the Monte Carlo routine randomly selected input parameters from the input ranges and that only models that were balanced were used This suggests that a high proportion of models were not balanced and therefore were not used (for example the EIS indicates that about one out of 1000 sampled input parameters was balanced6) A table showing the minimum maximum mode average and median values from the Monte Carlo runs for all the parameters would enable an evaluation of how much variation was actually sampled by the balanced model runs This is recommended in the EwE user information ie ldquoUsers should check the range of the input parameters that were actually used in the trials in the output csv file (see below)rdquo7
In addition there are several issues with the documentation of the derivation of the parameters for the functional groups Such documentation should clearly outline how the input parameter was estimated and the range of uncertainty for that parameter For example the input biomass of pinnipeds was defined as 04 t km 2 derived from estimates of 034 for Harbour seals and two estimates for Steller sea lions (012 and 014 t km 2) No explanation was provided for how the overall estimated pinniped biomass of 04 t km 2 was determined The diet of Sand Lance was described in the EIS as consisting mostly of zooplankton8 whereas the diet table for the model runs9 included 20 macrofauna 10 green algae and 10 detritus It is unclear why these additional prey were included in the diet used for the model runs
334 Highly mobile functional groups This implementation of the EwE framework included transient and migratory functional groups This is entirely appropriate and these groups cannot be excluded The approach taken in the Ecospace module was to impose a low (and conservative) dispersal rate among model spatial units (lsquopixelsrsquo) of 1 km yr-1 This may be appropriate for low mobility benthic organisms but it likely underestimates the movements of many other functional groups The effects of using higher and perhaps functional-group-specific dispersal rates was not considered The Proponents argued that higher dispersal rates would reduce impacts since species can move away from less desirable areas more quickly for completeness these runs should be done and evaluated Mobile species will also bring energy (food) captured outside the system into the modelled ecosystem This process was included in the model with the use of a diet import factor reflecting the consumption of prey outside the modelled region with the assumption that groups with high import rates were unlikely to respond to local changes on Roberts Bank10 This assumption needs justification perhaps at the functional group level for example many species of highly migratory birds and Pacific salmon use the Roberts Bank ecosystem to obtain food to continue their migrations Although this food does not compose a large fraction of their annual consumption it can be critical to enable them to continue their migrations
The EwE model is not designed to capture differences in prey quality ie differences in essential fatty acid or nutrient ratios The same species of prey may have greater or lesser nutritional value to predators depending on the conditions under which they are growing and their seasonal variations This is a particular concern with the nutritional quality of the diatom-dominated biofilm Diatomaceous biofilm is important to the highly migratory Western Sandpiper (Calidris mauri) Despite its predictive merits in relation to other ecosystem
6 EIS Appendix 10D Section 24 p5 7 EwE Help file p 151 8 EIS Appendix 10B Section 4133 p 76 9 EIS Appendix A of Appendix 10B 10 PMV Response 2016-03-02 p 28 lines 429 - 436
Pacific Region Science Response Technical Review Assessing
Ecosystem Productivity Model of Roberts Bank
11
components the EwE model is not informative with respect to understanding the potential impacts of the Project on biofilm and the Western Sandpiper While this example is specific to seabirds the potential exists for differences in the quality of biofilm to also be an issue for copepods which feed on biofilm and consequently to juvenile salmon which feed on these copepods (eg Sutherland et al 2013)
The EwE model is also not designed to predict effects of the Project on water quality although the Proponent noted that ldquoOther abiotic factors not included were deemed to be representative of variables that were already included in the modelhelliprdquo11 The Project may cause changes in physical and water quality conditions whether in isolation or in combination which may impact the productivity or nutritional quality of key prey organisms for local and migratory species which will not be captured by the model The EwE model does not assess the production of key nutrients or the implications of changes in important physical and water quality parameters to biofilm community structure and hence to important migratory birds
The model does not include biotic factors for both pelagic and benthic environments to assess the potential development of eutrophication and benthic organic enrichment events respectively Organic and redox indicators traditional measures of environmental assessments that are used to determine changes in functional group responses were included in the recent Deltaport Third environmental assessment (ie Pelagic chlorophyll dissolved nutrients Benthic sediment carbonnitrogen content redox state [sulfide concentration]) Benthic anoxic events based on organic enrichment are known to be strong drivers of community composition and exclusion regardless of substrate type In the absence of biotic factors (eg organic particulates) the model has not considered the potential for benthic organic enrichment which coincides with siltation processes within the upper tidal flats The tidal flat corner bordered by the Delta-dyke and Deltaport causeway has served as a catchment area for Fraser River silt since the development of the original Deltaport causeway (Sutherland et al 2013) The proposed position of the new terminal placed at the seaward termination of the Deltaport causeway may produce a crescent-shaped feature in the wake of the Fraser River Plume This feature may provide a more efficient silt trap that will promote benthic organic enrichment This piece of the environmental assessment seems to be missing and is important for assessing fish habitat in this area
335 Seasonality (model time step) Input data to parameterize the model were available on a range of time scales from hourly (eg physical data on salinity and water flow) to annual (eg species biomass) The Proponents indicated12 that this is a strength of the EwE model although ultimately the model was run with an annual time step with all sub-annual values being averaged to annual values This method therefore did not incorporate important seasonal processes such as winter-summer differences in salinity and storm properties and the seasonal appearances of abundances of predators and prey such as migratory salmon and birds that are much larger than the annual average For example juvenile salmon migrate from the Fraser River and onto Roberts Bank in the spring before moving into deeper waters If these spring abundances are averaged over the entire year these average abundances would be 5-10 times lower than the actual abundances during the spring (ie averaging the biomass that occurs in two months over a 12 month period) Additionally this method did not capture the intensity of processes such as growth and predation which can be focused over periods of a few weeks to a few months There may be important threshold effects at particular times and places which may be missed when using an 11 EIS Section 10 p 10-11 12 PMV Response 2016-03-02 p 86 line 1655
Pacific Region Science Response Technical Review Assessing
Ecosystem Productivity Model of Roberts Bank
12
annual time step for the model The Ecospace module has a monthly time step13 and therefore it is feasible to run this module with a sub-annual time step For example the Proponents submit14 that there are inadequate data to model the potential effects of the Project on the timing of biofilm production which could have implications for the migratory dunlin and Western Sandpiper However this could be modelled in an exploratory way to determine hypotheses about which factors could affect the timing of production of biofilm and the potential impacts on these birds These issues are of major concern to ECCC
336 Life history structure The EwE model did not separate functional groups into life history stages (stanzas) yet for many functional groups the juvenile stages can have very different life history characteristics and habitats than the adults It is unclear in the description of the model how different life history structures were considered and whether for example there were enough juveniles to produce the adults The implications of not including early life stages should be explored at least qualitatively to identify which species might have life stages that may be more vulnerable to project effects
337 Model balancing Balancing an EwE model is the process by which parameters are adjusted so that there is sufficient production for consumption requirements ie there are sufficient prey for all predators Expert opinion was used to examine parameter values and to adjust for errors or inconsistencies in logic ldquoPMV is confident that since the approach taken to balance the model was based on best practices the steps are appropriaterdquo15 Adjustments to initial parameters to ensure an ecologically-feasible model are necessary and to be expected For a few functional groups however very large changes to initial parameter estimates (which were often not based on Roberts Bank specific data) were necessary for example to transient killer whales When such initial parameters were adjusted (often by substantial amounts) by expert opinion to balance the model the confidence intervals around these adjusted parameter values were not increased to reflect this added uncertainty (see for example PMV Response 2016-03-02 p 51 lines 955-956) When expert opinion was used to make very large changes to initial parameter values broader confidence intervals about these parameters should have been applied This does not appear to have been the case and as a consequence may cause the actual uncertainty of the model outputs to be underestimated
Another example is for the pinniped group in which 50 of the diet was assumed to come from outside the model area in order to balance the model The rationale provided was ldquoThe pinnipeds caused excessive predation mortalities on numerous fish functional groups The biomass of pinnipeds was an average for the Strait of Georgia which was likely too high for Roberts Bank Therefore it was assumed that pinnipeds extracted only half of their diet from the study areardquo16 It is unclear whether the sensitivity of the model to different percentages of diet allocation was explored
As noted above (332) the Ecopath model was relatively unconstrained and few adjustments to input parameters were required to balance the model This is unusual and the low ecotrophic efficiencies of several functional groups suggest that full accounting of energy flows may not have been achieved (an ecotrophic efficiency of 1 indicates that 100 of the production of that
13 EIS Appendix 10C Section 29 p24 14 EIS Appendix 10D Appendix C p72 15 PMV Response 2016-03-02 p 49 lines 910-912 16 EIS Appendix 10C Section 261 p 20
Pacific Region Science Response Technical Review Assessing
Ecosystem Productivity Model of Roberts Bank
13
particular group is being preyed upon or removed by fishing leaving no individuals to die of old age17) An ldquoexcessrdquo of individuals dying of old age ie ecotrophic efficiencies much less than 1 suggests a potentially large biomass that is not used by the ecosystem and instead is converted to detritus
34 Model validation Model validation is the process by which the model parameters variables and outputs are compared with those from the real ecosystem to ascertain how well the model represents the ecosystem It is an essential step in providing confidence that the projections from the model in this case with and without the Project have relevance to how the real ecosystem may be expected to function with and without the Project In practice validating complex ecosystem models is difficult considering the range of assumptions that must be made when building the model the limited available data and natural variability of the ecosystem at a variety of time and space scales
Many of the standard diagnostics for the Ecopath model have not been evaluated in the EIS The Proponent appears to have assumed that once the Ecopath model was balanced then it was valid and fit for purpose The Proponent should provide all the Ecopath estimates of vital rates including mortality rates As presented questions remain For example many Ecotrophic Efficiencies (which control the transfer of biomass from prey to predators) are less than 1 even for taxa which would be expected to be close to 1 such as carnivorous zooplankton The reason for Ecotrophic Efficiencies less than 1 were not discussed or explained in the EIS
Detailed diagnostics for the Ecospace model should also be presented in order to evaluate model performance In response to criticisms by DFO ECCC and NRCan in discussions with the Proponent the latter provided the biomass of the functional groups from the Ecopath model (before Ecospace) and the Ecospace model after the spin-up period (which involved adjusting the parameters from the Ecopath model to balance the 5468 separate cells of the Ecospace model)18 The Proponents argue that ldquoIt is important to note that changes in biomass values generated during the spin-up period are identical for both with and without Project scenarios and thus do not provide information on the potential Project-related effects on productivity19 However several changes to biomass result from the Ecospace balancing process (spin-up period) This is only given brief attention by the Proponent in its response to the DFO ECCC and NRCan questions An analysis of Table 620 revealed that the biomass of 9 functional groups was larger or smaller than the widest confidence limits allowed for each group21 This requires further discussion and justification
The Proponent used a goodness of fit measure to compare spatial distributions of model outputs with field observations They indicated that ldquono other EwE models were identified which use a goodness-of-fit measure Hence the RB model is potentially the first such EwE model where a goodness of fit measure has been appliedrdquo22 The chosen goodness of fit measure is the percent correct classification (PCC) method23 This method derives a test statistic based on the proportion of locations at which predicted occurrences from the model match observed
17 EIS Appendix 10-B p 11 18 PMV Response 2016-03-02 p 65-66 Table 6 19 PMV Response 2016-03-02 p 64 lines 1205-1207 20 PMV Response 2016-03-02 p 65-66 Table 6 21 PMV Response 2016-03-02 p 45 Table 3 22 PMV Response 2016-03-02 p 78 lines 1481-1483 23 PMV Response 2016-03-02 p 78 lines 1483-1484
Pacific Region Science Response Technical Review Assessing
Ecosystem Productivity Model of Roberts Bank
14
occurrences from data and similarly with predicted and observed absences The Proponent then calculated two additional accuracy of fit measures sensitivity (the model predicts a species to occur in an area where it is known to occur in reality) and specificity (the model predicts a species does not occur in an area it is known not to occur in reality)24 This analysis concluded that the model has high predictability for functional groups such as eelgrass and sea pens with relatively static distributions but lower predictability for functional groups which are more temporally and spatially dynamic such as biofilm and green algae25
There are two problems with this approach The first is that this goodness of fit comparison was done only for habitat-forming functional groups no discussion of how well this analysis applies to mobile functional groups was provided The second problem is that this method does not take into account situations (such as occurs in this study with several groups) in which species occur at only a few locations For example ldquohellipif the test data consist of 95 absences and 5 presences and this reflects the true prevalence of the species on the landscape (a realistic scenario for a rare species) a lsquonullrsquo model that predicted absence in all cases (eg no model at all) would be correct 95 of the timehellipldquo (Franklin 2009 p 151) This latter point is important here as these habitat functional groups (biofilm brown algae native eelgrass green algae Japanese eelgrass tidal marsh biomat and orange sea pens26) appear not to occur over most of the Project area (as portrayed by the model outputs presented in the distribution figures of PMV Response 2016-03-02 Appendix 218) It is therefore important that a robust evaluation of the performance of the Ecospace module is used with preferably more than one measure
In summary the starting point for this modelling analysis matters It is not just about a comparison between results with and without the Project The model has to be considered a sufficient representation of the ecosystem The Proponent has not yet sufficiently validated the model
35 Model results 351 Presentation of model results
As noted above (Section 331) the stated objective of the Roberts Bank ecosystem model was not to provide an assessment of Project impacts for each functional group at a fine temporal scale but to estimate changes in productive potential with and without the Project at the ecosystem level27 However results were presented as comparisons by speciesfunctional group with and without the Project and not as potential changes in total ecosystem productivity The revised figures for each functional group showing distributions without the Project with the Project and their difference indicated impacts were likely to be localized with overall impacts relatively small The range of biomass ratios with and without the Project was 045 ndash 189 with most values slightly less than 1 This is interpreted as indicating slight decreases in the capacity of the study area to support biomass and production with the Project for many functional groups28 (Figure 2)
24 PMV Response 2016-03-02 p 80 lines 1524-1527 25 PMV Response 2016-03-02 p 81 lines 1551-1559 26 PMV Response 2016-03-02 p 82 Table 8 27 PMV Response 2016-03-02 p 99 lines 1914-1917 28 PMV Response 2016-03-02 Appendix 218
Pacific Region Science Response Technical Review Assessing
Ecosystem Productivity Model of Roberts Bank
15
Biomass Ratio
Freq
uenc
y
04 07 10 13 16 19
05
1015
2025
30
Figure 2 Histogram of biomass ratios obtained by comparisons of model runs with and without the project (ie With Without) Values less than 1 indicate reductions in biomass with the Project compared against without the Project) Data from Appendix 218 of PMV Response 2016-03-02
352 Sensitivity and vulnerability analyses Every ecosystem model is only one possible representation of the true ecosystem defined by the modelrsquos structure and the values chosen for its many parameters The key point is how well the model represents the real system how that fit can be measured and the sensitivity of model outputs to variability in the selected parameter values The ideal model should be robust to a wide range of uncertainties in the input data and parameters This robustness is determined by performing sensitivity analyses on the model to see how it responds to variations in the input parameters and determining to which input parameters the model is most sensitive
The vulnerability parameters determine the strength of the feeding interactions between functional groups They set the level of density dependence of each functional group Higher vulnerability settings provide greater top-down (predator) control whereas lower settings provide greater bottom-up (environmental) control29 Several publications have shown that EwE models are very sensitive to the vulnerability parameters and Christensen and Walters (2000) point out that a main pitfall of EwE is that ldquopredation vulnerabilities are often underestimated lessening the modelled impacts of predationrdquo It is usual practice to tune Ecopath models including the vulnerability parameters to time series data such as biomass using the temporal simulation model Ecosim However these data were not available for the RBT2 area so this robust method of fitting the model and estimating vulnerability parameters was not possible Instead a vulnerability setting of 2 was used as the default value for the key model runs which is ldquocommon practice when time series data are not available and estimates of vulnerability in the
29 PMV Response 2016-03-02 p 70 lines 1318-1323
Pacific Region Science Response Technical Review Assessing
Ecosystem Productivity Model of Roberts Bank
16
model cannot be maderdquo30 with sensitivity analyses run for a range of 15 to 3 This narrow range was criticized by DFOECCC in initial discussions about the model with the Proponent The Proponent subsequently reran the model with a larger range of vulnerabilities31 (11 to 10) and concluded this broader vulnerability range produced similar results for the productivity ratio with and without the Project to those in the original EIS and that the EIS was more likely to overestimate than underestimate potential project effects32 The data in Table 7 of the PMV Response33 did indicate changes in productivity ratios ranging from 0 to 50 of the defined key run (which used a vulnerability setting of 2) However the Proponent changed all vulnerability settings to the same value ie all were 2 or all were 10 etc In reality the vulnerability parameters resulting from Ecosim models that are fitted to data as described above vary by functional group which was not explored here Therefore although the results suggest that the original choice of 2 for the default key run seemed reasonable the potential effects of variability in vulnerability settings was not fully explored
Sensitivity analyses are usually based on the range of uncertainty estimated for input data and parameters often called the confidence limits around the model parameters The EwE framework integrates many different data sources and parameters including values from the literature It can therefore be difficult to identify ldquoreasonablerdquo confidence limits when derived from such diverse data sources Standard practice in Ecopath models has been to develop a pedigree for each parameter with default values for uncertainty based on the nature of the source data For example parameter values based on high precision field observations of biomass within the model domain receive default confidence intervals of 10 whereas parameter values based on models developed for elsewhere or professional judgment receive confidence intervals of 8034 Sensitivity analyses are then run using parameter values selected from within these confidence intervals However if these default confidence intervals do not capture the full range of variability then the outputs are not informative of the variability in the lsquorealrsquo ecosystem Field observations were collected for many functional groups within the model domain in 2012 and 2013 as part of studies to support the RBT2 EIS Apparently the purpose of these observations was to document spatial variability (in part for the Ecospace model) and temporal variability (measurements at one location over time) and not to derive confidence intervals around the observations35
The reliance on the pedigree approach to derive confidence intervals for this Roberts Bank model was criticized by DFO ECCC and NRCan in discussions with the Proponent As a result the Proponent reran the model with much larger confidence intervals ranging from 30 to 100 depending on the input parameter and functional group36 The results from this new analysis using the broader confidence intervals were similar to those using the original pedigree approach The Proponent noted that ldquoWhile the production within each helliprun was very different there was little difference in the biomass ratio [with and without the Project] These results further demonstrate that even with a greater range in input values the influence of the Project on the Roberts Bank ecosystem is consistent among allhellipmodel runsrdquo37 This provides confidence that the model may be robust to uncertainty in its input parameters Two concerns
30 PMV Response 2016-03-02 p 70 lines 1321-1322 31 PMV Response 2016-03-02 p 71-74 32 PMV Response 2016-03-02 p 71 lines 1339-1341 33 PMV Response 2016-03-02 p 73 34 EIS Appendix 10-C Section 251 page 18 35 PMV Response 2016-03-02 p 42 lines 772-777 36 PMV Response 2016-03-02 p 44-47 37 PMV Response 2016-03-02 p 47 lines 855-858 and see also PMV Response 2016-03-02 Appendix 27-B
Pacific Region Science Response Technical Review Assessing
Ecosystem Productivity Model of Roberts Bank
17
remain however The quote above indicates that the production among the different model runs was very different although with little difference in the biomass ratios with and without the Project Since biomass is not the same as production it would be informative for understanding model performance and potential impacts to show these production differences This also relates to the point made in Section 34 regarding how well the model represents the real ecosystem and not just within-model comparisons with and without the Project The second question is more technical and relates to how the randomization (Monte Carlo or MC) routine that was used to create multiple model runs used the uncertainty about the diet data Diets are not currently included in the MC routine available to regular users of the Ecosim model how they were handled in this RBT2 model appears not to be explained
Finally the sensitivity analyses indicate that the uncertainty in the input parameters does not lead to much difference between model parameters with or without the project However this conclusion does not describe how the uncertainty in the input parameters affects understanding of the ecosystem
40 Conclusions Overall the main conclusion of the Environmental Impact Statement from the Proponent is stated as ldquohellipafter the implementation of mitigation hellipthe Project is not expected to result in any significant adverse effects on any of the 16 valued componentsrdquo38 In addition ldquohellipapproximately 40 of the functional groups are forecast to change no more than 5 which hellip is judged to be within the uncertainty of the model runsrdquo39 although larger changes were forecast for orange sea pens freshwater biofilm green algae and raptors The conclusions from the modelling studies are that ldquohellipthe proposed project will have an impact on the study area that the effect varies between species and that the findings are robust to parameter uncertaintyrdquo40 Specific outcomes by valued component as derived from the EwE model are presented by functional groups in Table 1
38 PMV March 2015 Roberts Bank Environmental Impact Statement Executive Summary ndash Part 1 page 37 39 EIS Appendix 10-C p ii 40 EIS Appendix 10-D p iv
Pacific Region Science Response Technical Review Assessing
Ecosystem Productivity Model of Roberts Bank
18
Table 1 Changes in productive potential with the Project as derived from the EwE model
Changes in productive potential
Ecosystem category
Number of valued
components
Number with potential
biomass loss
Moderate decrease (31-60 decline)
Minor decrease (6-30 decline)
Negligible (0-5
change)
Minor increase (6-
30 increase)
Moderate increase (31-60 increase)
Source
Marine vegetation
7 7 - 3 2 2 - EIS Vol 3 Section 11 Table 11-17 page 11-65
Marine invertebrates
4 3 1 1 1 1 - EIS Vol 3 Section 12 Table 12-8 page 12-52
Marine fish 13 13 - 2 6 5 - EIS Vol 3 Section 13 Table 13-10 page 13-95
Coastal birds
11 8 - 3 4 3 1 EIS Vol 3 Section 15 Table 15-10 page 15-67
Pacific Region Science Response Technical Review Assessing
Ecosystem Productivity Model of Roberts Bank
19
Most functional groups showed some potential biomass loss with the Project with biomass loss defined as any model run with negative outcomes (ie in which biomass with the project was less than biomass without the Project) The summary of changes in productivity potential are mixed with most (33 out of 35) valued components showing minor decreases to minor increases (defined as 6 to 30 changes in productive potential with the Project compared to without the Project)
The main conclusions of this review in regards to the Terms of Reference are
1 Do the functional groups and abiotic variables used in the model adequately represent the ecosystem at Roberts Bank
o The 58 functional groups and abiotic variables used in the model adequately represent the main components of the Roberts Bank ecosystem however for longer lived species the life stages of the species are not well represented and some of the impacts of the Project may be expected to affect specific life stages
o The abiotic variables adequately represent the physical drivers of this ecosystem on an annual time scale However annual values for these abiotic variables may not adequately capture important sub-annual events such as storms (DFO 2016) the timing of arrival and departure of highly migratory species and whether there may be important sub-annual thresholds or mismatches in timing as a result of the Project
o Biotic factors (eg nutrients) which are particularly important for biofilm and other lower trophic level taxa are not included in this model The model is therefore unable to assess the potential development of eutrophication and benthic organic enrichment events which may affect fish habitats in the study area
2 Are the parameter estimates used by the model valid and defensible for this system
o In general parameter estimates appear to be adequate for this system Field studies were done in two years to provide data in particular on distributions of selected functional groups for the Ecospace module Note the distribution studies focussed on taxa which were relatively immobile and therefore lsquofixedrsquo in space
o the selection of some model parameters would benefit from further explanation for example the choice of fixed diet matrices versus dynamic matrices which can vary with changes in abundances or predators and prey
o the selection of some model parameters would benefit from further explanation for example the link between the diets described in the text of Appendix 10B and the quantities presented in Appendix A of Appendix 10B It is understood that proportions were derived using the ldquofixed selectivityrdquo principle but in order to be fully transparent the derivation of each diet should be provided in an appendix
o discussion and explanation is needed of why ecotrophic efficiencies differ from expected values (eg the ecotrophic efficiency for Pacific herring is listed as 038) and
o the abiotic factor lsquosubstratersquo was limited to ldquohardrdquo or rdquosoftrdquo options which can be restrictive given that they serve as endpoints on a substrate composition continuum These limited options may not provide the sensitivity required to assess substrate preference nor the flexibility for taxa (eg motile organisms) that span hard mixed and soft substrate types In addition it is not clear if changes in the hardsoft categories were considered over time within identified depositional or erosional settings before and after construction
Pacific Region Science Response Technical Review Assessing
Ecosystem Productivity Model of Roberts Bank
20
3 Are the limitations and uncertainties of the model identified and appropriately considered when determining the modelrsquos representation of current and possible future conditions
o the EwE model was not designed to evaluate a range of future conditions It was designed to estimate changes in the productive potential at the ecosystem level with and without the Project Therefore the model was run without the Project and with the Project for a range of plausible abiotic conditions and the results were compared with respect to biomass and productivity by functional group
o the pedigree approach to assessing the uncertainties of model outcomes is unsatisfactory for the purpose here as it relates solely to a qualitative judgment of the value of data based on its source However when the model was rerun with much wider ranges of confidence intervals (uncertainties) the results in general (but not necessarily for each functional group) were similar to the results using the original pedigree approach This suggests that taken overall the model may be robust to wide ranges of uncertainty in these input variables and parameters
o there is inadequate validation of the model This is inadequate for three reasons
(i) the basic Ecopath model is not validated and the Ecospace balancing process (the spin-up period) resulted in some biomass estimates being increased or decreased beyond their confidence limits
(ii) the goodness of fit test used to evaluate how well the model predicted the spatial occurrence functional groups is not fit for purpose (Section 34) and
(iii) validation was provided for only a small number of functional groups (the habitat-forming functional groups) As a consequence the model is currently not validated
o Considering the proportion of open boundaries relative to closed boundaries in the model processes taking place outside the modelled ecosystem are likely to contribute to dynamics within the modelled ecosystem However these external processes may not be well-resolved by the EwE model as currently configured
4 Are the model results related to the potential effects of the Project on fish and fish habitat and migratory birds and their food resources valid and defensible
o this is a very complex ecosystem model constructed for a relatively small and open (in the sense of considerable exchange with adjacent non-modelled areas) system Many assumptions have been made based on poor or missing data Taking all these considerations into account the model does the best job possible of comparing the biomass and productivity of the Roberts Bank ecosystem with and without the Project
o the extent to which the model adequately represents the lsquorealrsquo ecosystem of Roberts Bank as opposed to comparisons of model results with and without the Project is unclear as a number of basic diagnostics are not presented (see point 3 above)
o the EwE model is not capable of and is not designed to represent nutritional and food quality variations in prey functional groups and how these may impact highly migratory predators such as birds with and without the Project
5 Is the EwE model framework a valid method to quantify large scale impacts to fish habitat fish productivity and migratory bird productivity
o the EwE model as implemented in this project and reviewed here is a useful first-order framework to organise information and derive initial estimates of how the system may respond to perturbations
Pacific Region Science Response Technical Review Assessing
Ecosystem Productivity Model of Roberts Bank
21
o the utility of a EWE model for impact purposes is highly dependent on the quality of input data
o each EwE model is highly dependent on local conditions Although appropriate as an overall methodology each application would need to be reviewed for how it may be applied to any new ecosystem and
o the EwE model would need to be substantially reformulated if it was to include considerations of changes in chemical composition or food quality of prey in particular for seasonal migratory species such as birds which may depend on very large biomasses of prey with specific chemical composition to fuel their migrations beyond the ecosystem model boundaries
Contributors Contributor Affiliation Ian Perry Author DFO Science Pacific Region Alida Bundy Author DFO Science Maritimes Region Terri Sutherland Author DFO Science Pacific Region Robert Elner Author ECCC Canadian Wildlife Service Andrew Robinson Author ECCC Canadian Wildlife Service Lesley MacDougall Editor DFO Science Pacific Region
Approved by Carmel Lowe
Regional Director Science Branch Pacific Region Fisheries and Oceans Canada
November 4 2016
Sources of Information Christensen V Coll M Steenbeek J Buszowski J Chagaris D walters CJ 2014
Representing variable habitat quality in a spatial food web model Ecosystems 17 1397-1412
Christensen V and Walters C 2000 Ecopath with Ecosim methods capabilities and limitations Ecological Modelling 172 109-139
Colleacuteter M Valls A Guitton J Gascuel D Pauly D and Christensen V 2015 Global overview of the applications of the Ecopath with Ecosim modeling approach using the EcoBase models repository Ecological Modelling 302 pp42-53
Compass Resource Management Ltd 2013 Roberts Bank Terminal 2 Technical Advisory Group (TAG) Process Report Productive Capacity ndash Final Report 119pp (Accessed November 1 2016)
DFO 2016 Technical Review of Roberts Bank Terminal 2 Environmental Assessment Section 95 ndash Coastal Geomorphology DFO Can Sci Advis Sec Sci Resp 2016045 (Accessed November 4 2016)
Pacific Region Science Response Technical Review Assessing
Ecosystem Productivity Model of Roberts Bank
22
ESSA Technologies 2014a Roberts Bank Terminal 2 Project Roberts Bank Delta BC Environmental Impact Statement Volume 3 Biophysical Effects Assessments Appendix 10-C Roberts Bank Ecosystem Model Development and Key Run Port Metro Vancouver (Accessed November 1 2016)
ESSA Technologies 2014b Roberts Bank Terminal 2 Project Roberts Bank Delta BC Environmental Impact Statement Volume 3 Biophysical Effects Assessments Appendix 10-D Roberts Bank Ecosystem Model Sensitivity Analyses Port Metro Vancouver (Accessed November 1 2016)
Franklin J 2009 Mapping Species Distributions Spatial Inference and Prediction Cambridge University Press Cambridge
Hemmera 2014 Roberts Bank Terminal 2 Project Roberts Bank Delta BC Environmental Impact Statement Volume 3 Biophysical Effects Assessments Appendix 10-B Roberts Bank Ecosystem Model Parameter Estimates Port Metro Vancouver File 302-03503 (Accessed November 1 2016)
Port Metro Vancouver 2015a Roberts Bank Terminal 2 Project Roberts Bank Delta BC Environmental Impact Statement Volume 3 Biophysical Effects Assessments Section 100 Biophysical Setting (Accessed November 1 2016)
Port Metro Vancouver 2015b Roberts Bank Terminal 2 Project Roberts Bank Delta BC Environmental Impact Statement Volume 3 Biophysical Effects Assessments Section 103 Overview of Assessing Ecosystem Productivity (Accessed November 1 2016)
Port Metro Vancouver 2015c Roberts Bank Terminal 2 Project Environmental Assessment Additional Information Requirements (July 31 2015) Responses Response to Information Request 6 IR-73115-06 Canadian Environmental Assessment Agency Reference Number 80054 dated 26 October 2015
Steenbeek J Coll M Gurney L Meacutelin F Hoepffner N Buszowski J and Christensen V 2013 Bridging the gap between ecosystem modeling tools and geographic information systems Driving a food web model with external spatialndashtemporal data Ecological Modelling 263 139ndash 151
Sutherland T Elner R and OrsquoNeill J 2013 Roberts Bank Ecological crucible of the Fraser River estuary Progress in Oceanography 115 171ndash180
Vancouver Fraser Port Authority 2016 From the Vancouver Fraser Port Authority to the Review Panel re Answers to preliminary technical questions submitted during the completeness phase from Fisheries and Oceans Canada Natural Resources Canada and Environment and Climate Change Canada concerning the ecosystem modelling to support the Roberts Bank Terminal 2 Project environmental review CEAR Document 547 (Accessed November 1 2016)
Pacific Region Science Response Technical Review Assessing
Ecosystem Productivity Model of Roberts Bank
23
This Report is Available from the Centre for Science Advice
Pacific Region Fisheries and Oceans Canada
3190 Hammond Bay Road Nanaimo BC V9T 6N7
Telephone (250) 756-7208 E-Mail csapdfo-mpogcca
Internet address wwwdfo-mpogccacsas-sccs
ISSN 1919-3769 copy Her Majesty the Queen in Right of Canada 2016
Correct Citation for this Publication
DFO 2016 Technical review of Roberts Bank Terminal 2 environmental assessment section 103 ndash assessing ecosystem productivity DFO Can Sci Advis Sec Sci Resp 2016050
Aussi disponible en franccedilais
MPO 2016 Examen technique de leacutevaluation environnementale du Terminal 2 agrave Roberts Bank section 103 ndash eacutevaluation de la productiviteacute de leacutecosystegraveme Secr can de consult sci du MPO Reacutep des Sci 2016050

Pacific Region Science Response Technical Review Assessing
Ecosystem Productivity Model of Roberts Bank
14
occurrences from data and similarly with predicted and observed absences The Proponent then calculated two additional accuracy of fit measures sensitivity (the model predicts a species to occur in an area where it is known to occur in reality) and specificity (the model predicts a species does not occur in an area it is known not to occur in reality)24 This analysis concluded that the model has high predictability for functional groups such as eelgrass and sea pens with relatively static distributions but lower predictability for functional groups which are more temporally and spatially dynamic such as biofilm and green algae25
There are two problems with this approach The first is that this goodness of fit comparison was done only for habitat-forming functional groups no discussion of how well this analysis applies to mobile functional groups was provided The second problem is that this method does not take into account situations (such as occurs in this study with several groups) in which species occur at only a few locations For example ldquohellipif the test data consist of 95 absences and 5 presences and this reflects the true prevalence of the species on the landscape (a realistic scenario for a rare species) a lsquonullrsquo model that predicted absence in all cases (eg no model at all) would be correct 95 of the timehellipldquo (Franklin 2009 p 151) This latter point is important here as these habitat functional groups (biofilm brown algae native eelgrass green algae Japanese eelgrass tidal marsh biomat and orange sea pens26) appear not to occur over most of the Project area (as portrayed by the model outputs presented in the distribution figures of PMV Response 2016-03-02 Appendix 218) It is therefore important that a robust evaluation of the performance of the Ecospace module is used with preferably more than one measure
In summary the starting point for this modelling analysis matters It is not just about a comparison between results with and without the Project The model has to be considered a sufficient representation of the ecosystem The Proponent has not yet sufficiently validated the model
35 Model results 351 Presentation of model results
As noted above (Section 331) the stated objective of the Roberts Bank ecosystem model was not to provide an assessment of Project impacts for each functional group at a fine temporal scale but to estimate changes in productive potential with and without the Project at the ecosystem level27 However results were presented as comparisons by speciesfunctional group with and without the Project and not as potential changes in total ecosystem productivity The revised figures for each functional group showing distributions without the Project with the Project and their difference indicated impacts were likely to be localized with overall impacts relatively small The range of biomass ratios with and without the Project was 045 ndash 189 with most values slightly less than 1 This is interpreted as indicating slight decreases in the capacity of the study area to support biomass and production with the Project for many functional groups28 (Figure 2)
24 PMV Response 2016-03-02 p 80 lines 1524-1527 25 PMV Response 2016-03-02 p 81 lines 1551-1559 26 PMV Response 2016-03-02 p 82 Table 8 27 PMV Response 2016-03-02 p 99 lines 1914-1917 28 PMV Response 2016-03-02 Appendix 218
Pacific Region Science Response Technical Review Assessing
Ecosystem Productivity Model of Roberts Bank
15
Biomass Ratio
Freq
uenc
y
04 07 10 13 16 19
05
1015
2025
30
Figure 2 Histogram of biomass ratios obtained by comparisons of model runs with and without the project (ie With Without) Values less than 1 indicate reductions in biomass with the Project compared against without the Project) Data from Appendix 218 of PMV Response 2016-03-02
352 Sensitivity and vulnerability analyses Every ecosystem model is only one possible representation of the true ecosystem defined by the modelrsquos structure and the values chosen for its many parameters The key point is how well the model represents the real system how that fit can be measured and the sensitivity of model outputs to variability in the selected parameter values The ideal model should be robust to a wide range of uncertainties in the input data and parameters This robustness is determined by performing sensitivity analyses on the model to see how it responds to variations in the input parameters and determining to which input parameters the model is most sensitive
The vulnerability parameters determine the strength of the feeding interactions between functional groups They set the level of density dependence of each functional group Higher vulnerability settings provide greater top-down (predator) control whereas lower settings provide greater bottom-up (environmental) control29 Several publications have shown that EwE models are very sensitive to the vulnerability parameters and Christensen and Walters (2000) point out that a main pitfall of EwE is that ldquopredation vulnerabilities are often underestimated lessening the modelled impacts of predationrdquo It is usual practice to tune Ecopath models including the vulnerability parameters to time series data such as biomass using the temporal simulation model Ecosim However these data were not available for the RBT2 area so this robust method of fitting the model and estimating vulnerability parameters was not possible Instead a vulnerability setting of 2 was used as the default value for the key model runs which is ldquocommon practice when time series data are not available and estimates of vulnerability in the
29 PMV Response 2016-03-02 p 70 lines 1318-1323
Pacific Region Science Response Technical Review Assessing
Ecosystem Productivity Model of Roberts Bank
16
model cannot be maderdquo30 with sensitivity analyses run for a range of 15 to 3 This narrow range was criticized by DFOECCC in initial discussions about the model with the Proponent The Proponent subsequently reran the model with a larger range of vulnerabilities31 (11 to 10) and concluded this broader vulnerability range produced similar results for the productivity ratio with and without the Project to those in the original EIS and that the EIS was more likely to overestimate than underestimate potential project effects32 The data in Table 7 of the PMV Response33 did indicate changes in productivity ratios ranging from 0 to 50 of the defined key run (which used a vulnerability setting of 2) However the Proponent changed all vulnerability settings to the same value ie all were 2 or all were 10 etc In reality the vulnerability parameters resulting from Ecosim models that are fitted to data as described above vary by functional group which was not explored here Therefore although the results suggest that the original choice of 2 for the default key run seemed reasonable the potential effects of variability in vulnerability settings was not fully explored
Sensitivity analyses are usually based on the range of uncertainty estimated for input data and parameters often called the confidence limits around the model parameters The EwE framework integrates many different data sources and parameters including values from the literature It can therefore be difficult to identify ldquoreasonablerdquo confidence limits when derived from such diverse data sources Standard practice in Ecopath models has been to develop a pedigree for each parameter with default values for uncertainty based on the nature of the source data For example parameter values based on high precision field observations of biomass within the model domain receive default confidence intervals of 10 whereas parameter values based on models developed for elsewhere or professional judgment receive confidence intervals of 8034 Sensitivity analyses are then run using parameter values selected from within these confidence intervals However if these default confidence intervals do not capture the full range of variability then the outputs are not informative of the variability in the lsquorealrsquo ecosystem Field observations were collected for many functional groups within the model domain in 2012 and 2013 as part of studies to support the RBT2 EIS Apparently the purpose of these observations was to document spatial variability (in part for the Ecospace model) and temporal variability (measurements at one location over time) and not to derive confidence intervals around the observations35
The reliance on the pedigree approach to derive confidence intervals for this Roberts Bank model was criticized by DFO ECCC and NRCan in discussions with the Proponent As a result the Proponent reran the model with much larger confidence intervals ranging from 30 to 100 depending on the input parameter and functional group36 The results from this new analysis using the broader confidence intervals were similar to those using the original pedigree approach The Proponent noted that ldquoWhile the production within each helliprun was very different there was little difference in the biomass ratio [with and without the Project] These results further demonstrate that even with a greater range in input values the influence of the Project on the Roberts Bank ecosystem is consistent among allhellipmodel runsrdquo37 This provides confidence that the model may be robust to uncertainty in its input parameters Two concerns
30 PMV Response 2016-03-02 p 70 lines 1321-1322 31 PMV Response 2016-03-02 p 71-74 32 PMV Response 2016-03-02 p 71 lines 1339-1341 33 PMV Response 2016-03-02 p 73 34 EIS Appendix 10-C Section 251 page 18 35 PMV Response 2016-03-02 p 42 lines 772-777 36 PMV Response 2016-03-02 p 44-47 37 PMV Response 2016-03-02 p 47 lines 855-858 and see also PMV Response 2016-03-02 Appendix 27-B
Pacific Region Science Response Technical Review Assessing
Ecosystem Productivity Model of Roberts Bank
17
remain however The quote above indicates that the production among the different model runs was very different although with little difference in the biomass ratios with and without the Project Since biomass is not the same as production it would be informative for understanding model performance and potential impacts to show these production differences This also relates to the point made in Section 34 regarding how well the model represents the real ecosystem and not just within-model comparisons with and without the Project The second question is more technical and relates to how the randomization (Monte Carlo or MC) routine that was used to create multiple model runs used the uncertainty about the diet data Diets are not currently included in the MC routine available to regular users of the Ecosim model how they were handled in this RBT2 model appears not to be explained
Finally the sensitivity analyses indicate that the uncertainty in the input parameters does not lead to much difference between model parameters with or without the project However this conclusion does not describe how the uncertainty in the input parameters affects understanding of the ecosystem
40 Conclusions Overall the main conclusion of the Environmental Impact Statement from the Proponent is stated as ldquohellipafter the implementation of mitigation hellipthe Project is not expected to result in any significant adverse effects on any of the 16 valued componentsrdquo38 In addition ldquohellipapproximately 40 of the functional groups are forecast to change no more than 5 which hellip is judged to be within the uncertainty of the model runsrdquo39 although larger changes were forecast for orange sea pens freshwater biofilm green algae and raptors The conclusions from the modelling studies are that ldquohellipthe proposed project will have an impact on the study area that the effect varies between species and that the findings are robust to parameter uncertaintyrdquo40 Specific outcomes by valued component as derived from the EwE model are presented by functional groups in Table 1
38 PMV March 2015 Roberts Bank Environmental Impact Statement Executive Summary ndash Part 1 page 37 39 EIS Appendix 10-C p ii 40 EIS Appendix 10-D p iv
Pacific Region Science Response Technical Review Assessing
Ecosystem Productivity Model of Roberts Bank
18
Table 1 Changes in productive potential with the Project as derived from the EwE model
Changes in productive potential
Ecosystem category
Number of valued
components
Number with potential
biomass loss
Moderate decrease (31-60 decline)
Minor decrease (6-30 decline)
Negligible (0-5
change)
Minor increase (6-
30 increase)
Moderate increase (31-60 increase)
Source
Marine vegetation
7 7 - 3 2 2 - EIS Vol 3 Section 11 Table 11-17 page 11-65
Marine invertebrates
4 3 1 1 1 1 - EIS Vol 3 Section 12 Table 12-8 page 12-52
Marine fish 13 13 - 2 6 5 - EIS Vol 3 Section 13 Table 13-10 page 13-95
Coastal birds
11 8 - 3 4 3 1 EIS Vol 3 Section 15 Table 15-10 page 15-67
Pacific Region Science Response Technical Review Assessing
Ecosystem Productivity Model of Roberts Bank
19
Most functional groups showed some potential biomass loss with the Project with biomass loss defined as any model run with negative outcomes (ie in which biomass with the project was less than biomass without the Project) The summary of changes in productivity potential are mixed with most (33 out of 35) valued components showing minor decreases to minor increases (defined as 6 to 30 changes in productive potential with the Project compared to without the Project)
The main conclusions of this review in regards to the Terms of Reference are
1 Do the functional groups and abiotic variables used in the model adequately represent the ecosystem at Roberts Bank
o The 58 functional groups and abiotic variables used in the model adequately represent the main components of the Roberts Bank ecosystem however for longer lived species the life stages of the species are not well represented and some of the impacts of the Project may be expected to affect specific life stages
o The abiotic variables adequately represent the physical drivers of this ecosystem on an annual time scale However annual values for these abiotic variables may not adequately capture important sub-annual events such as storms (DFO 2016) the timing of arrival and departure of highly migratory species and whether there may be important sub-annual thresholds or mismatches in timing as a result of the Project
o Biotic factors (eg nutrients) which are particularly important for biofilm and other lower trophic level taxa are not included in this model The model is therefore unable to assess the potential development of eutrophication and benthic organic enrichment events which may affect fish habitats in the study area
2 Are the parameter estimates used by the model valid and defensible for this system
o In general parameter estimates appear to be adequate for this system Field studies were done in two years to provide data in particular on distributions of selected functional groups for the Ecospace module Note the distribution studies focussed on taxa which were relatively immobile and therefore lsquofixedrsquo in space
o the selection of some model parameters would benefit from further explanation for example the choice of fixed diet matrices versus dynamic matrices which can vary with changes in abundances or predators and prey
o the selection of some model parameters would benefit from further explanation for example the link between the diets described in the text of Appendix 10B and the quantities presented in Appendix A of Appendix 10B It is understood that proportions were derived using the ldquofixed selectivityrdquo principle but in order to be fully transparent the derivation of each diet should be provided in an appendix
o discussion and explanation is needed of why ecotrophic efficiencies differ from expected values (eg the ecotrophic efficiency for Pacific herring is listed as 038) and
o the abiotic factor lsquosubstratersquo was limited to ldquohardrdquo or rdquosoftrdquo options which can be restrictive given that they serve as endpoints on a substrate composition continuum These limited options may not provide the sensitivity required to assess substrate preference nor the flexibility for taxa (eg motile organisms) that span hard mixed and soft substrate types In addition it is not clear if changes in the hardsoft categories were considered over time within identified depositional or erosional settings before and after construction
Pacific Region Science Response Technical Review Assessing
Ecosystem Productivity Model of Roberts Bank
20
3 Are the limitations and uncertainties of the model identified and appropriately considered when determining the modelrsquos representation of current and possible future conditions
o the EwE model was not designed to evaluate a range of future conditions It was designed to estimate changes in the productive potential at the ecosystem level with and without the Project Therefore the model was run without the Project and with the Project for a range of plausible abiotic conditions and the results were compared with respect to biomass and productivity by functional group
o the pedigree approach to assessing the uncertainties of model outcomes is unsatisfactory for the purpose here as it relates solely to a qualitative judgment of the value of data based on its source However when the model was rerun with much wider ranges of confidence intervals (uncertainties) the results in general (but not necessarily for each functional group) were similar to the results using the original pedigree approach This suggests that taken overall the model may be robust to wide ranges of uncertainty in these input variables and parameters
o there is inadequate validation of the model This is inadequate for three reasons
(i) the basic Ecopath model is not validated and the Ecospace balancing process (the spin-up period) resulted in some biomass estimates being increased or decreased beyond their confidence limits
(ii) the goodness of fit test used to evaluate how well the model predicted the spatial occurrence functional groups is not fit for purpose (Section 34) and
(iii) validation was provided for only a small number of functional groups (the habitat-forming functional groups) As a consequence the model is currently not validated
o Considering the proportion of open boundaries relative to closed boundaries in the model processes taking place outside the modelled ecosystem are likely to contribute to dynamics within the modelled ecosystem However these external processes may not be well-resolved by the EwE model as currently configured
4 Are the model results related to the potential effects of the Project on fish and fish habitat and migratory birds and their food resources valid and defensible
o this is a very complex ecosystem model constructed for a relatively small and open (in the sense of considerable exchange with adjacent non-modelled areas) system Many assumptions have been made based on poor or missing data Taking all these considerations into account the model does the best job possible of comparing the biomass and productivity of the Roberts Bank ecosystem with and without the Project
o the extent to which the model adequately represents the lsquorealrsquo ecosystem of Roberts Bank as opposed to comparisons of model results with and without the Project is unclear as a number of basic diagnostics are not presented (see point 3 above)
o the EwE model is not capable of and is not designed to represent nutritional and food quality variations in prey functional groups and how these may impact highly migratory predators such as birds with and without the Project
5 Is the EwE model framework a valid method to quantify large scale impacts to fish habitat fish productivity and migratory bird productivity
o the EwE model as implemented in this project and reviewed here is a useful first-order framework to organise information and derive initial estimates of how the system may respond to perturbations
Pacific Region Science Response Technical Review Assessing
Ecosystem Productivity Model of Roberts Bank
21
o the utility of a EWE model for impact purposes is highly dependent on the quality of input data
o each EwE model is highly dependent on local conditions Although appropriate as an overall methodology each application would need to be reviewed for how it may be applied to any new ecosystem and
o the EwE model would need to be substantially reformulated if it was to include considerations of changes in chemical composition or food quality of prey in particular for seasonal migratory species such as birds which may depend on very large biomasses of prey with specific chemical composition to fuel their migrations beyond the ecosystem model boundaries
Contributors Contributor Affiliation Ian Perry Author DFO Science Pacific Region Alida Bundy Author DFO Science Maritimes Region Terri Sutherland Author DFO Science Pacific Region Robert Elner Author ECCC Canadian Wildlife Service Andrew Robinson Author ECCC Canadian Wildlife Service Lesley MacDougall Editor DFO Science Pacific Region
Approved by Carmel Lowe
Regional Director Science Branch Pacific Region Fisheries and Oceans Canada
November 4 2016
Sources of Information Christensen V Coll M Steenbeek J Buszowski J Chagaris D walters CJ 2014
Representing variable habitat quality in a spatial food web model Ecosystems 17 1397-1412
Christensen V and Walters C 2000 Ecopath with Ecosim methods capabilities and limitations Ecological Modelling 172 109-139
Colleacuteter M Valls A Guitton J Gascuel D Pauly D and Christensen V 2015 Global overview of the applications of the Ecopath with Ecosim modeling approach using the EcoBase models repository Ecological Modelling 302 pp42-53
Compass Resource Management Ltd 2013 Roberts Bank Terminal 2 Technical Advisory Group (TAG) Process Report Productive Capacity ndash Final Report 119pp (Accessed November 1 2016)
DFO 2016 Technical Review of Roberts Bank Terminal 2 Environmental Assessment Section 95 ndash Coastal Geomorphology DFO Can Sci Advis Sec Sci Resp 2016045 (Accessed November 4 2016)
Pacific Region Science Response Technical Review Assessing
Ecosystem Productivity Model of Roberts Bank
22
ESSA Technologies 2014a Roberts Bank Terminal 2 Project Roberts Bank Delta BC Environmental Impact Statement Volume 3 Biophysical Effects Assessments Appendix 10-C Roberts Bank Ecosystem Model Development and Key Run Port Metro Vancouver (Accessed November 1 2016)
ESSA Technologies 2014b Roberts Bank Terminal 2 Project Roberts Bank Delta BC Environmental Impact Statement Volume 3 Biophysical Effects Assessments Appendix 10-D Roberts Bank Ecosystem Model Sensitivity Analyses Port Metro Vancouver (Accessed November 1 2016)
Franklin J 2009 Mapping Species Distributions Spatial Inference and Prediction Cambridge University Press Cambridge
Hemmera 2014 Roberts Bank Terminal 2 Project Roberts Bank Delta BC Environmental Impact Statement Volume 3 Biophysical Effects Assessments Appendix 10-B Roberts Bank Ecosystem Model Parameter Estimates Port Metro Vancouver File 302-03503 (Accessed November 1 2016)
Port Metro Vancouver 2015a Roberts Bank Terminal 2 Project Roberts Bank Delta BC Environmental Impact Statement Volume 3 Biophysical Effects Assessments Section 100 Biophysical Setting (Accessed November 1 2016)
Port Metro Vancouver 2015b Roberts Bank Terminal 2 Project Roberts Bank Delta BC Environmental Impact Statement Volume 3 Biophysical Effects Assessments Section 103 Overview of Assessing Ecosystem Productivity (Accessed November 1 2016)
Port Metro Vancouver 2015c Roberts Bank Terminal 2 Project Environmental Assessment Additional Information Requirements (July 31 2015) Responses Response to Information Request 6 IR-73115-06 Canadian Environmental Assessment Agency Reference Number 80054 dated 26 October 2015
Steenbeek J Coll M Gurney L Meacutelin F Hoepffner N Buszowski J and Christensen V 2013 Bridging the gap between ecosystem modeling tools and geographic information systems Driving a food web model with external spatialndashtemporal data Ecological Modelling 263 139ndash 151
Sutherland T Elner R and OrsquoNeill J 2013 Roberts Bank Ecological crucible of the Fraser River estuary Progress in Oceanography 115 171ndash180
Vancouver Fraser Port Authority 2016 From the Vancouver Fraser Port Authority to the Review Panel re Answers to preliminary technical questions submitted during the completeness phase from Fisheries and Oceans Canada Natural Resources Canada and Environment and Climate Change Canada concerning the ecosystem modelling to support the Roberts Bank Terminal 2 Project environmental review CEAR Document 547 (Accessed November 1 2016)
Pacific Region Science Response Technical Review Assessing
Ecosystem Productivity Model of Roberts Bank
23
This Report is Available from the Centre for Science Advice
Pacific Region Fisheries and Oceans Canada
3190 Hammond Bay Road Nanaimo BC V9T 6N7
Telephone (250) 756-7208 E-Mail csapdfo-mpogcca
Internet address wwwdfo-mpogccacsas-sccs
ISSN 1919-3769 copy Her Majesty the Queen in Right of Canada 2016
Correct Citation for this Publication
DFO 2016 Technical review of Roberts Bank Terminal 2 environmental assessment section 103 ndash assessing ecosystem productivity DFO Can Sci Advis Sec Sci Resp 2016050
Aussi disponible en franccedilais
MPO 2016 Examen technique de leacutevaluation environnementale du Terminal 2 agrave Roberts Bank section 103 ndash eacutevaluation de la productiviteacute de leacutecosystegraveme Secr can de consult sci du MPO Reacutep des Sci 2016050
- TECHNICAL REVIEW OF ROBERTS BANK TERMINAL 2 ENVIRONMENTAL ASSESSMENT SECTION 103 ndash ASSESSING ECOSYSTEM PRODUCTIVITY
-
- 10 Context
- 20 Background
-
- 21 Background and Terms of Reference
- 22 Approach to assessing ecosystem productivity
-
- 30 Analysis and Response
-
- 31 The EwE Team
- 32 Overview of assessment results of hydrological and sediment modelling
- 33 Model implementation
-
- 331 The purpose of the EwE model
- 332 Applicability of the EwE model framework to the Roberts Bank region
- 333 Model documentation
- 334 Highly mobile functional groups
- 335 Seasonality (model time step)
- 336 Life history structure
- 337 Model balancing
-
- 34 Model validation
- 35 Model results
-
- 351 Presentation of model results
- 352 Sensitivity and vulnerability analyses
-
- 40 Conclusions
- Contributors
- Approved by
- Sources of Information
- This Report is Available from the
-
- CSAS 2016-50 - Assessing Ecosystem Productivitypdf
-
- TECHNICAL REVIEW OF ROBERTS BANK TERMINAL 2 ENVIRONMENTAL ASSESSMENT SECTION 103 ndash ASSESSING ECOSYSTEM PRODUCTIVITY
-
- 10 Context
- 20 Background
-
- 21 Background and Terms of Reference
- 22 Approach to assessing ecosystem productivity
-
- 30 Analysis and Response
-
- 31 The EwE Team
- 32 Overview of assessment results of hydrological and sediment modelling
- 33 Model implementation
-
- 331 The purpose of the EwE model
- 332 Applicability of the EwE model framework to the Roberts Bank region
- 333 Model documentation
- 334 Highly mobile functional groups
- 335 Seasonality (model time step)
- 336 Life history structure
- 337 Model balancing
-
- 34 Model validation
- 35 Model results
-
- 351 Presentation of model results
- 352 Sensitivity and vulnerability analyses
-
- 40 Conclusions
- Contributors
- Approved by
- Sources of Information
- This Report is Available from the
-
Canadian Science Advisory Secretariat Pacific Region Science Response 2016050
December 2016
TECHNICAL REVIEW OF ROBERTS BANK TERMINAL 2 ENVIRONMENTAL ASSESSMENT SECTION 103 ndash
ASSESSING ECOSYSTEM PRODUCTIVITY
10 Context Vancouver Fraser Port Authority (VFPA) formerly Port Metro Vancouver (the Proponent) is proposing to construct and operate the Roberts Bank Terminal 2 Project (the Project) a new three-berth marine container terminal at Roberts Bank in Delta British Columbia The proposed terminal is located next to the existing Deltaport and Westshore Terminals In addition to the construction of the new terminal the Proponent has proposed to widen the north side of the existing Roberts Bank causeway from its east-end connection with the mainland to the entrance to the new terminal The existing tug basin connected to the northeast side of Deltaport Terminal is also proposed to be expanded The new marine terminal is predicted by the Proponent to process up to 260 container ship calls per year at full capacity with the assistance of two or three large berthing or escort tugs to manoeuver ships into or away from assigned berths The terminal is designed to operate 24 hours per day year-round
The Roberts Bank Terminal 2 Project is subject to an environmental assessment by a Review Panel pursuant to the Canadian Environmental Assessment Act 2012 As a federal authority in the environmental assessment for the Project Fisheries and Oceans Canada (DFO) will be asked to present information to the review panel and at public hearings in relation to its expertise on the effects of the Project on fish and fish habitat including aquatic species at risk and the adequacy of mitigation and offsetting measures and monitoring and follow-up programs proposed by the Proponent DFOrsquos Pacific Region Fisheries Protection Program (FPP) will coordinate DFOrsquos participation in the environmental assessment
The Proponent assessed future ecosystem productivity at Roberts Bank using the Ecopath with Ecosim and Ecospace (EwE) model framework The potential impacts of the Project to hydrodynamic conditions and sediment transport in the area as a result of changes in wind wave and current patterns and intensities are projected using different model frameworks A companion Science Response (DFO 2016) has been developed by DFO and Natural Resource Canada (NRCan) to review Section 95 ldquoCoastal Geomorphologyrdquo of the Environmental Impact Statement (EIS) which describes the hydrodynamic and sedimentology models that were used to evaluate the effect of the Project on water and sediment movements
Outcomes of the EwE models are incorporated into the analysis of the potential project-related effects on the ongoing productivity of commercial recreational and Aboriginal fisheries Consequently DFO FPP has requested that DFO Science Branch provide an evaluation of the Proponentrsquos characterization of project-related effects as conducted using the Ecopath with Ecosim and Ecospace (EwE) ecosystem model
Pacific Region Science Response Technical Review Assessing
Ecosystem Productivity Model of Roberts Bank
2
The objectives for this Science Response are to
1 Determine if the functional groups and abiotic factors used in the model adequately represent the ecosystem at Roberts Bank
2 Assess whether the parameter estimates used by the model are valid and defensible for this system
3 Assess whether the limitations and uncertainties of the model are identified and appropriately considered when determining the modelrsquos representation of current and possible future conditions
4 Provide advice regarding whether the model results related to the potential effects of the Project on fish and fish habitat and migratory birds and their food resources are valid and defensible
5 If possible provide advice regarding the validity of using the EwE model framework to quantify large scale impacts to fish habitat and fisheries productivity and the productivity of migratory birds
This Science Response evaluates Section 100 ldquoBiophysical Settingrdquo with a focus on Section 103 ldquoOverview of Assessing Ecosystem Productivityrdquo in the EIS as submitted by the Proponent (Port Metro Vancouver 2015) This Section and consequently this Response describes the ecosystem modelling approach that was taken to evaluate the direct and indirect effects of the footprint of the proposed terminal and widened causeway herein referred to as lsquothe Projectrsquo This ecosystem model provides outputs related to potential effects of the project on the study area at an ecosystem level including aquatic species and bird species in the Project area Evaluation of the model and its outputs therefore required expertise in both fishery aquatic species and migratory bird species Consequently this Science Response is the product of a joint review between DFO and Environment and Climate Change Canada (ECCC) Canadian Wildlife Service and Wildlife and Landscape Science to provide a complete evaluation
This Science Response Report results from the Science Response Process of July 2016 on the Technical Review of Ecopath with Ecosim and Ecospace (EwE) Ecosystem Productivity Model application to the Roberts Bank Terminal 2 Environmental Assessment
20 Background
21 Background and Terms of Reference The Projectrsquos main components have a proposed combined marine footprint area of approximately 179 km2 listed below by specific component
bull Marine Terminal 1335 km 2 including terminal (116 km 2) and dredged berth pocket and marine approach areas (0174 km 2)
bull Widened Causeway 0424 km 2
bull Expanded Tug basin 0031 km 2
Roberts Bank in the Fraser River estuary consists of complex intertidal and subtidal habitats including intertidal eelgrass beds and is an important stopover area for migrating shorebirds and productive feeding and rearing habitats for many fish and invertebrate species It also provides habitat for endangered Southern Resident Killer Whales and other marine mammals
Pacific Region Science Response Technical Review Assessing
Ecosystem Productivity Model of Roberts Bank
3
The environmental conditions at Roberts Bank are dynamic and are influenced by a variety of oceanographic and atmospheric factors including the Fraser River freshwater and sediment plume discharge diurnal tidal currents and prevailing and storm-generated wind and wave activity In addition the intercauseway region provides significant drainage from marsh and agricultural areas which have different characteristics from marine waters and which run along the ferry causeway
To provide the required science advice this Science Response focusses on Section 10 ldquoBiophysical Settingrdquo of the Environmental Impact Statement (EIS) (Port Metro Vancouver 2015a) specifically Section 103 ldquoOverview of Assessing Ecosystem Productivityrdquo (Port Metro Vancouver 2015b) and its related Appendices 10-B ldquoRoberts Bank Ecopath with Ecosim and Ecospace model parameter estimatesrdquo (Hemmera 2014) Appendix 10-C ldquoRoberts Bank Ecosystem model development and key runsrdquo(ESSA Technologies 2014a) and Appendix 10-D ldquoRoberts Bank Ecosystem model sensitivity analysesrdquo (ESSA Technologies 2014b) Additional important information was obtained from the Response to Information Request 6 (IR-73115-06 Canadian Environmental Assessment Agency Reference Number 80054 dated 26 October 2015) (Port Metro Vancouver 2015c) and the Written Responses to Coastal Geomorphology and Ecosystem Modelling Questions provided by the Proponent to DFO ECCC and NRCan on 2 March 2016 (Port Metro Vancouver (PMV) Transmittal TRE-01-RBT2-0004A subsequently referred in this Science Response as ldquoPMV Response 2016-03-02rdquo) (Vancouver Fraser Port Authority 2016)
The process followed in preparing this Science Response involved an initial review of the submitted EIS followed by an in-person meeting of the Proponent its contractors and representatives of DFO ECCC and NRCan to discuss and clarify questions arising from the initial review (Vancouver 23 November 2015) DFO and NRCan provided written questions to the Proponent based on preliminary review of the EIS on November 19 2015 ECCC also provided written questions based on its preliminary review of the EIS to the Proponent on December 1 2015 and January 20 2016 This large initial meeting was followed by smaller focussed meetings between the Proponent its contractors and DFO and NRCan on 11 December 2015 to clarify hydrology and sediment modelling questions with DFO on 8 January 2016 to clarify ecosystem modelling questions and with ECCC on 18 February 2016 to clarify questions relating to birds Written responses to all of these meetings and questions were provided by the Proponent to DFO ECCC and NRCan as the ldquoPMV Response 2016-03-02rdquo and ldquoPMV Response 2016-05-30rdquo (Vancouver Fraser Port Authority 2016) VFPArsquos answers to questions posed by DFO and NRCan regarding coastal geomorphology modelling have been posted to the Canadian Environmental Assessment Registry (CEAR)
22 Approach to assessing ecosystem productivity The Proponent adopted an ecosystem approach to evaluate the direct and indirect effects of the Project on the productivity of the Roberts Bank ecosystem A weight of evidence approach was used to assess the potential effects of the project on the productivity of the ecosystem and selected key components in the study area this approach included a spatial ecosystem simulation model (which included a habitat capacity model) a shorebird opportunity model and empirical data An important point is that any effects on the system during the construction phase or from expansion of the tug basin were excluded from this modelling process the focus instead being a comparison of modelled system productivity before and after the proposed terminal and expanded causeway is in place The chosen ecosystem simulation model was
Pacific Region Science Response Technical Review Assessing
Ecosystem Productivity Model of Roberts Bank
4
Ecopath with Ecosim and its spatial version Ecospace (collectively referred to here as the EwE framework or EwE model) This modelling approach was recommended by a prior Productive Capacity Technical Advisory Group comprised of representatives of technical experts from government agencies academia non-governmental organizations Vancouver Fraser Port Authority and its consultants (Compass 2013) convened by the Proponent and which also recommended a selection of focal species for the model The final selection of functional groups and the resulting food web that form the core of this ecosystem model are shown in Figure 1
Pacific Region Science Response Technical Review Assessing
Ecosystem Productivity Model of Roberts Bank
5
Figure 1 Ecopath with Ecosim model food web for Roberts Bank (Adapted from EIS Volume 3 Section 10 Fig 1033 on page 10-16) The groups coloured in orange represent focal groups size of symbols represents relative annual amount of biomass in the Roberts Bank study area
Pacific Region Science Response Technical Review Assessing
Ecosystem Productivity Model of Roberts Bank
6
The EwE framework is a common approach to ecosystem modelling which has been developed and expanded over the past two to three decades It currently has three main components
1 Ecopath ndash the core model which provides a mass-balance snapshot of the system
2 Ecosim ndash a module that enables simulation modelling over time
3 Ecospace ndash a module that enables simulation modelling over space
In order to make an EwE model tractable species are aggregated into functional groups based on their similar ecological characteristics (habitat and prey preferences etc) the Roberts Bank models had 58 functional groups The first step (Ecopath) was to obtain input parameters representing biomass production consumption emigration and diet for each functional group These parameters were then tuned in an iterative process until the overall production and consumption was balanced (a mass-balance approach) resulting in a model food web with estimates of energy flow between functional groups (Fig 1)
In the second step Ecosim was combined with the spatial model Ecospace The abiotic variables selected in this EIS (depth salinity bottom current wave height sediment type) were used as external forcings to the Ecospace module These abiotic variables provided the physical forcings for the simulations without and with the Project Since time series data on the functional groups of the model were not available Ecospace was run until the model reached equilibrium using various assumptions of the value of the vulnerability parameter (see Section 352) In this EIS the selected time step was annual with all variables abiotic and biotic expressed as yearly averages As used in this EIS the Ecospace module included a habitat capacity model which estimated the distribution of functional groups based on their environmental preferences for each abiotic variable (depth salinity bottom current wave height) and for substrate type (sand mud etc) The model thus allocated the spatial distribution of functional groups over the model domain based on their environmental preferences and the distributions of these abiotic variables with and without the Project The selected spatial unit size (ldquopixelrdquo) for the Ecospace model was 100 m2 In essence an Ecopath model was constructed for each pixel with particular rules governing how the functional groups interacted and moved among these spatial units The Ecospace module was run until it approached equilibrium (20 model years) to establish the spatial patterns without the Project For the lsquowith the Projectrsquo simulations the model was run for an initial 10 years and then the spatial patterns of the abiotic variables with the project were added and the model run for an additional 10 years1 The model outputs predicted changes in the productive potential of the Roberts Bank ecosystem as a comparison (ratio) with and without the Project rather than an absolute biomass that would be lost or gained as a result of the Project
1 EIS Appendix 10-C p 26
Pacific Region Science Response Technical Review Assessing
Ecosystem Productivity Model of Roberts Bank
7
30 Analysis and Response To prepare this response the following sections of the EIS additional documents were reviewed
DocumentSection Title
EIS Section 10
Including appendices 10B 10C and 10D
(Port Metro Vancouver 2015a Hemmera 2014 ESSA Technologies 2014a ESSA Technologies 2014b)
Biophysical Setting
Appendix 10-B Roberts Bank Ecosystem Model Parameter Estimates Port Metro Vancouver File 302-03503
Appendix 10-C Roberts Bank Ecosystem Model Development and Key Run Port Metro Vancouver
Appendix 10-D Roberts Bank Ecosystem Model Sensitivity Analyses Port Metro Vancouver
CEAR document 547 (Including Appendices) ldquoPMV Response 2016-03-02rdquo and ldquoPMV Response 2016-05-30rdquo
(Vancouver Fraser Port Authority 2016)
Vancouver Fraser Port Authority to the Review Panel re Answers to preliminary technical questions submitted during the completeness phase from Fisheries and Oceans Canada Natural Resources Canada and Environment and Climate Change Canada concerning the ecosystem modelling to support the Roberts Bank Terminal 2 Project environmental review
31 The EwE Team Building this ecosystem model was a complex undertaking which required knowledge of the ecosystem to be modelled how to set initial parameter values determination of reasonable ranges of these parameters how to balance the model and how to recognize when the model outputs were unrealistic These tasks became even more complex when spatial model dynamics were involved such as with Ecospace The team engaged by the Proponent to conduct this ecosystem modelling for the Roberts Bank Terminal 2 (RBT2) EIS was led by scientists at the Institute for Oceans and Fisheries located at the University of British Columbia in Vancouver These scientists are global leaders of the EwE model framework having developed much of its current implementation and who continue to lead its elaborations and extensions Construction and running of the model for this specific ecosystem was done in collaboration with ESSA Technologies of Vancouver Parameter values for the ecosystem model were obtained in part from observational studies conducted in the area by Hemmera of Burnaby BC
32 Overview of assessment results of hydrological and sediment modelling Implementation of the ldquowith the Projectrdquo simulations of the ecosystem model was done by driving the model with the abiotic variables as they were projected to be distributed with the Project footprint In the context of this EIS specifying depth salinity bottom currents wave height and sediment type conditions without the Project and changes with the Project were achieved by construction of hydrodynamical and sediment transport models The outputs from these models in combination with the identified environment preferences for the various biological groups were then used as inputs to the Ecospace model to define the spatial
Pacific Region Science Response Technical Review Assessing
Ecosystem Productivity Model of Roberts Bank
8
distributions of these functional groups The implementation of these hydrological and sediment transport models in this EIS was reviewed by DFO and NRCan (DFO 2016) This review concluded that the implementation of these models for this EIS was adequate for average winter conditions but lacking in validation for summer conditions in particular with strong freshwater flows from the Fraser River Simulations of strong storm events and their impacts on wave conditions and sediment transport were also lacking The effect of wave action and current speeds on sediment transport is non-linear such that increasing winds over short periods of time can impact sediment transport processes bottom topography and water depths beyond that determined under average model conditions Overall the review concluded that a greater range of sensitivity analyses is required to have confidence in the model outputs under lsquonon-averagersquo conditions The implication of this conclusion for the present review of the EwE model is that the full range of variability of abiotic characteristics such as bottom topography bottom current and wave heights and how they may affect relevant functional groups in the model with the Project may not be adequately represented Sensitivity analyses were provided by varying the intensity of abiotic variables and by removing abiotic variables to assess their interactive effects In general the ecosystem model outputs were robust to these sensitivity analyses with most groups varying by less than 5 Larger changes however were observed for primary producer and bird groupings and for some fish groups when various abiotic variables were omitted2
33 Model implementation 331 The purpose of the EwE model
The EwE model was intended to provide one line of evidence to assess the potential impacts of the Project on the Roberts Bank ecosystem which would then be used with other lines of evidence to make the final assessment Specifically ldquohellip the objective of the RB [Roberts Bank] model was not to provide an assessment of Project impacts for each functional group at a fine temporal scale but to estimate changes in productive potential with and without the Project at the ecosystem levelrdquo3 In addition ldquohellipthe primary objective of the RB ecosystem model is to evaluate potential changes in productivity from such abiotic factors with and without the terminal and causewayrdquo4 Results are presented for the selected functional groups no results were presented on potential changes in ecosystem structure or function
332 Applicability of the EwE model framework to the Roberts Bank region EwE models work best when the exchanges within the system being modelled are greater than the exchanges between the modelled system and the lsquooutsidersquo world In practice this means that EwE models work best for larger systems with few external exchanges In a meta-analysis of 433 Ecopath models Colleacuteter et al (2015) concluded that ldquohellipin the last two decades the range of the models area has expanded toward very large areas and the median has shifted accordingly from about 1000 km2 in 1984ndash1993 to about 100000 km2 in 1994ndash2014rdquo The section of the Roberts Bank ecosystem that is included in the EwE model was comparatively small (5468 km2) and complex It is an intertidally-dominated environment that is subject to strong seasonal influences of both freshwater and marine exchanges across relatively large seaward and shoreward boundaries
2 EIS Appendix 10-D p ii - iii 3 PMV Response 2016-03-02 p 99 lines 1914-1917 4 PMV Response 2016-03-02 p 38 lines 689-691
Pacific Region Science Response Technical Review Assessing
Ecosystem Productivity Model of Roberts Bank
9
Processes taking place outside the modelled ecosystem will contribute to dynamics within the modelled ecosystem (eg lsquooutsidersquo food supporting predators which occur in the Roberts Bank ecosystem for only part of the year predators which may feed in the Roberts Bank ecosystem but export this energy when they migrate out of the region) but which may not be well-resolved by the EwE model The Proponent justifies the spatial scale because it was specifically chosen for the questions being asked in regard to assessing productivity changes and because the relative influences of external exchanges are assumed to be identical with and without the project In addition highly mobile species with broad prey bases were assumed in the model to be partially sustained by external energy from outside the model system5 The distributions of organisms may differ however with and without the project which may affect their interactions with areas outside of the modelled system and the use of diets from outside the modelled system may not reflect the impacts of the project Further clarification of how the EwE model captures the exchanges and interactions with adjacent ecosystems are needed For example it could be argued that an ecosystem which is open to frequent exchanges of water and organic matter from beyond its boundaries might be more robust to local disturbances such as the Project
There are some inconsistencies in the information and assumptions used for some of the taxa in this ecosystem model For Dungeness Crab the justification for estimating total adult biomass (including females) from the biomass of fished males is unclear In addition it is unclear if the slower growth of female crabs once they have reached sexual maturity in comparison with male crabs has been considered The diet matrix for spiny dogfish does not represent the actual diet well in particular of euphausiids herring and shrimp and there are more recent references for biomass estimates of spiny dogfish in the study area than what was used in the EIS
Fishing mortality was not included in the model under the assumption that this would not change with or without the project While this assumption may be true the model has been parameterized by ignoring a source of mortality that will influence total production In essence fishing removes biomass from the ecosystem with the result that less biomass will be available for higher trophic levels How this may impact the ecosystem with and without the Project is unclear but it could make noticeable differences if for example there were thresholds in the feeding responses by these higher trophic level species The Ecopath model that was used is relatively unconstrained since many ecological efficiencies are low even for forage species which would be expected to be higher It is not clear how many species are exploited or the levels of exploitation but even if this does not change with the Project these mortality rates should be included in the model in order to add realistic constraints to the exploited functional groups
333 Model documentation Based on questions from DFO ECCC and NRCan following their initial review of the EIS the Proponent provided written responses dated 2 March 2016 to clarify several of the steps in the model development and implementation However several questions remain including questions about the Ecospace module Ecospace has undergone several recent developments such as the inclusion of the spatial-temporal data layer framework (Steenbeek et al 2013) the habitat capacity model (Christensen et al 2014) and the Monte Carlo analysis including the diet matrix As yet there are few published studies using these latest Ecospace developments and their documentation and justification need to be improved in the EIS
5 PMV Response 2016-03-02 p 29 lines 446 - 464
Pacific Region Science Response Technical Review Assessing
Ecosystem Productivity Model of Roberts Bank
10
Questions also remain regarding how the Monte Carlo randomization routine treated diet data The report indicates that the Monte Carlo routine randomly selected input parameters from the input ranges and that only models that were balanced were used This suggests that a high proportion of models were not balanced and therefore were not used (for example the EIS indicates that about one out of 1000 sampled input parameters was balanced6) A table showing the minimum maximum mode average and median values from the Monte Carlo runs for all the parameters would enable an evaluation of how much variation was actually sampled by the balanced model runs This is recommended in the EwE user information ie ldquoUsers should check the range of the input parameters that were actually used in the trials in the output csv file (see below)rdquo7
In addition there are several issues with the documentation of the derivation of the parameters for the functional groups Such documentation should clearly outline how the input parameter was estimated and the range of uncertainty for that parameter For example the input biomass of pinnipeds was defined as 04 t km 2 derived from estimates of 034 for Harbour seals and two estimates for Steller sea lions (012 and 014 t km 2) No explanation was provided for how the overall estimated pinniped biomass of 04 t km 2 was determined The diet of Sand Lance was described in the EIS as consisting mostly of zooplankton8 whereas the diet table for the model runs9 included 20 macrofauna 10 green algae and 10 detritus It is unclear why these additional prey were included in the diet used for the model runs
334 Highly mobile functional groups This implementation of the EwE framework included transient and migratory functional groups This is entirely appropriate and these groups cannot be excluded The approach taken in the Ecospace module was to impose a low (and conservative) dispersal rate among model spatial units (lsquopixelsrsquo) of 1 km yr-1 This may be appropriate for low mobility benthic organisms but it likely underestimates the movements of many other functional groups The effects of using higher and perhaps functional-group-specific dispersal rates was not considered The Proponents argued that higher dispersal rates would reduce impacts since species can move away from less desirable areas more quickly for completeness these runs should be done and evaluated Mobile species will also bring energy (food) captured outside the system into the modelled ecosystem This process was included in the model with the use of a diet import factor reflecting the consumption of prey outside the modelled region with the assumption that groups with high import rates were unlikely to respond to local changes on Roberts Bank10 This assumption needs justification perhaps at the functional group level for example many species of highly migratory birds and Pacific salmon use the Roberts Bank ecosystem to obtain food to continue their migrations Although this food does not compose a large fraction of their annual consumption it can be critical to enable them to continue their migrations
The EwE model is not designed to capture differences in prey quality ie differences in essential fatty acid or nutrient ratios The same species of prey may have greater or lesser nutritional value to predators depending on the conditions under which they are growing and their seasonal variations This is a particular concern with the nutritional quality of the diatom-dominated biofilm Diatomaceous biofilm is important to the highly migratory Western Sandpiper (Calidris mauri) Despite its predictive merits in relation to other ecosystem
6 EIS Appendix 10D Section 24 p5 7 EwE Help file p 151 8 EIS Appendix 10B Section 4133 p 76 9 EIS Appendix A of Appendix 10B 10 PMV Response 2016-03-02 p 28 lines 429 - 436
Pacific Region Science Response Technical Review Assessing
Ecosystem Productivity Model of Roberts Bank
11
components the EwE model is not informative with respect to understanding the potential impacts of the Project on biofilm and the Western Sandpiper While this example is specific to seabirds the potential exists for differences in the quality of biofilm to also be an issue for copepods which feed on biofilm and consequently to juvenile salmon which feed on these copepods (eg Sutherland et al 2013)
The EwE model is also not designed to predict effects of the Project on water quality although the Proponent noted that ldquoOther abiotic factors not included were deemed to be representative of variables that were already included in the modelhelliprdquo11 The Project may cause changes in physical and water quality conditions whether in isolation or in combination which may impact the productivity or nutritional quality of key prey organisms for local and migratory species which will not be captured by the model The EwE model does not assess the production of key nutrients or the implications of changes in important physical and water quality parameters to biofilm community structure and hence to important migratory birds
The model does not include biotic factors for both pelagic and benthic environments to assess the potential development of eutrophication and benthic organic enrichment events respectively Organic and redox indicators traditional measures of environmental assessments that are used to determine changes in functional group responses were included in the recent Deltaport Third environmental assessment (ie Pelagic chlorophyll dissolved nutrients Benthic sediment carbonnitrogen content redox state [sulfide concentration]) Benthic anoxic events based on organic enrichment are known to be strong drivers of community composition and exclusion regardless of substrate type In the absence of biotic factors (eg organic particulates) the model has not considered the potential for benthic organic enrichment which coincides with siltation processes within the upper tidal flats The tidal flat corner bordered by the Delta-dyke and Deltaport causeway has served as a catchment area for Fraser River silt since the development of the original Deltaport causeway (Sutherland et al 2013) The proposed position of the new terminal placed at the seaward termination of the Deltaport causeway may produce a crescent-shaped feature in the wake of the Fraser River Plume This feature may provide a more efficient silt trap that will promote benthic organic enrichment This piece of the environmental assessment seems to be missing and is important for assessing fish habitat in this area
335 Seasonality (model time step) Input data to parameterize the model were available on a range of time scales from hourly (eg physical data on salinity and water flow) to annual (eg species biomass) The Proponents indicated12 that this is a strength of the EwE model although ultimately the model was run with an annual time step with all sub-annual values being averaged to annual values This method therefore did not incorporate important seasonal processes such as winter-summer differences in salinity and storm properties and the seasonal appearances of abundances of predators and prey such as migratory salmon and birds that are much larger than the annual average For example juvenile salmon migrate from the Fraser River and onto Roberts Bank in the spring before moving into deeper waters If these spring abundances are averaged over the entire year these average abundances would be 5-10 times lower than the actual abundances during the spring (ie averaging the biomass that occurs in two months over a 12 month period) Additionally this method did not capture the intensity of processes such as growth and predation which can be focused over periods of a few weeks to a few months There may be important threshold effects at particular times and places which may be missed when using an 11 EIS Section 10 p 10-11 12 PMV Response 2016-03-02 p 86 line 1655
Pacific Region Science Response Technical Review Assessing
Ecosystem Productivity Model of Roberts Bank
12
annual time step for the model The Ecospace module has a monthly time step13 and therefore it is feasible to run this module with a sub-annual time step For example the Proponents submit14 that there are inadequate data to model the potential effects of the Project on the timing of biofilm production which could have implications for the migratory dunlin and Western Sandpiper However this could be modelled in an exploratory way to determine hypotheses about which factors could affect the timing of production of biofilm and the potential impacts on these birds These issues are of major concern to ECCC
336 Life history structure The EwE model did not separate functional groups into life history stages (stanzas) yet for many functional groups the juvenile stages can have very different life history characteristics and habitats than the adults It is unclear in the description of the model how different life history structures were considered and whether for example there were enough juveniles to produce the adults The implications of not including early life stages should be explored at least qualitatively to identify which species might have life stages that may be more vulnerable to project effects
337 Model balancing Balancing an EwE model is the process by which parameters are adjusted so that there is sufficient production for consumption requirements ie there are sufficient prey for all predators Expert opinion was used to examine parameter values and to adjust for errors or inconsistencies in logic ldquoPMV is confident that since the approach taken to balance the model was based on best practices the steps are appropriaterdquo15 Adjustments to initial parameters to ensure an ecologically-feasible model are necessary and to be expected For a few functional groups however very large changes to initial parameter estimates (which were often not based on Roberts Bank specific data) were necessary for example to transient killer whales When such initial parameters were adjusted (often by substantial amounts) by expert opinion to balance the model the confidence intervals around these adjusted parameter values were not increased to reflect this added uncertainty (see for example PMV Response 2016-03-02 p 51 lines 955-956) When expert opinion was used to make very large changes to initial parameter values broader confidence intervals about these parameters should have been applied This does not appear to have been the case and as a consequence may cause the actual uncertainty of the model outputs to be underestimated
Another example is for the pinniped group in which 50 of the diet was assumed to come from outside the model area in order to balance the model The rationale provided was ldquoThe pinnipeds caused excessive predation mortalities on numerous fish functional groups The biomass of pinnipeds was an average for the Strait of Georgia which was likely too high for Roberts Bank Therefore it was assumed that pinnipeds extracted only half of their diet from the study areardquo16 It is unclear whether the sensitivity of the model to different percentages of diet allocation was explored
As noted above (332) the Ecopath model was relatively unconstrained and few adjustments to input parameters were required to balance the model This is unusual and the low ecotrophic efficiencies of several functional groups suggest that full accounting of energy flows may not have been achieved (an ecotrophic efficiency of 1 indicates that 100 of the production of that
13 EIS Appendix 10C Section 29 p24 14 EIS Appendix 10D Appendix C p72 15 PMV Response 2016-03-02 p 49 lines 910-912 16 EIS Appendix 10C Section 261 p 20
Pacific Region Science Response Technical Review Assessing
Ecosystem Productivity Model of Roberts Bank
13
particular group is being preyed upon or removed by fishing leaving no individuals to die of old age17) An ldquoexcessrdquo of individuals dying of old age ie ecotrophic efficiencies much less than 1 suggests a potentially large biomass that is not used by the ecosystem and instead is converted to detritus
34 Model validation Model validation is the process by which the model parameters variables and outputs are compared with those from the real ecosystem to ascertain how well the model represents the ecosystem It is an essential step in providing confidence that the projections from the model in this case with and without the Project have relevance to how the real ecosystem may be expected to function with and without the Project In practice validating complex ecosystem models is difficult considering the range of assumptions that must be made when building the model the limited available data and natural variability of the ecosystem at a variety of time and space scales
Many of the standard diagnostics for the Ecopath model have not been evaluated in the EIS The Proponent appears to have assumed that once the Ecopath model was balanced then it was valid and fit for purpose The Proponent should provide all the Ecopath estimates of vital rates including mortality rates As presented questions remain For example many Ecotrophic Efficiencies (which control the transfer of biomass from prey to predators) are less than 1 even for taxa which would be expected to be close to 1 such as carnivorous zooplankton The reason for Ecotrophic Efficiencies less than 1 were not discussed or explained in the EIS
Detailed diagnostics for the Ecospace model should also be presented in order to evaluate model performance In response to criticisms by DFO ECCC and NRCan in discussions with the Proponent the latter provided the biomass of the functional groups from the Ecopath model (before Ecospace) and the Ecospace model after the spin-up period (which involved adjusting the parameters from the Ecopath model to balance the 5468 separate cells of the Ecospace model)18 The Proponents argue that ldquoIt is important to note that changes in biomass values generated during the spin-up period are identical for both with and without Project scenarios and thus do not provide information on the potential Project-related effects on productivity19 However several changes to biomass result from the Ecospace balancing process (spin-up period) This is only given brief attention by the Proponent in its response to the DFO ECCC and NRCan questions An analysis of Table 620 revealed that the biomass of 9 functional groups was larger or smaller than the widest confidence limits allowed for each group21 This requires further discussion and justification
The Proponent used a goodness of fit measure to compare spatial distributions of model outputs with field observations They indicated that ldquono other EwE models were identified which use a goodness-of-fit measure Hence the RB model is potentially the first such EwE model where a goodness of fit measure has been appliedrdquo22 The chosen goodness of fit measure is the percent correct classification (PCC) method23 This method derives a test statistic based on the proportion of locations at which predicted occurrences from the model match observed
17 EIS Appendix 10-B p 11 18 PMV Response 2016-03-02 p 65-66 Table 6 19 PMV Response 2016-03-02 p 64 lines 1205-1207 20 PMV Response 2016-03-02 p 65-66 Table 6 21 PMV Response 2016-03-02 p 45 Table 3 22 PMV Response 2016-03-02 p 78 lines 1481-1483 23 PMV Response 2016-03-02 p 78 lines 1483-1484
Pacific Region Science Response Technical Review Assessing
Ecosystem Productivity Model of Roberts Bank
14
occurrences from data and similarly with predicted and observed absences The Proponent then calculated two additional accuracy of fit measures sensitivity (the model predicts a species to occur in an area where it is known to occur in reality) and specificity (the model predicts a species does not occur in an area it is known not to occur in reality)24 This analysis concluded that the model has high predictability for functional groups such as eelgrass and sea pens with relatively static distributions but lower predictability for functional groups which are more temporally and spatially dynamic such as biofilm and green algae25
There are two problems with this approach The first is that this goodness of fit comparison was done only for habitat-forming functional groups no discussion of how well this analysis applies to mobile functional groups was provided The second problem is that this method does not take into account situations (such as occurs in this study with several groups) in which species occur at only a few locations For example ldquohellipif the test data consist of 95 absences and 5 presences and this reflects the true prevalence of the species on the landscape (a realistic scenario for a rare species) a lsquonullrsquo model that predicted absence in all cases (eg no model at all) would be correct 95 of the timehellipldquo (Franklin 2009 p 151) This latter point is important here as these habitat functional groups (biofilm brown algae native eelgrass green algae Japanese eelgrass tidal marsh biomat and orange sea pens26) appear not to occur over most of the Project area (as portrayed by the model outputs presented in the distribution figures of PMV Response 2016-03-02 Appendix 218) It is therefore important that a robust evaluation of the performance of the Ecospace module is used with preferably more than one measure
In summary the starting point for this modelling analysis matters It is not just about a comparison between results with and without the Project The model has to be considered a sufficient representation of the ecosystem The Proponent has not yet sufficiently validated the model
35 Model results 351 Presentation of model results
As noted above (Section 331) the stated objective of the Roberts Bank ecosystem model was not to provide an assessment of Project impacts for each functional group at a fine temporal scale but to estimate changes in productive potential with and without the Project at the ecosystem level27 However results were presented as comparisons by speciesfunctional group with and without the Project and not as potential changes in total ecosystem productivity The revised figures for each functional group showing distributions without the Project with the Project and their difference indicated impacts were likely to be localized with overall impacts relatively small The range of biomass ratios with and without the Project was 045 ndash 189 with most values slightly less than 1 This is interpreted as indicating slight decreases in the capacity of the study area to support biomass and production with the Project for many functional groups28 (Figure 2)
24 PMV Response 2016-03-02 p 80 lines 1524-1527 25 PMV Response 2016-03-02 p 81 lines 1551-1559 26 PMV Response 2016-03-02 p 82 Table 8 27 PMV Response 2016-03-02 p 99 lines 1914-1917 28 PMV Response 2016-03-02 Appendix 218
Pacific Region Science Response Technical Review Assessing
Ecosystem Productivity Model of Roberts Bank
15
Biomass Ratio
Freq
uenc
y
04 07 10 13 16 19
05
1015
2025
30
Figure 2 Histogram of biomass ratios obtained by comparisons of model runs with and without the project (ie With Without) Values less than 1 indicate reductions in biomass with the Project compared against without the Project) Data from Appendix 218 of PMV Response 2016-03-02
352 Sensitivity and vulnerability analyses Every ecosystem model is only one possible representation of the true ecosystem defined by the modelrsquos structure and the values chosen for its many parameters The key point is how well the model represents the real system how that fit can be measured and the sensitivity of model outputs to variability in the selected parameter values The ideal model should be robust to a wide range of uncertainties in the input data and parameters This robustness is determined by performing sensitivity analyses on the model to see how it responds to variations in the input parameters and determining to which input parameters the model is most sensitive
The vulnerability parameters determine the strength of the feeding interactions between functional groups They set the level of density dependence of each functional group Higher vulnerability settings provide greater top-down (predator) control whereas lower settings provide greater bottom-up (environmental) control29 Several publications have shown that EwE models are very sensitive to the vulnerability parameters and Christensen and Walters (2000) point out that a main pitfall of EwE is that ldquopredation vulnerabilities are often underestimated lessening the modelled impacts of predationrdquo It is usual practice to tune Ecopath models including the vulnerability parameters to time series data such as biomass using the temporal simulation model Ecosim However these data were not available for the RBT2 area so this robust method of fitting the model and estimating vulnerability parameters was not possible Instead a vulnerability setting of 2 was used as the default value for the key model runs which is ldquocommon practice when time series data are not available and estimates of vulnerability in the
29 PMV Response 2016-03-02 p 70 lines 1318-1323
Pacific Region Science Response Technical Review Assessing
Ecosystem Productivity Model of Roberts Bank
16
model cannot be maderdquo30 with sensitivity analyses run for a range of 15 to 3 This narrow range was criticized by DFOECCC in initial discussions about the model with the Proponent The Proponent subsequently reran the model with a larger range of vulnerabilities31 (11 to 10) and concluded this broader vulnerability range produced similar results for the productivity ratio with and without the Project to those in the original EIS and that the EIS was more likely to overestimate than underestimate potential project effects32 The data in Table 7 of the PMV Response33 did indicate changes in productivity ratios ranging from 0 to 50 of the defined key run (which used a vulnerability setting of 2) However the Proponent changed all vulnerability settings to the same value ie all were 2 or all were 10 etc In reality the vulnerability parameters resulting from Ecosim models that are fitted to data as described above vary by functional group which was not explored here Therefore although the results suggest that the original choice of 2 for the default key run seemed reasonable the potential effects of variability in vulnerability settings was not fully explored
Sensitivity analyses are usually based on the range of uncertainty estimated for input data and parameters often called the confidence limits around the model parameters The EwE framework integrates many different data sources and parameters including values from the literature It can therefore be difficult to identify ldquoreasonablerdquo confidence limits when derived from such diverse data sources Standard practice in Ecopath models has been to develop a pedigree for each parameter with default values for uncertainty based on the nature of the source data For example parameter values based on high precision field observations of biomass within the model domain receive default confidence intervals of 10 whereas parameter values based on models developed for elsewhere or professional judgment receive confidence intervals of 8034 Sensitivity analyses are then run using parameter values selected from within these confidence intervals However if these default confidence intervals do not capture the full range of variability then the outputs are not informative of the variability in the lsquorealrsquo ecosystem Field observations were collected for many functional groups within the model domain in 2012 and 2013 as part of studies to support the RBT2 EIS Apparently the purpose of these observations was to document spatial variability (in part for the Ecospace model) and temporal variability (measurements at one location over time) and not to derive confidence intervals around the observations35
The reliance on the pedigree approach to derive confidence intervals for this Roberts Bank model was criticized by DFO ECCC and NRCan in discussions with the Proponent As a result the Proponent reran the model with much larger confidence intervals ranging from 30 to 100 depending on the input parameter and functional group36 The results from this new analysis using the broader confidence intervals were similar to those using the original pedigree approach The Proponent noted that ldquoWhile the production within each helliprun was very different there was little difference in the biomass ratio [with and without the Project] These results further demonstrate that even with a greater range in input values the influence of the Project on the Roberts Bank ecosystem is consistent among allhellipmodel runsrdquo37 This provides confidence that the model may be robust to uncertainty in its input parameters Two concerns
30 PMV Response 2016-03-02 p 70 lines 1321-1322 31 PMV Response 2016-03-02 p 71-74 32 PMV Response 2016-03-02 p 71 lines 1339-1341 33 PMV Response 2016-03-02 p 73 34 EIS Appendix 10-C Section 251 page 18 35 PMV Response 2016-03-02 p 42 lines 772-777 36 PMV Response 2016-03-02 p 44-47 37 PMV Response 2016-03-02 p 47 lines 855-858 and see also PMV Response 2016-03-02 Appendix 27-B
Pacific Region Science Response Technical Review Assessing
Ecosystem Productivity Model of Roberts Bank
17
remain however The quote above indicates that the production among the different model runs was very different although with little difference in the biomass ratios with and without the Project Since biomass is not the same as production it would be informative for understanding model performance and potential impacts to show these production differences This also relates to the point made in Section 34 regarding how well the model represents the real ecosystem and not just within-model comparisons with and without the Project The second question is more technical and relates to how the randomization (Monte Carlo or MC) routine that was used to create multiple model runs used the uncertainty about the diet data Diets are not currently included in the MC routine available to regular users of the Ecosim model how they were handled in this RBT2 model appears not to be explained
Finally the sensitivity analyses indicate that the uncertainty in the input parameters does not lead to much difference between model parameters with or without the project However this conclusion does not describe how the uncertainty in the input parameters affects understanding of the ecosystem
40 Conclusions Overall the main conclusion of the Environmental Impact Statement from the Proponent is stated as ldquohellipafter the implementation of mitigation hellipthe Project is not expected to result in any significant adverse effects on any of the 16 valued componentsrdquo38 In addition ldquohellipapproximately 40 of the functional groups are forecast to change no more than 5 which hellip is judged to be within the uncertainty of the model runsrdquo39 although larger changes were forecast for orange sea pens freshwater biofilm green algae and raptors The conclusions from the modelling studies are that ldquohellipthe proposed project will have an impact on the study area that the effect varies between species and that the findings are robust to parameter uncertaintyrdquo40 Specific outcomes by valued component as derived from the EwE model are presented by functional groups in Table 1
38 PMV March 2015 Roberts Bank Environmental Impact Statement Executive Summary ndash Part 1 page 37 39 EIS Appendix 10-C p ii 40 EIS Appendix 10-D p iv
Pacific Region Science Response Technical Review Assessing
Ecosystem Productivity Model of Roberts Bank
18
Table 1 Changes in productive potential with the Project as derived from the EwE model
Changes in productive potential
Ecosystem category
Number of valued
components
Number with potential
biomass loss
Moderate decrease (31-60 decline)
Minor decrease (6-30 decline)
Negligible (0-5
change)
Minor increase (6-
30 increase)
Moderate increase (31-60 increase)
Source
Marine vegetation
7 7 - 3 2 2 - EIS Vol 3 Section 11 Table 11-17 page 11-65
Marine invertebrates
4 3 1 1 1 1 - EIS Vol 3 Section 12 Table 12-8 page 12-52
Marine fish 13 13 - 2 6 5 - EIS Vol 3 Section 13 Table 13-10 page 13-95
Coastal birds
11 8 - 3 4 3 1 EIS Vol 3 Section 15 Table 15-10 page 15-67
Pacific Region Science Response Technical Review Assessing
Ecosystem Productivity Model of Roberts Bank
19
Most functional groups showed some potential biomass loss with the Project with biomass loss defined as any model run with negative outcomes (ie in which biomass with the project was less than biomass without the Project) The summary of changes in productivity potential are mixed with most (33 out of 35) valued components showing minor decreases to minor increases (defined as 6 to 30 changes in productive potential with the Project compared to without the Project)
The main conclusions of this review in regards to the Terms of Reference are
1 Do the functional groups and abiotic variables used in the model adequately represent the ecosystem at Roberts Bank
o The 58 functional groups and abiotic variables used in the model adequately represent the main components of the Roberts Bank ecosystem however for longer lived species the life stages of the species are not well represented and some of the impacts of the Project may be expected to affect specific life stages
o The abiotic variables adequately represent the physical drivers of this ecosystem on an annual time scale However annual values for these abiotic variables may not adequately capture important sub-annual events such as storms (DFO 2016) the timing of arrival and departure of highly migratory species and whether there may be important sub-annual thresholds or mismatches in timing as a result of the Project
o Biotic factors (eg nutrients) which are particularly important for biofilm and other lower trophic level taxa are not included in this model The model is therefore unable to assess the potential development of eutrophication and benthic organic enrichment events which may affect fish habitats in the study area
2 Are the parameter estimates used by the model valid and defensible for this system
o In general parameter estimates appear to be adequate for this system Field studies were done in two years to provide data in particular on distributions of selected functional groups for the Ecospace module Note the distribution studies focussed on taxa which were relatively immobile and therefore lsquofixedrsquo in space
o the selection of some model parameters would benefit from further explanation for example the choice of fixed diet matrices versus dynamic matrices which can vary with changes in abundances or predators and prey
o the selection of some model parameters would benefit from further explanation for example the link between the diets described in the text of Appendix 10B and the quantities presented in Appendix A of Appendix 10B It is understood that proportions were derived using the ldquofixed selectivityrdquo principle but in order to be fully transparent the derivation of each diet should be provided in an appendix
o discussion and explanation is needed of why ecotrophic efficiencies differ from expected values (eg the ecotrophic efficiency for Pacific herring is listed as 038) and
o the abiotic factor lsquosubstratersquo was limited to ldquohardrdquo or rdquosoftrdquo options which can be restrictive given that they serve as endpoints on a substrate composition continuum These limited options may not provide the sensitivity required to assess substrate preference nor the flexibility for taxa (eg motile organisms) that span hard mixed and soft substrate types In addition it is not clear if changes in the hardsoft categories were considered over time within identified depositional or erosional settings before and after construction
Pacific Region Science Response Technical Review Assessing
Ecosystem Productivity Model of Roberts Bank
20
3 Are the limitations and uncertainties of the model identified and appropriately considered when determining the modelrsquos representation of current and possible future conditions
o the EwE model was not designed to evaluate a range of future conditions It was designed to estimate changes in the productive potential at the ecosystem level with and without the Project Therefore the model was run without the Project and with the Project for a range of plausible abiotic conditions and the results were compared with respect to biomass and productivity by functional group
o the pedigree approach to assessing the uncertainties of model outcomes is unsatisfactory for the purpose here as it relates solely to a qualitative judgment of the value of data based on its source However when the model was rerun with much wider ranges of confidence intervals (uncertainties) the results in general (but not necessarily for each functional group) were similar to the results using the original pedigree approach This suggests that taken overall the model may be robust to wide ranges of uncertainty in these input variables and parameters
o there is inadequate validation of the model This is inadequate for three reasons
(i) the basic Ecopath model is not validated and the Ecospace balancing process (the spin-up period) resulted in some biomass estimates being increased or decreased beyond their confidence limits
(ii) the goodness of fit test used to evaluate how well the model predicted the spatial occurrence functional groups is not fit for purpose (Section 34) and
(iii) validation was provided for only a small number of functional groups (the habitat-forming functional groups) As a consequence the model is currently not validated
o Considering the proportion of open boundaries relative to closed boundaries in the model processes taking place outside the modelled ecosystem are likely to contribute to dynamics within the modelled ecosystem However these external processes may not be well-resolved by the EwE model as currently configured
4 Are the model results related to the potential effects of the Project on fish and fish habitat and migratory birds and their food resources valid and defensible
o this is a very complex ecosystem model constructed for a relatively small and open (in the sense of considerable exchange with adjacent non-modelled areas) system Many assumptions have been made based on poor or missing data Taking all these considerations into account the model does the best job possible of comparing the biomass and productivity of the Roberts Bank ecosystem with and without the Project
o the extent to which the model adequately represents the lsquorealrsquo ecosystem of Roberts Bank as opposed to comparisons of model results with and without the Project is unclear as a number of basic diagnostics are not presented (see point 3 above)
o the EwE model is not capable of and is not designed to represent nutritional and food quality variations in prey functional groups and how these may impact highly migratory predators such as birds with and without the Project
5 Is the EwE model framework a valid method to quantify large scale impacts to fish habitat fish productivity and migratory bird productivity
o the EwE model as implemented in this project and reviewed here is a useful first-order framework to organise information and derive initial estimates of how the system may respond to perturbations
Pacific Region Science Response Technical Review Assessing
Ecosystem Productivity Model of Roberts Bank
21
o the utility of a EWE model for impact purposes is highly dependent on the quality of input data
o each EwE model is highly dependent on local conditions Although appropriate as an overall methodology each application would need to be reviewed for how it may be applied to any new ecosystem and
o the EwE model would need to be substantially reformulated if it was to include considerations of changes in chemical composition or food quality of prey in particular for seasonal migratory species such as birds which may depend on very large biomasses of prey with specific chemical composition to fuel their migrations beyond the ecosystem model boundaries
Contributors Contributor Affiliation Ian Perry Author DFO Science Pacific Region Alida Bundy Author DFO Science Maritimes Region Terri Sutherland Author DFO Science Pacific Region Robert Elner Author ECCC Canadian Wildlife Service Andrew Robinson Author ECCC Canadian Wildlife Service Lesley MacDougall Editor DFO Science Pacific Region
Approved by Carmel Lowe
Regional Director Science Branch Pacific Region Fisheries and Oceans Canada
November 4 2016
Sources of Information Christensen V Coll M Steenbeek J Buszowski J Chagaris D walters CJ 2014
Representing variable habitat quality in a spatial food web model Ecosystems 17 1397-1412
Christensen V and Walters C 2000 Ecopath with Ecosim methods capabilities and limitations Ecological Modelling 172 109-139
Colleacuteter M Valls A Guitton J Gascuel D Pauly D and Christensen V 2015 Global overview of the applications of the Ecopath with Ecosim modeling approach using the EcoBase models repository Ecological Modelling 302 pp42-53
Compass Resource Management Ltd 2013 Roberts Bank Terminal 2 Technical Advisory Group (TAG) Process Report Productive Capacity ndash Final Report 119pp (Accessed November 1 2016)
DFO 2016 Technical Review of Roberts Bank Terminal 2 Environmental Assessment Section 95 ndash Coastal Geomorphology DFO Can Sci Advis Sec Sci Resp 2016045 (Accessed November 4 2016)
Pacific Region Science Response Technical Review Assessing
Ecosystem Productivity Model of Roberts Bank
22
ESSA Technologies 2014a Roberts Bank Terminal 2 Project Roberts Bank Delta BC Environmental Impact Statement Volume 3 Biophysical Effects Assessments Appendix 10-C Roberts Bank Ecosystem Model Development and Key Run Port Metro Vancouver (Accessed November 1 2016)
ESSA Technologies 2014b Roberts Bank Terminal 2 Project Roberts Bank Delta BC Environmental Impact Statement Volume 3 Biophysical Effects Assessments Appendix 10-D Roberts Bank Ecosystem Model Sensitivity Analyses Port Metro Vancouver (Accessed November 1 2016)
Franklin J 2009 Mapping Species Distributions Spatial Inference and Prediction Cambridge University Press Cambridge
Hemmera 2014 Roberts Bank Terminal 2 Project Roberts Bank Delta BC Environmental Impact Statement Volume 3 Biophysical Effects Assessments Appendix 10-B Roberts Bank Ecosystem Model Parameter Estimates Port Metro Vancouver File 302-03503 (Accessed November 1 2016)
Port Metro Vancouver 2015a Roberts Bank Terminal 2 Project Roberts Bank Delta BC Environmental Impact Statement Volume 3 Biophysical Effects Assessments Section 100 Biophysical Setting (Accessed November 1 2016)
Port Metro Vancouver 2015b Roberts Bank Terminal 2 Project Roberts Bank Delta BC Environmental Impact Statement Volume 3 Biophysical Effects Assessments Section 103 Overview of Assessing Ecosystem Productivity (Accessed November 1 2016)
Port Metro Vancouver 2015c Roberts Bank Terminal 2 Project Environmental Assessment Additional Information Requirements (July 31 2015) Responses Response to Information Request 6 IR-73115-06 Canadian Environmental Assessment Agency Reference Number 80054 dated 26 October 2015
Steenbeek J Coll M Gurney L Meacutelin F Hoepffner N Buszowski J and Christensen V 2013 Bridging the gap between ecosystem modeling tools and geographic information systems Driving a food web model with external spatialndashtemporal data Ecological Modelling 263 139ndash 151
Sutherland T Elner R and OrsquoNeill J 2013 Roberts Bank Ecological crucible of the Fraser River estuary Progress in Oceanography 115 171ndash180
Vancouver Fraser Port Authority 2016 From the Vancouver Fraser Port Authority to the Review Panel re Answers to preliminary technical questions submitted during the completeness phase from Fisheries and Oceans Canada Natural Resources Canada and Environment and Climate Change Canada concerning the ecosystem modelling to support the Roberts Bank Terminal 2 Project environmental review CEAR Document 547 (Accessed November 1 2016)
Pacific Region Science Response Technical Review Assessing
Ecosystem Productivity Model of Roberts Bank
23
This Report is Available from the Centre for Science Advice
Pacific Region Fisheries and Oceans Canada
3190 Hammond Bay Road Nanaimo BC V9T 6N7
Telephone (250) 756-7208 E-Mail csapdfo-mpogcca
Internet address wwwdfo-mpogccacsas-sccs
ISSN 1919-3769 copy Her Majesty the Queen in Right of Canada 2016
Correct Citation for this Publication
DFO 2016 Technical review of Roberts Bank Terminal 2 environmental assessment section 103 ndash assessing ecosystem productivity DFO Can Sci Advis Sec Sci Resp 2016050
Aussi disponible en franccedilais
MPO 2016 Examen technique de leacutevaluation environnementale du Terminal 2 agrave Roberts Bank section 103 ndash eacutevaluation de la productiviteacute de leacutecosystegraveme Secr can de consult sci du MPO Reacutep des Sci 2016050

Pacific Region Science Response Technical Review Assessing
Ecosystem Productivity Model of Roberts Bank
15
Biomass Ratio
Freq
uenc
y
04 07 10 13 16 19
05
1015
2025
30
Figure 2 Histogram of biomass ratios obtained by comparisons of model runs with and without the project (ie With Without) Values less than 1 indicate reductions in biomass with the Project compared against without the Project) Data from Appendix 218 of PMV Response 2016-03-02
352 Sensitivity and vulnerability analyses Every ecosystem model is only one possible representation of the true ecosystem defined by the modelrsquos structure and the values chosen for its many parameters The key point is how well the model represents the real system how that fit can be measured and the sensitivity of model outputs to variability in the selected parameter values The ideal model should be robust to a wide range of uncertainties in the input data and parameters This robustness is determined by performing sensitivity analyses on the model to see how it responds to variations in the input parameters and determining to which input parameters the model is most sensitive
The vulnerability parameters determine the strength of the feeding interactions between functional groups They set the level of density dependence of each functional group Higher vulnerability settings provide greater top-down (predator) control whereas lower settings provide greater bottom-up (environmental) control29 Several publications have shown that EwE models are very sensitive to the vulnerability parameters and Christensen and Walters (2000) point out that a main pitfall of EwE is that ldquopredation vulnerabilities are often underestimated lessening the modelled impacts of predationrdquo It is usual practice to tune Ecopath models including the vulnerability parameters to time series data such as biomass using the temporal simulation model Ecosim However these data were not available for the RBT2 area so this robust method of fitting the model and estimating vulnerability parameters was not possible Instead a vulnerability setting of 2 was used as the default value for the key model runs which is ldquocommon practice when time series data are not available and estimates of vulnerability in the
29 PMV Response 2016-03-02 p 70 lines 1318-1323
Pacific Region Science Response Technical Review Assessing
Ecosystem Productivity Model of Roberts Bank
16
model cannot be maderdquo30 with sensitivity analyses run for a range of 15 to 3 This narrow range was criticized by DFOECCC in initial discussions about the model with the Proponent The Proponent subsequently reran the model with a larger range of vulnerabilities31 (11 to 10) and concluded this broader vulnerability range produced similar results for the productivity ratio with and without the Project to those in the original EIS and that the EIS was more likely to overestimate than underestimate potential project effects32 The data in Table 7 of the PMV Response33 did indicate changes in productivity ratios ranging from 0 to 50 of the defined key run (which used a vulnerability setting of 2) However the Proponent changed all vulnerability settings to the same value ie all were 2 or all were 10 etc In reality the vulnerability parameters resulting from Ecosim models that are fitted to data as described above vary by functional group which was not explored here Therefore although the results suggest that the original choice of 2 for the default key run seemed reasonable the potential effects of variability in vulnerability settings was not fully explored
Sensitivity analyses are usually based on the range of uncertainty estimated for input data and parameters often called the confidence limits around the model parameters The EwE framework integrates many different data sources and parameters including values from the literature It can therefore be difficult to identify ldquoreasonablerdquo confidence limits when derived from such diverse data sources Standard practice in Ecopath models has been to develop a pedigree for each parameter with default values for uncertainty based on the nature of the source data For example parameter values based on high precision field observations of biomass within the model domain receive default confidence intervals of 10 whereas parameter values based on models developed for elsewhere or professional judgment receive confidence intervals of 8034 Sensitivity analyses are then run using parameter values selected from within these confidence intervals However if these default confidence intervals do not capture the full range of variability then the outputs are not informative of the variability in the lsquorealrsquo ecosystem Field observations were collected for many functional groups within the model domain in 2012 and 2013 as part of studies to support the RBT2 EIS Apparently the purpose of these observations was to document spatial variability (in part for the Ecospace model) and temporal variability (measurements at one location over time) and not to derive confidence intervals around the observations35
The reliance on the pedigree approach to derive confidence intervals for this Roberts Bank model was criticized by DFO ECCC and NRCan in discussions with the Proponent As a result the Proponent reran the model with much larger confidence intervals ranging from 30 to 100 depending on the input parameter and functional group36 The results from this new analysis using the broader confidence intervals were similar to those using the original pedigree approach The Proponent noted that ldquoWhile the production within each helliprun was very different there was little difference in the biomass ratio [with and without the Project] These results further demonstrate that even with a greater range in input values the influence of the Project on the Roberts Bank ecosystem is consistent among allhellipmodel runsrdquo37 This provides confidence that the model may be robust to uncertainty in its input parameters Two concerns
30 PMV Response 2016-03-02 p 70 lines 1321-1322 31 PMV Response 2016-03-02 p 71-74 32 PMV Response 2016-03-02 p 71 lines 1339-1341 33 PMV Response 2016-03-02 p 73 34 EIS Appendix 10-C Section 251 page 18 35 PMV Response 2016-03-02 p 42 lines 772-777 36 PMV Response 2016-03-02 p 44-47 37 PMV Response 2016-03-02 p 47 lines 855-858 and see also PMV Response 2016-03-02 Appendix 27-B
Pacific Region Science Response Technical Review Assessing
Ecosystem Productivity Model of Roberts Bank
17
remain however The quote above indicates that the production among the different model runs was very different although with little difference in the biomass ratios with and without the Project Since biomass is not the same as production it would be informative for understanding model performance and potential impacts to show these production differences This also relates to the point made in Section 34 regarding how well the model represents the real ecosystem and not just within-model comparisons with and without the Project The second question is more technical and relates to how the randomization (Monte Carlo or MC) routine that was used to create multiple model runs used the uncertainty about the diet data Diets are not currently included in the MC routine available to regular users of the Ecosim model how they were handled in this RBT2 model appears not to be explained
Finally the sensitivity analyses indicate that the uncertainty in the input parameters does not lead to much difference between model parameters with or without the project However this conclusion does not describe how the uncertainty in the input parameters affects understanding of the ecosystem
40 Conclusions Overall the main conclusion of the Environmental Impact Statement from the Proponent is stated as ldquohellipafter the implementation of mitigation hellipthe Project is not expected to result in any significant adverse effects on any of the 16 valued componentsrdquo38 In addition ldquohellipapproximately 40 of the functional groups are forecast to change no more than 5 which hellip is judged to be within the uncertainty of the model runsrdquo39 although larger changes were forecast for orange sea pens freshwater biofilm green algae and raptors The conclusions from the modelling studies are that ldquohellipthe proposed project will have an impact on the study area that the effect varies between species and that the findings are robust to parameter uncertaintyrdquo40 Specific outcomes by valued component as derived from the EwE model are presented by functional groups in Table 1
38 PMV March 2015 Roberts Bank Environmental Impact Statement Executive Summary ndash Part 1 page 37 39 EIS Appendix 10-C p ii 40 EIS Appendix 10-D p iv
Pacific Region Science Response Technical Review Assessing
Ecosystem Productivity Model of Roberts Bank
18
Table 1 Changes in productive potential with the Project as derived from the EwE model
Changes in productive potential
Ecosystem category
Number of valued
components
Number with potential
biomass loss
Moderate decrease (31-60 decline)
Minor decrease (6-30 decline)
Negligible (0-5
change)
Minor increase (6-
30 increase)
Moderate increase (31-60 increase)
Source
Marine vegetation
7 7 - 3 2 2 - EIS Vol 3 Section 11 Table 11-17 page 11-65
Marine invertebrates
4 3 1 1 1 1 - EIS Vol 3 Section 12 Table 12-8 page 12-52
Marine fish 13 13 - 2 6 5 - EIS Vol 3 Section 13 Table 13-10 page 13-95
Coastal birds
11 8 - 3 4 3 1 EIS Vol 3 Section 15 Table 15-10 page 15-67
Pacific Region Science Response Technical Review Assessing
Ecosystem Productivity Model of Roberts Bank
19
Most functional groups showed some potential biomass loss with the Project with biomass loss defined as any model run with negative outcomes (ie in which biomass with the project was less than biomass without the Project) The summary of changes in productivity potential are mixed with most (33 out of 35) valued components showing minor decreases to minor increases (defined as 6 to 30 changes in productive potential with the Project compared to without the Project)
The main conclusions of this review in regards to the Terms of Reference are
1 Do the functional groups and abiotic variables used in the model adequately represent the ecosystem at Roberts Bank
o The 58 functional groups and abiotic variables used in the model adequately represent the main components of the Roberts Bank ecosystem however for longer lived species the life stages of the species are not well represented and some of the impacts of the Project may be expected to affect specific life stages
o The abiotic variables adequately represent the physical drivers of this ecosystem on an annual time scale However annual values for these abiotic variables may not adequately capture important sub-annual events such as storms (DFO 2016) the timing of arrival and departure of highly migratory species and whether there may be important sub-annual thresholds or mismatches in timing as a result of the Project
o Biotic factors (eg nutrients) which are particularly important for biofilm and other lower trophic level taxa are not included in this model The model is therefore unable to assess the potential development of eutrophication and benthic organic enrichment events which may affect fish habitats in the study area
2 Are the parameter estimates used by the model valid and defensible for this system
o In general parameter estimates appear to be adequate for this system Field studies were done in two years to provide data in particular on distributions of selected functional groups for the Ecospace module Note the distribution studies focussed on taxa which were relatively immobile and therefore lsquofixedrsquo in space
o the selection of some model parameters would benefit from further explanation for example the choice of fixed diet matrices versus dynamic matrices which can vary with changes in abundances or predators and prey
o the selection of some model parameters would benefit from further explanation for example the link between the diets described in the text of Appendix 10B and the quantities presented in Appendix A of Appendix 10B It is understood that proportions were derived using the ldquofixed selectivityrdquo principle but in order to be fully transparent the derivation of each diet should be provided in an appendix
o discussion and explanation is needed of why ecotrophic efficiencies differ from expected values (eg the ecotrophic efficiency for Pacific herring is listed as 038) and
o the abiotic factor lsquosubstratersquo was limited to ldquohardrdquo or rdquosoftrdquo options which can be restrictive given that they serve as endpoints on a substrate composition continuum These limited options may not provide the sensitivity required to assess substrate preference nor the flexibility for taxa (eg motile organisms) that span hard mixed and soft substrate types In addition it is not clear if changes in the hardsoft categories were considered over time within identified depositional or erosional settings before and after construction
Pacific Region Science Response Technical Review Assessing
Ecosystem Productivity Model of Roberts Bank
20
3 Are the limitations and uncertainties of the model identified and appropriately considered when determining the modelrsquos representation of current and possible future conditions
o the EwE model was not designed to evaluate a range of future conditions It was designed to estimate changes in the productive potential at the ecosystem level with and without the Project Therefore the model was run without the Project and with the Project for a range of plausible abiotic conditions and the results were compared with respect to biomass and productivity by functional group
o the pedigree approach to assessing the uncertainties of model outcomes is unsatisfactory for the purpose here as it relates solely to a qualitative judgment of the value of data based on its source However when the model was rerun with much wider ranges of confidence intervals (uncertainties) the results in general (but not necessarily for each functional group) were similar to the results using the original pedigree approach This suggests that taken overall the model may be robust to wide ranges of uncertainty in these input variables and parameters
o there is inadequate validation of the model This is inadequate for three reasons
(i) the basic Ecopath model is not validated and the Ecospace balancing process (the spin-up period) resulted in some biomass estimates being increased or decreased beyond their confidence limits
(ii) the goodness of fit test used to evaluate how well the model predicted the spatial occurrence functional groups is not fit for purpose (Section 34) and
(iii) validation was provided for only a small number of functional groups (the habitat-forming functional groups) As a consequence the model is currently not validated
o Considering the proportion of open boundaries relative to closed boundaries in the model processes taking place outside the modelled ecosystem are likely to contribute to dynamics within the modelled ecosystem However these external processes may not be well-resolved by the EwE model as currently configured
4 Are the model results related to the potential effects of the Project on fish and fish habitat and migratory birds and their food resources valid and defensible
o this is a very complex ecosystem model constructed for a relatively small and open (in the sense of considerable exchange with adjacent non-modelled areas) system Many assumptions have been made based on poor or missing data Taking all these considerations into account the model does the best job possible of comparing the biomass and productivity of the Roberts Bank ecosystem with and without the Project
o the extent to which the model adequately represents the lsquorealrsquo ecosystem of Roberts Bank as opposed to comparisons of model results with and without the Project is unclear as a number of basic diagnostics are not presented (see point 3 above)
o the EwE model is not capable of and is not designed to represent nutritional and food quality variations in prey functional groups and how these may impact highly migratory predators such as birds with and without the Project
5 Is the EwE model framework a valid method to quantify large scale impacts to fish habitat fish productivity and migratory bird productivity
o the EwE model as implemented in this project and reviewed here is a useful first-order framework to organise information and derive initial estimates of how the system may respond to perturbations
Pacific Region Science Response Technical Review Assessing
Ecosystem Productivity Model of Roberts Bank
21
o the utility of a EWE model for impact purposes is highly dependent on the quality of input data
o each EwE model is highly dependent on local conditions Although appropriate as an overall methodology each application would need to be reviewed for how it may be applied to any new ecosystem and
o the EwE model would need to be substantially reformulated if it was to include considerations of changes in chemical composition or food quality of prey in particular for seasonal migratory species such as birds which may depend on very large biomasses of prey with specific chemical composition to fuel their migrations beyond the ecosystem model boundaries
Contributors Contributor Affiliation Ian Perry Author DFO Science Pacific Region Alida Bundy Author DFO Science Maritimes Region Terri Sutherland Author DFO Science Pacific Region Robert Elner Author ECCC Canadian Wildlife Service Andrew Robinson Author ECCC Canadian Wildlife Service Lesley MacDougall Editor DFO Science Pacific Region
Approved by Carmel Lowe
Regional Director Science Branch Pacific Region Fisheries and Oceans Canada
November 4 2016
Sources of Information Christensen V Coll M Steenbeek J Buszowski J Chagaris D walters CJ 2014
Representing variable habitat quality in a spatial food web model Ecosystems 17 1397-1412
Christensen V and Walters C 2000 Ecopath with Ecosim methods capabilities and limitations Ecological Modelling 172 109-139
Colleacuteter M Valls A Guitton J Gascuel D Pauly D and Christensen V 2015 Global overview of the applications of the Ecopath with Ecosim modeling approach using the EcoBase models repository Ecological Modelling 302 pp42-53
Compass Resource Management Ltd 2013 Roberts Bank Terminal 2 Technical Advisory Group (TAG) Process Report Productive Capacity ndash Final Report 119pp (Accessed November 1 2016)
DFO 2016 Technical Review of Roberts Bank Terminal 2 Environmental Assessment Section 95 ndash Coastal Geomorphology DFO Can Sci Advis Sec Sci Resp 2016045 (Accessed November 4 2016)
Pacific Region Science Response Technical Review Assessing
Ecosystem Productivity Model of Roberts Bank
22
ESSA Technologies 2014a Roberts Bank Terminal 2 Project Roberts Bank Delta BC Environmental Impact Statement Volume 3 Biophysical Effects Assessments Appendix 10-C Roberts Bank Ecosystem Model Development and Key Run Port Metro Vancouver (Accessed November 1 2016)
ESSA Technologies 2014b Roberts Bank Terminal 2 Project Roberts Bank Delta BC Environmental Impact Statement Volume 3 Biophysical Effects Assessments Appendix 10-D Roberts Bank Ecosystem Model Sensitivity Analyses Port Metro Vancouver (Accessed November 1 2016)
Franklin J 2009 Mapping Species Distributions Spatial Inference and Prediction Cambridge University Press Cambridge
Hemmera 2014 Roberts Bank Terminal 2 Project Roberts Bank Delta BC Environmental Impact Statement Volume 3 Biophysical Effects Assessments Appendix 10-B Roberts Bank Ecosystem Model Parameter Estimates Port Metro Vancouver File 302-03503 (Accessed November 1 2016)
Port Metro Vancouver 2015a Roberts Bank Terminal 2 Project Roberts Bank Delta BC Environmental Impact Statement Volume 3 Biophysical Effects Assessments Section 100 Biophysical Setting (Accessed November 1 2016)
Port Metro Vancouver 2015b Roberts Bank Terminal 2 Project Roberts Bank Delta BC Environmental Impact Statement Volume 3 Biophysical Effects Assessments Section 103 Overview of Assessing Ecosystem Productivity (Accessed November 1 2016)
Port Metro Vancouver 2015c Roberts Bank Terminal 2 Project Environmental Assessment Additional Information Requirements (July 31 2015) Responses Response to Information Request 6 IR-73115-06 Canadian Environmental Assessment Agency Reference Number 80054 dated 26 October 2015
Steenbeek J Coll M Gurney L Meacutelin F Hoepffner N Buszowski J and Christensen V 2013 Bridging the gap between ecosystem modeling tools and geographic information systems Driving a food web model with external spatialndashtemporal data Ecological Modelling 263 139ndash 151
Sutherland T Elner R and OrsquoNeill J 2013 Roberts Bank Ecological crucible of the Fraser River estuary Progress in Oceanography 115 171ndash180
Vancouver Fraser Port Authority 2016 From the Vancouver Fraser Port Authority to the Review Panel re Answers to preliminary technical questions submitted during the completeness phase from Fisheries and Oceans Canada Natural Resources Canada and Environment and Climate Change Canada concerning the ecosystem modelling to support the Roberts Bank Terminal 2 Project environmental review CEAR Document 547 (Accessed November 1 2016)
Pacific Region Science Response Technical Review Assessing
Ecosystem Productivity Model of Roberts Bank
23
This Report is Available from the Centre for Science Advice
Pacific Region Fisheries and Oceans Canada
3190 Hammond Bay Road Nanaimo BC V9T 6N7
Telephone (250) 756-7208 E-Mail csapdfo-mpogcca
Internet address wwwdfo-mpogccacsas-sccs
ISSN 1919-3769 copy Her Majesty the Queen in Right of Canada 2016
Correct Citation for this Publication
DFO 2016 Technical review of Roberts Bank Terminal 2 environmental assessment section 103 ndash assessing ecosystem productivity DFO Can Sci Advis Sec Sci Resp 2016050
Aussi disponible en franccedilais
MPO 2016 Examen technique de leacutevaluation environnementale du Terminal 2 agrave Roberts Bank section 103 ndash eacutevaluation de la productiviteacute de leacutecosystegraveme Secr can de consult sci du MPO Reacutep des Sci 2016050
- TECHNICAL REVIEW OF ROBERTS BANK TERMINAL 2 ENVIRONMENTAL ASSESSMENT SECTION 103 ndash ASSESSING ECOSYSTEM PRODUCTIVITY
-
- 10 Context
- 20 Background
-
- 21 Background and Terms of Reference
- 22 Approach to assessing ecosystem productivity
-
- 30 Analysis and Response
-
- 31 The EwE Team
- 32 Overview of assessment results of hydrological and sediment modelling
- 33 Model implementation
-
- 331 The purpose of the EwE model
- 332 Applicability of the EwE model framework to the Roberts Bank region
- 333 Model documentation
- 334 Highly mobile functional groups
- 335 Seasonality (model time step)
- 336 Life history structure
- 337 Model balancing
-
- 34 Model validation
- 35 Model results
-
- 351 Presentation of model results
- 352 Sensitivity and vulnerability analyses
-
- 40 Conclusions
- Contributors
- Approved by
- Sources of Information
- This Report is Available from the
-
- CSAS 2016-50 - Assessing Ecosystem Productivitypdf
-
- TECHNICAL REVIEW OF ROBERTS BANK TERMINAL 2 ENVIRONMENTAL ASSESSMENT SECTION 103 ndash ASSESSING ECOSYSTEM PRODUCTIVITY
-
- 10 Context
- 20 Background
-
- 21 Background and Terms of Reference
- 22 Approach to assessing ecosystem productivity
-
- 30 Analysis and Response
-
- 31 The EwE Team
- 32 Overview of assessment results of hydrological and sediment modelling
- 33 Model implementation
-
- 331 The purpose of the EwE model
- 332 Applicability of the EwE model framework to the Roberts Bank region
- 333 Model documentation
- 334 Highly mobile functional groups
- 335 Seasonality (model time step)
- 336 Life history structure
- 337 Model balancing
-
- 34 Model validation
- 35 Model results
-
- 351 Presentation of model results
- 352 Sensitivity and vulnerability analyses
-
- 40 Conclusions
- Contributors
- Approved by
- Sources of Information
- This Report is Available from the
-
Canadian Science Advisory Secretariat Pacific Region Science Response 2016050
December 2016
TECHNICAL REVIEW OF ROBERTS BANK TERMINAL 2 ENVIRONMENTAL ASSESSMENT SECTION 103 ndash
ASSESSING ECOSYSTEM PRODUCTIVITY
10 Context Vancouver Fraser Port Authority (VFPA) formerly Port Metro Vancouver (the Proponent) is proposing to construct and operate the Roberts Bank Terminal 2 Project (the Project) a new three-berth marine container terminal at Roberts Bank in Delta British Columbia The proposed terminal is located next to the existing Deltaport and Westshore Terminals In addition to the construction of the new terminal the Proponent has proposed to widen the north side of the existing Roberts Bank causeway from its east-end connection with the mainland to the entrance to the new terminal The existing tug basin connected to the northeast side of Deltaport Terminal is also proposed to be expanded The new marine terminal is predicted by the Proponent to process up to 260 container ship calls per year at full capacity with the assistance of two or three large berthing or escort tugs to manoeuver ships into or away from assigned berths The terminal is designed to operate 24 hours per day year-round
The Roberts Bank Terminal 2 Project is subject to an environmental assessment by a Review Panel pursuant to the Canadian Environmental Assessment Act 2012 As a federal authority in the environmental assessment for the Project Fisheries and Oceans Canada (DFO) will be asked to present information to the review panel and at public hearings in relation to its expertise on the effects of the Project on fish and fish habitat including aquatic species at risk and the adequacy of mitigation and offsetting measures and monitoring and follow-up programs proposed by the Proponent DFOrsquos Pacific Region Fisheries Protection Program (FPP) will coordinate DFOrsquos participation in the environmental assessment
The Proponent assessed future ecosystem productivity at Roberts Bank using the Ecopath with Ecosim and Ecospace (EwE) model framework The potential impacts of the Project to hydrodynamic conditions and sediment transport in the area as a result of changes in wind wave and current patterns and intensities are projected using different model frameworks A companion Science Response (DFO 2016) has been developed by DFO and Natural Resource Canada (NRCan) to review Section 95 ldquoCoastal Geomorphologyrdquo of the Environmental Impact Statement (EIS) which describes the hydrodynamic and sedimentology models that were used to evaluate the effect of the Project on water and sediment movements
Outcomes of the EwE models are incorporated into the analysis of the potential project-related effects on the ongoing productivity of commercial recreational and Aboriginal fisheries Consequently DFO FPP has requested that DFO Science Branch provide an evaluation of the Proponentrsquos characterization of project-related effects as conducted using the Ecopath with Ecosim and Ecospace (EwE) ecosystem model
Pacific Region Science Response Technical Review Assessing
Ecosystem Productivity Model of Roberts Bank
2
The objectives for this Science Response are to
1 Determine if the functional groups and abiotic factors used in the model adequately represent the ecosystem at Roberts Bank
2 Assess whether the parameter estimates used by the model are valid and defensible for this system
3 Assess whether the limitations and uncertainties of the model are identified and appropriately considered when determining the modelrsquos representation of current and possible future conditions
4 Provide advice regarding whether the model results related to the potential effects of the Project on fish and fish habitat and migratory birds and their food resources are valid and defensible
5 If possible provide advice regarding the validity of using the EwE model framework to quantify large scale impacts to fish habitat and fisheries productivity and the productivity of migratory birds
This Science Response evaluates Section 100 ldquoBiophysical Settingrdquo with a focus on Section 103 ldquoOverview of Assessing Ecosystem Productivityrdquo in the EIS as submitted by the Proponent (Port Metro Vancouver 2015) This Section and consequently this Response describes the ecosystem modelling approach that was taken to evaluate the direct and indirect effects of the footprint of the proposed terminal and widened causeway herein referred to as lsquothe Projectrsquo This ecosystem model provides outputs related to potential effects of the project on the study area at an ecosystem level including aquatic species and bird species in the Project area Evaluation of the model and its outputs therefore required expertise in both fishery aquatic species and migratory bird species Consequently this Science Response is the product of a joint review between DFO and Environment and Climate Change Canada (ECCC) Canadian Wildlife Service and Wildlife and Landscape Science to provide a complete evaluation
This Science Response Report results from the Science Response Process of July 2016 on the Technical Review of Ecopath with Ecosim and Ecospace (EwE) Ecosystem Productivity Model application to the Roberts Bank Terminal 2 Environmental Assessment
20 Background
21 Background and Terms of Reference The Projectrsquos main components have a proposed combined marine footprint area of approximately 179 km2 listed below by specific component
bull Marine Terminal 1335 km 2 including terminal (116 km 2) and dredged berth pocket and marine approach areas (0174 km 2)
bull Widened Causeway 0424 km 2
bull Expanded Tug basin 0031 km 2
Roberts Bank in the Fraser River estuary consists of complex intertidal and subtidal habitats including intertidal eelgrass beds and is an important stopover area for migrating shorebirds and productive feeding and rearing habitats for many fish and invertebrate species It also provides habitat for endangered Southern Resident Killer Whales and other marine mammals
Pacific Region Science Response Technical Review Assessing
Ecosystem Productivity Model of Roberts Bank
3
The environmental conditions at Roberts Bank are dynamic and are influenced by a variety of oceanographic and atmospheric factors including the Fraser River freshwater and sediment plume discharge diurnal tidal currents and prevailing and storm-generated wind and wave activity In addition the intercauseway region provides significant drainage from marsh and agricultural areas which have different characteristics from marine waters and which run along the ferry causeway
To provide the required science advice this Science Response focusses on Section 10 ldquoBiophysical Settingrdquo of the Environmental Impact Statement (EIS) (Port Metro Vancouver 2015a) specifically Section 103 ldquoOverview of Assessing Ecosystem Productivityrdquo (Port Metro Vancouver 2015b) and its related Appendices 10-B ldquoRoberts Bank Ecopath with Ecosim and Ecospace model parameter estimatesrdquo (Hemmera 2014) Appendix 10-C ldquoRoberts Bank Ecosystem model development and key runsrdquo(ESSA Technologies 2014a) and Appendix 10-D ldquoRoberts Bank Ecosystem model sensitivity analysesrdquo (ESSA Technologies 2014b) Additional important information was obtained from the Response to Information Request 6 (IR-73115-06 Canadian Environmental Assessment Agency Reference Number 80054 dated 26 October 2015) (Port Metro Vancouver 2015c) and the Written Responses to Coastal Geomorphology and Ecosystem Modelling Questions provided by the Proponent to DFO ECCC and NRCan on 2 March 2016 (Port Metro Vancouver (PMV) Transmittal TRE-01-RBT2-0004A subsequently referred in this Science Response as ldquoPMV Response 2016-03-02rdquo) (Vancouver Fraser Port Authority 2016)
The process followed in preparing this Science Response involved an initial review of the submitted EIS followed by an in-person meeting of the Proponent its contractors and representatives of DFO ECCC and NRCan to discuss and clarify questions arising from the initial review (Vancouver 23 November 2015) DFO and NRCan provided written questions to the Proponent based on preliminary review of the EIS on November 19 2015 ECCC also provided written questions based on its preliminary review of the EIS to the Proponent on December 1 2015 and January 20 2016 This large initial meeting was followed by smaller focussed meetings between the Proponent its contractors and DFO and NRCan on 11 December 2015 to clarify hydrology and sediment modelling questions with DFO on 8 January 2016 to clarify ecosystem modelling questions and with ECCC on 18 February 2016 to clarify questions relating to birds Written responses to all of these meetings and questions were provided by the Proponent to DFO ECCC and NRCan as the ldquoPMV Response 2016-03-02rdquo and ldquoPMV Response 2016-05-30rdquo (Vancouver Fraser Port Authority 2016) VFPArsquos answers to questions posed by DFO and NRCan regarding coastal geomorphology modelling have been posted to the Canadian Environmental Assessment Registry (CEAR)
22 Approach to assessing ecosystem productivity The Proponent adopted an ecosystem approach to evaluate the direct and indirect effects of the Project on the productivity of the Roberts Bank ecosystem A weight of evidence approach was used to assess the potential effects of the project on the productivity of the ecosystem and selected key components in the study area this approach included a spatial ecosystem simulation model (which included a habitat capacity model) a shorebird opportunity model and empirical data An important point is that any effects on the system during the construction phase or from expansion of the tug basin were excluded from this modelling process the focus instead being a comparison of modelled system productivity before and after the proposed terminal and expanded causeway is in place The chosen ecosystem simulation model was
Pacific Region Science Response Technical Review Assessing
Ecosystem Productivity Model of Roberts Bank
4
Ecopath with Ecosim and its spatial version Ecospace (collectively referred to here as the EwE framework or EwE model) This modelling approach was recommended by a prior Productive Capacity Technical Advisory Group comprised of representatives of technical experts from government agencies academia non-governmental organizations Vancouver Fraser Port Authority and its consultants (Compass 2013) convened by the Proponent and which also recommended a selection of focal species for the model The final selection of functional groups and the resulting food web that form the core of this ecosystem model are shown in Figure 1
Pacific Region Science Response Technical Review Assessing
Ecosystem Productivity Model of Roberts Bank
5
Figure 1 Ecopath with Ecosim model food web for Roberts Bank (Adapted from EIS Volume 3 Section 10 Fig 1033 on page 10-16) The groups coloured in orange represent focal groups size of symbols represents relative annual amount of biomass in the Roberts Bank study area
Pacific Region Science Response Technical Review Assessing
Ecosystem Productivity Model of Roberts Bank
6
The EwE framework is a common approach to ecosystem modelling which has been developed and expanded over the past two to three decades It currently has three main components
1 Ecopath ndash the core model which provides a mass-balance snapshot of the system
2 Ecosim ndash a module that enables simulation modelling over time
3 Ecospace ndash a module that enables simulation modelling over space
In order to make an EwE model tractable species are aggregated into functional groups based on their similar ecological characteristics (habitat and prey preferences etc) the Roberts Bank models had 58 functional groups The first step (Ecopath) was to obtain input parameters representing biomass production consumption emigration and diet for each functional group These parameters were then tuned in an iterative process until the overall production and consumption was balanced (a mass-balance approach) resulting in a model food web with estimates of energy flow between functional groups (Fig 1)
In the second step Ecosim was combined with the spatial model Ecospace The abiotic variables selected in this EIS (depth salinity bottom current wave height sediment type) were used as external forcings to the Ecospace module These abiotic variables provided the physical forcings for the simulations without and with the Project Since time series data on the functional groups of the model were not available Ecospace was run until the model reached equilibrium using various assumptions of the value of the vulnerability parameter (see Section 352) In this EIS the selected time step was annual with all variables abiotic and biotic expressed as yearly averages As used in this EIS the Ecospace module included a habitat capacity model which estimated the distribution of functional groups based on their environmental preferences for each abiotic variable (depth salinity bottom current wave height) and for substrate type (sand mud etc) The model thus allocated the spatial distribution of functional groups over the model domain based on their environmental preferences and the distributions of these abiotic variables with and without the Project The selected spatial unit size (ldquopixelrdquo) for the Ecospace model was 100 m2 In essence an Ecopath model was constructed for each pixel with particular rules governing how the functional groups interacted and moved among these spatial units The Ecospace module was run until it approached equilibrium (20 model years) to establish the spatial patterns without the Project For the lsquowith the Projectrsquo simulations the model was run for an initial 10 years and then the spatial patterns of the abiotic variables with the project were added and the model run for an additional 10 years1 The model outputs predicted changes in the productive potential of the Roberts Bank ecosystem as a comparison (ratio) with and without the Project rather than an absolute biomass that would be lost or gained as a result of the Project
1 EIS Appendix 10-C p 26
Pacific Region Science Response Technical Review Assessing
Ecosystem Productivity Model of Roberts Bank
7
30 Analysis and Response To prepare this response the following sections of the EIS additional documents were reviewed
DocumentSection Title
EIS Section 10
Including appendices 10B 10C and 10D
(Port Metro Vancouver 2015a Hemmera 2014 ESSA Technologies 2014a ESSA Technologies 2014b)
Biophysical Setting
Appendix 10-B Roberts Bank Ecosystem Model Parameter Estimates Port Metro Vancouver File 302-03503
Appendix 10-C Roberts Bank Ecosystem Model Development and Key Run Port Metro Vancouver
Appendix 10-D Roberts Bank Ecosystem Model Sensitivity Analyses Port Metro Vancouver
CEAR document 547 (Including Appendices) ldquoPMV Response 2016-03-02rdquo and ldquoPMV Response 2016-05-30rdquo
(Vancouver Fraser Port Authority 2016)
Vancouver Fraser Port Authority to the Review Panel re Answers to preliminary technical questions submitted during the completeness phase from Fisheries and Oceans Canada Natural Resources Canada and Environment and Climate Change Canada concerning the ecosystem modelling to support the Roberts Bank Terminal 2 Project environmental review
31 The EwE Team Building this ecosystem model was a complex undertaking which required knowledge of the ecosystem to be modelled how to set initial parameter values determination of reasonable ranges of these parameters how to balance the model and how to recognize when the model outputs were unrealistic These tasks became even more complex when spatial model dynamics were involved such as with Ecospace The team engaged by the Proponent to conduct this ecosystem modelling for the Roberts Bank Terminal 2 (RBT2) EIS was led by scientists at the Institute for Oceans and Fisheries located at the University of British Columbia in Vancouver These scientists are global leaders of the EwE model framework having developed much of its current implementation and who continue to lead its elaborations and extensions Construction and running of the model for this specific ecosystem was done in collaboration with ESSA Technologies of Vancouver Parameter values for the ecosystem model were obtained in part from observational studies conducted in the area by Hemmera of Burnaby BC
32 Overview of assessment results of hydrological and sediment modelling Implementation of the ldquowith the Projectrdquo simulations of the ecosystem model was done by driving the model with the abiotic variables as they were projected to be distributed with the Project footprint In the context of this EIS specifying depth salinity bottom currents wave height and sediment type conditions without the Project and changes with the Project were achieved by construction of hydrodynamical and sediment transport models The outputs from these models in combination with the identified environment preferences for the various biological groups were then used as inputs to the Ecospace model to define the spatial
Pacific Region Science Response Technical Review Assessing
Ecosystem Productivity Model of Roberts Bank
8
distributions of these functional groups The implementation of these hydrological and sediment transport models in this EIS was reviewed by DFO and NRCan (DFO 2016) This review concluded that the implementation of these models for this EIS was adequate for average winter conditions but lacking in validation for summer conditions in particular with strong freshwater flows from the Fraser River Simulations of strong storm events and their impacts on wave conditions and sediment transport were also lacking The effect of wave action and current speeds on sediment transport is non-linear such that increasing winds over short periods of time can impact sediment transport processes bottom topography and water depths beyond that determined under average model conditions Overall the review concluded that a greater range of sensitivity analyses is required to have confidence in the model outputs under lsquonon-averagersquo conditions The implication of this conclusion for the present review of the EwE model is that the full range of variability of abiotic characteristics such as bottom topography bottom current and wave heights and how they may affect relevant functional groups in the model with the Project may not be adequately represented Sensitivity analyses were provided by varying the intensity of abiotic variables and by removing abiotic variables to assess their interactive effects In general the ecosystem model outputs were robust to these sensitivity analyses with most groups varying by less than 5 Larger changes however were observed for primary producer and bird groupings and for some fish groups when various abiotic variables were omitted2
33 Model implementation 331 The purpose of the EwE model
The EwE model was intended to provide one line of evidence to assess the potential impacts of the Project on the Roberts Bank ecosystem which would then be used with other lines of evidence to make the final assessment Specifically ldquohellip the objective of the RB [Roberts Bank] model was not to provide an assessment of Project impacts for each functional group at a fine temporal scale but to estimate changes in productive potential with and without the Project at the ecosystem levelrdquo3 In addition ldquohellipthe primary objective of the RB ecosystem model is to evaluate potential changes in productivity from such abiotic factors with and without the terminal and causewayrdquo4 Results are presented for the selected functional groups no results were presented on potential changes in ecosystem structure or function
332 Applicability of the EwE model framework to the Roberts Bank region EwE models work best when the exchanges within the system being modelled are greater than the exchanges between the modelled system and the lsquooutsidersquo world In practice this means that EwE models work best for larger systems with few external exchanges In a meta-analysis of 433 Ecopath models Colleacuteter et al (2015) concluded that ldquohellipin the last two decades the range of the models area has expanded toward very large areas and the median has shifted accordingly from about 1000 km2 in 1984ndash1993 to about 100000 km2 in 1994ndash2014rdquo The section of the Roberts Bank ecosystem that is included in the EwE model was comparatively small (5468 km2) and complex It is an intertidally-dominated environment that is subject to strong seasonal influences of both freshwater and marine exchanges across relatively large seaward and shoreward boundaries
2 EIS Appendix 10-D p ii - iii 3 PMV Response 2016-03-02 p 99 lines 1914-1917 4 PMV Response 2016-03-02 p 38 lines 689-691
Pacific Region Science Response Technical Review Assessing
Ecosystem Productivity Model of Roberts Bank
9
Processes taking place outside the modelled ecosystem will contribute to dynamics within the modelled ecosystem (eg lsquooutsidersquo food supporting predators which occur in the Roberts Bank ecosystem for only part of the year predators which may feed in the Roberts Bank ecosystem but export this energy when they migrate out of the region) but which may not be well-resolved by the EwE model The Proponent justifies the spatial scale because it was specifically chosen for the questions being asked in regard to assessing productivity changes and because the relative influences of external exchanges are assumed to be identical with and without the project In addition highly mobile species with broad prey bases were assumed in the model to be partially sustained by external energy from outside the model system5 The distributions of organisms may differ however with and without the project which may affect their interactions with areas outside of the modelled system and the use of diets from outside the modelled system may not reflect the impacts of the project Further clarification of how the EwE model captures the exchanges and interactions with adjacent ecosystems are needed For example it could be argued that an ecosystem which is open to frequent exchanges of water and organic matter from beyond its boundaries might be more robust to local disturbances such as the Project
There are some inconsistencies in the information and assumptions used for some of the taxa in this ecosystem model For Dungeness Crab the justification for estimating total adult biomass (including females) from the biomass of fished males is unclear In addition it is unclear if the slower growth of female crabs once they have reached sexual maturity in comparison with male crabs has been considered The diet matrix for spiny dogfish does not represent the actual diet well in particular of euphausiids herring and shrimp and there are more recent references for biomass estimates of spiny dogfish in the study area than what was used in the EIS
Fishing mortality was not included in the model under the assumption that this would not change with or without the project While this assumption may be true the model has been parameterized by ignoring a source of mortality that will influence total production In essence fishing removes biomass from the ecosystem with the result that less biomass will be available for higher trophic levels How this may impact the ecosystem with and without the Project is unclear but it could make noticeable differences if for example there were thresholds in the feeding responses by these higher trophic level species The Ecopath model that was used is relatively unconstrained since many ecological efficiencies are low even for forage species which would be expected to be higher It is not clear how many species are exploited or the levels of exploitation but even if this does not change with the Project these mortality rates should be included in the model in order to add realistic constraints to the exploited functional groups
333 Model documentation Based on questions from DFO ECCC and NRCan following their initial review of the EIS the Proponent provided written responses dated 2 March 2016 to clarify several of the steps in the model development and implementation However several questions remain including questions about the Ecospace module Ecospace has undergone several recent developments such as the inclusion of the spatial-temporal data layer framework (Steenbeek et al 2013) the habitat capacity model (Christensen et al 2014) and the Monte Carlo analysis including the diet matrix As yet there are few published studies using these latest Ecospace developments and their documentation and justification need to be improved in the EIS
5 PMV Response 2016-03-02 p 29 lines 446 - 464
Pacific Region Science Response Technical Review Assessing
Ecosystem Productivity Model of Roberts Bank
10
Questions also remain regarding how the Monte Carlo randomization routine treated diet data The report indicates that the Monte Carlo routine randomly selected input parameters from the input ranges and that only models that were balanced were used This suggests that a high proportion of models were not balanced and therefore were not used (for example the EIS indicates that about one out of 1000 sampled input parameters was balanced6) A table showing the minimum maximum mode average and median values from the Monte Carlo runs for all the parameters would enable an evaluation of how much variation was actually sampled by the balanced model runs This is recommended in the EwE user information ie ldquoUsers should check the range of the input parameters that were actually used in the trials in the output csv file (see below)rdquo7
In addition there are several issues with the documentation of the derivation of the parameters for the functional groups Such documentation should clearly outline how the input parameter was estimated and the range of uncertainty for that parameter For example the input biomass of pinnipeds was defined as 04 t km 2 derived from estimates of 034 for Harbour seals and two estimates for Steller sea lions (012 and 014 t km 2) No explanation was provided for how the overall estimated pinniped biomass of 04 t km 2 was determined The diet of Sand Lance was described in the EIS as consisting mostly of zooplankton8 whereas the diet table for the model runs9 included 20 macrofauna 10 green algae and 10 detritus It is unclear why these additional prey were included in the diet used for the model runs
334 Highly mobile functional groups This implementation of the EwE framework included transient and migratory functional groups This is entirely appropriate and these groups cannot be excluded The approach taken in the Ecospace module was to impose a low (and conservative) dispersal rate among model spatial units (lsquopixelsrsquo) of 1 km yr-1 This may be appropriate for low mobility benthic organisms but it likely underestimates the movements of many other functional groups The effects of using higher and perhaps functional-group-specific dispersal rates was not considered The Proponents argued that higher dispersal rates would reduce impacts since species can move away from less desirable areas more quickly for completeness these runs should be done and evaluated Mobile species will also bring energy (food) captured outside the system into the modelled ecosystem This process was included in the model with the use of a diet import factor reflecting the consumption of prey outside the modelled region with the assumption that groups with high import rates were unlikely to respond to local changes on Roberts Bank10 This assumption needs justification perhaps at the functional group level for example many species of highly migratory birds and Pacific salmon use the Roberts Bank ecosystem to obtain food to continue their migrations Although this food does not compose a large fraction of their annual consumption it can be critical to enable them to continue their migrations
The EwE model is not designed to capture differences in prey quality ie differences in essential fatty acid or nutrient ratios The same species of prey may have greater or lesser nutritional value to predators depending on the conditions under which they are growing and their seasonal variations This is a particular concern with the nutritional quality of the diatom-dominated biofilm Diatomaceous biofilm is important to the highly migratory Western Sandpiper (Calidris mauri) Despite its predictive merits in relation to other ecosystem
6 EIS Appendix 10D Section 24 p5 7 EwE Help file p 151 8 EIS Appendix 10B Section 4133 p 76 9 EIS Appendix A of Appendix 10B 10 PMV Response 2016-03-02 p 28 lines 429 - 436
Pacific Region Science Response Technical Review Assessing
Ecosystem Productivity Model of Roberts Bank
11
components the EwE model is not informative with respect to understanding the potential impacts of the Project on biofilm and the Western Sandpiper While this example is specific to seabirds the potential exists for differences in the quality of biofilm to also be an issue for copepods which feed on biofilm and consequently to juvenile salmon which feed on these copepods (eg Sutherland et al 2013)
The EwE model is also not designed to predict effects of the Project on water quality although the Proponent noted that ldquoOther abiotic factors not included were deemed to be representative of variables that were already included in the modelhelliprdquo11 The Project may cause changes in physical and water quality conditions whether in isolation or in combination which may impact the productivity or nutritional quality of key prey organisms for local and migratory species which will not be captured by the model The EwE model does not assess the production of key nutrients or the implications of changes in important physical and water quality parameters to biofilm community structure and hence to important migratory birds
The model does not include biotic factors for both pelagic and benthic environments to assess the potential development of eutrophication and benthic organic enrichment events respectively Organic and redox indicators traditional measures of environmental assessments that are used to determine changes in functional group responses were included in the recent Deltaport Third environmental assessment (ie Pelagic chlorophyll dissolved nutrients Benthic sediment carbonnitrogen content redox state [sulfide concentration]) Benthic anoxic events based on organic enrichment are known to be strong drivers of community composition and exclusion regardless of substrate type In the absence of biotic factors (eg organic particulates) the model has not considered the potential for benthic organic enrichment which coincides with siltation processes within the upper tidal flats The tidal flat corner bordered by the Delta-dyke and Deltaport causeway has served as a catchment area for Fraser River silt since the development of the original Deltaport causeway (Sutherland et al 2013) The proposed position of the new terminal placed at the seaward termination of the Deltaport causeway may produce a crescent-shaped feature in the wake of the Fraser River Plume This feature may provide a more efficient silt trap that will promote benthic organic enrichment This piece of the environmental assessment seems to be missing and is important for assessing fish habitat in this area
335 Seasonality (model time step) Input data to parameterize the model were available on a range of time scales from hourly (eg physical data on salinity and water flow) to annual (eg species biomass) The Proponents indicated12 that this is a strength of the EwE model although ultimately the model was run with an annual time step with all sub-annual values being averaged to annual values This method therefore did not incorporate important seasonal processes such as winter-summer differences in salinity and storm properties and the seasonal appearances of abundances of predators and prey such as migratory salmon and birds that are much larger than the annual average For example juvenile salmon migrate from the Fraser River and onto Roberts Bank in the spring before moving into deeper waters If these spring abundances are averaged over the entire year these average abundances would be 5-10 times lower than the actual abundances during the spring (ie averaging the biomass that occurs in two months over a 12 month period) Additionally this method did not capture the intensity of processes such as growth and predation which can be focused over periods of a few weeks to a few months There may be important threshold effects at particular times and places which may be missed when using an 11 EIS Section 10 p 10-11 12 PMV Response 2016-03-02 p 86 line 1655
Pacific Region Science Response Technical Review Assessing
Ecosystem Productivity Model of Roberts Bank
12
annual time step for the model The Ecospace module has a monthly time step13 and therefore it is feasible to run this module with a sub-annual time step For example the Proponents submit14 that there are inadequate data to model the potential effects of the Project on the timing of biofilm production which could have implications for the migratory dunlin and Western Sandpiper However this could be modelled in an exploratory way to determine hypotheses about which factors could affect the timing of production of biofilm and the potential impacts on these birds These issues are of major concern to ECCC
336 Life history structure The EwE model did not separate functional groups into life history stages (stanzas) yet for many functional groups the juvenile stages can have very different life history characteristics and habitats than the adults It is unclear in the description of the model how different life history structures were considered and whether for example there were enough juveniles to produce the adults The implications of not including early life stages should be explored at least qualitatively to identify which species might have life stages that may be more vulnerable to project effects
337 Model balancing Balancing an EwE model is the process by which parameters are adjusted so that there is sufficient production for consumption requirements ie there are sufficient prey for all predators Expert opinion was used to examine parameter values and to adjust for errors or inconsistencies in logic ldquoPMV is confident that since the approach taken to balance the model was based on best practices the steps are appropriaterdquo15 Adjustments to initial parameters to ensure an ecologically-feasible model are necessary and to be expected For a few functional groups however very large changes to initial parameter estimates (which were often not based on Roberts Bank specific data) were necessary for example to transient killer whales When such initial parameters were adjusted (often by substantial amounts) by expert opinion to balance the model the confidence intervals around these adjusted parameter values were not increased to reflect this added uncertainty (see for example PMV Response 2016-03-02 p 51 lines 955-956) When expert opinion was used to make very large changes to initial parameter values broader confidence intervals about these parameters should have been applied This does not appear to have been the case and as a consequence may cause the actual uncertainty of the model outputs to be underestimated
Another example is for the pinniped group in which 50 of the diet was assumed to come from outside the model area in order to balance the model The rationale provided was ldquoThe pinnipeds caused excessive predation mortalities on numerous fish functional groups The biomass of pinnipeds was an average for the Strait of Georgia which was likely too high for Roberts Bank Therefore it was assumed that pinnipeds extracted only half of their diet from the study areardquo16 It is unclear whether the sensitivity of the model to different percentages of diet allocation was explored
As noted above (332) the Ecopath model was relatively unconstrained and few adjustments to input parameters were required to balance the model This is unusual and the low ecotrophic efficiencies of several functional groups suggest that full accounting of energy flows may not have been achieved (an ecotrophic efficiency of 1 indicates that 100 of the production of that
13 EIS Appendix 10C Section 29 p24 14 EIS Appendix 10D Appendix C p72 15 PMV Response 2016-03-02 p 49 lines 910-912 16 EIS Appendix 10C Section 261 p 20
Pacific Region Science Response Technical Review Assessing
Ecosystem Productivity Model of Roberts Bank
13
particular group is being preyed upon or removed by fishing leaving no individuals to die of old age17) An ldquoexcessrdquo of individuals dying of old age ie ecotrophic efficiencies much less than 1 suggests a potentially large biomass that is not used by the ecosystem and instead is converted to detritus
34 Model validation Model validation is the process by which the model parameters variables and outputs are compared with those from the real ecosystem to ascertain how well the model represents the ecosystem It is an essential step in providing confidence that the projections from the model in this case with and without the Project have relevance to how the real ecosystem may be expected to function with and without the Project In practice validating complex ecosystem models is difficult considering the range of assumptions that must be made when building the model the limited available data and natural variability of the ecosystem at a variety of time and space scales
Many of the standard diagnostics for the Ecopath model have not been evaluated in the EIS The Proponent appears to have assumed that once the Ecopath model was balanced then it was valid and fit for purpose The Proponent should provide all the Ecopath estimates of vital rates including mortality rates As presented questions remain For example many Ecotrophic Efficiencies (which control the transfer of biomass from prey to predators) are less than 1 even for taxa which would be expected to be close to 1 such as carnivorous zooplankton The reason for Ecotrophic Efficiencies less than 1 were not discussed or explained in the EIS
Detailed diagnostics for the Ecospace model should also be presented in order to evaluate model performance In response to criticisms by DFO ECCC and NRCan in discussions with the Proponent the latter provided the biomass of the functional groups from the Ecopath model (before Ecospace) and the Ecospace model after the spin-up period (which involved adjusting the parameters from the Ecopath model to balance the 5468 separate cells of the Ecospace model)18 The Proponents argue that ldquoIt is important to note that changes in biomass values generated during the spin-up period are identical for both with and without Project scenarios and thus do not provide information on the potential Project-related effects on productivity19 However several changes to biomass result from the Ecospace balancing process (spin-up period) This is only given brief attention by the Proponent in its response to the DFO ECCC and NRCan questions An analysis of Table 620 revealed that the biomass of 9 functional groups was larger or smaller than the widest confidence limits allowed for each group21 This requires further discussion and justification
The Proponent used a goodness of fit measure to compare spatial distributions of model outputs with field observations They indicated that ldquono other EwE models were identified which use a goodness-of-fit measure Hence the RB model is potentially the first such EwE model where a goodness of fit measure has been appliedrdquo22 The chosen goodness of fit measure is the percent correct classification (PCC) method23 This method derives a test statistic based on the proportion of locations at which predicted occurrences from the model match observed
17 EIS Appendix 10-B p 11 18 PMV Response 2016-03-02 p 65-66 Table 6 19 PMV Response 2016-03-02 p 64 lines 1205-1207 20 PMV Response 2016-03-02 p 65-66 Table 6 21 PMV Response 2016-03-02 p 45 Table 3 22 PMV Response 2016-03-02 p 78 lines 1481-1483 23 PMV Response 2016-03-02 p 78 lines 1483-1484
Pacific Region Science Response Technical Review Assessing
Ecosystem Productivity Model of Roberts Bank
14
occurrences from data and similarly with predicted and observed absences The Proponent then calculated two additional accuracy of fit measures sensitivity (the model predicts a species to occur in an area where it is known to occur in reality) and specificity (the model predicts a species does not occur in an area it is known not to occur in reality)24 This analysis concluded that the model has high predictability for functional groups such as eelgrass and sea pens with relatively static distributions but lower predictability for functional groups which are more temporally and spatially dynamic such as biofilm and green algae25
There are two problems with this approach The first is that this goodness of fit comparison was done only for habitat-forming functional groups no discussion of how well this analysis applies to mobile functional groups was provided The second problem is that this method does not take into account situations (such as occurs in this study with several groups) in which species occur at only a few locations For example ldquohellipif the test data consist of 95 absences and 5 presences and this reflects the true prevalence of the species on the landscape (a realistic scenario for a rare species) a lsquonullrsquo model that predicted absence in all cases (eg no model at all) would be correct 95 of the timehellipldquo (Franklin 2009 p 151) This latter point is important here as these habitat functional groups (biofilm brown algae native eelgrass green algae Japanese eelgrass tidal marsh biomat and orange sea pens26) appear not to occur over most of the Project area (as portrayed by the model outputs presented in the distribution figures of PMV Response 2016-03-02 Appendix 218) It is therefore important that a robust evaluation of the performance of the Ecospace module is used with preferably more than one measure
In summary the starting point for this modelling analysis matters It is not just about a comparison between results with and without the Project The model has to be considered a sufficient representation of the ecosystem The Proponent has not yet sufficiently validated the model
35 Model results 351 Presentation of model results
As noted above (Section 331) the stated objective of the Roberts Bank ecosystem model was not to provide an assessment of Project impacts for each functional group at a fine temporal scale but to estimate changes in productive potential with and without the Project at the ecosystem level27 However results were presented as comparisons by speciesfunctional group with and without the Project and not as potential changes in total ecosystem productivity The revised figures for each functional group showing distributions without the Project with the Project and their difference indicated impacts were likely to be localized with overall impacts relatively small The range of biomass ratios with and without the Project was 045 ndash 189 with most values slightly less than 1 This is interpreted as indicating slight decreases in the capacity of the study area to support biomass and production with the Project for many functional groups28 (Figure 2)
24 PMV Response 2016-03-02 p 80 lines 1524-1527 25 PMV Response 2016-03-02 p 81 lines 1551-1559 26 PMV Response 2016-03-02 p 82 Table 8 27 PMV Response 2016-03-02 p 99 lines 1914-1917 28 PMV Response 2016-03-02 Appendix 218
Pacific Region Science Response Technical Review Assessing
Ecosystem Productivity Model of Roberts Bank
15
Biomass Ratio
Freq
uenc
y
04 07 10 13 16 19
05
1015
2025
30
Figure 2 Histogram of biomass ratios obtained by comparisons of model runs with and without the project (ie With Without) Values less than 1 indicate reductions in biomass with the Project compared against without the Project) Data from Appendix 218 of PMV Response 2016-03-02
352 Sensitivity and vulnerability analyses Every ecosystem model is only one possible representation of the true ecosystem defined by the modelrsquos structure and the values chosen for its many parameters The key point is how well the model represents the real system how that fit can be measured and the sensitivity of model outputs to variability in the selected parameter values The ideal model should be robust to a wide range of uncertainties in the input data and parameters This robustness is determined by performing sensitivity analyses on the model to see how it responds to variations in the input parameters and determining to which input parameters the model is most sensitive
The vulnerability parameters determine the strength of the feeding interactions between functional groups They set the level of density dependence of each functional group Higher vulnerability settings provide greater top-down (predator) control whereas lower settings provide greater bottom-up (environmental) control29 Several publications have shown that EwE models are very sensitive to the vulnerability parameters and Christensen and Walters (2000) point out that a main pitfall of EwE is that ldquopredation vulnerabilities are often underestimated lessening the modelled impacts of predationrdquo It is usual practice to tune Ecopath models including the vulnerability parameters to time series data such as biomass using the temporal simulation model Ecosim However these data were not available for the RBT2 area so this robust method of fitting the model and estimating vulnerability parameters was not possible Instead a vulnerability setting of 2 was used as the default value for the key model runs which is ldquocommon practice when time series data are not available and estimates of vulnerability in the
29 PMV Response 2016-03-02 p 70 lines 1318-1323
Pacific Region Science Response Technical Review Assessing
Ecosystem Productivity Model of Roberts Bank
16
model cannot be maderdquo30 with sensitivity analyses run for a range of 15 to 3 This narrow range was criticized by DFOECCC in initial discussions about the model with the Proponent The Proponent subsequently reran the model with a larger range of vulnerabilities31 (11 to 10) and concluded this broader vulnerability range produced similar results for the productivity ratio with and without the Project to those in the original EIS and that the EIS was more likely to overestimate than underestimate potential project effects32 The data in Table 7 of the PMV Response33 did indicate changes in productivity ratios ranging from 0 to 50 of the defined key run (which used a vulnerability setting of 2) However the Proponent changed all vulnerability settings to the same value ie all were 2 or all were 10 etc In reality the vulnerability parameters resulting from Ecosim models that are fitted to data as described above vary by functional group which was not explored here Therefore although the results suggest that the original choice of 2 for the default key run seemed reasonable the potential effects of variability in vulnerability settings was not fully explored
Sensitivity analyses are usually based on the range of uncertainty estimated for input data and parameters often called the confidence limits around the model parameters The EwE framework integrates many different data sources and parameters including values from the literature It can therefore be difficult to identify ldquoreasonablerdquo confidence limits when derived from such diverse data sources Standard practice in Ecopath models has been to develop a pedigree for each parameter with default values for uncertainty based on the nature of the source data For example parameter values based on high precision field observations of biomass within the model domain receive default confidence intervals of 10 whereas parameter values based on models developed for elsewhere or professional judgment receive confidence intervals of 8034 Sensitivity analyses are then run using parameter values selected from within these confidence intervals However if these default confidence intervals do not capture the full range of variability then the outputs are not informative of the variability in the lsquorealrsquo ecosystem Field observations were collected for many functional groups within the model domain in 2012 and 2013 as part of studies to support the RBT2 EIS Apparently the purpose of these observations was to document spatial variability (in part for the Ecospace model) and temporal variability (measurements at one location over time) and not to derive confidence intervals around the observations35
The reliance on the pedigree approach to derive confidence intervals for this Roberts Bank model was criticized by DFO ECCC and NRCan in discussions with the Proponent As a result the Proponent reran the model with much larger confidence intervals ranging from 30 to 100 depending on the input parameter and functional group36 The results from this new analysis using the broader confidence intervals were similar to those using the original pedigree approach The Proponent noted that ldquoWhile the production within each helliprun was very different there was little difference in the biomass ratio [with and without the Project] These results further demonstrate that even with a greater range in input values the influence of the Project on the Roberts Bank ecosystem is consistent among allhellipmodel runsrdquo37 This provides confidence that the model may be robust to uncertainty in its input parameters Two concerns
30 PMV Response 2016-03-02 p 70 lines 1321-1322 31 PMV Response 2016-03-02 p 71-74 32 PMV Response 2016-03-02 p 71 lines 1339-1341 33 PMV Response 2016-03-02 p 73 34 EIS Appendix 10-C Section 251 page 18 35 PMV Response 2016-03-02 p 42 lines 772-777 36 PMV Response 2016-03-02 p 44-47 37 PMV Response 2016-03-02 p 47 lines 855-858 and see also PMV Response 2016-03-02 Appendix 27-B
Pacific Region Science Response Technical Review Assessing
Ecosystem Productivity Model of Roberts Bank
17
remain however The quote above indicates that the production among the different model runs was very different although with little difference in the biomass ratios with and without the Project Since biomass is not the same as production it would be informative for understanding model performance and potential impacts to show these production differences This also relates to the point made in Section 34 regarding how well the model represents the real ecosystem and not just within-model comparisons with and without the Project The second question is more technical and relates to how the randomization (Monte Carlo or MC) routine that was used to create multiple model runs used the uncertainty about the diet data Diets are not currently included in the MC routine available to regular users of the Ecosim model how they were handled in this RBT2 model appears not to be explained
Finally the sensitivity analyses indicate that the uncertainty in the input parameters does not lead to much difference between model parameters with or without the project However this conclusion does not describe how the uncertainty in the input parameters affects understanding of the ecosystem
40 Conclusions Overall the main conclusion of the Environmental Impact Statement from the Proponent is stated as ldquohellipafter the implementation of mitigation hellipthe Project is not expected to result in any significant adverse effects on any of the 16 valued componentsrdquo38 In addition ldquohellipapproximately 40 of the functional groups are forecast to change no more than 5 which hellip is judged to be within the uncertainty of the model runsrdquo39 although larger changes were forecast for orange sea pens freshwater biofilm green algae and raptors The conclusions from the modelling studies are that ldquohellipthe proposed project will have an impact on the study area that the effect varies between species and that the findings are robust to parameter uncertaintyrdquo40 Specific outcomes by valued component as derived from the EwE model are presented by functional groups in Table 1
38 PMV March 2015 Roberts Bank Environmental Impact Statement Executive Summary ndash Part 1 page 37 39 EIS Appendix 10-C p ii 40 EIS Appendix 10-D p iv
Pacific Region Science Response Technical Review Assessing
Ecosystem Productivity Model of Roberts Bank
18
Table 1 Changes in productive potential with the Project as derived from the EwE model
Changes in productive potential
Ecosystem category
Number of valued
components
Number with potential
biomass loss
Moderate decrease (31-60 decline)
Minor decrease (6-30 decline)
Negligible (0-5
change)
Minor increase (6-
30 increase)
Moderate increase (31-60 increase)
Source
Marine vegetation
7 7 - 3 2 2 - EIS Vol 3 Section 11 Table 11-17 page 11-65
Marine invertebrates
4 3 1 1 1 1 - EIS Vol 3 Section 12 Table 12-8 page 12-52
Marine fish 13 13 - 2 6 5 - EIS Vol 3 Section 13 Table 13-10 page 13-95
Coastal birds
11 8 - 3 4 3 1 EIS Vol 3 Section 15 Table 15-10 page 15-67
Pacific Region Science Response Technical Review Assessing
Ecosystem Productivity Model of Roberts Bank
19
Most functional groups showed some potential biomass loss with the Project with biomass loss defined as any model run with negative outcomes (ie in which biomass with the project was less than biomass without the Project) The summary of changes in productivity potential are mixed with most (33 out of 35) valued components showing minor decreases to minor increases (defined as 6 to 30 changes in productive potential with the Project compared to without the Project)
The main conclusions of this review in regards to the Terms of Reference are
1 Do the functional groups and abiotic variables used in the model adequately represent the ecosystem at Roberts Bank
o The 58 functional groups and abiotic variables used in the model adequately represent the main components of the Roberts Bank ecosystem however for longer lived species the life stages of the species are not well represented and some of the impacts of the Project may be expected to affect specific life stages
o The abiotic variables adequately represent the physical drivers of this ecosystem on an annual time scale However annual values for these abiotic variables may not adequately capture important sub-annual events such as storms (DFO 2016) the timing of arrival and departure of highly migratory species and whether there may be important sub-annual thresholds or mismatches in timing as a result of the Project
o Biotic factors (eg nutrients) which are particularly important for biofilm and other lower trophic level taxa are not included in this model The model is therefore unable to assess the potential development of eutrophication and benthic organic enrichment events which may affect fish habitats in the study area
2 Are the parameter estimates used by the model valid and defensible for this system
o In general parameter estimates appear to be adequate for this system Field studies were done in two years to provide data in particular on distributions of selected functional groups for the Ecospace module Note the distribution studies focussed on taxa which were relatively immobile and therefore lsquofixedrsquo in space
o the selection of some model parameters would benefit from further explanation for example the choice of fixed diet matrices versus dynamic matrices which can vary with changes in abundances or predators and prey
o the selection of some model parameters would benefit from further explanation for example the link between the diets described in the text of Appendix 10B and the quantities presented in Appendix A of Appendix 10B It is understood that proportions were derived using the ldquofixed selectivityrdquo principle but in order to be fully transparent the derivation of each diet should be provided in an appendix
o discussion and explanation is needed of why ecotrophic efficiencies differ from expected values (eg the ecotrophic efficiency for Pacific herring is listed as 038) and
o the abiotic factor lsquosubstratersquo was limited to ldquohardrdquo or rdquosoftrdquo options which can be restrictive given that they serve as endpoints on a substrate composition continuum These limited options may not provide the sensitivity required to assess substrate preference nor the flexibility for taxa (eg motile organisms) that span hard mixed and soft substrate types In addition it is not clear if changes in the hardsoft categories were considered over time within identified depositional or erosional settings before and after construction
Pacific Region Science Response Technical Review Assessing
Ecosystem Productivity Model of Roberts Bank
20
3 Are the limitations and uncertainties of the model identified and appropriately considered when determining the modelrsquos representation of current and possible future conditions
o the EwE model was not designed to evaluate a range of future conditions It was designed to estimate changes in the productive potential at the ecosystem level with and without the Project Therefore the model was run without the Project and with the Project for a range of plausible abiotic conditions and the results were compared with respect to biomass and productivity by functional group
o the pedigree approach to assessing the uncertainties of model outcomes is unsatisfactory for the purpose here as it relates solely to a qualitative judgment of the value of data based on its source However when the model was rerun with much wider ranges of confidence intervals (uncertainties) the results in general (but not necessarily for each functional group) were similar to the results using the original pedigree approach This suggests that taken overall the model may be robust to wide ranges of uncertainty in these input variables and parameters
o there is inadequate validation of the model This is inadequate for three reasons
(i) the basic Ecopath model is not validated and the Ecospace balancing process (the spin-up period) resulted in some biomass estimates being increased or decreased beyond their confidence limits
(ii) the goodness of fit test used to evaluate how well the model predicted the spatial occurrence functional groups is not fit for purpose (Section 34) and
(iii) validation was provided for only a small number of functional groups (the habitat-forming functional groups) As a consequence the model is currently not validated
o Considering the proportion of open boundaries relative to closed boundaries in the model processes taking place outside the modelled ecosystem are likely to contribute to dynamics within the modelled ecosystem However these external processes may not be well-resolved by the EwE model as currently configured
4 Are the model results related to the potential effects of the Project on fish and fish habitat and migratory birds and their food resources valid and defensible
o this is a very complex ecosystem model constructed for a relatively small and open (in the sense of considerable exchange with adjacent non-modelled areas) system Many assumptions have been made based on poor or missing data Taking all these considerations into account the model does the best job possible of comparing the biomass and productivity of the Roberts Bank ecosystem with and without the Project
o the extent to which the model adequately represents the lsquorealrsquo ecosystem of Roberts Bank as opposed to comparisons of model results with and without the Project is unclear as a number of basic diagnostics are not presented (see point 3 above)
o the EwE model is not capable of and is not designed to represent nutritional and food quality variations in prey functional groups and how these may impact highly migratory predators such as birds with and without the Project
5 Is the EwE model framework a valid method to quantify large scale impacts to fish habitat fish productivity and migratory bird productivity
o the EwE model as implemented in this project and reviewed here is a useful first-order framework to organise information and derive initial estimates of how the system may respond to perturbations
Pacific Region Science Response Technical Review Assessing
Ecosystem Productivity Model of Roberts Bank
21
o the utility of a EWE model for impact purposes is highly dependent on the quality of input data
o each EwE model is highly dependent on local conditions Although appropriate as an overall methodology each application would need to be reviewed for how it may be applied to any new ecosystem and
o the EwE model would need to be substantially reformulated if it was to include considerations of changes in chemical composition or food quality of prey in particular for seasonal migratory species such as birds which may depend on very large biomasses of prey with specific chemical composition to fuel their migrations beyond the ecosystem model boundaries
Contributors Contributor Affiliation Ian Perry Author DFO Science Pacific Region Alida Bundy Author DFO Science Maritimes Region Terri Sutherland Author DFO Science Pacific Region Robert Elner Author ECCC Canadian Wildlife Service Andrew Robinson Author ECCC Canadian Wildlife Service Lesley MacDougall Editor DFO Science Pacific Region
Approved by Carmel Lowe
Regional Director Science Branch Pacific Region Fisheries and Oceans Canada
November 4 2016
Sources of Information Christensen V Coll M Steenbeek J Buszowski J Chagaris D walters CJ 2014
Representing variable habitat quality in a spatial food web model Ecosystems 17 1397-1412
Christensen V and Walters C 2000 Ecopath with Ecosim methods capabilities and limitations Ecological Modelling 172 109-139
Colleacuteter M Valls A Guitton J Gascuel D Pauly D and Christensen V 2015 Global overview of the applications of the Ecopath with Ecosim modeling approach using the EcoBase models repository Ecological Modelling 302 pp42-53
Compass Resource Management Ltd 2013 Roberts Bank Terminal 2 Technical Advisory Group (TAG) Process Report Productive Capacity ndash Final Report 119pp (Accessed November 1 2016)
DFO 2016 Technical Review of Roberts Bank Terminal 2 Environmental Assessment Section 95 ndash Coastal Geomorphology DFO Can Sci Advis Sec Sci Resp 2016045 (Accessed November 4 2016)
Pacific Region Science Response Technical Review Assessing
Ecosystem Productivity Model of Roberts Bank
22
ESSA Technologies 2014a Roberts Bank Terminal 2 Project Roberts Bank Delta BC Environmental Impact Statement Volume 3 Biophysical Effects Assessments Appendix 10-C Roberts Bank Ecosystem Model Development and Key Run Port Metro Vancouver (Accessed November 1 2016)
ESSA Technologies 2014b Roberts Bank Terminal 2 Project Roberts Bank Delta BC Environmental Impact Statement Volume 3 Biophysical Effects Assessments Appendix 10-D Roberts Bank Ecosystem Model Sensitivity Analyses Port Metro Vancouver (Accessed November 1 2016)
Franklin J 2009 Mapping Species Distributions Spatial Inference and Prediction Cambridge University Press Cambridge
Hemmera 2014 Roberts Bank Terminal 2 Project Roberts Bank Delta BC Environmental Impact Statement Volume 3 Biophysical Effects Assessments Appendix 10-B Roberts Bank Ecosystem Model Parameter Estimates Port Metro Vancouver File 302-03503 (Accessed November 1 2016)
Port Metro Vancouver 2015a Roberts Bank Terminal 2 Project Roberts Bank Delta BC Environmental Impact Statement Volume 3 Biophysical Effects Assessments Section 100 Biophysical Setting (Accessed November 1 2016)
Port Metro Vancouver 2015b Roberts Bank Terminal 2 Project Roberts Bank Delta BC Environmental Impact Statement Volume 3 Biophysical Effects Assessments Section 103 Overview of Assessing Ecosystem Productivity (Accessed November 1 2016)
Port Metro Vancouver 2015c Roberts Bank Terminal 2 Project Environmental Assessment Additional Information Requirements (July 31 2015) Responses Response to Information Request 6 IR-73115-06 Canadian Environmental Assessment Agency Reference Number 80054 dated 26 October 2015
Steenbeek J Coll M Gurney L Meacutelin F Hoepffner N Buszowski J and Christensen V 2013 Bridging the gap between ecosystem modeling tools and geographic information systems Driving a food web model with external spatialndashtemporal data Ecological Modelling 263 139ndash 151
Sutherland T Elner R and OrsquoNeill J 2013 Roberts Bank Ecological crucible of the Fraser River estuary Progress in Oceanography 115 171ndash180
Vancouver Fraser Port Authority 2016 From the Vancouver Fraser Port Authority to the Review Panel re Answers to preliminary technical questions submitted during the completeness phase from Fisheries and Oceans Canada Natural Resources Canada and Environment and Climate Change Canada concerning the ecosystem modelling to support the Roberts Bank Terminal 2 Project environmental review CEAR Document 547 (Accessed November 1 2016)
Pacific Region Science Response Technical Review Assessing
Ecosystem Productivity Model of Roberts Bank
23
This Report is Available from the Centre for Science Advice
Pacific Region Fisheries and Oceans Canada
3190 Hammond Bay Road Nanaimo BC V9T 6N7
Telephone (250) 756-7208 E-Mail csapdfo-mpogcca
Internet address wwwdfo-mpogccacsas-sccs
ISSN 1919-3769 copy Her Majesty the Queen in Right of Canada 2016
Correct Citation for this Publication
DFO 2016 Technical review of Roberts Bank Terminal 2 environmental assessment section 103 ndash assessing ecosystem productivity DFO Can Sci Advis Sec Sci Resp 2016050
Aussi disponible en franccedilais
MPO 2016 Examen technique de leacutevaluation environnementale du Terminal 2 agrave Roberts Bank section 103 ndash eacutevaluation de la productiviteacute de leacutecosystegraveme Secr can de consult sci du MPO Reacutep des Sci 2016050
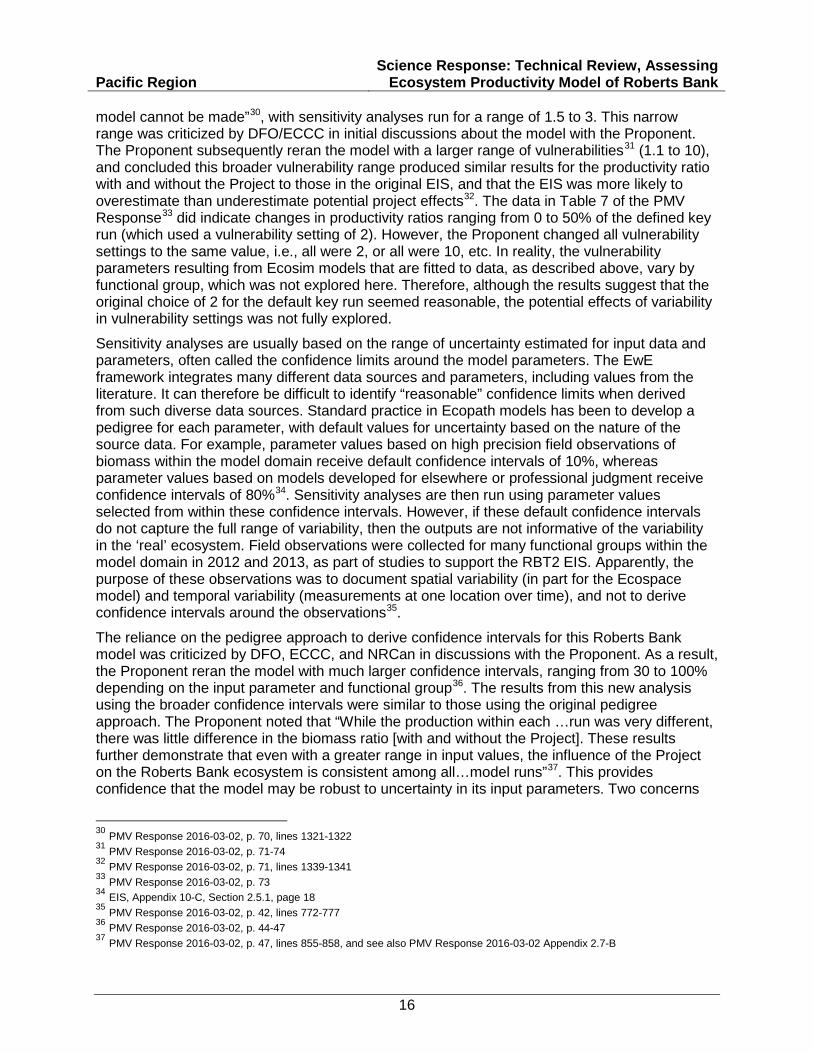
Pacific Region Science Response Technical Review Assessing
Ecosystem Productivity Model of Roberts Bank
16
model cannot be maderdquo30 with sensitivity analyses run for a range of 15 to 3 This narrow range was criticized by DFOECCC in initial discussions about the model with the Proponent The Proponent subsequently reran the model with a larger range of vulnerabilities31 (11 to 10) and concluded this broader vulnerability range produced similar results for the productivity ratio with and without the Project to those in the original EIS and that the EIS was more likely to overestimate than underestimate potential project effects32 The data in Table 7 of the PMV Response33 did indicate changes in productivity ratios ranging from 0 to 50 of the defined key run (which used a vulnerability setting of 2) However the Proponent changed all vulnerability settings to the same value ie all were 2 or all were 10 etc In reality the vulnerability parameters resulting from Ecosim models that are fitted to data as described above vary by functional group which was not explored here Therefore although the results suggest that the original choice of 2 for the default key run seemed reasonable the potential effects of variability in vulnerability settings was not fully explored
Sensitivity analyses are usually based on the range of uncertainty estimated for input data and parameters often called the confidence limits around the model parameters The EwE framework integrates many different data sources and parameters including values from the literature It can therefore be difficult to identify ldquoreasonablerdquo confidence limits when derived from such diverse data sources Standard practice in Ecopath models has been to develop a pedigree for each parameter with default values for uncertainty based on the nature of the source data For example parameter values based on high precision field observations of biomass within the model domain receive default confidence intervals of 10 whereas parameter values based on models developed for elsewhere or professional judgment receive confidence intervals of 8034 Sensitivity analyses are then run using parameter values selected from within these confidence intervals However if these default confidence intervals do not capture the full range of variability then the outputs are not informative of the variability in the lsquorealrsquo ecosystem Field observations were collected for many functional groups within the model domain in 2012 and 2013 as part of studies to support the RBT2 EIS Apparently the purpose of these observations was to document spatial variability (in part for the Ecospace model) and temporal variability (measurements at one location over time) and not to derive confidence intervals around the observations35
The reliance on the pedigree approach to derive confidence intervals for this Roberts Bank model was criticized by DFO ECCC and NRCan in discussions with the Proponent As a result the Proponent reran the model with much larger confidence intervals ranging from 30 to 100 depending on the input parameter and functional group36 The results from this new analysis using the broader confidence intervals were similar to those using the original pedigree approach The Proponent noted that ldquoWhile the production within each helliprun was very different there was little difference in the biomass ratio [with and without the Project] These results further demonstrate that even with a greater range in input values the influence of the Project on the Roberts Bank ecosystem is consistent among allhellipmodel runsrdquo37 This provides confidence that the model may be robust to uncertainty in its input parameters Two concerns
30 PMV Response 2016-03-02 p 70 lines 1321-1322 31 PMV Response 2016-03-02 p 71-74 32 PMV Response 2016-03-02 p 71 lines 1339-1341 33 PMV Response 2016-03-02 p 73 34 EIS Appendix 10-C Section 251 page 18 35 PMV Response 2016-03-02 p 42 lines 772-777 36 PMV Response 2016-03-02 p 44-47 37 PMV Response 2016-03-02 p 47 lines 855-858 and see also PMV Response 2016-03-02 Appendix 27-B
Pacific Region Science Response Technical Review Assessing
Ecosystem Productivity Model of Roberts Bank
17
remain however The quote above indicates that the production among the different model runs was very different although with little difference in the biomass ratios with and without the Project Since biomass is not the same as production it would be informative for understanding model performance and potential impacts to show these production differences This also relates to the point made in Section 34 regarding how well the model represents the real ecosystem and not just within-model comparisons with and without the Project The second question is more technical and relates to how the randomization (Monte Carlo or MC) routine that was used to create multiple model runs used the uncertainty about the diet data Diets are not currently included in the MC routine available to regular users of the Ecosim model how they were handled in this RBT2 model appears not to be explained
Finally the sensitivity analyses indicate that the uncertainty in the input parameters does not lead to much difference between model parameters with or without the project However this conclusion does not describe how the uncertainty in the input parameters affects understanding of the ecosystem
40 Conclusions Overall the main conclusion of the Environmental Impact Statement from the Proponent is stated as ldquohellipafter the implementation of mitigation hellipthe Project is not expected to result in any significant adverse effects on any of the 16 valued componentsrdquo38 In addition ldquohellipapproximately 40 of the functional groups are forecast to change no more than 5 which hellip is judged to be within the uncertainty of the model runsrdquo39 although larger changes were forecast for orange sea pens freshwater biofilm green algae and raptors The conclusions from the modelling studies are that ldquohellipthe proposed project will have an impact on the study area that the effect varies between species and that the findings are robust to parameter uncertaintyrdquo40 Specific outcomes by valued component as derived from the EwE model are presented by functional groups in Table 1
38 PMV March 2015 Roberts Bank Environmental Impact Statement Executive Summary ndash Part 1 page 37 39 EIS Appendix 10-C p ii 40 EIS Appendix 10-D p iv
Pacific Region Science Response Technical Review Assessing
Ecosystem Productivity Model of Roberts Bank
18
Table 1 Changes in productive potential with the Project as derived from the EwE model
Changes in productive potential
Ecosystem category
Number of valued
components
Number with potential
biomass loss
Moderate decrease (31-60 decline)
Minor decrease (6-30 decline)
Negligible (0-5
change)
Minor increase (6-
30 increase)
Moderate increase (31-60 increase)
Source
Marine vegetation
7 7 - 3 2 2 - EIS Vol 3 Section 11 Table 11-17 page 11-65
Marine invertebrates
4 3 1 1 1 1 - EIS Vol 3 Section 12 Table 12-8 page 12-52
Marine fish 13 13 - 2 6 5 - EIS Vol 3 Section 13 Table 13-10 page 13-95
Coastal birds
11 8 - 3 4 3 1 EIS Vol 3 Section 15 Table 15-10 page 15-67
Pacific Region Science Response Technical Review Assessing
Ecosystem Productivity Model of Roberts Bank
19
Most functional groups showed some potential biomass loss with the Project with biomass loss defined as any model run with negative outcomes (ie in which biomass with the project was less than biomass without the Project) The summary of changes in productivity potential are mixed with most (33 out of 35) valued components showing minor decreases to minor increases (defined as 6 to 30 changes in productive potential with the Project compared to without the Project)
The main conclusions of this review in regards to the Terms of Reference are
1 Do the functional groups and abiotic variables used in the model adequately represent the ecosystem at Roberts Bank
o The 58 functional groups and abiotic variables used in the model adequately represent the main components of the Roberts Bank ecosystem however for longer lived species the life stages of the species are not well represented and some of the impacts of the Project may be expected to affect specific life stages
o The abiotic variables adequately represent the physical drivers of this ecosystem on an annual time scale However annual values for these abiotic variables may not adequately capture important sub-annual events such as storms (DFO 2016) the timing of arrival and departure of highly migratory species and whether there may be important sub-annual thresholds or mismatches in timing as a result of the Project
o Biotic factors (eg nutrients) which are particularly important for biofilm and other lower trophic level taxa are not included in this model The model is therefore unable to assess the potential development of eutrophication and benthic organic enrichment events which may affect fish habitats in the study area
2 Are the parameter estimates used by the model valid and defensible for this system
o In general parameter estimates appear to be adequate for this system Field studies were done in two years to provide data in particular on distributions of selected functional groups for the Ecospace module Note the distribution studies focussed on taxa which were relatively immobile and therefore lsquofixedrsquo in space
o the selection of some model parameters would benefit from further explanation for example the choice of fixed diet matrices versus dynamic matrices which can vary with changes in abundances or predators and prey
o the selection of some model parameters would benefit from further explanation for example the link between the diets described in the text of Appendix 10B and the quantities presented in Appendix A of Appendix 10B It is understood that proportions were derived using the ldquofixed selectivityrdquo principle but in order to be fully transparent the derivation of each diet should be provided in an appendix
o discussion and explanation is needed of why ecotrophic efficiencies differ from expected values (eg the ecotrophic efficiency for Pacific herring is listed as 038) and
o the abiotic factor lsquosubstratersquo was limited to ldquohardrdquo or rdquosoftrdquo options which can be restrictive given that they serve as endpoints on a substrate composition continuum These limited options may not provide the sensitivity required to assess substrate preference nor the flexibility for taxa (eg motile organisms) that span hard mixed and soft substrate types In addition it is not clear if changes in the hardsoft categories were considered over time within identified depositional or erosional settings before and after construction
Pacific Region Science Response Technical Review Assessing
Ecosystem Productivity Model of Roberts Bank
20
3 Are the limitations and uncertainties of the model identified and appropriately considered when determining the modelrsquos representation of current and possible future conditions
o the EwE model was not designed to evaluate a range of future conditions It was designed to estimate changes in the productive potential at the ecosystem level with and without the Project Therefore the model was run without the Project and with the Project for a range of plausible abiotic conditions and the results were compared with respect to biomass and productivity by functional group
o the pedigree approach to assessing the uncertainties of model outcomes is unsatisfactory for the purpose here as it relates solely to a qualitative judgment of the value of data based on its source However when the model was rerun with much wider ranges of confidence intervals (uncertainties) the results in general (but not necessarily for each functional group) were similar to the results using the original pedigree approach This suggests that taken overall the model may be robust to wide ranges of uncertainty in these input variables and parameters
o there is inadequate validation of the model This is inadequate for three reasons
(i) the basic Ecopath model is not validated and the Ecospace balancing process (the spin-up period) resulted in some biomass estimates being increased or decreased beyond their confidence limits
(ii) the goodness of fit test used to evaluate how well the model predicted the spatial occurrence functional groups is not fit for purpose (Section 34) and
(iii) validation was provided for only a small number of functional groups (the habitat-forming functional groups) As a consequence the model is currently not validated
o Considering the proportion of open boundaries relative to closed boundaries in the model processes taking place outside the modelled ecosystem are likely to contribute to dynamics within the modelled ecosystem However these external processes may not be well-resolved by the EwE model as currently configured
4 Are the model results related to the potential effects of the Project on fish and fish habitat and migratory birds and their food resources valid and defensible
o this is a very complex ecosystem model constructed for a relatively small and open (in the sense of considerable exchange with adjacent non-modelled areas) system Many assumptions have been made based on poor or missing data Taking all these considerations into account the model does the best job possible of comparing the biomass and productivity of the Roberts Bank ecosystem with and without the Project
o the extent to which the model adequately represents the lsquorealrsquo ecosystem of Roberts Bank as opposed to comparisons of model results with and without the Project is unclear as a number of basic diagnostics are not presented (see point 3 above)
o the EwE model is not capable of and is not designed to represent nutritional and food quality variations in prey functional groups and how these may impact highly migratory predators such as birds with and without the Project
5 Is the EwE model framework a valid method to quantify large scale impacts to fish habitat fish productivity and migratory bird productivity
o the EwE model as implemented in this project and reviewed here is a useful first-order framework to organise information and derive initial estimates of how the system may respond to perturbations
Pacific Region Science Response Technical Review Assessing
Ecosystem Productivity Model of Roberts Bank
21
o the utility of a EWE model for impact purposes is highly dependent on the quality of input data
o each EwE model is highly dependent on local conditions Although appropriate as an overall methodology each application would need to be reviewed for how it may be applied to any new ecosystem and
o the EwE model would need to be substantially reformulated if it was to include considerations of changes in chemical composition or food quality of prey in particular for seasonal migratory species such as birds which may depend on very large biomasses of prey with specific chemical composition to fuel their migrations beyond the ecosystem model boundaries
Contributors Contributor Affiliation Ian Perry Author DFO Science Pacific Region Alida Bundy Author DFO Science Maritimes Region Terri Sutherland Author DFO Science Pacific Region Robert Elner Author ECCC Canadian Wildlife Service Andrew Robinson Author ECCC Canadian Wildlife Service Lesley MacDougall Editor DFO Science Pacific Region
Approved by Carmel Lowe
Regional Director Science Branch Pacific Region Fisheries and Oceans Canada
November 4 2016
Sources of Information Christensen V Coll M Steenbeek J Buszowski J Chagaris D walters CJ 2014
Representing variable habitat quality in a spatial food web model Ecosystems 17 1397-1412
Christensen V and Walters C 2000 Ecopath with Ecosim methods capabilities and limitations Ecological Modelling 172 109-139
Colleacuteter M Valls A Guitton J Gascuel D Pauly D and Christensen V 2015 Global overview of the applications of the Ecopath with Ecosim modeling approach using the EcoBase models repository Ecological Modelling 302 pp42-53
Compass Resource Management Ltd 2013 Roberts Bank Terminal 2 Technical Advisory Group (TAG) Process Report Productive Capacity ndash Final Report 119pp (Accessed November 1 2016)
DFO 2016 Technical Review of Roberts Bank Terminal 2 Environmental Assessment Section 95 ndash Coastal Geomorphology DFO Can Sci Advis Sec Sci Resp 2016045 (Accessed November 4 2016)
Pacific Region Science Response Technical Review Assessing
Ecosystem Productivity Model of Roberts Bank
22
ESSA Technologies 2014a Roberts Bank Terminal 2 Project Roberts Bank Delta BC Environmental Impact Statement Volume 3 Biophysical Effects Assessments Appendix 10-C Roberts Bank Ecosystem Model Development and Key Run Port Metro Vancouver (Accessed November 1 2016)
ESSA Technologies 2014b Roberts Bank Terminal 2 Project Roberts Bank Delta BC Environmental Impact Statement Volume 3 Biophysical Effects Assessments Appendix 10-D Roberts Bank Ecosystem Model Sensitivity Analyses Port Metro Vancouver (Accessed November 1 2016)
Franklin J 2009 Mapping Species Distributions Spatial Inference and Prediction Cambridge University Press Cambridge
Hemmera 2014 Roberts Bank Terminal 2 Project Roberts Bank Delta BC Environmental Impact Statement Volume 3 Biophysical Effects Assessments Appendix 10-B Roberts Bank Ecosystem Model Parameter Estimates Port Metro Vancouver File 302-03503 (Accessed November 1 2016)
Port Metro Vancouver 2015a Roberts Bank Terminal 2 Project Roberts Bank Delta BC Environmental Impact Statement Volume 3 Biophysical Effects Assessments Section 100 Biophysical Setting (Accessed November 1 2016)
Port Metro Vancouver 2015b Roberts Bank Terminal 2 Project Roberts Bank Delta BC Environmental Impact Statement Volume 3 Biophysical Effects Assessments Section 103 Overview of Assessing Ecosystem Productivity (Accessed November 1 2016)
Port Metro Vancouver 2015c Roberts Bank Terminal 2 Project Environmental Assessment Additional Information Requirements (July 31 2015) Responses Response to Information Request 6 IR-73115-06 Canadian Environmental Assessment Agency Reference Number 80054 dated 26 October 2015
Steenbeek J Coll M Gurney L Meacutelin F Hoepffner N Buszowski J and Christensen V 2013 Bridging the gap between ecosystem modeling tools and geographic information systems Driving a food web model with external spatialndashtemporal data Ecological Modelling 263 139ndash 151
Sutherland T Elner R and OrsquoNeill J 2013 Roberts Bank Ecological crucible of the Fraser River estuary Progress in Oceanography 115 171ndash180
Vancouver Fraser Port Authority 2016 From the Vancouver Fraser Port Authority to the Review Panel re Answers to preliminary technical questions submitted during the completeness phase from Fisheries and Oceans Canada Natural Resources Canada and Environment and Climate Change Canada concerning the ecosystem modelling to support the Roberts Bank Terminal 2 Project environmental review CEAR Document 547 (Accessed November 1 2016)
Pacific Region Science Response Technical Review Assessing
Ecosystem Productivity Model of Roberts Bank
23
This Report is Available from the Centre for Science Advice
Pacific Region Fisheries and Oceans Canada
3190 Hammond Bay Road Nanaimo BC V9T 6N7
Telephone (250) 756-7208 E-Mail csapdfo-mpogcca
Internet address wwwdfo-mpogccacsas-sccs
ISSN 1919-3769 copy Her Majesty the Queen in Right of Canada 2016
Correct Citation for this Publication
DFO 2016 Technical review of Roberts Bank Terminal 2 environmental assessment section 103 ndash assessing ecosystem productivity DFO Can Sci Advis Sec Sci Resp 2016050
Aussi disponible en franccedilais
MPO 2016 Examen technique de leacutevaluation environnementale du Terminal 2 agrave Roberts Bank section 103 ndash eacutevaluation de la productiviteacute de leacutecosystegraveme Secr can de consult sci du MPO Reacutep des Sci 2016050
- TECHNICAL REVIEW OF ROBERTS BANK TERMINAL 2 ENVIRONMENTAL ASSESSMENT SECTION 103 ndash ASSESSING ECOSYSTEM PRODUCTIVITY
-
- 10 Context
- 20 Background
-
- 21 Background and Terms of Reference
- 22 Approach to assessing ecosystem productivity
-
- 30 Analysis and Response
-
- 31 The EwE Team
- 32 Overview of assessment results of hydrological and sediment modelling
- 33 Model implementation
-
- 331 The purpose of the EwE model
- 332 Applicability of the EwE model framework to the Roberts Bank region
- 333 Model documentation
- 334 Highly mobile functional groups
- 335 Seasonality (model time step)
- 336 Life history structure
- 337 Model balancing
-
- 34 Model validation
- 35 Model results
-
- 351 Presentation of model results
- 352 Sensitivity and vulnerability analyses
-
- 40 Conclusions
- Contributors
- Approved by
- Sources of Information
- This Report is Available from the
-
- CSAS 2016-50 - Assessing Ecosystem Productivitypdf
-
- TECHNICAL REVIEW OF ROBERTS BANK TERMINAL 2 ENVIRONMENTAL ASSESSMENT SECTION 103 ndash ASSESSING ECOSYSTEM PRODUCTIVITY
-
- 10 Context
- 20 Background
-
- 21 Background and Terms of Reference
- 22 Approach to assessing ecosystem productivity
-
- 30 Analysis and Response
-
- 31 The EwE Team
- 32 Overview of assessment results of hydrological and sediment modelling
- 33 Model implementation
-
- 331 The purpose of the EwE model
- 332 Applicability of the EwE model framework to the Roberts Bank region
- 333 Model documentation
- 334 Highly mobile functional groups
- 335 Seasonality (model time step)
- 336 Life history structure
- 337 Model balancing
-
- 34 Model validation
- 35 Model results
-
- 351 Presentation of model results
- 352 Sensitivity and vulnerability analyses
-
- 40 Conclusions
- Contributors
- Approved by
- Sources of Information
- This Report is Available from the
-
Canadian Science Advisory Secretariat Pacific Region Science Response 2016050
December 2016
TECHNICAL REVIEW OF ROBERTS BANK TERMINAL 2 ENVIRONMENTAL ASSESSMENT SECTION 103 ndash
ASSESSING ECOSYSTEM PRODUCTIVITY
10 Context Vancouver Fraser Port Authority (VFPA) formerly Port Metro Vancouver (the Proponent) is proposing to construct and operate the Roberts Bank Terminal 2 Project (the Project) a new three-berth marine container terminal at Roberts Bank in Delta British Columbia The proposed terminal is located next to the existing Deltaport and Westshore Terminals In addition to the construction of the new terminal the Proponent has proposed to widen the north side of the existing Roberts Bank causeway from its east-end connection with the mainland to the entrance to the new terminal The existing tug basin connected to the northeast side of Deltaport Terminal is also proposed to be expanded The new marine terminal is predicted by the Proponent to process up to 260 container ship calls per year at full capacity with the assistance of two or three large berthing or escort tugs to manoeuver ships into or away from assigned berths The terminal is designed to operate 24 hours per day year-round
The Roberts Bank Terminal 2 Project is subject to an environmental assessment by a Review Panel pursuant to the Canadian Environmental Assessment Act 2012 As a federal authority in the environmental assessment for the Project Fisheries and Oceans Canada (DFO) will be asked to present information to the review panel and at public hearings in relation to its expertise on the effects of the Project on fish and fish habitat including aquatic species at risk and the adequacy of mitigation and offsetting measures and monitoring and follow-up programs proposed by the Proponent DFOrsquos Pacific Region Fisheries Protection Program (FPP) will coordinate DFOrsquos participation in the environmental assessment
The Proponent assessed future ecosystem productivity at Roberts Bank using the Ecopath with Ecosim and Ecospace (EwE) model framework The potential impacts of the Project to hydrodynamic conditions and sediment transport in the area as a result of changes in wind wave and current patterns and intensities are projected using different model frameworks A companion Science Response (DFO 2016) has been developed by DFO and Natural Resource Canada (NRCan) to review Section 95 ldquoCoastal Geomorphologyrdquo of the Environmental Impact Statement (EIS) which describes the hydrodynamic and sedimentology models that were used to evaluate the effect of the Project on water and sediment movements
Outcomes of the EwE models are incorporated into the analysis of the potential project-related effects on the ongoing productivity of commercial recreational and Aboriginal fisheries Consequently DFO FPP has requested that DFO Science Branch provide an evaluation of the Proponentrsquos characterization of project-related effects as conducted using the Ecopath with Ecosim and Ecospace (EwE) ecosystem model
Pacific Region Science Response Technical Review Assessing
Ecosystem Productivity Model of Roberts Bank
2
The objectives for this Science Response are to
1 Determine if the functional groups and abiotic factors used in the model adequately represent the ecosystem at Roberts Bank
2 Assess whether the parameter estimates used by the model are valid and defensible for this system
3 Assess whether the limitations and uncertainties of the model are identified and appropriately considered when determining the modelrsquos representation of current and possible future conditions
4 Provide advice regarding whether the model results related to the potential effects of the Project on fish and fish habitat and migratory birds and their food resources are valid and defensible
5 If possible provide advice regarding the validity of using the EwE model framework to quantify large scale impacts to fish habitat and fisheries productivity and the productivity of migratory birds
This Science Response evaluates Section 100 ldquoBiophysical Settingrdquo with a focus on Section 103 ldquoOverview of Assessing Ecosystem Productivityrdquo in the EIS as submitted by the Proponent (Port Metro Vancouver 2015) This Section and consequently this Response describes the ecosystem modelling approach that was taken to evaluate the direct and indirect effects of the footprint of the proposed terminal and widened causeway herein referred to as lsquothe Projectrsquo This ecosystem model provides outputs related to potential effects of the project on the study area at an ecosystem level including aquatic species and bird species in the Project area Evaluation of the model and its outputs therefore required expertise in both fishery aquatic species and migratory bird species Consequently this Science Response is the product of a joint review between DFO and Environment and Climate Change Canada (ECCC) Canadian Wildlife Service and Wildlife and Landscape Science to provide a complete evaluation
This Science Response Report results from the Science Response Process of July 2016 on the Technical Review of Ecopath with Ecosim and Ecospace (EwE) Ecosystem Productivity Model application to the Roberts Bank Terminal 2 Environmental Assessment
20 Background
21 Background and Terms of Reference The Projectrsquos main components have a proposed combined marine footprint area of approximately 179 km2 listed below by specific component
bull Marine Terminal 1335 km 2 including terminal (116 km 2) and dredged berth pocket and marine approach areas (0174 km 2)
bull Widened Causeway 0424 km 2
bull Expanded Tug basin 0031 km 2
Roberts Bank in the Fraser River estuary consists of complex intertidal and subtidal habitats including intertidal eelgrass beds and is an important stopover area for migrating shorebirds and productive feeding and rearing habitats for many fish and invertebrate species It also provides habitat for endangered Southern Resident Killer Whales and other marine mammals
Pacific Region Science Response Technical Review Assessing
Ecosystem Productivity Model of Roberts Bank
3
The environmental conditions at Roberts Bank are dynamic and are influenced by a variety of oceanographic and atmospheric factors including the Fraser River freshwater and sediment plume discharge diurnal tidal currents and prevailing and storm-generated wind and wave activity In addition the intercauseway region provides significant drainage from marsh and agricultural areas which have different characteristics from marine waters and which run along the ferry causeway
To provide the required science advice this Science Response focusses on Section 10 ldquoBiophysical Settingrdquo of the Environmental Impact Statement (EIS) (Port Metro Vancouver 2015a) specifically Section 103 ldquoOverview of Assessing Ecosystem Productivityrdquo (Port Metro Vancouver 2015b) and its related Appendices 10-B ldquoRoberts Bank Ecopath with Ecosim and Ecospace model parameter estimatesrdquo (Hemmera 2014) Appendix 10-C ldquoRoberts Bank Ecosystem model development and key runsrdquo(ESSA Technologies 2014a) and Appendix 10-D ldquoRoberts Bank Ecosystem model sensitivity analysesrdquo (ESSA Technologies 2014b) Additional important information was obtained from the Response to Information Request 6 (IR-73115-06 Canadian Environmental Assessment Agency Reference Number 80054 dated 26 October 2015) (Port Metro Vancouver 2015c) and the Written Responses to Coastal Geomorphology and Ecosystem Modelling Questions provided by the Proponent to DFO ECCC and NRCan on 2 March 2016 (Port Metro Vancouver (PMV) Transmittal TRE-01-RBT2-0004A subsequently referred in this Science Response as ldquoPMV Response 2016-03-02rdquo) (Vancouver Fraser Port Authority 2016)
The process followed in preparing this Science Response involved an initial review of the submitted EIS followed by an in-person meeting of the Proponent its contractors and representatives of DFO ECCC and NRCan to discuss and clarify questions arising from the initial review (Vancouver 23 November 2015) DFO and NRCan provided written questions to the Proponent based on preliminary review of the EIS on November 19 2015 ECCC also provided written questions based on its preliminary review of the EIS to the Proponent on December 1 2015 and January 20 2016 This large initial meeting was followed by smaller focussed meetings between the Proponent its contractors and DFO and NRCan on 11 December 2015 to clarify hydrology and sediment modelling questions with DFO on 8 January 2016 to clarify ecosystem modelling questions and with ECCC on 18 February 2016 to clarify questions relating to birds Written responses to all of these meetings and questions were provided by the Proponent to DFO ECCC and NRCan as the ldquoPMV Response 2016-03-02rdquo and ldquoPMV Response 2016-05-30rdquo (Vancouver Fraser Port Authority 2016) VFPArsquos answers to questions posed by DFO and NRCan regarding coastal geomorphology modelling have been posted to the Canadian Environmental Assessment Registry (CEAR)
22 Approach to assessing ecosystem productivity The Proponent adopted an ecosystem approach to evaluate the direct and indirect effects of the Project on the productivity of the Roberts Bank ecosystem A weight of evidence approach was used to assess the potential effects of the project on the productivity of the ecosystem and selected key components in the study area this approach included a spatial ecosystem simulation model (which included a habitat capacity model) a shorebird opportunity model and empirical data An important point is that any effects on the system during the construction phase or from expansion of the tug basin were excluded from this modelling process the focus instead being a comparison of modelled system productivity before and after the proposed terminal and expanded causeway is in place The chosen ecosystem simulation model was
Pacific Region Science Response Technical Review Assessing
Ecosystem Productivity Model of Roberts Bank
4
Ecopath with Ecosim and its spatial version Ecospace (collectively referred to here as the EwE framework or EwE model) This modelling approach was recommended by a prior Productive Capacity Technical Advisory Group comprised of representatives of technical experts from government agencies academia non-governmental organizations Vancouver Fraser Port Authority and its consultants (Compass 2013) convened by the Proponent and which also recommended a selection of focal species for the model The final selection of functional groups and the resulting food web that form the core of this ecosystem model are shown in Figure 1
Pacific Region Science Response Technical Review Assessing
Ecosystem Productivity Model of Roberts Bank
5
Figure 1 Ecopath with Ecosim model food web for Roberts Bank (Adapted from EIS Volume 3 Section 10 Fig 1033 on page 10-16) The groups coloured in orange represent focal groups size of symbols represents relative annual amount of biomass in the Roberts Bank study area
Pacific Region Science Response Technical Review Assessing
Ecosystem Productivity Model of Roberts Bank
6
The EwE framework is a common approach to ecosystem modelling which has been developed and expanded over the past two to three decades It currently has three main components
1 Ecopath ndash the core model which provides a mass-balance snapshot of the system
2 Ecosim ndash a module that enables simulation modelling over time
3 Ecospace ndash a module that enables simulation modelling over space
In order to make an EwE model tractable species are aggregated into functional groups based on their similar ecological characteristics (habitat and prey preferences etc) the Roberts Bank models had 58 functional groups The first step (Ecopath) was to obtain input parameters representing biomass production consumption emigration and diet for each functional group These parameters were then tuned in an iterative process until the overall production and consumption was balanced (a mass-balance approach) resulting in a model food web with estimates of energy flow between functional groups (Fig 1)
In the second step Ecosim was combined with the spatial model Ecospace The abiotic variables selected in this EIS (depth salinity bottom current wave height sediment type) were used as external forcings to the Ecospace module These abiotic variables provided the physical forcings for the simulations without and with the Project Since time series data on the functional groups of the model were not available Ecospace was run until the model reached equilibrium using various assumptions of the value of the vulnerability parameter (see Section 352) In this EIS the selected time step was annual with all variables abiotic and biotic expressed as yearly averages As used in this EIS the Ecospace module included a habitat capacity model which estimated the distribution of functional groups based on their environmental preferences for each abiotic variable (depth salinity bottom current wave height) and for substrate type (sand mud etc) The model thus allocated the spatial distribution of functional groups over the model domain based on their environmental preferences and the distributions of these abiotic variables with and without the Project The selected spatial unit size (ldquopixelrdquo) for the Ecospace model was 100 m2 In essence an Ecopath model was constructed for each pixel with particular rules governing how the functional groups interacted and moved among these spatial units The Ecospace module was run until it approached equilibrium (20 model years) to establish the spatial patterns without the Project For the lsquowith the Projectrsquo simulations the model was run for an initial 10 years and then the spatial patterns of the abiotic variables with the project were added and the model run for an additional 10 years1 The model outputs predicted changes in the productive potential of the Roberts Bank ecosystem as a comparison (ratio) with and without the Project rather than an absolute biomass that would be lost or gained as a result of the Project
1 EIS Appendix 10-C p 26
Pacific Region Science Response Technical Review Assessing
Ecosystem Productivity Model of Roberts Bank
7
30 Analysis and Response To prepare this response the following sections of the EIS additional documents were reviewed
DocumentSection Title
EIS Section 10
Including appendices 10B 10C and 10D
(Port Metro Vancouver 2015a Hemmera 2014 ESSA Technologies 2014a ESSA Technologies 2014b)
Biophysical Setting
Appendix 10-B Roberts Bank Ecosystem Model Parameter Estimates Port Metro Vancouver File 302-03503
Appendix 10-C Roberts Bank Ecosystem Model Development and Key Run Port Metro Vancouver
Appendix 10-D Roberts Bank Ecosystem Model Sensitivity Analyses Port Metro Vancouver
CEAR document 547 (Including Appendices) ldquoPMV Response 2016-03-02rdquo and ldquoPMV Response 2016-05-30rdquo
(Vancouver Fraser Port Authority 2016)
Vancouver Fraser Port Authority to the Review Panel re Answers to preliminary technical questions submitted during the completeness phase from Fisheries and Oceans Canada Natural Resources Canada and Environment and Climate Change Canada concerning the ecosystem modelling to support the Roberts Bank Terminal 2 Project environmental review
31 The EwE Team Building this ecosystem model was a complex undertaking which required knowledge of the ecosystem to be modelled how to set initial parameter values determination of reasonable ranges of these parameters how to balance the model and how to recognize when the model outputs were unrealistic These tasks became even more complex when spatial model dynamics were involved such as with Ecospace The team engaged by the Proponent to conduct this ecosystem modelling for the Roberts Bank Terminal 2 (RBT2) EIS was led by scientists at the Institute for Oceans and Fisheries located at the University of British Columbia in Vancouver These scientists are global leaders of the EwE model framework having developed much of its current implementation and who continue to lead its elaborations and extensions Construction and running of the model for this specific ecosystem was done in collaboration with ESSA Technologies of Vancouver Parameter values for the ecosystem model were obtained in part from observational studies conducted in the area by Hemmera of Burnaby BC
32 Overview of assessment results of hydrological and sediment modelling Implementation of the ldquowith the Projectrdquo simulations of the ecosystem model was done by driving the model with the abiotic variables as they were projected to be distributed with the Project footprint In the context of this EIS specifying depth salinity bottom currents wave height and sediment type conditions without the Project and changes with the Project were achieved by construction of hydrodynamical and sediment transport models The outputs from these models in combination with the identified environment preferences for the various biological groups were then used as inputs to the Ecospace model to define the spatial
Pacific Region Science Response Technical Review Assessing
Ecosystem Productivity Model of Roberts Bank
8
distributions of these functional groups The implementation of these hydrological and sediment transport models in this EIS was reviewed by DFO and NRCan (DFO 2016) This review concluded that the implementation of these models for this EIS was adequate for average winter conditions but lacking in validation for summer conditions in particular with strong freshwater flows from the Fraser River Simulations of strong storm events and their impacts on wave conditions and sediment transport were also lacking The effect of wave action and current speeds on sediment transport is non-linear such that increasing winds over short periods of time can impact sediment transport processes bottom topography and water depths beyond that determined under average model conditions Overall the review concluded that a greater range of sensitivity analyses is required to have confidence in the model outputs under lsquonon-averagersquo conditions The implication of this conclusion for the present review of the EwE model is that the full range of variability of abiotic characteristics such as bottom topography bottom current and wave heights and how they may affect relevant functional groups in the model with the Project may not be adequately represented Sensitivity analyses were provided by varying the intensity of abiotic variables and by removing abiotic variables to assess their interactive effects In general the ecosystem model outputs were robust to these sensitivity analyses with most groups varying by less than 5 Larger changes however were observed for primary producer and bird groupings and for some fish groups when various abiotic variables were omitted2
33 Model implementation 331 The purpose of the EwE model
The EwE model was intended to provide one line of evidence to assess the potential impacts of the Project on the Roberts Bank ecosystem which would then be used with other lines of evidence to make the final assessment Specifically ldquohellip the objective of the RB [Roberts Bank] model was not to provide an assessment of Project impacts for each functional group at a fine temporal scale but to estimate changes in productive potential with and without the Project at the ecosystem levelrdquo3 In addition ldquohellipthe primary objective of the RB ecosystem model is to evaluate potential changes in productivity from such abiotic factors with and without the terminal and causewayrdquo4 Results are presented for the selected functional groups no results were presented on potential changes in ecosystem structure or function
332 Applicability of the EwE model framework to the Roberts Bank region EwE models work best when the exchanges within the system being modelled are greater than the exchanges between the modelled system and the lsquooutsidersquo world In practice this means that EwE models work best for larger systems with few external exchanges In a meta-analysis of 433 Ecopath models Colleacuteter et al (2015) concluded that ldquohellipin the last two decades the range of the models area has expanded toward very large areas and the median has shifted accordingly from about 1000 km2 in 1984ndash1993 to about 100000 km2 in 1994ndash2014rdquo The section of the Roberts Bank ecosystem that is included in the EwE model was comparatively small (5468 km2) and complex It is an intertidally-dominated environment that is subject to strong seasonal influences of both freshwater and marine exchanges across relatively large seaward and shoreward boundaries
2 EIS Appendix 10-D p ii - iii 3 PMV Response 2016-03-02 p 99 lines 1914-1917 4 PMV Response 2016-03-02 p 38 lines 689-691
Pacific Region Science Response Technical Review Assessing
Ecosystem Productivity Model of Roberts Bank
9
Processes taking place outside the modelled ecosystem will contribute to dynamics within the modelled ecosystem (eg lsquooutsidersquo food supporting predators which occur in the Roberts Bank ecosystem for only part of the year predators which may feed in the Roberts Bank ecosystem but export this energy when they migrate out of the region) but which may not be well-resolved by the EwE model The Proponent justifies the spatial scale because it was specifically chosen for the questions being asked in regard to assessing productivity changes and because the relative influences of external exchanges are assumed to be identical with and without the project In addition highly mobile species with broad prey bases were assumed in the model to be partially sustained by external energy from outside the model system5 The distributions of organisms may differ however with and without the project which may affect their interactions with areas outside of the modelled system and the use of diets from outside the modelled system may not reflect the impacts of the project Further clarification of how the EwE model captures the exchanges and interactions with adjacent ecosystems are needed For example it could be argued that an ecosystem which is open to frequent exchanges of water and organic matter from beyond its boundaries might be more robust to local disturbances such as the Project
There are some inconsistencies in the information and assumptions used for some of the taxa in this ecosystem model For Dungeness Crab the justification for estimating total adult biomass (including females) from the biomass of fished males is unclear In addition it is unclear if the slower growth of female crabs once they have reached sexual maturity in comparison with male crabs has been considered The diet matrix for spiny dogfish does not represent the actual diet well in particular of euphausiids herring and shrimp and there are more recent references for biomass estimates of spiny dogfish in the study area than what was used in the EIS
Fishing mortality was not included in the model under the assumption that this would not change with or without the project While this assumption may be true the model has been parameterized by ignoring a source of mortality that will influence total production In essence fishing removes biomass from the ecosystem with the result that less biomass will be available for higher trophic levels How this may impact the ecosystem with and without the Project is unclear but it could make noticeable differences if for example there were thresholds in the feeding responses by these higher trophic level species The Ecopath model that was used is relatively unconstrained since many ecological efficiencies are low even for forage species which would be expected to be higher It is not clear how many species are exploited or the levels of exploitation but even if this does not change with the Project these mortality rates should be included in the model in order to add realistic constraints to the exploited functional groups
333 Model documentation Based on questions from DFO ECCC and NRCan following their initial review of the EIS the Proponent provided written responses dated 2 March 2016 to clarify several of the steps in the model development and implementation However several questions remain including questions about the Ecospace module Ecospace has undergone several recent developments such as the inclusion of the spatial-temporal data layer framework (Steenbeek et al 2013) the habitat capacity model (Christensen et al 2014) and the Monte Carlo analysis including the diet matrix As yet there are few published studies using these latest Ecospace developments and their documentation and justification need to be improved in the EIS
5 PMV Response 2016-03-02 p 29 lines 446 - 464
Pacific Region Science Response Technical Review Assessing
Ecosystem Productivity Model of Roberts Bank
10
Questions also remain regarding how the Monte Carlo randomization routine treated diet data The report indicates that the Monte Carlo routine randomly selected input parameters from the input ranges and that only models that were balanced were used This suggests that a high proportion of models were not balanced and therefore were not used (for example the EIS indicates that about one out of 1000 sampled input parameters was balanced6) A table showing the minimum maximum mode average and median values from the Monte Carlo runs for all the parameters would enable an evaluation of how much variation was actually sampled by the balanced model runs This is recommended in the EwE user information ie ldquoUsers should check the range of the input parameters that were actually used in the trials in the output csv file (see below)rdquo7
In addition there are several issues with the documentation of the derivation of the parameters for the functional groups Such documentation should clearly outline how the input parameter was estimated and the range of uncertainty for that parameter For example the input biomass of pinnipeds was defined as 04 t km 2 derived from estimates of 034 for Harbour seals and two estimates for Steller sea lions (012 and 014 t km 2) No explanation was provided for how the overall estimated pinniped biomass of 04 t km 2 was determined The diet of Sand Lance was described in the EIS as consisting mostly of zooplankton8 whereas the diet table for the model runs9 included 20 macrofauna 10 green algae and 10 detritus It is unclear why these additional prey were included in the diet used for the model runs
334 Highly mobile functional groups This implementation of the EwE framework included transient and migratory functional groups This is entirely appropriate and these groups cannot be excluded The approach taken in the Ecospace module was to impose a low (and conservative) dispersal rate among model spatial units (lsquopixelsrsquo) of 1 km yr-1 This may be appropriate for low mobility benthic organisms but it likely underestimates the movements of many other functional groups The effects of using higher and perhaps functional-group-specific dispersal rates was not considered The Proponents argued that higher dispersal rates would reduce impacts since species can move away from less desirable areas more quickly for completeness these runs should be done and evaluated Mobile species will also bring energy (food) captured outside the system into the modelled ecosystem This process was included in the model with the use of a diet import factor reflecting the consumption of prey outside the modelled region with the assumption that groups with high import rates were unlikely to respond to local changes on Roberts Bank10 This assumption needs justification perhaps at the functional group level for example many species of highly migratory birds and Pacific salmon use the Roberts Bank ecosystem to obtain food to continue their migrations Although this food does not compose a large fraction of their annual consumption it can be critical to enable them to continue their migrations
The EwE model is not designed to capture differences in prey quality ie differences in essential fatty acid or nutrient ratios The same species of prey may have greater or lesser nutritional value to predators depending on the conditions under which they are growing and their seasonal variations This is a particular concern with the nutritional quality of the diatom-dominated biofilm Diatomaceous biofilm is important to the highly migratory Western Sandpiper (Calidris mauri) Despite its predictive merits in relation to other ecosystem
6 EIS Appendix 10D Section 24 p5 7 EwE Help file p 151 8 EIS Appendix 10B Section 4133 p 76 9 EIS Appendix A of Appendix 10B 10 PMV Response 2016-03-02 p 28 lines 429 - 436
Pacific Region Science Response Technical Review Assessing
Ecosystem Productivity Model of Roberts Bank
11
components the EwE model is not informative with respect to understanding the potential impacts of the Project on biofilm and the Western Sandpiper While this example is specific to seabirds the potential exists for differences in the quality of biofilm to also be an issue for copepods which feed on biofilm and consequently to juvenile salmon which feed on these copepods (eg Sutherland et al 2013)
The EwE model is also not designed to predict effects of the Project on water quality although the Proponent noted that ldquoOther abiotic factors not included were deemed to be representative of variables that were already included in the modelhelliprdquo11 The Project may cause changes in physical and water quality conditions whether in isolation or in combination which may impact the productivity or nutritional quality of key prey organisms for local and migratory species which will not be captured by the model The EwE model does not assess the production of key nutrients or the implications of changes in important physical and water quality parameters to biofilm community structure and hence to important migratory birds
The model does not include biotic factors for both pelagic and benthic environments to assess the potential development of eutrophication and benthic organic enrichment events respectively Organic and redox indicators traditional measures of environmental assessments that are used to determine changes in functional group responses were included in the recent Deltaport Third environmental assessment (ie Pelagic chlorophyll dissolved nutrients Benthic sediment carbonnitrogen content redox state [sulfide concentration]) Benthic anoxic events based on organic enrichment are known to be strong drivers of community composition and exclusion regardless of substrate type In the absence of biotic factors (eg organic particulates) the model has not considered the potential for benthic organic enrichment which coincides with siltation processes within the upper tidal flats The tidal flat corner bordered by the Delta-dyke and Deltaport causeway has served as a catchment area for Fraser River silt since the development of the original Deltaport causeway (Sutherland et al 2013) The proposed position of the new terminal placed at the seaward termination of the Deltaport causeway may produce a crescent-shaped feature in the wake of the Fraser River Plume This feature may provide a more efficient silt trap that will promote benthic organic enrichment This piece of the environmental assessment seems to be missing and is important for assessing fish habitat in this area
335 Seasonality (model time step) Input data to parameterize the model were available on a range of time scales from hourly (eg physical data on salinity and water flow) to annual (eg species biomass) The Proponents indicated12 that this is a strength of the EwE model although ultimately the model was run with an annual time step with all sub-annual values being averaged to annual values This method therefore did not incorporate important seasonal processes such as winter-summer differences in salinity and storm properties and the seasonal appearances of abundances of predators and prey such as migratory salmon and birds that are much larger than the annual average For example juvenile salmon migrate from the Fraser River and onto Roberts Bank in the spring before moving into deeper waters If these spring abundances are averaged over the entire year these average abundances would be 5-10 times lower than the actual abundances during the spring (ie averaging the biomass that occurs in two months over a 12 month period) Additionally this method did not capture the intensity of processes such as growth and predation which can be focused over periods of a few weeks to a few months There may be important threshold effects at particular times and places which may be missed when using an 11 EIS Section 10 p 10-11 12 PMV Response 2016-03-02 p 86 line 1655
Pacific Region Science Response Technical Review Assessing
Ecosystem Productivity Model of Roberts Bank
12
annual time step for the model The Ecospace module has a monthly time step13 and therefore it is feasible to run this module with a sub-annual time step For example the Proponents submit14 that there are inadequate data to model the potential effects of the Project on the timing of biofilm production which could have implications for the migratory dunlin and Western Sandpiper However this could be modelled in an exploratory way to determine hypotheses about which factors could affect the timing of production of biofilm and the potential impacts on these birds These issues are of major concern to ECCC
336 Life history structure The EwE model did not separate functional groups into life history stages (stanzas) yet for many functional groups the juvenile stages can have very different life history characteristics and habitats than the adults It is unclear in the description of the model how different life history structures were considered and whether for example there were enough juveniles to produce the adults The implications of not including early life stages should be explored at least qualitatively to identify which species might have life stages that may be more vulnerable to project effects
337 Model balancing Balancing an EwE model is the process by which parameters are adjusted so that there is sufficient production for consumption requirements ie there are sufficient prey for all predators Expert opinion was used to examine parameter values and to adjust for errors or inconsistencies in logic ldquoPMV is confident that since the approach taken to balance the model was based on best practices the steps are appropriaterdquo15 Adjustments to initial parameters to ensure an ecologically-feasible model are necessary and to be expected For a few functional groups however very large changes to initial parameter estimates (which were often not based on Roberts Bank specific data) were necessary for example to transient killer whales When such initial parameters were adjusted (often by substantial amounts) by expert opinion to balance the model the confidence intervals around these adjusted parameter values were not increased to reflect this added uncertainty (see for example PMV Response 2016-03-02 p 51 lines 955-956) When expert opinion was used to make very large changes to initial parameter values broader confidence intervals about these parameters should have been applied This does not appear to have been the case and as a consequence may cause the actual uncertainty of the model outputs to be underestimated
Another example is for the pinniped group in which 50 of the diet was assumed to come from outside the model area in order to balance the model The rationale provided was ldquoThe pinnipeds caused excessive predation mortalities on numerous fish functional groups The biomass of pinnipeds was an average for the Strait of Georgia which was likely too high for Roberts Bank Therefore it was assumed that pinnipeds extracted only half of their diet from the study areardquo16 It is unclear whether the sensitivity of the model to different percentages of diet allocation was explored
As noted above (332) the Ecopath model was relatively unconstrained and few adjustments to input parameters were required to balance the model This is unusual and the low ecotrophic efficiencies of several functional groups suggest that full accounting of energy flows may not have been achieved (an ecotrophic efficiency of 1 indicates that 100 of the production of that
13 EIS Appendix 10C Section 29 p24 14 EIS Appendix 10D Appendix C p72 15 PMV Response 2016-03-02 p 49 lines 910-912 16 EIS Appendix 10C Section 261 p 20
Pacific Region Science Response Technical Review Assessing
Ecosystem Productivity Model of Roberts Bank
13
particular group is being preyed upon or removed by fishing leaving no individuals to die of old age17) An ldquoexcessrdquo of individuals dying of old age ie ecotrophic efficiencies much less than 1 suggests a potentially large biomass that is not used by the ecosystem and instead is converted to detritus
34 Model validation Model validation is the process by which the model parameters variables and outputs are compared with those from the real ecosystem to ascertain how well the model represents the ecosystem It is an essential step in providing confidence that the projections from the model in this case with and without the Project have relevance to how the real ecosystem may be expected to function with and without the Project In practice validating complex ecosystem models is difficult considering the range of assumptions that must be made when building the model the limited available data and natural variability of the ecosystem at a variety of time and space scales
Many of the standard diagnostics for the Ecopath model have not been evaluated in the EIS The Proponent appears to have assumed that once the Ecopath model was balanced then it was valid and fit for purpose The Proponent should provide all the Ecopath estimates of vital rates including mortality rates As presented questions remain For example many Ecotrophic Efficiencies (which control the transfer of biomass from prey to predators) are less than 1 even for taxa which would be expected to be close to 1 such as carnivorous zooplankton The reason for Ecotrophic Efficiencies less than 1 were not discussed or explained in the EIS
Detailed diagnostics for the Ecospace model should also be presented in order to evaluate model performance In response to criticisms by DFO ECCC and NRCan in discussions with the Proponent the latter provided the biomass of the functional groups from the Ecopath model (before Ecospace) and the Ecospace model after the spin-up period (which involved adjusting the parameters from the Ecopath model to balance the 5468 separate cells of the Ecospace model)18 The Proponents argue that ldquoIt is important to note that changes in biomass values generated during the spin-up period are identical for both with and without Project scenarios and thus do not provide information on the potential Project-related effects on productivity19 However several changes to biomass result from the Ecospace balancing process (spin-up period) This is only given brief attention by the Proponent in its response to the DFO ECCC and NRCan questions An analysis of Table 620 revealed that the biomass of 9 functional groups was larger or smaller than the widest confidence limits allowed for each group21 This requires further discussion and justification
The Proponent used a goodness of fit measure to compare spatial distributions of model outputs with field observations They indicated that ldquono other EwE models were identified which use a goodness-of-fit measure Hence the RB model is potentially the first such EwE model where a goodness of fit measure has been appliedrdquo22 The chosen goodness of fit measure is the percent correct classification (PCC) method23 This method derives a test statistic based on the proportion of locations at which predicted occurrences from the model match observed
17 EIS Appendix 10-B p 11 18 PMV Response 2016-03-02 p 65-66 Table 6 19 PMV Response 2016-03-02 p 64 lines 1205-1207 20 PMV Response 2016-03-02 p 65-66 Table 6 21 PMV Response 2016-03-02 p 45 Table 3 22 PMV Response 2016-03-02 p 78 lines 1481-1483 23 PMV Response 2016-03-02 p 78 lines 1483-1484
Pacific Region Science Response Technical Review Assessing
Ecosystem Productivity Model of Roberts Bank
14
occurrences from data and similarly with predicted and observed absences The Proponent then calculated two additional accuracy of fit measures sensitivity (the model predicts a species to occur in an area where it is known to occur in reality) and specificity (the model predicts a species does not occur in an area it is known not to occur in reality)24 This analysis concluded that the model has high predictability for functional groups such as eelgrass and sea pens with relatively static distributions but lower predictability for functional groups which are more temporally and spatially dynamic such as biofilm and green algae25
There are two problems with this approach The first is that this goodness of fit comparison was done only for habitat-forming functional groups no discussion of how well this analysis applies to mobile functional groups was provided The second problem is that this method does not take into account situations (such as occurs in this study with several groups) in which species occur at only a few locations For example ldquohellipif the test data consist of 95 absences and 5 presences and this reflects the true prevalence of the species on the landscape (a realistic scenario for a rare species) a lsquonullrsquo model that predicted absence in all cases (eg no model at all) would be correct 95 of the timehellipldquo (Franklin 2009 p 151) This latter point is important here as these habitat functional groups (biofilm brown algae native eelgrass green algae Japanese eelgrass tidal marsh biomat and orange sea pens26) appear not to occur over most of the Project area (as portrayed by the model outputs presented in the distribution figures of PMV Response 2016-03-02 Appendix 218) It is therefore important that a robust evaluation of the performance of the Ecospace module is used with preferably more than one measure
In summary the starting point for this modelling analysis matters It is not just about a comparison between results with and without the Project The model has to be considered a sufficient representation of the ecosystem The Proponent has not yet sufficiently validated the model
35 Model results 351 Presentation of model results
As noted above (Section 331) the stated objective of the Roberts Bank ecosystem model was not to provide an assessment of Project impacts for each functional group at a fine temporal scale but to estimate changes in productive potential with and without the Project at the ecosystem level27 However results were presented as comparisons by speciesfunctional group with and without the Project and not as potential changes in total ecosystem productivity The revised figures for each functional group showing distributions without the Project with the Project and their difference indicated impacts were likely to be localized with overall impacts relatively small The range of biomass ratios with and without the Project was 045 ndash 189 with most values slightly less than 1 This is interpreted as indicating slight decreases in the capacity of the study area to support biomass and production with the Project for many functional groups28 (Figure 2)
24 PMV Response 2016-03-02 p 80 lines 1524-1527 25 PMV Response 2016-03-02 p 81 lines 1551-1559 26 PMV Response 2016-03-02 p 82 Table 8 27 PMV Response 2016-03-02 p 99 lines 1914-1917 28 PMV Response 2016-03-02 Appendix 218
Pacific Region Science Response Technical Review Assessing
Ecosystem Productivity Model of Roberts Bank
15
Biomass Ratio
Freq
uenc
y
04 07 10 13 16 19
05
1015
2025
30
Figure 2 Histogram of biomass ratios obtained by comparisons of model runs with and without the project (ie With Without) Values less than 1 indicate reductions in biomass with the Project compared against without the Project) Data from Appendix 218 of PMV Response 2016-03-02
352 Sensitivity and vulnerability analyses Every ecosystem model is only one possible representation of the true ecosystem defined by the modelrsquos structure and the values chosen for its many parameters The key point is how well the model represents the real system how that fit can be measured and the sensitivity of model outputs to variability in the selected parameter values The ideal model should be robust to a wide range of uncertainties in the input data and parameters This robustness is determined by performing sensitivity analyses on the model to see how it responds to variations in the input parameters and determining to which input parameters the model is most sensitive
The vulnerability parameters determine the strength of the feeding interactions between functional groups They set the level of density dependence of each functional group Higher vulnerability settings provide greater top-down (predator) control whereas lower settings provide greater bottom-up (environmental) control29 Several publications have shown that EwE models are very sensitive to the vulnerability parameters and Christensen and Walters (2000) point out that a main pitfall of EwE is that ldquopredation vulnerabilities are often underestimated lessening the modelled impacts of predationrdquo It is usual practice to tune Ecopath models including the vulnerability parameters to time series data such as biomass using the temporal simulation model Ecosim However these data were not available for the RBT2 area so this robust method of fitting the model and estimating vulnerability parameters was not possible Instead a vulnerability setting of 2 was used as the default value for the key model runs which is ldquocommon practice when time series data are not available and estimates of vulnerability in the
29 PMV Response 2016-03-02 p 70 lines 1318-1323
Pacific Region Science Response Technical Review Assessing
Ecosystem Productivity Model of Roberts Bank
16
model cannot be maderdquo30 with sensitivity analyses run for a range of 15 to 3 This narrow range was criticized by DFOECCC in initial discussions about the model with the Proponent The Proponent subsequently reran the model with a larger range of vulnerabilities31 (11 to 10) and concluded this broader vulnerability range produced similar results for the productivity ratio with and without the Project to those in the original EIS and that the EIS was more likely to overestimate than underestimate potential project effects32 The data in Table 7 of the PMV Response33 did indicate changes in productivity ratios ranging from 0 to 50 of the defined key run (which used a vulnerability setting of 2) However the Proponent changed all vulnerability settings to the same value ie all were 2 or all were 10 etc In reality the vulnerability parameters resulting from Ecosim models that are fitted to data as described above vary by functional group which was not explored here Therefore although the results suggest that the original choice of 2 for the default key run seemed reasonable the potential effects of variability in vulnerability settings was not fully explored
Sensitivity analyses are usually based on the range of uncertainty estimated for input data and parameters often called the confidence limits around the model parameters The EwE framework integrates many different data sources and parameters including values from the literature It can therefore be difficult to identify ldquoreasonablerdquo confidence limits when derived from such diverse data sources Standard practice in Ecopath models has been to develop a pedigree for each parameter with default values for uncertainty based on the nature of the source data For example parameter values based on high precision field observations of biomass within the model domain receive default confidence intervals of 10 whereas parameter values based on models developed for elsewhere or professional judgment receive confidence intervals of 8034 Sensitivity analyses are then run using parameter values selected from within these confidence intervals However if these default confidence intervals do not capture the full range of variability then the outputs are not informative of the variability in the lsquorealrsquo ecosystem Field observations were collected for many functional groups within the model domain in 2012 and 2013 as part of studies to support the RBT2 EIS Apparently the purpose of these observations was to document spatial variability (in part for the Ecospace model) and temporal variability (measurements at one location over time) and not to derive confidence intervals around the observations35
The reliance on the pedigree approach to derive confidence intervals for this Roberts Bank model was criticized by DFO ECCC and NRCan in discussions with the Proponent As a result the Proponent reran the model with much larger confidence intervals ranging from 30 to 100 depending on the input parameter and functional group36 The results from this new analysis using the broader confidence intervals were similar to those using the original pedigree approach The Proponent noted that ldquoWhile the production within each helliprun was very different there was little difference in the biomass ratio [with and without the Project] These results further demonstrate that even with a greater range in input values the influence of the Project on the Roberts Bank ecosystem is consistent among allhellipmodel runsrdquo37 This provides confidence that the model may be robust to uncertainty in its input parameters Two concerns
30 PMV Response 2016-03-02 p 70 lines 1321-1322 31 PMV Response 2016-03-02 p 71-74 32 PMV Response 2016-03-02 p 71 lines 1339-1341 33 PMV Response 2016-03-02 p 73 34 EIS Appendix 10-C Section 251 page 18 35 PMV Response 2016-03-02 p 42 lines 772-777 36 PMV Response 2016-03-02 p 44-47 37 PMV Response 2016-03-02 p 47 lines 855-858 and see also PMV Response 2016-03-02 Appendix 27-B
Pacific Region Science Response Technical Review Assessing
Ecosystem Productivity Model of Roberts Bank
17
remain however The quote above indicates that the production among the different model runs was very different although with little difference in the biomass ratios with and without the Project Since biomass is not the same as production it would be informative for understanding model performance and potential impacts to show these production differences This also relates to the point made in Section 34 regarding how well the model represents the real ecosystem and not just within-model comparisons with and without the Project The second question is more technical and relates to how the randomization (Monte Carlo or MC) routine that was used to create multiple model runs used the uncertainty about the diet data Diets are not currently included in the MC routine available to regular users of the Ecosim model how they were handled in this RBT2 model appears not to be explained
Finally the sensitivity analyses indicate that the uncertainty in the input parameters does not lead to much difference between model parameters with or without the project However this conclusion does not describe how the uncertainty in the input parameters affects understanding of the ecosystem
40 Conclusions Overall the main conclusion of the Environmental Impact Statement from the Proponent is stated as ldquohellipafter the implementation of mitigation hellipthe Project is not expected to result in any significant adverse effects on any of the 16 valued componentsrdquo38 In addition ldquohellipapproximately 40 of the functional groups are forecast to change no more than 5 which hellip is judged to be within the uncertainty of the model runsrdquo39 although larger changes were forecast for orange sea pens freshwater biofilm green algae and raptors The conclusions from the modelling studies are that ldquohellipthe proposed project will have an impact on the study area that the effect varies between species and that the findings are robust to parameter uncertaintyrdquo40 Specific outcomes by valued component as derived from the EwE model are presented by functional groups in Table 1
38 PMV March 2015 Roberts Bank Environmental Impact Statement Executive Summary ndash Part 1 page 37 39 EIS Appendix 10-C p ii 40 EIS Appendix 10-D p iv
Pacific Region Science Response Technical Review Assessing
Ecosystem Productivity Model of Roberts Bank
18
Table 1 Changes in productive potential with the Project as derived from the EwE model
Changes in productive potential
Ecosystem category
Number of valued
components
Number with potential
biomass loss
Moderate decrease (31-60 decline)
Minor decrease (6-30 decline)
Negligible (0-5
change)
Minor increase (6-
30 increase)
Moderate increase (31-60 increase)
Source
Marine vegetation
7 7 - 3 2 2 - EIS Vol 3 Section 11 Table 11-17 page 11-65
Marine invertebrates
4 3 1 1 1 1 - EIS Vol 3 Section 12 Table 12-8 page 12-52
Marine fish 13 13 - 2 6 5 - EIS Vol 3 Section 13 Table 13-10 page 13-95
Coastal birds
11 8 - 3 4 3 1 EIS Vol 3 Section 15 Table 15-10 page 15-67
Pacific Region Science Response Technical Review Assessing
Ecosystem Productivity Model of Roberts Bank
19
Most functional groups showed some potential biomass loss with the Project with biomass loss defined as any model run with negative outcomes (ie in which biomass with the project was less than biomass without the Project) The summary of changes in productivity potential are mixed with most (33 out of 35) valued components showing minor decreases to minor increases (defined as 6 to 30 changes in productive potential with the Project compared to without the Project)
The main conclusions of this review in regards to the Terms of Reference are
1 Do the functional groups and abiotic variables used in the model adequately represent the ecosystem at Roberts Bank
o The 58 functional groups and abiotic variables used in the model adequately represent the main components of the Roberts Bank ecosystem however for longer lived species the life stages of the species are not well represented and some of the impacts of the Project may be expected to affect specific life stages
o The abiotic variables adequately represent the physical drivers of this ecosystem on an annual time scale However annual values for these abiotic variables may not adequately capture important sub-annual events such as storms (DFO 2016) the timing of arrival and departure of highly migratory species and whether there may be important sub-annual thresholds or mismatches in timing as a result of the Project
o Biotic factors (eg nutrients) which are particularly important for biofilm and other lower trophic level taxa are not included in this model The model is therefore unable to assess the potential development of eutrophication and benthic organic enrichment events which may affect fish habitats in the study area
2 Are the parameter estimates used by the model valid and defensible for this system
o In general parameter estimates appear to be adequate for this system Field studies were done in two years to provide data in particular on distributions of selected functional groups for the Ecospace module Note the distribution studies focussed on taxa which were relatively immobile and therefore lsquofixedrsquo in space
o the selection of some model parameters would benefit from further explanation for example the choice of fixed diet matrices versus dynamic matrices which can vary with changes in abundances or predators and prey
o the selection of some model parameters would benefit from further explanation for example the link between the diets described in the text of Appendix 10B and the quantities presented in Appendix A of Appendix 10B It is understood that proportions were derived using the ldquofixed selectivityrdquo principle but in order to be fully transparent the derivation of each diet should be provided in an appendix
o discussion and explanation is needed of why ecotrophic efficiencies differ from expected values (eg the ecotrophic efficiency for Pacific herring is listed as 038) and
o the abiotic factor lsquosubstratersquo was limited to ldquohardrdquo or rdquosoftrdquo options which can be restrictive given that they serve as endpoints on a substrate composition continuum These limited options may not provide the sensitivity required to assess substrate preference nor the flexibility for taxa (eg motile organisms) that span hard mixed and soft substrate types In addition it is not clear if changes in the hardsoft categories were considered over time within identified depositional or erosional settings before and after construction
Pacific Region Science Response Technical Review Assessing
Ecosystem Productivity Model of Roberts Bank
20
3 Are the limitations and uncertainties of the model identified and appropriately considered when determining the modelrsquos representation of current and possible future conditions
o the EwE model was not designed to evaluate a range of future conditions It was designed to estimate changes in the productive potential at the ecosystem level with and without the Project Therefore the model was run without the Project and with the Project for a range of plausible abiotic conditions and the results were compared with respect to biomass and productivity by functional group
o the pedigree approach to assessing the uncertainties of model outcomes is unsatisfactory for the purpose here as it relates solely to a qualitative judgment of the value of data based on its source However when the model was rerun with much wider ranges of confidence intervals (uncertainties) the results in general (but not necessarily for each functional group) were similar to the results using the original pedigree approach This suggests that taken overall the model may be robust to wide ranges of uncertainty in these input variables and parameters
o there is inadequate validation of the model This is inadequate for three reasons
(i) the basic Ecopath model is not validated and the Ecospace balancing process (the spin-up period) resulted in some biomass estimates being increased or decreased beyond their confidence limits
(ii) the goodness of fit test used to evaluate how well the model predicted the spatial occurrence functional groups is not fit for purpose (Section 34) and
(iii) validation was provided for only a small number of functional groups (the habitat-forming functional groups) As a consequence the model is currently not validated
o Considering the proportion of open boundaries relative to closed boundaries in the model processes taking place outside the modelled ecosystem are likely to contribute to dynamics within the modelled ecosystem However these external processes may not be well-resolved by the EwE model as currently configured
4 Are the model results related to the potential effects of the Project on fish and fish habitat and migratory birds and their food resources valid and defensible
o this is a very complex ecosystem model constructed for a relatively small and open (in the sense of considerable exchange with adjacent non-modelled areas) system Many assumptions have been made based on poor or missing data Taking all these considerations into account the model does the best job possible of comparing the biomass and productivity of the Roberts Bank ecosystem with and without the Project
o the extent to which the model adequately represents the lsquorealrsquo ecosystem of Roberts Bank as opposed to comparisons of model results with and without the Project is unclear as a number of basic diagnostics are not presented (see point 3 above)
o the EwE model is not capable of and is not designed to represent nutritional and food quality variations in prey functional groups and how these may impact highly migratory predators such as birds with and without the Project
5 Is the EwE model framework a valid method to quantify large scale impacts to fish habitat fish productivity and migratory bird productivity
o the EwE model as implemented in this project and reviewed here is a useful first-order framework to organise information and derive initial estimates of how the system may respond to perturbations
Pacific Region Science Response Technical Review Assessing
Ecosystem Productivity Model of Roberts Bank
21
o the utility of a EWE model for impact purposes is highly dependent on the quality of input data
o each EwE model is highly dependent on local conditions Although appropriate as an overall methodology each application would need to be reviewed for how it may be applied to any new ecosystem and
o the EwE model would need to be substantially reformulated if it was to include considerations of changes in chemical composition or food quality of prey in particular for seasonal migratory species such as birds which may depend on very large biomasses of prey with specific chemical composition to fuel their migrations beyond the ecosystem model boundaries
Contributors Contributor Affiliation Ian Perry Author DFO Science Pacific Region Alida Bundy Author DFO Science Maritimes Region Terri Sutherland Author DFO Science Pacific Region Robert Elner Author ECCC Canadian Wildlife Service Andrew Robinson Author ECCC Canadian Wildlife Service Lesley MacDougall Editor DFO Science Pacific Region
Approved by Carmel Lowe
Regional Director Science Branch Pacific Region Fisheries and Oceans Canada
November 4 2016
Sources of Information Christensen V Coll M Steenbeek J Buszowski J Chagaris D walters CJ 2014
Representing variable habitat quality in a spatial food web model Ecosystems 17 1397-1412
Christensen V and Walters C 2000 Ecopath with Ecosim methods capabilities and limitations Ecological Modelling 172 109-139
Colleacuteter M Valls A Guitton J Gascuel D Pauly D and Christensen V 2015 Global overview of the applications of the Ecopath with Ecosim modeling approach using the EcoBase models repository Ecological Modelling 302 pp42-53
Compass Resource Management Ltd 2013 Roberts Bank Terminal 2 Technical Advisory Group (TAG) Process Report Productive Capacity ndash Final Report 119pp (Accessed November 1 2016)
DFO 2016 Technical Review of Roberts Bank Terminal 2 Environmental Assessment Section 95 ndash Coastal Geomorphology DFO Can Sci Advis Sec Sci Resp 2016045 (Accessed November 4 2016)
Pacific Region Science Response Technical Review Assessing
Ecosystem Productivity Model of Roberts Bank
22
ESSA Technologies 2014a Roberts Bank Terminal 2 Project Roberts Bank Delta BC Environmental Impact Statement Volume 3 Biophysical Effects Assessments Appendix 10-C Roberts Bank Ecosystem Model Development and Key Run Port Metro Vancouver (Accessed November 1 2016)
ESSA Technologies 2014b Roberts Bank Terminal 2 Project Roberts Bank Delta BC Environmental Impact Statement Volume 3 Biophysical Effects Assessments Appendix 10-D Roberts Bank Ecosystem Model Sensitivity Analyses Port Metro Vancouver (Accessed November 1 2016)
Franklin J 2009 Mapping Species Distributions Spatial Inference and Prediction Cambridge University Press Cambridge
Hemmera 2014 Roberts Bank Terminal 2 Project Roberts Bank Delta BC Environmental Impact Statement Volume 3 Biophysical Effects Assessments Appendix 10-B Roberts Bank Ecosystem Model Parameter Estimates Port Metro Vancouver File 302-03503 (Accessed November 1 2016)
Port Metro Vancouver 2015a Roberts Bank Terminal 2 Project Roberts Bank Delta BC Environmental Impact Statement Volume 3 Biophysical Effects Assessments Section 100 Biophysical Setting (Accessed November 1 2016)
Port Metro Vancouver 2015b Roberts Bank Terminal 2 Project Roberts Bank Delta BC Environmental Impact Statement Volume 3 Biophysical Effects Assessments Section 103 Overview of Assessing Ecosystem Productivity (Accessed November 1 2016)
Port Metro Vancouver 2015c Roberts Bank Terminal 2 Project Environmental Assessment Additional Information Requirements (July 31 2015) Responses Response to Information Request 6 IR-73115-06 Canadian Environmental Assessment Agency Reference Number 80054 dated 26 October 2015
Steenbeek J Coll M Gurney L Meacutelin F Hoepffner N Buszowski J and Christensen V 2013 Bridging the gap between ecosystem modeling tools and geographic information systems Driving a food web model with external spatialndashtemporal data Ecological Modelling 263 139ndash 151
Sutherland T Elner R and OrsquoNeill J 2013 Roberts Bank Ecological crucible of the Fraser River estuary Progress in Oceanography 115 171ndash180
Vancouver Fraser Port Authority 2016 From the Vancouver Fraser Port Authority to the Review Panel re Answers to preliminary technical questions submitted during the completeness phase from Fisheries and Oceans Canada Natural Resources Canada and Environment and Climate Change Canada concerning the ecosystem modelling to support the Roberts Bank Terminal 2 Project environmental review CEAR Document 547 (Accessed November 1 2016)
Pacific Region Science Response Technical Review Assessing
Ecosystem Productivity Model of Roberts Bank
23
This Report is Available from the Centre for Science Advice
Pacific Region Fisheries and Oceans Canada
3190 Hammond Bay Road Nanaimo BC V9T 6N7
Telephone (250) 756-7208 E-Mail csapdfo-mpogcca
Internet address wwwdfo-mpogccacsas-sccs
ISSN 1919-3769 copy Her Majesty the Queen in Right of Canada 2016
Correct Citation for this Publication
DFO 2016 Technical review of Roberts Bank Terminal 2 environmental assessment section 103 ndash assessing ecosystem productivity DFO Can Sci Advis Sec Sci Resp 2016050
Aussi disponible en franccedilais
MPO 2016 Examen technique de leacutevaluation environnementale du Terminal 2 agrave Roberts Bank section 103 ndash eacutevaluation de la productiviteacute de leacutecosystegraveme Secr can de consult sci du MPO Reacutep des Sci 2016050

Pacific Region Science Response Technical Review Assessing
Ecosystem Productivity Model of Roberts Bank
17
remain however The quote above indicates that the production among the different model runs was very different although with little difference in the biomass ratios with and without the Project Since biomass is not the same as production it would be informative for understanding model performance and potential impacts to show these production differences This also relates to the point made in Section 34 regarding how well the model represents the real ecosystem and not just within-model comparisons with and without the Project The second question is more technical and relates to how the randomization (Monte Carlo or MC) routine that was used to create multiple model runs used the uncertainty about the diet data Diets are not currently included in the MC routine available to regular users of the Ecosim model how they were handled in this RBT2 model appears not to be explained
Finally the sensitivity analyses indicate that the uncertainty in the input parameters does not lead to much difference between model parameters with or without the project However this conclusion does not describe how the uncertainty in the input parameters affects understanding of the ecosystem
40 Conclusions Overall the main conclusion of the Environmental Impact Statement from the Proponent is stated as ldquohellipafter the implementation of mitigation hellipthe Project is not expected to result in any significant adverse effects on any of the 16 valued componentsrdquo38 In addition ldquohellipapproximately 40 of the functional groups are forecast to change no more than 5 which hellip is judged to be within the uncertainty of the model runsrdquo39 although larger changes were forecast for orange sea pens freshwater biofilm green algae and raptors The conclusions from the modelling studies are that ldquohellipthe proposed project will have an impact on the study area that the effect varies between species and that the findings are robust to parameter uncertaintyrdquo40 Specific outcomes by valued component as derived from the EwE model are presented by functional groups in Table 1
38 PMV March 2015 Roberts Bank Environmental Impact Statement Executive Summary ndash Part 1 page 37 39 EIS Appendix 10-C p ii 40 EIS Appendix 10-D p iv
Pacific Region Science Response Technical Review Assessing
Ecosystem Productivity Model of Roberts Bank
18
Table 1 Changes in productive potential with the Project as derived from the EwE model
Changes in productive potential
Ecosystem category
Number of valued
components
Number with potential
biomass loss
Moderate decrease (31-60 decline)
Minor decrease (6-30 decline)
Negligible (0-5
change)
Minor increase (6-
30 increase)
Moderate increase (31-60 increase)
Source
Marine vegetation
7 7 - 3 2 2 - EIS Vol 3 Section 11 Table 11-17 page 11-65
Marine invertebrates
4 3 1 1 1 1 - EIS Vol 3 Section 12 Table 12-8 page 12-52
Marine fish 13 13 - 2 6 5 - EIS Vol 3 Section 13 Table 13-10 page 13-95
Coastal birds
11 8 - 3 4 3 1 EIS Vol 3 Section 15 Table 15-10 page 15-67
Pacific Region Science Response Technical Review Assessing
Ecosystem Productivity Model of Roberts Bank
19
Most functional groups showed some potential biomass loss with the Project with biomass loss defined as any model run with negative outcomes (ie in which biomass with the project was less than biomass without the Project) The summary of changes in productivity potential are mixed with most (33 out of 35) valued components showing minor decreases to minor increases (defined as 6 to 30 changes in productive potential with the Project compared to without the Project)
The main conclusions of this review in regards to the Terms of Reference are
1 Do the functional groups and abiotic variables used in the model adequately represent the ecosystem at Roberts Bank
o The 58 functional groups and abiotic variables used in the model adequately represent the main components of the Roberts Bank ecosystem however for longer lived species the life stages of the species are not well represented and some of the impacts of the Project may be expected to affect specific life stages
o The abiotic variables adequately represent the physical drivers of this ecosystem on an annual time scale However annual values for these abiotic variables may not adequately capture important sub-annual events such as storms (DFO 2016) the timing of arrival and departure of highly migratory species and whether there may be important sub-annual thresholds or mismatches in timing as a result of the Project
o Biotic factors (eg nutrients) which are particularly important for biofilm and other lower trophic level taxa are not included in this model The model is therefore unable to assess the potential development of eutrophication and benthic organic enrichment events which may affect fish habitats in the study area
2 Are the parameter estimates used by the model valid and defensible for this system
o In general parameter estimates appear to be adequate for this system Field studies were done in two years to provide data in particular on distributions of selected functional groups for the Ecospace module Note the distribution studies focussed on taxa which were relatively immobile and therefore lsquofixedrsquo in space
o the selection of some model parameters would benefit from further explanation for example the choice of fixed diet matrices versus dynamic matrices which can vary with changes in abundances or predators and prey
o the selection of some model parameters would benefit from further explanation for example the link between the diets described in the text of Appendix 10B and the quantities presented in Appendix A of Appendix 10B It is understood that proportions were derived using the ldquofixed selectivityrdquo principle but in order to be fully transparent the derivation of each diet should be provided in an appendix
o discussion and explanation is needed of why ecotrophic efficiencies differ from expected values (eg the ecotrophic efficiency for Pacific herring is listed as 038) and
o the abiotic factor lsquosubstratersquo was limited to ldquohardrdquo or rdquosoftrdquo options which can be restrictive given that they serve as endpoints on a substrate composition continuum These limited options may not provide the sensitivity required to assess substrate preference nor the flexibility for taxa (eg motile organisms) that span hard mixed and soft substrate types In addition it is not clear if changes in the hardsoft categories were considered over time within identified depositional or erosional settings before and after construction
Pacific Region Science Response Technical Review Assessing
Ecosystem Productivity Model of Roberts Bank
20
3 Are the limitations and uncertainties of the model identified and appropriately considered when determining the modelrsquos representation of current and possible future conditions
o the EwE model was not designed to evaluate a range of future conditions It was designed to estimate changes in the productive potential at the ecosystem level with and without the Project Therefore the model was run without the Project and with the Project for a range of plausible abiotic conditions and the results were compared with respect to biomass and productivity by functional group
o the pedigree approach to assessing the uncertainties of model outcomes is unsatisfactory for the purpose here as it relates solely to a qualitative judgment of the value of data based on its source However when the model was rerun with much wider ranges of confidence intervals (uncertainties) the results in general (but not necessarily for each functional group) were similar to the results using the original pedigree approach This suggests that taken overall the model may be robust to wide ranges of uncertainty in these input variables and parameters
o there is inadequate validation of the model This is inadequate for three reasons
(i) the basic Ecopath model is not validated and the Ecospace balancing process (the spin-up period) resulted in some biomass estimates being increased or decreased beyond their confidence limits
(ii) the goodness of fit test used to evaluate how well the model predicted the spatial occurrence functional groups is not fit for purpose (Section 34) and
(iii) validation was provided for only a small number of functional groups (the habitat-forming functional groups) As a consequence the model is currently not validated
o Considering the proportion of open boundaries relative to closed boundaries in the model processes taking place outside the modelled ecosystem are likely to contribute to dynamics within the modelled ecosystem However these external processes may not be well-resolved by the EwE model as currently configured
4 Are the model results related to the potential effects of the Project on fish and fish habitat and migratory birds and their food resources valid and defensible
o this is a very complex ecosystem model constructed for a relatively small and open (in the sense of considerable exchange with adjacent non-modelled areas) system Many assumptions have been made based on poor or missing data Taking all these considerations into account the model does the best job possible of comparing the biomass and productivity of the Roberts Bank ecosystem with and without the Project
o the extent to which the model adequately represents the lsquorealrsquo ecosystem of Roberts Bank as opposed to comparisons of model results with and without the Project is unclear as a number of basic diagnostics are not presented (see point 3 above)
o the EwE model is not capable of and is not designed to represent nutritional and food quality variations in prey functional groups and how these may impact highly migratory predators such as birds with and without the Project
5 Is the EwE model framework a valid method to quantify large scale impacts to fish habitat fish productivity and migratory bird productivity
o the EwE model as implemented in this project and reviewed here is a useful first-order framework to organise information and derive initial estimates of how the system may respond to perturbations
Pacific Region Science Response Technical Review Assessing
Ecosystem Productivity Model of Roberts Bank
21
o the utility of a EWE model for impact purposes is highly dependent on the quality of input data
o each EwE model is highly dependent on local conditions Although appropriate as an overall methodology each application would need to be reviewed for how it may be applied to any new ecosystem and
o the EwE model would need to be substantially reformulated if it was to include considerations of changes in chemical composition or food quality of prey in particular for seasonal migratory species such as birds which may depend on very large biomasses of prey with specific chemical composition to fuel their migrations beyond the ecosystem model boundaries
Contributors Contributor Affiliation Ian Perry Author DFO Science Pacific Region Alida Bundy Author DFO Science Maritimes Region Terri Sutherland Author DFO Science Pacific Region Robert Elner Author ECCC Canadian Wildlife Service Andrew Robinson Author ECCC Canadian Wildlife Service Lesley MacDougall Editor DFO Science Pacific Region
Approved by Carmel Lowe
Regional Director Science Branch Pacific Region Fisheries and Oceans Canada
November 4 2016
Sources of Information Christensen V Coll M Steenbeek J Buszowski J Chagaris D walters CJ 2014
Representing variable habitat quality in a spatial food web model Ecosystems 17 1397-1412
Christensen V and Walters C 2000 Ecopath with Ecosim methods capabilities and limitations Ecological Modelling 172 109-139
Colleacuteter M Valls A Guitton J Gascuel D Pauly D and Christensen V 2015 Global overview of the applications of the Ecopath with Ecosim modeling approach using the EcoBase models repository Ecological Modelling 302 pp42-53
Compass Resource Management Ltd 2013 Roberts Bank Terminal 2 Technical Advisory Group (TAG) Process Report Productive Capacity ndash Final Report 119pp (Accessed November 1 2016)
DFO 2016 Technical Review of Roberts Bank Terminal 2 Environmental Assessment Section 95 ndash Coastal Geomorphology DFO Can Sci Advis Sec Sci Resp 2016045 (Accessed November 4 2016)
Pacific Region Science Response Technical Review Assessing
Ecosystem Productivity Model of Roberts Bank
22
ESSA Technologies 2014a Roberts Bank Terminal 2 Project Roberts Bank Delta BC Environmental Impact Statement Volume 3 Biophysical Effects Assessments Appendix 10-C Roberts Bank Ecosystem Model Development and Key Run Port Metro Vancouver (Accessed November 1 2016)
ESSA Technologies 2014b Roberts Bank Terminal 2 Project Roberts Bank Delta BC Environmental Impact Statement Volume 3 Biophysical Effects Assessments Appendix 10-D Roberts Bank Ecosystem Model Sensitivity Analyses Port Metro Vancouver (Accessed November 1 2016)
Franklin J 2009 Mapping Species Distributions Spatial Inference and Prediction Cambridge University Press Cambridge
Hemmera 2014 Roberts Bank Terminal 2 Project Roberts Bank Delta BC Environmental Impact Statement Volume 3 Biophysical Effects Assessments Appendix 10-B Roberts Bank Ecosystem Model Parameter Estimates Port Metro Vancouver File 302-03503 (Accessed November 1 2016)
Port Metro Vancouver 2015a Roberts Bank Terminal 2 Project Roberts Bank Delta BC Environmental Impact Statement Volume 3 Biophysical Effects Assessments Section 100 Biophysical Setting (Accessed November 1 2016)
Port Metro Vancouver 2015b Roberts Bank Terminal 2 Project Roberts Bank Delta BC Environmental Impact Statement Volume 3 Biophysical Effects Assessments Section 103 Overview of Assessing Ecosystem Productivity (Accessed November 1 2016)
Port Metro Vancouver 2015c Roberts Bank Terminal 2 Project Environmental Assessment Additional Information Requirements (July 31 2015) Responses Response to Information Request 6 IR-73115-06 Canadian Environmental Assessment Agency Reference Number 80054 dated 26 October 2015
Steenbeek J Coll M Gurney L Meacutelin F Hoepffner N Buszowski J and Christensen V 2013 Bridging the gap between ecosystem modeling tools and geographic information systems Driving a food web model with external spatialndashtemporal data Ecological Modelling 263 139ndash 151
Sutherland T Elner R and OrsquoNeill J 2013 Roberts Bank Ecological crucible of the Fraser River estuary Progress in Oceanography 115 171ndash180
Vancouver Fraser Port Authority 2016 From the Vancouver Fraser Port Authority to the Review Panel re Answers to preliminary technical questions submitted during the completeness phase from Fisheries and Oceans Canada Natural Resources Canada and Environment and Climate Change Canada concerning the ecosystem modelling to support the Roberts Bank Terminal 2 Project environmental review CEAR Document 547 (Accessed November 1 2016)
Pacific Region Science Response Technical Review Assessing
Ecosystem Productivity Model of Roberts Bank
23
This Report is Available from the Centre for Science Advice
Pacific Region Fisheries and Oceans Canada
3190 Hammond Bay Road Nanaimo BC V9T 6N7
Telephone (250) 756-7208 E-Mail csapdfo-mpogcca
Internet address wwwdfo-mpogccacsas-sccs
ISSN 1919-3769 copy Her Majesty the Queen in Right of Canada 2016
Correct Citation for this Publication
DFO 2016 Technical review of Roberts Bank Terminal 2 environmental assessment section 103 ndash assessing ecosystem productivity DFO Can Sci Advis Sec Sci Resp 2016050
Aussi disponible en franccedilais
MPO 2016 Examen technique de leacutevaluation environnementale du Terminal 2 agrave Roberts Bank section 103 ndash eacutevaluation de la productiviteacute de leacutecosystegraveme Secr can de consult sci du MPO Reacutep des Sci 2016050
- TECHNICAL REVIEW OF ROBERTS BANK TERMINAL 2 ENVIRONMENTAL ASSESSMENT SECTION 103 ndash ASSESSING ECOSYSTEM PRODUCTIVITY
-
- 10 Context
- 20 Background
-
- 21 Background and Terms of Reference
- 22 Approach to assessing ecosystem productivity
-
- 30 Analysis and Response
-
- 31 The EwE Team
- 32 Overview of assessment results of hydrological and sediment modelling
- 33 Model implementation
-
- 331 The purpose of the EwE model
- 332 Applicability of the EwE model framework to the Roberts Bank region
- 333 Model documentation
- 334 Highly mobile functional groups
- 335 Seasonality (model time step)
- 336 Life history structure
- 337 Model balancing
-
- 34 Model validation
- 35 Model results
-
- 351 Presentation of model results
- 352 Sensitivity and vulnerability analyses
-
- 40 Conclusions
- Contributors
- Approved by
- Sources of Information
- This Report is Available from the
-
- CSAS 2016-50 - Assessing Ecosystem Productivitypdf
-
- TECHNICAL REVIEW OF ROBERTS BANK TERMINAL 2 ENVIRONMENTAL ASSESSMENT SECTION 103 ndash ASSESSING ECOSYSTEM PRODUCTIVITY
-
- 10 Context
- 20 Background
-
- 21 Background and Terms of Reference
- 22 Approach to assessing ecosystem productivity
-
- 30 Analysis and Response
-
- 31 The EwE Team
- 32 Overview of assessment results of hydrological and sediment modelling
- 33 Model implementation
-
- 331 The purpose of the EwE model
- 332 Applicability of the EwE model framework to the Roberts Bank region
- 333 Model documentation
- 334 Highly mobile functional groups
- 335 Seasonality (model time step)
- 336 Life history structure
- 337 Model balancing
-
- 34 Model validation
- 35 Model results
-
- 351 Presentation of model results
- 352 Sensitivity and vulnerability analyses
-
- 40 Conclusions
- Contributors
- Approved by
- Sources of Information
- This Report is Available from the
-
Canadian Science Advisory Secretariat Pacific Region Science Response 2016050
December 2016
TECHNICAL REVIEW OF ROBERTS BANK TERMINAL 2 ENVIRONMENTAL ASSESSMENT SECTION 103 ndash
ASSESSING ECOSYSTEM PRODUCTIVITY
10 Context Vancouver Fraser Port Authority (VFPA) formerly Port Metro Vancouver (the Proponent) is proposing to construct and operate the Roberts Bank Terminal 2 Project (the Project) a new three-berth marine container terminal at Roberts Bank in Delta British Columbia The proposed terminal is located next to the existing Deltaport and Westshore Terminals In addition to the construction of the new terminal the Proponent has proposed to widen the north side of the existing Roberts Bank causeway from its east-end connection with the mainland to the entrance to the new terminal The existing tug basin connected to the northeast side of Deltaport Terminal is also proposed to be expanded The new marine terminal is predicted by the Proponent to process up to 260 container ship calls per year at full capacity with the assistance of two or three large berthing or escort tugs to manoeuver ships into or away from assigned berths The terminal is designed to operate 24 hours per day year-round
The Roberts Bank Terminal 2 Project is subject to an environmental assessment by a Review Panel pursuant to the Canadian Environmental Assessment Act 2012 As a federal authority in the environmental assessment for the Project Fisheries and Oceans Canada (DFO) will be asked to present information to the review panel and at public hearings in relation to its expertise on the effects of the Project on fish and fish habitat including aquatic species at risk and the adequacy of mitigation and offsetting measures and monitoring and follow-up programs proposed by the Proponent DFOrsquos Pacific Region Fisheries Protection Program (FPP) will coordinate DFOrsquos participation in the environmental assessment
The Proponent assessed future ecosystem productivity at Roberts Bank using the Ecopath with Ecosim and Ecospace (EwE) model framework The potential impacts of the Project to hydrodynamic conditions and sediment transport in the area as a result of changes in wind wave and current patterns and intensities are projected using different model frameworks A companion Science Response (DFO 2016) has been developed by DFO and Natural Resource Canada (NRCan) to review Section 95 ldquoCoastal Geomorphologyrdquo of the Environmental Impact Statement (EIS) which describes the hydrodynamic and sedimentology models that were used to evaluate the effect of the Project on water and sediment movements
Outcomes of the EwE models are incorporated into the analysis of the potential project-related effects on the ongoing productivity of commercial recreational and Aboriginal fisheries Consequently DFO FPP has requested that DFO Science Branch provide an evaluation of the Proponentrsquos characterization of project-related effects as conducted using the Ecopath with Ecosim and Ecospace (EwE) ecosystem model
Pacific Region Science Response Technical Review Assessing
Ecosystem Productivity Model of Roberts Bank
2
The objectives for this Science Response are to
1 Determine if the functional groups and abiotic factors used in the model adequately represent the ecosystem at Roberts Bank
2 Assess whether the parameter estimates used by the model are valid and defensible for this system
3 Assess whether the limitations and uncertainties of the model are identified and appropriately considered when determining the modelrsquos representation of current and possible future conditions
4 Provide advice regarding whether the model results related to the potential effects of the Project on fish and fish habitat and migratory birds and their food resources are valid and defensible
5 If possible provide advice regarding the validity of using the EwE model framework to quantify large scale impacts to fish habitat and fisheries productivity and the productivity of migratory birds
This Science Response evaluates Section 100 ldquoBiophysical Settingrdquo with a focus on Section 103 ldquoOverview of Assessing Ecosystem Productivityrdquo in the EIS as submitted by the Proponent (Port Metro Vancouver 2015) This Section and consequently this Response describes the ecosystem modelling approach that was taken to evaluate the direct and indirect effects of the footprint of the proposed terminal and widened causeway herein referred to as lsquothe Projectrsquo This ecosystem model provides outputs related to potential effects of the project on the study area at an ecosystem level including aquatic species and bird species in the Project area Evaluation of the model and its outputs therefore required expertise in both fishery aquatic species and migratory bird species Consequently this Science Response is the product of a joint review between DFO and Environment and Climate Change Canada (ECCC) Canadian Wildlife Service and Wildlife and Landscape Science to provide a complete evaluation
This Science Response Report results from the Science Response Process of July 2016 on the Technical Review of Ecopath with Ecosim and Ecospace (EwE) Ecosystem Productivity Model application to the Roberts Bank Terminal 2 Environmental Assessment
20 Background
21 Background and Terms of Reference The Projectrsquos main components have a proposed combined marine footprint area of approximately 179 km2 listed below by specific component
bull Marine Terminal 1335 km 2 including terminal (116 km 2) and dredged berth pocket and marine approach areas (0174 km 2)
bull Widened Causeway 0424 km 2
bull Expanded Tug basin 0031 km 2
Roberts Bank in the Fraser River estuary consists of complex intertidal and subtidal habitats including intertidal eelgrass beds and is an important stopover area for migrating shorebirds and productive feeding and rearing habitats for many fish and invertebrate species It also provides habitat for endangered Southern Resident Killer Whales and other marine mammals
Pacific Region Science Response Technical Review Assessing
Ecosystem Productivity Model of Roberts Bank
3
The environmental conditions at Roberts Bank are dynamic and are influenced by a variety of oceanographic and atmospheric factors including the Fraser River freshwater and sediment plume discharge diurnal tidal currents and prevailing and storm-generated wind and wave activity In addition the intercauseway region provides significant drainage from marsh and agricultural areas which have different characteristics from marine waters and which run along the ferry causeway
To provide the required science advice this Science Response focusses on Section 10 ldquoBiophysical Settingrdquo of the Environmental Impact Statement (EIS) (Port Metro Vancouver 2015a) specifically Section 103 ldquoOverview of Assessing Ecosystem Productivityrdquo (Port Metro Vancouver 2015b) and its related Appendices 10-B ldquoRoberts Bank Ecopath with Ecosim and Ecospace model parameter estimatesrdquo (Hemmera 2014) Appendix 10-C ldquoRoberts Bank Ecosystem model development and key runsrdquo(ESSA Technologies 2014a) and Appendix 10-D ldquoRoberts Bank Ecosystem model sensitivity analysesrdquo (ESSA Technologies 2014b) Additional important information was obtained from the Response to Information Request 6 (IR-73115-06 Canadian Environmental Assessment Agency Reference Number 80054 dated 26 October 2015) (Port Metro Vancouver 2015c) and the Written Responses to Coastal Geomorphology and Ecosystem Modelling Questions provided by the Proponent to DFO ECCC and NRCan on 2 March 2016 (Port Metro Vancouver (PMV) Transmittal TRE-01-RBT2-0004A subsequently referred in this Science Response as ldquoPMV Response 2016-03-02rdquo) (Vancouver Fraser Port Authority 2016)
The process followed in preparing this Science Response involved an initial review of the submitted EIS followed by an in-person meeting of the Proponent its contractors and representatives of DFO ECCC and NRCan to discuss and clarify questions arising from the initial review (Vancouver 23 November 2015) DFO and NRCan provided written questions to the Proponent based on preliminary review of the EIS on November 19 2015 ECCC also provided written questions based on its preliminary review of the EIS to the Proponent on December 1 2015 and January 20 2016 This large initial meeting was followed by smaller focussed meetings between the Proponent its contractors and DFO and NRCan on 11 December 2015 to clarify hydrology and sediment modelling questions with DFO on 8 January 2016 to clarify ecosystem modelling questions and with ECCC on 18 February 2016 to clarify questions relating to birds Written responses to all of these meetings and questions were provided by the Proponent to DFO ECCC and NRCan as the ldquoPMV Response 2016-03-02rdquo and ldquoPMV Response 2016-05-30rdquo (Vancouver Fraser Port Authority 2016) VFPArsquos answers to questions posed by DFO and NRCan regarding coastal geomorphology modelling have been posted to the Canadian Environmental Assessment Registry (CEAR)
22 Approach to assessing ecosystem productivity The Proponent adopted an ecosystem approach to evaluate the direct and indirect effects of the Project on the productivity of the Roberts Bank ecosystem A weight of evidence approach was used to assess the potential effects of the project on the productivity of the ecosystem and selected key components in the study area this approach included a spatial ecosystem simulation model (which included a habitat capacity model) a shorebird opportunity model and empirical data An important point is that any effects on the system during the construction phase or from expansion of the tug basin were excluded from this modelling process the focus instead being a comparison of modelled system productivity before and after the proposed terminal and expanded causeway is in place The chosen ecosystem simulation model was
Pacific Region Science Response Technical Review Assessing
Ecosystem Productivity Model of Roberts Bank
4
Ecopath with Ecosim and its spatial version Ecospace (collectively referred to here as the EwE framework or EwE model) This modelling approach was recommended by a prior Productive Capacity Technical Advisory Group comprised of representatives of technical experts from government agencies academia non-governmental organizations Vancouver Fraser Port Authority and its consultants (Compass 2013) convened by the Proponent and which also recommended a selection of focal species for the model The final selection of functional groups and the resulting food web that form the core of this ecosystem model are shown in Figure 1
Pacific Region Science Response Technical Review Assessing
Ecosystem Productivity Model of Roberts Bank
5
Figure 1 Ecopath with Ecosim model food web for Roberts Bank (Adapted from EIS Volume 3 Section 10 Fig 1033 on page 10-16) The groups coloured in orange represent focal groups size of symbols represents relative annual amount of biomass in the Roberts Bank study area
Pacific Region Science Response Technical Review Assessing
Ecosystem Productivity Model of Roberts Bank
6
The EwE framework is a common approach to ecosystem modelling which has been developed and expanded over the past two to three decades It currently has three main components
1 Ecopath ndash the core model which provides a mass-balance snapshot of the system
2 Ecosim ndash a module that enables simulation modelling over time
3 Ecospace ndash a module that enables simulation modelling over space
In order to make an EwE model tractable species are aggregated into functional groups based on their similar ecological characteristics (habitat and prey preferences etc) the Roberts Bank models had 58 functional groups The first step (Ecopath) was to obtain input parameters representing biomass production consumption emigration and diet for each functional group These parameters were then tuned in an iterative process until the overall production and consumption was balanced (a mass-balance approach) resulting in a model food web with estimates of energy flow between functional groups (Fig 1)
In the second step Ecosim was combined with the spatial model Ecospace The abiotic variables selected in this EIS (depth salinity bottom current wave height sediment type) were used as external forcings to the Ecospace module These abiotic variables provided the physical forcings for the simulations without and with the Project Since time series data on the functional groups of the model were not available Ecospace was run until the model reached equilibrium using various assumptions of the value of the vulnerability parameter (see Section 352) In this EIS the selected time step was annual with all variables abiotic and biotic expressed as yearly averages As used in this EIS the Ecospace module included a habitat capacity model which estimated the distribution of functional groups based on their environmental preferences for each abiotic variable (depth salinity bottom current wave height) and for substrate type (sand mud etc) The model thus allocated the spatial distribution of functional groups over the model domain based on their environmental preferences and the distributions of these abiotic variables with and without the Project The selected spatial unit size (ldquopixelrdquo) for the Ecospace model was 100 m2 In essence an Ecopath model was constructed for each pixel with particular rules governing how the functional groups interacted and moved among these spatial units The Ecospace module was run until it approached equilibrium (20 model years) to establish the spatial patterns without the Project For the lsquowith the Projectrsquo simulations the model was run for an initial 10 years and then the spatial patterns of the abiotic variables with the project were added and the model run for an additional 10 years1 The model outputs predicted changes in the productive potential of the Roberts Bank ecosystem as a comparison (ratio) with and without the Project rather than an absolute biomass that would be lost or gained as a result of the Project
1 EIS Appendix 10-C p 26
Pacific Region Science Response Technical Review Assessing
Ecosystem Productivity Model of Roberts Bank
7
30 Analysis and Response To prepare this response the following sections of the EIS additional documents were reviewed
DocumentSection Title
EIS Section 10
Including appendices 10B 10C and 10D
(Port Metro Vancouver 2015a Hemmera 2014 ESSA Technologies 2014a ESSA Technologies 2014b)
Biophysical Setting
Appendix 10-B Roberts Bank Ecosystem Model Parameter Estimates Port Metro Vancouver File 302-03503
Appendix 10-C Roberts Bank Ecosystem Model Development and Key Run Port Metro Vancouver
Appendix 10-D Roberts Bank Ecosystem Model Sensitivity Analyses Port Metro Vancouver
CEAR document 547 (Including Appendices) ldquoPMV Response 2016-03-02rdquo and ldquoPMV Response 2016-05-30rdquo
(Vancouver Fraser Port Authority 2016)
Vancouver Fraser Port Authority to the Review Panel re Answers to preliminary technical questions submitted during the completeness phase from Fisheries and Oceans Canada Natural Resources Canada and Environment and Climate Change Canada concerning the ecosystem modelling to support the Roberts Bank Terminal 2 Project environmental review
31 The EwE Team Building this ecosystem model was a complex undertaking which required knowledge of the ecosystem to be modelled how to set initial parameter values determination of reasonable ranges of these parameters how to balance the model and how to recognize when the model outputs were unrealistic These tasks became even more complex when spatial model dynamics were involved such as with Ecospace The team engaged by the Proponent to conduct this ecosystem modelling for the Roberts Bank Terminal 2 (RBT2) EIS was led by scientists at the Institute for Oceans and Fisheries located at the University of British Columbia in Vancouver These scientists are global leaders of the EwE model framework having developed much of its current implementation and who continue to lead its elaborations and extensions Construction and running of the model for this specific ecosystem was done in collaboration with ESSA Technologies of Vancouver Parameter values for the ecosystem model were obtained in part from observational studies conducted in the area by Hemmera of Burnaby BC
32 Overview of assessment results of hydrological and sediment modelling Implementation of the ldquowith the Projectrdquo simulations of the ecosystem model was done by driving the model with the abiotic variables as they were projected to be distributed with the Project footprint In the context of this EIS specifying depth salinity bottom currents wave height and sediment type conditions without the Project and changes with the Project were achieved by construction of hydrodynamical and sediment transport models The outputs from these models in combination with the identified environment preferences for the various biological groups were then used as inputs to the Ecospace model to define the spatial
Pacific Region Science Response Technical Review Assessing
Ecosystem Productivity Model of Roberts Bank
8
distributions of these functional groups The implementation of these hydrological and sediment transport models in this EIS was reviewed by DFO and NRCan (DFO 2016) This review concluded that the implementation of these models for this EIS was adequate for average winter conditions but lacking in validation for summer conditions in particular with strong freshwater flows from the Fraser River Simulations of strong storm events and their impacts on wave conditions and sediment transport were also lacking The effect of wave action and current speeds on sediment transport is non-linear such that increasing winds over short periods of time can impact sediment transport processes bottom topography and water depths beyond that determined under average model conditions Overall the review concluded that a greater range of sensitivity analyses is required to have confidence in the model outputs under lsquonon-averagersquo conditions The implication of this conclusion for the present review of the EwE model is that the full range of variability of abiotic characteristics such as bottom topography bottom current and wave heights and how they may affect relevant functional groups in the model with the Project may not be adequately represented Sensitivity analyses were provided by varying the intensity of abiotic variables and by removing abiotic variables to assess their interactive effects In general the ecosystem model outputs were robust to these sensitivity analyses with most groups varying by less than 5 Larger changes however were observed for primary producer and bird groupings and for some fish groups when various abiotic variables were omitted2
33 Model implementation 331 The purpose of the EwE model
The EwE model was intended to provide one line of evidence to assess the potential impacts of the Project on the Roberts Bank ecosystem which would then be used with other lines of evidence to make the final assessment Specifically ldquohellip the objective of the RB [Roberts Bank] model was not to provide an assessment of Project impacts for each functional group at a fine temporal scale but to estimate changes in productive potential with and without the Project at the ecosystem levelrdquo3 In addition ldquohellipthe primary objective of the RB ecosystem model is to evaluate potential changes in productivity from such abiotic factors with and without the terminal and causewayrdquo4 Results are presented for the selected functional groups no results were presented on potential changes in ecosystem structure or function
332 Applicability of the EwE model framework to the Roberts Bank region EwE models work best when the exchanges within the system being modelled are greater than the exchanges between the modelled system and the lsquooutsidersquo world In practice this means that EwE models work best for larger systems with few external exchanges In a meta-analysis of 433 Ecopath models Colleacuteter et al (2015) concluded that ldquohellipin the last two decades the range of the models area has expanded toward very large areas and the median has shifted accordingly from about 1000 km2 in 1984ndash1993 to about 100000 km2 in 1994ndash2014rdquo The section of the Roberts Bank ecosystem that is included in the EwE model was comparatively small (5468 km2) and complex It is an intertidally-dominated environment that is subject to strong seasonal influences of both freshwater and marine exchanges across relatively large seaward and shoreward boundaries
2 EIS Appendix 10-D p ii - iii 3 PMV Response 2016-03-02 p 99 lines 1914-1917 4 PMV Response 2016-03-02 p 38 lines 689-691
Pacific Region Science Response Technical Review Assessing
Ecosystem Productivity Model of Roberts Bank
9
Processes taking place outside the modelled ecosystem will contribute to dynamics within the modelled ecosystem (eg lsquooutsidersquo food supporting predators which occur in the Roberts Bank ecosystem for only part of the year predators which may feed in the Roberts Bank ecosystem but export this energy when they migrate out of the region) but which may not be well-resolved by the EwE model The Proponent justifies the spatial scale because it was specifically chosen for the questions being asked in regard to assessing productivity changes and because the relative influences of external exchanges are assumed to be identical with and without the project In addition highly mobile species with broad prey bases were assumed in the model to be partially sustained by external energy from outside the model system5 The distributions of organisms may differ however with and without the project which may affect their interactions with areas outside of the modelled system and the use of diets from outside the modelled system may not reflect the impacts of the project Further clarification of how the EwE model captures the exchanges and interactions with adjacent ecosystems are needed For example it could be argued that an ecosystem which is open to frequent exchanges of water and organic matter from beyond its boundaries might be more robust to local disturbances such as the Project
There are some inconsistencies in the information and assumptions used for some of the taxa in this ecosystem model For Dungeness Crab the justification for estimating total adult biomass (including females) from the biomass of fished males is unclear In addition it is unclear if the slower growth of female crabs once they have reached sexual maturity in comparison with male crabs has been considered The diet matrix for spiny dogfish does not represent the actual diet well in particular of euphausiids herring and shrimp and there are more recent references for biomass estimates of spiny dogfish in the study area than what was used in the EIS
Fishing mortality was not included in the model under the assumption that this would not change with or without the project While this assumption may be true the model has been parameterized by ignoring a source of mortality that will influence total production In essence fishing removes biomass from the ecosystem with the result that less biomass will be available for higher trophic levels How this may impact the ecosystem with and without the Project is unclear but it could make noticeable differences if for example there were thresholds in the feeding responses by these higher trophic level species The Ecopath model that was used is relatively unconstrained since many ecological efficiencies are low even for forage species which would be expected to be higher It is not clear how many species are exploited or the levels of exploitation but even if this does not change with the Project these mortality rates should be included in the model in order to add realistic constraints to the exploited functional groups
333 Model documentation Based on questions from DFO ECCC and NRCan following their initial review of the EIS the Proponent provided written responses dated 2 March 2016 to clarify several of the steps in the model development and implementation However several questions remain including questions about the Ecospace module Ecospace has undergone several recent developments such as the inclusion of the spatial-temporal data layer framework (Steenbeek et al 2013) the habitat capacity model (Christensen et al 2014) and the Monte Carlo analysis including the diet matrix As yet there are few published studies using these latest Ecospace developments and their documentation and justification need to be improved in the EIS
5 PMV Response 2016-03-02 p 29 lines 446 - 464
Pacific Region Science Response Technical Review Assessing
Ecosystem Productivity Model of Roberts Bank
10
Questions also remain regarding how the Monte Carlo randomization routine treated diet data The report indicates that the Monte Carlo routine randomly selected input parameters from the input ranges and that only models that were balanced were used This suggests that a high proportion of models were not balanced and therefore were not used (for example the EIS indicates that about one out of 1000 sampled input parameters was balanced6) A table showing the minimum maximum mode average and median values from the Monte Carlo runs for all the parameters would enable an evaluation of how much variation was actually sampled by the balanced model runs This is recommended in the EwE user information ie ldquoUsers should check the range of the input parameters that were actually used in the trials in the output csv file (see below)rdquo7
In addition there are several issues with the documentation of the derivation of the parameters for the functional groups Such documentation should clearly outline how the input parameter was estimated and the range of uncertainty for that parameter For example the input biomass of pinnipeds was defined as 04 t km 2 derived from estimates of 034 for Harbour seals and two estimates for Steller sea lions (012 and 014 t km 2) No explanation was provided for how the overall estimated pinniped biomass of 04 t km 2 was determined The diet of Sand Lance was described in the EIS as consisting mostly of zooplankton8 whereas the diet table for the model runs9 included 20 macrofauna 10 green algae and 10 detritus It is unclear why these additional prey were included in the diet used for the model runs
334 Highly mobile functional groups This implementation of the EwE framework included transient and migratory functional groups This is entirely appropriate and these groups cannot be excluded The approach taken in the Ecospace module was to impose a low (and conservative) dispersal rate among model spatial units (lsquopixelsrsquo) of 1 km yr-1 This may be appropriate for low mobility benthic organisms but it likely underestimates the movements of many other functional groups The effects of using higher and perhaps functional-group-specific dispersal rates was not considered The Proponents argued that higher dispersal rates would reduce impacts since species can move away from less desirable areas more quickly for completeness these runs should be done and evaluated Mobile species will also bring energy (food) captured outside the system into the modelled ecosystem This process was included in the model with the use of a diet import factor reflecting the consumption of prey outside the modelled region with the assumption that groups with high import rates were unlikely to respond to local changes on Roberts Bank10 This assumption needs justification perhaps at the functional group level for example many species of highly migratory birds and Pacific salmon use the Roberts Bank ecosystem to obtain food to continue their migrations Although this food does not compose a large fraction of their annual consumption it can be critical to enable them to continue their migrations
The EwE model is not designed to capture differences in prey quality ie differences in essential fatty acid or nutrient ratios The same species of prey may have greater or lesser nutritional value to predators depending on the conditions under which they are growing and their seasonal variations This is a particular concern with the nutritional quality of the diatom-dominated biofilm Diatomaceous biofilm is important to the highly migratory Western Sandpiper (Calidris mauri) Despite its predictive merits in relation to other ecosystem
6 EIS Appendix 10D Section 24 p5 7 EwE Help file p 151 8 EIS Appendix 10B Section 4133 p 76 9 EIS Appendix A of Appendix 10B 10 PMV Response 2016-03-02 p 28 lines 429 - 436
Pacific Region Science Response Technical Review Assessing
Ecosystem Productivity Model of Roberts Bank
11
components the EwE model is not informative with respect to understanding the potential impacts of the Project on biofilm and the Western Sandpiper While this example is specific to seabirds the potential exists for differences in the quality of biofilm to also be an issue for copepods which feed on biofilm and consequently to juvenile salmon which feed on these copepods (eg Sutherland et al 2013)
The EwE model is also not designed to predict effects of the Project on water quality although the Proponent noted that ldquoOther abiotic factors not included were deemed to be representative of variables that were already included in the modelhelliprdquo11 The Project may cause changes in physical and water quality conditions whether in isolation or in combination which may impact the productivity or nutritional quality of key prey organisms for local and migratory species which will not be captured by the model The EwE model does not assess the production of key nutrients or the implications of changes in important physical and water quality parameters to biofilm community structure and hence to important migratory birds
The model does not include biotic factors for both pelagic and benthic environments to assess the potential development of eutrophication and benthic organic enrichment events respectively Organic and redox indicators traditional measures of environmental assessments that are used to determine changes in functional group responses were included in the recent Deltaport Third environmental assessment (ie Pelagic chlorophyll dissolved nutrients Benthic sediment carbonnitrogen content redox state [sulfide concentration]) Benthic anoxic events based on organic enrichment are known to be strong drivers of community composition and exclusion regardless of substrate type In the absence of biotic factors (eg organic particulates) the model has not considered the potential for benthic organic enrichment which coincides with siltation processes within the upper tidal flats The tidal flat corner bordered by the Delta-dyke and Deltaport causeway has served as a catchment area for Fraser River silt since the development of the original Deltaport causeway (Sutherland et al 2013) The proposed position of the new terminal placed at the seaward termination of the Deltaport causeway may produce a crescent-shaped feature in the wake of the Fraser River Plume This feature may provide a more efficient silt trap that will promote benthic organic enrichment This piece of the environmental assessment seems to be missing and is important for assessing fish habitat in this area
335 Seasonality (model time step) Input data to parameterize the model were available on a range of time scales from hourly (eg physical data on salinity and water flow) to annual (eg species biomass) The Proponents indicated12 that this is a strength of the EwE model although ultimately the model was run with an annual time step with all sub-annual values being averaged to annual values This method therefore did not incorporate important seasonal processes such as winter-summer differences in salinity and storm properties and the seasonal appearances of abundances of predators and prey such as migratory salmon and birds that are much larger than the annual average For example juvenile salmon migrate from the Fraser River and onto Roberts Bank in the spring before moving into deeper waters If these spring abundances are averaged over the entire year these average abundances would be 5-10 times lower than the actual abundances during the spring (ie averaging the biomass that occurs in two months over a 12 month period) Additionally this method did not capture the intensity of processes such as growth and predation which can be focused over periods of a few weeks to a few months There may be important threshold effects at particular times and places which may be missed when using an 11 EIS Section 10 p 10-11 12 PMV Response 2016-03-02 p 86 line 1655
Pacific Region Science Response Technical Review Assessing
Ecosystem Productivity Model of Roberts Bank
12
annual time step for the model The Ecospace module has a monthly time step13 and therefore it is feasible to run this module with a sub-annual time step For example the Proponents submit14 that there are inadequate data to model the potential effects of the Project on the timing of biofilm production which could have implications for the migratory dunlin and Western Sandpiper However this could be modelled in an exploratory way to determine hypotheses about which factors could affect the timing of production of biofilm and the potential impacts on these birds These issues are of major concern to ECCC
336 Life history structure The EwE model did not separate functional groups into life history stages (stanzas) yet for many functional groups the juvenile stages can have very different life history characteristics and habitats than the adults It is unclear in the description of the model how different life history structures were considered and whether for example there were enough juveniles to produce the adults The implications of not including early life stages should be explored at least qualitatively to identify which species might have life stages that may be more vulnerable to project effects
337 Model balancing Balancing an EwE model is the process by which parameters are adjusted so that there is sufficient production for consumption requirements ie there are sufficient prey for all predators Expert opinion was used to examine parameter values and to adjust for errors or inconsistencies in logic ldquoPMV is confident that since the approach taken to balance the model was based on best practices the steps are appropriaterdquo15 Adjustments to initial parameters to ensure an ecologically-feasible model are necessary and to be expected For a few functional groups however very large changes to initial parameter estimates (which were often not based on Roberts Bank specific data) were necessary for example to transient killer whales When such initial parameters were adjusted (often by substantial amounts) by expert opinion to balance the model the confidence intervals around these adjusted parameter values were not increased to reflect this added uncertainty (see for example PMV Response 2016-03-02 p 51 lines 955-956) When expert opinion was used to make very large changes to initial parameter values broader confidence intervals about these parameters should have been applied This does not appear to have been the case and as a consequence may cause the actual uncertainty of the model outputs to be underestimated
Another example is for the pinniped group in which 50 of the diet was assumed to come from outside the model area in order to balance the model The rationale provided was ldquoThe pinnipeds caused excessive predation mortalities on numerous fish functional groups The biomass of pinnipeds was an average for the Strait of Georgia which was likely too high for Roberts Bank Therefore it was assumed that pinnipeds extracted only half of their diet from the study areardquo16 It is unclear whether the sensitivity of the model to different percentages of diet allocation was explored
As noted above (332) the Ecopath model was relatively unconstrained and few adjustments to input parameters were required to balance the model This is unusual and the low ecotrophic efficiencies of several functional groups suggest that full accounting of energy flows may not have been achieved (an ecotrophic efficiency of 1 indicates that 100 of the production of that
13 EIS Appendix 10C Section 29 p24 14 EIS Appendix 10D Appendix C p72 15 PMV Response 2016-03-02 p 49 lines 910-912 16 EIS Appendix 10C Section 261 p 20
Pacific Region Science Response Technical Review Assessing
Ecosystem Productivity Model of Roberts Bank
13
particular group is being preyed upon or removed by fishing leaving no individuals to die of old age17) An ldquoexcessrdquo of individuals dying of old age ie ecotrophic efficiencies much less than 1 suggests a potentially large biomass that is not used by the ecosystem and instead is converted to detritus
34 Model validation Model validation is the process by which the model parameters variables and outputs are compared with those from the real ecosystem to ascertain how well the model represents the ecosystem It is an essential step in providing confidence that the projections from the model in this case with and without the Project have relevance to how the real ecosystem may be expected to function with and without the Project In practice validating complex ecosystem models is difficult considering the range of assumptions that must be made when building the model the limited available data and natural variability of the ecosystem at a variety of time and space scales
Many of the standard diagnostics for the Ecopath model have not been evaluated in the EIS The Proponent appears to have assumed that once the Ecopath model was balanced then it was valid and fit for purpose The Proponent should provide all the Ecopath estimates of vital rates including mortality rates As presented questions remain For example many Ecotrophic Efficiencies (which control the transfer of biomass from prey to predators) are less than 1 even for taxa which would be expected to be close to 1 such as carnivorous zooplankton The reason for Ecotrophic Efficiencies less than 1 were not discussed or explained in the EIS
Detailed diagnostics for the Ecospace model should also be presented in order to evaluate model performance In response to criticisms by DFO ECCC and NRCan in discussions with the Proponent the latter provided the biomass of the functional groups from the Ecopath model (before Ecospace) and the Ecospace model after the spin-up period (which involved adjusting the parameters from the Ecopath model to balance the 5468 separate cells of the Ecospace model)18 The Proponents argue that ldquoIt is important to note that changes in biomass values generated during the spin-up period are identical for both with and without Project scenarios and thus do not provide information on the potential Project-related effects on productivity19 However several changes to biomass result from the Ecospace balancing process (spin-up period) This is only given brief attention by the Proponent in its response to the DFO ECCC and NRCan questions An analysis of Table 620 revealed that the biomass of 9 functional groups was larger or smaller than the widest confidence limits allowed for each group21 This requires further discussion and justification
The Proponent used a goodness of fit measure to compare spatial distributions of model outputs with field observations They indicated that ldquono other EwE models were identified which use a goodness-of-fit measure Hence the RB model is potentially the first such EwE model where a goodness of fit measure has been appliedrdquo22 The chosen goodness of fit measure is the percent correct classification (PCC) method23 This method derives a test statistic based on the proportion of locations at which predicted occurrences from the model match observed
17 EIS Appendix 10-B p 11 18 PMV Response 2016-03-02 p 65-66 Table 6 19 PMV Response 2016-03-02 p 64 lines 1205-1207 20 PMV Response 2016-03-02 p 65-66 Table 6 21 PMV Response 2016-03-02 p 45 Table 3 22 PMV Response 2016-03-02 p 78 lines 1481-1483 23 PMV Response 2016-03-02 p 78 lines 1483-1484
Pacific Region Science Response Technical Review Assessing
Ecosystem Productivity Model of Roberts Bank
14
occurrences from data and similarly with predicted and observed absences The Proponent then calculated two additional accuracy of fit measures sensitivity (the model predicts a species to occur in an area where it is known to occur in reality) and specificity (the model predicts a species does not occur in an area it is known not to occur in reality)24 This analysis concluded that the model has high predictability for functional groups such as eelgrass and sea pens with relatively static distributions but lower predictability for functional groups which are more temporally and spatially dynamic such as biofilm and green algae25
There are two problems with this approach The first is that this goodness of fit comparison was done only for habitat-forming functional groups no discussion of how well this analysis applies to mobile functional groups was provided The second problem is that this method does not take into account situations (such as occurs in this study with several groups) in which species occur at only a few locations For example ldquohellipif the test data consist of 95 absences and 5 presences and this reflects the true prevalence of the species on the landscape (a realistic scenario for a rare species) a lsquonullrsquo model that predicted absence in all cases (eg no model at all) would be correct 95 of the timehellipldquo (Franklin 2009 p 151) This latter point is important here as these habitat functional groups (biofilm brown algae native eelgrass green algae Japanese eelgrass tidal marsh biomat and orange sea pens26) appear not to occur over most of the Project area (as portrayed by the model outputs presented in the distribution figures of PMV Response 2016-03-02 Appendix 218) It is therefore important that a robust evaluation of the performance of the Ecospace module is used with preferably more than one measure
In summary the starting point for this modelling analysis matters It is not just about a comparison between results with and without the Project The model has to be considered a sufficient representation of the ecosystem The Proponent has not yet sufficiently validated the model
35 Model results 351 Presentation of model results
As noted above (Section 331) the stated objective of the Roberts Bank ecosystem model was not to provide an assessment of Project impacts for each functional group at a fine temporal scale but to estimate changes in productive potential with and without the Project at the ecosystem level27 However results were presented as comparisons by speciesfunctional group with and without the Project and not as potential changes in total ecosystem productivity The revised figures for each functional group showing distributions without the Project with the Project and their difference indicated impacts were likely to be localized with overall impacts relatively small The range of biomass ratios with and without the Project was 045 ndash 189 with most values slightly less than 1 This is interpreted as indicating slight decreases in the capacity of the study area to support biomass and production with the Project for many functional groups28 (Figure 2)
24 PMV Response 2016-03-02 p 80 lines 1524-1527 25 PMV Response 2016-03-02 p 81 lines 1551-1559 26 PMV Response 2016-03-02 p 82 Table 8 27 PMV Response 2016-03-02 p 99 lines 1914-1917 28 PMV Response 2016-03-02 Appendix 218
Pacific Region Science Response Technical Review Assessing
Ecosystem Productivity Model of Roberts Bank
15
Biomass Ratio
Freq
uenc
y
04 07 10 13 16 19
05
1015
2025
30
Figure 2 Histogram of biomass ratios obtained by comparisons of model runs with and without the project (ie With Without) Values less than 1 indicate reductions in biomass with the Project compared against without the Project) Data from Appendix 218 of PMV Response 2016-03-02
352 Sensitivity and vulnerability analyses Every ecosystem model is only one possible representation of the true ecosystem defined by the modelrsquos structure and the values chosen for its many parameters The key point is how well the model represents the real system how that fit can be measured and the sensitivity of model outputs to variability in the selected parameter values The ideal model should be robust to a wide range of uncertainties in the input data and parameters This robustness is determined by performing sensitivity analyses on the model to see how it responds to variations in the input parameters and determining to which input parameters the model is most sensitive
The vulnerability parameters determine the strength of the feeding interactions between functional groups They set the level of density dependence of each functional group Higher vulnerability settings provide greater top-down (predator) control whereas lower settings provide greater bottom-up (environmental) control29 Several publications have shown that EwE models are very sensitive to the vulnerability parameters and Christensen and Walters (2000) point out that a main pitfall of EwE is that ldquopredation vulnerabilities are often underestimated lessening the modelled impacts of predationrdquo It is usual practice to tune Ecopath models including the vulnerability parameters to time series data such as biomass using the temporal simulation model Ecosim However these data were not available for the RBT2 area so this robust method of fitting the model and estimating vulnerability parameters was not possible Instead a vulnerability setting of 2 was used as the default value for the key model runs which is ldquocommon practice when time series data are not available and estimates of vulnerability in the
29 PMV Response 2016-03-02 p 70 lines 1318-1323
Pacific Region Science Response Technical Review Assessing
Ecosystem Productivity Model of Roberts Bank
16
model cannot be maderdquo30 with sensitivity analyses run for a range of 15 to 3 This narrow range was criticized by DFOECCC in initial discussions about the model with the Proponent The Proponent subsequently reran the model with a larger range of vulnerabilities31 (11 to 10) and concluded this broader vulnerability range produced similar results for the productivity ratio with and without the Project to those in the original EIS and that the EIS was more likely to overestimate than underestimate potential project effects32 The data in Table 7 of the PMV Response33 did indicate changes in productivity ratios ranging from 0 to 50 of the defined key run (which used a vulnerability setting of 2) However the Proponent changed all vulnerability settings to the same value ie all were 2 or all were 10 etc In reality the vulnerability parameters resulting from Ecosim models that are fitted to data as described above vary by functional group which was not explored here Therefore although the results suggest that the original choice of 2 for the default key run seemed reasonable the potential effects of variability in vulnerability settings was not fully explored
Sensitivity analyses are usually based on the range of uncertainty estimated for input data and parameters often called the confidence limits around the model parameters The EwE framework integrates many different data sources and parameters including values from the literature It can therefore be difficult to identify ldquoreasonablerdquo confidence limits when derived from such diverse data sources Standard practice in Ecopath models has been to develop a pedigree for each parameter with default values for uncertainty based on the nature of the source data For example parameter values based on high precision field observations of biomass within the model domain receive default confidence intervals of 10 whereas parameter values based on models developed for elsewhere or professional judgment receive confidence intervals of 8034 Sensitivity analyses are then run using parameter values selected from within these confidence intervals However if these default confidence intervals do not capture the full range of variability then the outputs are not informative of the variability in the lsquorealrsquo ecosystem Field observations were collected for many functional groups within the model domain in 2012 and 2013 as part of studies to support the RBT2 EIS Apparently the purpose of these observations was to document spatial variability (in part for the Ecospace model) and temporal variability (measurements at one location over time) and not to derive confidence intervals around the observations35
The reliance on the pedigree approach to derive confidence intervals for this Roberts Bank model was criticized by DFO ECCC and NRCan in discussions with the Proponent As a result the Proponent reran the model with much larger confidence intervals ranging from 30 to 100 depending on the input parameter and functional group36 The results from this new analysis using the broader confidence intervals were similar to those using the original pedigree approach The Proponent noted that ldquoWhile the production within each helliprun was very different there was little difference in the biomass ratio [with and without the Project] These results further demonstrate that even with a greater range in input values the influence of the Project on the Roberts Bank ecosystem is consistent among allhellipmodel runsrdquo37 This provides confidence that the model may be robust to uncertainty in its input parameters Two concerns
30 PMV Response 2016-03-02 p 70 lines 1321-1322 31 PMV Response 2016-03-02 p 71-74 32 PMV Response 2016-03-02 p 71 lines 1339-1341 33 PMV Response 2016-03-02 p 73 34 EIS Appendix 10-C Section 251 page 18 35 PMV Response 2016-03-02 p 42 lines 772-777 36 PMV Response 2016-03-02 p 44-47 37 PMV Response 2016-03-02 p 47 lines 855-858 and see also PMV Response 2016-03-02 Appendix 27-B
Pacific Region Science Response Technical Review Assessing
Ecosystem Productivity Model of Roberts Bank
17
remain however The quote above indicates that the production among the different model runs was very different although with little difference in the biomass ratios with and without the Project Since biomass is not the same as production it would be informative for understanding model performance and potential impacts to show these production differences This also relates to the point made in Section 34 regarding how well the model represents the real ecosystem and not just within-model comparisons with and without the Project The second question is more technical and relates to how the randomization (Monte Carlo or MC) routine that was used to create multiple model runs used the uncertainty about the diet data Diets are not currently included in the MC routine available to regular users of the Ecosim model how they were handled in this RBT2 model appears not to be explained
Finally the sensitivity analyses indicate that the uncertainty in the input parameters does not lead to much difference between model parameters with or without the project However this conclusion does not describe how the uncertainty in the input parameters affects understanding of the ecosystem
40 Conclusions Overall the main conclusion of the Environmental Impact Statement from the Proponent is stated as ldquohellipafter the implementation of mitigation hellipthe Project is not expected to result in any significant adverse effects on any of the 16 valued componentsrdquo38 In addition ldquohellipapproximately 40 of the functional groups are forecast to change no more than 5 which hellip is judged to be within the uncertainty of the model runsrdquo39 although larger changes were forecast for orange sea pens freshwater biofilm green algae and raptors The conclusions from the modelling studies are that ldquohellipthe proposed project will have an impact on the study area that the effect varies between species and that the findings are robust to parameter uncertaintyrdquo40 Specific outcomes by valued component as derived from the EwE model are presented by functional groups in Table 1
38 PMV March 2015 Roberts Bank Environmental Impact Statement Executive Summary ndash Part 1 page 37 39 EIS Appendix 10-C p ii 40 EIS Appendix 10-D p iv
Pacific Region Science Response Technical Review Assessing
Ecosystem Productivity Model of Roberts Bank
18
Table 1 Changes in productive potential with the Project as derived from the EwE model
Changes in productive potential
Ecosystem category
Number of valued
components
Number with potential
biomass loss
Moderate decrease (31-60 decline)
Minor decrease (6-30 decline)
Negligible (0-5
change)
Minor increase (6-
30 increase)
Moderate increase (31-60 increase)
Source
Marine vegetation
7 7 - 3 2 2 - EIS Vol 3 Section 11 Table 11-17 page 11-65
Marine invertebrates
4 3 1 1 1 1 - EIS Vol 3 Section 12 Table 12-8 page 12-52
Marine fish 13 13 - 2 6 5 - EIS Vol 3 Section 13 Table 13-10 page 13-95
Coastal birds
11 8 - 3 4 3 1 EIS Vol 3 Section 15 Table 15-10 page 15-67
Pacific Region Science Response Technical Review Assessing
Ecosystem Productivity Model of Roberts Bank
19
Most functional groups showed some potential biomass loss with the Project with biomass loss defined as any model run with negative outcomes (ie in which biomass with the project was less than biomass without the Project) The summary of changes in productivity potential are mixed with most (33 out of 35) valued components showing minor decreases to minor increases (defined as 6 to 30 changes in productive potential with the Project compared to without the Project)
The main conclusions of this review in regards to the Terms of Reference are
1 Do the functional groups and abiotic variables used in the model adequately represent the ecosystem at Roberts Bank
o The 58 functional groups and abiotic variables used in the model adequately represent the main components of the Roberts Bank ecosystem however for longer lived species the life stages of the species are not well represented and some of the impacts of the Project may be expected to affect specific life stages
o The abiotic variables adequately represent the physical drivers of this ecosystem on an annual time scale However annual values for these abiotic variables may not adequately capture important sub-annual events such as storms (DFO 2016) the timing of arrival and departure of highly migratory species and whether there may be important sub-annual thresholds or mismatches in timing as a result of the Project
o Biotic factors (eg nutrients) which are particularly important for biofilm and other lower trophic level taxa are not included in this model The model is therefore unable to assess the potential development of eutrophication and benthic organic enrichment events which may affect fish habitats in the study area
2 Are the parameter estimates used by the model valid and defensible for this system
o In general parameter estimates appear to be adequate for this system Field studies were done in two years to provide data in particular on distributions of selected functional groups for the Ecospace module Note the distribution studies focussed on taxa which were relatively immobile and therefore lsquofixedrsquo in space
o the selection of some model parameters would benefit from further explanation for example the choice of fixed diet matrices versus dynamic matrices which can vary with changes in abundances or predators and prey
o the selection of some model parameters would benefit from further explanation for example the link between the diets described in the text of Appendix 10B and the quantities presented in Appendix A of Appendix 10B It is understood that proportions were derived using the ldquofixed selectivityrdquo principle but in order to be fully transparent the derivation of each diet should be provided in an appendix
o discussion and explanation is needed of why ecotrophic efficiencies differ from expected values (eg the ecotrophic efficiency for Pacific herring is listed as 038) and
o the abiotic factor lsquosubstratersquo was limited to ldquohardrdquo or rdquosoftrdquo options which can be restrictive given that they serve as endpoints on a substrate composition continuum These limited options may not provide the sensitivity required to assess substrate preference nor the flexibility for taxa (eg motile organisms) that span hard mixed and soft substrate types In addition it is not clear if changes in the hardsoft categories were considered over time within identified depositional or erosional settings before and after construction
Pacific Region Science Response Technical Review Assessing
Ecosystem Productivity Model of Roberts Bank
20
3 Are the limitations and uncertainties of the model identified and appropriately considered when determining the modelrsquos representation of current and possible future conditions
o the EwE model was not designed to evaluate a range of future conditions It was designed to estimate changes in the productive potential at the ecosystem level with and without the Project Therefore the model was run without the Project and with the Project for a range of plausible abiotic conditions and the results were compared with respect to biomass and productivity by functional group
o the pedigree approach to assessing the uncertainties of model outcomes is unsatisfactory for the purpose here as it relates solely to a qualitative judgment of the value of data based on its source However when the model was rerun with much wider ranges of confidence intervals (uncertainties) the results in general (but not necessarily for each functional group) were similar to the results using the original pedigree approach This suggests that taken overall the model may be robust to wide ranges of uncertainty in these input variables and parameters
o there is inadequate validation of the model This is inadequate for three reasons
(i) the basic Ecopath model is not validated and the Ecospace balancing process (the spin-up period) resulted in some biomass estimates being increased or decreased beyond their confidence limits
(ii) the goodness of fit test used to evaluate how well the model predicted the spatial occurrence functional groups is not fit for purpose (Section 34) and
(iii) validation was provided for only a small number of functional groups (the habitat-forming functional groups) As a consequence the model is currently not validated
o Considering the proportion of open boundaries relative to closed boundaries in the model processes taking place outside the modelled ecosystem are likely to contribute to dynamics within the modelled ecosystem However these external processes may not be well-resolved by the EwE model as currently configured
4 Are the model results related to the potential effects of the Project on fish and fish habitat and migratory birds and their food resources valid and defensible
o this is a very complex ecosystem model constructed for a relatively small and open (in the sense of considerable exchange with adjacent non-modelled areas) system Many assumptions have been made based on poor or missing data Taking all these considerations into account the model does the best job possible of comparing the biomass and productivity of the Roberts Bank ecosystem with and without the Project
o the extent to which the model adequately represents the lsquorealrsquo ecosystem of Roberts Bank as opposed to comparisons of model results with and without the Project is unclear as a number of basic diagnostics are not presented (see point 3 above)
o the EwE model is not capable of and is not designed to represent nutritional and food quality variations in prey functional groups and how these may impact highly migratory predators such as birds with and without the Project
5 Is the EwE model framework a valid method to quantify large scale impacts to fish habitat fish productivity and migratory bird productivity
o the EwE model as implemented in this project and reviewed here is a useful first-order framework to organise information and derive initial estimates of how the system may respond to perturbations
Pacific Region Science Response Technical Review Assessing
Ecosystem Productivity Model of Roberts Bank
21
o the utility of a EWE model for impact purposes is highly dependent on the quality of input data
o each EwE model is highly dependent on local conditions Although appropriate as an overall methodology each application would need to be reviewed for how it may be applied to any new ecosystem and
o the EwE model would need to be substantially reformulated if it was to include considerations of changes in chemical composition or food quality of prey in particular for seasonal migratory species such as birds which may depend on very large biomasses of prey with specific chemical composition to fuel their migrations beyond the ecosystem model boundaries
Contributors Contributor Affiliation Ian Perry Author DFO Science Pacific Region Alida Bundy Author DFO Science Maritimes Region Terri Sutherland Author DFO Science Pacific Region Robert Elner Author ECCC Canadian Wildlife Service Andrew Robinson Author ECCC Canadian Wildlife Service Lesley MacDougall Editor DFO Science Pacific Region
Approved by Carmel Lowe
Regional Director Science Branch Pacific Region Fisheries and Oceans Canada
November 4 2016
Sources of Information Christensen V Coll M Steenbeek J Buszowski J Chagaris D walters CJ 2014
Representing variable habitat quality in a spatial food web model Ecosystems 17 1397-1412
Christensen V and Walters C 2000 Ecopath with Ecosim methods capabilities and limitations Ecological Modelling 172 109-139
Colleacuteter M Valls A Guitton J Gascuel D Pauly D and Christensen V 2015 Global overview of the applications of the Ecopath with Ecosim modeling approach using the EcoBase models repository Ecological Modelling 302 pp42-53
Compass Resource Management Ltd 2013 Roberts Bank Terminal 2 Technical Advisory Group (TAG) Process Report Productive Capacity ndash Final Report 119pp (Accessed November 1 2016)
DFO 2016 Technical Review of Roberts Bank Terminal 2 Environmental Assessment Section 95 ndash Coastal Geomorphology DFO Can Sci Advis Sec Sci Resp 2016045 (Accessed November 4 2016)
Pacific Region Science Response Technical Review Assessing
Ecosystem Productivity Model of Roberts Bank
22
ESSA Technologies 2014a Roberts Bank Terminal 2 Project Roberts Bank Delta BC Environmental Impact Statement Volume 3 Biophysical Effects Assessments Appendix 10-C Roberts Bank Ecosystem Model Development and Key Run Port Metro Vancouver (Accessed November 1 2016)
ESSA Technologies 2014b Roberts Bank Terminal 2 Project Roberts Bank Delta BC Environmental Impact Statement Volume 3 Biophysical Effects Assessments Appendix 10-D Roberts Bank Ecosystem Model Sensitivity Analyses Port Metro Vancouver (Accessed November 1 2016)
Franklin J 2009 Mapping Species Distributions Spatial Inference and Prediction Cambridge University Press Cambridge
Hemmera 2014 Roberts Bank Terminal 2 Project Roberts Bank Delta BC Environmental Impact Statement Volume 3 Biophysical Effects Assessments Appendix 10-B Roberts Bank Ecosystem Model Parameter Estimates Port Metro Vancouver File 302-03503 (Accessed November 1 2016)
Port Metro Vancouver 2015a Roberts Bank Terminal 2 Project Roberts Bank Delta BC Environmental Impact Statement Volume 3 Biophysical Effects Assessments Section 100 Biophysical Setting (Accessed November 1 2016)
Port Metro Vancouver 2015b Roberts Bank Terminal 2 Project Roberts Bank Delta BC Environmental Impact Statement Volume 3 Biophysical Effects Assessments Section 103 Overview of Assessing Ecosystem Productivity (Accessed November 1 2016)
Port Metro Vancouver 2015c Roberts Bank Terminal 2 Project Environmental Assessment Additional Information Requirements (July 31 2015) Responses Response to Information Request 6 IR-73115-06 Canadian Environmental Assessment Agency Reference Number 80054 dated 26 October 2015
Steenbeek J Coll M Gurney L Meacutelin F Hoepffner N Buszowski J and Christensen V 2013 Bridging the gap between ecosystem modeling tools and geographic information systems Driving a food web model with external spatialndashtemporal data Ecological Modelling 263 139ndash 151
Sutherland T Elner R and OrsquoNeill J 2013 Roberts Bank Ecological crucible of the Fraser River estuary Progress in Oceanography 115 171ndash180
Vancouver Fraser Port Authority 2016 From the Vancouver Fraser Port Authority to the Review Panel re Answers to preliminary technical questions submitted during the completeness phase from Fisheries and Oceans Canada Natural Resources Canada and Environment and Climate Change Canada concerning the ecosystem modelling to support the Roberts Bank Terminal 2 Project environmental review CEAR Document 547 (Accessed November 1 2016)
Pacific Region Science Response Technical Review Assessing
Ecosystem Productivity Model of Roberts Bank
23
This Report is Available from the Centre for Science Advice
Pacific Region Fisheries and Oceans Canada
3190 Hammond Bay Road Nanaimo BC V9T 6N7
Telephone (250) 756-7208 E-Mail csapdfo-mpogcca
Internet address wwwdfo-mpogccacsas-sccs
ISSN 1919-3769 copy Her Majesty the Queen in Right of Canada 2016
Correct Citation for this Publication
DFO 2016 Technical review of Roberts Bank Terminal 2 environmental assessment section 103 ndash assessing ecosystem productivity DFO Can Sci Advis Sec Sci Resp 2016050
Aussi disponible en franccedilais
MPO 2016 Examen technique de leacutevaluation environnementale du Terminal 2 agrave Roberts Bank section 103 ndash eacutevaluation de la productiviteacute de leacutecosystegraveme Secr can de consult sci du MPO Reacutep des Sci 2016050

Pacific Region Science Response Technical Review Assessing
Ecosystem Productivity Model of Roberts Bank
18
Table 1 Changes in productive potential with the Project as derived from the EwE model
Changes in productive potential
Ecosystem category
Number of valued
components
Number with potential
biomass loss
Moderate decrease (31-60 decline)
Minor decrease (6-30 decline)
Negligible (0-5
change)
Minor increase (6-
30 increase)
Moderate increase (31-60 increase)
Source
Marine vegetation
7 7 - 3 2 2 - EIS Vol 3 Section 11 Table 11-17 page 11-65
Marine invertebrates
4 3 1 1 1 1 - EIS Vol 3 Section 12 Table 12-8 page 12-52
Marine fish 13 13 - 2 6 5 - EIS Vol 3 Section 13 Table 13-10 page 13-95
Coastal birds
11 8 - 3 4 3 1 EIS Vol 3 Section 15 Table 15-10 page 15-67
Pacific Region Science Response Technical Review Assessing
Ecosystem Productivity Model of Roberts Bank
19
Most functional groups showed some potential biomass loss with the Project with biomass loss defined as any model run with negative outcomes (ie in which biomass with the project was less than biomass without the Project) The summary of changes in productivity potential are mixed with most (33 out of 35) valued components showing minor decreases to minor increases (defined as 6 to 30 changes in productive potential with the Project compared to without the Project)
The main conclusions of this review in regards to the Terms of Reference are
1 Do the functional groups and abiotic variables used in the model adequately represent the ecosystem at Roberts Bank
o The 58 functional groups and abiotic variables used in the model adequately represent the main components of the Roberts Bank ecosystem however for longer lived species the life stages of the species are not well represented and some of the impacts of the Project may be expected to affect specific life stages
o The abiotic variables adequately represent the physical drivers of this ecosystem on an annual time scale However annual values for these abiotic variables may not adequately capture important sub-annual events such as storms (DFO 2016) the timing of arrival and departure of highly migratory species and whether there may be important sub-annual thresholds or mismatches in timing as a result of the Project
o Biotic factors (eg nutrients) which are particularly important for biofilm and other lower trophic level taxa are not included in this model The model is therefore unable to assess the potential development of eutrophication and benthic organic enrichment events which may affect fish habitats in the study area
2 Are the parameter estimates used by the model valid and defensible for this system
o In general parameter estimates appear to be adequate for this system Field studies were done in two years to provide data in particular on distributions of selected functional groups for the Ecospace module Note the distribution studies focussed on taxa which were relatively immobile and therefore lsquofixedrsquo in space
o the selection of some model parameters would benefit from further explanation for example the choice of fixed diet matrices versus dynamic matrices which can vary with changes in abundances or predators and prey
o the selection of some model parameters would benefit from further explanation for example the link between the diets described in the text of Appendix 10B and the quantities presented in Appendix A of Appendix 10B It is understood that proportions were derived using the ldquofixed selectivityrdquo principle but in order to be fully transparent the derivation of each diet should be provided in an appendix
o discussion and explanation is needed of why ecotrophic efficiencies differ from expected values (eg the ecotrophic efficiency for Pacific herring is listed as 038) and
o the abiotic factor lsquosubstratersquo was limited to ldquohardrdquo or rdquosoftrdquo options which can be restrictive given that they serve as endpoints on a substrate composition continuum These limited options may not provide the sensitivity required to assess substrate preference nor the flexibility for taxa (eg motile organisms) that span hard mixed and soft substrate types In addition it is not clear if changes in the hardsoft categories were considered over time within identified depositional or erosional settings before and after construction
Pacific Region Science Response Technical Review Assessing
Ecosystem Productivity Model of Roberts Bank
20
3 Are the limitations and uncertainties of the model identified and appropriately considered when determining the modelrsquos representation of current and possible future conditions
o the EwE model was not designed to evaluate a range of future conditions It was designed to estimate changes in the productive potential at the ecosystem level with and without the Project Therefore the model was run without the Project and with the Project for a range of plausible abiotic conditions and the results were compared with respect to biomass and productivity by functional group
o the pedigree approach to assessing the uncertainties of model outcomes is unsatisfactory for the purpose here as it relates solely to a qualitative judgment of the value of data based on its source However when the model was rerun with much wider ranges of confidence intervals (uncertainties) the results in general (but not necessarily for each functional group) were similar to the results using the original pedigree approach This suggests that taken overall the model may be robust to wide ranges of uncertainty in these input variables and parameters
o there is inadequate validation of the model This is inadequate for three reasons
(i) the basic Ecopath model is not validated and the Ecospace balancing process (the spin-up period) resulted in some biomass estimates being increased or decreased beyond their confidence limits
(ii) the goodness of fit test used to evaluate how well the model predicted the spatial occurrence functional groups is not fit for purpose (Section 34) and
(iii) validation was provided for only a small number of functional groups (the habitat-forming functional groups) As a consequence the model is currently not validated
o Considering the proportion of open boundaries relative to closed boundaries in the model processes taking place outside the modelled ecosystem are likely to contribute to dynamics within the modelled ecosystem However these external processes may not be well-resolved by the EwE model as currently configured
4 Are the model results related to the potential effects of the Project on fish and fish habitat and migratory birds and their food resources valid and defensible
o this is a very complex ecosystem model constructed for a relatively small and open (in the sense of considerable exchange with adjacent non-modelled areas) system Many assumptions have been made based on poor or missing data Taking all these considerations into account the model does the best job possible of comparing the biomass and productivity of the Roberts Bank ecosystem with and without the Project
o the extent to which the model adequately represents the lsquorealrsquo ecosystem of Roberts Bank as opposed to comparisons of model results with and without the Project is unclear as a number of basic diagnostics are not presented (see point 3 above)
o the EwE model is not capable of and is not designed to represent nutritional and food quality variations in prey functional groups and how these may impact highly migratory predators such as birds with and without the Project
5 Is the EwE model framework a valid method to quantify large scale impacts to fish habitat fish productivity and migratory bird productivity
o the EwE model as implemented in this project and reviewed here is a useful first-order framework to organise information and derive initial estimates of how the system may respond to perturbations
Pacific Region Science Response Technical Review Assessing
Ecosystem Productivity Model of Roberts Bank
21
o the utility of a EWE model for impact purposes is highly dependent on the quality of input data
o each EwE model is highly dependent on local conditions Although appropriate as an overall methodology each application would need to be reviewed for how it may be applied to any new ecosystem and
o the EwE model would need to be substantially reformulated if it was to include considerations of changes in chemical composition or food quality of prey in particular for seasonal migratory species such as birds which may depend on very large biomasses of prey with specific chemical composition to fuel their migrations beyond the ecosystem model boundaries
Contributors Contributor Affiliation Ian Perry Author DFO Science Pacific Region Alida Bundy Author DFO Science Maritimes Region Terri Sutherland Author DFO Science Pacific Region Robert Elner Author ECCC Canadian Wildlife Service Andrew Robinson Author ECCC Canadian Wildlife Service Lesley MacDougall Editor DFO Science Pacific Region
Approved by Carmel Lowe
Regional Director Science Branch Pacific Region Fisheries and Oceans Canada
November 4 2016
Sources of Information Christensen V Coll M Steenbeek J Buszowski J Chagaris D walters CJ 2014
Representing variable habitat quality in a spatial food web model Ecosystems 17 1397-1412
Christensen V and Walters C 2000 Ecopath with Ecosim methods capabilities and limitations Ecological Modelling 172 109-139
Colleacuteter M Valls A Guitton J Gascuel D Pauly D and Christensen V 2015 Global overview of the applications of the Ecopath with Ecosim modeling approach using the EcoBase models repository Ecological Modelling 302 pp42-53
Compass Resource Management Ltd 2013 Roberts Bank Terminal 2 Technical Advisory Group (TAG) Process Report Productive Capacity ndash Final Report 119pp (Accessed November 1 2016)
DFO 2016 Technical Review of Roberts Bank Terminal 2 Environmental Assessment Section 95 ndash Coastal Geomorphology DFO Can Sci Advis Sec Sci Resp 2016045 (Accessed November 4 2016)
Pacific Region Science Response Technical Review Assessing
Ecosystem Productivity Model of Roberts Bank
22
ESSA Technologies 2014a Roberts Bank Terminal 2 Project Roberts Bank Delta BC Environmental Impact Statement Volume 3 Biophysical Effects Assessments Appendix 10-C Roberts Bank Ecosystem Model Development and Key Run Port Metro Vancouver (Accessed November 1 2016)
ESSA Technologies 2014b Roberts Bank Terminal 2 Project Roberts Bank Delta BC Environmental Impact Statement Volume 3 Biophysical Effects Assessments Appendix 10-D Roberts Bank Ecosystem Model Sensitivity Analyses Port Metro Vancouver (Accessed November 1 2016)
Franklin J 2009 Mapping Species Distributions Spatial Inference and Prediction Cambridge University Press Cambridge
Hemmera 2014 Roberts Bank Terminal 2 Project Roberts Bank Delta BC Environmental Impact Statement Volume 3 Biophysical Effects Assessments Appendix 10-B Roberts Bank Ecosystem Model Parameter Estimates Port Metro Vancouver File 302-03503 (Accessed November 1 2016)
Port Metro Vancouver 2015a Roberts Bank Terminal 2 Project Roberts Bank Delta BC Environmental Impact Statement Volume 3 Biophysical Effects Assessments Section 100 Biophysical Setting (Accessed November 1 2016)
Port Metro Vancouver 2015b Roberts Bank Terminal 2 Project Roberts Bank Delta BC Environmental Impact Statement Volume 3 Biophysical Effects Assessments Section 103 Overview of Assessing Ecosystem Productivity (Accessed November 1 2016)
Port Metro Vancouver 2015c Roberts Bank Terminal 2 Project Environmental Assessment Additional Information Requirements (July 31 2015) Responses Response to Information Request 6 IR-73115-06 Canadian Environmental Assessment Agency Reference Number 80054 dated 26 October 2015
Steenbeek J Coll M Gurney L Meacutelin F Hoepffner N Buszowski J and Christensen V 2013 Bridging the gap between ecosystem modeling tools and geographic information systems Driving a food web model with external spatialndashtemporal data Ecological Modelling 263 139ndash 151
Sutherland T Elner R and OrsquoNeill J 2013 Roberts Bank Ecological crucible of the Fraser River estuary Progress in Oceanography 115 171ndash180
Vancouver Fraser Port Authority 2016 From the Vancouver Fraser Port Authority to the Review Panel re Answers to preliminary technical questions submitted during the completeness phase from Fisheries and Oceans Canada Natural Resources Canada and Environment and Climate Change Canada concerning the ecosystem modelling to support the Roberts Bank Terminal 2 Project environmental review CEAR Document 547 (Accessed November 1 2016)
Pacific Region Science Response Technical Review Assessing
Ecosystem Productivity Model of Roberts Bank
23
This Report is Available from the Centre for Science Advice
Pacific Region Fisheries and Oceans Canada
3190 Hammond Bay Road Nanaimo BC V9T 6N7
Telephone (250) 756-7208 E-Mail csapdfo-mpogcca
Internet address wwwdfo-mpogccacsas-sccs
ISSN 1919-3769 copy Her Majesty the Queen in Right of Canada 2016
Correct Citation for this Publication
DFO 2016 Technical review of Roberts Bank Terminal 2 environmental assessment section 103 ndash assessing ecosystem productivity DFO Can Sci Advis Sec Sci Resp 2016050
Aussi disponible en franccedilais
MPO 2016 Examen technique de leacutevaluation environnementale du Terminal 2 agrave Roberts Bank section 103 ndash eacutevaluation de la productiviteacute de leacutecosystegraveme Secr can de consult sci du MPO Reacutep des Sci 2016050
- TECHNICAL REVIEW OF ROBERTS BANK TERMINAL 2 ENVIRONMENTAL ASSESSMENT SECTION 103 ndash ASSESSING ECOSYSTEM PRODUCTIVITY
-
- 10 Context
- 20 Background
-
- 21 Background and Terms of Reference
- 22 Approach to assessing ecosystem productivity
-
- 30 Analysis and Response
-
- 31 The EwE Team
- 32 Overview of assessment results of hydrological and sediment modelling
- 33 Model implementation
-
- 331 The purpose of the EwE model
- 332 Applicability of the EwE model framework to the Roberts Bank region
- 333 Model documentation
- 334 Highly mobile functional groups
- 335 Seasonality (model time step)
- 336 Life history structure
- 337 Model balancing
-
- 34 Model validation
- 35 Model results
-
- 351 Presentation of model results
- 352 Sensitivity and vulnerability analyses
-
- 40 Conclusions
- Contributors
- Approved by
- Sources of Information
- This Report is Available from the
-
- CSAS 2016-50 - Assessing Ecosystem Productivitypdf
-
- TECHNICAL REVIEW OF ROBERTS BANK TERMINAL 2 ENVIRONMENTAL ASSESSMENT SECTION 103 ndash ASSESSING ECOSYSTEM PRODUCTIVITY
-
- 10 Context
- 20 Background
-
- 21 Background and Terms of Reference
- 22 Approach to assessing ecosystem productivity
-
- 30 Analysis and Response
-
- 31 The EwE Team
- 32 Overview of assessment results of hydrological and sediment modelling
- 33 Model implementation
-
- 331 The purpose of the EwE model
- 332 Applicability of the EwE model framework to the Roberts Bank region
- 333 Model documentation
- 334 Highly mobile functional groups
- 335 Seasonality (model time step)
- 336 Life history structure
- 337 Model balancing
-
- 34 Model validation
- 35 Model results
-
- 351 Presentation of model results
- 352 Sensitivity and vulnerability analyses
-
- 40 Conclusions
- Contributors
- Approved by
- Sources of Information
- This Report is Available from the
-
Canadian Science Advisory Secretariat Pacific Region Science Response 2016050
December 2016
TECHNICAL REVIEW OF ROBERTS BANK TERMINAL 2 ENVIRONMENTAL ASSESSMENT SECTION 103 ndash
ASSESSING ECOSYSTEM PRODUCTIVITY
10 Context Vancouver Fraser Port Authority (VFPA) formerly Port Metro Vancouver (the Proponent) is proposing to construct and operate the Roberts Bank Terminal 2 Project (the Project) a new three-berth marine container terminal at Roberts Bank in Delta British Columbia The proposed terminal is located next to the existing Deltaport and Westshore Terminals In addition to the construction of the new terminal the Proponent has proposed to widen the north side of the existing Roberts Bank causeway from its east-end connection with the mainland to the entrance to the new terminal The existing tug basin connected to the northeast side of Deltaport Terminal is also proposed to be expanded The new marine terminal is predicted by the Proponent to process up to 260 container ship calls per year at full capacity with the assistance of two or three large berthing or escort tugs to manoeuver ships into or away from assigned berths The terminal is designed to operate 24 hours per day year-round
The Roberts Bank Terminal 2 Project is subject to an environmental assessment by a Review Panel pursuant to the Canadian Environmental Assessment Act 2012 As a federal authority in the environmental assessment for the Project Fisheries and Oceans Canada (DFO) will be asked to present information to the review panel and at public hearings in relation to its expertise on the effects of the Project on fish and fish habitat including aquatic species at risk and the adequacy of mitigation and offsetting measures and monitoring and follow-up programs proposed by the Proponent DFOrsquos Pacific Region Fisheries Protection Program (FPP) will coordinate DFOrsquos participation in the environmental assessment
The Proponent assessed future ecosystem productivity at Roberts Bank using the Ecopath with Ecosim and Ecospace (EwE) model framework The potential impacts of the Project to hydrodynamic conditions and sediment transport in the area as a result of changes in wind wave and current patterns and intensities are projected using different model frameworks A companion Science Response (DFO 2016) has been developed by DFO and Natural Resource Canada (NRCan) to review Section 95 ldquoCoastal Geomorphologyrdquo of the Environmental Impact Statement (EIS) which describes the hydrodynamic and sedimentology models that were used to evaluate the effect of the Project on water and sediment movements
Outcomes of the EwE models are incorporated into the analysis of the potential project-related effects on the ongoing productivity of commercial recreational and Aboriginal fisheries Consequently DFO FPP has requested that DFO Science Branch provide an evaluation of the Proponentrsquos characterization of project-related effects as conducted using the Ecopath with Ecosim and Ecospace (EwE) ecosystem model
Pacific Region Science Response Technical Review Assessing
Ecosystem Productivity Model of Roberts Bank
2
The objectives for this Science Response are to
1 Determine if the functional groups and abiotic factors used in the model adequately represent the ecosystem at Roberts Bank
2 Assess whether the parameter estimates used by the model are valid and defensible for this system
3 Assess whether the limitations and uncertainties of the model are identified and appropriately considered when determining the modelrsquos representation of current and possible future conditions
4 Provide advice regarding whether the model results related to the potential effects of the Project on fish and fish habitat and migratory birds and their food resources are valid and defensible
5 If possible provide advice regarding the validity of using the EwE model framework to quantify large scale impacts to fish habitat and fisheries productivity and the productivity of migratory birds
This Science Response evaluates Section 100 ldquoBiophysical Settingrdquo with a focus on Section 103 ldquoOverview of Assessing Ecosystem Productivityrdquo in the EIS as submitted by the Proponent (Port Metro Vancouver 2015) This Section and consequently this Response describes the ecosystem modelling approach that was taken to evaluate the direct and indirect effects of the footprint of the proposed terminal and widened causeway herein referred to as lsquothe Projectrsquo This ecosystem model provides outputs related to potential effects of the project on the study area at an ecosystem level including aquatic species and bird species in the Project area Evaluation of the model and its outputs therefore required expertise in both fishery aquatic species and migratory bird species Consequently this Science Response is the product of a joint review between DFO and Environment and Climate Change Canada (ECCC) Canadian Wildlife Service and Wildlife and Landscape Science to provide a complete evaluation
This Science Response Report results from the Science Response Process of July 2016 on the Technical Review of Ecopath with Ecosim and Ecospace (EwE) Ecosystem Productivity Model application to the Roberts Bank Terminal 2 Environmental Assessment
20 Background
21 Background and Terms of Reference The Projectrsquos main components have a proposed combined marine footprint area of approximately 179 km2 listed below by specific component
bull Marine Terminal 1335 km 2 including terminal (116 km 2) and dredged berth pocket and marine approach areas (0174 km 2)
bull Widened Causeway 0424 km 2
bull Expanded Tug basin 0031 km 2
Roberts Bank in the Fraser River estuary consists of complex intertidal and subtidal habitats including intertidal eelgrass beds and is an important stopover area for migrating shorebirds and productive feeding and rearing habitats for many fish and invertebrate species It also provides habitat for endangered Southern Resident Killer Whales and other marine mammals
Pacific Region Science Response Technical Review Assessing
Ecosystem Productivity Model of Roberts Bank
3
The environmental conditions at Roberts Bank are dynamic and are influenced by a variety of oceanographic and atmospheric factors including the Fraser River freshwater and sediment plume discharge diurnal tidal currents and prevailing and storm-generated wind and wave activity In addition the intercauseway region provides significant drainage from marsh and agricultural areas which have different characteristics from marine waters and which run along the ferry causeway
To provide the required science advice this Science Response focusses on Section 10 ldquoBiophysical Settingrdquo of the Environmental Impact Statement (EIS) (Port Metro Vancouver 2015a) specifically Section 103 ldquoOverview of Assessing Ecosystem Productivityrdquo (Port Metro Vancouver 2015b) and its related Appendices 10-B ldquoRoberts Bank Ecopath with Ecosim and Ecospace model parameter estimatesrdquo (Hemmera 2014) Appendix 10-C ldquoRoberts Bank Ecosystem model development and key runsrdquo(ESSA Technologies 2014a) and Appendix 10-D ldquoRoberts Bank Ecosystem model sensitivity analysesrdquo (ESSA Technologies 2014b) Additional important information was obtained from the Response to Information Request 6 (IR-73115-06 Canadian Environmental Assessment Agency Reference Number 80054 dated 26 October 2015) (Port Metro Vancouver 2015c) and the Written Responses to Coastal Geomorphology and Ecosystem Modelling Questions provided by the Proponent to DFO ECCC and NRCan on 2 March 2016 (Port Metro Vancouver (PMV) Transmittal TRE-01-RBT2-0004A subsequently referred in this Science Response as ldquoPMV Response 2016-03-02rdquo) (Vancouver Fraser Port Authority 2016)
The process followed in preparing this Science Response involved an initial review of the submitted EIS followed by an in-person meeting of the Proponent its contractors and representatives of DFO ECCC and NRCan to discuss and clarify questions arising from the initial review (Vancouver 23 November 2015) DFO and NRCan provided written questions to the Proponent based on preliminary review of the EIS on November 19 2015 ECCC also provided written questions based on its preliminary review of the EIS to the Proponent on December 1 2015 and January 20 2016 This large initial meeting was followed by smaller focussed meetings between the Proponent its contractors and DFO and NRCan on 11 December 2015 to clarify hydrology and sediment modelling questions with DFO on 8 January 2016 to clarify ecosystem modelling questions and with ECCC on 18 February 2016 to clarify questions relating to birds Written responses to all of these meetings and questions were provided by the Proponent to DFO ECCC and NRCan as the ldquoPMV Response 2016-03-02rdquo and ldquoPMV Response 2016-05-30rdquo (Vancouver Fraser Port Authority 2016) VFPArsquos answers to questions posed by DFO and NRCan regarding coastal geomorphology modelling have been posted to the Canadian Environmental Assessment Registry (CEAR)
22 Approach to assessing ecosystem productivity The Proponent adopted an ecosystem approach to evaluate the direct and indirect effects of the Project on the productivity of the Roberts Bank ecosystem A weight of evidence approach was used to assess the potential effects of the project on the productivity of the ecosystem and selected key components in the study area this approach included a spatial ecosystem simulation model (which included a habitat capacity model) a shorebird opportunity model and empirical data An important point is that any effects on the system during the construction phase or from expansion of the tug basin were excluded from this modelling process the focus instead being a comparison of modelled system productivity before and after the proposed terminal and expanded causeway is in place The chosen ecosystem simulation model was
Pacific Region Science Response Technical Review Assessing
Ecosystem Productivity Model of Roberts Bank
4
Ecopath with Ecosim and its spatial version Ecospace (collectively referred to here as the EwE framework or EwE model) This modelling approach was recommended by a prior Productive Capacity Technical Advisory Group comprised of representatives of technical experts from government agencies academia non-governmental organizations Vancouver Fraser Port Authority and its consultants (Compass 2013) convened by the Proponent and which also recommended a selection of focal species for the model The final selection of functional groups and the resulting food web that form the core of this ecosystem model are shown in Figure 1
Pacific Region Science Response Technical Review Assessing
Ecosystem Productivity Model of Roberts Bank
5
Figure 1 Ecopath with Ecosim model food web for Roberts Bank (Adapted from EIS Volume 3 Section 10 Fig 1033 on page 10-16) The groups coloured in orange represent focal groups size of symbols represents relative annual amount of biomass in the Roberts Bank study area
Pacific Region Science Response Technical Review Assessing
Ecosystem Productivity Model of Roberts Bank
6
The EwE framework is a common approach to ecosystem modelling which has been developed and expanded over the past two to three decades It currently has three main components
1 Ecopath ndash the core model which provides a mass-balance snapshot of the system
2 Ecosim ndash a module that enables simulation modelling over time
3 Ecospace ndash a module that enables simulation modelling over space
In order to make an EwE model tractable species are aggregated into functional groups based on their similar ecological characteristics (habitat and prey preferences etc) the Roberts Bank models had 58 functional groups The first step (Ecopath) was to obtain input parameters representing biomass production consumption emigration and diet for each functional group These parameters were then tuned in an iterative process until the overall production and consumption was balanced (a mass-balance approach) resulting in a model food web with estimates of energy flow between functional groups (Fig 1)
In the second step Ecosim was combined with the spatial model Ecospace The abiotic variables selected in this EIS (depth salinity bottom current wave height sediment type) were used as external forcings to the Ecospace module These abiotic variables provided the physical forcings for the simulations without and with the Project Since time series data on the functional groups of the model were not available Ecospace was run until the model reached equilibrium using various assumptions of the value of the vulnerability parameter (see Section 352) In this EIS the selected time step was annual with all variables abiotic and biotic expressed as yearly averages As used in this EIS the Ecospace module included a habitat capacity model which estimated the distribution of functional groups based on their environmental preferences for each abiotic variable (depth salinity bottom current wave height) and for substrate type (sand mud etc) The model thus allocated the spatial distribution of functional groups over the model domain based on their environmental preferences and the distributions of these abiotic variables with and without the Project The selected spatial unit size (ldquopixelrdquo) for the Ecospace model was 100 m2 In essence an Ecopath model was constructed for each pixel with particular rules governing how the functional groups interacted and moved among these spatial units The Ecospace module was run until it approached equilibrium (20 model years) to establish the spatial patterns without the Project For the lsquowith the Projectrsquo simulations the model was run for an initial 10 years and then the spatial patterns of the abiotic variables with the project were added and the model run for an additional 10 years1 The model outputs predicted changes in the productive potential of the Roberts Bank ecosystem as a comparison (ratio) with and without the Project rather than an absolute biomass that would be lost or gained as a result of the Project
1 EIS Appendix 10-C p 26
Pacific Region Science Response Technical Review Assessing
Ecosystem Productivity Model of Roberts Bank
7
30 Analysis and Response To prepare this response the following sections of the EIS additional documents were reviewed
DocumentSection Title
EIS Section 10
Including appendices 10B 10C and 10D
(Port Metro Vancouver 2015a Hemmera 2014 ESSA Technologies 2014a ESSA Technologies 2014b)
Biophysical Setting
Appendix 10-B Roberts Bank Ecosystem Model Parameter Estimates Port Metro Vancouver File 302-03503
Appendix 10-C Roberts Bank Ecosystem Model Development and Key Run Port Metro Vancouver
Appendix 10-D Roberts Bank Ecosystem Model Sensitivity Analyses Port Metro Vancouver
CEAR document 547 (Including Appendices) ldquoPMV Response 2016-03-02rdquo and ldquoPMV Response 2016-05-30rdquo
(Vancouver Fraser Port Authority 2016)
Vancouver Fraser Port Authority to the Review Panel re Answers to preliminary technical questions submitted during the completeness phase from Fisheries and Oceans Canada Natural Resources Canada and Environment and Climate Change Canada concerning the ecosystem modelling to support the Roberts Bank Terminal 2 Project environmental review
31 The EwE Team Building this ecosystem model was a complex undertaking which required knowledge of the ecosystem to be modelled how to set initial parameter values determination of reasonable ranges of these parameters how to balance the model and how to recognize when the model outputs were unrealistic These tasks became even more complex when spatial model dynamics were involved such as with Ecospace The team engaged by the Proponent to conduct this ecosystem modelling for the Roberts Bank Terminal 2 (RBT2) EIS was led by scientists at the Institute for Oceans and Fisheries located at the University of British Columbia in Vancouver These scientists are global leaders of the EwE model framework having developed much of its current implementation and who continue to lead its elaborations and extensions Construction and running of the model for this specific ecosystem was done in collaboration with ESSA Technologies of Vancouver Parameter values for the ecosystem model were obtained in part from observational studies conducted in the area by Hemmera of Burnaby BC
32 Overview of assessment results of hydrological and sediment modelling Implementation of the ldquowith the Projectrdquo simulations of the ecosystem model was done by driving the model with the abiotic variables as they were projected to be distributed with the Project footprint In the context of this EIS specifying depth salinity bottom currents wave height and sediment type conditions without the Project and changes with the Project were achieved by construction of hydrodynamical and sediment transport models The outputs from these models in combination with the identified environment preferences for the various biological groups were then used as inputs to the Ecospace model to define the spatial
Pacific Region Science Response Technical Review Assessing
Ecosystem Productivity Model of Roberts Bank
8
distributions of these functional groups The implementation of these hydrological and sediment transport models in this EIS was reviewed by DFO and NRCan (DFO 2016) This review concluded that the implementation of these models for this EIS was adequate for average winter conditions but lacking in validation for summer conditions in particular with strong freshwater flows from the Fraser River Simulations of strong storm events and their impacts on wave conditions and sediment transport were also lacking The effect of wave action and current speeds on sediment transport is non-linear such that increasing winds over short periods of time can impact sediment transport processes bottom topography and water depths beyond that determined under average model conditions Overall the review concluded that a greater range of sensitivity analyses is required to have confidence in the model outputs under lsquonon-averagersquo conditions The implication of this conclusion for the present review of the EwE model is that the full range of variability of abiotic characteristics such as bottom topography bottom current and wave heights and how they may affect relevant functional groups in the model with the Project may not be adequately represented Sensitivity analyses were provided by varying the intensity of abiotic variables and by removing abiotic variables to assess their interactive effects In general the ecosystem model outputs were robust to these sensitivity analyses with most groups varying by less than 5 Larger changes however were observed for primary producer and bird groupings and for some fish groups when various abiotic variables were omitted2
33 Model implementation 331 The purpose of the EwE model
The EwE model was intended to provide one line of evidence to assess the potential impacts of the Project on the Roberts Bank ecosystem which would then be used with other lines of evidence to make the final assessment Specifically ldquohellip the objective of the RB [Roberts Bank] model was not to provide an assessment of Project impacts for each functional group at a fine temporal scale but to estimate changes in productive potential with and without the Project at the ecosystem levelrdquo3 In addition ldquohellipthe primary objective of the RB ecosystem model is to evaluate potential changes in productivity from such abiotic factors with and without the terminal and causewayrdquo4 Results are presented for the selected functional groups no results were presented on potential changes in ecosystem structure or function
332 Applicability of the EwE model framework to the Roberts Bank region EwE models work best when the exchanges within the system being modelled are greater than the exchanges between the modelled system and the lsquooutsidersquo world In practice this means that EwE models work best for larger systems with few external exchanges In a meta-analysis of 433 Ecopath models Colleacuteter et al (2015) concluded that ldquohellipin the last two decades the range of the models area has expanded toward very large areas and the median has shifted accordingly from about 1000 km2 in 1984ndash1993 to about 100000 km2 in 1994ndash2014rdquo The section of the Roberts Bank ecosystem that is included in the EwE model was comparatively small (5468 km2) and complex It is an intertidally-dominated environment that is subject to strong seasonal influences of both freshwater and marine exchanges across relatively large seaward and shoreward boundaries
2 EIS Appendix 10-D p ii - iii 3 PMV Response 2016-03-02 p 99 lines 1914-1917 4 PMV Response 2016-03-02 p 38 lines 689-691
Pacific Region Science Response Technical Review Assessing
Ecosystem Productivity Model of Roberts Bank
9
Processes taking place outside the modelled ecosystem will contribute to dynamics within the modelled ecosystem (eg lsquooutsidersquo food supporting predators which occur in the Roberts Bank ecosystem for only part of the year predators which may feed in the Roberts Bank ecosystem but export this energy when they migrate out of the region) but which may not be well-resolved by the EwE model The Proponent justifies the spatial scale because it was specifically chosen for the questions being asked in regard to assessing productivity changes and because the relative influences of external exchanges are assumed to be identical with and without the project In addition highly mobile species with broad prey bases were assumed in the model to be partially sustained by external energy from outside the model system5 The distributions of organisms may differ however with and without the project which may affect their interactions with areas outside of the modelled system and the use of diets from outside the modelled system may not reflect the impacts of the project Further clarification of how the EwE model captures the exchanges and interactions with adjacent ecosystems are needed For example it could be argued that an ecosystem which is open to frequent exchanges of water and organic matter from beyond its boundaries might be more robust to local disturbances such as the Project
There are some inconsistencies in the information and assumptions used for some of the taxa in this ecosystem model For Dungeness Crab the justification for estimating total adult biomass (including females) from the biomass of fished males is unclear In addition it is unclear if the slower growth of female crabs once they have reached sexual maturity in comparison with male crabs has been considered The diet matrix for spiny dogfish does not represent the actual diet well in particular of euphausiids herring and shrimp and there are more recent references for biomass estimates of spiny dogfish in the study area than what was used in the EIS
Fishing mortality was not included in the model under the assumption that this would not change with or without the project While this assumption may be true the model has been parameterized by ignoring a source of mortality that will influence total production In essence fishing removes biomass from the ecosystem with the result that less biomass will be available for higher trophic levels How this may impact the ecosystem with and without the Project is unclear but it could make noticeable differences if for example there were thresholds in the feeding responses by these higher trophic level species The Ecopath model that was used is relatively unconstrained since many ecological efficiencies are low even for forage species which would be expected to be higher It is not clear how many species are exploited or the levels of exploitation but even if this does not change with the Project these mortality rates should be included in the model in order to add realistic constraints to the exploited functional groups
333 Model documentation Based on questions from DFO ECCC and NRCan following their initial review of the EIS the Proponent provided written responses dated 2 March 2016 to clarify several of the steps in the model development and implementation However several questions remain including questions about the Ecospace module Ecospace has undergone several recent developments such as the inclusion of the spatial-temporal data layer framework (Steenbeek et al 2013) the habitat capacity model (Christensen et al 2014) and the Monte Carlo analysis including the diet matrix As yet there are few published studies using these latest Ecospace developments and their documentation and justification need to be improved in the EIS
5 PMV Response 2016-03-02 p 29 lines 446 - 464
Pacific Region Science Response Technical Review Assessing
Ecosystem Productivity Model of Roberts Bank
10
Questions also remain regarding how the Monte Carlo randomization routine treated diet data The report indicates that the Monte Carlo routine randomly selected input parameters from the input ranges and that only models that were balanced were used This suggests that a high proportion of models were not balanced and therefore were not used (for example the EIS indicates that about one out of 1000 sampled input parameters was balanced6) A table showing the minimum maximum mode average and median values from the Monte Carlo runs for all the parameters would enable an evaluation of how much variation was actually sampled by the balanced model runs This is recommended in the EwE user information ie ldquoUsers should check the range of the input parameters that were actually used in the trials in the output csv file (see below)rdquo7
In addition there are several issues with the documentation of the derivation of the parameters for the functional groups Such documentation should clearly outline how the input parameter was estimated and the range of uncertainty for that parameter For example the input biomass of pinnipeds was defined as 04 t km 2 derived from estimates of 034 for Harbour seals and two estimates for Steller sea lions (012 and 014 t km 2) No explanation was provided for how the overall estimated pinniped biomass of 04 t km 2 was determined The diet of Sand Lance was described in the EIS as consisting mostly of zooplankton8 whereas the diet table for the model runs9 included 20 macrofauna 10 green algae and 10 detritus It is unclear why these additional prey were included in the diet used for the model runs
334 Highly mobile functional groups This implementation of the EwE framework included transient and migratory functional groups This is entirely appropriate and these groups cannot be excluded The approach taken in the Ecospace module was to impose a low (and conservative) dispersal rate among model spatial units (lsquopixelsrsquo) of 1 km yr-1 This may be appropriate for low mobility benthic organisms but it likely underestimates the movements of many other functional groups The effects of using higher and perhaps functional-group-specific dispersal rates was not considered The Proponents argued that higher dispersal rates would reduce impacts since species can move away from less desirable areas more quickly for completeness these runs should be done and evaluated Mobile species will also bring energy (food) captured outside the system into the modelled ecosystem This process was included in the model with the use of a diet import factor reflecting the consumption of prey outside the modelled region with the assumption that groups with high import rates were unlikely to respond to local changes on Roberts Bank10 This assumption needs justification perhaps at the functional group level for example many species of highly migratory birds and Pacific salmon use the Roberts Bank ecosystem to obtain food to continue their migrations Although this food does not compose a large fraction of their annual consumption it can be critical to enable them to continue their migrations
The EwE model is not designed to capture differences in prey quality ie differences in essential fatty acid or nutrient ratios The same species of prey may have greater or lesser nutritional value to predators depending on the conditions under which they are growing and their seasonal variations This is a particular concern with the nutritional quality of the diatom-dominated biofilm Diatomaceous biofilm is important to the highly migratory Western Sandpiper (Calidris mauri) Despite its predictive merits in relation to other ecosystem
6 EIS Appendix 10D Section 24 p5 7 EwE Help file p 151 8 EIS Appendix 10B Section 4133 p 76 9 EIS Appendix A of Appendix 10B 10 PMV Response 2016-03-02 p 28 lines 429 - 436
Pacific Region Science Response Technical Review Assessing
Ecosystem Productivity Model of Roberts Bank
11
components the EwE model is not informative with respect to understanding the potential impacts of the Project on biofilm and the Western Sandpiper While this example is specific to seabirds the potential exists for differences in the quality of biofilm to also be an issue for copepods which feed on biofilm and consequently to juvenile salmon which feed on these copepods (eg Sutherland et al 2013)
The EwE model is also not designed to predict effects of the Project on water quality although the Proponent noted that ldquoOther abiotic factors not included were deemed to be representative of variables that were already included in the modelhelliprdquo11 The Project may cause changes in physical and water quality conditions whether in isolation or in combination which may impact the productivity or nutritional quality of key prey organisms for local and migratory species which will not be captured by the model The EwE model does not assess the production of key nutrients or the implications of changes in important physical and water quality parameters to biofilm community structure and hence to important migratory birds
The model does not include biotic factors for both pelagic and benthic environments to assess the potential development of eutrophication and benthic organic enrichment events respectively Organic and redox indicators traditional measures of environmental assessments that are used to determine changes in functional group responses were included in the recent Deltaport Third environmental assessment (ie Pelagic chlorophyll dissolved nutrients Benthic sediment carbonnitrogen content redox state [sulfide concentration]) Benthic anoxic events based on organic enrichment are known to be strong drivers of community composition and exclusion regardless of substrate type In the absence of biotic factors (eg organic particulates) the model has not considered the potential for benthic organic enrichment which coincides with siltation processes within the upper tidal flats The tidal flat corner bordered by the Delta-dyke and Deltaport causeway has served as a catchment area for Fraser River silt since the development of the original Deltaport causeway (Sutherland et al 2013) The proposed position of the new terminal placed at the seaward termination of the Deltaport causeway may produce a crescent-shaped feature in the wake of the Fraser River Plume This feature may provide a more efficient silt trap that will promote benthic organic enrichment This piece of the environmental assessment seems to be missing and is important for assessing fish habitat in this area
335 Seasonality (model time step) Input data to parameterize the model were available on a range of time scales from hourly (eg physical data on salinity and water flow) to annual (eg species biomass) The Proponents indicated12 that this is a strength of the EwE model although ultimately the model was run with an annual time step with all sub-annual values being averaged to annual values This method therefore did not incorporate important seasonal processes such as winter-summer differences in salinity and storm properties and the seasonal appearances of abundances of predators and prey such as migratory salmon and birds that are much larger than the annual average For example juvenile salmon migrate from the Fraser River and onto Roberts Bank in the spring before moving into deeper waters If these spring abundances are averaged over the entire year these average abundances would be 5-10 times lower than the actual abundances during the spring (ie averaging the biomass that occurs in two months over a 12 month period) Additionally this method did not capture the intensity of processes such as growth and predation which can be focused over periods of a few weeks to a few months There may be important threshold effects at particular times and places which may be missed when using an 11 EIS Section 10 p 10-11 12 PMV Response 2016-03-02 p 86 line 1655
Pacific Region Science Response Technical Review Assessing
Ecosystem Productivity Model of Roberts Bank
12
annual time step for the model The Ecospace module has a monthly time step13 and therefore it is feasible to run this module with a sub-annual time step For example the Proponents submit14 that there are inadequate data to model the potential effects of the Project on the timing of biofilm production which could have implications for the migratory dunlin and Western Sandpiper However this could be modelled in an exploratory way to determine hypotheses about which factors could affect the timing of production of biofilm and the potential impacts on these birds These issues are of major concern to ECCC
336 Life history structure The EwE model did not separate functional groups into life history stages (stanzas) yet for many functional groups the juvenile stages can have very different life history characteristics and habitats than the adults It is unclear in the description of the model how different life history structures were considered and whether for example there were enough juveniles to produce the adults The implications of not including early life stages should be explored at least qualitatively to identify which species might have life stages that may be more vulnerable to project effects
337 Model balancing Balancing an EwE model is the process by which parameters are adjusted so that there is sufficient production for consumption requirements ie there are sufficient prey for all predators Expert opinion was used to examine parameter values and to adjust for errors or inconsistencies in logic ldquoPMV is confident that since the approach taken to balance the model was based on best practices the steps are appropriaterdquo15 Adjustments to initial parameters to ensure an ecologically-feasible model are necessary and to be expected For a few functional groups however very large changes to initial parameter estimates (which were often not based on Roberts Bank specific data) were necessary for example to transient killer whales When such initial parameters were adjusted (often by substantial amounts) by expert opinion to balance the model the confidence intervals around these adjusted parameter values were not increased to reflect this added uncertainty (see for example PMV Response 2016-03-02 p 51 lines 955-956) When expert opinion was used to make very large changes to initial parameter values broader confidence intervals about these parameters should have been applied This does not appear to have been the case and as a consequence may cause the actual uncertainty of the model outputs to be underestimated
Another example is for the pinniped group in which 50 of the diet was assumed to come from outside the model area in order to balance the model The rationale provided was ldquoThe pinnipeds caused excessive predation mortalities on numerous fish functional groups The biomass of pinnipeds was an average for the Strait of Georgia which was likely too high for Roberts Bank Therefore it was assumed that pinnipeds extracted only half of their diet from the study areardquo16 It is unclear whether the sensitivity of the model to different percentages of diet allocation was explored
As noted above (332) the Ecopath model was relatively unconstrained and few adjustments to input parameters were required to balance the model This is unusual and the low ecotrophic efficiencies of several functional groups suggest that full accounting of energy flows may not have been achieved (an ecotrophic efficiency of 1 indicates that 100 of the production of that
13 EIS Appendix 10C Section 29 p24 14 EIS Appendix 10D Appendix C p72 15 PMV Response 2016-03-02 p 49 lines 910-912 16 EIS Appendix 10C Section 261 p 20
Pacific Region Science Response Technical Review Assessing
Ecosystem Productivity Model of Roberts Bank
13
particular group is being preyed upon or removed by fishing leaving no individuals to die of old age17) An ldquoexcessrdquo of individuals dying of old age ie ecotrophic efficiencies much less than 1 suggests a potentially large biomass that is not used by the ecosystem and instead is converted to detritus
34 Model validation Model validation is the process by which the model parameters variables and outputs are compared with those from the real ecosystem to ascertain how well the model represents the ecosystem It is an essential step in providing confidence that the projections from the model in this case with and without the Project have relevance to how the real ecosystem may be expected to function with and without the Project In practice validating complex ecosystem models is difficult considering the range of assumptions that must be made when building the model the limited available data and natural variability of the ecosystem at a variety of time and space scales
Many of the standard diagnostics for the Ecopath model have not been evaluated in the EIS The Proponent appears to have assumed that once the Ecopath model was balanced then it was valid and fit for purpose The Proponent should provide all the Ecopath estimates of vital rates including mortality rates As presented questions remain For example many Ecotrophic Efficiencies (which control the transfer of biomass from prey to predators) are less than 1 even for taxa which would be expected to be close to 1 such as carnivorous zooplankton The reason for Ecotrophic Efficiencies less than 1 were not discussed or explained in the EIS
Detailed diagnostics for the Ecospace model should also be presented in order to evaluate model performance In response to criticisms by DFO ECCC and NRCan in discussions with the Proponent the latter provided the biomass of the functional groups from the Ecopath model (before Ecospace) and the Ecospace model after the spin-up period (which involved adjusting the parameters from the Ecopath model to balance the 5468 separate cells of the Ecospace model)18 The Proponents argue that ldquoIt is important to note that changes in biomass values generated during the spin-up period are identical for both with and without Project scenarios and thus do not provide information on the potential Project-related effects on productivity19 However several changes to biomass result from the Ecospace balancing process (spin-up period) This is only given brief attention by the Proponent in its response to the DFO ECCC and NRCan questions An analysis of Table 620 revealed that the biomass of 9 functional groups was larger or smaller than the widest confidence limits allowed for each group21 This requires further discussion and justification
The Proponent used a goodness of fit measure to compare spatial distributions of model outputs with field observations They indicated that ldquono other EwE models were identified which use a goodness-of-fit measure Hence the RB model is potentially the first such EwE model where a goodness of fit measure has been appliedrdquo22 The chosen goodness of fit measure is the percent correct classification (PCC) method23 This method derives a test statistic based on the proportion of locations at which predicted occurrences from the model match observed
17 EIS Appendix 10-B p 11 18 PMV Response 2016-03-02 p 65-66 Table 6 19 PMV Response 2016-03-02 p 64 lines 1205-1207 20 PMV Response 2016-03-02 p 65-66 Table 6 21 PMV Response 2016-03-02 p 45 Table 3 22 PMV Response 2016-03-02 p 78 lines 1481-1483 23 PMV Response 2016-03-02 p 78 lines 1483-1484
Pacific Region Science Response Technical Review Assessing
Ecosystem Productivity Model of Roberts Bank
14
occurrences from data and similarly with predicted and observed absences The Proponent then calculated two additional accuracy of fit measures sensitivity (the model predicts a species to occur in an area where it is known to occur in reality) and specificity (the model predicts a species does not occur in an area it is known not to occur in reality)24 This analysis concluded that the model has high predictability for functional groups such as eelgrass and sea pens with relatively static distributions but lower predictability for functional groups which are more temporally and spatially dynamic such as biofilm and green algae25
There are two problems with this approach The first is that this goodness of fit comparison was done only for habitat-forming functional groups no discussion of how well this analysis applies to mobile functional groups was provided The second problem is that this method does not take into account situations (such as occurs in this study with several groups) in which species occur at only a few locations For example ldquohellipif the test data consist of 95 absences and 5 presences and this reflects the true prevalence of the species on the landscape (a realistic scenario for a rare species) a lsquonullrsquo model that predicted absence in all cases (eg no model at all) would be correct 95 of the timehellipldquo (Franklin 2009 p 151) This latter point is important here as these habitat functional groups (biofilm brown algae native eelgrass green algae Japanese eelgrass tidal marsh biomat and orange sea pens26) appear not to occur over most of the Project area (as portrayed by the model outputs presented in the distribution figures of PMV Response 2016-03-02 Appendix 218) It is therefore important that a robust evaluation of the performance of the Ecospace module is used with preferably more than one measure
In summary the starting point for this modelling analysis matters It is not just about a comparison between results with and without the Project The model has to be considered a sufficient representation of the ecosystem The Proponent has not yet sufficiently validated the model
35 Model results 351 Presentation of model results
As noted above (Section 331) the stated objective of the Roberts Bank ecosystem model was not to provide an assessment of Project impacts for each functional group at a fine temporal scale but to estimate changes in productive potential with and without the Project at the ecosystem level27 However results were presented as comparisons by speciesfunctional group with and without the Project and not as potential changes in total ecosystem productivity The revised figures for each functional group showing distributions without the Project with the Project and their difference indicated impacts were likely to be localized with overall impacts relatively small The range of biomass ratios with and without the Project was 045 ndash 189 with most values slightly less than 1 This is interpreted as indicating slight decreases in the capacity of the study area to support biomass and production with the Project for many functional groups28 (Figure 2)
24 PMV Response 2016-03-02 p 80 lines 1524-1527 25 PMV Response 2016-03-02 p 81 lines 1551-1559 26 PMV Response 2016-03-02 p 82 Table 8 27 PMV Response 2016-03-02 p 99 lines 1914-1917 28 PMV Response 2016-03-02 Appendix 218
Pacific Region Science Response Technical Review Assessing
Ecosystem Productivity Model of Roberts Bank
15
Biomass Ratio
Freq
uenc
y
04 07 10 13 16 19
05
1015
2025
30
Figure 2 Histogram of biomass ratios obtained by comparisons of model runs with and without the project (ie With Without) Values less than 1 indicate reductions in biomass with the Project compared against without the Project) Data from Appendix 218 of PMV Response 2016-03-02
352 Sensitivity and vulnerability analyses Every ecosystem model is only one possible representation of the true ecosystem defined by the modelrsquos structure and the values chosen for its many parameters The key point is how well the model represents the real system how that fit can be measured and the sensitivity of model outputs to variability in the selected parameter values The ideal model should be robust to a wide range of uncertainties in the input data and parameters This robustness is determined by performing sensitivity analyses on the model to see how it responds to variations in the input parameters and determining to which input parameters the model is most sensitive
The vulnerability parameters determine the strength of the feeding interactions between functional groups They set the level of density dependence of each functional group Higher vulnerability settings provide greater top-down (predator) control whereas lower settings provide greater bottom-up (environmental) control29 Several publications have shown that EwE models are very sensitive to the vulnerability parameters and Christensen and Walters (2000) point out that a main pitfall of EwE is that ldquopredation vulnerabilities are often underestimated lessening the modelled impacts of predationrdquo It is usual practice to tune Ecopath models including the vulnerability parameters to time series data such as biomass using the temporal simulation model Ecosim However these data were not available for the RBT2 area so this robust method of fitting the model and estimating vulnerability parameters was not possible Instead a vulnerability setting of 2 was used as the default value for the key model runs which is ldquocommon practice when time series data are not available and estimates of vulnerability in the
29 PMV Response 2016-03-02 p 70 lines 1318-1323
Pacific Region Science Response Technical Review Assessing
Ecosystem Productivity Model of Roberts Bank
16
model cannot be maderdquo30 with sensitivity analyses run for a range of 15 to 3 This narrow range was criticized by DFOECCC in initial discussions about the model with the Proponent The Proponent subsequently reran the model with a larger range of vulnerabilities31 (11 to 10) and concluded this broader vulnerability range produced similar results for the productivity ratio with and without the Project to those in the original EIS and that the EIS was more likely to overestimate than underestimate potential project effects32 The data in Table 7 of the PMV Response33 did indicate changes in productivity ratios ranging from 0 to 50 of the defined key run (which used a vulnerability setting of 2) However the Proponent changed all vulnerability settings to the same value ie all were 2 or all were 10 etc In reality the vulnerability parameters resulting from Ecosim models that are fitted to data as described above vary by functional group which was not explored here Therefore although the results suggest that the original choice of 2 for the default key run seemed reasonable the potential effects of variability in vulnerability settings was not fully explored
Sensitivity analyses are usually based on the range of uncertainty estimated for input data and parameters often called the confidence limits around the model parameters The EwE framework integrates many different data sources and parameters including values from the literature It can therefore be difficult to identify ldquoreasonablerdquo confidence limits when derived from such diverse data sources Standard practice in Ecopath models has been to develop a pedigree for each parameter with default values for uncertainty based on the nature of the source data For example parameter values based on high precision field observations of biomass within the model domain receive default confidence intervals of 10 whereas parameter values based on models developed for elsewhere or professional judgment receive confidence intervals of 8034 Sensitivity analyses are then run using parameter values selected from within these confidence intervals However if these default confidence intervals do not capture the full range of variability then the outputs are not informative of the variability in the lsquorealrsquo ecosystem Field observations were collected for many functional groups within the model domain in 2012 and 2013 as part of studies to support the RBT2 EIS Apparently the purpose of these observations was to document spatial variability (in part for the Ecospace model) and temporal variability (measurements at one location over time) and not to derive confidence intervals around the observations35
The reliance on the pedigree approach to derive confidence intervals for this Roberts Bank model was criticized by DFO ECCC and NRCan in discussions with the Proponent As a result the Proponent reran the model with much larger confidence intervals ranging from 30 to 100 depending on the input parameter and functional group36 The results from this new analysis using the broader confidence intervals were similar to those using the original pedigree approach The Proponent noted that ldquoWhile the production within each helliprun was very different there was little difference in the biomass ratio [with and without the Project] These results further demonstrate that even with a greater range in input values the influence of the Project on the Roberts Bank ecosystem is consistent among allhellipmodel runsrdquo37 This provides confidence that the model may be robust to uncertainty in its input parameters Two concerns
30 PMV Response 2016-03-02 p 70 lines 1321-1322 31 PMV Response 2016-03-02 p 71-74 32 PMV Response 2016-03-02 p 71 lines 1339-1341 33 PMV Response 2016-03-02 p 73 34 EIS Appendix 10-C Section 251 page 18 35 PMV Response 2016-03-02 p 42 lines 772-777 36 PMV Response 2016-03-02 p 44-47 37 PMV Response 2016-03-02 p 47 lines 855-858 and see also PMV Response 2016-03-02 Appendix 27-B
Pacific Region Science Response Technical Review Assessing
Ecosystem Productivity Model of Roberts Bank
17
remain however The quote above indicates that the production among the different model runs was very different although with little difference in the biomass ratios with and without the Project Since biomass is not the same as production it would be informative for understanding model performance and potential impacts to show these production differences This also relates to the point made in Section 34 regarding how well the model represents the real ecosystem and not just within-model comparisons with and without the Project The second question is more technical and relates to how the randomization (Monte Carlo or MC) routine that was used to create multiple model runs used the uncertainty about the diet data Diets are not currently included in the MC routine available to regular users of the Ecosim model how they were handled in this RBT2 model appears not to be explained
Finally the sensitivity analyses indicate that the uncertainty in the input parameters does not lead to much difference between model parameters with or without the project However this conclusion does not describe how the uncertainty in the input parameters affects understanding of the ecosystem
40 Conclusions Overall the main conclusion of the Environmental Impact Statement from the Proponent is stated as ldquohellipafter the implementation of mitigation hellipthe Project is not expected to result in any significant adverse effects on any of the 16 valued componentsrdquo38 In addition ldquohellipapproximately 40 of the functional groups are forecast to change no more than 5 which hellip is judged to be within the uncertainty of the model runsrdquo39 although larger changes were forecast for orange sea pens freshwater biofilm green algae and raptors The conclusions from the modelling studies are that ldquohellipthe proposed project will have an impact on the study area that the effect varies between species and that the findings are robust to parameter uncertaintyrdquo40 Specific outcomes by valued component as derived from the EwE model are presented by functional groups in Table 1
38 PMV March 2015 Roberts Bank Environmental Impact Statement Executive Summary ndash Part 1 page 37 39 EIS Appendix 10-C p ii 40 EIS Appendix 10-D p iv
Pacific Region Science Response Technical Review Assessing
Ecosystem Productivity Model of Roberts Bank
18
Table 1 Changes in productive potential with the Project as derived from the EwE model
Changes in productive potential
Ecosystem category
Number of valued
components
Number with potential
biomass loss
Moderate decrease (31-60 decline)
Minor decrease (6-30 decline)
Negligible (0-5
change)
Minor increase (6-
30 increase)
Moderate increase (31-60 increase)
Source
Marine vegetation
7 7 - 3 2 2 - EIS Vol 3 Section 11 Table 11-17 page 11-65
Marine invertebrates
4 3 1 1 1 1 - EIS Vol 3 Section 12 Table 12-8 page 12-52
Marine fish 13 13 - 2 6 5 - EIS Vol 3 Section 13 Table 13-10 page 13-95
Coastal birds
11 8 - 3 4 3 1 EIS Vol 3 Section 15 Table 15-10 page 15-67
Pacific Region Science Response Technical Review Assessing
Ecosystem Productivity Model of Roberts Bank
19
Most functional groups showed some potential biomass loss with the Project with biomass loss defined as any model run with negative outcomes (ie in which biomass with the project was less than biomass without the Project) The summary of changes in productivity potential are mixed with most (33 out of 35) valued components showing minor decreases to minor increases (defined as 6 to 30 changes in productive potential with the Project compared to without the Project)
The main conclusions of this review in regards to the Terms of Reference are
1 Do the functional groups and abiotic variables used in the model adequately represent the ecosystem at Roberts Bank
o The 58 functional groups and abiotic variables used in the model adequately represent the main components of the Roberts Bank ecosystem however for longer lived species the life stages of the species are not well represented and some of the impacts of the Project may be expected to affect specific life stages
o The abiotic variables adequately represent the physical drivers of this ecosystem on an annual time scale However annual values for these abiotic variables may not adequately capture important sub-annual events such as storms (DFO 2016) the timing of arrival and departure of highly migratory species and whether there may be important sub-annual thresholds or mismatches in timing as a result of the Project
o Biotic factors (eg nutrients) which are particularly important for biofilm and other lower trophic level taxa are not included in this model The model is therefore unable to assess the potential development of eutrophication and benthic organic enrichment events which may affect fish habitats in the study area
2 Are the parameter estimates used by the model valid and defensible for this system
o In general parameter estimates appear to be adequate for this system Field studies were done in two years to provide data in particular on distributions of selected functional groups for the Ecospace module Note the distribution studies focussed on taxa which were relatively immobile and therefore lsquofixedrsquo in space
o the selection of some model parameters would benefit from further explanation for example the choice of fixed diet matrices versus dynamic matrices which can vary with changes in abundances or predators and prey
o the selection of some model parameters would benefit from further explanation for example the link between the diets described in the text of Appendix 10B and the quantities presented in Appendix A of Appendix 10B It is understood that proportions were derived using the ldquofixed selectivityrdquo principle but in order to be fully transparent the derivation of each diet should be provided in an appendix
o discussion and explanation is needed of why ecotrophic efficiencies differ from expected values (eg the ecotrophic efficiency for Pacific herring is listed as 038) and
o the abiotic factor lsquosubstratersquo was limited to ldquohardrdquo or rdquosoftrdquo options which can be restrictive given that they serve as endpoints on a substrate composition continuum These limited options may not provide the sensitivity required to assess substrate preference nor the flexibility for taxa (eg motile organisms) that span hard mixed and soft substrate types In addition it is not clear if changes in the hardsoft categories were considered over time within identified depositional or erosional settings before and after construction
Pacific Region Science Response Technical Review Assessing
Ecosystem Productivity Model of Roberts Bank
20
3 Are the limitations and uncertainties of the model identified and appropriately considered when determining the modelrsquos representation of current and possible future conditions
o the EwE model was not designed to evaluate a range of future conditions It was designed to estimate changes in the productive potential at the ecosystem level with and without the Project Therefore the model was run without the Project and with the Project for a range of plausible abiotic conditions and the results were compared with respect to biomass and productivity by functional group
o the pedigree approach to assessing the uncertainties of model outcomes is unsatisfactory for the purpose here as it relates solely to a qualitative judgment of the value of data based on its source However when the model was rerun with much wider ranges of confidence intervals (uncertainties) the results in general (but not necessarily for each functional group) were similar to the results using the original pedigree approach This suggests that taken overall the model may be robust to wide ranges of uncertainty in these input variables and parameters
o there is inadequate validation of the model This is inadequate for three reasons
(i) the basic Ecopath model is not validated and the Ecospace balancing process (the spin-up period) resulted in some biomass estimates being increased or decreased beyond their confidence limits
(ii) the goodness of fit test used to evaluate how well the model predicted the spatial occurrence functional groups is not fit for purpose (Section 34) and
(iii) validation was provided for only a small number of functional groups (the habitat-forming functional groups) As a consequence the model is currently not validated
o Considering the proportion of open boundaries relative to closed boundaries in the model processes taking place outside the modelled ecosystem are likely to contribute to dynamics within the modelled ecosystem However these external processes may not be well-resolved by the EwE model as currently configured
4 Are the model results related to the potential effects of the Project on fish and fish habitat and migratory birds and their food resources valid and defensible
o this is a very complex ecosystem model constructed for a relatively small and open (in the sense of considerable exchange with adjacent non-modelled areas) system Many assumptions have been made based on poor or missing data Taking all these considerations into account the model does the best job possible of comparing the biomass and productivity of the Roberts Bank ecosystem with and without the Project
o the extent to which the model adequately represents the lsquorealrsquo ecosystem of Roberts Bank as opposed to comparisons of model results with and without the Project is unclear as a number of basic diagnostics are not presented (see point 3 above)
o the EwE model is not capable of and is not designed to represent nutritional and food quality variations in prey functional groups and how these may impact highly migratory predators such as birds with and without the Project
5 Is the EwE model framework a valid method to quantify large scale impacts to fish habitat fish productivity and migratory bird productivity
o the EwE model as implemented in this project and reviewed here is a useful first-order framework to organise information and derive initial estimates of how the system may respond to perturbations
Pacific Region Science Response Technical Review Assessing
Ecosystem Productivity Model of Roberts Bank
21
o the utility of a EWE model for impact purposes is highly dependent on the quality of input data
o each EwE model is highly dependent on local conditions Although appropriate as an overall methodology each application would need to be reviewed for how it may be applied to any new ecosystem and
o the EwE model would need to be substantially reformulated if it was to include considerations of changes in chemical composition or food quality of prey in particular for seasonal migratory species such as birds which may depend on very large biomasses of prey with specific chemical composition to fuel their migrations beyond the ecosystem model boundaries
Contributors Contributor Affiliation Ian Perry Author DFO Science Pacific Region Alida Bundy Author DFO Science Maritimes Region Terri Sutherland Author DFO Science Pacific Region Robert Elner Author ECCC Canadian Wildlife Service Andrew Robinson Author ECCC Canadian Wildlife Service Lesley MacDougall Editor DFO Science Pacific Region
Approved by Carmel Lowe
Regional Director Science Branch Pacific Region Fisheries and Oceans Canada
November 4 2016
Sources of Information Christensen V Coll M Steenbeek J Buszowski J Chagaris D walters CJ 2014
Representing variable habitat quality in a spatial food web model Ecosystems 17 1397-1412
Christensen V and Walters C 2000 Ecopath with Ecosim methods capabilities and limitations Ecological Modelling 172 109-139
Colleacuteter M Valls A Guitton J Gascuel D Pauly D and Christensen V 2015 Global overview of the applications of the Ecopath with Ecosim modeling approach using the EcoBase models repository Ecological Modelling 302 pp42-53
Compass Resource Management Ltd 2013 Roberts Bank Terminal 2 Technical Advisory Group (TAG) Process Report Productive Capacity ndash Final Report 119pp (Accessed November 1 2016)
DFO 2016 Technical Review of Roberts Bank Terminal 2 Environmental Assessment Section 95 ndash Coastal Geomorphology DFO Can Sci Advis Sec Sci Resp 2016045 (Accessed November 4 2016)
Pacific Region Science Response Technical Review Assessing
Ecosystem Productivity Model of Roberts Bank
22
ESSA Technologies 2014a Roberts Bank Terminal 2 Project Roberts Bank Delta BC Environmental Impact Statement Volume 3 Biophysical Effects Assessments Appendix 10-C Roberts Bank Ecosystem Model Development and Key Run Port Metro Vancouver (Accessed November 1 2016)
ESSA Technologies 2014b Roberts Bank Terminal 2 Project Roberts Bank Delta BC Environmental Impact Statement Volume 3 Biophysical Effects Assessments Appendix 10-D Roberts Bank Ecosystem Model Sensitivity Analyses Port Metro Vancouver (Accessed November 1 2016)
Franklin J 2009 Mapping Species Distributions Spatial Inference and Prediction Cambridge University Press Cambridge
Hemmera 2014 Roberts Bank Terminal 2 Project Roberts Bank Delta BC Environmental Impact Statement Volume 3 Biophysical Effects Assessments Appendix 10-B Roberts Bank Ecosystem Model Parameter Estimates Port Metro Vancouver File 302-03503 (Accessed November 1 2016)
Port Metro Vancouver 2015a Roberts Bank Terminal 2 Project Roberts Bank Delta BC Environmental Impact Statement Volume 3 Biophysical Effects Assessments Section 100 Biophysical Setting (Accessed November 1 2016)
Port Metro Vancouver 2015b Roberts Bank Terminal 2 Project Roberts Bank Delta BC Environmental Impact Statement Volume 3 Biophysical Effects Assessments Section 103 Overview of Assessing Ecosystem Productivity (Accessed November 1 2016)
Port Metro Vancouver 2015c Roberts Bank Terminal 2 Project Environmental Assessment Additional Information Requirements (July 31 2015) Responses Response to Information Request 6 IR-73115-06 Canadian Environmental Assessment Agency Reference Number 80054 dated 26 October 2015
Steenbeek J Coll M Gurney L Meacutelin F Hoepffner N Buszowski J and Christensen V 2013 Bridging the gap between ecosystem modeling tools and geographic information systems Driving a food web model with external spatialndashtemporal data Ecological Modelling 263 139ndash 151
Sutherland T Elner R and OrsquoNeill J 2013 Roberts Bank Ecological crucible of the Fraser River estuary Progress in Oceanography 115 171ndash180
Vancouver Fraser Port Authority 2016 From the Vancouver Fraser Port Authority to the Review Panel re Answers to preliminary technical questions submitted during the completeness phase from Fisheries and Oceans Canada Natural Resources Canada and Environment and Climate Change Canada concerning the ecosystem modelling to support the Roberts Bank Terminal 2 Project environmental review CEAR Document 547 (Accessed November 1 2016)
Pacific Region Science Response Technical Review Assessing
Ecosystem Productivity Model of Roberts Bank
23
This Report is Available from the Centre for Science Advice
Pacific Region Fisheries and Oceans Canada
3190 Hammond Bay Road Nanaimo BC V9T 6N7
Telephone (250) 756-7208 E-Mail csapdfo-mpogcca
Internet address wwwdfo-mpogccacsas-sccs
ISSN 1919-3769 copy Her Majesty the Queen in Right of Canada 2016
Correct Citation for this Publication
DFO 2016 Technical review of Roberts Bank Terminal 2 environmental assessment section 103 ndash assessing ecosystem productivity DFO Can Sci Advis Sec Sci Resp 2016050
Aussi disponible en franccedilais
MPO 2016 Examen technique de leacutevaluation environnementale du Terminal 2 agrave Roberts Bank section 103 ndash eacutevaluation de la productiviteacute de leacutecosystegraveme Secr can de consult sci du MPO Reacutep des Sci 2016050

Pacific Region Science Response Technical Review Assessing
Ecosystem Productivity Model of Roberts Bank
19
Most functional groups showed some potential biomass loss with the Project with biomass loss defined as any model run with negative outcomes (ie in which biomass with the project was less than biomass without the Project) The summary of changes in productivity potential are mixed with most (33 out of 35) valued components showing minor decreases to minor increases (defined as 6 to 30 changes in productive potential with the Project compared to without the Project)
The main conclusions of this review in regards to the Terms of Reference are
1 Do the functional groups and abiotic variables used in the model adequately represent the ecosystem at Roberts Bank
o The 58 functional groups and abiotic variables used in the model adequately represent the main components of the Roberts Bank ecosystem however for longer lived species the life stages of the species are not well represented and some of the impacts of the Project may be expected to affect specific life stages
o The abiotic variables adequately represent the physical drivers of this ecosystem on an annual time scale However annual values for these abiotic variables may not adequately capture important sub-annual events such as storms (DFO 2016) the timing of arrival and departure of highly migratory species and whether there may be important sub-annual thresholds or mismatches in timing as a result of the Project
o Biotic factors (eg nutrients) which are particularly important for biofilm and other lower trophic level taxa are not included in this model The model is therefore unable to assess the potential development of eutrophication and benthic organic enrichment events which may affect fish habitats in the study area
2 Are the parameter estimates used by the model valid and defensible for this system
o In general parameter estimates appear to be adequate for this system Field studies were done in two years to provide data in particular on distributions of selected functional groups for the Ecospace module Note the distribution studies focussed on taxa which were relatively immobile and therefore lsquofixedrsquo in space
o the selection of some model parameters would benefit from further explanation for example the choice of fixed diet matrices versus dynamic matrices which can vary with changes in abundances or predators and prey
o the selection of some model parameters would benefit from further explanation for example the link between the diets described in the text of Appendix 10B and the quantities presented in Appendix A of Appendix 10B It is understood that proportions were derived using the ldquofixed selectivityrdquo principle but in order to be fully transparent the derivation of each diet should be provided in an appendix
o discussion and explanation is needed of why ecotrophic efficiencies differ from expected values (eg the ecotrophic efficiency for Pacific herring is listed as 038) and
o the abiotic factor lsquosubstratersquo was limited to ldquohardrdquo or rdquosoftrdquo options which can be restrictive given that they serve as endpoints on a substrate composition continuum These limited options may not provide the sensitivity required to assess substrate preference nor the flexibility for taxa (eg motile organisms) that span hard mixed and soft substrate types In addition it is not clear if changes in the hardsoft categories were considered over time within identified depositional or erosional settings before and after construction
Pacific Region Science Response Technical Review Assessing
Ecosystem Productivity Model of Roberts Bank
20
3 Are the limitations and uncertainties of the model identified and appropriately considered when determining the modelrsquos representation of current and possible future conditions
o the EwE model was not designed to evaluate a range of future conditions It was designed to estimate changes in the productive potential at the ecosystem level with and without the Project Therefore the model was run without the Project and with the Project for a range of plausible abiotic conditions and the results were compared with respect to biomass and productivity by functional group
o the pedigree approach to assessing the uncertainties of model outcomes is unsatisfactory for the purpose here as it relates solely to a qualitative judgment of the value of data based on its source However when the model was rerun with much wider ranges of confidence intervals (uncertainties) the results in general (but not necessarily for each functional group) were similar to the results using the original pedigree approach This suggests that taken overall the model may be robust to wide ranges of uncertainty in these input variables and parameters
o there is inadequate validation of the model This is inadequate for three reasons
(i) the basic Ecopath model is not validated and the Ecospace balancing process (the spin-up period) resulted in some biomass estimates being increased or decreased beyond their confidence limits
(ii) the goodness of fit test used to evaluate how well the model predicted the spatial occurrence functional groups is not fit for purpose (Section 34) and
(iii) validation was provided for only a small number of functional groups (the habitat-forming functional groups) As a consequence the model is currently not validated
o Considering the proportion of open boundaries relative to closed boundaries in the model processes taking place outside the modelled ecosystem are likely to contribute to dynamics within the modelled ecosystem However these external processes may not be well-resolved by the EwE model as currently configured
4 Are the model results related to the potential effects of the Project on fish and fish habitat and migratory birds and their food resources valid and defensible
o this is a very complex ecosystem model constructed for a relatively small and open (in the sense of considerable exchange with adjacent non-modelled areas) system Many assumptions have been made based on poor or missing data Taking all these considerations into account the model does the best job possible of comparing the biomass and productivity of the Roberts Bank ecosystem with and without the Project
o the extent to which the model adequately represents the lsquorealrsquo ecosystem of Roberts Bank as opposed to comparisons of model results with and without the Project is unclear as a number of basic diagnostics are not presented (see point 3 above)
o the EwE model is not capable of and is not designed to represent nutritional and food quality variations in prey functional groups and how these may impact highly migratory predators such as birds with and without the Project
5 Is the EwE model framework a valid method to quantify large scale impacts to fish habitat fish productivity and migratory bird productivity
o the EwE model as implemented in this project and reviewed here is a useful first-order framework to organise information and derive initial estimates of how the system may respond to perturbations
Pacific Region Science Response Technical Review Assessing
Ecosystem Productivity Model of Roberts Bank
21
o the utility of a EWE model for impact purposes is highly dependent on the quality of input data
o each EwE model is highly dependent on local conditions Although appropriate as an overall methodology each application would need to be reviewed for how it may be applied to any new ecosystem and
o the EwE model would need to be substantially reformulated if it was to include considerations of changes in chemical composition or food quality of prey in particular for seasonal migratory species such as birds which may depend on very large biomasses of prey with specific chemical composition to fuel their migrations beyond the ecosystem model boundaries
Contributors Contributor Affiliation Ian Perry Author DFO Science Pacific Region Alida Bundy Author DFO Science Maritimes Region Terri Sutherland Author DFO Science Pacific Region Robert Elner Author ECCC Canadian Wildlife Service Andrew Robinson Author ECCC Canadian Wildlife Service Lesley MacDougall Editor DFO Science Pacific Region
Approved by Carmel Lowe
Regional Director Science Branch Pacific Region Fisheries and Oceans Canada
November 4 2016
Sources of Information Christensen V Coll M Steenbeek J Buszowski J Chagaris D walters CJ 2014
Representing variable habitat quality in a spatial food web model Ecosystems 17 1397-1412
Christensen V and Walters C 2000 Ecopath with Ecosim methods capabilities and limitations Ecological Modelling 172 109-139
Colleacuteter M Valls A Guitton J Gascuel D Pauly D and Christensen V 2015 Global overview of the applications of the Ecopath with Ecosim modeling approach using the EcoBase models repository Ecological Modelling 302 pp42-53
Compass Resource Management Ltd 2013 Roberts Bank Terminal 2 Technical Advisory Group (TAG) Process Report Productive Capacity ndash Final Report 119pp (Accessed November 1 2016)
DFO 2016 Technical Review of Roberts Bank Terminal 2 Environmental Assessment Section 95 ndash Coastal Geomorphology DFO Can Sci Advis Sec Sci Resp 2016045 (Accessed November 4 2016)
Pacific Region Science Response Technical Review Assessing
Ecosystem Productivity Model of Roberts Bank
22
ESSA Technologies 2014a Roberts Bank Terminal 2 Project Roberts Bank Delta BC Environmental Impact Statement Volume 3 Biophysical Effects Assessments Appendix 10-C Roberts Bank Ecosystem Model Development and Key Run Port Metro Vancouver (Accessed November 1 2016)
ESSA Technologies 2014b Roberts Bank Terminal 2 Project Roberts Bank Delta BC Environmental Impact Statement Volume 3 Biophysical Effects Assessments Appendix 10-D Roberts Bank Ecosystem Model Sensitivity Analyses Port Metro Vancouver (Accessed November 1 2016)
Franklin J 2009 Mapping Species Distributions Spatial Inference and Prediction Cambridge University Press Cambridge
Hemmera 2014 Roberts Bank Terminal 2 Project Roberts Bank Delta BC Environmental Impact Statement Volume 3 Biophysical Effects Assessments Appendix 10-B Roberts Bank Ecosystem Model Parameter Estimates Port Metro Vancouver File 302-03503 (Accessed November 1 2016)
Port Metro Vancouver 2015a Roberts Bank Terminal 2 Project Roberts Bank Delta BC Environmental Impact Statement Volume 3 Biophysical Effects Assessments Section 100 Biophysical Setting (Accessed November 1 2016)
Port Metro Vancouver 2015b Roberts Bank Terminal 2 Project Roberts Bank Delta BC Environmental Impact Statement Volume 3 Biophysical Effects Assessments Section 103 Overview of Assessing Ecosystem Productivity (Accessed November 1 2016)
Port Metro Vancouver 2015c Roberts Bank Terminal 2 Project Environmental Assessment Additional Information Requirements (July 31 2015) Responses Response to Information Request 6 IR-73115-06 Canadian Environmental Assessment Agency Reference Number 80054 dated 26 October 2015
Steenbeek J Coll M Gurney L Meacutelin F Hoepffner N Buszowski J and Christensen V 2013 Bridging the gap between ecosystem modeling tools and geographic information systems Driving a food web model with external spatialndashtemporal data Ecological Modelling 263 139ndash 151
Sutherland T Elner R and OrsquoNeill J 2013 Roberts Bank Ecological crucible of the Fraser River estuary Progress in Oceanography 115 171ndash180
Vancouver Fraser Port Authority 2016 From the Vancouver Fraser Port Authority to the Review Panel re Answers to preliminary technical questions submitted during the completeness phase from Fisheries and Oceans Canada Natural Resources Canada and Environment and Climate Change Canada concerning the ecosystem modelling to support the Roberts Bank Terminal 2 Project environmental review CEAR Document 547 (Accessed November 1 2016)
Pacific Region Science Response Technical Review Assessing
Ecosystem Productivity Model of Roberts Bank
23
This Report is Available from the Centre for Science Advice
Pacific Region Fisheries and Oceans Canada
3190 Hammond Bay Road Nanaimo BC V9T 6N7
Telephone (250) 756-7208 E-Mail csapdfo-mpogcca
Internet address wwwdfo-mpogccacsas-sccs
ISSN 1919-3769 copy Her Majesty the Queen in Right of Canada 2016
Correct Citation for this Publication
DFO 2016 Technical review of Roberts Bank Terminal 2 environmental assessment section 103 ndash assessing ecosystem productivity DFO Can Sci Advis Sec Sci Resp 2016050
Aussi disponible en franccedilais
MPO 2016 Examen technique de leacutevaluation environnementale du Terminal 2 agrave Roberts Bank section 103 ndash eacutevaluation de la productiviteacute de leacutecosystegraveme Secr can de consult sci du MPO Reacutep des Sci 2016050
- TECHNICAL REVIEW OF ROBERTS BANK TERMINAL 2 ENVIRONMENTAL ASSESSMENT SECTION 103 ndash ASSESSING ECOSYSTEM PRODUCTIVITY
-
- 10 Context
- 20 Background
-
- 21 Background and Terms of Reference
- 22 Approach to assessing ecosystem productivity
-
- 30 Analysis and Response
-
- 31 The EwE Team
- 32 Overview of assessment results of hydrological and sediment modelling
- 33 Model implementation
-
- 331 The purpose of the EwE model
- 332 Applicability of the EwE model framework to the Roberts Bank region
- 333 Model documentation
- 334 Highly mobile functional groups
- 335 Seasonality (model time step)
- 336 Life history structure
- 337 Model balancing
-
- 34 Model validation
- 35 Model results
-
- 351 Presentation of model results
- 352 Sensitivity and vulnerability analyses
-
- 40 Conclusions
- Contributors
- Approved by
- Sources of Information
- This Report is Available from the
-
- CSAS 2016-50 - Assessing Ecosystem Productivitypdf
-
- TECHNICAL REVIEW OF ROBERTS BANK TERMINAL 2 ENVIRONMENTAL ASSESSMENT SECTION 103 ndash ASSESSING ECOSYSTEM PRODUCTIVITY
-
- 10 Context
- 20 Background
-
- 21 Background and Terms of Reference
- 22 Approach to assessing ecosystem productivity
-
- 30 Analysis and Response
-
- 31 The EwE Team
- 32 Overview of assessment results of hydrological and sediment modelling
- 33 Model implementation
-
- 331 The purpose of the EwE model
- 332 Applicability of the EwE model framework to the Roberts Bank region
- 333 Model documentation
- 334 Highly mobile functional groups
- 335 Seasonality (model time step)
- 336 Life history structure
- 337 Model balancing
-
- 34 Model validation
- 35 Model results
-
- 351 Presentation of model results
- 352 Sensitivity and vulnerability analyses
-
- 40 Conclusions
- Contributors
- Approved by
- Sources of Information
- This Report is Available from the
-
Canadian Science Advisory Secretariat Pacific Region Science Response 2016050
December 2016
TECHNICAL REVIEW OF ROBERTS BANK TERMINAL 2 ENVIRONMENTAL ASSESSMENT SECTION 103 ndash
ASSESSING ECOSYSTEM PRODUCTIVITY
10 Context Vancouver Fraser Port Authority (VFPA) formerly Port Metro Vancouver (the Proponent) is proposing to construct and operate the Roberts Bank Terminal 2 Project (the Project) a new three-berth marine container terminal at Roberts Bank in Delta British Columbia The proposed terminal is located next to the existing Deltaport and Westshore Terminals In addition to the construction of the new terminal the Proponent has proposed to widen the north side of the existing Roberts Bank causeway from its east-end connection with the mainland to the entrance to the new terminal The existing tug basin connected to the northeast side of Deltaport Terminal is also proposed to be expanded The new marine terminal is predicted by the Proponent to process up to 260 container ship calls per year at full capacity with the assistance of two or three large berthing or escort tugs to manoeuver ships into or away from assigned berths The terminal is designed to operate 24 hours per day year-round
The Roberts Bank Terminal 2 Project is subject to an environmental assessment by a Review Panel pursuant to the Canadian Environmental Assessment Act 2012 As a federal authority in the environmental assessment for the Project Fisheries and Oceans Canada (DFO) will be asked to present information to the review panel and at public hearings in relation to its expertise on the effects of the Project on fish and fish habitat including aquatic species at risk and the adequacy of mitigation and offsetting measures and monitoring and follow-up programs proposed by the Proponent DFOrsquos Pacific Region Fisheries Protection Program (FPP) will coordinate DFOrsquos participation in the environmental assessment
The Proponent assessed future ecosystem productivity at Roberts Bank using the Ecopath with Ecosim and Ecospace (EwE) model framework The potential impacts of the Project to hydrodynamic conditions and sediment transport in the area as a result of changes in wind wave and current patterns and intensities are projected using different model frameworks A companion Science Response (DFO 2016) has been developed by DFO and Natural Resource Canada (NRCan) to review Section 95 ldquoCoastal Geomorphologyrdquo of the Environmental Impact Statement (EIS) which describes the hydrodynamic and sedimentology models that were used to evaluate the effect of the Project on water and sediment movements
Outcomes of the EwE models are incorporated into the analysis of the potential project-related effects on the ongoing productivity of commercial recreational and Aboriginal fisheries Consequently DFO FPP has requested that DFO Science Branch provide an evaluation of the Proponentrsquos characterization of project-related effects as conducted using the Ecopath with Ecosim and Ecospace (EwE) ecosystem model
Pacific Region Science Response Technical Review Assessing
Ecosystem Productivity Model of Roberts Bank
2
The objectives for this Science Response are to
1 Determine if the functional groups and abiotic factors used in the model adequately represent the ecosystem at Roberts Bank
2 Assess whether the parameter estimates used by the model are valid and defensible for this system
3 Assess whether the limitations and uncertainties of the model are identified and appropriately considered when determining the modelrsquos representation of current and possible future conditions
4 Provide advice regarding whether the model results related to the potential effects of the Project on fish and fish habitat and migratory birds and their food resources are valid and defensible
5 If possible provide advice regarding the validity of using the EwE model framework to quantify large scale impacts to fish habitat and fisheries productivity and the productivity of migratory birds
This Science Response evaluates Section 100 ldquoBiophysical Settingrdquo with a focus on Section 103 ldquoOverview of Assessing Ecosystem Productivityrdquo in the EIS as submitted by the Proponent (Port Metro Vancouver 2015) This Section and consequently this Response describes the ecosystem modelling approach that was taken to evaluate the direct and indirect effects of the footprint of the proposed terminal and widened causeway herein referred to as lsquothe Projectrsquo This ecosystem model provides outputs related to potential effects of the project on the study area at an ecosystem level including aquatic species and bird species in the Project area Evaluation of the model and its outputs therefore required expertise in both fishery aquatic species and migratory bird species Consequently this Science Response is the product of a joint review between DFO and Environment and Climate Change Canada (ECCC) Canadian Wildlife Service and Wildlife and Landscape Science to provide a complete evaluation
This Science Response Report results from the Science Response Process of July 2016 on the Technical Review of Ecopath with Ecosim and Ecospace (EwE) Ecosystem Productivity Model application to the Roberts Bank Terminal 2 Environmental Assessment
20 Background
21 Background and Terms of Reference The Projectrsquos main components have a proposed combined marine footprint area of approximately 179 km2 listed below by specific component
bull Marine Terminal 1335 km 2 including terminal (116 km 2) and dredged berth pocket and marine approach areas (0174 km 2)
bull Widened Causeway 0424 km 2
bull Expanded Tug basin 0031 km 2
Roberts Bank in the Fraser River estuary consists of complex intertidal and subtidal habitats including intertidal eelgrass beds and is an important stopover area for migrating shorebirds and productive feeding and rearing habitats for many fish and invertebrate species It also provides habitat for endangered Southern Resident Killer Whales and other marine mammals
Pacific Region Science Response Technical Review Assessing
Ecosystem Productivity Model of Roberts Bank
3
The environmental conditions at Roberts Bank are dynamic and are influenced by a variety of oceanographic and atmospheric factors including the Fraser River freshwater and sediment plume discharge diurnal tidal currents and prevailing and storm-generated wind and wave activity In addition the intercauseway region provides significant drainage from marsh and agricultural areas which have different characteristics from marine waters and which run along the ferry causeway
To provide the required science advice this Science Response focusses on Section 10 ldquoBiophysical Settingrdquo of the Environmental Impact Statement (EIS) (Port Metro Vancouver 2015a) specifically Section 103 ldquoOverview of Assessing Ecosystem Productivityrdquo (Port Metro Vancouver 2015b) and its related Appendices 10-B ldquoRoberts Bank Ecopath with Ecosim and Ecospace model parameter estimatesrdquo (Hemmera 2014) Appendix 10-C ldquoRoberts Bank Ecosystem model development and key runsrdquo(ESSA Technologies 2014a) and Appendix 10-D ldquoRoberts Bank Ecosystem model sensitivity analysesrdquo (ESSA Technologies 2014b) Additional important information was obtained from the Response to Information Request 6 (IR-73115-06 Canadian Environmental Assessment Agency Reference Number 80054 dated 26 October 2015) (Port Metro Vancouver 2015c) and the Written Responses to Coastal Geomorphology and Ecosystem Modelling Questions provided by the Proponent to DFO ECCC and NRCan on 2 March 2016 (Port Metro Vancouver (PMV) Transmittal TRE-01-RBT2-0004A subsequently referred in this Science Response as ldquoPMV Response 2016-03-02rdquo) (Vancouver Fraser Port Authority 2016)
The process followed in preparing this Science Response involved an initial review of the submitted EIS followed by an in-person meeting of the Proponent its contractors and representatives of DFO ECCC and NRCan to discuss and clarify questions arising from the initial review (Vancouver 23 November 2015) DFO and NRCan provided written questions to the Proponent based on preliminary review of the EIS on November 19 2015 ECCC also provided written questions based on its preliminary review of the EIS to the Proponent on December 1 2015 and January 20 2016 This large initial meeting was followed by smaller focussed meetings between the Proponent its contractors and DFO and NRCan on 11 December 2015 to clarify hydrology and sediment modelling questions with DFO on 8 January 2016 to clarify ecosystem modelling questions and with ECCC on 18 February 2016 to clarify questions relating to birds Written responses to all of these meetings and questions were provided by the Proponent to DFO ECCC and NRCan as the ldquoPMV Response 2016-03-02rdquo and ldquoPMV Response 2016-05-30rdquo (Vancouver Fraser Port Authority 2016) VFPArsquos answers to questions posed by DFO and NRCan regarding coastal geomorphology modelling have been posted to the Canadian Environmental Assessment Registry (CEAR)
22 Approach to assessing ecosystem productivity The Proponent adopted an ecosystem approach to evaluate the direct and indirect effects of the Project on the productivity of the Roberts Bank ecosystem A weight of evidence approach was used to assess the potential effects of the project on the productivity of the ecosystem and selected key components in the study area this approach included a spatial ecosystem simulation model (which included a habitat capacity model) a shorebird opportunity model and empirical data An important point is that any effects on the system during the construction phase or from expansion of the tug basin were excluded from this modelling process the focus instead being a comparison of modelled system productivity before and after the proposed terminal and expanded causeway is in place The chosen ecosystem simulation model was
Pacific Region Science Response Technical Review Assessing
Ecosystem Productivity Model of Roberts Bank
4
Ecopath with Ecosim and its spatial version Ecospace (collectively referred to here as the EwE framework or EwE model) This modelling approach was recommended by a prior Productive Capacity Technical Advisory Group comprised of representatives of technical experts from government agencies academia non-governmental organizations Vancouver Fraser Port Authority and its consultants (Compass 2013) convened by the Proponent and which also recommended a selection of focal species for the model The final selection of functional groups and the resulting food web that form the core of this ecosystem model are shown in Figure 1
Pacific Region Science Response Technical Review Assessing
Ecosystem Productivity Model of Roberts Bank
5
Figure 1 Ecopath with Ecosim model food web for Roberts Bank (Adapted from EIS Volume 3 Section 10 Fig 1033 on page 10-16) The groups coloured in orange represent focal groups size of symbols represents relative annual amount of biomass in the Roberts Bank study area
Pacific Region Science Response Technical Review Assessing
Ecosystem Productivity Model of Roberts Bank
6
The EwE framework is a common approach to ecosystem modelling which has been developed and expanded over the past two to three decades It currently has three main components
1 Ecopath ndash the core model which provides a mass-balance snapshot of the system
2 Ecosim ndash a module that enables simulation modelling over time
3 Ecospace ndash a module that enables simulation modelling over space
In order to make an EwE model tractable species are aggregated into functional groups based on their similar ecological characteristics (habitat and prey preferences etc) the Roberts Bank models had 58 functional groups The first step (Ecopath) was to obtain input parameters representing biomass production consumption emigration and diet for each functional group These parameters were then tuned in an iterative process until the overall production and consumption was balanced (a mass-balance approach) resulting in a model food web with estimates of energy flow between functional groups (Fig 1)
In the second step Ecosim was combined with the spatial model Ecospace The abiotic variables selected in this EIS (depth salinity bottom current wave height sediment type) were used as external forcings to the Ecospace module These abiotic variables provided the physical forcings for the simulations without and with the Project Since time series data on the functional groups of the model were not available Ecospace was run until the model reached equilibrium using various assumptions of the value of the vulnerability parameter (see Section 352) In this EIS the selected time step was annual with all variables abiotic and biotic expressed as yearly averages As used in this EIS the Ecospace module included a habitat capacity model which estimated the distribution of functional groups based on their environmental preferences for each abiotic variable (depth salinity bottom current wave height) and for substrate type (sand mud etc) The model thus allocated the spatial distribution of functional groups over the model domain based on their environmental preferences and the distributions of these abiotic variables with and without the Project The selected spatial unit size (ldquopixelrdquo) for the Ecospace model was 100 m2 In essence an Ecopath model was constructed for each pixel with particular rules governing how the functional groups interacted and moved among these spatial units The Ecospace module was run until it approached equilibrium (20 model years) to establish the spatial patterns without the Project For the lsquowith the Projectrsquo simulations the model was run for an initial 10 years and then the spatial patterns of the abiotic variables with the project were added and the model run for an additional 10 years1 The model outputs predicted changes in the productive potential of the Roberts Bank ecosystem as a comparison (ratio) with and without the Project rather than an absolute biomass that would be lost or gained as a result of the Project
1 EIS Appendix 10-C p 26
Pacific Region Science Response Technical Review Assessing
Ecosystem Productivity Model of Roberts Bank
7
30 Analysis and Response To prepare this response the following sections of the EIS additional documents were reviewed
DocumentSection Title
EIS Section 10
Including appendices 10B 10C and 10D
(Port Metro Vancouver 2015a Hemmera 2014 ESSA Technologies 2014a ESSA Technologies 2014b)
Biophysical Setting
Appendix 10-B Roberts Bank Ecosystem Model Parameter Estimates Port Metro Vancouver File 302-03503
Appendix 10-C Roberts Bank Ecosystem Model Development and Key Run Port Metro Vancouver
Appendix 10-D Roberts Bank Ecosystem Model Sensitivity Analyses Port Metro Vancouver
CEAR document 547 (Including Appendices) ldquoPMV Response 2016-03-02rdquo and ldquoPMV Response 2016-05-30rdquo
(Vancouver Fraser Port Authority 2016)
Vancouver Fraser Port Authority to the Review Panel re Answers to preliminary technical questions submitted during the completeness phase from Fisheries and Oceans Canada Natural Resources Canada and Environment and Climate Change Canada concerning the ecosystem modelling to support the Roberts Bank Terminal 2 Project environmental review
31 The EwE Team Building this ecosystem model was a complex undertaking which required knowledge of the ecosystem to be modelled how to set initial parameter values determination of reasonable ranges of these parameters how to balance the model and how to recognize when the model outputs were unrealistic These tasks became even more complex when spatial model dynamics were involved such as with Ecospace The team engaged by the Proponent to conduct this ecosystem modelling for the Roberts Bank Terminal 2 (RBT2) EIS was led by scientists at the Institute for Oceans and Fisheries located at the University of British Columbia in Vancouver These scientists are global leaders of the EwE model framework having developed much of its current implementation and who continue to lead its elaborations and extensions Construction and running of the model for this specific ecosystem was done in collaboration with ESSA Technologies of Vancouver Parameter values for the ecosystem model were obtained in part from observational studies conducted in the area by Hemmera of Burnaby BC
32 Overview of assessment results of hydrological and sediment modelling Implementation of the ldquowith the Projectrdquo simulations of the ecosystem model was done by driving the model with the abiotic variables as they were projected to be distributed with the Project footprint In the context of this EIS specifying depth salinity bottom currents wave height and sediment type conditions without the Project and changes with the Project were achieved by construction of hydrodynamical and sediment transport models The outputs from these models in combination with the identified environment preferences for the various biological groups were then used as inputs to the Ecospace model to define the spatial
Pacific Region Science Response Technical Review Assessing
Ecosystem Productivity Model of Roberts Bank
8
distributions of these functional groups The implementation of these hydrological and sediment transport models in this EIS was reviewed by DFO and NRCan (DFO 2016) This review concluded that the implementation of these models for this EIS was adequate for average winter conditions but lacking in validation for summer conditions in particular with strong freshwater flows from the Fraser River Simulations of strong storm events and their impacts on wave conditions and sediment transport were also lacking The effect of wave action and current speeds on sediment transport is non-linear such that increasing winds over short periods of time can impact sediment transport processes bottom topography and water depths beyond that determined under average model conditions Overall the review concluded that a greater range of sensitivity analyses is required to have confidence in the model outputs under lsquonon-averagersquo conditions The implication of this conclusion for the present review of the EwE model is that the full range of variability of abiotic characteristics such as bottom topography bottom current and wave heights and how they may affect relevant functional groups in the model with the Project may not be adequately represented Sensitivity analyses were provided by varying the intensity of abiotic variables and by removing abiotic variables to assess their interactive effects In general the ecosystem model outputs were robust to these sensitivity analyses with most groups varying by less than 5 Larger changes however were observed for primary producer and bird groupings and for some fish groups when various abiotic variables were omitted2
33 Model implementation 331 The purpose of the EwE model
The EwE model was intended to provide one line of evidence to assess the potential impacts of the Project on the Roberts Bank ecosystem which would then be used with other lines of evidence to make the final assessment Specifically ldquohellip the objective of the RB [Roberts Bank] model was not to provide an assessment of Project impacts for each functional group at a fine temporal scale but to estimate changes in productive potential with and without the Project at the ecosystem levelrdquo3 In addition ldquohellipthe primary objective of the RB ecosystem model is to evaluate potential changes in productivity from such abiotic factors with and without the terminal and causewayrdquo4 Results are presented for the selected functional groups no results were presented on potential changes in ecosystem structure or function
332 Applicability of the EwE model framework to the Roberts Bank region EwE models work best when the exchanges within the system being modelled are greater than the exchanges between the modelled system and the lsquooutsidersquo world In practice this means that EwE models work best for larger systems with few external exchanges In a meta-analysis of 433 Ecopath models Colleacuteter et al (2015) concluded that ldquohellipin the last two decades the range of the models area has expanded toward very large areas and the median has shifted accordingly from about 1000 km2 in 1984ndash1993 to about 100000 km2 in 1994ndash2014rdquo The section of the Roberts Bank ecosystem that is included in the EwE model was comparatively small (5468 km2) and complex It is an intertidally-dominated environment that is subject to strong seasonal influences of both freshwater and marine exchanges across relatively large seaward and shoreward boundaries
2 EIS Appendix 10-D p ii - iii 3 PMV Response 2016-03-02 p 99 lines 1914-1917 4 PMV Response 2016-03-02 p 38 lines 689-691
Pacific Region Science Response Technical Review Assessing
Ecosystem Productivity Model of Roberts Bank
9
Processes taking place outside the modelled ecosystem will contribute to dynamics within the modelled ecosystem (eg lsquooutsidersquo food supporting predators which occur in the Roberts Bank ecosystem for only part of the year predators which may feed in the Roberts Bank ecosystem but export this energy when they migrate out of the region) but which may not be well-resolved by the EwE model The Proponent justifies the spatial scale because it was specifically chosen for the questions being asked in regard to assessing productivity changes and because the relative influences of external exchanges are assumed to be identical with and without the project In addition highly mobile species with broad prey bases were assumed in the model to be partially sustained by external energy from outside the model system5 The distributions of organisms may differ however with and without the project which may affect their interactions with areas outside of the modelled system and the use of diets from outside the modelled system may not reflect the impacts of the project Further clarification of how the EwE model captures the exchanges and interactions with adjacent ecosystems are needed For example it could be argued that an ecosystem which is open to frequent exchanges of water and organic matter from beyond its boundaries might be more robust to local disturbances such as the Project
There are some inconsistencies in the information and assumptions used for some of the taxa in this ecosystem model For Dungeness Crab the justification for estimating total adult biomass (including females) from the biomass of fished males is unclear In addition it is unclear if the slower growth of female crabs once they have reached sexual maturity in comparison with male crabs has been considered The diet matrix for spiny dogfish does not represent the actual diet well in particular of euphausiids herring and shrimp and there are more recent references for biomass estimates of spiny dogfish in the study area than what was used in the EIS
Fishing mortality was not included in the model under the assumption that this would not change with or without the project While this assumption may be true the model has been parameterized by ignoring a source of mortality that will influence total production In essence fishing removes biomass from the ecosystem with the result that less biomass will be available for higher trophic levels How this may impact the ecosystem with and without the Project is unclear but it could make noticeable differences if for example there were thresholds in the feeding responses by these higher trophic level species The Ecopath model that was used is relatively unconstrained since many ecological efficiencies are low even for forage species which would be expected to be higher It is not clear how many species are exploited or the levels of exploitation but even if this does not change with the Project these mortality rates should be included in the model in order to add realistic constraints to the exploited functional groups
333 Model documentation Based on questions from DFO ECCC and NRCan following their initial review of the EIS the Proponent provided written responses dated 2 March 2016 to clarify several of the steps in the model development and implementation However several questions remain including questions about the Ecospace module Ecospace has undergone several recent developments such as the inclusion of the spatial-temporal data layer framework (Steenbeek et al 2013) the habitat capacity model (Christensen et al 2014) and the Monte Carlo analysis including the diet matrix As yet there are few published studies using these latest Ecospace developments and their documentation and justification need to be improved in the EIS
5 PMV Response 2016-03-02 p 29 lines 446 - 464
Pacific Region Science Response Technical Review Assessing
Ecosystem Productivity Model of Roberts Bank
10
Questions also remain regarding how the Monte Carlo randomization routine treated diet data The report indicates that the Monte Carlo routine randomly selected input parameters from the input ranges and that only models that were balanced were used This suggests that a high proportion of models were not balanced and therefore were not used (for example the EIS indicates that about one out of 1000 sampled input parameters was balanced6) A table showing the minimum maximum mode average and median values from the Monte Carlo runs for all the parameters would enable an evaluation of how much variation was actually sampled by the balanced model runs This is recommended in the EwE user information ie ldquoUsers should check the range of the input parameters that were actually used in the trials in the output csv file (see below)rdquo7
In addition there are several issues with the documentation of the derivation of the parameters for the functional groups Such documentation should clearly outline how the input parameter was estimated and the range of uncertainty for that parameter For example the input biomass of pinnipeds was defined as 04 t km 2 derived from estimates of 034 for Harbour seals and two estimates for Steller sea lions (012 and 014 t km 2) No explanation was provided for how the overall estimated pinniped biomass of 04 t km 2 was determined The diet of Sand Lance was described in the EIS as consisting mostly of zooplankton8 whereas the diet table for the model runs9 included 20 macrofauna 10 green algae and 10 detritus It is unclear why these additional prey were included in the diet used for the model runs
334 Highly mobile functional groups This implementation of the EwE framework included transient and migratory functional groups This is entirely appropriate and these groups cannot be excluded The approach taken in the Ecospace module was to impose a low (and conservative) dispersal rate among model spatial units (lsquopixelsrsquo) of 1 km yr-1 This may be appropriate for low mobility benthic organisms but it likely underestimates the movements of many other functional groups The effects of using higher and perhaps functional-group-specific dispersal rates was not considered The Proponents argued that higher dispersal rates would reduce impacts since species can move away from less desirable areas more quickly for completeness these runs should be done and evaluated Mobile species will also bring energy (food) captured outside the system into the modelled ecosystem This process was included in the model with the use of a diet import factor reflecting the consumption of prey outside the modelled region with the assumption that groups with high import rates were unlikely to respond to local changes on Roberts Bank10 This assumption needs justification perhaps at the functional group level for example many species of highly migratory birds and Pacific salmon use the Roberts Bank ecosystem to obtain food to continue their migrations Although this food does not compose a large fraction of their annual consumption it can be critical to enable them to continue their migrations
The EwE model is not designed to capture differences in prey quality ie differences in essential fatty acid or nutrient ratios The same species of prey may have greater or lesser nutritional value to predators depending on the conditions under which they are growing and their seasonal variations This is a particular concern with the nutritional quality of the diatom-dominated biofilm Diatomaceous biofilm is important to the highly migratory Western Sandpiper (Calidris mauri) Despite its predictive merits in relation to other ecosystem
6 EIS Appendix 10D Section 24 p5 7 EwE Help file p 151 8 EIS Appendix 10B Section 4133 p 76 9 EIS Appendix A of Appendix 10B 10 PMV Response 2016-03-02 p 28 lines 429 - 436
Pacific Region Science Response Technical Review Assessing
Ecosystem Productivity Model of Roberts Bank
11
components the EwE model is not informative with respect to understanding the potential impacts of the Project on biofilm and the Western Sandpiper While this example is specific to seabirds the potential exists for differences in the quality of biofilm to also be an issue for copepods which feed on biofilm and consequently to juvenile salmon which feed on these copepods (eg Sutherland et al 2013)
The EwE model is also not designed to predict effects of the Project on water quality although the Proponent noted that ldquoOther abiotic factors not included were deemed to be representative of variables that were already included in the modelhelliprdquo11 The Project may cause changes in physical and water quality conditions whether in isolation or in combination which may impact the productivity or nutritional quality of key prey organisms for local and migratory species which will not be captured by the model The EwE model does not assess the production of key nutrients or the implications of changes in important physical and water quality parameters to biofilm community structure and hence to important migratory birds
The model does not include biotic factors for both pelagic and benthic environments to assess the potential development of eutrophication and benthic organic enrichment events respectively Organic and redox indicators traditional measures of environmental assessments that are used to determine changes in functional group responses were included in the recent Deltaport Third environmental assessment (ie Pelagic chlorophyll dissolved nutrients Benthic sediment carbonnitrogen content redox state [sulfide concentration]) Benthic anoxic events based on organic enrichment are known to be strong drivers of community composition and exclusion regardless of substrate type In the absence of biotic factors (eg organic particulates) the model has not considered the potential for benthic organic enrichment which coincides with siltation processes within the upper tidal flats The tidal flat corner bordered by the Delta-dyke and Deltaport causeway has served as a catchment area for Fraser River silt since the development of the original Deltaport causeway (Sutherland et al 2013) The proposed position of the new terminal placed at the seaward termination of the Deltaport causeway may produce a crescent-shaped feature in the wake of the Fraser River Plume This feature may provide a more efficient silt trap that will promote benthic organic enrichment This piece of the environmental assessment seems to be missing and is important for assessing fish habitat in this area
335 Seasonality (model time step) Input data to parameterize the model were available on a range of time scales from hourly (eg physical data on salinity and water flow) to annual (eg species biomass) The Proponents indicated12 that this is a strength of the EwE model although ultimately the model was run with an annual time step with all sub-annual values being averaged to annual values This method therefore did not incorporate important seasonal processes such as winter-summer differences in salinity and storm properties and the seasonal appearances of abundances of predators and prey such as migratory salmon and birds that are much larger than the annual average For example juvenile salmon migrate from the Fraser River and onto Roberts Bank in the spring before moving into deeper waters If these spring abundances are averaged over the entire year these average abundances would be 5-10 times lower than the actual abundances during the spring (ie averaging the biomass that occurs in two months over a 12 month period) Additionally this method did not capture the intensity of processes such as growth and predation which can be focused over periods of a few weeks to a few months There may be important threshold effects at particular times and places which may be missed when using an 11 EIS Section 10 p 10-11 12 PMV Response 2016-03-02 p 86 line 1655
Pacific Region Science Response Technical Review Assessing
Ecosystem Productivity Model of Roberts Bank
12
annual time step for the model The Ecospace module has a monthly time step13 and therefore it is feasible to run this module with a sub-annual time step For example the Proponents submit14 that there are inadequate data to model the potential effects of the Project on the timing of biofilm production which could have implications for the migratory dunlin and Western Sandpiper However this could be modelled in an exploratory way to determine hypotheses about which factors could affect the timing of production of biofilm and the potential impacts on these birds These issues are of major concern to ECCC
336 Life history structure The EwE model did not separate functional groups into life history stages (stanzas) yet for many functional groups the juvenile stages can have very different life history characteristics and habitats than the adults It is unclear in the description of the model how different life history structures were considered and whether for example there were enough juveniles to produce the adults The implications of not including early life stages should be explored at least qualitatively to identify which species might have life stages that may be more vulnerable to project effects
337 Model balancing Balancing an EwE model is the process by which parameters are adjusted so that there is sufficient production for consumption requirements ie there are sufficient prey for all predators Expert opinion was used to examine parameter values and to adjust for errors or inconsistencies in logic ldquoPMV is confident that since the approach taken to balance the model was based on best practices the steps are appropriaterdquo15 Adjustments to initial parameters to ensure an ecologically-feasible model are necessary and to be expected For a few functional groups however very large changes to initial parameter estimates (which were often not based on Roberts Bank specific data) were necessary for example to transient killer whales When such initial parameters were adjusted (often by substantial amounts) by expert opinion to balance the model the confidence intervals around these adjusted parameter values were not increased to reflect this added uncertainty (see for example PMV Response 2016-03-02 p 51 lines 955-956) When expert opinion was used to make very large changes to initial parameter values broader confidence intervals about these parameters should have been applied This does not appear to have been the case and as a consequence may cause the actual uncertainty of the model outputs to be underestimated
Another example is for the pinniped group in which 50 of the diet was assumed to come from outside the model area in order to balance the model The rationale provided was ldquoThe pinnipeds caused excessive predation mortalities on numerous fish functional groups The biomass of pinnipeds was an average for the Strait of Georgia which was likely too high for Roberts Bank Therefore it was assumed that pinnipeds extracted only half of their diet from the study areardquo16 It is unclear whether the sensitivity of the model to different percentages of diet allocation was explored
As noted above (332) the Ecopath model was relatively unconstrained and few adjustments to input parameters were required to balance the model This is unusual and the low ecotrophic efficiencies of several functional groups suggest that full accounting of energy flows may not have been achieved (an ecotrophic efficiency of 1 indicates that 100 of the production of that
13 EIS Appendix 10C Section 29 p24 14 EIS Appendix 10D Appendix C p72 15 PMV Response 2016-03-02 p 49 lines 910-912 16 EIS Appendix 10C Section 261 p 20
Pacific Region Science Response Technical Review Assessing
Ecosystem Productivity Model of Roberts Bank
13
particular group is being preyed upon or removed by fishing leaving no individuals to die of old age17) An ldquoexcessrdquo of individuals dying of old age ie ecotrophic efficiencies much less than 1 suggests a potentially large biomass that is not used by the ecosystem and instead is converted to detritus
34 Model validation Model validation is the process by which the model parameters variables and outputs are compared with those from the real ecosystem to ascertain how well the model represents the ecosystem It is an essential step in providing confidence that the projections from the model in this case with and without the Project have relevance to how the real ecosystem may be expected to function with and without the Project In practice validating complex ecosystem models is difficult considering the range of assumptions that must be made when building the model the limited available data and natural variability of the ecosystem at a variety of time and space scales
Many of the standard diagnostics for the Ecopath model have not been evaluated in the EIS The Proponent appears to have assumed that once the Ecopath model was balanced then it was valid and fit for purpose The Proponent should provide all the Ecopath estimates of vital rates including mortality rates As presented questions remain For example many Ecotrophic Efficiencies (which control the transfer of biomass from prey to predators) are less than 1 even for taxa which would be expected to be close to 1 such as carnivorous zooplankton The reason for Ecotrophic Efficiencies less than 1 were not discussed or explained in the EIS
Detailed diagnostics for the Ecospace model should also be presented in order to evaluate model performance In response to criticisms by DFO ECCC and NRCan in discussions with the Proponent the latter provided the biomass of the functional groups from the Ecopath model (before Ecospace) and the Ecospace model after the spin-up period (which involved adjusting the parameters from the Ecopath model to balance the 5468 separate cells of the Ecospace model)18 The Proponents argue that ldquoIt is important to note that changes in biomass values generated during the spin-up period are identical for both with and without Project scenarios and thus do not provide information on the potential Project-related effects on productivity19 However several changes to biomass result from the Ecospace balancing process (spin-up period) This is only given brief attention by the Proponent in its response to the DFO ECCC and NRCan questions An analysis of Table 620 revealed that the biomass of 9 functional groups was larger or smaller than the widest confidence limits allowed for each group21 This requires further discussion and justification
The Proponent used a goodness of fit measure to compare spatial distributions of model outputs with field observations They indicated that ldquono other EwE models were identified which use a goodness-of-fit measure Hence the RB model is potentially the first such EwE model where a goodness of fit measure has been appliedrdquo22 The chosen goodness of fit measure is the percent correct classification (PCC) method23 This method derives a test statistic based on the proportion of locations at which predicted occurrences from the model match observed
17 EIS Appendix 10-B p 11 18 PMV Response 2016-03-02 p 65-66 Table 6 19 PMV Response 2016-03-02 p 64 lines 1205-1207 20 PMV Response 2016-03-02 p 65-66 Table 6 21 PMV Response 2016-03-02 p 45 Table 3 22 PMV Response 2016-03-02 p 78 lines 1481-1483 23 PMV Response 2016-03-02 p 78 lines 1483-1484
Pacific Region Science Response Technical Review Assessing
Ecosystem Productivity Model of Roberts Bank
14
occurrences from data and similarly with predicted and observed absences The Proponent then calculated two additional accuracy of fit measures sensitivity (the model predicts a species to occur in an area where it is known to occur in reality) and specificity (the model predicts a species does not occur in an area it is known not to occur in reality)24 This analysis concluded that the model has high predictability for functional groups such as eelgrass and sea pens with relatively static distributions but lower predictability for functional groups which are more temporally and spatially dynamic such as biofilm and green algae25
There are two problems with this approach The first is that this goodness of fit comparison was done only for habitat-forming functional groups no discussion of how well this analysis applies to mobile functional groups was provided The second problem is that this method does not take into account situations (such as occurs in this study with several groups) in which species occur at only a few locations For example ldquohellipif the test data consist of 95 absences and 5 presences and this reflects the true prevalence of the species on the landscape (a realistic scenario for a rare species) a lsquonullrsquo model that predicted absence in all cases (eg no model at all) would be correct 95 of the timehellipldquo (Franklin 2009 p 151) This latter point is important here as these habitat functional groups (biofilm brown algae native eelgrass green algae Japanese eelgrass tidal marsh biomat and orange sea pens26) appear not to occur over most of the Project area (as portrayed by the model outputs presented in the distribution figures of PMV Response 2016-03-02 Appendix 218) It is therefore important that a robust evaluation of the performance of the Ecospace module is used with preferably more than one measure
In summary the starting point for this modelling analysis matters It is not just about a comparison between results with and without the Project The model has to be considered a sufficient representation of the ecosystem The Proponent has not yet sufficiently validated the model
35 Model results 351 Presentation of model results
As noted above (Section 331) the stated objective of the Roberts Bank ecosystem model was not to provide an assessment of Project impacts for each functional group at a fine temporal scale but to estimate changes in productive potential with and without the Project at the ecosystem level27 However results were presented as comparisons by speciesfunctional group with and without the Project and not as potential changes in total ecosystem productivity The revised figures for each functional group showing distributions without the Project with the Project and their difference indicated impacts were likely to be localized with overall impacts relatively small The range of biomass ratios with and without the Project was 045 ndash 189 with most values slightly less than 1 This is interpreted as indicating slight decreases in the capacity of the study area to support biomass and production with the Project for many functional groups28 (Figure 2)
24 PMV Response 2016-03-02 p 80 lines 1524-1527 25 PMV Response 2016-03-02 p 81 lines 1551-1559 26 PMV Response 2016-03-02 p 82 Table 8 27 PMV Response 2016-03-02 p 99 lines 1914-1917 28 PMV Response 2016-03-02 Appendix 218
Pacific Region Science Response Technical Review Assessing
Ecosystem Productivity Model of Roberts Bank
15
Biomass Ratio
Freq
uenc
y
04 07 10 13 16 19
05
1015
2025
30
Figure 2 Histogram of biomass ratios obtained by comparisons of model runs with and without the project (ie With Without) Values less than 1 indicate reductions in biomass with the Project compared against without the Project) Data from Appendix 218 of PMV Response 2016-03-02
352 Sensitivity and vulnerability analyses Every ecosystem model is only one possible representation of the true ecosystem defined by the modelrsquos structure and the values chosen for its many parameters The key point is how well the model represents the real system how that fit can be measured and the sensitivity of model outputs to variability in the selected parameter values The ideal model should be robust to a wide range of uncertainties in the input data and parameters This robustness is determined by performing sensitivity analyses on the model to see how it responds to variations in the input parameters and determining to which input parameters the model is most sensitive
The vulnerability parameters determine the strength of the feeding interactions between functional groups They set the level of density dependence of each functional group Higher vulnerability settings provide greater top-down (predator) control whereas lower settings provide greater bottom-up (environmental) control29 Several publications have shown that EwE models are very sensitive to the vulnerability parameters and Christensen and Walters (2000) point out that a main pitfall of EwE is that ldquopredation vulnerabilities are often underestimated lessening the modelled impacts of predationrdquo It is usual practice to tune Ecopath models including the vulnerability parameters to time series data such as biomass using the temporal simulation model Ecosim However these data were not available for the RBT2 area so this robust method of fitting the model and estimating vulnerability parameters was not possible Instead a vulnerability setting of 2 was used as the default value for the key model runs which is ldquocommon practice when time series data are not available and estimates of vulnerability in the
29 PMV Response 2016-03-02 p 70 lines 1318-1323
Pacific Region Science Response Technical Review Assessing
Ecosystem Productivity Model of Roberts Bank
16
model cannot be maderdquo30 with sensitivity analyses run for a range of 15 to 3 This narrow range was criticized by DFOECCC in initial discussions about the model with the Proponent The Proponent subsequently reran the model with a larger range of vulnerabilities31 (11 to 10) and concluded this broader vulnerability range produced similar results for the productivity ratio with and without the Project to those in the original EIS and that the EIS was more likely to overestimate than underestimate potential project effects32 The data in Table 7 of the PMV Response33 did indicate changes in productivity ratios ranging from 0 to 50 of the defined key run (which used a vulnerability setting of 2) However the Proponent changed all vulnerability settings to the same value ie all were 2 or all were 10 etc In reality the vulnerability parameters resulting from Ecosim models that are fitted to data as described above vary by functional group which was not explored here Therefore although the results suggest that the original choice of 2 for the default key run seemed reasonable the potential effects of variability in vulnerability settings was not fully explored
Sensitivity analyses are usually based on the range of uncertainty estimated for input data and parameters often called the confidence limits around the model parameters The EwE framework integrates many different data sources and parameters including values from the literature It can therefore be difficult to identify ldquoreasonablerdquo confidence limits when derived from such diverse data sources Standard practice in Ecopath models has been to develop a pedigree for each parameter with default values for uncertainty based on the nature of the source data For example parameter values based on high precision field observations of biomass within the model domain receive default confidence intervals of 10 whereas parameter values based on models developed for elsewhere or professional judgment receive confidence intervals of 8034 Sensitivity analyses are then run using parameter values selected from within these confidence intervals However if these default confidence intervals do not capture the full range of variability then the outputs are not informative of the variability in the lsquorealrsquo ecosystem Field observations were collected for many functional groups within the model domain in 2012 and 2013 as part of studies to support the RBT2 EIS Apparently the purpose of these observations was to document spatial variability (in part for the Ecospace model) and temporal variability (measurements at one location over time) and not to derive confidence intervals around the observations35
The reliance on the pedigree approach to derive confidence intervals for this Roberts Bank model was criticized by DFO ECCC and NRCan in discussions with the Proponent As a result the Proponent reran the model with much larger confidence intervals ranging from 30 to 100 depending on the input parameter and functional group36 The results from this new analysis using the broader confidence intervals were similar to those using the original pedigree approach The Proponent noted that ldquoWhile the production within each helliprun was very different there was little difference in the biomass ratio [with and without the Project] These results further demonstrate that even with a greater range in input values the influence of the Project on the Roberts Bank ecosystem is consistent among allhellipmodel runsrdquo37 This provides confidence that the model may be robust to uncertainty in its input parameters Two concerns
30 PMV Response 2016-03-02 p 70 lines 1321-1322 31 PMV Response 2016-03-02 p 71-74 32 PMV Response 2016-03-02 p 71 lines 1339-1341 33 PMV Response 2016-03-02 p 73 34 EIS Appendix 10-C Section 251 page 18 35 PMV Response 2016-03-02 p 42 lines 772-777 36 PMV Response 2016-03-02 p 44-47 37 PMV Response 2016-03-02 p 47 lines 855-858 and see also PMV Response 2016-03-02 Appendix 27-B
Pacific Region Science Response Technical Review Assessing
Ecosystem Productivity Model of Roberts Bank
17
remain however The quote above indicates that the production among the different model runs was very different although with little difference in the biomass ratios with and without the Project Since biomass is not the same as production it would be informative for understanding model performance and potential impacts to show these production differences This also relates to the point made in Section 34 regarding how well the model represents the real ecosystem and not just within-model comparisons with and without the Project The second question is more technical and relates to how the randomization (Monte Carlo or MC) routine that was used to create multiple model runs used the uncertainty about the diet data Diets are not currently included in the MC routine available to regular users of the Ecosim model how they were handled in this RBT2 model appears not to be explained
Finally the sensitivity analyses indicate that the uncertainty in the input parameters does not lead to much difference between model parameters with or without the project However this conclusion does not describe how the uncertainty in the input parameters affects understanding of the ecosystem
40 Conclusions Overall the main conclusion of the Environmental Impact Statement from the Proponent is stated as ldquohellipafter the implementation of mitigation hellipthe Project is not expected to result in any significant adverse effects on any of the 16 valued componentsrdquo38 In addition ldquohellipapproximately 40 of the functional groups are forecast to change no more than 5 which hellip is judged to be within the uncertainty of the model runsrdquo39 although larger changes were forecast for orange sea pens freshwater biofilm green algae and raptors The conclusions from the modelling studies are that ldquohellipthe proposed project will have an impact on the study area that the effect varies between species and that the findings are robust to parameter uncertaintyrdquo40 Specific outcomes by valued component as derived from the EwE model are presented by functional groups in Table 1
38 PMV March 2015 Roberts Bank Environmental Impact Statement Executive Summary ndash Part 1 page 37 39 EIS Appendix 10-C p ii 40 EIS Appendix 10-D p iv
Pacific Region Science Response Technical Review Assessing
Ecosystem Productivity Model of Roberts Bank
18
Table 1 Changes in productive potential with the Project as derived from the EwE model
Changes in productive potential
Ecosystem category
Number of valued
components
Number with potential
biomass loss
Moderate decrease (31-60 decline)
Minor decrease (6-30 decline)
Negligible (0-5
change)
Minor increase (6-
30 increase)
Moderate increase (31-60 increase)
Source
Marine vegetation
7 7 - 3 2 2 - EIS Vol 3 Section 11 Table 11-17 page 11-65
Marine invertebrates
4 3 1 1 1 1 - EIS Vol 3 Section 12 Table 12-8 page 12-52
Marine fish 13 13 - 2 6 5 - EIS Vol 3 Section 13 Table 13-10 page 13-95
Coastal birds
11 8 - 3 4 3 1 EIS Vol 3 Section 15 Table 15-10 page 15-67
Pacific Region Science Response Technical Review Assessing
Ecosystem Productivity Model of Roberts Bank
19
Most functional groups showed some potential biomass loss with the Project with biomass loss defined as any model run with negative outcomes (ie in which biomass with the project was less than biomass without the Project) The summary of changes in productivity potential are mixed with most (33 out of 35) valued components showing minor decreases to minor increases (defined as 6 to 30 changes in productive potential with the Project compared to without the Project)
The main conclusions of this review in regards to the Terms of Reference are
1 Do the functional groups and abiotic variables used in the model adequately represent the ecosystem at Roberts Bank
o The 58 functional groups and abiotic variables used in the model adequately represent the main components of the Roberts Bank ecosystem however for longer lived species the life stages of the species are not well represented and some of the impacts of the Project may be expected to affect specific life stages
o The abiotic variables adequately represent the physical drivers of this ecosystem on an annual time scale However annual values for these abiotic variables may not adequately capture important sub-annual events such as storms (DFO 2016) the timing of arrival and departure of highly migratory species and whether there may be important sub-annual thresholds or mismatches in timing as a result of the Project
o Biotic factors (eg nutrients) which are particularly important for biofilm and other lower trophic level taxa are not included in this model The model is therefore unable to assess the potential development of eutrophication and benthic organic enrichment events which may affect fish habitats in the study area
2 Are the parameter estimates used by the model valid and defensible for this system
o In general parameter estimates appear to be adequate for this system Field studies were done in two years to provide data in particular on distributions of selected functional groups for the Ecospace module Note the distribution studies focussed on taxa which were relatively immobile and therefore lsquofixedrsquo in space
o the selection of some model parameters would benefit from further explanation for example the choice of fixed diet matrices versus dynamic matrices which can vary with changes in abundances or predators and prey
o the selection of some model parameters would benefit from further explanation for example the link between the diets described in the text of Appendix 10B and the quantities presented in Appendix A of Appendix 10B It is understood that proportions were derived using the ldquofixed selectivityrdquo principle but in order to be fully transparent the derivation of each diet should be provided in an appendix
o discussion and explanation is needed of why ecotrophic efficiencies differ from expected values (eg the ecotrophic efficiency for Pacific herring is listed as 038) and
o the abiotic factor lsquosubstratersquo was limited to ldquohardrdquo or rdquosoftrdquo options which can be restrictive given that they serve as endpoints on a substrate composition continuum These limited options may not provide the sensitivity required to assess substrate preference nor the flexibility for taxa (eg motile organisms) that span hard mixed and soft substrate types In addition it is not clear if changes in the hardsoft categories were considered over time within identified depositional or erosional settings before and after construction
Pacific Region Science Response Technical Review Assessing
Ecosystem Productivity Model of Roberts Bank
20
3 Are the limitations and uncertainties of the model identified and appropriately considered when determining the modelrsquos representation of current and possible future conditions
o the EwE model was not designed to evaluate a range of future conditions It was designed to estimate changes in the productive potential at the ecosystem level with and without the Project Therefore the model was run without the Project and with the Project for a range of plausible abiotic conditions and the results were compared with respect to biomass and productivity by functional group
o the pedigree approach to assessing the uncertainties of model outcomes is unsatisfactory for the purpose here as it relates solely to a qualitative judgment of the value of data based on its source However when the model was rerun with much wider ranges of confidence intervals (uncertainties) the results in general (but not necessarily for each functional group) were similar to the results using the original pedigree approach This suggests that taken overall the model may be robust to wide ranges of uncertainty in these input variables and parameters
o there is inadequate validation of the model This is inadequate for three reasons
(i) the basic Ecopath model is not validated and the Ecospace balancing process (the spin-up period) resulted in some biomass estimates being increased or decreased beyond their confidence limits
(ii) the goodness of fit test used to evaluate how well the model predicted the spatial occurrence functional groups is not fit for purpose (Section 34) and
(iii) validation was provided for only a small number of functional groups (the habitat-forming functional groups) As a consequence the model is currently not validated
o Considering the proportion of open boundaries relative to closed boundaries in the model processes taking place outside the modelled ecosystem are likely to contribute to dynamics within the modelled ecosystem However these external processes may not be well-resolved by the EwE model as currently configured
4 Are the model results related to the potential effects of the Project on fish and fish habitat and migratory birds and their food resources valid and defensible
o this is a very complex ecosystem model constructed for a relatively small and open (in the sense of considerable exchange with adjacent non-modelled areas) system Many assumptions have been made based on poor or missing data Taking all these considerations into account the model does the best job possible of comparing the biomass and productivity of the Roberts Bank ecosystem with and without the Project
o the extent to which the model adequately represents the lsquorealrsquo ecosystem of Roberts Bank as opposed to comparisons of model results with and without the Project is unclear as a number of basic diagnostics are not presented (see point 3 above)
o the EwE model is not capable of and is not designed to represent nutritional and food quality variations in prey functional groups and how these may impact highly migratory predators such as birds with and without the Project
5 Is the EwE model framework a valid method to quantify large scale impacts to fish habitat fish productivity and migratory bird productivity
o the EwE model as implemented in this project and reviewed here is a useful first-order framework to organise information and derive initial estimates of how the system may respond to perturbations
Pacific Region Science Response Technical Review Assessing
Ecosystem Productivity Model of Roberts Bank
21
o the utility of a EWE model for impact purposes is highly dependent on the quality of input data
o each EwE model is highly dependent on local conditions Although appropriate as an overall methodology each application would need to be reviewed for how it may be applied to any new ecosystem and
o the EwE model would need to be substantially reformulated if it was to include considerations of changes in chemical composition or food quality of prey in particular for seasonal migratory species such as birds which may depend on very large biomasses of prey with specific chemical composition to fuel their migrations beyond the ecosystem model boundaries
Contributors Contributor Affiliation Ian Perry Author DFO Science Pacific Region Alida Bundy Author DFO Science Maritimes Region Terri Sutherland Author DFO Science Pacific Region Robert Elner Author ECCC Canadian Wildlife Service Andrew Robinson Author ECCC Canadian Wildlife Service Lesley MacDougall Editor DFO Science Pacific Region
Approved by Carmel Lowe
Regional Director Science Branch Pacific Region Fisheries and Oceans Canada
November 4 2016
Sources of Information Christensen V Coll M Steenbeek J Buszowski J Chagaris D walters CJ 2014
Representing variable habitat quality in a spatial food web model Ecosystems 17 1397-1412
Christensen V and Walters C 2000 Ecopath with Ecosim methods capabilities and limitations Ecological Modelling 172 109-139
Colleacuteter M Valls A Guitton J Gascuel D Pauly D and Christensen V 2015 Global overview of the applications of the Ecopath with Ecosim modeling approach using the EcoBase models repository Ecological Modelling 302 pp42-53
Compass Resource Management Ltd 2013 Roberts Bank Terminal 2 Technical Advisory Group (TAG) Process Report Productive Capacity ndash Final Report 119pp (Accessed November 1 2016)
DFO 2016 Technical Review of Roberts Bank Terminal 2 Environmental Assessment Section 95 ndash Coastal Geomorphology DFO Can Sci Advis Sec Sci Resp 2016045 (Accessed November 4 2016)
Pacific Region Science Response Technical Review Assessing
Ecosystem Productivity Model of Roberts Bank
22
ESSA Technologies 2014a Roberts Bank Terminal 2 Project Roberts Bank Delta BC Environmental Impact Statement Volume 3 Biophysical Effects Assessments Appendix 10-C Roberts Bank Ecosystem Model Development and Key Run Port Metro Vancouver (Accessed November 1 2016)
ESSA Technologies 2014b Roberts Bank Terminal 2 Project Roberts Bank Delta BC Environmental Impact Statement Volume 3 Biophysical Effects Assessments Appendix 10-D Roberts Bank Ecosystem Model Sensitivity Analyses Port Metro Vancouver (Accessed November 1 2016)
Franklin J 2009 Mapping Species Distributions Spatial Inference and Prediction Cambridge University Press Cambridge
Hemmera 2014 Roberts Bank Terminal 2 Project Roberts Bank Delta BC Environmental Impact Statement Volume 3 Biophysical Effects Assessments Appendix 10-B Roberts Bank Ecosystem Model Parameter Estimates Port Metro Vancouver File 302-03503 (Accessed November 1 2016)
Port Metro Vancouver 2015a Roberts Bank Terminal 2 Project Roberts Bank Delta BC Environmental Impact Statement Volume 3 Biophysical Effects Assessments Section 100 Biophysical Setting (Accessed November 1 2016)
Port Metro Vancouver 2015b Roberts Bank Terminal 2 Project Roberts Bank Delta BC Environmental Impact Statement Volume 3 Biophysical Effects Assessments Section 103 Overview of Assessing Ecosystem Productivity (Accessed November 1 2016)
Port Metro Vancouver 2015c Roberts Bank Terminal 2 Project Environmental Assessment Additional Information Requirements (July 31 2015) Responses Response to Information Request 6 IR-73115-06 Canadian Environmental Assessment Agency Reference Number 80054 dated 26 October 2015
Steenbeek J Coll M Gurney L Meacutelin F Hoepffner N Buszowski J and Christensen V 2013 Bridging the gap between ecosystem modeling tools and geographic information systems Driving a food web model with external spatialndashtemporal data Ecological Modelling 263 139ndash 151
Sutherland T Elner R and OrsquoNeill J 2013 Roberts Bank Ecological crucible of the Fraser River estuary Progress in Oceanography 115 171ndash180
Vancouver Fraser Port Authority 2016 From the Vancouver Fraser Port Authority to the Review Panel re Answers to preliminary technical questions submitted during the completeness phase from Fisheries and Oceans Canada Natural Resources Canada and Environment and Climate Change Canada concerning the ecosystem modelling to support the Roberts Bank Terminal 2 Project environmental review CEAR Document 547 (Accessed November 1 2016)
Pacific Region Science Response Technical Review Assessing
Ecosystem Productivity Model of Roberts Bank
23
This Report is Available from the Centre for Science Advice
Pacific Region Fisheries and Oceans Canada
3190 Hammond Bay Road Nanaimo BC V9T 6N7
Telephone (250) 756-7208 E-Mail csapdfo-mpogcca
Internet address wwwdfo-mpogccacsas-sccs
ISSN 1919-3769 copy Her Majesty the Queen in Right of Canada 2016
Correct Citation for this Publication
DFO 2016 Technical review of Roberts Bank Terminal 2 environmental assessment section 103 ndash assessing ecosystem productivity DFO Can Sci Advis Sec Sci Resp 2016050
Aussi disponible en franccedilais
MPO 2016 Examen technique de leacutevaluation environnementale du Terminal 2 agrave Roberts Bank section 103 ndash eacutevaluation de la productiviteacute de leacutecosystegraveme Secr can de consult sci du MPO Reacutep des Sci 2016050
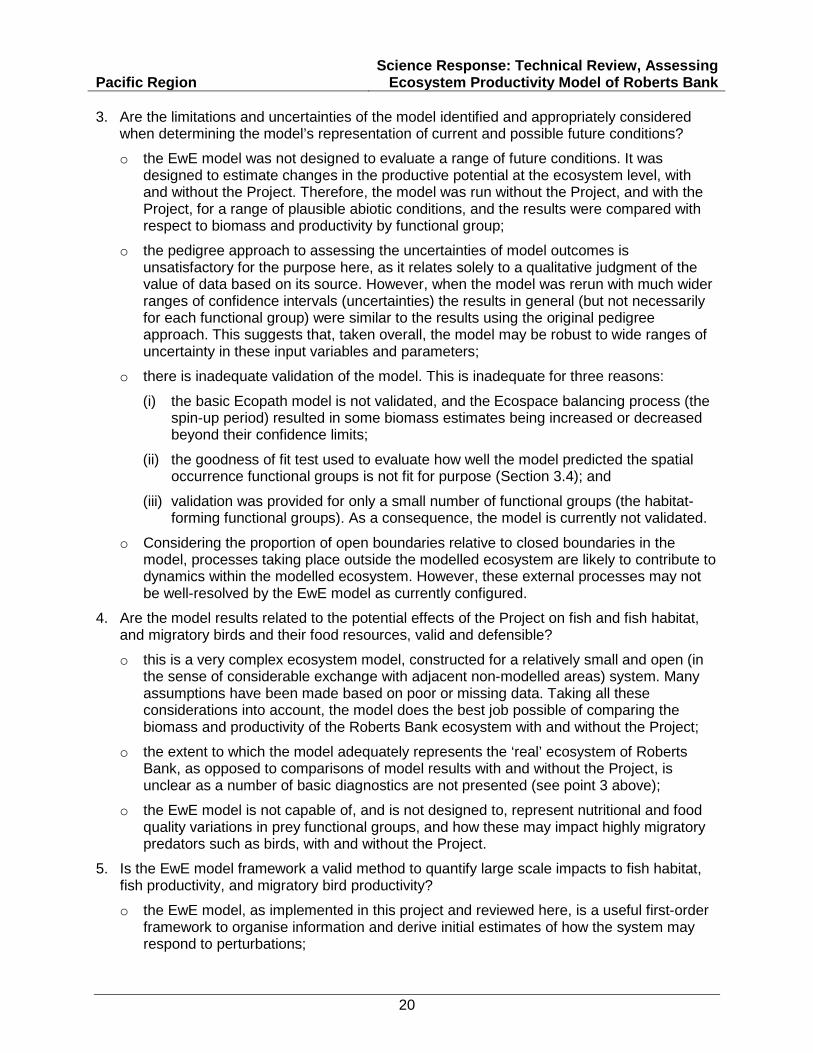
Pacific Region Science Response Technical Review Assessing
Ecosystem Productivity Model of Roberts Bank
20
3 Are the limitations and uncertainties of the model identified and appropriately considered when determining the modelrsquos representation of current and possible future conditions
o the EwE model was not designed to evaluate a range of future conditions It was designed to estimate changes in the productive potential at the ecosystem level with and without the Project Therefore the model was run without the Project and with the Project for a range of plausible abiotic conditions and the results were compared with respect to biomass and productivity by functional group
o the pedigree approach to assessing the uncertainties of model outcomes is unsatisfactory for the purpose here as it relates solely to a qualitative judgment of the value of data based on its source However when the model was rerun with much wider ranges of confidence intervals (uncertainties) the results in general (but not necessarily for each functional group) were similar to the results using the original pedigree approach This suggests that taken overall the model may be robust to wide ranges of uncertainty in these input variables and parameters
o there is inadequate validation of the model This is inadequate for three reasons
(i) the basic Ecopath model is not validated and the Ecospace balancing process (the spin-up period) resulted in some biomass estimates being increased or decreased beyond their confidence limits
(ii) the goodness of fit test used to evaluate how well the model predicted the spatial occurrence functional groups is not fit for purpose (Section 34) and
(iii) validation was provided for only a small number of functional groups (the habitat-forming functional groups) As a consequence the model is currently not validated
o Considering the proportion of open boundaries relative to closed boundaries in the model processes taking place outside the modelled ecosystem are likely to contribute to dynamics within the modelled ecosystem However these external processes may not be well-resolved by the EwE model as currently configured
4 Are the model results related to the potential effects of the Project on fish and fish habitat and migratory birds and their food resources valid and defensible
o this is a very complex ecosystem model constructed for a relatively small and open (in the sense of considerable exchange with adjacent non-modelled areas) system Many assumptions have been made based on poor or missing data Taking all these considerations into account the model does the best job possible of comparing the biomass and productivity of the Roberts Bank ecosystem with and without the Project
o the extent to which the model adequately represents the lsquorealrsquo ecosystem of Roberts Bank as opposed to comparisons of model results with and without the Project is unclear as a number of basic diagnostics are not presented (see point 3 above)
o the EwE model is not capable of and is not designed to represent nutritional and food quality variations in prey functional groups and how these may impact highly migratory predators such as birds with and without the Project
5 Is the EwE model framework a valid method to quantify large scale impacts to fish habitat fish productivity and migratory bird productivity
o the EwE model as implemented in this project and reviewed here is a useful first-order framework to organise information and derive initial estimates of how the system may respond to perturbations
Pacific Region Science Response Technical Review Assessing
Ecosystem Productivity Model of Roberts Bank
21
o the utility of a EWE model for impact purposes is highly dependent on the quality of input data
o each EwE model is highly dependent on local conditions Although appropriate as an overall methodology each application would need to be reviewed for how it may be applied to any new ecosystem and
o the EwE model would need to be substantially reformulated if it was to include considerations of changes in chemical composition or food quality of prey in particular for seasonal migratory species such as birds which may depend on very large biomasses of prey with specific chemical composition to fuel their migrations beyond the ecosystem model boundaries
Contributors Contributor Affiliation Ian Perry Author DFO Science Pacific Region Alida Bundy Author DFO Science Maritimes Region Terri Sutherland Author DFO Science Pacific Region Robert Elner Author ECCC Canadian Wildlife Service Andrew Robinson Author ECCC Canadian Wildlife Service Lesley MacDougall Editor DFO Science Pacific Region
Approved by Carmel Lowe
Regional Director Science Branch Pacific Region Fisheries and Oceans Canada
November 4 2016
Sources of Information Christensen V Coll M Steenbeek J Buszowski J Chagaris D walters CJ 2014
Representing variable habitat quality in a spatial food web model Ecosystems 17 1397-1412
Christensen V and Walters C 2000 Ecopath with Ecosim methods capabilities and limitations Ecological Modelling 172 109-139
Colleacuteter M Valls A Guitton J Gascuel D Pauly D and Christensen V 2015 Global overview of the applications of the Ecopath with Ecosim modeling approach using the EcoBase models repository Ecological Modelling 302 pp42-53
Compass Resource Management Ltd 2013 Roberts Bank Terminal 2 Technical Advisory Group (TAG) Process Report Productive Capacity ndash Final Report 119pp (Accessed November 1 2016)
DFO 2016 Technical Review of Roberts Bank Terminal 2 Environmental Assessment Section 95 ndash Coastal Geomorphology DFO Can Sci Advis Sec Sci Resp 2016045 (Accessed November 4 2016)
Pacific Region Science Response Technical Review Assessing
Ecosystem Productivity Model of Roberts Bank
22
ESSA Technologies 2014a Roberts Bank Terminal 2 Project Roberts Bank Delta BC Environmental Impact Statement Volume 3 Biophysical Effects Assessments Appendix 10-C Roberts Bank Ecosystem Model Development and Key Run Port Metro Vancouver (Accessed November 1 2016)
ESSA Technologies 2014b Roberts Bank Terminal 2 Project Roberts Bank Delta BC Environmental Impact Statement Volume 3 Biophysical Effects Assessments Appendix 10-D Roberts Bank Ecosystem Model Sensitivity Analyses Port Metro Vancouver (Accessed November 1 2016)
Franklin J 2009 Mapping Species Distributions Spatial Inference and Prediction Cambridge University Press Cambridge
Hemmera 2014 Roberts Bank Terminal 2 Project Roberts Bank Delta BC Environmental Impact Statement Volume 3 Biophysical Effects Assessments Appendix 10-B Roberts Bank Ecosystem Model Parameter Estimates Port Metro Vancouver File 302-03503 (Accessed November 1 2016)
Port Metro Vancouver 2015a Roberts Bank Terminal 2 Project Roberts Bank Delta BC Environmental Impact Statement Volume 3 Biophysical Effects Assessments Section 100 Biophysical Setting (Accessed November 1 2016)
Port Metro Vancouver 2015b Roberts Bank Terminal 2 Project Roberts Bank Delta BC Environmental Impact Statement Volume 3 Biophysical Effects Assessments Section 103 Overview of Assessing Ecosystem Productivity (Accessed November 1 2016)
Port Metro Vancouver 2015c Roberts Bank Terminal 2 Project Environmental Assessment Additional Information Requirements (July 31 2015) Responses Response to Information Request 6 IR-73115-06 Canadian Environmental Assessment Agency Reference Number 80054 dated 26 October 2015
Steenbeek J Coll M Gurney L Meacutelin F Hoepffner N Buszowski J and Christensen V 2013 Bridging the gap between ecosystem modeling tools and geographic information systems Driving a food web model with external spatialndashtemporal data Ecological Modelling 263 139ndash 151
Sutherland T Elner R and OrsquoNeill J 2013 Roberts Bank Ecological crucible of the Fraser River estuary Progress in Oceanography 115 171ndash180
Vancouver Fraser Port Authority 2016 From the Vancouver Fraser Port Authority to the Review Panel re Answers to preliminary technical questions submitted during the completeness phase from Fisheries and Oceans Canada Natural Resources Canada and Environment and Climate Change Canada concerning the ecosystem modelling to support the Roberts Bank Terminal 2 Project environmental review CEAR Document 547 (Accessed November 1 2016)
Pacific Region Science Response Technical Review Assessing
Ecosystem Productivity Model of Roberts Bank
23
This Report is Available from the Centre for Science Advice
Pacific Region Fisheries and Oceans Canada
3190 Hammond Bay Road Nanaimo BC V9T 6N7
Telephone (250) 756-7208 E-Mail csapdfo-mpogcca
Internet address wwwdfo-mpogccacsas-sccs
ISSN 1919-3769 copy Her Majesty the Queen in Right of Canada 2016
Correct Citation for this Publication
DFO 2016 Technical review of Roberts Bank Terminal 2 environmental assessment section 103 ndash assessing ecosystem productivity DFO Can Sci Advis Sec Sci Resp 2016050
Aussi disponible en franccedilais
MPO 2016 Examen technique de leacutevaluation environnementale du Terminal 2 agrave Roberts Bank section 103 ndash eacutevaluation de la productiviteacute de leacutecosystegraveme Secr can de consult sci du MPO Reacutep des Sci 2016050
- TECHNICAL REVIEW OF ROBERTS BANK TERMINAL 2 ENVIRONMENTAL ASSESSMENT SECTION 103 ndash ASSESSING ECOSYSTEM PRODUCTIVITY
-
- 10 Context
- 20 Background
-
- 21 Background and Terms of Reference
- 22 Approach to assessing ecosystem productivity
-
- 30 Analysis and Response
-
- 31 The EwE Team
- 32 Overview of assessment results of hydrological and sediment modelling
- 33 Model implementation
-
- 331 The purpose of the EwE model
- 332 Applicability of the EwE model framework to the Roberts Bank region
- 333 Model documentation
- 334 Highly mobile functional groups
- 335 Seasonality (model time step)
- 336 Life history structure
- 337 Model balancing
-
- 34 Model validation
- 35 Model results
-
- 351 Presentation of model results
- 352 Sensitivity and vulnerability analyses
-
- 40 Conclusions
- Contributors
- Approved by
- Sources of Information
- This Report is Available from the
-
- CSAS 2016-50 - Assessing Ecosystem Productivitypdf
-
- TECHNICAL REVIEW OF ROBERTS BANK TERMINAL 2 ENVIRONMENTAL ASSESSMENT SECTION 103 ndash ASSESSING ECOSYSTEM PRODUCTIVITY
-
- 10 Context
- 20 Background
-
- 21 Background and Terms of Reference
- 22 Approach to assessing ecosystem productivity
-
- 30 Analysis and Response
-
- 31 The EwE Team
- 32 Overview of assessment results of hydrological and sediment modelling
- 33 Model implementation
-
- 331 The purpose of the EwE model
- 332 Applicability of the EwE model framework to the Roberts Bank region
- 333 Model documentation
- 334 Highly mobile functional groups
- 335 Seasonality (model time step)
- 336 Life history structure
- 337 Model balancing
-
- 34 Model validation
- 35 Model results
-
- 351 Presentation of model results
- 352 Sensitivity and vulnerability analyses
-
- 40 Conclusions
- Contributors
- Approved by
- Sources of Information
- This Report is Available from the
-
Canadian Science Advisory Secretariat Pacific Region Science Response 2016050
December 2016
TECHNICAL REVIEW OF ROBERTS BANK TERMINAL 2 ENVIRONMENTAL ASSESSMENT SECTION 103 ndash
ASSESSING ECOSYSTEM PRODUCTIVITY
10 Context Vancouver Fraser Port Authority (VFPA) formerly Port Metro Vancouver (the Proponent) is proposing to construct and operate the Roberts Bank Terminal 2 Project (the Project) a new three-berth marine container terminal at Roberts Bank in Delta British Columbia The proposed terminal is located next to the existing Deltaport and Westshore Terminals In addition to the construction of the new terminal the Proponent has proposed to widen the north side of the existing Roberts Bank causeway from its east-end connection with the mainland to the entrance to the new terminal The existing tug basin connected to the northeast side of Deltaport Terminal is also proposed to be expanded The new marine terminal is predicted by the Proponent to process up to 260 container ship calls per year at full capacity with the assistance of two or three large berthing or escort tugs to manoeuver ships into or away from assigned berths The terminal is designed to operate 24 hours per day year-round
The Roberts Bank Terminal 2 Project is subject to an environmental assessment by a Review Panel pursuant to the Canadian Environmental Assessment Act 2012 As a federal authority in the environmental assessment for the Project Fisheries and Oceans Canada (DFO) will be asked to present information to the review panel and at public hearings in relation to its expertise on the effects of the Project on fish and fish habitat including aquatic species at risk and the adequacy of mitigation and offsetting measures and monitoring and follow-up programs proposed by the Proponent DFOrsquos Pacific Region Fisheries Protection Program (FPP) will coordinate DFOrsquos participation in the environmental assessment
The Proponent assessed future ecosystem productivity at Roberts Bank using the Ecopath with Ecosim and Ecospace (EwE) model framework The potential impacts of the Project to hydrodynamic conditions and sediment transport in the area as a result of changes in wind wave and current patterns and intensities are projected using different model frameworks A companion Science Response (DFO 2016) has been developed by DFO and Natural Resource Canada (NRCan) to review Section 95 ldquoCoastal Geomorphologyrdquo of the Environmental Impact Statement (EIS) which describes the hydrodynamic and sedimentology models that were used to evaluate the effect of the Project on water and sediment movements
Outcomes of the EwE models are incorporated into the analysis of the potential project-related effects on the ongoing productivity of commercial recreational and Aboriginal fisheries Consequently DFO FPP has requested that DFO Science Branch provide an evaluation of the Proponentrsquos characterization of project-related effects as conducted using the Ecopath with Ecosim and Ecospace (EwE) ecosystem model
Pacific Region Science Response Technical Review Assessing
Ecosystem Productivity Model of Roberts Bank
2
The objectives for this Science Response are to
1 Determine if the functional groups and abiotic factors used in the model adequately represent the ecosystem at Roberts Bank
2 Assess whether the parameter estimates used by the model are valid and defensible for this system
3 Assess whether the limitations and uncertainties of the model are identified and appropriately considered when determining the modelrsquos representation of current and possible future conditions
4 Provide advice regarding whether the model results related to the potential effects of the Project on fish and fish habitat and migratory birds and their food resources are valid and defensible
5 If possible provide advice regarding the validity of using the EwE model framework to quantify large scale impacts to fish habitat and fisheries productivity and the productivity of migratory birds
This Science Response evaluates Section 100 ldquoBiophysical Settingrdquo with a focus on Section 103 ldquoOverview of Assessing Ecosystem Productivityrdquo in the EIS as submitted by the Proponent (Port Metro Vancouver 2015) This Section and consequently this Response describes the ecosystem modelling approach that was taken to evaluate the direct and indirect effects of the footprint of the proposed terminal and widened causeway herein referred to as lsquothe Projectrsquo This ecosystem model provides outputs related to potential effects of the project on the study area at an ecosystem level including aquatic species and bird species in the Project area Evaluation of the model and its outputs therefore required expertise in both fishery aquatic species and migratory bird species Consequently this Science Response is the product of a joint review between DFO and Environment and Climate Change Canada (ECCC) Canadian Wildlife Service and Wildlife and Landscape Science to provide a complete evaluation
This Science Response Report results from the Science Response Process of July 2016 on the Technical Review of Ecopath with Ecosim and Ecospace (EwE) Ecosystem Productivity Model application to the Roberts Bank Terminal 2 Environmental Assessment
20 Background
21 Background and Terms of Reference The Projectrsquos main components have a proposed combined marine footprint area of approximately 179 km2 listed below by specific component
bull Marine Terminal 1335 km 2 including terminal (116 km 2) and dredged berth pocket and marine approach areas (0174 km 2)
bull Widened Causeway 0424 km 2
bull Expanded Tug basin 0031 km 2
Roberts Bank in the Fraser River estuary consists of complex intertidal and subtidal habitats including intertidal eelgrass beds and is an important stopover area for migrating shorebirds and productive feeding and rearing habitats for many fish and invertebrate species It also provides habitat for endangered Southern Resident Killer Whales and other marine mammals
Pacific Region Science Response Technical Review Assessing
Ecosystem Productivity Model of Roberts Bank
3
The environmental conditions at Roberts Bank are dynamic and are influenced by a variety of oceanographic and atmospheric factors including the Fraser River freshwater and sediment plume discharge diurnal tidal currents and prevailing and storm-generated wind and wave activity In addition the intercauseway region provides significant drainage from marsh and agricultural areas which have different characteristics from marine waters and which run along the ferry causeway
To provide the required science advice this Science Response focusses on Section 10 ldquoBiophysical Settingrdquo of the Environmental Impact Statement (EIS) (Port Metro Vancouver 2015a) specifically Section 103 ldquoOverview of Assessing Ecosystem Productivityrdquo (Port Metro Vancouver 2015b) and its related Appendices 10-B ldquoRoberts Bank Ecopath with Ecosim and Ecospace model parameter estimatesrdquo (Hemmera 2014) Appendix 10-C ldquoRoberts Bank Ecosystem model development and key runsrdquo(ESSA Technologies 2014a) and Appendix 10-D ldquoRoberts Bank Ecosystem model sensitivity analysesrdquo (ESSA Technologies 2014b) Additional important information was obtained from the Response to Information Request 6 (IR-73115-06 Canadian Environmental Assessment Agency Reference Number 80054 dated 26 October 2015) (Port Metro Vancouver 2015c) and the Written Responses to Coastal Geomorphology and Ecosystem Modelling Questions provided by the Proponent to DFO ECCC and NRCan on 2 March 2016 (Port Metro Vancouver (PMV) Transmittal TRE-01-RBT2-0004A subsequently referred in this Science Response as ldquoPMV Response 2016-03-02rdquo) (Vancouver Fraser Port Authority 2016)
The process followed in preparing this Science Response involved an initial review of the submitted EIS followed by an in-person meeting of the Proponent its contractors and representatives of DFO ECCC and NRCan to discuss and clarify questions arising from the initial review (Vancouver 23 November 2015) DFO and NRCan provided written questions to the Proponent based on preliminary review of the EIS on November 19 2015 ECCC also provided written questions based on its preliminary review of the EIS to the Proponent on December 1 2015 and January 20 2016 This large initial meeting was followed by smaller focussed meetings between the Proponent its contractors and DFO and NRCan on 11 December 2015 to clarify hydrology and sediment modelling questions with DFO on 8 January 2016 to clarify ecosystem modelling questions and with ECCC on 18 February 2016 to clarify questions relating to birds Written responses to all of these meetings and questions were provided by the Proponent to DFO ECCC and NRCan as the ldquoPMV Response 2016-03-02rdquo and ldquoPMV Response 2016-05-30rdquo (Vancouver Fraser Port Authority 2016) VFPArsquos answers to questions posed by DFO and NRCan regarding coastal geomorphology modelling have been posted to the Canadian Environmental Assessment Registry (CEAR)
22 Approach to assessing ecosystem productivity The Proponent adopted an ecosystem approach to evaluate the direct and indirect effects of the Project on the productivity of the Roberts Bank ecosystem A weight of evidence approach was used to assess the potential effects of the project on the productivity of the ecosystem and selected key components in the study area this approach included a spatial ecosystem simulation model (which included a habitat capacity model) a shorebird opportunity model and empirical data An important point is that any effects on the system during the construction phase or from expansion of the tug basin were excluded from this modelling process the focus instead being a comparison of modelled system productivity before and after the proposed terminal and expanded causeway is in place The chosen ecosystem simulation model was
Pacific Region Science Response Technical Review Assessing
Ecosystem Productivity Model of Roberts Bank
4
Ecopath with Ecosim and its spatial version Ecospace (collectively referred to here as the EwE framework or EwE model) This modelling approach was recommended by a prior Productive Capacity Technical Advisory Group comprised of representatives of technical experts from government agencies academia non-governmental organizations Vancouver Fraser Port Authority and its consultants (Compass 2013) convened by the Proponent and which also recommended a selection of focal species for the model The final selection of functional groups and the resulting food web that form the core of this ecosystem model are shown in Figure 1
Pacific Region Science Response Technical Review Assessing
Ecosystem Productivity Model of Roberts Bank
5
Figure 1 Ecopath with Ecosim model food web for Roberts Bank (Adapted from EIS Volume 3 Section 10 Fig 1033 on page 10-16) The groups coloured in orange represent focal groups size of symbols represents relative annual amount of biomass in the Roberts Bank study area
Pacific Region Science Response Technical Review Assessing
Ecosystem Productivity Model of Roberts Bank
6
The EwE framework is a common approach to ecosystem modelling which has been developed and expanded over the past two to three decades It currently has three main components
1 Ecopath ndash the core model which provides a mass-balance snapshot of the system
2 Ecosim ndash a module that enables simulation modelling over time
3 Ecospace ndash a module that enables simulation modelling over space
In order to make an EwE model tractable species are aggregated into functional groups based on their similar ecological characteristics (habitat and prey preferences etc) the Roberts Bank models had 58 functional groups The first step (Ecopath) was to obtain input parameters representing biomass production consumption emigration and diet for each functional group These parameters were then tuned in an iterative process until the overall production and consumption was balanced (a mass-balance approach) resulting in a model food web with estimates of energy flow between functional groups (Fig 1)
In the second step Ecosim was combined with the spatial model Ecospace The abiotic variables selected in this EIS (depth salinity bottom current wave height sediment type) were used as external forcings to the Ecospace module These abiotic variables provided the physical forcings for the simulations without and with the Project Since time series data on the functional groups of the model were not available Ecospace was run until the model reached equilibrium using various assumptions of the value of the vulnerability parameter (see Section 352) In this EIS the selected time step was annual with all variables abiotic and biotic expressed as yearly averages As used in this EIS the Ecospace module included a habitat capacity model which estimated the distribution of functional groups based on their environmental preferences for each abiotic variable (depth salinity bottom current wave height) and for substrate type (sand mud etc) The model thus allocated the spatial distribution of functional groups over the model domain based on their environmental preferences and the distributions of these abiotic variables with and without the Project The selected spatial unit size (ldquopixelrdquo) for the Ecospace model was 100 m2 In essence an Ecopath model was constructed for each pixel with particular rules governing how the functional groups interacted and moved among these spatial units The Ecospace module was run until it approached equilibrium (20 model years) to establish the spatial patterns without the Project For the lsquowith the Projectrsquo simulations the model was run for an initial 10 years and then the spatial patterns of the abiotic variables with the project were added and the model run for an additional 10 years1 The model outputs predicted changes in the productive potential of the Roberts Bank ecosystem as a comparison (ratio) with and without the Project rather than an absolute biomass that would be lost or gained as a result of the Project
1 EIS Appendix 10-C p 26
Pacific Region Science Response Technical Review Assessing
Ecosystem Productivity Model of Roberts Bank
7
30 Analysis and Response To prepare this response the following sections of the EIS additional documents were reviewed
DocumentSection Title
EIS Section 10
Including appendices 10B 10C and 10D
(Port Metro Vancouver 2015a Hemmera 2014 ESSA Technologies 2014a ESSA Technologies 2014b)
Biophysical Setting
Appendix 10-B Roberts Bank Ecosystem Model Parameter Estimates Port Metro Vancouver File 302-03503
Appendix 10-C Roberts Bank Ecosystem Model Development and Key Run Port Metro Vancouver
Appendix 10-D Roberts Bank Ecosystem Model Sensitivity Analyses Port Metro Vancouver
CEAR document 547 (Including Appendices) ldquoPMV Response 2016-03-02rdquo and ldquoPMV Response 2016-05-30rdquo
(Vancouver Fraser Port Authority 2016)
Vancouver Fraser Port Authority to the Review Panel re Answers to preliminary technical questions submitted during the completeness phase from Fisheries and Oceans Canada Natural Resources Canada and Environment and Climate Change Canada concerning the ecosystem modelling to support the Roberts Bank Terminal 2 Project environmental review
31 The EwE Team Building this ecosystem model was a complex undertaking which required knowledge of the ecosystem to be modelled how to set initial parameter values determination of reasonable ranges of these parameters how to balance the model and how to recognize when the model outputs were unrealistic These tasks became even more complex when spatial model dynamics were involved such as with Ecospace The team engaged by the Proponent to conduct this ecosystem modelling for the Roberts Bank Terminal 2 (RBT2) EIS was led by scientists at the Institute for Oceans and Fisheries located at the University of British Columbia in Vancouver These scientists are global leaders of the EwE model framework having developed much of its current implementation and who continue to lead its elaborations and extensions Construction and running of the model for this specific ecosystem was done in collaboration with ESSA Technologies of Vancouver Parameter values for the ecosystem model were obtained in part from observational studies conducted in the area by Hemmera of Burnaby BC
32 Overview of assessment results of hydrological and sediment modelling Implementation of the ldquowith the Projectrdquo simulations of the ecosystem model was done by driving the model with the abiotic variables as they were projected to be distributed with the Project footprint In the context of this EIS specifying depth salinity bottom currents wave height and sediment type conditions without the Project and changes with the Project were achieved by construction of hydrodynamical and sediment transport models The outputs from these models in combination with the identified environment preferences for the various biological groups were then used as inputs to the Ecospace model to define the spatial
Pacific Region Science Response Technical Review Assessing
Ecosystem Productivity Model of Roberts Bank
8
distributions of these functional groups The implementation of these hydrological and sediment transport models in this EIS was reviewed by DFO and NRCan (DFO 2016) This review concluded that the implementation of these models for this EIS was adequate for average winter conditions but lacking in validation for summer conditions in particular with strong freshwater flows from the Fraser River Simulations of strong storm events and their impacts on wave conditions and sediment transport were also lacking The effect of wave action and current speeds on sediment transport is non-linear such that increasing winds over short periods of time can impact sediment transport processes bottom topography and water depths beyond that determined under average model conditions Overall the review concluded that a greater range of sensitivity analyses is required to have confidence in the model outputs under lsquonon-averagersquo conditions The implication of this conclusion for the present review of the EwE model is that the full range of variability of abiotic characteristics such as bottom topography bottom current and wave heights and how they may affect relevant functional groups in the model with the Project may not be adequately represented Sensitivity analyses were provided by varying the intensity of abiotic variables and by removing abiotic variables to assess their interactive effects In general the ecosystem model outputs were robust to these sensitivity analyses with most groups varying by less than 5 Larger changes however were observed for primary producer and bird groupings and for some fish groups when various abiotic variables were omitted2
33 Model implementation 331 The purpose of the EwE model
The EwE model was intended to provide one line of evidence to assess the potential impacts of the Project on the Roberts Bank ecosystem which would then be used with other lines of evidence to make the final assessment Specifically ldquohellip the objective of the RB [Roberts Bank] model was not to provide an assessment of Project impacts for each functional group at a fine temporal scale but to estimate changes in productive potential with and without the Project at the ecosystem levelrdquo3 In addition ldquohellipthe primary objective of the RB ecosystem model is to evaluate potential changes in productivity from such abiotic factors with and without the terminal and causewayrdquo4 Results are presented for the selected functional groups no results were presented on potential changes in ecosystem structure or function
332 Applicability of the EwE model framework to the Roberts Bank region EwE models work best when the exchanges within the system being modelled are greater than the exchanges between the modelled system and the lsquooutsidersquo world In practice this means that EwE models work best for larger systems with few external exchanges In a meta-analysis of 433 Ecopath models Colleacuteter et al (2015) concluded that ldquohellipin the last two decades the range of the models area has expanded toward very large areas and the median has shifted accordingly from about 1000 km2 in 1984ndash1993 to about 100000 km2 in 1994ndash2014rdquo The section of the Roberts Bank ecosystem that is included in the EwE model was comparatively small (5468 km2) and complex It is an intertidally-dominated environment that is subject to strong seasonal influences of both freshwater and marine exchanges across relatively large seaward and shoreward boundaries
2 EIS Appendix 10-D p ii - iii 3 PMV Response 2016-03-02 p 99 lines 1914-1917 4 PMV Response 2016-03-02 p 38 lines 689-691
Pacific Region Science Response Technical Review Assessing
Ecosystem Productivity Model of Roberts Bank
9
Processes taking place outside the modelled ecosystem will contribute to dynamics within the modelled ecosystem (eg lsquooutsidersquo food supporting predators which occur in the Roberts Bank ecosystem for only part of the year predators which may feed in the Roberts Bank ecosystem but export this energy when they migrate out of the region) but which may not be well-resolved by the EwE model The Proponent justifies the spatial scale because it was specifically chosen for the questions being asked in regard to assessing productivity changes and because the relative influences of external exchanges are assumed to be identical with and without the project In addition highly mobile species with broad prey bases were assumed in the model to be partially sustained by external energy from outside the model system5 The distributions of organisms may differ however with and without the project which may affect their interactions with areas outside of the modelled system and the use of diets from outside the modelled system may not reflect the impacts of the project Further clarification of how the EwE model captures the exchanges and interactions with adjacent ecosystems are needed For example it could be argued that an ecosystem which is open to frequent exchanges of water and organic matter from beyond its boundaries might be more robust to local disturbances such as the Project
There are some inconsistencies in the information and assumptions used for some of the taxa in this ecosystem model For Dungeness Crab the justification for estimating total adult biomass (including females) from the biomass of fished males is unclear In addition it is unclear if the slower growth of female crabs once they have reached sexual maturity in comparison with male crabs has been considered The diet matrix for spiny dogfish does not represent the actual diet well in particular of euphausiids herring and shrimp and there are more recent references for biomass estimates of spiny dogfish in the study area than what was used in the EIS
Fishing mortality was not included in the model under the assumption that this would not change with or without the project While this assumption may be true the model has been parameterized by ignoring a source of mortality that will influence total production In essence fishing removes biomass from the ecosystem with the result that less biomass will be available for higher trophic levels How this may impact the ecosystem with and without the Project is unclear but it could make noticeable differences if for example there were thresholds in the feeding responses by these higher trophic level species The Ecopath model that was used is relatively unconstrained since many ecological efficiencies are low even for forage species which would be expected to be higher It is not clear how many species are exploited or the levels of exploitation but even if this does not change with the Project these mortality rates should be included in the model in order to add realistic constraints to the exploited functional groups
333 Model documentation Based on questions from DFO ECCC and NRCan following their initial review of the EIS the Proponent provided written responses dated 2 March 2016 to clarify several of the steps in the model development and implementation However several questions remain including questions about the Ecospace module Ecospace has undergone several recent developments such as the inclusion of the spatial-temporal data layer framework (Steenbeek et al 2013) the habitat capacity model (Christensen et al 2014) and the Monte Carlo analysis including the diet matrix As yet there are few published studies using these latest Ecospace developments and their documentation and justification need to be improved in the EIS
5 PMV Response 2016-03-02 p 29 lines 446 - 464
Pacific Region Science Response Technical Review Assessing
Ecosystem Productivity Model of Roberts Bank
10
Questions also remain regarding how the Monte Carlo randomization routine treated diet data The report indicates that the Monte Carlo routine randomly selected input parameters from the input ranges and that only models that were balanced were used This suggests that a high proportion of models were not balanced and therefore were not used (for example the EIS indicates that about one out of 1000 sampled input parameters was balanced6) A table showing the minimum maximum mode average and median values from the Monte Carlo runs for all the parameters would enable an evaluation of how much variation was actually sampled by the balanced model runs This is recommended in the EwE user information ie ldquoUsers should check the range of the input parameters that were actually used in the trials in the output csv file (see below)rdquo7
In addition there are several issues with the documentation of the derivation of the parameters for the functional groups Such documentation should clearly outline how the input parameter was estimated and the range of uncertainty for that parameter For example the input biomass of pinnipeds was defined as 04 t km 2 derived from estimates of 034 for Harbour seals and two estimates for Steller sea lions (012 and 014 t km 2) No explanation was provided for how the overall estimated pinniped biomass of 04 t km 2 was determined The diet of Sand Lance was described in the EIS as consisting mostly of zooplankton8 whereas the diet table for the model runs9 included 20 macrofauna 10 green algae and 10 detritus It is unclear why these additional prey were included in the diet used for the model runs
334 Highly mobile functional groups This implementation of the EwE framework included transient and migratory functional groups This is entirely appropriate and these groups cannot be excluded The approach taken in the Ecospace module was to impose a low (and conservative) dispersal rate among model spatial units (lsquopixelsrsquo) of 1 km yr-1 This may be appropriate for low mobility benthic organisms but it likely underestimates the movements of many other functional groups The effects of using higher and perhaps functional-group-specific dispersal rates was not considered The Proponents argued that higher dispersal rates would reduce impacts since species can move away from less desirable areas more quickly for completeness these runs should be done and evaluated Mobile species will also bring energy (food) captured outside the system into the modelled ecosystem This process was included in the model with the use of a diet import factor reflecting the consumption of prey outside the modelled region with the assumption that groups with high import rates were unlikely to respond to local changes on Roberts Bank10 This assumption needs justification perhaps at the functional group level for example many species of highly migratory birds and Pacific salmon use the Roberts Bank ecosystem to obtain food to continue their migrations Although this food does not compose a large fraction of their annual consumption it can be critical to enable them to continue their migrations
The EwE model is not designed to capture differences in prey quality ie differences in essential fatty acid or nutrient ratios The same species of prey may have greater or lesser nutritional value to predators depending on the conditions under which they are growing and their seasonal variations This is a particular concern with the nutritional quality of the diatom-dominated biofilm Diatomaceous biofilm is important to the highly migratory Western Sandpiper (Calidris mauri) Despite its predictive merits in relation to other ecosystem
6 EIS Appendix 10D Section 24 p5 7 EwE Help file p 151 8 EIS Appendix 10B Section 4133 p 76 9 EIS Appendix A of Appendix 10B 10 PMV Response 2016-03-02 p 28 lines 429 - 436
Pacific Region Science Response Technical Review Assessing
Ecosystem Productivity Model of Roberts Bank
11
components the EwE model is not informative with respect to understanding the potential impacts of the Project on biofilm and the Western Sandpiper While this example is specific to seabirds the potential exists for differences in the quality of biofilm to also be an issue for copepods which feed on biofilm and consequently to juvenile salmon which feed on these copepods (eg Sutherland et al 2013)
The EwE model is also not designed to predict effects of the Project on water quality although the Proponent noted that ldquoOther abiotic factors not included were deemed to be representative of variables that were already included in the modelhelliprdquo11 The Project may cause changes in physical and water quality conditions whether in isolation or in combination which may impact the productivity or nutritional quality of key prey organisms for local and migratory species which will not be captured by the model The EwE model does not assess the production of key nutrients or the implications of changes in important physical and water quality parameters to biofilm community structure and hence to important migratory birds
The model does not include biotic factors for both pelagic and benthic environments to assess the potential development of eutrophication and benthic organic enrichment events respectively Organic and redox indicators traditional measures of environmental assessments that are used to determine changes in functional group responses were included in the recent Deltaport Third environmental assessment (ie Pelagic chlorophyll dissolved nutrients Benthic sediment carbonnitrogen content redox state [sulfide concentration]) Benthic anoxic events based on organic enrichment are known to be strong drivers of community composition and exclusion regardless of substrate type In the absence of biotic factors (eg organic particulates) the model has not considered the potential for benthic organic enrichment which coincides with siltation processes within the upper tidal flats The tidal flat corner bordered by the Delta-dyke and Deltaport causeway has served as a catchment area for Fraser River silt since the development of the original Deltaport causeway (Sutherland et al 2013) The proposed position of the new terminal placed at the seaward termination of the Deltaport causeway may produce a crescent-shaped feature in the wake of the Fraser River Plume This feature may provide a more efficient silt trap that will promote benthic organic enrichment This piece of the environmental assessment seems to be missing and is important for assessing fish habitat in this area
335 Seasonality (model time step) Input data to parameterize the model were available on a range of time scales from hourly (eg physical data on salinity and water flow) to annual (eg species biomass) The Proponents indicated12 that this is a strength of the EwE model although ultimately the model was run with an annual time step with all sub-annual values being averaged to annual values This method therefore did not incorporate important seasonal processes such as winter-summer differences in salinity and storm properties and the seasonal appearances of abundances of predators and prey such as migratory salmon and birds that are much larger than the annual average For example juvenile salmon migrate from the Fraser River and onto Roberts Bank in the spring before moving into deeper waters If these spring abundances are averaged over the entire year these average abundances would be 5-10 times lower than the actual abundances during the spring (ie averaging the biomass that occurs in two months over a 12 month period) Additionally this method did not capture the intensity of processes such as growth and predation which can be focused over periods of a few weeks to a few months There may be important threshold effects at particular times and places which may be missed when using an 11 EIS Section 10 p 10-11 12 PMV Response 2016-03-02 p 86 line 1655
Pacific Region Science Response Technical Review Assessing
Ecosystem Productivity Model of Roberts Bank
12
annual time step for the model The Ecospace module has a monthly time step13 and therefore it is feasible to run this module with a sub-annual time step For example the Proponents submit14 that there are inadequate data to model the potential effects of the Project on the timing of biofilm production which could have implications for the migratory dunlin and Western Sandpiper However this could be modelled in an exploratory way to determine hypotheses about which factors could affect the timing of production of biofilm and the potential impacts on these birds These issues are of major concern to ECCC
336 Life history structure The EwE model did not separate functional groups into life history stages (stanzas) yet for many functional groups the juvenile stages can have very different life history characteristics and habitats than the adults It is unclear in the description of the model how different life history structures were considered and whether for example there were enough juveniles to produce the adults The implications of not including early life stages should be explored at least qualitatively to identify which species might have life stages that may be more vulnerable to project effects
337 Model balancing Balancing an EwE model is the process by which parameters are adjusted so that there is sufficient production for consumption requirements ie there are sufficient prey for all predators Expert opinion was used to examine parameter values and to adjust for errors or inconsistencies in logic ldquoPMV is confident that since the approach taken to balance the model was based on best practices the steps are appropriaterdquo15 Adjustments to initial parameters to ensure an ecologically-feasible model are necessary and to be expected For a few functional groups however very large changes to initial parameter estimates (which were often not based on Roberts Bank specific data) were necessary for example to transient killer whales When such initial parameters were adjusted (often by substantial amounts) by expert opinion to balance the model the confidence intervals around these adjusted parameter values were not increased to reflect this added uncertainty (see for example PMV Response 2016-03-02 p 51 lines 955-956) When expert opinion was used to make very large changes to initial parameter values broader confidence intervals about these parameters should have been applied This does not appear to have been the case and as a consequence may cause the actual uncertainty of the model outputs to be underestimated
Another example is for the pinniped group in which 50 of the diet was assumed to come from outside the model area in order to balance the model The rationale provided was ldquoThe pinnipeds caused excessive predation mortalities on numerous fish functional groups The biomass of pinnipeds was an average for the Strait of Georgia which was likely too high for Roberts Bank Therefore it was assumed that pinnipeds extracted only half of their diet from the study areardquo16 It is unclear whether the sensitivity of the model to different percentages of diet allocation was explored
As noted above (332) the Ecopath model was relatively unconstrained and few adjustments to input parameters were required to balance the model This is unusual and the low ecotrophic efficiencies of several functional groups suggest that full accounting of energy flows may not have been achieved (an ecotrophic efficiency of 1 indicates that 100 of the production of that
13 EIS Appendix 10C Section 29 p24 14 EIS Appendix 10D Appendix C p72 15 PMV Response 2016-03-02 p 49 lines 910-912 16 EIS Appendix 10C Section 261 p 20
Pacific Region Science Response Technical Review Assessing
Ecosystem Productivity Model of Roberts Bank
13
particular group is being preyed upon or removed by fishing leaving no individuals to die of old age17) An ldquoexcessrdquo of individuals dying of old age ie ecotrophic efficiencies much less than 1 suggests a potentially large biomass that is not used by the ecosystem and instead is converted to detritus
34 Model validation Model validation is the process by which the model parameters variables and outputs are compared with those from the real ecosystem to ascertain how well the model represents the ecosystem It is an essential step in providing confidence that the projections from the model in this case with and without the Project have relevance to how the real ecosystem may be expected to function with and without the Project In practice validating complex ecosystem models is difficult considering the range of assumptions that must be made when building the model the limited available data and natural variability of the ecosystem at a variety of time and space scales
Many of the standard diagnostics for the Ecopath model have not been evaluated in the EIS The Proponent appears to have assumed that once the Ecopath model was balanced then it was valid and fit for purpose The Proponent should provide all the Ecopath estimates of vital rates including mortality rates As presented questions remain For example many Ecotrophic Efficiencies (which control the transfer of biomass from prey to predators) are less than 1 even for taxa which would be expected to be close to 1 such as carnivorous zooplankton The reason for Ecotrophic Efficiencies less than 1 were not discussed or explained in the EIS
Detailed diagnostics for the Ecospace model should also be presented in order to evaluate model performance In response to criticisms by DFO ECCC and NRCan in discussions with the Proponent the latter provided the biomass of the functional groups from the Ecopath model (before Ecospace) and the Ecospace model after the spin-up period (which involved adjusting the parameters from the Ecopath model to balance the 5468 separate cells of the Ecospace model)18 The Proponents argue that ldquoIt is important to note that changes in biomass values generated during the spin-up period are identical for both with and without Project scenarios and thus do not provide information on the potential Project-related effects on productivity19 However several changes to biomass result from the Ecospace balancing process (spin-up period) This is only given brief attention by the Proponent in its response to the DFO ECCC and NRCan questions An analysis of Table 620 revealed that the biomass of 9 functional groups was larger or smaller than the widest confidence limits allowed for each group21 This requires further discussion and justification
The Proponent used a goodness of fit measure to compare spatial distributions of model outputs with field observations They indicated that ldquono other EwE models were identified which use a goodness-of-fit measure Hence the RB model is potentially the first such EwE model where a goodness of fit measure has been appliedrdquo22 The chosen goodness of fit measure is the percent correct classification (PCC) method23 This method derives a test statistic based on the proportion of locations at which predicted occurrences from the model match observed
17 EIS Appendix 10-B p 11 18 PMV Response 2016-03-02 p 65-66 Table 6 19 PMV Response 2016-03-02 p 64 lines 1205-1207 20 PMV Response 2016-03-02 p 65-66 Table 6 21 PMV Response 2016-03-02 p 45 Table 3 22 PMV Response 2016-03-02 p 78 lines 1481-1483 23 PMV Response 2016-03-02 p 78 lines 1483-1484
Pacific Region Science Response Technical Review Assessing
Ecosystem Productivity Model of Roberts Bank
14
occurrences from data and similarly with predicted and observed absences The Proponent then calculated two additional accuracy of fit measures sensitivity (the model predicts a species to occur in an area where it is known to occur in reality) and specificity (the model predicts a species does not occur in an area it is known not to occur in reality)24 This analysis concluded that the model has high predictability for functional groups such as eelgrass and sea pens with relatively static distributions but lower predictability for functional groups which are more temporally and spatially dynamic such as biofilm and green algae25
There are two problems with this approach The first is that this goodness of fit comparison was done only for habitat-forming functional groups no discussion of how well this analysis applies to mobile functional groups was provided The second problem is that this method does not take into account situations (such as occurs in this study with several groups) in which species occur at only a few locations For example ldquohellipif the test data consist of 95 absences and 5 presences and this reflects the true prevalence of the species on the landscape (a realistic scenario for a rare species) a lsquonullrsquo model that predicted absence in all cases (eg no model at all) would be correct 95 of the timehellipldquo (Franklin 2009 p 151) This latter point is important here as these habitat functional groups (biofilm brown algae native eelgrass green algae Japanese eelgrass tidal marsh biomat and orange sea pens26) appear not to occur over most of the Project area (as portrayed by the model outputs presented in the distribution figures of PMV Response 2016-03-02 Appendix 218) It is therefore important that a robust evaluation of the performance of the Ecospace module is used with preferably more than one measure
In summary the starting point for this modelling analysis matters It is not just about a comparison between results with and without the Project The model has to be considered a sufficient representation of the ecosystem The Proponent has not yet sufficiently validated the model
35 Model results 351 Presentation of model results
As noted above (Section 331) the stated objective of the Roberts Bank ecosystem model was not to provide an assessment of Project impacts for each functional group at a fine temporal scale but to estimate changes in productive potential with and without the Project at the ecosystem level27 However results were presented as comparisons by speciesfunctional group with and without the Project and not as potential changes in total ecosystem productivity The revised figures for each functional group showing distributions without the Project with the Project and their difference indicated impacts were likely to be localized with overall impacts relatively small The range of biomass ratios with and without the Project was 045 ndash 189 with most values slightly less than 1 This is interpreted as indicating slight decreases in the capacity of the study area to support biomass and production with the Project for many functional groups28 (Figure 2)
24 PMV Response 2016-03-02 p 80 lines 1524-1527 25 PMV Response 2016-03-02 p 81 lines 1551-1559 26 PMV Response 2016-03-02 p 82 Table 8 27 PMV Response 2016-03-02 p 99 lines 1914-1917 28 PMV Response 2016-03-02 Appendix 218
Pacific Region Science Response Technical Review Assessing
Ecosystem Productivity Model of Roberts Bank
15
Biomass Ratio
Freq
uenc
y
04 07 10 13 16 19
05
1015
2025
30
Figure 2 Histogram of biomass ratios obtained by comparisons of model runs with and without the project (ie With Without) Values less than 1 indicate reductions in biomass with the Project compared against without the Project) Data from Appendix 218 of PMV Response 2016-03-02
352 Sensitivity and vulnerability analyses Every ecosystem model is only one possible representation of the true ecosystem defined by the modelrsquos structure and the values chosen for its many parameters The key point is how well the model represents the real system how that fit can be measured and the sensitivity of model outputs to variability in the selected parameter values The ideal model should be robust to a wide range of uncertainties in the input data and parameters This robustness is determined by performing sensitivity analyses on the model to see how it responds to variations in the input parameters and determining to which input parameters the model is most sensitive
The vulnerability parameters determine the strength of the feeding interactions between functional groups They set the level of density dependence of each functional group Higher vulnerability settings provide greater top-down (predator) control whereas lower settings provide greater bottom-up (environmental) control29 Several publications have shown that EwE models are very sensitive to the vulnerability parameters and Christensen and Walters (2000) point out that a main pitfall of EwE is that ldquopredation vulnerabilities are often underestimated lessening the modelled impacts of predationrdquo It is usual practice to tune Ecopath models including the vulnerability parameters to time series data such as biomass using the temporal simulation model Ecosim However these data were not available for the RBT2 area so this robust method of fitting the model and estimating vulnerability parameters was not possible Instead a vulnerability setting of 2 was used as the default value for the key model runs which is ldquocommon practice when time series data are not available and estimates of vulnerability in the
29 PMV Response 2016-03-02 p 70 lines 1318-1323
Pacific Region Science Response Technical Review Assessing
Ecosystem Productivity Model of Roberts Bank
16
model cannot be maderdquo30 with sensitivity analyses run for a range of 15 to 3 This narrow range was criticized by DFOECCC in initial discussions about the model with the Proponent The Proponent subsequently reran the model with a larger range of vulnerabilities31 (11 to 10) and concluded this broader vulnerability range produced similar results for the productivity ratio with and without the Project to those in the original EIS and that the EIS was more likely to overestimate than underestimate potential project effects32 The data in Table 7 of the PMV Response33 did indicate changes in productivity ratios ranging from 0 to 50 of the defined key run (which used a vulnerability setting of 2) However the Proponent changed all vulnerability settings to the same value ie all were 2 or all were 10 etc In reality the vulnerability parameters resulting from Ecosim models that are fitted to data as described above vary by functional group which was not explored here Therefore although the results suggest that the original choice of 2 for the default key run seemed reasonable the potential effects of variability in vulnerability settings was not fully explored
Sensitivity analyses are usually based on the range of uncertainty estimated for input data and parameters often called the confidence limits around the model parameters The EwE framework integrates many different data sources and parameters including values from the literature It can therefore be difficult to identify ldquoreasonablerdquo confidence limits when derived from such diverse data sources Standard practice in Ecopath models has been to develop a pedigree for each parameter with default values for uncertainty based on the nature of the source data For example parameter values based on high precision field observations of biomass within the model domain receive default confidence intervals of 10 whereas parameter values based on models developed for elsewhere or professional judgment receive confidence intervals of 8034 Sensitivity analyses are then run using parameter values selected from within these confidence intervals However if these default confidence intervals do not capture the full range of variability then the outputs are not informative of the variability in the lsquorealrsquo ecosystem Field observations were collected for many functional groups within the model domain in 2012 and 2013 as part of studies to support the RBT2 EIS Apparently the purpose of these observations was to document spatial variability (in part for the Ecospace model) and temporal variability (measurements at one location over time) and not to derive confidence intervals around the observations35
The reliance on the pedigree approach to derive confidence intervals for this Roberts Bank model was criticized by DFO ECCC and NRCan in discussions with the Proponent As a result the Proponent reran the model with much larger confidence intervals ranging from 30 to 100 depending on the input parameter and functional group36 The results from this new analysis using the broader confidence intervals were similar to those using the original pedigree approach The Proponent noted that ldquoWhile the production within each helliprun was very different there was little difference in the biomass ratio [with and without the Project] These results further demonstrate that even with a greater range in input values the influence of the Project on the Roberts Bank ecosystem is consistent among allhellipmodel runsrdquo37 This provides confidence that the model may be robust to uncertainty in its input parameters Two concerns
30 PMV Response 2016-03-02 p 70 lines 1321-1322 31 PMV Response 2016-03-02 p 71-74 32 PMV Response 2016-03-02 p 71 lines 1339-1341 33 PMV Response 2016-03-02 p 73 34 EIS Appendix 10-C Section 251 page 18 35 PMV Response 2016-03-02 p 42 lines 772-777 36 PMV Response 2016-03-02 p 44-47 37 PMV Response 2016-03-02 p 47 lines 855-858 and see also PMV Response 2016-03-02 Appendix 27-B
Pacific Region Science Response Technical Review Assessing
Ecosystem Productivity Model of Roberts Bank
17
remain however The quote above indicates that the production among the different model runs was very different although with little difference in the biomass ratios with and without the Project Since biomass is not the same as production it would be informative for understanding model performance and potential impacts to show these production differences This also relates to the point made in Section 34 regarding how well the model represents the real ecosystem and not just within-model comparisons with and without the Project The second question is more technical and relates to how the randomization (Monte Carlo or MC) routine that was used to create multiple model runs used the uncertainty about the diet data Diets are not currently included in the MC routine available to regular users of the Ecosim model how they were handled in this RBT2 model appears not to be explained
Finally the sensitivity analyses indicate that the uncertainty in the input parameters does not lead to much difference between model parameters with or without the project However this conclusion does not describe how the uncertainty in the input parameters affects understanding of the ecosystem
40 Conclusions Overall the main conclusion of the Environmental Impact Statement from the Proponent is stated as ldquohellipafter the implementation of mitigation hellipthe Project is not expected to result in any significant adverse effects on any of the 16 valued componentsrdquo38 In addition ldquohellipapproximately 40 of the functional groups are forecast to change no more than 5 which hellip is judged to be within the uncertainty of the model runsrdquo39 although larger changes were forecast for orange sea pens freshwater biofilm green algae and raptors The conclusions from the modelling studies are that ldquohellipthe proposed project will have an impact on the study area that the effect varies between species and that the findings are robust to parameter uncertaintyrdquo40 Specific outcomes by valued component as derived from the EwE model are presented by functional groups in Table 1
38 PMV March 2015 Roberts Bank Environmental Impact Statement Executive Summary ndash Part 1 page 37 39 EIS Appendix 10-C p ii 40 EIS Appendix 10-D p iv
Pacific Region Science Response Technical Review Assessing
Ecosystem Productivity Model of Roberts Bank
18
Table 1 Changes in productive potential with the Project as derived from the EwE model
Changes in productive potential
Ecosystem category
Number of valued
components
Number with potential
biomass loss
Moderate decrease (31-60 decline)
Minor decrease (6-30 decline)
Negligible (0-5
change)
Minor increase (6-
30 increase)
Moderate increase (31-60 increase)
Source
Marine vegetation
7 7 - 3 2 2 - EIS Vol 3 Section 11 Table 11-17 page 11-65
Marine invertebrates
4 3 1 1 1 1 - EIS Vol 3 Section 12 Table 12-8 page 12-52
Marine fish 13 13 - 2 6 5 - EIS Vol 3 Section 13 Table 13-10 page 13-95
Coastal birds
11 8 - 3 4 3 1 EIS Vol 3 Section 15 Table 15-10 page 15-67
Pacific Region Science Response Technical Review Assessing
Ecosystem Productivity Model of Roberts Bank
19
Most functional groups showed some potential biomass loss with the Project with biomass loss defined as any model run with negative outcomes (ie in which biomass with the project was less than biomass without the Project) The summary of changes in productivity potential are mixed with most (33 out of 35) valued components showing minor decreases to minor increases (defined as 6 to 30 changes in productive potential with the Project compared to without the Project)
The main conclusions of this review in regards to the Terms of Reference are
1 Do the functional groups and abiotic variables used in the model adequately represent the ecosystem at Roberts Bank
o The 58 functional groups and abiotic variables used in the model adequately represent the main components of the Roberts Bank ecosystem however for longer lived species the life stages of the species are not well represented and some of the impacts of the Project may be expected to affect specific life stages
o The abiotic variables adequately represent the physical drivers of this ecosystem on an annual time scale However annual values for these abiotic variables may not adequately capture important sub-annual events such as storms (DFO 2016) the timing of arrival and departure of highly migratory species and whether there may be important sub-annual thresholds or mismatches in timing as a result of the Project
o Biotic factors (eg nutrients) which are particularly important for biofilm and other lower trophic level taxa are not included in this model The model is therefore unable to assess the potential development of eutrophication and benthic organic enrichment events which may affect fish habitats in the study area
2 Are the parameter estimates used by the model valid and defensible for this system
o In general parameter estimates appear to be adequate for this system Field studies were done in two years to provide data in particular on distributions of selected functional groups for the Ecospace module Note the distribution studies focussed on taxa which were relatively immobile and therefore lsquofixedrsquo in space
o the selection of some model parameters would benefit from further explanation for example the choice of fixed diet matrices versus dynamic matrices which can vary with changes in abundances or predators and prey
o the selection of some model parameters would benefit from further explanation for example the link between the diets described in the text of Appendix 10B and the quantities presented in Appendix A of Appendix 10B It is understood that proportions were derived using the ldquofixed selectivityrdquo principle but in order to be fully transparent the derivation of each diet should be provided in an appendix
o discussion and explanation is needed of why ecotrophic efficiencies differ from expected values (eg the ecotrophic efficiency for Pacific herring is listed as 038) and
o the abiotic factor lsquosubstratersquo was limited to ldquohardrdquo or rdquosoftrdquo options which can be restrictive given that they serve as endpoints on a substrate composition continuum These limited options may not provide the sensitivity required to assess substrate preference nor the flexibility for taxa (eg motile organisms) that span hard mixed and soft substrate types In addition it is not clear if changes in the hardsoft categories were considered over time within identified depositional or erosional settings before and after construction
Pacific Region Science Response Technical Review Assessing
Ecosystem Productivity Model of Roberts Bank
20
3 Are the limitations and uncertainties of the model identified and appropriately considered when determining the modelrsquos representation of current and possible future conditions
o the EwE model was not designed to evaluate a range of future conditions It was designed to estimate changes in the productive potential at the ecosystem level with and without the Project Therefore the model was run without the Project and with the Project for a range of plausible abiotic conditions and the results were compared with respect to biomass and productivity by functional group
o the pedigree approach to assessing the uncertainties of model outcomes is unsatisfactory for the purpose here as it relates solely to a qualitative judgment of the value of data based on its source However when the model was rerun with much wider ranges of confidence intervals (uncertainties) the results in general (but not necessarily for each functional group) were similar to the results using the original pedigree approach This suggests that taken overall the model may be robust to wide ranges of uncertainty in these input variables and parameters
o there is inadequate validation of the model This is inadequate for three reasons
(i) the basic Ecopath model is not validated and the Ecospace balancing process (the spin-up period) resulted in some biomass estimates being increased or decreased beyond their confidence limits
(ii) the goodness of fit test used to evaluate how well the model predicted the spatial occurrence functional groups is not fit for purpose (Section 34) and
(iii) validation was provided for only a small number of functional groups (the habitat-forming functional groups) As a consequence the model is currently not validated
o Considering the proportion of open boundaries relative to closed boundaries in the model processes taking place outside the modelled ecosystem are likely to contribute to dynamics within the modelled ecosystem However these external processes may not be well-resolved by the EwE model as currently configured
4 Are the model results related to the potential effects of the Project on fish and fish habitat and migratory birds and their food resources valid and defensible
o this is a very complex ecosystem model constructed for a relatively small and open (in the sense of considerable exchange with adjacent non-modelled areas) system Many assumptions have been made based on poor or missing data Taking all these considerations into account the model does the best job possible of comparing the biomass and productivity of the Roberts Bank ecosystem with and without the Project
o the extent to which the model adequately represents the lsquorealrsquo ecosystem of Roberts Bank as opposed to comparisons of model results with and without the Project is unclear as a number of basic diagnostics are not presented (see point 3 above)
o the EwE model is not capable of and is not designed to represent nutritional and food quality variations in prey functional groups and how these may impact highly migratory predators such as birds with and without the Project
5 Is the EwE model framework a valid method to quantify large scale impacts to fish habitat fish productivity and migratory bird productivity
o the EwE model as implemented in this project and reviewed here is a useful first-order framework to organise information and derive initial estimates of how the system may respond to perturbations
Pacific Region Science Response Technical Review Assessing
Ecosystem Productivity Model of Roberts Bank
21
o the utility of a EWE model for impact purposes is highly dependent on the quality of input data
o each EwE model is highly dependent on local conditions Although appropriate as an overall methodology each application would need to be reviewed for how it may be applied to any new ecosystem and
o the EwE model would need to be substantially reformulated if it was to include considerations of changes in chemical composition or food quality of prey in particular for seasonal migratory species such as birds which may depend on very large biomasses of prey with specific chemical composition to fuel their migrations beyond the ecosystem model boundaries
Contributors Contributor Affiliation Ian Perry Author DFO Science Pacific Region Alida Bundy Author DFO Science Maritimes Region Terri Sutherland Author DFO Science Pacific Region Robert Elner Author ECCC Canadian Wildlife Service Andrew Robinson Author ECCC Canadian Wildlife Service Lesley MacDougall Editor DFO Science Pacific Region
Approved by Carmel Lowe
Regional Director Science Branch Pacific Region Fisheries and Oceans Canada
November 4 2016
Sources of Information Christensen V Coll M Steenbeek J Buszowski J Chagaris D walters CJ 2014
Representing variable habitat quality in a spatial food web model Ecosystems 17 1397-1412
Christensen V and Walters C 2000 Ecopath with Ecosim methods capabilities and limitations Ecological Modelling 172 109-139
Colleacuteter M Valls A Guitton J Gascuel D Pauly D and Christensen V 2015 Global overview of the applications of the Ecopath with Ecosim modeling approach using the EcoBase models repository Ecological Modelling 302 pp42-53
Compass Resource Management Ltd 2013 Roberts Bank Terminal 2 Technical Advisory Group (TAG) Process Report Productive Capacity ndash Final Report 119pp (Accessed November 1 2016)
DFO 2016 Technical Review of Roberts Bank Terminal 2 Environmental Assessment Section 95 ndash Coastal Geomorphology DFO Can Sci Advis Sec Sci Resp 2016045 (Accessed November 4 2016)
Pacific Region Science Response Technical Review Assessing
Ecosystem Productivity Model of Roberts Bank
22
ESSA Technologies 2014a Roberts Bank Terminal 2 Project Roberts Bank Delta BC Environmental Impact Statement Volume 3 Biophysical Effects Assessments Appendix 10-C Roberts Bank Ecosystem Model Development and Key Run Port Metro Vancouver (Accessed November 1 2016)
ESSA Technologies 2014b Roberts Bank Terminal 2 Project Roberts Bank Delta BC Environmental Impact Statement Volume 3 Biophysical Effects Assessments Appendix 10-D Roberts Bank Ecosystem Model Sensitivity Analyses Port Metro Vancouver (Accessed November 1 2016)
Franklin J 2009 Mapping Species Distributions Spatial Inference and Prediction Cambridge University Press Cambridge
Hemmera 2014 Roberts Bank Terminal 2 Project Roberts Bank Delta BC Environmental Impact Statement Volume 3 Biophysical Effects Assessments Appendix 10-B Roberts Bank Ecosystem Model Parameter Estimates Port Metro Vancouver File 302-03503 (Accessed November 1 2016)
Port Metro Vancouver 2015a Roberts Bank Terminal 2 Project Roberts Bank Delta BC Environmental Impact Statement Volume 3 Biophysical Effects Assessments Section 100 Biophysical Setting (Accessed November 1 2016)
Port Metro Vancouver 2015b Roberts Bank Terminal 2 Project Roberts Bank Delta BC Environmental Impact Statement Volume 3 Biophysical Effects Assessments Section 103 Overview of Assessing Ecosystem Productivity (Accessed November 1 2016)
Port Metro Vancouver 2015c Roberts Bank Terminal 2 Project Environmental Assessment Additional Information Requirements (July 31 2015) Responses Response to Information Request 6 IR-73115-06 Canadian Environmental Assessment Agency Reference Number 80054 dated 26 October 2015
Steenbeek J Coll M Gurney L Meacutelin F Hoepffner N Buszowski J and Christensen V 2013 Bridging the gap between ecosystem modeling tools and geographic information systems Driving a food web model with external spatialndashtemporal data Ecological Modelling 263 139ndash 151
Sutherland T Elner R and OrsquoNeill J 2013 Roberts Bank Ecological crucible of the Fraser River estuary Progress in Oceanography 115 171ndash180
Vancouver Fraser Port Authority 2016 From the Vancouver Fraser Port Authority to the Review Panel re Answers to preliminary technical questions submitted during the completeness phase from Fisheries and Oceans Canada Natural Resources Canada and Environment and Climate Change Canada concerning the ecosystem modelling to support the Roberts Bank Terminal 2 Project environmental review CEAR Document 547 (Accessed November 1 2016)
Pacific Region Science Response Technical Review Assessing
Ecosystem Productivity Model of Roberts Bank
23
This Report is Available from the Centre for Science Advice
Pacific Region Fisheries and Oceans Canada
3190 Hammond Bay Road Nanaimo BC V9T 6N7
Telephone (250) 756-7208 E-Mail csapdfo-mpogcca
Internet address wwwdfo-mpogccacsas-sccs
ISSN 1919-3769 copy Her Majesty the Queen in Right of Canada 2016
Correct Citation for this Publication
DFO 2016 Technical review of Roberts Bank Terminal 2 environmental assessment section 103 ndash assessing ecosystem productivity DFO Can Sci Advis Sec Sci Resp 2016050
Aussi disponible en franccedilais
MPO 2016 Examen technique de leacutevaluation environnementale du Terminal 2 agrave Roberts Bank section 103 ndash eacutevaluation de la productiviteacute de leacutecosystegraveme Secr can de consult sci du MPO Reacutep des Sci 2016050

Pacific Region Science Response Technical Review Assessing
Ecosystem Productivity Model of Roberts Bank
21
o the utility of a EWE model for impact purposes is highly dependent on the quality of input data
o each EwE model is highly dependent on local conditions Although appropriate as an overall methodology each application would need to be reviewed for how it may be applied to any new ecosystem and
o the EwE model would need to be substantially reformulated if it was to include considerations of changes in chemical composition or food quality of prey in particular for seasonal migratory species such as birds which may depend on very large biomasses of prey with specific chemical composition to fuel their migrations beyond the ecosystem model boundaries
Contributors Contributor Affiliation Ian Perry Author DFO Science Pacific Region Alida Bundy Author DFO Science Maritimes Region Terri Sutherland Author DFO Science Pacific Region Robert Elner Author ECCC Canadian Wildlife Service Andrew Robinson Author ECCC Canadian Wildlife Service Lesley MacDougall Editor DFO Science Pacific Region
Approved by Carmel Lowe
Regional Director Science Branch Pacific Region Fisheries and Oceans Canada
November 4 2016
Sources of Information Christensen V Coll M Steenbeek J Buszowski J Chagaris D walters CJ 2014
Representing variable habitat quality in a spatial food web model Ecosystems 17 1397-1412
Christensen V and Walters C 2000 Ecopath with Ecosim methods capabilities and limitations Ecological Modelling 172 109-139
Colleacuteter M Valls A Guitton J Gascuel D Pauly D and Christensen V 2015 Global overview of the applications of the Ecopath with Ecosim modeling approach using the EcoBase models repository Ecological Modelling 302 pp42-53
Compass Resource Management Ltd 2013 Roberts Bank Terminal 2 Technical Advisory Group (TAG) Process Report Productive Capacity ndash Final Report 119pp (Accessed November 1 2016)
DFO 2016 Technical Review of Roberts Bank Terminal 2 Environmental Assessment Section 95 ndash Coastal Geomorphology DFO Can Sci Advis Sec Sci Resp 2016045 (Accessed November 4 2016)
Pacific Region Science Response Technical Review Assessing
Ecosystem Productivity Model of Roberts Bank
22
ESSA Technologies 2014a Roberts Bank Terminal 2 Project Roberts Bank Delta BC Environmental Impact Statement Volume 3 Biophysical Effects Assessments Appendix 10-C Roberts Bank Ecosystem Model Development and Key Run Port Metro Vancouver (Accessed November 1 2016)
ESSA Technologies 2014b Roberts Bank Terminal 2 Project Roberts Bank Delta BC Environmental Impact Statement Volume 3 Biophysical Effects Assessments Appendix 10-D Roberts Bank Ecosystem Model Sensitivity Analyses Port Metro Vancouver (Accessed November 1 2016)
Franklin J 2009 Mapping Species Distributions Spatial Inference and Prediction Cambridge University Press Cambridge
Hemmera 2014 Roberts Bank Terminal 2 Project Roberts Bank Delta BC Environmental Impact Statement Volume 3 Biophysical Effects Assessments Appendix 10-B Roberts Bank Ecosystem Model Parameter Estimates Port Metro Vancouver File 302-03503 (Accessed November 1 2016)
Port Metro Vancouver 2015a Roberts Bank Terminal 2 Project Roberts Bank Delta BC Environmental Impact Statement Volume 3 Biophysical Effects Assessments Section 100 Biophysical Setting (Accessed November 1 2016)
Port Metro Vancouver 2015b Roberts Bank Terminal 2 Project Roberts Bank Delta BC Environmental Impact Statement Volume 3 Biophysical Effects Assessments Section 103 Overview of Assessing Ecosystem Productivity (Accessed November 1 2016)
Port Metro Vancouver 2015c Roberts Bank Terminal 2 Project Environmental Assessment Additional Information Requirements (July 31 2015) Responses Response to Information Request 6 IR-73115-06 Canadian Environmental Assessment Agency Reference Number 80054 dated 26 October 2015
Steenbeek J Coll M Gurney L Meacutelin F Hoepffner N Buszowski J and Christensen V 2013 Bridging the gap between ecosystem modeling tools and geographic information systems Driving a food web model with external spatialndashtemporal data Ecological Modelling 263 139ndash 151
Sutherland T Elner R and OrsquoNeill J 2013 Roberts Bank Ecological crucible of the Fraser River estuary Progress in Oceanography 115 171ndash180
Vancouver Fraser Port Authority 2016 From the Vancouver Fraser Port Authority to the Review Panel re Answers to preliminary technical questions submitted during the completeness phase from Fisheries and Oceans Canada Natural Resources Canada and Environment and Climate Change Canada concerning the ecosystem modelling to support the Roberts Bank Terminal 2 Project environmental review CEAR Document 547 (Accessed November 1 2016)
Pacific Region Science Response Technical Review Assessing
Ecosystem Productivity Model of Roberts Bank
23
This Report is Available from the Centre for Science Advice
Pacific Region Fisheries and Oceans Canada
3190 Hammond Bay Road Nanaimo BC V9T 6N7
Telephone (250) 756-7208 E-Mail csapdfo-mpogcca
Internet address wwwdfo-mpogccacsas-sccs
ISSN 1919-3769 copy Her Majesty the Queen in Right of Canada 2016
Correct Citation for this Publication
DFO 2016 Technical review of Roberts Bank Terminal 2 environmental assessment section 103 ndash assessing ecosystem productivity DFO Can Sci Advis Sec Sci Resp 2016050
Aussi disponible en franccedilais
MPO 2016 Examen technique de leacutevaluation environnementale du Terminal 2 agrave Roberts Bank section 103 ndash eacutevaluation de la productiviteacute de leacutecosystegraveme Secr can de consult sci du MPO Reacutep des Sci 2016050
- TECHNICAL REVIEW OF ROBERTS BANK TERMINAL 2 ENVIRONMENTAL ASSESSMENT SECTION 103 ndash ASSESSING ECOSYSTEM PRODUCTIVITY
-
- 10 Context
- 20 Background
-
- 21 Background and Terms of Reference
- 22 Approach to assessing ecosystem productivity
-
- 30 Analysis and Response
-
- 31 The EwE Team
- 32 Overview of assessment results of hydrological and sediment modelling
- 33 Model implementation
-
- 331 The purpose of the EwE model
- 332 Applicability of the EwE model framework to the Roberts Bank region
- 333 Model documentation
- 334 Highly mobile functional groups
- 335 Seasonality (model time step)
- 336 Life history structure
- 337 Model balancing
-
- 34 Model validation
- 35 Model results
-
- 351 Presentation of model results
- 352 Sensitivity and vulnerability analyses
-
- 40 Conclusions
- Contributors
- Approved by
- Sources of Information
- This Report is Available from the
-
- CSAS 2016-50 - Assessing Ecosystem Productivitypdf
-
- TECHNICAL REVIEW OF ROBERTS BANK TERMINAL 2 ENVIRONMENTAL ASSESSMENT SECTION 103 ndash ASSESSING ECOSYSTEM PRODUCTIVITY
-
- 10 Context
- 20 Background
-
- 21 Background and Terms of Reference
- 22 Approach to assessing ecosystem productivity
-
- 30 Analysis and Response
-
- 31 The EwE Team
- 32 Overview of assessment results of hydrological and sediment modelling
- 33 Model implementation
-
- 331 The purpose of the EwE model
- 332 Applicability of the EwE model framework to the Roberts Bank region
- 333 Model documentation
- 334 Highly mobile functional groups
- 335 Seasonality (model time step)
- 336 Life history structure
- 337 Model balancing
-
- 34 Model validation
- 35 Model results
-
- 351 Presentation of model results
- 352 Sensitivity and vulnerability analyses
-
- 40 Conclusions
- Contributors
- Approved by
- Sources of Information
- This Report is Available from the
-
Canadian Science Advisory Secretariat Pacific Region Science Response 2016050
December 2016
TECHNICAL REVIEW OF ROBERTS BANK TERMINAL 2 ENVIRONMENTAL ASSESSMENT SECTION 103 ndash
ASSESSING ECOSYSTEM PRODUCTIVITY
10 Context Vancouver Fraser Port Authority (VFPA) formerly Port Metro Vancouver (the Proponent) is proposing to construct and operate the Roberts Bank Terminal 2 Project (the Project) a new three-berth marine container terminal at Roberts Bank in Delta British Columbia The proposed terminal is located next to the existing Deltaport and Westshore Terminals In addition to the construction of the new terminal the Proponent has proposed to widen the north side of the existing Roberts Bank causeway from its east-end connection with the mainland to the entrance to the new terminal The existing tug basin connected to the northeast side of Deltaport Terminal is also proposed to be expanded The new marine terminal is predicted by the Proponent to process up to 260 container ship calls per year at full capacity with the assistance of two or three large berthing or escort tugs to manoeuver ships into or away from assigned berths The terminal is designed to operate 24 hours per day year-round
The Roberts Bank Terminal 2 Project is subject to an environmental assessment by a Review Panel pursuant to the Canadian Environmental Assessment Act 2012 As a federal authority in the environmental assessment for the Project Fisheries and Oceans Canada (DFO) will be asked to present information to the review panel and at public hearings in relation to its expertise on the effects of the Project on fish and fish habitat including aquatic species at risk and the adequacy of mitigation and offsetting measures and monitoring and follow-up programs proposed by the Proponent DFOrsquos Pacific Region Fisheries Protection Program (FPP) will coordinate DFOrsquos participation in the environmental assessment
The Proponent assessed future ecosystem productivity at Roberts Bank using the Ecopath with Ecosim and Ecospace (EwE) model framework The potential impacts of the Project to hydrodynamic conditions and sediment transport in the area as a result of changes in wind wave and current patterns and intensities are projected using different model frameworks A companion Science Response (DFO 2016) has been developed by DFO and Natural Resource Canada (NRCan) to review Section 95 ldquoCoastal Geomorphologyrdquo of the Environmental Impact Statement (EIS) which describes the hydrodynamic and sedimentology models that were used to evaluate the effect of the Project on water and sediment movements
Outcomes of the EwE models are incorporated into the analysis of the potential project-related effects on the ongoing productivity of commercial recreational and Aboriginal fisheries Consequently DFO FPP has requested that DFO Science Branch provide an evaluation of the Proponentrsquos characterization of project-related effects as conducted using the Ecopath with Ecosim and Ecospace (EwE) ecosystem model
Pacific Region Science Response Technical Review Assessing
Ecosystem Productivity Model of Roberts Bank
2
The objectives for this Science Response are to
1 Determine if the functional groups and abiotic factors used in the model adequately represent the ecosystem at Roberts Bank
2 Assess whether the parameter estimates used by the model are valid and defensible for this system
3 Assess whether the limitations and uncertainties of the model are identified and appropriately considered when determining the modelrsquos representation of current and possible future conditions
4 Provide advice regarding whether the model results related to the potential effects of the Project on fish and fish habitat and migratory birds and their food resources are valid and defensible
5 If possible provide advice regarding the validity of using the EwE model framework to quantify large scale impacts to fish habitat and fisheries productivity and the productivity of migratory birds
This Science Response evaluates Section 100 ldquoBiophysical Settingrdquo with a focus on Section 103 ldquoOverview of Assessing Ecosystem Productivityrdquo in the EIS as submitted by the Proponent (Port Metro Vancouver 2015) This Section and consequently this Response describes the ecosystem modelling approach that was taken to evaluate the direct and indirect effects of the footprint of the proposed terminal and widened causeway herein referred to as lsquothe Projectrsquo This ecosystem model provides outputs related to potential effects of the project on the study area at an ecosystem level including aquatic species and bird species in the Project area Evaluation of the model and its outputs therefore required expertise in both fishery aquatic species and migratory bird species Consequently this Science Response is the product of a joint review between DFO and Environment and Climate Change Canada (ECCC) Canadian Wildlife Service and Wildlife and Landscape Science to provide a complete evaluation
This Science Response Report results from the Science Response Process of July 2016 on the Technical Review of Ecopath with Ecosim and Ecospace (EwE) Ecosystem Productivity Model application to the Roberts Bank Terminal 2 Environmental Assessment
20 Background
21 Background and Terms of Reference The Projectrsquos main components have a proposed combined marine footprint area of approximately 179 km2 listed below by specific component
bull Marine Terminal 1335 km 2 including terminal (116 km 2) and dredged berth pocket and marine approach areas (0174 km 2)
bull Widened Causeway 0424 km 2
bull Expanded Tug basin 0031 km 2
Roberts Bank in the Fraser River estuary consists of complex intertidal and subtidal habitats including intertidal eelgrass beds and is an important stopover area for migrating shorebirds and productive feeding and rearing habitats for many fish and invertebrate species It also provides habitat for endangered Southern Resident Killer Whales and other marine mammals
Pacific Region Science Response Technical Review Assessing
Ecosystem Productivity Model of Roberts Bank
3
The environmental conditions at Roberts Bank are dynamic and are influenced by a variety of oceanographic and atmospheric factors including the Fraser River freshwater and sediment plume discharge diurnal tidal currents and prevailing and storm-generated wind and wave activity In addition the intercauseway region provides significant drainage from marsh and agricultural areas which have different characteristics from marine waters and which run along the ferry causeway
To provide the required science advice this Science Response focusses on Section 10 ldquoBiophysical Settingrdquo of the Environmental Impact Statement (EIS) (Port Metro Vancouver 2015a) specifically Section 103 ldquoOverview of Assessing Ecosystem Productivityrdquo (Port Metro Vancouver 2015b) and its related Appendices 10-B ldquoRoberts Bank Ecopath with Ecosim and Ecospace model parameter estimatesrdquo (Hemmera 2014) Appendix 10-C ldquoRoberts Bank Ecosystem model development and key runsrdquo(ESSA Technologies 2014a) and Appendix 10-D ldquoRoberts Bank Ecosystem model sensitivity analysesrdquo (ESSA Technologies 2014b) Additional important information was obtained from the Response to Information Request 6 (IR-73115-06 Canadian Environmental Assessment Agency Reference Number 80054 dated 26 October 2015) (Port Metro Vancouver 2015c) and the Written Responses to Coastal Geomorphology and Ecosystem Modelling Questions provided by the Proponent to DFO ECCC and NRCan on 2 March 2016 (Port Metro Vancouver (PMV) Transmittal TRE-01-RBT2-0004A subsequently referred in this Science Response as ldquoPMV Response 2016-03-02rdquo) (Vancouver Fraser Port Authority 2016)
The process followed in preparing this Science Response involved an initial review of the submitted EIS followed by an in-person meeting of the Proponent its contractors and representatives of DFO ECCC and NRCan to discuss and clarify questions arising from the initial review (Vancouver 23 November 2015) DFO and NRCan provided written questions to the Proponent based on preliminary review of the EIS on November 19 2015 ECCC also provided written questions based on its preliminary review of the EIS to the Proponent on December 1 2015 and January 20 2016 This large initial meeting was followed by smaller focussed meetings between the Proponent its contractors and DFO and NRCan on 11 December 2015 to clarify hydrology and sediment modelling questions with DFO on 8 January 2016 to clarify ecosystem modelling questions and with ECCC on 18 February 2016 to clarify questions relating to birds Written responses to all of these meetings and questions were provided by the Proponent to DFO ECCC and NRCan as the ldquoPMV Response 2016-03-02rdquo and ldquoPMV Response 2016-05-30rdquo (Vancouver Fraser Port Authority 2016) VFPArsquos answers to questions posed by DFO and NRCan regarding coastal geomorphology modelling have been posted to the Canadian Environmental Assessment Registry (CEAR)
22 Approach to assessing ecosystem productivity The Proponent adopted an ecosystem approach to evaluate the direct and indirect effects of the Project on the productivity of the Roberts Bank ecosystem A weight of evidence approach was used to assess the potential effects of the project on the productivity of the ecosystem and selected key components in the study area this approach included a spatial ecosystem simulation model (which included a habitat capacity model) a shorebird opportunity model and empirical data An important point is that any effects on the system during the construction phase or from expansion of the tug basin were excluded from this modelling process the focus instead being a comparison of modelled system productivity before and after the proposed terminal and expanded causeway is in place The chosen ecosystem simulation model was
Pacific Region Science Response Technical Review Assessing
Ecosystem Productivity Model of Roberts Bank
4
Ecopath with Ecosim and its spatial version Ecospace (collectively referred to here as the EwE framework or EwE model) This modelling approach was recommended by a prior Productive Capacity Technical Advisory Group comprised of representatives of technical experts from government agencies academia non-governmental organizations Vancouver Fraser Port Authority and its consultants (Compass 2013) convened by the Proponent and which also recommended a selection of focal species for the model The final selection of functional groups and the resulting food web that form the core of this ecosystem model are shown in Figure 1
Pacific Region Science Response Technical Review Assessing
Ecosystem Productivity Model of Roberts Bank
5
Figure 1 Ecopath with Ecosim model food web for Roberts Bank (Adapted from EIS Volume 3 Section 10 Fig 1033 on page 10-16) The groups coloured in orange represent focal groups size of symbols represents relative annual amount of biomass in the Roberts Bank study area
Pacific Region Science Response Technical Review Assessing
Ecosystem Productivity Model of Roberts Bank
6
The EwE framework is a common approach to ecosystem modelling which has been developed and expanded over the past two to three decades It currently has three main components
1 Ecopath ndash the core model which provides a mass-balance snapshot of the system
2 Ecosim ndash a module that enables simulation modelling over time
3 Ecospace ndash a module that enables simulation modelling over space
In order to make an EwE model tractable species are aggregated into functional groups based on their similar ecological characteristics (habitat and prey preferences etc) the Roberts Bank models had 58 functional groups The first step (Ecopath) was to obtain input parameters representing biomass production consumption emigration and diet for each functional group These parameters were then tuned in an iterative process until the overall production and consumption was balanced (a mass-balance approach) resulting in a model food web with estimates of energy flow between functional groups (Fig 1)
In the second step Ecosim was combined with the spatial model Ecospace The abiotic variables selected in this EIS (depth salinity bottom current wave height sediment type) were used as external forcings to the Ecospace module These abiotic variables provided the physical forcings for the simulations without and with the Project Since time series data on the functional groups of the model were not available Ecospace was run until the model reached equilibrium using various assumptions of the value of the vulnerability parameter (see Section 352) In this EIS the selected time step was annual with all variables abiotic and biotic expressed as yearly averages As used in this EIS the Ecospace module included a habitat capacity model which estimated the distribution of functional groups based on their environmental preferences for each abiotic variable (depth salinity bottom current wave height) and for substrate type (sand mud etc) The model thus allocated the spatial distribution of functional groups over the model domain based on their environmental preferences and the distributions of these abiotic variables with and without the Project The selected spatial unit size (ldquopixelrdquo) for the Ecospace model was 100 m2 In essence an Ecopath model was constructed for each pixel with particular rules governing how the functional groups interacted and moved among these spatial units The Ecospace module was run until it approached equilibrium (20 model years) to establish the spatial patterns without the Project For the lsquowith the Projectrsquo simulations the model was run for an initial 10 years and then the spatial patterns of the abiotic variables with the project were added and the model run for an additional 10 years1 The model outputs predicted changes in the productive potential of the Roberts Bank ecosystem as a comparison (ratio) with and without the Project rather than an absolute biomass that would be lost or gained as a result of the Project
1 EIS Appendix 10-C p 26
Pacific Region Science Response Technical Review Assessing
Ecosystem Productivity Model of Roberts Bank
7
30 Analysis and Response To prepare this response the following sections of the EIS additional documents were reviewed
DocumentSection Title
EIS Section 10
Including appendices 10B 10C and 10D
(Port Metro Vancouver 2015a Hemmera 2014 ESSA Technologies 2014a ESSA Technologies 2014b)
Biophysical Setting
Appendix 10-B Roberts Bank Ecosystem Model Parameter Estimates Port Metro Vancouver File 302-03503
Appendix 10-C Roberts Bank Ecosystem Model Development and Key Run Port Metro Vancouver
Appendix 10-D Roberts Bank Ecosystem Model Sensitivity Analyses Port Metro Vancouver
CEAR document 547 (Including Appendices) ldquoPMV Response 2016-03-02rdquo and ldquoPMV Response 2016-05-30rdquo
(Vancouver Fraser Port Authority 2016)
Vancouver Fraser Port Authority to the Review Panel re Answers to preliminary technical questions submitted during the completeness phase from Fisheries and Oceans Canada Natural Resources Canada and Environment and Climate Change Canada concerning the ecosystem modelling to support the Roberts Bank Terminal 2 Project environmental review
31 The EwE Team Building this ecosystem model was a complex undertaking which required knowledge of the ecosystem to be modelled how to set initial parameter values determination of reasonable ranges of these parameters how to balance the model and how to recognize when the model outputs were unrealistic These tasks became even more complex when spatial model dynamics were involved such as with Ecospace The team engaged by the Proponent to conduct this ecosystem modelling for the Roberts Bank Terminal 2 (RBT2) EIS was led by scientists at the Institute for Oceans and Fisheries located at the University of British Columbia in Vancouver These scientists are global leaders of the EwE model framework having developed much of its current implementation and who continue to lead its elaborations and extensions Construction and running of the model for this specific ecosystem was done in collaboration with ESSA Technologies of Vancouver Parameter values for the ecosystem model were obtained in part from observational studies conducted in the area by Hemmera of Burnaby BC
32 Overview of assessment results of hydrological and sediment modelling Implementation of the ldquowith the Projectrdquo simulations of the ecosystem model was done by driving the model with the abiotic variables as they were projected to be distributed with the Project footprint In the context of this EIS specifying depth salinity bottom currents wave height and sediment type conditions without the Project and changes with the Project were achieved by construction of hydrodynamical and sediment transport models The outputs from these models in combination with the identified environment preferences for the various biological groups were then used as inputs to the Ecospace model to define the spatial
Pacific Region Science Response Technical Review Assessing
Ecosystem Productivity Model of Roberts Bank
8
distributions of these functional groups The implementation of these hydrological and sediment transport models in this EIS was reviewed by DFO and NRCan (DFO 2016) This review concluded that the implementation of these models for this EIS was adequate for average winter conditions but lacking in validation for summer conditions in particular with strong freshwater flows from the Fraser River Simulations of strong storm events and their impacts on wave conditions and sediment transport were also lacking The effect of wave action and current speeds on sediment transport is non-linear such that increasing winds over short periods of time can impact sediment transport processes bottom topography and water depths beyond that determined under average model conditions Overall the review concluded that a greater range of sensitivity analyses is required to have confidence in the model outputs under lsquonon-averagersquo conditions The implication of this conclusion for the present review of the EwE model is that the full range of variability of abiotic characteristics such as bottom topography bottom current and wave heights and how they may affect relevant functional groups in the model with the Project may not be adequately represented Sensitivity analyses were provided by varying the intensity of abiotic variables and by removing abiotic variables to assess their interactive effects In general the ecosystem model outputs were robust to these sensitivity analyses with most groups varying by less than 5 Larger changes however were observed for primary producer and bird groupings and for some fish groups when various abiotic variables were omitted2
33 Model implementation 331 The purpose of the EwE model
The EwE model was intended to provide one line of evidence to assess the potential impacts of the Project on the Roberts Bank ecosystem which would then be used with other lines of evidence to make the final assessment Specifically ldquohellip the objective of the RB [Roberts Bank] model was not to provide an assessment of Project impacts for each functional group at a fine temporal scale but to estimate changes in productive potential with and without the Project at the ecosystem levelrdquo3 In addition ldquohellipthe primary objective of the RB ecosystem model is to evaluate potential changes in productivity from such abiotic factors with and without the terminal and causewayrdquo4 Results are presented for the selected functional groups no results were presented on potential changes in ecosystem structure or function
332 Applicability of the EwE model framework to the Roberts Bank region EwE models work best when the exchanges within the system being modelled are greater than the exchanges between the modelled system and the lsquooutsidersquo world In practice this means that EwE models work best for larger systems with few external exchanges In a meta-analysis of 433 Ecopath models Colleacuteter et al (2015) concluded that ldquohellipin the last two decades the range of the models area has expanded toward very large areas and the median has shifted accordingly from about 1000 km2 in 1984ndash1993 to about 100000 km2 in 1994ndash2014rdquo The section of the Roberts Bank ecosystem that is included in the EwE model was comparatively small (5468 km2) and complex It is an intertidally-dominated environment that is subject to strong seasonal influences of both freshwater and marine exchanges across relatively large seaward and shoreward boundaries
2 EIS Appendix 10-D p ii - iii 3 PMV Response 2016-03-02 p 99 lines 1914-1917 4 PMV Response 2016-03-02 p 38 lines 689-691
Pacific Region Science Response Technical Review Assessing
Ecosystem Productivity Model of Roberts Bank
9
Processes taking place outside the modelled ecosystem will contribute to dynamics within the modelled ecosystem (eg lsquooutsidersquo food supporting predators which occur in the Roberts Bank ecosystem for only part of the year predators which may feed in the Roberts Bank ecosystem but export this energy when they migrate out of the region) but which may not be well-resolved by the EwE model The Proponent justifies the spatial scale because it was specifically chosen for the questions being asked in regard to assessing productivity changes and because the relative influences of external exchanges are assumed to be identical with and without the project In addition highly mobile species with broad prey bases were assumed in the model to be partially sustained by external energy from outside the model system5 The distributions of organisms may differ however with and without the project which may affect their interactions with areas outside of the modelled system and the use of diets from outside the modelled system may not reflect the impacts of the project Further clarification of how the EwE model captures the exchanges and interactions with adjacent ecosystems are needed For example it could be argued that an ecosystem which is open to frequent exchanges of water and organic matter from beyond its boundaries might be more robust to local disturbances such as the Project
There are some inconsistencies in the information and assumptions used for some of the taxa in this ecosystem model For Dungeness Crab the justification for estimating total adult biomass (including females) from the biomass of fished males is unclear In addition it is unclear if the slower growth of female crabs once they have reached sexual maturity in comparison with male crabs has been considered The diet matrix for spiny dogfish does not represent the actual diet well in particular of euphausiids herring and shrimp and there are more recent references for biomass estimates of spiny dogfish in the study area than what was used in the EIS
Fishing mortality was not included in the model under the assumption that this would not change with or without the project While this assumption may be true the model has been parameterized by ignoring a source of mortality that will influence total production In essence fishing removes biomass from the ecosystem with the result that less biomass will be available for higher trophic levels How this may impact the ecosystem with and without the Project is unclear but it could make noticeable differences if for example there were thresholds in the feeding responses by these higher trophic level species The Ecopath model that was used is relatively unconstrained since many ecological efficiencies are low even for forage species which would be expected to be higher It is not clear how many species are exploited or the levels of exploitation but even if this does not change with the Project these mortality rates should be included in the model in order to add realistic constraints to the exploited functional groups
333 Model documentation Based on questions from DFO ECCC and NRCan following their initial review of the EIS the Proponent provided written responses dated 2 March 2016 to clarify several of the steps in the model development and implementation However several questions remain including questions about the Ecospace module Ecospace has undergone several recent developments such as the inclusion of the spatial-temporal data layer framework (Steenbeek et al 2013) the habitat capacity model (Christensen et al 2014) and the Monte Carlo analysis including the diet matrix As yet there are few published studies using these latest Ecospace developments and their documentation and justification need to be improved in the EIS
5 PMV Response 2016-03-02 p 29 lines 446 - 464
Pacific Region Science Response Technical Review Assessing
Ecosystem Productivity Model of Roberts Bank
10
Questions also remain regarding how the Monte Carlo randomization routine treated diet data The report indicates that the Monte Carlo routine randomly selected input parameters from the input ranges and that only models that were balanced were used This suggests that a high proportion of models were not balanced and therefore were not used (for example the EIS indicates that about one out of 1000 sampled input parameters was balanced6) A table showing the minimum maximum mode average and median values from the Monte Carlo runs for all the parameters would enable an evaluation of how much variation was actually sampled by the balanced model runs This is recommended in the EwE user information ie ldquoUsers should check the range of the input parameters that were actually used in the trials in the output csv file (see below)rdquo7
In addition there are several issues with the documentation of the derivation of the parameters for the functional groups Such documentation should clearly outline how the input parameter was estimated and the range of uncertainty for that parameter For example the input biomass of pinnipeds was defined as 04 t km 2 derived from estimates of 034 for Harbour seals and two estimates for Steller sea lions (012 and 014 t km 2) No explanation was provided for how the overall estimated pinniped biomass of 04 t km 2 was determined The diet of Sand Lance was described in the EIS as consisting mostly of zooplankton8 whereas the diet table for the model runs9 included 20 macrofauna 10 green algae and 10 detritus It is unclear why these additional prey were included in the diet used for the model runs
334 Highly mobile functional groups This implementation of the EwE framework included transient and migratory functional groups This is entirely appropriate and these groups cannot be excluded The approach taken in the Ecospace module was to impose a low (and conservative) dispersal rate among model spatial units (lsquopixelsrsquo) of 1 km yr-1 This may be appropriate for low mobility benthic organisms but it likely underestimates the movements of many other functional groups The effects of using higher and perhaps functional-group-specific dispersal rates was not considered The Proponents argued that higher dispersal rates would reduce impacts since species can move away from less desirable areas more quickly for completeness these runs should be done and evaluated Mobile species will also bring energy (food) captured outside the system into the modelled ecosystem This process was included in the model with the use of a diet import factor reflecting the consumption of prey outside the modelled region with the assumption that groups with high import rates were unlikely to respond to local changes on Roberts Bank10 This assumption needs justification perhaps at the functional group level for example many species of highly migratory birds and Pacific salmon use the Roberts Bank ecosystem to obtain food to continue their migrations Although this food does not compose a large fraction of their annual consumption it can be critical to enable them to continue their migrations
The EwE model is not designed to capture differences in prey quality ie differences in essential fatty acid or nutrient ratios The same species of prey may have greater or lesser nutritional value to predators depending on the conditions under which they are growing and their seasonal variations This is a particular concern with the nutritional quality of the diatom-dominated biofilm Diatomaceous biofilm is important to the highly migratory Western Sandpiper (Calidris mauri) Despite its predictive merits in relation to other ecosystem
6 EIS Appendix 10D Section 24 p5 7 EwE Help file p 151 8 EIS Appendix 10B Section 4133 p 76 9 EIS Appendix A of Appendix 10B 10 PMV Response 2016-03-02 p 28 lines 429 - 436
Pacific Region Science Response Technical Review Assessing
Ecosystem Productivity Model of Roberts Bank
11
components the EwE model is not informative with respect to understanding the potential impacts of the Project on biofilm and the Western Sandpiper While this example is specific to seabirds the potential exists for differences in the quality of biofilm to also be an issue for copepods which feed on biofilm and consequently to juvenile salmon which feed on these copepods (eg Sutherland et al 2013)
The EwE model is also not designed to predict effects of the Project on water quality although the Proponent noted that ldquoOther abiotic factors not included were deemed to be representative of variables that were already included in the modelhelliprdquo11 The Project may cause changes in physical and water quality conditions whether in isolation or in combination which may impact the productivity or nutritional quality of key prey organisms for local and migratory species which will not be captured by the model The EwE model does not assess the production of key nutrients or the implications of changes in important physical and water quality parameters to biofilm community structure and hence to important migratory birds
The model does not include biotic factors for both pelagic and benthic environments to assess the potential development of eutrophication and benthic organic enrichment events respectively Organic and redox indicators traditional measures of environmental assessments that are used to determine changes in functional group responses were included in the recent Deltaport Third environmental assessment (ie Pelagic chlorophyll dissolved nutrients Benthic sediment carbonnitrogen content redox state [sulfide concentration]) Benthic anoxic events based on organic enrichment are known to be strong drivers of community composition and exclusion regardless of substrate type In the absence of biotic factors (eg organic particulates) the model has not considered the potential for benthic organic enrichment which coincides with siltation processes within the upper tidal flats The tidal flat corner bordered by the Delta-dyke and Deltaport causeway has served as a catchment area for Fraser River silt since the development of the original Deltaport causeway (Sutherland et al 2013) The proposed position of the new terminal placed at the seaward termination of the Deltaport causeway may produce a crescent-shaped feature in the wake of the Fraser River Plume This feature may provide a more efficient silt trap that will promote benthic organic enrichment This piece of the environmental assessment seems to be missing and is important for assessing fish habitat in this area
335 Seasonality (model time step) Input data to parameterize the model were available on a range of time scales from hourly (eg physical data on salinity and water flow) to annual (eg species biomass) The Proponents indicated12 that this is a strength of the EwE model although ultimately the model was run with an annual time step with all sub-annual values being averaged to annual values This method therefore did not incorporate important seasonal processes such as winter-summer differences in salinity and storm properties and the seasonal appearances of abundances of predators and prey such as migratory salmon and birds that are much larger than the annual average For example juvenile salmon migrate from the Fraser River and onto Roberts Bank in the spring before moving into deeper waters If these spring abundances are averaged over the entire year these average abundances would be 5-10 times lower than the actual abundances during the spring (ie averaging the biomass that occurs in two months over a 12 month period) Additionally this method did not capture the intensity of processes such as growth and predation which can be focused over periods of a few weeks to a few months There may be important threshold effects at particular times and places which may be missed when using an 11 EIS Section 10 p 10-11 12 PMV Response 2016-03-02 p 86 line 1655
Pacific Region Science Response Technical Review Assessing
Ecosystem Productivity Model of Roberts Bank
12
annual time step for the model The Ecospace module has a monthly time step13 and therefore it is feasible to run this module with a sub-annual time step For example the Proponents submit14 that there are inadequate data to model the potential effects of the Project on the timing of biofilm production which could have implications for the migratory dunlin and Western Sandpiper However this could be modelled in an exploratory way to determine hypotheses about which factors could affect the timing of production of biofilm and the potential impacts on these birds These issues are of major concern to ECCC
336 Life history structure The EwE model did not separate functional groups into life history stages (stanzas) yet for many functional groups the juvenile stages can have very different life history characteristics and habitats than the adults It is unclear in the description of the model how different life history structures were considered and whether for example there were enough juveniles to produce the adults The implications of not including early life stages should be explored at least qualitatively to identify which species might have life stages that may be more vulnerable to project effects
337 Model balancing Balancing an EwE model is the process by which parameters are adjusted so that there is sufficient production for consumption requirements ie there are sufficient prey for all predators Expert opinion was used to examine parameter values and to adjust for errors or inconsistencies in logic ldquoPMV is confident that since the approach taken to balance the model was based on best practices the steps are appropriaterdquo15 Adjustments to initial parameters to ensure an ecologically-feasible model are necessary and to be expected For a few functional groups however very large changes to initial parameter estimates (which were often not based on Roberts Bank specific data) were necessary for example to transient killer whales When such initial parameters were adjusted (often by substantial amounts) by expert opinion to balance the model the confidence intervals around these adjusted parameter values were not increased to reflect this added uncertainty (see for example PMV Response 2016-03-02 p 51 lines 955-956) When expert opinion was used to make very large changes to initial parameter values broader confidence intervals about these parameters should have been applied This does not appear to have been the case and as a consequence may cause the actual uncertainty of the model outputs to be underestimated
Another example is for the pinniped group in which 50 of the diet was assumed to come from outside the model area in order to balance the model The rationale provided was ldquoThe pinnipeds caused excessive predation mortalities on numerous fish functional groups The biomass of pinnipeds was an average for the Strait of Georgia which was likely too high for Roberts Bank Therefore it was assumed that pinnipeds extracted only half of their diet from the study areardquo16 It is unclear whether the sensitivity of the model to different percentages of diet allocation was explored
As noted above (332) the Ecopath model was relatively unconstrained and few adjustments to input parameters were required to balance the model This is unusual and the low ecotrophic efficiencies of several functional groups suggest that full accounting of energy flows may not have been achieved (an ecotrophic efficiency of 1 indicates that 100 of the production of that
13 EIS Appendix 10C Section 29 p24 14 EIS Appendix 10D Appendix C p72 15 PMV Response 2016-03-02 p 49 lines 910-912 16 EIS Appendix 10C Section 261 p 20
Pacific Region Science Response Technical Review Assessing
Ecosystem Productivity Model of Roberts Bank
13
particular group is being preyed upon or removed by fishing leaving no individuals to die of old age17) An ldquoexcessrdquo of individuals dying of old age ie ecotrophic efficiencies much less than 1 suggests a potentially large biomass that is not used by the ecosystem and instead is converted to detritus
34 Model validation Model validation is the process by which the model parameters variables and outputs are compared with those from the real ecosystem to ascertain how well the model represents the ecosystem It is an essential step in providing confidence that the projections from the model in this case with and without the Project have relevance to how the real ecosystem may be expected to function with and without the Project In practice validating complex ecosystem models is difficult considering the range of assumptions that must be made when building the model the limited available data and natural variability of the ecosystem at a variety of time and space scales
Many of the standard diagnostics for the Ecopath model have not been evaluated in the EIS The Proponent appears to have assumed that once the Ecopath model was balanced then it was valid and fit for purpose The Proponent should provide all the Ecopath estimates of vital rates including mortality rates As presented questions remain For example many Ecotrophic Efficiencies (which control the transfer of biomass from prey to predators) are less than 1 even for taxa which would be expected to be close to 1 such as carnivorous zooplankton The reason for Ecotrophic Efficiencies less than 1 were not discussed or explained in the EIS
Detailed diagnostics for the Ecospace model should also be presented in order to evaluate model performance In response to criticisms by DFO ECCC and NRCan in discussions with the Proponent the latter provided the biomass of the functional groups from the Ecopath model (before Ecospace) and the Ecospace model after the spin-up period (which involved adjusting the parameters from the Ecopath model to balance the 5468 separate cells of the Ecospace model)18 The Proponents argue that ldquoIt is important to note that changes in biomass values generated during the spin-up period are identical for both with and without Project scenarios and thus do not provide information on the potential Project-related effects on productivity19 However several changes to biomass result from the Ecospace balancing process (spin-up period) This is only given brief attention by the Proponent in its response to the DFO ECCC and NRCan questions An analysis of Table 620 revealed that the biomass of 9 functional groups was larger or smaller than the widest confidence limits allowed for each group21 This requires further discussion and justification
The Proponent used a goodness of fit measure to compare spatial distributions of model outputs with field observations They indicated that ldquono other EwE models were identified which use a goodness-of-fit measure Hence the RB model is potentially the first such EwE model where a goodness of fit measure has been appliedrdquo22 The chosen goodness of fit measure is the percent correct classification (PCC) method23 This method derives a test statistic based on the proportion of locations at which predicted occurrences from the model match observed
17 EIS Appendix 10-B p 11 18 PMV Response 2016-03-02 p 65-66 Table 6 19 PMV Response 2016-03-02 p 64 lines 1205-1207 20 PMV Response 2016-03-02 p 65-66 Table 6 21 PMV Response 2016-03-02 p 45 Table 3 22 PMV Response 2016-03-02 p 78 lines 1481-1483 23 PMV Response 2016-03-02 p 78 lines 1483-1484
Pacific Region Science Response Technical Review Assessing
Ecosystem Productivity Model of Roberts Bank
14
occurrences from data and similarly with predicted and observed absences The Proponent then calculated two additional accuracy of fit measures sensitivity (the model predicts a species to occur in an area where it is known to occur in reality) and specificity (the model predicts a species does not occur in an area it is known not to occur in reality)24 This analysis concluded that the model has high predictability for functional groups such as eelgrass and sea pens with relatively static distributions but lower predictability for functional groups which are more temporally and spatially dynamic such as biofilm and green algae25
There are two problems with this approach The first is that this goodness of fit comparison was done only for habitat-forming functional groups no discussion of how well this analysis applies to mobile functional groups was provided The second problem is that this method does not take into account situations (such as occurs in this study with several groups) in which species occur at only a few locations For example ldquohellipif the test data consist of 95 absences and 5 presences and this reflects the true prevalence of the species on the landscape (a realistic scenario for a rare species) a lsquonullrsquo model that predicted absence in all cases (eg no model at all) would be correct 95 of the timehellipldquo (Franklin 2009 p 151) This latter point is important here as these habitat functional groups (biofilm brown algae native eelgrass green algae Japanese eelgrass tidal marsh biomat and orange sea pens26) appear not to occur over most of the Project area (as portrayed by the model outputs presented in the distribution figures of PMV Response 2016-03-02 Appendix 218) It is therefore important that a robust evaluation of the performance of the Ecospace module is used with preferably more than one measure
In summary the starting point for this modelling analysis matters It is not just about a comparison between results with and without the Project The model has to be considered a sufficient representation of the ecosystem The Proponent has not yet sufficiently validated the model
35 Model results 351 Presentation of model results
As noted above (Section 331) the stated objective of the Roberts Bank ecosystem model was not to provide an assessment of Project impacts for each functional group at a fine temporal scale but to estimate changes in productive potential with and without the Project at the ecosystem level27 However results were presented as comparisons by speciesfunctional group with and without the Project and not as potential changes in total ecosystem productivity The revised figures for each functional group showing distributions without the Project with the Project and their difference indicated impacts were likely to be localized with overall impacts relatively small The range of biomass ratios with and without the Project was 045 ndash 189 with most values slightly less than 1 This is interpreted as indicating slight decreases in the capacity of the study area to support biomass and production with the Project for many functional groups28 (Figure 2)
24 PMV Response 2016-03-02 p 80 lines 1524-1527 25 PMV Response 2016-03-02 p 81 lines 1551-1559 26 PMV Response 2016-03-02 p 82 Table 8 27 PMV Response 2016-03-02 p 99 lines 1914-1917 28 PMV Response 2016-03-02 Appendix 218
Pacific Region Science Response Technical Review Assessing
Ecosystem Productivity Model of Roberts Bank
15
Biomass Ratio
Freq
uenc
y
04 07 10 13 16 19
05
1015
2025
30
Figure 2 Histogram of biomass ratios obtained by comparisons of model runs with and without the project (ie With Without) Values less than 1 indicate reductions in biomass with the Project compared against without the Project) Data from Appendix 218 of PMV Response 2016-03-02
352 Sensitivity and vulnerability analyses Every ecosystem model is only one possible representation of the true ecosystem defined by the modelrsquos structure and the values chosen for its many parameters The key point is how well the model represents the real system how that fit can be measured and the sensitivity of model outputs to variability in the selected parameter values The ideal model should be robust to a wide range of uncertainties in the input data and parameters This robustness is determined by performing sensitivity analyses on the model to see how it responds to variations in the input parameters and determining to which input parameters the model is most sensitive
The vulnerability parameters determine the strength of the feeding interactions between functional groups They set the level of density dependence of each functional group Higher vulnerability settings provide greater top-down (predator) control whereas lower settings provide greater bottom-up (environmental) control29 Several publications have shown that EwE models are very sensitive to the vulnerability parameters and Christensen and Walters (2000) point out that a main pitfall of EwE is that ldquopredation vulnerabilities are often underestimated lessening the modelled impacts of predationrdquo It is usual practice to tune Ecopath models including the vulnerability parameters to time series data such as biomass using the temporal simulation model Ecosim However these data were not available for the RBT2 area so this robust method of fitting the model and estimating vulnerability parameters was not possible Instead a vulnerability setting of 2 was used as the default value for the key model runs which is ldquocommon practice when time series data are not available and estimates of vulnerability in the
29 PMV Response 2016-03-02 p 70 lines 1318-1323
Pacific Region Science Response Technical Review Assessing
Ecosystem Productivity Model of Roberts Bank
16
model cannot be maderdquo30 with sensitivity analyses run for a range of 15 to 3 This narrow range was criticized by DFOECCC in initial discussions about the model with the Proponent The Proponent subsequently reran the model with a larger range of vulnerabilities31 (11 to 10) and concluded this broader vulnerability range produced similar results for the productivity ratio with and without the Project to those in the original EIS and that the EIS was more likely to overestimate than underestimate potential project effects32 The data in Table 7 of the PMV Response33 did indicate changes in productivity ratios ranging from 0 to 50 of the defined key run (which used a vulnerability setting of 2) However the Proponent changed all vulnerability settings to the same value ie all were 2 or all were 10 etc In reality the vulnerability parameters resulting from Ecosim models that are fitted to data as described above vary by functional group which was not explored here Therefore although the results suggest that the original choice of 2 for the default key run seemed reasonable the potential effects of variability in vulnerability settings was not fully explored
Sensitivity analyses are usually based on the range of uncertainty estimated for input data and parameters often called the confidence limits around the model parameters The EwE framework integrates many different data sources and parameters including values from the literature It can therefore be difficult to identify ldquoreasonablerdquo confidence limits when derived from such diverse data sources Standard practice in Ecopath models has been to develop a pedigree for each parameter with default values for uncertainty based on the nature of the source data For example parameter values based on high precision field observations of biomass within the model domain receive default confidence intervals of 10 whereas parameter values based on models developed for elsewhere or professional judgment receive confidence intervals of 8034 Sensitivity analyses are then run using parameter values selected from within these confidence intervals However if these default confidence intervals do not capture the full range of variability then the outputs are not informative of the variability in the lsquorealrsquo ecosystem Field observations were collected for many functional groups within the model domain in 2012 and 2013 as part of studies to support the RBT2 EIS Apparently the purpose of these observations was to document spatial variability (in part for the Ecospace model) and temporal variability (measurements at one location over time) and not to derive confidence intervals around the observations35
The reliance on the pedigree approach to derive confidence intervals for this Roberts Bank model was criticized by DFO ECCC and NRCan in discussions with the Proponent As a result the Proponent reran the model with much larger confidence intervals ranging from 30 to 100 depending on the input parameter and functional group36 The results from this new analysis using the broader confidence intervals were similar to those using the original pedigree approach The Proponent noted that ldquoWhile the production within each helliprun was very different there was little difference in the biomass ratio [with and without the Project] These results further demonstrate that even with a greater range in input values the influence of the Project on the Roberts Bank ecosystem is consistent among allhellipmodel runsrdquo37 This provides confidence that the model may be robust to uncertainty in its input parameters Two concerns
30 PMV Response 2016-03-02 p 70 lines 1321-1322 31 PMV Response 2016-03-02 p 71-74 32 PMV Response 2016-03-02 p 71 lines 1339-1341 33 PMV Response 2016-03-02 p 73 34 EIS Appendix 10-C Section 251 page 18 35 PMV Response 2016-03-02 p 42 lines 772-777 36 PMV Response 2016-03-02 p 44-47 37 PMV Response 2016-03-02 p 47 lines 855-858 and see also PMV Response 2016-03-02 Appendix 27-B
Pacific Region Science Response Technical Review Assessing
Ecosystem Productivity Model of Roberts Bank
17
remain however The quote above indicates that the production among the different model runs was very different although with little difference in the biomass ratios with and without the Project Since biomass is not the same as production it would be informative for understanding model performance and potential impacts to show these production differences This also relates to the point made in Section 34 regarding how well the model represents the real ecosystem and not just within-model comparisons with and without the Project The second question is more technical and relates to how the randomization (Monte Carlo or MC) routine that was used to create multiple model runs used the uncertainty about the diet data Diets are not currently included in the MC routine available to regular users of the Ecosim model how they were handled in this RBT2 model appears not to be explained
Finally the sensitivity analyses indicate that the uncertainty in the input parameters does not lead to much difference between model parameters with or without the project However this conclusion does not describe how the uncertainty in the input parameters affects understanding of the ecosystem
40 Conclusions Overall the main conclusion of the Environmental Impact Statement from the Proponent is stated as ldquohellipafter the implementation of mitigation hellipthe Project is not expected to result in any significant adverse effects on any of the 16 valued componentsrdquo38 In addition ldquohellipapproximately 40 of the functional groups are forecast to change no more than 5 which hellip is judged to be within the uncertainty of the model runsrdquo39 although larger changes were forecast for orange sea pens freshwater biofilm green algae and raptors The conclusions from the modelling studies are that ldquohellipthe proposed project will have an impact on the study area that the effect varies between species and that the findings are robust to parameter uncertaintyrdquo40 Specific outcomes by valued component as derived from the EwE model are presented by functional groups in Table 1
38 PMV March 2015 Roberts Bank Environmental Impact Statement Executive Summary ndash Part 1 page 37 39 EIS Appendix 10-C p ii 40 EIS Appendix 10-D p iv
Pacific Region Science Response Technical Review Assessing
Ecosystem Productivity Model of Roberts Bank
18
Table 1 Changes in productive potential with the Project as derived from the EwE model
Changes in productive potential
Ecosystem category
Number of valued
components
Number with potential
biomass loss
Moderate decrease (31-60 decline)
Minor decrease (6-30 decline)
Negligible (0-5
change)
Minor increase (6-
30 increase)
Moderate increase (31-60 increase)
Source
Marine vegetation
7 7 - 3 2 2 - EIS Vol 3 Section 11 Table 11-17 page 11-65
Marine invertebrates
4 3 1 1 1 1 - EIS Vol 3 Section 12 Table 12-8 page 12-52
Marine fish 13 13 - 2 6 5 - EIS Vol 3 Section 13 Table 13-10 page 13-95
Coastal birds
11 8 - 3 4 3 1 EIS Vol 3 Section 15 Table 15-10 page 15-67
Pacific Region Science Response Technical Review Assessing
Ecosystem Productivity Model of Roberts Bank
19
Most functional groups showed some potential biomass loss with the Project with biomass loss defined as any model run with negative outcomes (ie in which biomass with the project was less than biomass without the Project) The summary of changes in productivity potential are mixed with most (33 out of 35) valued components showing minor decreases to minor increases (defined as 6 to 30 changes in productive potential with the Project compared to without the Project)
The main conclusions of this review in regards to the Terms of Reference are
1 Do the functional groups and abiotic variables used in the model adequately represent the ecosystem at Roberts Bank
o The 58 functional groups and abiotic variables used in the model adequately represent the main components of the Roberts Bank ecosystem however for longer lived species the life stages of the species are not well represented and some of the impacts of the Project may be expected to affect specific life stages
o The abiotic variables adequately represent the physical drivers of this ecosystem on an annual time scale However annual values for these abiotic variables may not adequately capture important sub-annual events such as storms (DFO 2016) the timing of arrival and departure of highly migratory species and whether there may be important sub-annual thresholds or mismatches in timing as a result of the Project
o Biotic factors (eg nutrients) which are particularly important for biofilm and other lower trophic level taxa are not included in this model The model is therefore unable to assess the potential development of eutrophication and benthic organic enrichment events which may affect fish habitats in the study area
2 Are the parameter estimates used by the model valid and defensible for this system
o In general parameter estimates appear to be adequate for this system Field studies were done in two years to provide data in particular on distributions of selected functional groups for the Ecospace module Note the distribution studies focussed on taxa which were relatively immobile and therefore lsquofixedrsquo in space
o the selection of some model parameters would benefit from further explanation for example the choice of fixed diet matrices versus dynamic matrices which can vary with changes in abundances or predators and prey
o the selection of some model parameters would benefit from further explanation for example the link between the diets described in the text of Appendix 10B and the quantities presented in Appendix A of Appendix 10B It is understood that proportions were derived using the ldquofixed selectivityrdquo principle but in order to be fully transparent the derivation of each diet should be provided in an appendix
o discussion and explanation is needed of why ecotrophic efficiencies differ from expected values (eg the ecotrophic efficiency for Pacific herring is listed as 038) and
o the abiotic factor lsquosubstratersquo was limited to ldquohardrdquo or rdquosoftrdquo options which can be restrictive given that they serve as endpoints on a substrate composition continuum These limited options may not provide the sensitivity required to assess substrate preference nor the flexibility for taxa (eg motile organisms) that span hard mixed and soft substrate types In addition it is not clear if changes in the hardsoft categories were considered over time within identified depositional or erosional settings before and after construction
Pacific Region Science Response Technical Review Assessing
Ecosystem Productivity Model of Roberts Bank
20
3 Are the limitations and uncertainties of the model identified and appropriately considered when determining the modelrsquos representation of current and possible future conditions
o the EwE model was not designed to evaluate a range of future conditions It was designed to estimate changes in the productive potential at the ecosystem level with and without the Project Therefore the model was run without the Project and with the Project for a range of plausible abiotic conditions and the results were compared with respect to biomass and productivity by functional group
o the pedigree approach to assessing the uncertainties of model outcomes is unsatisfactory for the purpose here as it relates solely to a qualitative judgment of the value of data based on its source However when the model was rerun with much wider ranges of confidence intervals (uncertainties) the results in general (but not necessarily for each functional group) were similar to the results using the original pedigree approach This suggests that taken overall the model may be robust to wide ranges of uncertainty in these input variables and parameters
o there is inadequate validation of the model This is inadequate for three reasons
(i) the basic Ecopath model is not validated and the Ecospace balancing process (the spin-up period) resulted in some biomass estimates being increased or decreased beyond their confidence limits
(ii) the goodness of fit test used to evaluate how well the model predicted the spatial occurrence functional groups is not fit for purpose (Section 34) and
(iii) validation was provided for only a small number of functional groups (the habitat-forming functional groups) As a consequence the model is currently not validated
o Considering the proportion of open boundaries relative to closed boundaries in the model processes taking place outside the modelled ecosystem are likely to contribute to dynamics within the modelled ecosystem However these external processes may not be well-resolved by the EwE model as currently configured
4 Are the model results related to the potential effects of the Project on fish and fish habitat and migratory birds and their food resources valid and defensible
o this is a very complex ecosystem model constructed for a relatively small and open (in the sense of considerable exchange with adjacent non-modelled areas) system Many assumptions have been made based on poor or missing data Taking all these considerations into account the model does the best job possible of comparing the biomass and productivity of the Roberts Bank ecosystem with and without the Project
o the extent to which the model adequately represents the lsquorealrsquo ecosystem of Roberts Bank as opposed to comparisons of model results with and without the Project is unclear as a number of basic diagnostics are not presented (see point 3 above)
o the EwE model is not capable of and is not designed to represent nutritional and food quality variations in prey functional groups and how these may impact highly migratory predators such as birds with and without the Project
5 Is the EwE model framework a valid method to quantify large scale impacts to fish habitat fish productivity and migratory bird productivity
o the EwE model as implemented in this project and reviewed here is a useful first-order framework to organise information and derive initial estimates of how the system may respond to perturbations
Pacific Region Science Response Technical Review Assessing
Ecosystem Productivity Model of Roberts Bank
21
o the utility of a EWE model for impact purposes is highly dependent on the quality of input data
o each EwE model is highly dependent on local conditions Although appropriate as an overall methodology each application would need to be reviewed for how it may be applied to any new ecosystem and
o the EwE model would need to be substantially reformulated if it was to include considerations of changes in chemical composition or food quality of prey in particular for seasonal migratory species such as birds which may depend on very large biomasses of prey with specific chemical composition to fuel their migrations beyond the ecosystem model boundaries
Contributors Contributor Affiliation Ian Perry Author DFO Science Pacific Region Alida Bundy Author DFO Science Maritimes Region Terri Sutherland Author DFO Science Pacific Region Robert Elner Author ECCC Canadian Wildlife Service Andrew Robinson Author ECCC Canadian Wildlife Service Lesley MacDougall Editor DFO Science Pacific Region
Approved by Carmel Lowe
Regional Director Science Branch Pacific Region Fisheries and Oceans Canada
November 4 2016
Sources of Information Christensen V Coll M Steenbeek J Buszowski J Chagaris D walters CJ 2014
Representing variable habitat quality in a spatial food web model Ecosystems 17 1397-1412
Christensen V and Walters C 2000 Ecopath with Ecosim methods capabilities and limitations Ecological Modelling 172 109-139
Colleacuteter M Valls A Guitton J Gascuel D Pauly D and Christensen V 2015 Global overview of the applications of the Ecopath with Ecosim modeling approach using the EcoBase models repository Ecological Modelling 302 pp42-53
Compass Resource Management Ltd 2013 Roberts Bank Terminal 2 Technical Advisory Group (TAG) Process Report Productive Capacity ndash Final Report 119pp (Accessed November 1 2016)
DFO 2016 Technical Review of Roberts Bank Terminal 2 Environmental Assessment Section 95 ndash Coastal Geomorphology DFO Can Sci Advis Sec Sci Resp 2016045 (Accessed November 4 2016)
Pacific Region Science Response Technical Review Assessing
Ecosystem Productivity Model of Roberts Bank
22
ESSA Technologies 2014a Roberts Bank Terminal 2 Project Roberts Bank Delta BC Environmental Impact Statement Volume 3 Biophysical Effects Assessments Appendix 10-C Roberts Bank Ecosystem Model Development and Key Run Port Metro Vancouver (Accessed November 1 2016)
ESSA Technologies 2014b Roberts Bank Terminal 2 Project Roberts Bank Delta BC Environmental Impact Statement Volume 3 Biophysical Effects Assessments Appendix 10-D Roberts Bank Ecosystem Model Sensitivity Analyses Port Metro Vancouver (Accessed November 1 2016)
Franklin J 2009 Mapping Species Distributions Spatial Inference and Prediction Cambridge University Press Cambridge
Hemmera 2014 Roberts Bank Terminal 2 Project Roberts Bank Delta BC Environmental Impact Statement Volume 3 Biophysical Effects Assessments Appendix 10-B Roberts Bank Ecosystem Model Parameter Estimates Port Metro Vancouver File 302-03503 (Accessed November 1 2016)
Port Metro Vancouver 2015a Roberts Bank Terminal 2 Project Roberts Bank Delta BC Environmental Impact Statement Volume 3 Biophysical Effects Assessments Section 100 Biophysical Setting (Accessed November 1 2016)
Port Metro Vancouver 2015b Roberts Bank Terminal 2 Project Roberts Bank Delta BC Environmental Impact Statement Volume 3 Biophysical Effects Assessments Section 103 Overview of Assessing Ecosystem Productivity (Accessed November 1 2016)
Port Metro Vancouver 2015c Roberts Bank Terminal 2 Project Environmental Assessment Additional Information Requirements (July 31 2015) Responses Response to Information Request 6 IR-73115-06 Canadian Environmental Assessment Agency Reference Number 80054 dated 26 October 2015
Steenbeek J Coll M Gurney L Meacutelin F Hoepffner N Buszowski J and Christensen V 2013 Bridging the gap between ecosystem modeling tools and geographic information systems Driving a food web model with external spatialndashtemporal data Ecological Modelling 263 139ndash 151
Sutherland T Elner R and OrsquoNeill J 2013 Roberts Bank Ecological crucible of the Fraser River estuary Progress in Oceanography 115 171ndash180
Vancouver Fraser Port Authority 2016 From the Vancouver Fraser Port Authority to the Review Panel re Answers to preliminary technical questions submitted during the completeness phase from Fisheries and Oceans Canada Natural Resources Canada and Environment and Climate Change Canada concerning the ecosystem modelling to support the Roberts Bank Terminal 2 Project environmental review CEAR Document 547 (Accessed November 1 2016)
Pacific Region Science Response Technical Review Assessing
Ecosystem Productivity Model of Roberts Bank
23
This Report is Available from the Centre for Science Advice
Pacific Region Fisheries and Oceans Canada
3190 Hammond Bay Road Nanaimo BC V9T 6N7
Telephone (250) 756-7208 E-Mail csapdfo-mpogcca
Internet address wwwdfo-mpogccacsas-sccs
ISSN 1919-3769 copy Her Majesty the Queen in Right of Canada 2016
Correct Citation for this Publication
DFO 2016 Technical review of Roberts Bank Terminal 2 environmental assessment section 103 ndash assessing ecosystem productivity DFO Can Sci Advis Sec Sci Resp 2016050
Aussi disponible en franccedilais
MPO 2016 Examen technique de leacutevaluation environnementale du Terminal 2 agrave Roberts Bank section 103 ndash eacutevaluation de la productiviteacute de leacutecosystegraveme Secr can de consult sci du MPO Reacutep des Sci 2016050

Pacific Region Science Response Technical Review Assessing
Ecosystem Productivity Model of Roberts Bank
22
ESSA Technologies 2014a Roberts Bank Terminal 2 Project Roberts Bank Delta BC Environmental Impact Statement Volume 3 Biophysical Effects Assessments Appendix 10-C Roberts Bank Ecosystem Model Development and Key Run Port Metro Vancouver (Accessed November 1 2016)
ESSA Technologies 2014b Roberts Bank Terminal 2 Project Roberts Bank Delta BC Environmental Impact Statement Volume 3 Biophysical Effects Assessments Appendix 10-D Roberts Bank Ecosystem Model Sensitivity Analyses Port Metro Vancouver (Accessed November 1 2016)
Franklin J 2009 Mapping Species Distributions Spatial Inference and Prediction Cambridge University Press Cambridge
Hemmera 2014 Roberts Bank Terminal 2 Project Roberts Bank Delta BC Environmental Impact Statement Volume 3 Biophysical Effects Assessments Appendix 10-B Roberts Bank Ecosystem Model Parameter Estimates Port Metro Vancouver File 302-03503 (Accessed November 1 2016)
Port Metro Vancouver 2015a Roberts Bank Terminal 2 Project Roberts Bank Delta BC Environmental Impact Statement Volume 3 Biophysical Effects Assessments Section 100 Biophysical Setting (Accessed November 1 2016)
Port Metro Vancouver 2015b Roberts Bank Terminal 2 Project Roberts Bank Delta BC Environmental Impact Statement Volume 3 Biophysical Effects Assessments Section 103 Overview of Assessing Ecosystem Productivity (Accessed November 1 2016)
Port Metro Vancouver 2015c Roberts Bank Terminal 2 Project Environmental Assessment Additional Information Requirements (July 31 2015) Responses Response to Information Request 6 IR-73115-06 Canadian Environmental Assessment Agency Reference Number 80054 dated 26 October 2015
Steenbeek J Coll M Gurney L Meacutelin F Hoepffner N Buszowski J and Christensen V 2013 Bridging the gap between ecosystem modeling tools and geographic information systems Driving a food web model with external spatialndashtemporal data Ecological Modelling 263 139ndash 151
Sutherland T Elner R and OrsquoNeill J 2013 Roberts Bank Ecological crucible of the Fraser River estuary Progress in Oceanography 115 171ndash180
Vancouver Fraser Port Authority 2016 From the Vancouver Fraser Port Authority to the Review Panel re Answers to preliminary technical questions submitted during the completeness phase from Fisheries and Oceans Canada Natural Resources Canada and Environment and Climate Change Canada concerning the ecosystem modelling to support the Roberts Bank Terminal 2 Project environmental review CEAR Document 547 (Accessed November 1 2016)
Pacific Region Science Response Technical Review Assessing
Ecosystem Productivity Model of Roberts Bank
23
This Report is Available from the Centre for Science Advice
Pacific Region Fisheries and Oceans Canada
3190 Hammond Bay Road Nanaimo BC V9T 6N7
Telephone (250) 756-7208 E-Mail csapdfo-mpogcca
Internet address wwwdfo-mpogccacsas-sccs
ISSN 1919-3769 copy Her Majesty the Queen in Right of Canada 2016
Correct Citation for this Publication
DFO 2016 Technical review of Roberts Bank Terminal 2 environmental assessment section 103 ndash assessing ecosystem productivity DFO Can Sci Advis Sec Sci Resp 2016050
Aussi disponible en franccedilais
MPO 2016 Examen technique de leacutevaluation environnementale du Terminal 2 agrave Roberts Bank section 103 ndash eacutevaluation de la productiviteacute de leacutecosystegraveme Secr can de consult sci du MPO Reacutep des Sci 2016050
- TECHNICAL REVIEW OF ROBERTS BANK TERMINAL 2 ENVIRONMENTAL ASSESSMENT SECTION 103 ndash ASSESSING ECOSYSTEM PRODUCTIVITY
-
- 10 Context
- 20 Background
-
- 21 Background and Terms of Reference
- 22 Approach to assessing ecosystem productivity
-
- 30 Analysis and Response
-
- 31 The EwE Team
- 32 Overview of assessment results of hydrological and sediment modelling
- 33 Model implementation
-
- 331 The purpose of the EwE model
- 332 Applicability of the EwE model framework to the Roberts Bank region
- 333 Model documentation
- 334 Highly mobile functional groups
- 335 Seasonality (model time step)
- 336 Life history structure
- 337 Model balancing
-
- 34 Model validation
- 35 Model results
-
- 351 Presentation of model results
- 352 Sensitivity and vulnerability analyses
-
- 40 Conclusions
- Contributors
- Approved by
- Sources of Information
- This Report is Available from the
-
- CSAS 2016-50 - Assessing Ecosystem Productivitypdf
-
- TECHNICAL REVIEW OF ROBERTS BANK TERMINAL 2 ENVIRONMENTAL ASSESSMENT SECTION 103 ndash ASSESSING ECOSYSTEM PRODUCTIVITY
-
- 10 Context
- 20 Background
-
- 21 Background and Terms of Reference
- 22 Approach to assessing ecosystem productivity
-
- 30 Analysis and Response
-
- 31 The EwE Team
- 32 Overview of assessment results of hydrological and sediment modelling
- 33 Model implementation
-
- 331 The purpose of the EwE model
- 332 Applicability of the EwE model framework to the Roberts Bank region
- 333 Model documentation
- 334 Highly mobile functional groups
- 335 Seasonality (model time step)
- 336 Life history structure
- 337 Model balancing
-
- 34 Model validation
- 35 Model results
-
- 351 Presentation of model results
- 352 Sensitivity and vulnerability analyses
-
- 40 Conclusions
- Contributors
- Approved by
- Sources of Information
- This Report is Available from the
-
Canadian Science Advisory Secretariat Pacific Region Science Response 2016050
December 2016
TECHNICAL REVIEW OF ROBERTS BANK TERMINAL 2 ENVIRONMENTAL ASSESSMENT SECTION 103 ndash
ASSESSING ECOSYSTEM PRODUCTIVITY
10 Context Vancouver Fraser Port Authority (VFPA) formerly Port Metro Vancouver (the Proponent) is proposing to construct and operate the Roberts Bank Terminal 2 Project (the Project) a new three-berth marine container terminal at Roberts Bank in Delta British Columbia The proposed terminal is located next to the existing Deltaport and Westshore Terminals In addition to the construction of the new terminal the Proponent has proposed to widen the north side of the existing Roberts Bank causeway from its east-end connection with the mainland to the entrance to the new terminal The existing tug basin connected to the northeast side of Deltaport Terminal is also proposed to be expanded The new marine terminal is predicted by the Proponent to process up to 260 container ship calls per year at full capacity with the assistance of two or three large berthing or escort tugs to manoeuver ships into or away from assigned berths The terminal is designed to operate 24 hours per day year-round
The Roberts Bank Terminal 2 Project is subject to an environmental assessment by a Review Panel pursuant to the Canadian Environmental Assessment Act 2012 As a federal authority in the environmental assessment for the Project Fisheries and Oceans Canada (DFO) will be asked to present information to the review panel and at public hearings in relation to its expertise on the effects of the Project on fish and fish habitat including aquatic species at risk and the adequacy of mitigation and offsetting measures and monitoring and follow-up programs proposed by the Proponent DFOrsquos Pacific Region Fisheries Protection Program (FPP) will coordinate DFOrsquos participation in the environmental assessment
The Proponent assessed future ecosystem productivity at Roberts Bank using the Ecopath with Ecosim and Ecospace (EwE) model framework The potential impacts of the Project to hydrodynamic conditions and sediment transport in the area as a result of changes in wind wave and current patterns and intensities are projected using different model frameworks A companion Science Response (DFO 2016) has been developed by DFO and Natural Resource Canada (NRCan) to review Section 95 ldquoCoastal Geomorphologyrdquo of the Environmental Impact Statement (EIS) which describes the hydrodynamic and sedimentology models that were used to evaluate the effect of the Project on water and sediment movements
Outcomes of the EwE models are incorporated into the analysis of the potential project-related effects on the ongoing productivity of commercial recreational and Aboriginal fisheries Consequently DFO FPP has requested that DFO Science Branch provide an evaluation of the Proponentrsquos characterization of project-related effects as conducted using the Ecopath with Ecosim and Ecospace (EwE) ecosystem model
Pacific Region Science Response Technical Review Assessing
Ecosystem Productivity Model of Roberts Bank
2
The objectives for this Science Response are to
1 Determine if the functional groups and abiotic factors used in the model adequately represent the ecosystem at Roberts Bank
2 Assess whether the parameter estimates used by the model are valid and defensible for this system
3 Assess whether the limitations and uncertainties of the model are identified and appropriately considered when determining the modelrsquos representation of current and possible future conditions
4 Provide advice regarding whether the model results related to the potential effects of the Project on fish and fish habitat and migratory birds and their food resources are valid and defensible
5 If possible provide advice regarding the validity of using the EwE model framework to quantify large scale impacts to fish habitat and fisheries productivity and the productivity of migratory birds
This Science Response evaluates Section 100 ldquoBiophysical Settingrdquo with a focus on Section 103 ldquoOverview of Assessing Ecosystem Productivityrdquo in the EIS as submitted by the Proponent (Port Metro Vancouver 2015) This Section and consequently this Response describes the ecosystem modelling approach that was taken to evaluate the direct and indirect effects of the footprint of the proposed terminal and widened causeway herein referred to as lsquothe Projectrsquo This ecosystem model provides outputs related to potential effects of the project on the study area at an ecosystem level including aquatic species and bird species in the Project area Evaluation of the model and its outputs therefore required expertise in both fishery aquatic species and migratory bird species Consequently this Science Response is the product of a joint review between DFO and Environment and Climate Change Canada (ECCC) Canadian Wildlife Service and Wildlife and Landscape Science to provide a complete evaluation
This Science Response Report results from the Science Response Process of July 2016 on the Technical Review of Ecopath with Ecosim and Ecospace (EwE) Ecosystem Productivity Model application to the Roberts Bank Terminal 2 Environmental Assessment
20 Background
21 Background and Terms of Reference The Projectrsquos main components have a proposed combined marine footprint area of approximately 179 km2 listed below by specific component
bull Marine Terminal 1335 km 2 including terminal (116 km 2) and dredged berth pocket and marine approach areas (0174 km 2)
bull Widened Causeway 0424 km 2
bull Expanded Tug basin 0031 km 2
Roberts Bank in the Fraser River estuary consists of complex intertidal and subtidal habitats including intertidal eelgrass beds and is an important stopover area for migrating shorebirds and productive feeding and rearing habitats for many fish and invertebrate species It also provides habitat for endangered Southern Resident Killer Whales and other marine mammals
Pacific Region Science Response Technical Review Assessing
Ecosystem Productivity Model of Roberts Bank
3
The environmental conditions at Roberts Bank are dynamic and are influenced by a variety of oceanographic and atmospheric factors including the Fraser River freshwater and sediment plume discharge diurnal tidal currents and prevailing and storm-generated wind and wave activity In addition the intercauseway region provides significant drainage from marsh and agricultural areas which have different characteristics from marine waters and which run along the ferry causeway
To provide the required science advice this Science Response focusses on Section 10 ldquoBiophysical Settingrdquo of the Environmental Impact Statement (EIS) (Port Metro Vancouver 2015a) specifically Section 103 ldquoOverview of Assessing Ecosystem Productivityrdquo (Port Metro Vancouver 2015b) and its related Appendices 10-B ldquoRoberts Bank Ecopath with Ecosim and Ecospace model parameter estimatesrdquo (Hemmera 2014) Appendix 10-C ldquoRoberts Bank Ecosystem model development and key runsrdquo(ESSA Technologies 2014a) and Appendix 10-D ldquoRoberts Bank Ecosystem model sensitivity analysesrdquo (ESSA Technologies 2014b) Additional important information was obtained from the Response to Information Request 6 (IR-73115-06 Canadian Environmental Assessment Agency Reference Number 80054 dated 26 October 2015) (Port Metro Vancouver 2015c) and the Written Responses to Coastal Geomorphology and Ecosystem Modelling Questions provided by the Proponent to DFO ECCC and NRCan on 2 March 2016 (Port Metro Vancouver (PMV) Transmittal TRE-01-RBT2-0004A subsequently referred in this Science Response as ldquoPMV Response 2016-03-02rdquo) (Vancouver Fraser Port Authority 2016)
The process followed in preparing this Science Response involved an initial review of the submitted EIS followed by an in-person meeting of the Proponent its contractors and representatives of DFO ECCC and NRCan to discuss and clarify questions arising from the initial review (Vancouver 23 November 2015) DFO and NRCan provided written questions to the Proponent based on preliminary review of the EIS on November 19 2015 ECCC also provided written questions based on its preliminary review of the EIS to the Proponent on December 1 2015 and January 20 2016 This large initial meeting was followed by smaller focussed meetings between the Proponent its contractors and DFO and NRCan on 11 December 2015 to clarify hydrology and sediment modelling questions with DFO on 8 January 2016 to clarify ecosystem modelling questions and with ECCC on 18 February 2016 to clarify questions relating to birds Written responses to all of these meetings and questions were provided by the Proponent to DFO ECCC and NRCan as the ldquoPMV Response 2016-03-02rdquo and ldquoPMV Response 2016-05-30rdquo (Vancouver Fraser Port Authority 2016) VFPArsquos answers to questions posed by DFO and NRCan regarding coastal geomorphology modelling have been posted to the Canadian Environmental Assessment Registry (CEAR)
22 Approach to assessing ecosystem productivity The Proponent adopted an ecosystem approach to evaluate the direct and indirect effects of the Project on the productivity of the Roberts Bank ecosystem A weight of evidence approach was used to assess the potential effects of the project on the productivity of the ecosystem and selected key components in the study area this approach included a spatial ecosystem simulation model (which included a habitat capacity model) a shorebird opportunity model and empirical data An important point is that any effects on the system during the construction phase or from expansion of the tug basin were excluded from this modelling process the focus instead being a comparison of modelled system productivity before and after the proposed terminal and expanded causeway is in place The chosen ecosystem simulation model was
Pacific Region Science Response Technical Review Assessing
Ecosystem Productivity Model of Roberts Bank
4
Ecopath with Ecosim and its spatial version Ecospace (collectively referred to here as the EwE framework or EwE model) This modelling approach was recommended by a prior Productive Capacity Technical Advisory Group comprised of representatives of technical experts from government agencies academia non-governmental organizations Vancouver Fraser Port Authority and its consultants (Compass 2013) convened by the Proponent and which also recommended a selection of focal species for the model The final selection of functional groups and the resulting food web that form the core of this ecosystem model are shown in Figure 1
Pacific Region Science Response Technical Review Assessing
Ecosystem Productivity Model of Roberts Bank
5
Figure 1 Ecopath with Ecosim model food web for Roberts Bank (Adapted from EIS Volume 3 Section 10 Fig 1033 on page 10-16) The groups coloured in orange represent focal groups size of symbols represents relative annual amount of biomass in the Roberts Bank study area
Pacific Region Science Response Technical Review Assessing
Ecosystem Productivity Model of Roberts Bank
6
The EwE framework is a common approach to ecosystem modelling which has been developed and expanded over the past two to three decades It currently has three main components
1 Ecopath ndash the core model which provides a mass-balance snapshot of the system
2 Ecosim ndash a module that enables simulation modelling over time
3 Ecospace ndash a module that enables simulation modelling over space
In order to make an EwE model tractable species are aggregated into functional groups based on their similar ecological characteristics (habitat and prey preferences etc) the Roberts Bank models had 58 functional groups The first step (Ecopath) was to obtain input parameters representing biomass production consumption emigration and diet for each functional group These parameters were then tuned in an iterative process until the overall production and consumption was balanced (a mass-balance approach) resulting in a model food web with estimates of energy flow between functional groups (Fig 1)
In the second step Ecosim was combined with the spatial model Ecospace The abiotic variables selected in this EIS (depth salinity bottom current wave height sediment type) were used as external forcings to the Ecospace module These abiotic variables provided the physical forcings for the simulations without and with the Project Since time series data on the functional groups of the model were not available Ecospace was run until the model reached equilibrium using various assumptions of the value of the vulnerability parameter (see Section 352) In this EIS the selected time step was annual with all variables abiotic and biotic expressed as yearly averages As used in this EIS the Ecospace module included a habitat capacity model which estimated the distribution of functional groups based on their environmental preferences for each abiotic variable (depth salinity bottom current wave height) and for substrate type (sand mud etc) The model thus allocated the spatial distribution of functional groups over the model domain based on their environmental preferences and the distributions of these abiotic variables with and without the Project The selected spatial unit size (ldquopixelrdquo) for the Ecospace model was 100 m2 In essence an Ecopath model was constructed for each pixel with particular rules governing how the functional groups interacted and moved among these spatial units The Ecospace module was run until it approached equilibrium (20 model years) to establish the spatial patterns without the Project For the lsquowith the Projectrsquo simulations the model was run for an initial 10 years and then the spatial patterns of the abiotic variables with the project were added and the model run for an additional 10 years1 The model outputs predicted changes in the productive potential of the Roberts Bank ecosystem as a comparison (ratio) with and without the Project rather than an absolute biomass that would be lost or gained as a result of the Project
1 EIS Appendix 10-C p 26
Pacific Region Science Response Technical Review Assessing
Ecosystem Productivity Model of Roberts Bank
7
30 Analysis and Response To prepare this response the following sections of the EIS additional documents were reviewed
DocumentSection Title
EIS Section 10
Including appendices 10B 10C and 10D
(Port Metro Vancouver 2015a Hemmera 2014 ESSA Technologies 2014a ESSA Technologies 2014b)
Biophysical Setting
Appendix 10-B Roberts Bank Ecosystem Model Parameter Estimates Port Metro Vancouver File 302-03503
Appendix 10-C Roberts Bank Ecosystem Model Development and Key Run Port Metro Vancouver
Appendix 10-D Roberts Bank Ecosystem Model Sensitivity Analyses Port Metro Vancouver
CEAR document 547 (Including Appendices) ldquoPMV Response 2016-03-02rdquo and ldquoPMV Response 2016-05-30rdquo
(Vancouver Fraser Port Authority 2016)
Vancouver Fraser Port Authority to the Review Panel re Answers to preliminary technical questions submitted during the completeness phase from Fisheries and Oceans Canada Natural Resources Canada and Environment and Climate Change Canada concerning the ecosystem modelling to support the Roberts Bank Terminal 2 Project environmental review
31 The EwE Team Building this ecosystem model was a complex undertaking which required knowledge of the ecosystem to be modelled how to set initial parameter values determination of reasonable ranges of these parameters how to balance the model and how to recognize when the model outputs were unrealistic These tasks became even more complex when spatial model dynamics were involved such as with Ecospace The team engaged by the Proponent to conduct this ecosystem modelling for the Roberts Bank Terminal 2 (RBT2) EIS was led by scientists at the Institute for Oceans and Fisheries located at the University of British Columbia in Vancouver These scientists are global leaders of the EwE model framework having developed much of its current implementation and who continue to lead its elaborations and extensions Construction and running of the model for this specific ecosystem was done in collaboration with ESSA Technologies of Vancouver Parameter values for the ecosystem model were obtained in part from observational studies conducted in the area by Hemmera of Burnaby BC
32 Overview of assessment results of hydrological and sediment modelling Implementation of the ldquowith the Projectrdquo simulations of the ecosystem model was done by driving the model with the abiotic variables as they were projected to be distributed with the Project footprint In the context of this EIS specifying depth salinity bottom currents wave height and sediment type conditions without the Project and changes with the Project were achieved by construction of hydrodynamical and sediment transport models The outputs from these models in combination with the identified environment preferences for the various biological groups were then used as inputs to the Ecospace model to define the spatial
Pacific Region Science Response Technical Review Assessing
Ecosystem Productivity Model of Roberts Bank
8
distributions of these functional groups The implementation of these hydrological and sediment transport models in this EIS was reviewed by DFO and NRCan (DFO 2016) This review concluded that the implementation of these models for this EIS was adequate for average winter conditions but lacking in validation for summer conditions in particular with strong freshwater flows from the Fraser River Simulations of strong storm events and their impacts on wave conditions and sediment transport were also lacking The effect of wave action and current speeds on sediment transport is non-linear such that increasing winds over short periods of time can impact sediment transport processes bottom topography and water depths beyond that determined under average model conditions Overall the review concluded that a greater range of sensitivity analyses is required to have confidence in the model outputs under lsquonon-averagersquo conditions The implication of this conclusion for the present review of the EwE model is that the full range of variability of abiotic characteristics such as bottom topography bottom current and wave heights and how they may affect relevant functional groups in the model with the Project may not be adequately represented Sensitivity analyses were provided by varying the intensity of abiotic variables and by removing abiotic variables to assess their interactive effects In general the ecosystem model outputs were robust to these sensitivity analyses with most groups varying by less than 5 Larger changes however were observed for primary producer and bird groupings and for some fish groups when various abiotic variables were omitted2
33 Model implementation 331 The purpose of the EwE model
The EwE model was intended to provide one line of evidence to assess the potential impacts of the Project on the Roberts Bank ecosystem which would then be used with other lines of evidence to make the final assessment Specifically ldquohellip the objective of the RB [Roberts Bank] model was not to provide an assessment of Project impacts for each functional group at a fine temporal scale but to estimate changes in productive potential with and without the Project at the ecosystem levelrdquo3 In addition ldquohellipthe primary objective of the RB ecosystem model is to evaluate potential changes in productivity from such abiotic factors with and without the terminal and causewayrdquo4 Results are presented for the selected functional groups no results were presented on potential changes in ecosystem structure or function
332 Applicability of the EwE model framework to the Roberts Bank region EwE models work best when the exchanges within the system being modelled are greater than the exchanges between the modelled system and the lsquooutsidersquo world In practice this means that EwE models work best for larger systems with few external exchanges In a meta-analysis of 433 Ecopath models Colleacuteter et al (2015) concluded that ldquohellipin the last two decades the range of the models area has expanded toward very large areas and the median has shifted accordingly from about 1000 km2 in 1984ndash1993 to about 100000 km2 in 1994ndash2014rdquo The section of the Roberts Bank ecosystem that is included in the EwE model was comparatively small (5468 km2) and complex It is an intertidally-dominated environment that is subject to strong seasonal influences of both freshwater and marine exchanges across relatively large seaward and shoreward boundaries
2 EIS Appendix 10-D p ii - iii 3 PMV Response 2016-03-02 p 99 lines 1914-1917 4 PMV Response 2016-03-02 p 38 lines 689-691
Pacific Region Science Response Technical Review Assessing
Ecosystem Productivity Model of Roberts Bank
9
Processes taking place outside the modelled ecosystem will contribute to dynamics within the modelled ecosystem (eg lsquooutsidersquo food supporting predators which occur in the Roberts Bank ecosystem for only part of the year predators which may feed in the Roberts Bank ecosystem but export this energy when they migrate out of the region) but which may not be well-resolved by the EwE model The Proponent justifies the spatial scale because it was specifically chosen for the questions being asked in regard to assessing productivity changes and because the relative influences of external exchanges are assumed to be identical with and without the project In addition highly mobile species with broad prey bases were assumed in the model to be partially sustained by external energy from outside the model system5 The distributions of organisms may differ however with and without the project which may affect their interactions with areas outside of the modelled system and the use of diets from outside the modelled system may not reflect the impacts of the project Further clarification of how the EwE model captures the exchanges and interactions with adjacent ecosystems are needed For example it could be argued that an ecosystem which is open to frequent exchanges of water and organic matter from beyond its boundaries might be more robust to local disturbances such as the Project
There are some inconsistencies in the information and assumptions used for some of the taxa in this ecosystem model For Dungeness Crab the justification for estimating total adult biomass (including females) from the biomass of fished males is unclear In addition it is unclear if the slower growth of female crabs once they have reached sexual maturity in comparison with male crabs has been considered The diet matrix for spiny dogfish does not represent the actual diet well in particular of euphausiids herring and shrimp and there are more recent references for biomass estimates of spiny dogfish in the study area than what was used in the EIS
Fishing mortality was not included in the model under the assumption that this would not change with or without the project While this assumption may be true the model has been parameterized by ignoring a source of mortality that will influence total production In essence fishing removes biomass from the ecosystem with the result that less biomass will be available for higher trophic levels How this may impact the ecosystem with and without the Project is unclear but it could make noticeable differences if for example there were thresholds in the feeding responses by these higher trophic level species The Ecopath model that was used is relatively unconstrained since many ecological efficiencies are low even for forage species which would be expected to be higher It is not clear how many species are exploited or the levels of exploitation but even if this does not change with the Project these mortality rates should be included in the model in order to add realistic constraints to the exploited functional groups
333 Model documentation Based on questions from DFO ECCC and NRCan following their initial review of the EIS the Proponent provided written responses dated 2 March 2016 to clarify several of the steps in the model development and implementation However several questions remain including questions about the Ecospace module Ecospace has undergone several recent developments such as the inclusion of the spatial-temporal data layer framework (Steenbeek et al 2013) the habitat capacity model (Christensen et al 2014) and the Monte Carlo analysis including the diet matrix As yet there are few published studies using these latest Ecospace developments and their documentation and justification need to be improved in the EIS
5 PMV Response 2016-03-02 p 29 lines 446 - 464
Pacific Region Science Response Technical Review Assessing
Ecosystem Productivity Model of Roberts Bank
10
Questions also remain regarding how the Monte Carlo randomization routine treated diet data The report indicates that the Monte Carlo routine randomly selected input parameters from the input ranges and that only models that were balanced were used This suggests that a high proportion of models were not balanced and therefore were not used (for example the EIS indicates that about one out of 1000 sampled input parameters was balanced6) A table showing the minimum maximum mode average and median values from the Monte Carlo runs for all the parameters would enable an evaluation of how much variation was actually sampled by the balanced model runs This is recommended in the EwE user information ie ldquoUsers should check the range of the input parameters that were actually used in the trials in the output csv file (see below)rdquo7
In addition there are several issues with the documentation of the derivation of the parameters for the functional groups Such documentation should clearly outline how the input parameter was estimated and the range of uncertainty for that parameter For example the input biomass of pinnipeds was defined as 04 t km 2 derived from estimates of 034 for Harbour seals and two estimates for Steller sea lions (012 and 014 t km 2) No explanation was provided for how the overall estimated pinniped biomass of 04 t km 2 was determined The diet of Sand Lance was described in the EIS as consisting mostly of zooplankton8 whereas the diet table for the model runs9 included 20 macrofauna 10 green algae and 10 detritus It is unclear why these additional prey were included in the diet used for the model runs
334 Highly mobile functional groups This implementation of the EwE framework included transient and migratory functional groups This is entirely appropriate and these groups cannot be excluded The approach taken in the Ecospace module was to impose a low (and conservative) dispersal rate among model spatial units (lsquopixelsrsquo) of 1 km yr-1 This may be appropriate for low mobility benthic organisms but it likely underestimates the movements of many other functional groups The effects of using higher and perhaps functional-group-specific dispersal rates was not considered The Proponents argued that higher dispersal rates would reduce impacts since species can move away from less desirable areas more quickly for completeness these runs should be done and evaluated Mobile species will also bring energy (food) captured outside the system into the modelled ecosystem This process was included in the model with the use of a diet import factor reflecting the consumption of prey outside the modelled region with the assumption that groups with high import rates were unlikely to respond to local changes on Roberts Bank10 This assumption needs justification perhaps at the functional group level for example many species of highly migratory birds and Pacific salmon use the Roberts Bank ecosystem to obtain food to continue their migrations Although this food does not compose a large fraction of their annual consumption it can be critical to enable them to continue their migrations
The EwE model is not designed to capture differences in prey quality ie differences in essential fatty acid or nutrient ratios The same species of prey may have greater or lesser nutritional value to predators depending on the conditions under which they are growing and their seasonal variations This is a particular concern with the nutritional quality of the diatom-dominated biofilm Diatomaceous biofilm is important to the highly migratory Western Sandpiper (Calidris mauri) Despite its predictive merits in relation to other ecosystem
6 EIS Appendix 10D Section 24 p5 7 EwE Help file p 151 8 EIS Appendix 10B Section 4133 p 76 9 EIS Appendix A of Appendix 10B 10 PMV Response 2016-03-02 p 28 lines 429 - 436
Pacific Region Science Response Technical Review Assessing
Ecosystem Productivity Model of Roberts Bank
11
components the EwE model is not informative with respect to understanding the potential impacts of the Project on biofilm and the Western Sandpiper While this example is specific to seabirds the potential exists for differences in the quality of biofilm to also be an issue for copepods which feed on biofilm and consequently to juvenile salmon which feed on these copepods (eg Sutherland et al 2013)
The EwE model is also not designed to predict effects of the Project on water quality although the Proponent noted that ldquoOther abiotic factors not included were deemed to be representative of variables that were already included in the modelhelliprdquo11 The Project may cause changes in physical and water quality conditions whether in isolation or in combination which may impact the productivity or nutritional quality of key prey organisms for local and migratory species which will not be captured by the model The EwE model does not assess the production of key nutrients or the implications of changes in important physical and water quality parameters to biofilm community structure and hence to important migratory birds
The model does not include biotic factors for both pelagic and benthic environments to assess the potential development of eutrophication and benthic organic enrichment events respectively Organic and redox indicators traditional measures of environmental assessments that are used to determine changes in functional group responses were included in the recent Deltaport Third environmental assessment (ie Pelagic chlorophyll dissolved nutrients Benthic sediment carbonnitrogen content redox state [sulfide concentration]) Benthic anoxic events based on organic enrichment are known to be strong drivers of community composition and exclusion regardless of substrate type In the absence of biotic factors (eg organic particulates) the model has not considered the potential for benthic organic enrichment which coincides with siltation processes within the upper tidal flats The tidal flat corner bordered by the Delta-dyke and Deltaport causeway has served as a catchment area for Fraser River silt since the development of the original Deltaport causeway (Sutherland et al 2013) The proposed position of the new terminal placed at the seaward termination of the Deltaport causeway may produce a crescent-shaped feature in the wake of the Fraser River Plume This feature may provide a more efficient silt trap that will promote benthic organic enrichment This piece of the environmental assessment seems to be missing and is important for assessing fish habitat in this area
335 Seasonality (model time step) Input data to parameterize the model were available on a range of time scales from hourly (eg physical data on salinity and water flow) to annual (eg species biomass) The Proponents indicated12 that this is a strength of the EwE model although ultimately the model was run with an annual time step with all sub-annual values being averaged to annual values This method therefore did not incorporate important seasonal processes such as winter-summer differences in salinity and storm properties and the seasonal appearances of abundances of predators and prey such as migratory salmon and birds that are much larger than the annual average For example juvenile salmon migrate from the Fraser River and onto Roberts Bank in the spring before moving into deeper waters If these spring abundances are averaged over the entire year these average abundances would be 5-10 times lower than the actual abundances during the spring (ie averaging the biomass that occurs in two months over a 12 month period) Additionally this method did not capture the intensity of processes such as growth and predation which can be focused over periods of a few weeks to a few months There may be important threshold effects at particular times and places which may be missed when using an 11 EIS Section 10 p 10-11 12 PMV Response 2016-03-02 p 86 line 1655
Pacific Region Science Response Technical Review Assessing
Ecosystem Productivity Model of Roberts Bank
12
annual time step for the model The Ecospace module has a monthly time step13 and therefore it is feasible to run this module with a sub-annual time step For example the Proponents submit14 that there are inadequate data to model the potential effects of the Project on the timing of biofilm production which could have implications for the migratory dunlin and Western Sandpiper However this could be modelled in an exploratory way to determine hypotheses about which factors could affect the timing of production of biofilm and the potential impacts on these birds These issues are of major concern to ECCC
336 Life history structure The EwE model did not separate functional groups into life history stages (stanzas) yet for many functional groups the juvenile stages can have very different life history characteristics and habitats than the adults It is unclear in the description of the model how different life history structures were considered and whether for example there were enough juveniles to produce the adults The implications of not including early life stages should be explored at least qualitatively to identify which species might have life stages that may be more vulnerable to project effects
337 Model balancing Balancing an EwE model is the process by which parameters are adjusted so that there is sufficient production for consumption requirements ie there are sufficient prey for all predators Expert opinion was used to examine parameter values and to adjust for errors or inconsistencies in logic ldquoPMV is confident that since the approach taken to balance the model was based on best practices the steps are appropriaterdquo15 Adjustments to initial parameters to ensure an ecologically-feasible model are necessary and to be expected For a few functional groups however very large changes to initial parameter estimates (which were often not based on Roberts Bank specific data) were necessary for example to transient killer whales When such initial parameters were adjusted (often by substantial amounts) by expert opinion to balance the model the confidence intervals around these adjusted parameter values were not increased to reflect this added uncertainty (see for example PMV Response 2016-03-02 p 51 lines 955-956) When expert opinion was used to make very large changes to initial parameter values broader confidence intervals about these parameters should have been applied This does not appear to have been the case and as a consequence may cause the actual uncertainty of the model outputs to be underestimated
Another example is for the pinniped group in which 50 of the diet was assumed to come from outside the model area in order to balance the model The rationale provided was ldquoThe pinnipeds caused excessive predation mortalities on numerous fish functional groups The biomass of pinnipeds was an average for the Strait of Georgia which was likely too high for Roberts Bank Therefore it was assumed that pinnipeds extracted only half of their diet from the study areardquo16 It is unclear whether the sensitivity of the model to different percentages of diet allocation was explored
As noted above (332) the Ecopath model was relatively unconstrained and few adjustments to input parameters were required to balance the model This is unusual and the low ecotrophic efficiencies of several functional groups suggest that full accounting of energy flows may not have been achieved (an ecotrophic efficiency of 1 indicates that 100 of the production of that
13 EIS Appendix 10C Section 29 p24 14 EIS Appendix 10D Appendix C p72 15 PMV Response 2016-03-02 p 49 lines 910-912 16 EIS Appendix 10C Section 261 p 20
Pacific Region Science Response Technical Review Assessing
Ecosystem Productivity Model of Roberts Bank
13
particular group is being preyed upon or removed by fishing leaving no individuals to die of old age17) An ldquoexcessrdquo of individuals dying of old age ie ecotrophic efficiencies much less than 1 suggests a potentially large biomass that is not used by the ecosystem and instead is converted to detritus
34 Model validation Model validation is the process by which the model parameters variables and outputs are compared with those from the real ecosystem to ascertain how well the model represents the ecosystem It is an essential step in providing confidence that the projections from the model in this case with and without the Project have relevance to how the real ecosystem may be expected to function with and without the Project In practice validating complex ecosystem models is difficult considering the range of assumptions that must be made when building the model the limited available data and natural variability of the ecosystem at a variety of time and space scales
Many of the standard diagnostics for the Ecopath model have not been evaluated in the EIS The Proponent appears to have assumed that once the Ecopath model was balanced then it was valid and fit for purpose The Proponent should provide all the Ecopath estimates of vital rates including mortality rates As presented questions remain For example many Ecotrophic Efficiencies (which control the transfer of biomass from prey to predators) are less than 1 even for taxa which would be expected to be close to 1 such as carnivorous zooplankton The reason for Ecotrophic Efficiencies less than 1 were not discussed or explained in the EIS
Detailed diagnostics for the Ecospace model should also be presented in order to evaluate model performance In response to criticisms by DFO ECCC and NRCan in discussions with the Proponent the latter provided the biomass of the functional groups from the Ecopath model (before Ecospace) and the Ecospace model after the spin-up period (which involved adjusting the parameters from the Ecopath model to balance the 5468 separate cells of the Ecospace model)18 The Proponents argue that ldquoIt is important to note that changes in biomass values generated during the spin-up period are identical for both with and without Project scenarios and thus do not provide information on the potential Project-related effects on productivity19 However several changes to biomass result from the Ecospace balancing process (spin-up period) This is only given brief attention by the Proponent in its response to the DFO ECCC and NRCan questions An analysis of Table 620 revealed that the biomass of 9 functional groups was larger or smaller than the widest confidence limits allowed for each group21 This requires further discussion and justification
The Proponent used a goodness of fit measure to compare spatial distributions of model outputs with field observations They indicated that ldquono other EwE models were identified which use a goodness-of-fit measure Hence the RB model is potentially the first such EwE model where a goodness of fit measure has been appliedrdquo22 The chosen goodness of fit measure is the percent correct classification (PCC) method23 This method derives a test statistic based on the proportion of locations at which predicted occurrences from the model match observed
17 EIS Appendix 10-B p 11 18 PMV Response 2016-03-02 p 65-66 Table 6 19 PMV Response 2016-03-02 p 64 lines 1205-1207 20 PMV Response 2016-03-02 p 65-66 Table 6 21 PMV Response 2016-03-02 p 45 Table 3 22 PMV Response 2016-03-02 p 78 lines 1481-1483 23 PMV Response 2016-03-02 p 78 lines 1483-1484
Pacific Region Science Response Technical Review Assessing
Ecosystem Productivity Model of Roberts Bank
14
occurrences from data and similarly with predicted and observed absences The Proponent then calculated two additional accuracy of fit measures sensitivity (the model predicts a species to occur in an area where it is known to occur in reality) and specificity (the model predicts a species does not occur in an area it is known not to occur in reality)24 This analysis concluded that the model has high predictability for functional groups such as eelgrass and sea pens with relatively static distributions but lower predictability for functional groups which are more temporally and spatially dynamic such as biofilm and green algae25
There are two problems with this approach The first is that this goodness of fit comparison was done only for habitat-forming functional groups no discussion of how well this analysis applies to mobile functional groups was provided The second problem is that this method does not take into account situations (such as occurs in this study with several groups) in which species occur at only a few locations For example ldquohellipif the test data consist of 95 absences and 5 presences and this reflects the true prevalence of the species on the landscape (a realistic scenario for a rare species) a lsquonullrsquo model that predicted absence in all cases (eg no model at all) would be correct 95 of the timehellipldquo (Franklin 2009 p 151) This latter point is important here as these habitat functional groups (biofilm brown algae native eelgrass green algae Japanese eelgrass tidal marsh biomat and orange sea pens26) appear not to occur over most of the Project area (as portrayed by the model outputs presented in the distribution figures of PMV Response 2016-03-02 Appendix 218) It is therefore important that a robust evaluation of the performance of the Ecospace module is used with preferably more than one measure
In summary the starting point for this modelling analysis matters It is not just about a comparison between results with and without the Project The model has to be considered a sufficient representation of the ecosystem The Proponent has not yet sufficiently validated the model
35 Model results 351 Presentation of model results
As noted above (Section 331) the stated objective of the Roberts Bank ecosystem model was not to provide an assessment of Project impacts for each functional group at a fine temporal scale but to estimate changes in productive potential with and without the Project at the ecosystem level27 However results were presented as comparisons by speciesfunctional group with and without the Project and not as potential changes in total ecosystem productivity The revised figures for each functional group showing distributions without the Project with the Project and their difference indicated impacts were likely to be localized with overall impacts relatively small The range of biomass ratios with and without the Project was 045 ndash 189 with most values slightly less than 1 This is interpreted as indicating slight decreases in the capacity of the study area to support biomass and production with the Project for many functional groups28 (Figure 2)
24 PMV Response 2016-03-02 p 80 lines 1524-1527 25 PMV Response 2016-03-02 p 81 lines 1551-1559 26 PMV Response 2016-03-02 p 82 Table 8 27 PMV Response 2016-03-02 p 99 lines 1914-1917 28 PMV Response 2016-03-02 Appendix 218
Pacific Region Science Response Technical Review Assessing
Ecosystem Productivity Model of Roberts Bank
15
Biomass Ratio
Freq
uenc
y
04 07 10 13 16 19
05
1015
2025
30
Figure 2 Histogram of biomass ratios obtained by comparisons of model runs with and without the project (ie With Without) Values less than 1 indicate reductions in biomass with the Project compared against without the Project) Data from Appendix 218 of PMV Response 2016-03-02
352 Sensitivity and vulnerability analyses Every ecosystem model is only one possible representation of the true ecosystem defined by the modelrsquos structure and the values chosen for its many parameters The key point is how well the model represents the real system how that fit can be measured and the sensitivity of model outputs to variability in the selected parameter values The ideal model should be robust to a wide range of uncertainties in the input data and parameters This robustness is determined by performing sensitivity analyses on the model to see how it responds to variations in the input parameters and determining to which input parameters the model is most sensitive
The vulnerability parameters determine the strength of the feeding interactions between functional groups They set the level of density dependence of each functional group Higher vulnerability settings provide greater top-down (predator) control whereas lower settings provide greater bottom-up (environmental) control29 Several publications have shown that EwE models are very sensitive to the vulnerability parameters and Christensen and Walters (2000) point out that a main pitfall of EwE is that ldquopredation vulnerabilities are often underestimated lessening the modelled impacts of predationrdquo It is usual practice to tune Ecopath models including the vulnerability parameters to time series data such as biomass using the temporal simulation model Ecosim However these data were not available for the RBT2 area so this robust method of fitting the model and estimating vulnerability parameters was not possible Instead a vulnerability setting of 2 was used as the default value for the key model runs which is ldquocommon practice when time series data are not available and estimates of vulnerability in the
29 PMV Response 2016-03-02 p 70 lines 1318-1323
Pacific Region Science Response Technical Review Assessing
Ecosystem Productivity Model of Roberts Bank
16
model cannot be maderdquo30 with sensitivity analyses run for a range of 15 to 3 This narrow range was criticized by DFOECCC in initial discussions about the model with the Proponent The Proponent subsequently reran the model with a larger range of vulnerabilities31 (11 to 10) and concluded this broader vulnerability range produced similar results for the productivity ratio with and without the Project to those in the original EIS and that the EIS was more likely to overestimate than underestimate potential project effects32 The data in Table 7 of the PMV Response33 did indicate changes in productivity ratios ranging from 0 to 50 of the defined key run (which used a vulnerability setting of 2) However the Proponent changed all vulnerability settings to the same value ie all were 2 or all were 10 etc In reality the vulnerability parameters resulting from Ecosim models that are fitted to data as described above vary by functional group which was not explored here Therefore although the results suggest that the original choice of 2 for the default key run seemed reasonable the potential effects of variability in vulnerability settings was not fully explored
Sensitivity analyses are usually based on the range of uncertainty estimated for input data and parameters often called the confidence limits around the model parameters The EwE framework integrates many different data sources and parameters including values from the literature It can therefore be difficult to identify ldquoreasonablerdquo confidence limits when derived from such diverse data sources Standard practice in Ecopath models has been to develop a pedigree for each parameter with default values for uncertainty based on the nature of the source data For example parameter values based on high precision field observations of biomass within the model domain receive default confidence intervals of 10 whereas parameter values based on models developed for elsewhere or professional judgment receive confidence intervals of 8034 Sensitivity analyses are then run using parameter values selected from within these confidence intervals However if these default confidence intervals do not capture the full range of variability then the outputs are not informative of the variability in the lsquorealrsquo ecosystem Field observations were collected for many functional groups within the model domain in 2012 and 2013 as part of studies to support the RBT2 EIS Apparently the purpose of these observations was to document spatial variability (in part for the Ecospace model) and temporal variability (measurements at one location over time) and not to derive confidence intervals around the observations35
The reliance on the pedigree approach to derive confidence intervals for this Roberts Bank model was criticized by DFO ECCC and NRCan in discussions with the Proponent As a result the Proponent reran the model with much larger confidence intervals ranging from 30 to 100 depending on the input parameter and functional group36 The results from this new analysis using the broader confidence intervals were similar to those using the original pedigree approach The Proponent noted that ldquoWhile the production within each helliprun was very different there was little difference in the biomass ratio [with and without the Project] These results further demonstrate that even with a greater range in input values the influence of the Project on the Roberts Bank ecosystem is consistent among allhellipmodel runsrdquo37 This provides confidence that the model may be robust to uncertainty in its input parameters Two concerns
30 PMV Response 2016-03-02 p 70 lines 1321-1322 31 PMV Response 2016-03-02 p 71-74 32 PMV Response 2016-03-02 p 71 lines 1339-1341 33 PMV Response 2016-03-02 p 73 34 EIS Appendix 10-C Section 251 page 18 35 PMV Response 2016-03-02 p 42 lines 772-777 36 PMV Response 2016-03-02 p 44-47 37 PMV Response 2016-03-02 p 47 lines 855-858 and see also PMV Response 2016-03-02 Appendix 27-B
Pacific Region Science Response Technical Review Assessing
Ecosystem Productivity Model of Roberts Bank
17
remain however The quote above indicates that the production among the different model runs was very different although with little difference in the biomass ratios with and without the Project Since biomass is not the same as production it would be informative for understanding model performance and potential impacts to show these production differences This also relates to the point made in Section 34 regarding how well the model represents the real ecosystem and not just within-model comparisons with and without the Project The second question is more technical and relates to how the randomization (Monte Carlo or MC) routine that was used to create multiple model runs used the uncertainty about the diet data Diets are not currently included in the MC routine available to regular users of the Ecosim model how they were handled in this RBT2 model appears not to be explained
Finally the sensitivity analyses indicate that the uncertainty in the input parameters does not lead to much difference between model parameters with or without the project However this conclusion does not describe how the uncertainty in the input parameters affects understanding of the ecosystem
40 Conclusions Overall the main conclusion of the Environmental Impact Statement from the Proponent is stated as ldquohellipafter the implementation of mitigation hellipthe Project is not expected to result in any significant adverse effects on any of the 16 valued componentsrdquo38 In addition ldquohellipapproximately 40 of the functional groups are forecast to change no more than 5 which hellip is judged to be within the uncertainty of the model runsrdquo39 although larger changes were forecast for orange sea pens freshwater biofilm green algae and raptors The conclusions from the modelling studies are that ldquohellipthe proposed project will have an impact on the study area that the effect varies between species and that the findings are robust to parameter uncertaintyrdquo40 Specific outcomes by valued component as derived from the EwE model are presented by functional groups in Table 1
38 PMV March 2015 Roberts Bank Environmental Impact Statement Executive Summary ndash Part 1 page 37 39 EIS Appendix 10-C p ii 40 EIS Appendix 10-D p iv
Pacific Region Science Response Technical Review Assessing
Ecosystem Productivity Model of Roberts Bank
18
Table 1 Changes in productive potential with the Project as derived from the EwE model
Changes in productive potential
Ecosystem category
Number of valued
components
Number with potential
biomass loss
Moderate decrease (31-60 decline)
Minor decrease (6-30 decline)
Negligible (0-5
change)
Minor increase (6-
30 increase)
Moderate increase (31-60 increase)
Source
Marine vegetation
7 7 - 3 2 2 - EIS Vol 3 Section 11 Table 11-17 page 11-65
Marine invertebrates
4 3 1 1 1 1 - EIS Vol 3 Section 12 Table 12-8 page 12-52
Marine fish 13 13 - 2 6 5 - EIS Vol 3 Section 13 Table 13-10 page 13-95
Coastal birds
11 8 - 3 4 3 1 EIS Vol 3 Section 15 Table 15-10 page 15-67
Pacific Region Science Response Technical Review Assessing
Ecosystem Productivity Model of Roberts Bank
19
Most functional groups showed some potential biomass loss with the Project with biomass loss defined as any model run with negative outcomes (ie in which biomass with the project was less than biomass without the Project) The summary of changes in productivity potential are mixed with most (33 out of 35) valued components showing minor decreases to minor increases (defined as 6 to 30 changes in productive potential with the Project compared to without the Project)
The main conclusions of this review in regards to the Terms of Reference are
1 Do the functional groups and abiotic variables used in the model adequately represent the ecosystem at Roberts Bank
o The 58 functional groups and abiotic variables used in the model adequately represent the main components of the Roberts Bank ecosystem however for longer lived species the life stages of the species are not well represented and some of the impacts of the Project may be expected to affect specific life stages
o The abiotic variables adequately represent the physical drivers of this ecosystem on an annual time scale However annual values for these abiotic variables may not adequately capture important sub-annual events such as storms (DFO 2016) the timing of arrival and departure of highly migratory species and whether there may be important sub-annual thresholds or mismatches in timing as a result of the Project
o Biotic factors (eg nutrients) which are particularly important for biofilm and other lower trophic level taxa are not included in this model The model is therefore unable to assess the potential development of eutrophication and benthic organic enrichment events which may affect fish habitats in the study area
2 Are the parameter estimates used by the model valid and defensible for this system
o In general parameter estimates appear to be adequate for this system Field studies were done in two years to provide data in particular on distributions of selected functional groups for the Ecospace module Note the distribution studies focussed on taxa which were relatively immobile and therefore lsquofixedrsquo in space
o the selection of some model parameters would benefit from further explanation for example the choice of fixed diet matrices versus dynamic matrices which can vary with changes in abundances or predators and prey
o the selection of some model parameters would benefit from further explanation for example the link between the diets described in the text of Appendix 10B and the quantities presented in Appendix A of Appendix 10B It is understood that proportions were derived using the ldquofixed selectivityrdquo principle but in order to be fully transparent the derivation of each diet should be provided in an appendix
o discussion and explanation is needed of why ecotrophic efficiencies differ from expected values (eg the ecotrophic efficiency for Pacific herring is listed as 038) and
o the abiotic factor lsquosubstratersquo was limited to ldquohardrdquo or rdquosoftrdquo options which can be restrictive given that they serve as endpoints on a substrate composition continuum These limited options may not provide the sensitivity required to assess substrate preference nor the flexibility for taxa (eg motile organisms) that span hard mixed and soft substrate types In addition it is not clear if changes in the hardsoft categories were considered over time within identified depositional or erosional settings before and after construction
Pacific Region Science Response Technical Review Assessing
Ecosystem Productivity Model of Roberts Bank
20
3 Are the limitations and uncertainties of the model identified and appropriately considered when determining the modelrsquos representation of current and possible future conditions
o the EwE model was not designed to evaluate a range of future conditions It was designed to estimate changes in the productive potential at the ecosystem level with and without the Project Therefore the model was run without the Project and with the Project for a range of plausible abiotic conditions and the results were compared with respect to biomass and productivity by functional group
o the pedigree approach to assessing the uncertainties of model outcomes is unsatisfactory for the purpose here as it relates solely to a qualitative judgment of the value of data based on its source However when the model was rerun with much wider ranges of confidence intervals (uncertainties) the results in general (but not necessarily for each functional group) were similar to the results using the original pedigree approach This suggests that taken overall the model may be robust to wide ranges of uncertainty in these input variables and parameters
o there is inadequate validation of the model This is inadequate for three reasons
(i) the basic Ecopath model is not validated and the Ecospace balancing process (the spin-up period) resulted in some biomass estimates being increased or decreased beyond their confidence limits
(ii) the goodness of fit test used to evaluate how well the model predicted the spatial occurrence functional groups is not fit for purpose (Section 34) and
(iii) validation was provided for only a small number of functional groups (the habitat-forming functional groups) As a consequence the model is currently not validated
o Considering the proportion of open boundaries relative to closed boundaries in the model processes taking place outside the modelled ecosystem are likely to contribute to dynamics within the modelled ecosystem However these external processes may not be well-resolved by the EwE model as currently configured
4 Are the model results related to the potential effects of the Project on fish and fish habitat and migratory birds and their food resources valid and defensible
o this is a very complex ecosystem model constructed for a relatively small and open (in the sense of considerable exchange with adjacent non-modelled areas) system Many assumptions have been made based on poor or missing data Taking all these considerations into account the model does the best job possible of comparing the biomass and productivity of the Roberts Bank ecosystem with and without the Project
o the extent to which the model adequately represents the lsquorealrsquo ecosystem of Roberts Bank as opposed to comparisons of model results with and without the Project is unclear as a number of basic diagnostics are not presented (see point 3 above)
o the EwE model is not capable of and is not designed to represent nutritional and food quality variations in prey functional groups and how these may impact highly migratory predators such as birds with and without the Project
5 Is the EwE model framework a valid method to quantify large scale impacts to fish habitat fish productivity and migratory bird productivity
o the EwE model as implemented in this project and reviewed here is a useful first-order framework to organise information and derive initial estimates of how the system may respond to perturbations
Pacific Region Science Response Technical Review Assessing
Ecosystem Productivity Model of Roberts Bank
21
o the utility of a EWE model for impact purposes is highly dependent on the quality of input data
o each EwE model is highly dependent on local conditions Although appropriate as an overall methodology each application would need to be reviewed for how it may be applied to any new ecosystem and
o the EwE model would need to be substantially reformulated if it was to include considerations of changes in chemical composition or food quality of prey in particular for seasonal migratory species such as birds which may depend on very large biomasses of prey with specific chemical composition to fuel their migrations beyond the ecosystem model boundaries
Contributors Contributor Affiliation Ian Perry Author DFO Science Pacific Region Alida Bundy Author DFO Science Maritimes Region Terri Sutherland Author DFO Science Pacific Region Robert Elner Author ECCC Canadian Wildlife Service Andrew Robinson Author ECCC Canadian Wildlife Service Lesley MacDougall Editor DFO Science Pacific Region
Approved by Carmel Lowe
Regional Director Science Branch Pacific Region Fisheries and Oceans Canada
November 4 2016
Sources of Information Christensen V Coll M Steenbeek J Buszowski J Chagaris D walters CJ 2014
Representing variable habitat quality in a spatial food web model Ecosystems 17 1397-1412
Christensen V and Walters C 2000 Ecopath with Ecosim methods capabilities and limitations Ecological Modelling 172 109-139
Colleacuteter M Valls A Guitton J Gascuel D Pauly D and Christensen V 2015 Global overview of the applications of the Ecopath with Ecosim modeling approach using the EcoBase models repository Ecological Modelling 302 pp42-53
Compass Resource Management Ltd 2013 Roberts Bank Terminal 2 Technical Advisory Group (TAG) Process Report Productive Capacity ndash Final Report 119pp (Accessed November 1 2016)
DFO 2016 Technical Review of Roberts Bank Terminal 2 Environmental Assessment Section 95 ndash Coastal Geomorphology DFO Can Sci Advis Sec Sci Resp 2016045 (Accessed November 4 2016)
Pacific Region Science Response Technical Review Assessing
Ecosystem Productivity Model of Roberts Bank
22
ESSA Technologies 2014a Roberts Bank Terminal 2 Project Roberts Bank Delta BC Environmental Impact Statement Volume 3 Biophysical Effects Assessments Appendix 10-C Roberts Bank Ecosystem Model Development and Key Run Port Metro Vancouver (Accessed November 1 2016)
ESSA Technologies 2014b Roberts Bank Terminal 2 Project Roberts Bank Delta BC Environmental Impact Statement Volume 3 Biophysical Effects Assessments Appendix 10-D Roberts Bank Ecosystem Model Sensitivity Analyses Port Metro Vancouver (Accessed November 1 2016)
Franklin J 2009 Mapping Species Distributions Spatial Inference and Prediction Cambridge University Press Cambridge
Hemmera 2014 Roberts Bank Terminal 2 Project Roberts Bank Delta BC Environmental Impact Statement Volume 3 Biophysical Effects Assessments Appendix 10-B Roberts Bank Ecosystem Model Parameter Estimates Port Metro Vancouver File 302-03503 (Accessed November 1 2016)
Port Metro Vancouver 2015a Roberts Bank Terminal 2 Project Roberts Bank Delta BC Environmental Impact Statement Volume 3 Biophysical Effects Assessments Section 100 Biophysical Setting (Accessed November 1 2016)
Port Metro Vancouver 2015b Roberts Bank Terminal 2 Project Roberts Bank Delta BC Environmental Impact Statement Volume 3 Biophysical Effects Assessments Section 103 Overview of Assessing Ecosystem Productivity (Accessed November 1 2016)
Port Metro Vancouver 2015c Roberts Bank Terminal 2 Project Environmental Assessment Additional Information Requirements (July 31 2015) Responses Response to Information Request 6 IR-73115-06 Canadian Environmental Assessment Agency Reference Number 80054 dated 26 October 2015
Steenbeek J Coll M Gurney L Meacutelin F Hoepffner N Buszowski J and Christensen V 2013 Bridging the gap between ecosystem modeling tools and geographic information systems Driving a food web model with external spatialndashtemporal data Ecological Modelling 263 139ndash 151
Sutherland T Elner R and OrsquoNeill J 2013 Roberts Bank Ecological crucible of the Fraser River estuary Progress in Oceanography 115 171ndash180
Vancouver Fraser Port Authority 2016 From the Vancouver Fraser Port Authority to the Review Panel re Answers to preliminary technical questions submitted during the completeness phase from Fisheries and Oceans Canada Natural Resources Canada and Environment and Climate Change Canada concerning the ecosystem modelling to support the Roberts Bank Terminal 2 Project environmental review CEAR Document 547 (Accessed November 1 2016)
Pacific Region Science Response Technical Review Assessing
Ecosystem Productivity Model of Roberts Bank
23
This Report is Available from the Centre for Science Advice
Pacific Region Fisheries and Oceans Canada
3190 Hammond Bay Road Nanaimo BC V9T 6N7
Telephone (250) 756-7208 E-Mail csapdfo-mpogcca
Internet address wwwdfo-mpogccacsas-sccs
ISSN 1919-3769 copy Her Majesty the Queen in Right of Canada 2016
Correct Citation for this Publication
DFO 2016 Technical review of Roberts Bank Terminal 2 environmental assessment section 103 ndash assessing ecosystem productivity DFO Can Sci Advis Sec Sci Resp 2016050
Aussi disponible en franccedilais
MPO 2016 Examen technique de leacutevaluation environnementale du Terminal 2 agrave Roberts Bank section 103 ndash eacutevaluation de la productiviteacute de leacutecosystegraveme Secr can de consult sci du MPO Reacutep des Sci 2016050
- TECHNICAL REVIEW OF ROBERTS BANK TERMINAL 2 ENVIRONMENTAL ASSESSMENT SECTION 103 ndash ASSESSING ECOSYSTEM PRODUCTIVITY
-
- 10 Context
- 20 Background
-
- 21 Background and Terms of Reference
- 22 Approach to assessing ecosystem productivity
-
- 30 Analysis and Response
-
- 31 The EwE Team
- 32 Overview of assessment results of hydrological and sediment modelling
- 33 Model implementation
-
- 331 The purpose of the EwE model
- 332 Applicability of the EwE model framework to the Roberts Bank region
- 333 Model documentation
- 334 Highly mobile functional groups
- 335 Seasonality (model time step)
- 336 Life history structure
- 337 Model balancing
-
- 34 Model validation
- 35 Model results
-
- 351 Presentation of model results
- 352 Sensitivity and vulnerability analyses
-
- 40 Conclusions
- Contributors
- Approved by
- Sources of Information
- This Report is Available from the
-
- CSAS 2016-50 - Assessing Ecosystem Productivitypdf
-
- TECHNICAL REVIEW OF ROBERTS BANK TERMINAL 2 ENVIRONMENTAL ASSESSMENT SECTION 103 ndash ASSESSING ECOSYSTEM PRODUCTIVITY
-
- 10 Context
- 20 Background
-
- 21 Background and Terms of Reference
- 22 Approach to assessing ecosystem productivity
-
- 30 Analysis and Response
-
- 31 The EwE Team
- 32 Overview of assessment results of hydrological and sediment modelling
- 33 Model implementation
-
- 331 The purpose of the EwE model
- 332 Applicability of the EwE model framework to the Roberts Bank region
- 333 Model documentation
- 334 Highly mobile functional groups
- 335 Seasonality (model time step)
- 336 Life history structure
- 337 Model balancing
-
- 34 Model validation
- 35 Model results
-
- 351 Presentation of model results
- 352 Sensitivity and vulnerability analyses
-
- 40 Conclusions
- Contributors
- Approved by
- Sources of Information
- This Report is Available from the
-
Canadian Science Advisory Secretariat Pacific Region Science Response 2016050
December 2016
TECHNICAL REVIEW OF ROBERTS BANK TERMINAL 2 ENVIRONMENTAL ASSESSMENT SECTION 103 ndash
ASSESSING ECOSYSTEM PRODUCTIVITY
10 Context Vancouver Fraser Port Authority (VFPA) formerly Port Metro Vancouver (the Proponent) is proposing to construct and operate the Roberts Bank Terminal 2 Project (the Project) a new three-berth marine container terminal at Roberts Bank in Delta British Columbia The proposed terminal is located next to the existing Deltaport and Westshore Terminals In addition to the construction of the new terminal the Proponent has proposed to widen the north side of the existing Roberts Bank causeway from its east-end connection with the mainland to the entrance to the new terminal The existing tug basin connected to the northeast side of Deltaport Terminal is also proposed to be expanded The new marine terminal is predicted by the Proponent to process up to 260 container ship calls per year at full capacity with the assistance of two or three large berthing or escort tugs to manoeuver ships into or away from assigned berths The terminal is designed to operate 24 hours per day year-round
The Roberts Bank Terminal 2 Project is subject to an environmental assessment by a Review Panel pursuant to the Canadian Environmental Assessment Act 2012 As a federal authority in the environmental assessment for the Project Fisheries and Oceans Canada (DFO) will be asked to present information to the review panel and at public hearings in relation to its expertise on the effects of the Project on fish and fish habitat including aquatic species at risk and the adequacy of mitigation and offsetting measures and monitoring and follow-up programs proposed by the Proponent DFOrsquos Pacific Region Fisheries Protection Program (FPP) will coordinate DFOrsquos participation in the environmental assessment
The Proponent assessed future ecosystem productivity at Roberts Bank using the Ecopath with Ecosim and Ecospace (EwE) model framework The potential impacts of the Project to hydrodynamic conditions and sediment transport in the area as a result of changes in wind wave and current patterns and intensities are projected using different model frameworks A companion Science Response (DFO 2016) has been developed by DFO and Natural Resource Canada (NRCan) to review Section 95 ldquoCoastal Geomorphologyrdquo of the Environmental Impact Statement (EIS) which describes the hydrodynamic and sedimentology models that were used to evaluate the effect of the Project on water and sediment movements
Outcomes of the EwE models are incorporated into the analysis of the potential project-related effects on the ongoing productivity of commercial recreational and Aboriginal fisheries Consequently DFO FPP has requested that DFO Science Branch provide an evaluation of the Proponentrsquos characterization of project-related effects as conducted using the Ecopath with Ecosim and Ecospace (EwE) ecosystem model
Pacific Region Science Response Technical Review Assessing
Ecosystem Productivity Model of Roberts Bank
2
The objectives for this Science Response are to
1 Determine if the functional groups and abiotic factors used in the model adequately represent the ecosystem at Roberts Bank
2 Assess whether the parameter estimates used by the model are valid and defensible for this system
3 Assess whether the limitations and uncertainties of the model are identified and appropriately considered when determining the modelrsquos representation of current and possible future conditions
4 Provide advice regarding whether the model results related to the potential effects of the Project on fish and fish habitat and migratory birds and their food resources are valid and defensible
5 If possible provide advice regarding the validity of using the EwE model framework to quantify large scale impacts to fish habitat and fisheries productivity and the productivity of migratory birds
This Science Response evaluates Section 100 ldquoBiophysical Settingrdquo with a focus on Section 103 ldquoOverview of Assessing Ecosystem Productivityrdquo in the EIS as submitted by the Proponent (Port Metro Vancouver 2015) This Section and consequently this Response describes the ecosystem modelling approach that was taken to evaluate the direct and indirect effects of the footprint of the proposed terminal and widened causeway herein referred to as lsquothe Projectrsquo This ecosystem model provides outputs related to potential effects of the project on the study area at an ecosystem level including aquatic species and bird species in the Project area Evaluation of the model and its outputs therefore required expertise in both fishery aquatic species and migratory bird species Consequently this Science Response is the product of a joint review between DFO and Environment and Climate Change Canada (ECCC) Canadian Wildlife Service and Wildlife and Landscape Science to provide a complete evaluation
This Science Response Report results from the Science Response Process of July 2016 on the Technical Review of Ecopath with Ecosim and Ecospace (EwE) Ecosystem Productivity Model application to the Roberts Bank Terminal 2 Environmental Assessment
20 Background
21 Background and Terms of Reference The Projectrsquos main components have a proposed combined marine footprint area of approximately 179 km2 listed below by specific component
bull Marine Terminal 1335 km 2 including terminal (116 km 2) and dredged berth pocket and marine approach areas (0174 km 2)
bull Widened Causeway 0424 km 2
bull Expanded Tug basin 0031 km 2
Roberts Bank in the Fraser River estuary consists of complex intertidal and subtidal habitats including intertidal eelgrass beds and is an important stopover area for migrating shorebirds and productive feeding and rearing habitats for many fish and invertebrate species It also provides habitat for endangered Southern Resident Killer Whales and other marine mammals
Pacific Region Science Response Technical Review Assessing
Ecosystem Productivity Model of Roberts Bank
3
The environmental conditions at Roberts Bank are dynamic and are influenced by a variety of oceanographic and atmospheric factors including the Fraser River freshwater and sediment plume discharge diurnal tidal currents and prevailing and storm-generated wind and wave activity In addition the intercauseway region provides significant drainage from marsh and agricultural areas which have different characteristics from marine waters and which run along the ferry causeway
To provide the required science advice this Science Response focusses on Section 10 ldquoBiophysical Settingrdquo of the Environmental Impact Statement (EIS) (Port Metro Vancouver 2015a) specifically Section 103 ldquoOverview of Assessing Ecosystem Productivityrdquo (Port Metro Vancouver 2015b) and its related Appendices 10-B ldquoRoberts Bank Ecopath with Ecosim and Ecospace model parameter estimatesrdquo (Hemmera 2014) Appendix 10-C ldquoRoberts Bank Ecosystem model development and key runsrdquo(ESSA Technologies 2014a) and Appendix 10-D ldquoRoberts Bank Ecosystem model sensitivity analysesrdquo (ESSA Technologies 2014b) Additional important information was obtained from the Response to Information Request 6 (IR-73115-06 Canadian Environmental Assessment Agency Reference Number 80054 dated 26 October 2015) (Port Metro Vancouver 2015c) and the Written Responses to Coastal Geomorphology and Ecosystem Modelling Questions provided by the Proponent to DFO ECCC and NRCan on 2 March 2016 (Port Metro Vancouver (PMV) Transmittal TRE-01-RBT2-0004A subsequently referred in this Science Response as ldquoPMV Response 2016-03-02rdquo) (Vancouver Fraser Port Authority 2016)
The process followed in preparing this Science Response involved an initial review of the submitted EIS followed by an in-person meeting of the Proponent its contractors and representatives of DFO ECCC and NRCan to discuss and clarify questions arising from the initial review (Vancouver 23 November 2015) DFO and NRCan provided written questions to the Proponent based on preliminary review of the EIS on November 19 2015 ECCC also provided written questions based on its preliminary review of the EIS to the Proponent on December 1 2015 and January 20 2016 This large initial meeting was followed by smaller focussed meetings between the Proponent its contractors and DFO and NRCan on 11 December 2015 to clarify hydrology and sediment modelling questions with DFO on 8 January 2016 to clarify ecosystem modelling questions and with ECCC on 18 February 2016 to clarify questions relating to birds Written responses to all of these meetings and questions were provided by the Proponent to DFO ECCC and NRCan as the ldquoPMV Response 2016-03-02rdquo and ldquoPMV Response 2016-05-30rdquo (Vancouver Fraser Port Authority 2016) VFPArsquos answers to questions posed by DFO and NRCan regarding coastal geomorphology modelling have been posted to the Canadian Environmental Assessment Registry (CEAR)
22 Approach to assessing ecosystem productivity The Proponent adopted an ecosystem approach to evaluate the direct and indirect effects of the Project on the productivity of the Roberts Bank ecosystem A weight of evidence approach was used to assess the potential effects of the project on the productivity of the ecosystem and selected key components in the study area this approach included a spatial ecosystem simulation model (which included a habitat capacity model) a shorebird opportunity model and empirical data An important point is that any effects on the system during the construction phase or from expansion of the tug basin were excluded from this modelling process the focus instead being a comparison of modelled system productivity before and after the proposed terminal and expanded causeway is in place The chosen ecosystem simulation model was
Pacific Region Science Response Technical Review Assessing
Ecosystem Productivity Model of Roberts Bank
4
Ecopath with Ecosim and its spatial version Ecospace (collectively referred to here as the EwE framework or EwE model) This modelling approach was recommended by a prior Productive Capacity Technical Advisory Group comprised of representatives of technical experts from government agencies academia non-governmental organizations Vancouver Fraser Port Authority and its consultants (Compass 2013) convened by the Proponent and which also recommended a selection of focal species for the model The final selection of functional groups and the resulting food web that form the core of this ecosystem model are shown in Figure 1
Pacific Region Science Response Technical Review Assessing
Ecosystem Productivity Model of Roberts Bank
5
Figure 1 Ecopath with Ecosim model food web for Roberts Bank (Adapted from EIS Volume 3 Section 10 Fig 1033 on page 10-16) The groups coloured in orange represent focal groups size of symbols represents relative annual amount of biomass in the Roberts Bank study area
Pacific Region Science Response Technical Review Assessing
Ecosystem Productivity Model of Roberts Bank
6
The EwE framework is a common approach to ecosystem modelling which has been developed and expanded over the past two to three decades It currently has three main components
1 Ecopath ndash the core model which provides a mass-balance snapshot of the system
2 Ecosim ndash a module that enables simulation modelling over time
3 Ecospace ndash a module that enables simulation modelling over space
In order to make an EwE model tractable species are aggregated into functional groups based on their similar ecological characteristics (habitat and prey preferences etc) the Roberts Bank models had 58 functional groups The first step (Ecopath) was to obtain input parameters representing biomass production consumption emigration and diet for each functional group These parameters were then tuned in an iterative process until the overall production and consumption was balanced (a mass-balance approach) resulting in a model food web with estimates of energy flow between functional groups (Fig 1)
In the second step Ecosim was combined with the spatial model Ecospace The abiotic variables selected in this EIS (depth salinity bottom current wave height sediment type) were used as external forcings to the Ecospace module These abiotic variables provided the physical forcings for the simulations without and with the Project Since time series data on the functional groups of the model were not available Ecospace was run until the model reached equilibrium using various assumptions of the value of the vulnerability parameter (see Section 352) In this EIS the selected time step was annual with all variables abiotic and biotic expressed as yearly averages As used in this EIS the Ecospace module included a habitat capacity model which estimated the distribution of functional groups based on their environmental preferences for each abiotic variable (depth salinity bottom current wave height) and for substrate type (sand mud etc) The model thus allocated the spatial distribution of functional groups over the model domain based on their environmental preferences and the distributions of these abiotic variables with and without the Project The selected spatial unit size (ldquopixelrdquo) for the Ecospace model was 100 m2 In essence an Ecopath model was constructed for each pixel with particular rules governing how the functional groups interacted and moved among these spatial units The Ecospace module was run until it approached equilibrium (20 model years) to establish the spatial patterns without the Project For the lsquowith the Projectrsquo simulations the model was run for an initial 10 years and then the spatial patterns of the abiotic variables with the project were added and the model run for an additional 10 years1 The model outputs predicted changes in the productive potential of the Roberts Bank ecosystem as a comparison (ratio) with and without the Project rather than an absolute biomass that would be lost or gained as a result of the Project
1 EIS Appendix 10-C p 26
Pacific Region Science Response Technical Review Assessing
Ecosystem Productivity Model of Roberts Bank
7
30 Analysis and Response To prepare this response the following sections of the EIS additional documents were reviewed
DocumentSection Title
EIS Section 10
Including appendices 10B 10C and 10D
(Port Metro Vancouver 2015a Hemmera 2014 ESSA Technologies 2014a ESSA Technologies 2014b)
Biophysical Setting
Appendix 10-B Roberts Bank Ecosystem Model Parameter Estimates Port Metro Vancouver File 302-03503
Appendix 10-C Roberts Bank Ecosystem Model Development and Key Run Port Metro Vancouver
Appendix 10-D Roberts Bank Ecosystem Model Sensitivity Analyses Port Metro Vancouver
CEAR document 547 (Including Appendices) ldquoPMV Response 2016-03-02rdquo and ldquoPMV Response 2016-05-30rdquo
(Vancouver Fraser Port Authority 2016)
Vancouver Fraser Port Authority to the Review Panel re Answers to preliminary technical questions submitted during the completeness phase from Fisheries and Oceans Canada Natural Resources Canada and Environment and Climate Change Canada concerning the ecosystem modelling to support the Roberts Bank Terminal 2 Project environmental review
31 The EwE Team Building this ecosystem model was a complex undertaking which required knowledge of the ecosystem to be modelled how to set initial parameter values determination of reasonable ranges of these parameters how to balance the model and how to recognize when the model outputs were unrealistic These tasks became even more complex when spatial model dynamics were involved such as with Ecospace The team engaged by the Proponent to conduct this ecosystem modelling for the Roberts Bank Terminal 2 (RBT2) EIS was led by scientists at the Institute for Oceans and Fisheries located at the University of British Columbia in Vancouver These scientists are global leaders of the EwE model framework having developed much of its current implementation and who continue to lead its elaborations and extensions Construction and running of the model for this specific ecosystem was done in collaboration with ESSA Technologies of Vancouver Parameter values for the ecosystem model were obtained in part from observational studies conducted in the area by Hemmera of Burnaby BC
32 Overview of assessment results of hydrological and sediment modelling Implementation of the ldquowith the Projectrdquo simulations of the ecosystem model was done by driving the model with the abiotic variables as they were projected to be distributed with the Project footprint In the context of this EIS specifying depth salinity bottom currents wave height and sediment type conditions without the Project and changes with the Project were achieved by construction of hydrodynamical and sediment transport models The outputs from these models in combination with the identified environment preferences for the various biological groups were then used as inputs to the Ecospace model to define the spatial
Pacific Region Science Response Technical Review Assessing
Ecosystem Productivity Model of Roberts Bank
8
distributions of these functional groups The implementation of these hydrological and sediment transport models in this EIS was reviewed by DFO and NRCan (DFO 2016) This review concluded that the implementation of these models for this EIS was adequate for average winter conditions but lacking in validation for summer conditions in particular with strong freshwater flows from the Fraser River Simulations of strong storm events and their impacts on wave conditions and sediment transport were also lacking The effect of wave action and current speeds on sediment transport is non-linear such that increasing winds over short periods of time can impact sediment transport processes bottom topography and water depths beyond that determined under average model conditions Overall the review concluded that a greater range of sensitivity analyses is required to have confidence in the model outputs under lsquonon-averagersquo conditions The implication of this conclusion for the present review of the EwE model is that the full range of variability of abiotic characteristics such as bottom topography bottom current and wave heights and how they may affect relevant functional groups in the model with the Project may not be adequately represented Sensitivity analyses were provided by varying the intensity of abiotic variables and by removing abiotic variables to assess their interactive effects In general the ecosystem model outputs were robust to these sensitivity analyses with most groups varying by less than 5 Larger changes however were observed for primary producer and bird groupings and for some fish groups when various abiotic variables were omitted2
33 Model implementation 331 The purpose of the EwE model
The EwE model was intended to provide one line of evidence to assess the potential impacts of the Project on the Roberts Bank ecosystem which would then be used with other lines of evidence to make the final assessment Specifically ldquohellip the objective of the RB [Roberts Bank] model was not to provide an assessment of Project impacts for each functional group at a fine temporal scale but to estimate changes in productive potential with and without the Project at the ecosystem levelrdquo3 In addition ldquohellipthe primary objective of the RB ecosystem model is to evaluate potential changes in productivity from such abiotic factors with and without the terminal and causewayrdquo4 Results are presented for the selected functional groups no results were presented on potential changes in ecosystem structure or function
332 Applicability of the EwE model framework to the Roberts Bank region EwE models work best when the exchanges within the system being modelled are greater than the exchanges between the modelled system and the lsquooutsidersquo world In practice this means that EwE models work best for larger systems with few external exchanges In a meta-analysis of 433 Ecopath models Colleacuteter et al (2015) concluded that ldquohellipin the last two decades the range of the models area has expanded toward very large areas and the median has shifted accordingly from about 1000 km2 in 1984ndash1993 to about 100000 km2 in 1994ndash2014rdquo The section of the Roberts Bank ecosystem that is included in the EwE model was comparatively small (5468 km2) and complex It is an intertidally-dominated environment that is subject to strong seasonal influences of both freshwater and marine exchanges across relatively large seaward and shoreward boundaries
2 EIS Appendix 10-D p ii - iii 3 PMV Response 2016-03-02 p 99 lines 1914-1917 4 PMV Response 2016-03-02 p 38 lines 689-691
Pacific Region Science Response Technical Review Assessing
Ecosystem Productivity Model of Roberts Bank
9
Processes taking place outside the modelled ecosystem will contribute to dynamics within the modelled ecosystem (eg lsquooutsidersquo food supporting predators which occur in the Roberts Bank ecosystem for only part of the year predators which may feed in the Roberts Bank ecosystem but export this energy when they migrate out of the region) but which may not be well-resolved by the EwE model The Proponent justifies the spatial scale because it was specifically chosen for the questions being asked in regard to assessing productivity changes and because the relative influences of external exchanges are assumed to be identical with and without the project In addition highly mobile species with broad prey bases were assumed in the model to be partially sustained by external energy from outside the model system5 The distributions of organisms may differ however with and without the project which may affect their interactions with areas outside of the modelled system and the use of diets from outside the modelled system may not reflect the impacts of the project Further clarification of how the EwE model captures the exchanges and interactions with adjacent ecosystems are needed For example it could be argued that an ecosystem which is open to frequent exchanges of water and organic matter from beyond its boundaries might be more robust to local disturbances such as the Project
There are some inconsistencies in the information and assumptions used for some of the taxa in this ecosystem model For Dungeness Crab the justification for estimating total adult biomass (including females) from the biomass of fished males is unclear In addition it is unclear if the slower growth of female crabs once they have reached sexual maturity in comparison with male crabs has been considered The diet matrix for spiny dogfish does not represent the actual diet well in particular of euphausiids herring and shrimp and there are more recent references for biomass estimates of spiny dogfish in the study area than what was used in the EIS
Fishing mortality was not included in the model under the assumption that this would not change with or without the project While this assumption may be true the model has been parameterized by ignoring a source of mortality that will influence total production In essence fishing removes biomass from the ecosystem with the result that less biomass will be available for higher trophic levels How this may impact the ecosystem with and without the Project is unclear but it could make noticeable differences if for example there were thresholds in the feeding responses by these higher trophic level species The Ecopath model that was used is relatively unconstrained since many ecological efficiencies are low even for forage species which would be expected to be higher It is not clear how many species are exploited or the levels of exploitation but even if this does not change with the Project these mortality rates should be included in the model in order to add realistic constraints to the exploited functional groups
333 Model documentation Based on questions from DFO ECCC and NRCan following their initial review of the EIS the Proponent provided written responses dated 2 March 2016 to clarify several of the steps in the model development and implementation However several questions remain including questions about the Ecospace module Ecospace has undergone several recent developments such as the inclusion of the spatial-temporal data layer framework (Steenbeek et al 2013) the habitat capacity model (Christensen et al 2014) and the Monte Carlo analysis including the diet matrix As yet there are few published studies using these latest Ecospace developments and their documentation and justification need to be improved in the EIS
5 PMV Response 2016-03-02 p 29 lines 446 - 464
Pacific Region Science Response Technical Review Assessing
Ecosystem Productivity Model of Roberts Bank
10
Questions also remain regarding how the Monte Carlo randomization routine treated diet data The report indicates that the Monte Carlo routine randomly selected input parameters from the input ranges and that only models that were balanced were used This suggests that a high proportion of models were not balanced and therefore were not used (for example the EIS indicates that about one out of 1000 sampled input parameters was balanced6) A table showing the minimum maximum mode average and median values from the Monte Carlo runs for all the parameters would enable an evaluation of how much variation was actually sampled by the balanced model runs This is recommended in the EwE user information ie ldquoUsers should check the range of the input parameters that were actually used in the trials in the output csv file (see below)rdquo7
In addition there are several issues with the documentation of the derivation of the parameters for the functional groups Such documentation should clearly outline how the input parameter was estimated and the range of uncertainty for that parameter For example the input biomass of pinnipeds was defined as 04 t km 2 derived from estimates of 034 for Harbour seals and two estimates for Steller sea lions (012 and 014 t km 2) No explanation was provided for how the overall estimated pinniped biomass of 04 t km 2 was determined The diet of Sand Lance was described in the EIS as consisting mostly of zooplankton8 whereas the diet table for the model runs9 included 20 macrofauna 10 green algae and 10 detritus It is unclear why these additional prey were included in the diet used for the model runs
334 Highly mobile functional groups This implementation of the EwE framework included transient and migratory functional groups This is entirely appropriate and these groups cannot be excluded The approach taken in the Ecospace module was to impose a low (and conservative) dispersal rate among model spatial units (lsquopixelsrsquo) of 1 km yr-1 This may be appropriate for low mobility benthic organisms but it likely underestimates the movements of many other functional groups The effects of using higher and perhaps functional-group-specific dispersal rates was not considered The Proponents argued that higher dispersal rates would reduce impacts since species can move away from less desirable areas more quickly for completeness these runs should be done and evaluated Mobile species will also bring energy (food) captured outside the system into the modelled ecosystem This process was included in the model with the use of a diet import factor reflecting the consumption of prey outside the modelled region with the assumption that groups with high import rates were unlikely to respond to local changes on Roberts Bank10 This assumption needs justification perhaps at the functional group level for example many species of highly migratory birds and Pacific salmon use the Roberts Bank ecosystem to obtain food to continue their migrations Although this food does not compose a large fraction of their annual consumption it can be critical to enable them to continue their migrations
The EwE model is not designed to capture differences in prey quality ie differences in essential fatty acid or nutrient ratios The same species of prey may have greater or lesser nutritional value to predators depending on the conditions under which they are growing and their seasonal variations This is a particular concern with the nutritional quality of the diatom-dominated biofilm Diatomaceous biofilm is important to the highly migratory Western Sandpiper (Calidris mauri) Despite its predictive merits in relation to other ecosystem
6 EIS Appendix 10D Section 24 p5 7 EwE Help file p 151 8 EIS Appendix 10B Section 4133 p 76 9 EIS Appendix A of Appendix 10B 10 PMV Response 2016-03-02 p 28 lines 429 - 436
Pacific Region Science Response Technical Review Assessing
Ecosystem Productivity Model of Roberts Bank
11
components the EwE model is not informative with respect to understanding the potential impacts of the Project on biofilm and the Western Sandpiper While this example is specific to seabirds the potential exists for differences in the quality of biofilm to also be an issue for copepods which feed on biofilm and consequently to juvenile salmon which feed on these copepods (eg Sutherland et al 2013)
The EwE model is also not designed to predict effects of the Project on water quality although the Proponent noted that ldquoOther abiotic factors not included were deemed to be representative of variables that were already included in the modelhelliprdquo11 The Project may cause changes in physical and water quality conditions whether in isolation or in combination which may impact the productivity or nutritional quality of key prey organisms for local and migratory species which will not be captured by the model The EwE model does not assess the production of key nutrients or the implications of changes in important physical and water quality parameters to biofilm community structure and hence to important migratory birds
The model does not include biotic factors for both pelagic and benthic environments to assess the potential development of eutrophication and benthic organic enrichment events respectively Organic and redox indicators traditional measures of environmental assessments that are used to determine changes in functional group responses were included in the recent Deltaport Third environmental assessment (ie Pelagic chlorophyll dissolved nutrients Benthic sediment carbonnitrogen content redox state [sulfide concentration]) Benthic anoxic events based on organic enrichment are known to be strong drivers of community composition and exclusion regardless of substrate type In the absence of biotic factors (eg organic particulates) the model has not considered the potential for benthic organic enrichment which coincides with siltation processes within the upper tidal flats The tidal flat corner bordered by the Delta-dyke and Deltaport causeway has served as a catchment area for Fraser River silt since the development of the original Deltaport causeway (Sutherland et al 2013) The proposed position of the new terminal placed at the seaward termination of the Deltaport causeway may produce a crescent-shaped feature in the wake of the Fraser River Plume This feature may provide a more efficient silt trap that will promote benthic organic enrichment This piece of the environmental assessment seems to be missing and is important for assessing fish habitat in this area
335 Seasonality (model time step) Input data to parameterize the model were available on a range of time scales from hourly (eg physical data on salinity and water flow) to annual (eg species biomass) The Proponents indicated12 that this is a strength of the EwE model although ultimately the model was run with an annual time step with all sub-annual values being averaged to annual values This method therefore did not incorporate important seasonal processes such as winter-summer differences in salinity and storm properties and the seasonal appearances of abundances of predators and prey such as migratory salmon and birds that are much larger than the annual average For example juvenile salmon migrate from the Fraser River and onto Roberts Bank in the spring before moving into deeper waters If these spring abundances are averaged over the entire year these average abundances would be 5-10 times lower than the actual abundances during the spring (ie averaging the biomass that occurs in two months over a 12 month period) Additionally this method did not capture the intensity of processes such as growth and predation which can be focused over periods of a few weeks to a few months There may be important threshold effects at particular times and places which may be missed when using an 11 EIS Section 10 p 10-11 12 PMV Response 2016-03-02 p 86 line 1655
Pacific Region Science Response Technical Review Assessing
Ecosystem Productivity Model of Roberts Bank
12
annual time step for the model The Ecospace module has a monthly time step13 and therefore it is feasible to run this module with a sub-annual time step For example the Proponents submit14 that there are inadequate data to model the potential effects of the Project on the timing of biofilm production which could have implications for the migratory dunlin and Western Sandpiper However this could be modelled in an exploratory way to determine hypotheses about which factors could affect the timing of production of biofilm and the potential impacts on these birds These issues are of major concern to ECCC
336 Life history structure The EwE model did not separate functional groups into life history stages (stanzas) yet for many functional groups the juvenile stages can have very different life history characteristics and habitats than the adults It is unclear in the description of the model how different life history structures were considered and whether for example there were enough juveniles to produce the adults The implications of not including early life stages should be explored at least qualitatively to identify which species might have life stages that may be more vulnerable to project effects
337 Model balancing Balancing an EwE model is the process by which parameters are adjusted so that there is sufficient production for consumption requirements ie there are sufficient prey for all predators Expert opinion was used to examine parameter values and to adjust for errors or inconsistencies in logic ldquoPMV is confident that since the approach taken to balance the model was based on best practices the steps are appropriaterdquo15 Adjustments to initial parameters to ensure an ecologically-feasible model are necessary and to be expected For a few functional groups however very large changes to initial parameter estimates (which were often not based on Roberts Bank specific data) were necessary for example to transient killer whales When such initial parameters were adjusted (often by substantial amounts) by expert opinion to balance the model the confidence intervals around these adjusted parameter values were not increased to reflect this added uncertainty (see for example PMV Response 2016-03-02 p 51 lines 955-956) When expert opinion was used to make very large changes to initial parameter values broader confidence intervals about these parameters should have been applied This does not appear to have been the case and as a consequence may cause the actual uncertainty of the model outputs to be underestimated
Another example is for the pinniped group in which 50 of the diet was assumed to come from outside the model area in order to balance the model The rationale provided was ldquoThe pinnipeds caused excessive predation mortalities on numerous fish functional groups The biomass of pinnipeds was an average for the Strait of Georgia which was likely too high for Roberts Bank Therefore it was assumed that pinnipeds extracted only half of their diet from the study areardquo16 It is unclear whether the sensitivity of the model to different percentages of diet allocation was explored
As noted above (332) the Ecopath model was relatively unconstrained and few adjustments to input parameters were required to balance the model This is unusual and the low ecotrophic efficiencies of several functional groups suggest that full accounting of energy flows may not have been achieved (an ecotrophic efficiency of 1 indicates that 100 of the production of that
13 EIS Appendix 10C Section 29 p24 14 EIS Appendix 10D Appendix C p72 15 PMV Response 2016-03-02 p 49 lines 910-912 16 EIS Appendix 10C Section 261 p 20
Pacific Region Science Response Technical Review Assessing
Ecosystem Productivity Model of Roberts Bank
13
particular group is being preyed upon or removed by fishing leaving no individuals to die of old age17) An ldquoexcessrdquo of individuals dying of old age ie ecotrophic efficiencies much less than 1 suggests a potentially large biomass that is not used by the ecosystem and instead is converted to detritus
34 Model validation Model validation is the process by which the model parameters variables and outputs are compared with those from the real ecosystem to ascertain how well the model represents the ecosystem It is an essential step in providing confidence that the projections from the model in this case with and without the Project have relevance to how the real ecosystem may be expected to function with and without the Project In practice validating complex ecosystem models is difficult considering the range of assumptions that must be made when building the model the limited available data and natural variability of the ecosystem at a variety of time and space scales
Many of the standard diagnostics for the Ecopath model have not been evaluated in the EIS The Proponent appears to have assumed that once the Ecopath model was balanced then it was valid and fit for purpose The Proponent should provide all the Ecopath estimates of vital rates including mortality rates As presented questions remain For example many Ecotrophic Efficiencies (which control the transfer of biomass from prey to predators) are less than 1 even for taxa which would be expected to be close to 1 such as carnivorous zooplankton The reason for Ecotrophic Efficiencies less than 1 were not discussed or explained in the EIS
Detailed diagnostics for the Ecospace model should also be presented in order to evaluate model performance In response to criticisms by DFO ECCC and NRCan in discussions with the Proponent the latter provided the biomass of the functional groups from the Ecopath model (before Ecospace) and the Ecospace model after the spin-up period (which involved adjusting the parameters from the Ecopath model to balance the 5468 separate cells of the Ecospace model)18 The Proponents argue that ldquoIt is important to note that changes in biomass values generated during the spin-up period are identical for both with and without Project scenarios and thus do not provide information on the potential Project-related effects on productivity19 However several changes to biomass result from the Ecospace balancing process (spin-up period) This is only given brief attention by the Proponent in its response to the DFO ECCC and NRCan questions An analysis of Table 620 revealed that the biomass of 9 functional groups was larger or smaller than the widest confidence limits allowed for each group21 This requires further discussion and justification
The Proponent used a goodness of fit measure to compare spatial distributions of model outputs with field observations They indicated that ldquono other EwE models were identified which use a goodness-of-fit measure Hence the RB model is potentially the first such EwE model where a goodness of fit measure has been appliedrdquo22 The chosen goodness of fit measure is the percent correct classification (PCC) method23 This method derives a test statistic based on the proportion of locations at which predicted occurrences from the model match observed
17 EIS Appendix 10-B p 11 18 PMV Response 2016-03-02 p 65-66 Table 6 19 PMV Response 2016-03-02 p 64 lines 1205-1207 20 PMV Response 2016-03-02 p 65-66 Table 6 21 PMV Response 2016-03-02 p 45 Table 3 22 PMV Response 2016-03-02 p 78 lines 1481-1483 23 PMV Response 2016-03-02 p 78 lines 1483-1484
Pacific Region Science Response Technical Review Assessing
Ecosystem Productivity Model of Roberts Bank
14
occurrences from data and similarly with predicted and observed absences The Proponent then calculated two additional accuracy of fit measures sensitivity (the model predicts a species to occur in an area where it is known to occur in reality) and specificity (the model predicts a species does not occur in an area it is known not to occur in reality)24 This analysis concluded that the model has high predictability for functional groups such as eelgrass and sea pens with relatively static distributions but lower predictability for functional groups which are more temporally and spatially dynamic such as biofilm and green algae25
There are two problems with this approach The first is that this goodness of fit comparison was done only for habitat-forming functional groups no discussion of how well this analysis applies to mobile functional groups was provided The second problem is that this method does not take into account situations (such as occurs in this study with several groups) in which species occur at only a few locations For example ldquohellipif the test data consist of 95 absences and 5 presences and this reflects the true prevalence of the species on the landscape (a realistic scenario for a rare species) a lsquonullrsquo model that predicted absence in all cases (eg no model at all) would be correct 95 of the timehellipldquo (Franklin 2009 p 151) This latter point is important here as these habitat functional groups (biofilm brown algae native eelgrass green algae Japanese eelgrass tidal marsh biomat and orange sea pens26) appear not to occur over most of the Project area (as portrayed by the model outputs presented in the distribution figures of PMV Response 2016-03-02 Appendix 218) It is therefore important that a robust evaluation of the performance of the Ecospace module is used with preferably more than one measure
In summary the starting point for this modelling analysis matters It is not just about a comparison between results with and without the Project The model has to be considered a sufficient representation of the ecosystem The Proponent has not yet sufficiently validated the model
35 Model results 351 Presentation of model results
As noted above (Section 331) the stated objective of the Roberts Bank ecosystem model was not to provide an assessment of Project impacts for each functional group at a fine temporal scale but to estimate changes in productive potential with and without the Project at the ecosystem level27 However results were presented as comparisons by speciesfunctional group with and without the Project and not as potential changes in total ecosystem productivity The revised figures for each functional group showing distributions without the Project with the Project and their difference indicated impacts were likely to be localized with overall impacts relatively small The range of biomass ratios with and without the Project was 045 ndash 189 with most values slightly less than 1 This is interpreted as indicating slight decreases in the capacity of the study area to support biomass and production with the Project for many functional groups28 (Figure 2)
24 PMV Response 2016-03-02 p 80 lines 1524-1527 25 PMV Response 2016-03-02 p 81 lines 1551-1559 26 PMV Response 2016-03-02 p 82 Table 8 27 PMV Response 2016-03-02 p 99 lines 1914-1917 28 PMV Response 2016-03-02 Appendix 218
Pacific Region Science Response Technical Review Assessing
Ecosystem Productivity Model of Roberts Bank
15
Biomass Ratio
Freq
uenc
y
04 07 10 13 16 19
05
1015
2025
30
Figure 2 Histogram of biomass ratios obtained by comparisons of model runs with and without the project (ie With Without) Values less than 1 indicate reductions in biomass with the Project compared against without the Project) Data from Appendix 218 of PMV Response 2016-03-02
352 Sensitivity and vulnerability analyses Every ecosystem model is only one possible representation of the true ecosystem defined by the modelrsquos structure and the values chosen for its many parameters The key point is how well the model represents the real system how that fit can be measured and the sensitivity of model outputs to variability in the selected parameter values The ideal model should be robust to a wide range of uncertainties in the input data and parameters This robustness is determined by performing sensitivity analyses on the model to see how it responds to variations in the input parameters and determining to which input parameters the model is most sensitive
The vulnerability parameters determine the strength of the feeding interactions between functional groups They set the level of density dependence of each functional group Higher vulnerability settings provide greater top-down (predator) control whereas lower settings provide greater bottom-up (environmental) control29 Several publications have shown that EwE models are very sensitive to the vulnerability parameters and Christensen and Walters (2000) point out that a main pitfall of EwE is that ldquopredation vulnerabilities are often underestimated lessening the modelled impacts of predationrdquo It is usual practice to tune Ecopath models including the vulnerability parameters to time series data such as biomass using the temporal simulation model Ecosim However these data were not available for the RBT2 area so this robust method of fitting the model and estimating vulnerability parameters was not possible Instead a vulnerability setting of 2 was used as the default value for the key model runs which is ldquocommon practice when time series data are not available and estimates of vulnerability in the
29 PMV Response 2016-03-02 p 70 lines 1318-1323
Pacific Region Science Response Technical Review Assessing
Ecosystem Productivity Model of Roberts Bank
16
model cannot be maderdquo30 with sensitivity analyses run for a range of 15 to 3 This narrow range was criticized by DFOECCC in initial discussions about the model with the Proponent The Proponent subsequently reran the model with a larger range of vulnerabilities31 (11 to 10) and concluded this broader vulnerability range produced similar results for the productivity ratio with and without the Project to those in the original EIS and that the EIS was more likely to overestimate than underestimate potential project effects32 The data in Table 7 of the PMV Response33 did indicate changes in productivity ratios ranging from 0 to 50 of the defined key run (which used a vulnerability setting of 2) However the Proponent changed all vulnerability settings to the same value ie all were 2 or all were 10 etc In reality the vulnerability parameters resulting from Ecosim models that are fitted to data as described above vary by functional group which was not explored here Therefore although the results suggest that the original choice of 2 for the default key run seemed reasonable the potential effects of variability in vulnerability settings was not fully explored
Sensitivity analyses are usually based on the range of uncertainty estimated for input data and parameters often called the confidence limits around the model parameters The EwE framework integrates many different data sources and parameters including values from the literature It can therefore be difficult to identify ldquoreasonablerdquo confidence limits when derived from such diverse data sources Standard practice in Ecopath models has been to develop a pedigree for each parameter with default values for uncertainty based on the nature of the source data For example parameter values based on high precision field observations of biomass within the model domain receive default confidence intervals of 10 whereas parameter values based on models developed for elsewhere or professional judgment receive confidence intervals of 8034 Sensitivity analyses are then run using parameter values selected from within these confidence intervals However if these default confidence intervals do not capture the full range of variability then the outputs are not informative of the variability in the lsquorealrsquo ecosystem Field observations were collected for many functional groups within the model domain in 2012 and 2013 as part of studies to support the RBT2 EIS Apparently the purpose of these observations was to document spatial variability (in part for the Ecospace model) and temporal variability (measurements at one location over time) and not to derive confidence intervals around the observations35
The reliance on the pedigree approach to derive confidence intervals for this Roberts Bank model was criticized by DFO ECCC and NRCan in discussions with the Proponent As a result the Proponent reran the model with much larger confidence intervals ranging from 30 to 100 depending on the input parameter and functional group36 The results from this new analysis using the broader confidence intervals were similar to those using the original pedigree approach The Proponent noted that ldquoWhile the production within each helliprun was very different there was little difference in the biomass ratio [with and without the Project] These results further demonstrate that even with a greater range in input values the influence of the Project on the Roberts Bank ecosystem is consistent among allhellipmodel runsrdquo37 This provides confidence that the model may be robust to uncertainty in its input parameters Two concerns
30 PMV Response 2016-03-02 p 70 lines 1321-1322 31 PMV Response 2016-03-02 p 71-74 32 PMV Response 2016-03-02 p 71 lines 1339-1341 33 PMV Response 2016-03-02 p 73 34 EIS Appendix 10-C Section 251 page 18 35 PMV Response 2016-03-02 p 42 lines 772-777 36 PMV Response 2016-03-02 p 44-47 37 PMV Response 2016-03-02 p 47 lines 855-858 and see also PMV Response 2016-03-02 Appendix 27-B
Pacific Region Science Response Technical Review Assessing
Ecosystem Productivity Model of Roberts Bank
17
remain however The quote above indicates that the production among the different model runs was very different although with little difference in the biomass ratios with and without the Project Since biomass is not the same as production it would be informative for understanding model performance and potential impacts to show these production differences This also relates to the point made in Section 34 regarding how well the model represents the real ecosystem and not just within-model comparisons with and without the Project The second question is more technical and relates to how the randomization (Monte Carlo or MC) routine that was used to create multiple model runs used the uncertainty about the diet data Diets are not currently included in the MC routine available to regular users of the Ecosim model how they were handled in this RBT2 model appears not to be explained
Finally the sensitivity analyses indicate that the uncertainty in the input parameters does not lead to much difference between model parameters with or without the project However this conclusion does not describe how the uncertainty in the input parameters affects understanding of the ecosystem
40 Conclusions Overall the main conclusion of the Environmental Impact Statement from the Proponent is stated as ldquohellipafter the implementation of mitigation hellipthe Project is not expected to result in any significant adverse effects on any of the 16 valued componentsrdquo38 In addition ldquohellipapproximately 40 of the functional groups are forecast to change no more than 5 which hellip is judged to be within the uncertainty of the model runsrdquo39 although larger changes were forecast for orange sea pens freshwater biofilm green algae and raptors The conclusions from the modelling studies are that ldquohellipthe proposed project will have an impact on the study area that the effect varies between species and that the findings are robust to parameter uncertaintyrdquo40 Specific outcomes by valued component as derived from the EwE model are presented by functional groups in Table 1
38 PMV March 2015 Roberts Bank Environmental Impact Statement Executive Summary ndash Part 1 page 37 39 EIS Appendix 10-C p ii 40 EIS Appendix 10-D p iv
Pacific Region Science Response Technical Review Assessing
Ecosystem Productivity Model of Roberts Bank
18
Table 1 Changes in productive potential with the Project as derived from the EwE model
Changes in productive potential
Ecosystem category
Number of valued
components
Number with potential
biomass loss
Moderate decrease (31-60 decline)
Minor decrease (6-30 decline)
Negligible (0-5
change)
Minor increase (6-
30 increase)
Moderate increase (31-60 increase)
Source
Marine vegetation
7 7 - 3 2 2 - EIS Vol 3 Section 11 Table 11-17 page 11-65
Marine invertebrates
4 3 1 1 1 1 - EIS Vol 3 Section 12 Table 12-8 page 12-52
Marine fish 13 13 - 2 6 5 - EIS Vol 3 Section 13 Table 13-10 page 13-95
Coastal birds
11 8 - 3 4 3 1 EIS Vol 3 Section 15 Table 15-10 page 15-67
Pacific Region Science Response Technical Review Assessing
Ecosystem Productivity Model of Roberts Bank
19
Most functional groups showed some potential biomass loss with the Project with biomass loss defined as any model run with negative outcomes (ie in which biomass with the project was less than biomass without the Project) The summary of changes in productivity potential are mixed with most (33 out of 35) valued components showing minor decreases to minor increases (defined as 6 to 30 changes in productive potential with the Project compared to without the Project)
The main conclusions of this review in regards to the Terms of Reference are
1 Do the functional groups and abiotic variables used in the model adequately represent the ecosystem at Roberts Bank
o The 58 functional groups and abiotic variables used in the model adequately represent the main components of the Roberts Bank ecosystem however for longer lived species the life stages of the species are not well represented and some of the impacts of the Project may be expected to affect specific life stages
o The abiotic variables adequately represent the physical drivers of this ecosystem on an annual time scale However annual values for these abiotic variables may not adequately capture important sub-annual events such as storms (DFO 2016) the timing of arrival and departure of highly migratory species and whether there may be important sub-annual thresholds or mismatches in timing as a result of the Project
o Biotic factors (eg nutrients) which are particularly important for biofilm and other lower trophic level taxa are not included in this model The model is therefore unable to assess the potential development of eutrophication and benthic organic enrichment events which may affect fish habitats in the study area
2 Are the parameter estimates used by the model valid and defensible for this system
o In general parameter estimates appear to be adequate for this system Field studies were done in two years to provide data in particular on distributions of selected functional groups for the Ecospace module Note the distribution studies focussed on taxa which were relatively immobile and therefore lsquofixedrsquo in space
o the selection of some model parameters would benefit from further explanation for example the choice of fixed diet matrices versus dynamic matrices which can vary with changes in abundances or predators and prey
o the selection of some model parameters would benefit from further explanation for example the link between the diets described in the text of Appendix 10B and the quantities presented in Appendix A of Appendix 10B It is understood that proportions were derived using the ldquofixed selectivityrdquo principle but in order to be fully transparent the derivation of each diet should be provided in an appendix
o discussion and explanation is needed of why ecotrophic efficiencies differ from expected values (eg the ecotrophic efficiency for Pacific herring is listed as 038) and
o the abiotic factor lsquosubstratersquo was limited to ldquohardrdquo or rdquosoftrdquo options which can be restrictive given that they serve as endpoints on a substrate composition continuum These limited options may not provide the sensitivity required to assess substrate preference nor the flexibility for taxa (eg motile organisms) that span hard mixed and soft substrate types In addition it is not clear if changes in the hardsoft categories were considered over time within identified depositional or erosional settings before and after construction
Pacific Region Science Response Technical Review Assessing
Ecosystem Productivity Model of Roberts Bank
20
3 Are the limitations and uncertainties of the model identified and appropriately considered when determining the modelrsquos representation of current and possible future conditions
o the EwE model was not designed to evaluate a range of future conditions It was designed to estimate changes in the productive potential at the ecosystem level with and without the Project Therefore the model was run without the Project and with the Project for a range of plausible abiotic conditions and the results were compared with respect to biomass and productivity by functional group
o the pedigree approach to assessing the uncertainties of model outcomes is unsatisfactory for the purpose here as it relates solely to a qualitative judgment of the value of data based on its source However when the model was rerun with much wider ranges of confidence intervals (uncertainties) the results in general (but not necessarily for each functional group) were similar to the results using the original pedigree approach This suggests that taken overall the model may be robust to wide ranges of uncertainty in these input variables and parameters
o there is inadequate validation of the model This is inadequate for three reasons
(i) the basic Ecopath model is not validated and the Ecospace balancing process (the spin-up period) resulted in some biomass estimates being increased or decreased beyond their confidence limits
(ii) the goodness of fit test used to evaluate how well the model predicted the spatial occurrence functional groups is not fit for purpose (Section 34) and
(iii) validation was provided for only a small number of functional groups (the habitat-forming functional groups) As a consequence the model is currently not validated
o Considering the proportion of open boundaries relative to closed boundaries in the model processes taking place outside the modelled ecosystem are likely to contribute to dynamics within the modelled ecosystem However these external processes may not be well-resolved by the EwE model as currently configured
4 Are the model results related to the potential effects of the Project on fish and fish habitat and migratory birds and their food resources valid and defensible
o this is a very complex ecosystem model constructed for a relatively small and open (in the sense of considerable exchange with adjacent non-modelled areas) system Many assumptions have been made based on poor or missing data Taking all these considerations into account the model does the best job possible of comparing the biomass and productivity of the Roberts Bank ecosystem with and without the Project
o the extent to which the model adequately represents the lsquorealrsquo ecosystem of Roberts Bank as opposed to comparisons of model results with and without the Project is unclear as a number of basic diagnostics are not presented (see point 3 above)
o the EwE model is not capable of and is not designed to represent nutritional and food quality variations in prey functional groups and how these may impact highly migratory predators such as birds with and without the Project
5 Is the EwE model framework a valid method to quantify large scale impacts to fish habitat fish productivity and migratory bird productivity
o the EwE model as implemented in this project and reviewed here is a useful first-order framework to organise information and derive initial estimates of how the system may respond to perturbations
Pacific Region Science Response Technical Review Assessing
Ecosystem Productivity Model of Roberts Bank
21
o the utility of a EWE model for impact purposes is highly dependent on the quality of input data
o each EwE model is highly dependent on local conditions Although appropriate as an overall methodology each application would need to be reviewed for how it may be applied to any new ecosystem and
o the EwE model would need to be substantially reformulated if it was to include considerations of changes in chemical composition or food quality of prey in particular for seasonal migratory species such as birds which may depend on very large biomasses of prey with specific chemical composition to fuel their migrations beyond the ecosystem model boundaries
Contributors Contributor Affiliation Ian Perry Author DFO Science Pacific Region Alida Bundy Author DFO Science Maritimes Region Terri Sutherland Author DFO Science Pacific Region Robert Elner Author ECCC Canadian Wildlife Service Andrew Robinson Author ECCC Canadian Wildlife Service Lesley MacDougall Editor DFO Science Pacific Region
Approved by Carmel Lowe
Regional Director Science Branch Pacific Region Fisheries and Oceans Canada
November 4 2016
Sources of Information Christensen V Coll M Steenbeek J Buszowski J Chagaris D walters CJ 2014
Representing variable habitat quality in a spatial food web model Ecosystems 17 1397-1412
Christensen V and Walters C 2000 Ecopath with Ecosim methods capabilities and limitations Ecological Modelling 172 109-139
Colleacuteter M Valls A Guitton J Gascuel D Pauly D and Christensen V 2015 Global overview of the applications of the Ecopath with Ecosim modeling approach using the EcoBase models repository Ecological Modelling 302 pp42-53
Compass Resource Management Ltd 2013 Roberts Bank Terminal 2 Technical Advisory Group (TAG) Process Report Productive Capacity ndash Final Report 119pp (Accessed November 1 2016)
DFO 2016 Technical Review of Roberts Bank Terminal 2 Environmental Assessment Section 95 ndash Coastal Geomorphology DFO Can Sci Advis Sec Sci Resp 2016045 (Accessed November 4 2016)
Pacific Region Science Response Technical Review Assessing
Ecosystem Productivity Model of Roberts Bank
22
ESSA Technologies 2014a Roberts Bank Terminal 2 Project Roberts Bank Delta BC Environmental Impact Statement Volume 3 Biophysical Effects Assessments Appendix 10-C Roberts Bank Ecosystem Model Development and Key Run Port Metro Vancouver (Accessed November 1 2016)
ESSA Technologies 2014b Roberts Bank Terminal 2 Project Roberts Bank Delta BC Environmental Impact Statement Volume 3 Biophysical Effects Assessments Appendix 10-D Roberts Bank Ecosystem Model Sensitivity Analyses Port Metro Vancouver (Accessed November 1 2016)
Franklin J 2009 Mapping Species Distributions Spatial Inference and Prediction Cambridge University Press Cambridge
Hemmera 2014 Roberts Bank Terminal 2 Project Roberts Bank Delta BC Environmental Impact Statement Volume 3 Biophysical Effects Assessments Appendix 10-B Roberts Bank Ecosystem Model Parameter Estimates Port Metro Vancouver File 302-03503 (Accessed November 1 2016)
Port Metro Vancouver 2015a Roberts Bank Terminal 2 Project Roberts Bank Delta BC Environmental Impact Statement Volume 3 Biophysical Effects Assessments Section 100 Biophysical Setting (Accessed November 1 2016)
Port Metro Vancouver 2015b Roberts Bank Terminal 2 Project Roberts Bank Delta BC Environmental Impact Statement Volume 3 Biophysical Effects Assessments Section 103 Overview of Assessing Ecosystem Productivity (Accessed November 1 2016)
Port Metro Vancouver 2015c Roberts Bank Terminal 2 Project Environmental Assessment Additional Information Requirements (July 31 2015) Responses Response to Information Request 6 IR-73115-06 Canadian Environmental Assessment Agency Reference Number 80054 dated 26 October 2015
Steenbeek J Coll M Gurney L Meacutelin F Hoepffner N Buszowski J and Christensen V 2013 Bridging the gap between ecosystem modeling tools and geographic information systems Driving a food web model with external spatialndashtemporal data Ecological Modelling 263 139ndash 151
Sutherland T Elner R and OrsquoNeill J 2013 Roberts Bank Ecological crucible of the Fraser River estuary Progress in Oceanography 115 171ndash180
Vancouver Fraser Port Authority 2016 From the Vancouver Fraser Port Authority to the Review Panel re Answers to preliminary technical questions submitted during the completeness phase from Fisheries and Oceans Canada Natural Resources Canada and Environment and Climate Change Canada concerning the ecosystem modelling to support the Roberts Bank Terminal 2 Project environmental review CEAR Document 547 (Accessed November 1 2016)
Pacific Region Science Response Technical Review Assessing
Ecosystem Productivity Model of Roberts Bank
23
This Report is Available from the Centre for Science Advice
Pacific Region Fisheries and Oceans Canada
3190 Hammond Bay Road Nanaimo BC V9T 6N7
Telephone (250) 756-7208 E-Mail csapdfo-mpogcca
Internet address wwwdfo-mpogccacsas-sccs
ISSN 1919-3769 copy Her Majesty the Queen in Right of Canada 2016
Correct Citation for this Publication
DFO 2016 Technical review of Roberts Bank Terminal 2 environmental assessment section 103 ndash assessing ecosystem productivity DFO Can Sci Advis Sec Sci Resp 2016050
Aussi disponible en franccedilais
MPO 2016 Examen technique de leacutevaluation environnementale du Terminal 2 agrave Roberts Bank section 103 ndash eacutevaluation de la productiviteacute de leacutecosystegraveme Secr can de consult sci du MPO Reacutep des Sci 2016050
- CSAS 2016-50 - Assessing Ecosystem Productivitypdf
-
- TECHNICAL REVIEW OF ROBERTS BANK TERMINAL 2 ENVIRONMENTAL ASSESSMENT SECTION 103 ndash ASSESSING ECOSYSTEM PRODUCTIVITY
-
- 10 Context
- 20 Background
-
- 21 Background and Terms of Reference
- 22 Approach to assessing ecosystem productivity
-
- 30 Analysis and Response
-
- 31 The EwE Team
- 32 Overview of assessment results of hydrological and sediment modelling
- 33 Model implementation
-
- 331 The purpose of the EwE model
- 332 Applicability of the EwE model framework to the Roberts Bank region
- 333 Model documentation
- 334 Highly mobile functional groups
- 335 Seasonality (model time step)
- 336 Life history structure
- 337 Model balancing
-
- 34 Model validation
- 35 Model results
-
- 351 Presentation of model results
- 352 Sensitivity and vulnerability analyses
-
- 40 Conclusions
- Contributors
- Approved by
- Sources of Information
- This Report is Available from the
-

Pacific Region Science Response Technical Review Assessing
Ecosystem Productivity Model of Roberts Bank
23
This Report is Available from the Centre for Science Advice
Pacific Region Fisheries and Oceans Canada
3190 Hammond Bay Road Nanaimo BC V9T 6N7
Telephone (250) 756-7208 E-Mail csapdfo-mpogcca
Internet address wwwdfo-mpogccacsas-sccs
ISSN 1919-3769 copy Her Majesty the Queen in Right of Canada 2016
Correct Citation for this Publication
DFO 2016 Technical review of Roberts Bank Terminal 2 environmental assessment section 103 ndash assessing ecosystem productivity DFO Can Sci Advis Sec Sci Resp 2016050
Aussi disponible en franccedilais
MPO 2016 Examen technique de leacutevaluation environnementale du Terminal 2 agrave Roberts Bank section 103 ndash eacutevaluation de la productiviteacute de leacutecosystegraveme Secr can de consult sci du MPO Reacutep des Sci 2016050
- CSAS 2016-50 - Assessing Ecosystem Productivitypdf
-
- TECHNICAL REVIEW OF ROBERTS BANK TERMINAL 2 ENVIRONMENTAL ASSESSMENT SECTION 103 ndash ASSESSING ECOSYSTEM PRODUCTIVITY
-
- 10 Context
- 20 Background
-
- 21 Background and Terms of Reference
- 22 Approach to assessing ecosystem productivity
-
- 30 Analysis and Response
-
- 31 The EwE Team
- 32 Overview of assessment results of hydrological and sediment modelling
- 33 Model implementation
-
- 331 The purpose of the EwE model
- 332 Applicability of the EwE model framework to the Roberts Bank region
- 333 Model documentation
- 334 Highly mobile functional groups
- 335 Seasonality (model time step)
- 336 Life history structure
- 337 Model balancing
-
- 34 Model validation
- 35 Model results
-
- 351 Presentation of model results
- 352 Sensitivity and vulnerability analyses
-
- 40 Conclusions
- Contributors
- Approved by
- Sources of Information
- This Report is Available from the
-


![POS Terminal Agreement - Steward Bank Terminal Agreement 2017.pdf · Version 1.2017 Page 3 of 18 [Steward bank POS Terminal Agreement] 2.7 In the event that the terminal is damaged](https://static.fdocuments.net/doc/165x107/5e1e25865dd032067571b961/pos-terminal-agreement-steward-bank-terminal-agreement-2017pdf-version-12017.jpg)


