Review Overview of integrative tools and methods in assessing
19
Review Overview of integrative tools and methods in assessing ecological integrity in estuarine and coastal systems worldwide Angel Borja a, * , Suzanne B. Bricker b , Daniel M. Dauer c , Nicolette T. Demetriades d , João G. Ferreira e , Anthony T. Forbes d , Pat Hutchings f , Xiaoping Jia i , Richard Kenchington g , João Carlos Marques h , Changbo Zhu i a AZTI-Tecnalia, Marine Research Division, Herrera Kaia, Portualdea s/n, 20110 Pasaia, Spain b NOAA-National Ocean Service, National Centers for Coastal Ocean Science, 1305 East West Highway, Silver Spring, MD 20910, USA c Department of Biological Sciences, Old Dominion University, Norfolk, VA 23529, USA d Marine and Estuarine Research, P.O. Box 417, Hyper by the Sea 4053, South Africa e IMAR–Institute of Marine Research, Centre for Ocean and Environment, FCT-UNL, Portugal f Marine Invertebrates, Australian Museum, Sydney, NSW 2010 Australia g Australian National Centre for Ocean Resources and Security, University of Wollongong, NSW 2522, Australia h IMAR–Institute of Marine Research, University of Coimbra, Portugal i South China Sea Fisheries Research Institute, CAFS, PR China article info Keywords: Ecological integrity Integrative assessment Ecological status Environmental quality Marine parks abstract In recent years, several sets of legislation worldwide (Oceans Act in USA, Australia or Canada; Water Framework Directive or Marine Strategy in Europe, National Water Act in South Africa, etc.) have been developed in order to address ecological quality or integrity, within estuarine and coastal systems. Most such legislation seeks to define quality in an integrative way, by using several biological elements, together with physico-chemical and pollution elements. Such an approach allows assessment of ecolog- ical status at the ecosystem level (‘ecosystem approach’ or ‘holistic approach’ methodologies), rather than at species level (e.g. mussel biomonitoring or Mussel Watch) or just at chemical level (i.e. quality objec- tives) alone. Increasing attention has been paid to the development of tools for different physico-chemical or bio- logical (phytoplankton, zooplankton, benthos, algae, phanerogams, fishes) elements of the ecosystems. However, few methodologies integrate all the elements into a single evaluation of a water body. The need for such integrative tools to assess ecosystem quality is very important, both from a scientific and stake- holder point of view. Politicians and managers need information from simple and pragmatic, but scien- tifically sound methodologies, in order to show to society the evolution of a zone (estuary, coastal area, etc.), taking into account human pressures or recovery processes. These approaches include: (i) multidisciplinarity, inherent in the teams involved in their implementa- tion; (ii) integration of biotic and abiotic factors; (iii) accurate and validated methods in determining eco- logical integrity; and (iv) adequate indicators to follow the evolution of the monitored ecosystems. While some countries increasingly use the establishment of marine parks to conserve marine biodiversity and ecological integrity, there is awareness (e.g. in Australia) that conservation and management of mar- ine ecosystems cannot be restricted to Marine Protected Areas but must include areas outside such reserves. This contribution reviews the current situation of integrative ecological assessment worldwide, by pre- senting several examples from each of the continents: Africa, Asia, Australia, Europe and North America. Ó 2008 Elsevier Ltd. All rights reserved. 1. Introduction The marine environment presents high levels of complexity, diverse habitats and supports a high level of biodiversity. These provide goods and services that support different uses which should be undertaken in a sustainable way. However, the marine, and particularly estuarine, environments are facing increasing 0025-326X/$ - see front matter Ó 2008 Elsevier Ltd. All rights reserved. doi:10.1016/j.marpolbul.2008.07.005 * Corresponding author. E-mail addresses: [email protected] (A. Borja), [email protected] (S.B. Bricker), [email protected] (D.M. Dauer), [email protected] (N.T. Demetriades), [email protected] (J.G. Ferreira), [email protected] (P. Hutchings), [email protected] (X. Jia), [email protected] (R. Kench- ington), [email protected] (J.C. Marques), [email protected] (C. Zhu). Marine Pollution Bulletin 56 (2008) 1519–1537 Contents lists available at ScienceDirect Marine Pollution Bulletin journal homepage: www.elsevier.com/locate/marpolbul
Transcript of Review Overview of integrative tools and methods in assessing

Marine Pollution Bulletin 56 (2008) 1519–1537
Contents lists available at ScienceDirect
Marine Pollution Bulletin
journal homepage: www.elsevier .com/ locate /marpolbul
Review
Overview of integrative tools and methods in assessing ecological integrityin estuarine and coastal systems worldwide
Angel Borja a,*, Suzanne B. Bricker b, Daniel M. Dauer c, Nicolette T. Demetriades d, João G. Ferreira e,Anthony T. Forbes d, Pat Hutchings f, Xiaoping Jia i, Richard Kenchington g,João Carlos Marques h, Changbo Zhu i
a AZTI-Tecnalia, Marine Research Division, Herrera Kaia, Portualdea s/n, 20110 Pasaia, Spainb NOAA-National Ocean Service, National Centers for Coastal Ocean Science, 1305 East West Highway, Silver Spring, MD 20910, USAc Department of Biological Sciences, Old Dominion University, Norfolk, VA 23529, USAd Marine and Estuarine Research, P.O. Box 417, Hyper by the Sea 4053, South Africae IMAR–Institute of Marine Research, Centre for Ocean and Environment, FCT-UNL, Portugalf Marine Invertebrates, Australian Museum, Sydney, NSW 2010 Australiag Australian National Centre for Ocean Resources and Security, University of Wollongong, NSW 2522, Australiah IMAR–Institute of Marine Research, University of Coimbra, Portugali South China Sea Fisheries Research Institute, CAFS, PR China
a r t i c l e i n f o
Keywords:Ecological integrity
Integrative assessmentEcological statusEnvironmental qualityMarine parks0025-326X/$ - see front matter � 2008 Elsevier Ltd. Adoi:10.1016/j.marpolbul.2008.07.005
* Corresponding author.E-mail addresses: [email protected] (A. Borja), su
Bricker), [email protected] (D.M. Dauer), ticky@[email protected] (J.G. Ferreira), Pat.Hutchings@[email protected] (X. Jia), richard.kenchington@ington), [email protected] (J.C. Marques), changbo@ec
a b s t r a c t
In recent years, several sets of legislation worldwide (Oceans Act in USA, Australia or Canada; WaterFramework Directive or Marine Strategy in Europe, National Water Act in South Africa, etc.) have beendeveloped in order to address ecological quality or integrity, within estuarine and coastal systems. Mostsuch legislation seeks to define quality in an integrative way, by using several biological elements,together with physico-chemical and pollution elements. Such an approach allows assessment of ecolog-ical status at the ecosystem level (‘ecosystem approach’ or ‘holistic approach’ methodologies), rather thanat species level (e.g. mussel biomonitoring or Mussel Watch) or just at chemical level (i.e. quality objec-tives) alone.
Increasing attention has been paid to the development of tools for different physico-chemical or bio-logical (phytoplankton, zooplankton, benthos, algae, phanerogams, fishes) elements of the ecosystems.However, few methodologies integrate all the elements into a single evaluation of a water body. The needfor such integrative tools to assess ecosystem quality is very important, both from a scientific and stake-holder point of view. Politicians and managers need information from simple and pragmatic, but scien-tifically sound methodologies, in order to show to society the evolution of a zone (estuary, coastal area,etc.), taking into account human pressures or recovery processes.
These approaches include: (i) multidisciplinarity, inherent in the teams involved in their implementa-tion; (ii) integration of biotic and abiotic factors; (iii) accurate and validated methods in determining eco-logical integrity; and (iv) adequate indicators to follow the evolution of the monitored ecosystems.While some countries increasingly use the establishment of marine parks to conserve marine biodiversityand ecological integrity, there is awareness (e.g. in Australia) that conservation and management of mar-ine ecosystems cannot be restricted to Marine Protected Areas but must include areas outside suchreserves.
This contribution reviews the current situation of integrative ecological assessment worldwide, by pre-senting several examples from each of the continents: Africa, Asia, Australia, Europe and North America.
� 2008 Elsevier Ltd. All rights reserved.
ll rights reserved.
[email protected] (S.B.r.co.za (N.T. Demetriades),
tmus.gov.au (P. Hutchings),netspeed.com.au (R. Kench-
owin.org (C. Zhu).
1. Introduction
The marine environment presents high levels of complexity,diverse habitats and supports a high level of biodiversity. Theseprovide goods and services that support different uses whichshould be undertaken in a sustainable way. However, the marine,and particularly estuarine, environments are facing increasing

1520 A. Borja et al. / Marine Pollution Bulletin 56 (2008) 1519–1537
and significant impacts, which include physical and chemicaltransformation, habitat destruction and changes in biodiversity(Halpern et al., 2007, 2008). Causes include land reclamation,dredging, pollution (sediment discharges, hazardous substances,litter, oil-spills, eutrophication, etc.), unsustainable exploitationof marine resources (sand extraction, oil and gas exploitation, fish-ing, etc.), unmanaged tourism, introduction of alien species and cli-mate change (see Halpern et al., 2007). These are driven byeconomic and social pressures for development and access to mar-ine resources and activities through i.a. commercial fishing, aqua-culture, tourism, recreation and maritime transport.
In order to resolve these problems, policy-makers world-wideseek to develop strategies to protect, conserve and manage themarine environment. The United Nations Convention on Law ofthe Sea (UNCLOS, 1982) is the international basic legal frameworkthat governs the uses of the oceans and seas. UNCLOS establishesan international obligation to protect and use the resources ofthe marine environment sustainably as does the 1992 Conventionon Biological Diversity (CBD, 2000), as highlighted by Parsons(2005).
At a national or regional level, several initiatives have beendeveloped recently: (i) in December 1998, Australia released anOceans Policy (Commonwealth of Australia, 1999, 2006); (ii) theCanadian Parliament passed the Oceans Act, which came into forcein January 1997, being Canada’s Oceans Strategy released in 2002(Parsons, 2005); (iii) in the USA, the Pew Oceans Commission, cre-ated in 2000, and the US Commission on Ocean Policy, created bythe Oceans Act of 2000, reported in 2004 (Granek et al., 2005);(iv) in Europe, the Water Framework Directive (WFD), which pro-motes the protection of continental, estuarine and marine waters,was released in 2000 (Borja, 2005), and the European Marine Strat-egy (EMS) Directive, was presented in 2005 (Borja, 2006; COM,2005a, b, c); (v) in South Africa the National Water Act of 1998(www.dwaf.gov.za/documents/publications) and the developingCoastal Management Act are presently in the form of the Inte-grated Coastal Management Bill (www.deat.gov.za); and (vi) inthe People’s Republic of China (PRC) a substantial body of legisla-tion exists to address environmental protection (laws on Water(1988/01/21) and Environmental Protection (1989/12/26): SeaWater Quality GB 3097-1997, Environmental Quality for SurfaceWater GB 3838-2002, and Provisions for Monitoring of Marine Cul-ture and Propagation Areas (2002/04/01)).
The objectives of these initiatives are to protect and/or restorethe corresponding seas by ensuring that human activities are car-ried out in a sustainable manner, to provide safe, clean, healthyand productive marine waters. In summary, they try to promotethe sustainable use of the seas and conserve marine ecosystems.Hence, the main objective of these legislative measures and poli-cies is to maintain a good environmental or ecological status formarine waters, habitats and resources. The concept of environmen-tal status takes into account the structure, function and processesof marine ecosystems bringing together natural physical, chemical,physiographic, geographic and climatic factors, and integratesthese conditions with the anthropogenic impacts and activities inthe area concerned.
The above concept defines quality in an integrative way, byusing several biological parameters together with physico-chemi-cal and pollution elements. This approach is intended to allow anassessment of the ecological status at the ecosystem level (‘ecosys-tem-based approach’ (EBA) or ‘holistic approach’ methodologies(Browman et al., 2004; Nicholson and Jennings, 2004; Rudd,2004; Foster et al., 2005; Jennings, 2005; and Apitz et al., 2006)),more effectively than can be done at a species (e.g. mussel biomon-itoring or Mussel Watch) or chemical level (i.e. quality objectives).The EBA is defined as: ‘‘a strategy for the integrated managementof land, water and living resources that promotes conservation
and sustainable use in an equitable way. The application of theEBA will help to reach a balance of the conservation, sustainableuse, and the fair and equitable sharing of the benefits arising outof the utilization of genetic resources” (CBD, 2000). However, thereare various interpretations of the EBA and its application almost al-ways brings about confrontations and resistance among managers,proponents, and stakeholders (Morishita, 2008).
Following this approach, increasing attention has been paid tothe development of tools for different physico-chemical or biolog-ical (phytoplankton, zooplankton, benthos, algae, phanerogams,and fishes) elements of the ecosystems. However, very few meth-odologies integrate all the elements into a unique evaluation ofstatus and performance of an aquatic system. The need for suchintegrative tools to assess the ecosystem quality is very important,both from a scientific and stakeholder point of view. The scientificchallenge is to develop robust simple, pragmatic, but scientificallysound methodologies, which can provide communities and deci-sion-makers with tools to define and monitor the evolution, cur-rent condition and biological performance of marine ecosystemsand bioregions.
These approaches include: (i) multidisciplinarity, inherent inthe teams involved in their implementation; (ii) integration of bio-tic and abiotic factors; (iii) accurate and validated methods fordetermining ecological integrity; (iv) accurate and validated meth-ods for determining the extent and effect of human uses and im-pacts; (v) adequate indicators to follow the evolution of themonitored ecosystems; and (vi) the use of protected areas asmeans of conserving and managing viable representative examplesof marine environments especially coastal areas where greatestanthropogenic inputs occur. Finally there should be some earlywarning systems for abrupt changes in environmental conditions.
Arising out of the above, a special session on ‘Integrative toolsand methods in assessing ecological integrity in estuarine andcoastal systems’ was organised to discuss all the abovementionedtopics at the ‘EcoSummit 2007–Ecological Complexity and Sustain-ability’ conference in Beijing (China), in May 2007, The debateamong the attendees of this session resulted in this contribution,which reviews the current situation of the integrative ecologicalassessment worldwide, by presenting several examples from sev-eral continents e.g. Africa, Asia, Australia, Europe, and NorthAmerica.
2. Current situation in North America
2.1. Legislative framework
Canada’s legislative framework and application have been dis-cussed by Foster et al. (2005); O’Boyle and Jamieson (2006), andCanessa et al. (2007). In the United States (USA) the main legisla-tion for prevention and study of pollution is based on the CleanWater Act (CWA) of 1972, Air Pollution Prevention and ControlAct of 1977, Coastal Zone Management Act of 1972, Harmful AlgalBloom and Hypoxia Research and Control Act of 1998, and, mostrecently, the Oceans Act of 2000.
Responsibility for monitoring and assessment of water qualityin the USA is shared by federal agencies, primarily the Environ-mental Protection Agency (EPA) and the National Oceanic andAtmospheric Administration (NOAA; Fig. 1). The EPA is chargedwith regulating most aspects of water quality under the federalCWA (USEPA, 2003). This establishes that, wherever possible,water quality must provide for the protection and propagation offish, shellfish, and wildlife, for recreation in and on the waterand/or protection of the physical, chemical, and biological integrityof those waters. States and tribes designate uses for their waters inconsideration of CWA goals and establish water quality criteria to

Response (or condition) Monitoring, Assessment, Modeling
Nutrient Load-Limits
N load reductions ofPoint and Non Point sources
Load Response Translator
BMP Implementation
NOAANEEA/ASSETS
TypologyHuman Use Indicator
EPANCA
N Models
States &Tribes305(b) reporting303(d) listing
Components of the US regulation of nutrients for management of eutrophication effects in estuaries
State numeric response (or condition) criteriaDerived from reference conditions for each class of estuary or
designated use (for many water bodies these do not exist)
TMDL
process initiated
(305b) reporting
If use is not attained (criteria are exceeded) water body is listed (303d)
Load Response Models:Place based
Spatially explicit
Fig. 1. Roles, responsibilities and interactions of US Agencies for estuarine and coastal environments (EPA, NOAA, States).
A. Borja et al. / Marine Pollution Bulletin 56 (2008) 1519–1537 1521
protect integrity and uses. The CWA Sections 305(b) and 303(d)state reporting requirements require regular monitoring designedto identify waterbodies that do not meet criteria for designateduses (Keller and Cavallaro, 2008). These waterbodies are includedon the Section 303(d) list of impaired waters which establishesprotocols that must be followed to mitigate pollution induced im-pacts (USEPA, 2003; regarding impairment between the CWA, Kel-ler and Cavallaro (2008) can be consulted).
Responsibility for implementing standards and criteria, and formonitoring to assess attainment, is generally delegated by EPA tostate water management authorities. States and tribes are requiredto report periodically to the EPA on water quality conditions, andto develop plans to remedy impacts when they occur. EPA andNOAA support regulatory decisions by providing research andassessment results, and they share some management responsibil-ities (e.g. Coastal Zone Management Act Reauthorization Amend-ments (CZARA) Section 6217 coastal non-point pollution controlprogram; CZMA, 1996).
Using nutrients as an example, EPA in 1998 developed the Na-tional Strategy for the Development of Regional Nutrient Criteria(USEPA, 1998, 2001c). This strategy detailed EPA’s intention to de-velop technical guidance manuals for four types of waters (lakes,rivers, estuaries/coastal waters, wetlands), which can be seen at:http://www.epa.gov/waterscience/criteria/nutrient/guidance/mar-ine/. The approaches described in the manuals have been appliedby EPA and resulted in publication of 26 ecoregional nutrient crite-ria documents for freshwaters. To date, there have been no suchcriteria established for estuaries, however, there is a guidancemanual (USEPA, 2001a).
2.2. Tools and methodologies used in assessing ecological integrity
Several methods are used by US EPA and NOAA to evaluate eco-logical integrity or the condition status of coastal waters. TheNOAA’s National Status and Trends Program (NS&T) gauges thespatial distribution and temporal trends of chemical contamina-tion and develops indicators to evaluate environmental contami-nant exposure. Data from NS&T fixed sampling sites are used toassess the distribution, concentration and extent of chemical im-
pacts at a given point and over time, and are important for plan-ning future resource management and restoration activities. TheNS&T includes the Mussel Watch Project, Bioeffects Assessments,and the National Estuarine Eutrophication Assessment/Assessmentof Estuarine Trophic Status (NEEA/ASSETS; http://ccma.nos.noaa.gov/stressors/pollution/nsandt/) and is designed to addressrequirements of the CWA.
The EPA’s National Coastal Assessment (NCA) Program also sur-veys the condition of the nation’s coastal resources. The Program isimplemented through a federal–state partnership and is designedto fulfil section 305(b) of the CWA, which requires EPA to reportperiodically on the condition of the nation’s waters (USEPA,2003). Data from NCA sites are selected through a statistical ran-dom sample design and used together with site specific data fromNOAA’s NS&T Program and from other national programs to pro-vide regional and national results for five primary indices: WaterQuality (WQI), Sediment Quality (SQI), Benthic (BI), Coastal Habitat(CHI), and Fish Tissue Contaminants (FTCI; NCCR1, NCCR2; USEPA,2001a, 2001b, 2005). These indices provide information on bothecological condition and human use of estuaries.
Results of the two methods for eutrophication assessment arecompared here and the EPA NCA BI is also highlighted. For addi-tional benthic indices (e.g. Index of Biological Integrity (IBI)) con-sult Díaz et al. (2004). All are designed to evaluate conditionsand some also address causes of impacts with the intent to informmanagement.
2.2.1. NEEA/ASSETSNOAA’s eutrophication assessment examines nutrient related
water quality problems at individual system, regional and nationalscales (Bricker et al., 1999; NOAA, 1996, 1997a, 1997b, 1997c,1998). The recent update examines changes that have occurredsince the early 1990s (Bricker et al., 2007). The NEEA is comple-mentary to the National Research Program for Nutrient Pollutionin Coastal Waters (Howarth et al., 2003), it interacts with theEPA NCA, and it supports efforts by US states and the EuropeanCommission (EC) member states to fulfil requirements of theCWA section 305(b) and the EU WFD (e.g. COAST, 2003; OSPAR,2002), respectively. The method is described here in brief (for

1522 A. Borja et al. / Marine Pollution Bulletin 56 (2008) 1519–1537
details see Bricker et al., 1999, 2003, 2007; Ferreira et al., 2007b;Scavia and Bricker, 2006, www.eutro.org, www.eutro.us).
(i) Pressure-Influencing Factors (IF) are determined by a matrixthat combines the magnitude of nutrient inputs from thewatershed with a measure of the system’s ability to diluteor flush the nutrient inputs (i.e. susceptibility). The magni-tude of loads is determined by a model that comparesanthropogenic loading, from monitoring data or model esti-mations (e.g. USGS SPARROW model, Smith et al., 1997, andWATERSN model, Castro et al., 2001; Whitall et al., 2003,2004), with natural background concentrations. The modelfactors in possible oceanic sources providing insight to thesuccess of potential watershed-based managementmeasures.
(ii) State-Overall Eutrophic Condition (OEC) is based on fivevariables that are divided into two groups: (1) primarysymptoms that indicate early stages of eutrophication(chlorophyll a (Chl) and macroalgae); and (2) secondarysymptoms, indicative of well-advanced problems (low dis-solved oxygen (DO), losses of submerged aquatic vegeta-tion (SAV), and occurrence of nuisance and/or toxic algalblooms (HABs)). An area-weighted-estuary-wide value foreach variable is determined based on concentration, spa-tial coverage, and frequency of occurrence of problem con-ditions. The overall OEC, falling into one of five categories(i.e. High, Moderate High, Moderate, Moderate Low orLow) is determined by a matrix that combines the averagescore of primary symptoms and the highest score (worstimpact) of the three secondary symptoms, thus giving thesecondary symptoms a higher weighting in a precautionaryapproach.
(iii) The expected Response-Future Outlook (FO) or future condi-tion (worsen, no change, improve) is determined by combin-ing susceptibility of the system with expected changes innutrient loads. Predictions of future loading (increase,decrease, unchanged) are based on predicted changes inpopulation and watershed uses, mitigated by planned man-agement actions.
(iv) ASSETS Synthesis: IF, OEC and FO are then combined into asingle rating for the estuary resulting in a rating of: Bad,Poor, Moderate, Good or High.
Modifications to the NEEA/ASSETS include development of atype classification based on physical and hydrologic characteristicsthat is expected to improve assessment accuracy and managementeffectiveness. The EPA has also worked to develop a classification(Burgess et al., 2004) which resulted in 11 groupings or types, com-pared to the 10 NEEA/ASSETS groups (Chapter 6 in Bricker et al.,2007; Kurtz et al., 2006). A human use indicator has also beendeveloped to complement the NEEA/ASSETS water quality indices.Despite its importance, few previous studies have looked at the so-cial and economic costs of eutrophication. A variety of potentialhuman-uses (e.g. fishing, swimming, boating, tourism) could beconsidered, although, adequate data are not available for mostactivities (Bricker et al., 1999; USEPA, 2005). Fishing is importantin most estuaries and is usually impacted directly by eutrophica-tion; data are available through the US National Marine FisheriesService (NMFS), Marine Recreational Fisheries Statistics Survey(MRFSS) which regularly conducts surveys of recreational fishingactivity and success in most US estuarine systems. MRFSS fishcatch data can be combined with water quality data to determinewhether recreational fishing catch rates are related to eutrophicconditions (e.g. Lipton and Hicks, 1999, 2003; Bricker et al.,2006). With additional analysis, potential lost economic valuecan be estimated using techniques such as travel cost and random
utility models (Herriges and Kling, 1999), or by benefits transfer(Walsh et al., 1992).
2.2.2. EPA National Coastal Assessment: water quality and benthicindices
(i) The WQI is the NCA indicator that describes nutrient relatedconditions. The WQI combines the status of five indicators: dis-solved inorganic nitrogen (DIN), dissolved inorganic phosphorus(DIP), Chl, water clarity, and DO. Samples are taken once per yearat randomly selected statistical sites during a summer index period(June–October; USEPA, 2001a). The WQI is intended to characterizeacutely degraded conditions within coastal regions during the in-dex period and is not expected to capture site-specific detail. Bycomparison, NEEA/ASSETS evaluates systems, then synthesizesindividual results to regional and national levels.
Each WQI indicator is assessed for each site. The five indicatorsare given equal weight and are combined to give an overall ratingfor the site, compared to the NEEA/ASSETS which gives secondarysymptoms a higher weight. A regional rating for each NCA indicatoris developed based on combined results for individual sites withinthe region. A national picture is then developed from regionalresults.
(ii) The NCA BI is a set of regionally-based or site-specific ben-thic indices of estuarine environmental condition that reflectchanges in diversity and population size of indicator species to dis-tinguish degraded from undegraded benthic habitats (Engle et al.,1994; Weisberg et al., 1997; Engle and Summers, 1999; Van Dolahet al., 1999). The indices reflect changes in benthic communitydiversity and the abundance of pollution-tolerant and pollution-sensitive species. A high BI rating is indicative of a wide varietyof species, a low proportion of pollution-tolerant species, and ahigh proportion of pollution-sensitive species. A low BI rating indi-cates that benthic communities are less diverse, have more pollu-tion-tolerant species, and fewer pollution-sensitive species thanmight be expected.
2.3. Some examples of integrative assessment
2.3.1. NEEA/ASSETSThe NEEA/ASSETS method was applied to 141 individual sys-
tems, though not all had adequate data for complete analysis(Bricker et al., 2007). The majority of systems that were assessed(36 of 64) had high IF ratings indicating that inputs of nitrogenfrom human related activities were large compared to the capacityto dilute or flush nutrients. High nitrogen loads were largely attrib-uted to the influence of dense coastal populations.
Eutrophication is a widespread problem with the majority ofsystems assessed (64 of 99 or 78% of assessed estuarine area) ratedas having moderate to high levels of eutrophication (Fig. 2; Chapter4 in Bricker et al., 2007). OEC and symptom expressions were geo-graphically variable, through the mid-Atlantic (a region of greatestpopulation density), which was most impaired. The most fre-quently noted causes of impacts were agricultural activities (cropsand animal husbandry), urban runoff, wastewater treatment plantsand atmospheric deposition. Comparisons of results from early1990s and 2004 showed no appreciable change in assessed sys-tems with moderate, moderate high and high level eutrophicationimpacts (Fig. 3), despite a national population increase in coastalcounties of 13% between 1990 and 2003 (Crossett et al., 2004). In1999, 68% (84 of 124 assessed systems) had moderate to high lev-els of eutrophication, in the 2004 study 65% (64 of 99 assessed sys-tems) had moderate to high levels of eturophication. The increasein unknowns is primarily a result of the way the data were col-lected with personal visits and workshops held in the 1999 studyand self-reporting at a website, with minimal personal contact inthe follow-up study.
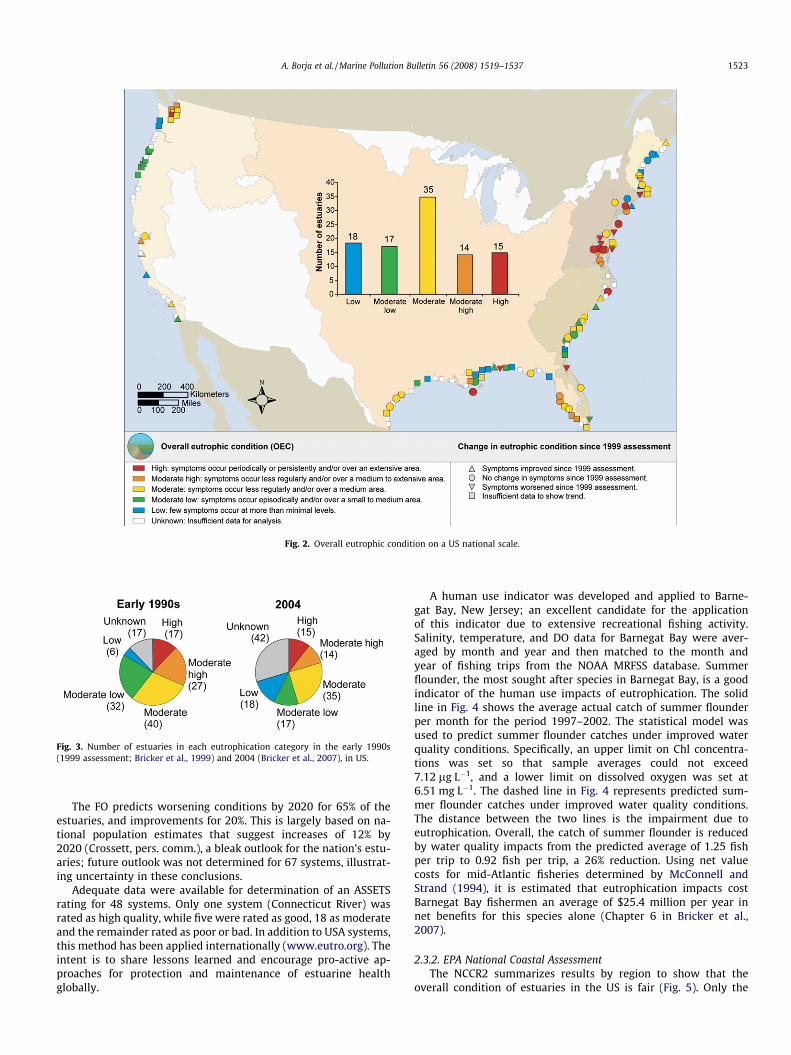
Fig. 2. Overall eutrophic condition on a US national scale.
Fig. 3. Number of estuaries in each eutrophication category in the early 1990s(1999 assessment; Bricker et al., 1999) and 2004 (Bricker et al., 2007), in US.
A. Borja et al. / Marine Pollution Bulletin 56 (2008) 1519–1537 1523
The FO predicts worsening conditions by 2020 for 65% of theestuaries, and improvements for 20%. This is largely based on na-tional population estimates that suggest increases of 12% by2020 (Crossett, pers. comm.), a bleak outlook for the nation’s estu-aries; future outlook was not determined for 67 systems, illustrat-ing uncertainty in these conclusions.
Adequate data were available for determination of an ASSETSrating for 48 systems. Only one system (Connecticut River) wasrated as high quality, while five were rated as good, 18 as moderateand the remainder rated as poor or bad. In addition to USA systems,this method has been applied internationally (www.eutro.org). Theintent is to share lessons learned and encourage pro-active ap-proaches for protection and maintenance of estuarine healthglobally.
A human use indicator was developed and applied to Barne-gat Bay, New Jersey; an excellent candidate for the applicationof this indicator due to extensive recreational fishing activity.Salinity, temperature, and DO data for Barnegat Bay were aver-aged by month and year and then matched to the month andyear of fishing trips from the NOAA MRFSS database. Summerflounder, the most sought after species in Barnegat Bay, is a goodindicator of the human use impacts of eutrophication. The solidline in Fig. 4 shows the average actual catch of summer flounderper month for the period 1997–2002. The statistical model wasused to predict summer flounder catches under improved waterquality conditions. Specifically, an upper limit on Chl concentra-tions was set so that sample averages could not exceed7.12 lg L�1, and a lower limit on dissolved oxygen was set at6.51 mg L�1. The dashed line in Fig. 4 represents predicted sum-mer flounder catches under improved water quality conditions.The distance between the two lines is the impairment due toeutrophication. Overall, the catch of summer flounder is reducedby water quality impacts from the predicted average of 1.25 fishper trip to 0.92 fish per trip, a 26% reduction. Using net valuecosts for mid-Atlantic fisheries determined by McConnell andStrand (1994), it is estimated that eutrophication impacts costBarnegat Bay fishermen an average of $25.4 million per year innet benefits for this species alone (Chapter 6 in Bricker et al.,2007).
2.3.2. EPA National Coastal AssessmentThe NCCR2 summarizes results by region to show that the
overall condition of estuaries in the US is fair (Fig. 5). Only the

Fig. 4. Barnegat Bay (US) monthly average summer flounder actual catch per recreational fishing trip (solid line), and predicted catch rates under improved water quality(WQ) conditions (dashed line).
Fig. 5. Overall US national and regional coastal condition between 1997 and 2000 (USEPA, 2005).
1524 A. Borja et al. / Marine Pollution Bulletin 56 (2008) 1519–1537
CHI received a poor overall rating and only the FTCI was ratedgood for any region. The WQI, equivalent to the OEC of theNEEA/ASSETS, the BI and SQI were rated fair to poor. About
28% of estuarine area is impaired for aquatic life use, 22% is im-paired for human use, and an additional 44% is threatened forboth uses. The EPA NCA reported no significant changes in over-

A. Borja et al. / Marine Pollution Bulletin 56 (2008) 1519–1537 1525
all environmental condition on a national basis from the early tothe late 1990s, but the WQI was reported to improve over thesame time period.
3. Current situation in Africa
3.1. Legislative framework
The most recent report on the current situation of the overallAfrican continent was published by the United Nations Environ-ment Programme (UNEP), the situation of coastal and marine envi-ronments was reported by Arthuron and Korateng (2006). As otherregions worldwide, coastal populations in Africa continue to grow,and pressures on the environment from land-based and marine hu-man activities increased within the last 50 years; coastal and mar-ine living resources and their habitats are being lost or damaged inways that have diminished biodiversity and thus decreasedopportunities for livelihood and aggravating poverty (Arthuronand Korateng, 2006). They have identified key concerns over thecontinent, including natural disasters, poverty, overexploitationof offshore fisheries, exploitation of non-living resources (oil, dia-monds, etc.), modification of river flows to the coast by dammingand irrigation, and other pollution from land, marine and atmo-spheric sources. One of the conclusions is the need for developingand promoting integrated coastal management plans, with stronginter-sectoral and international linkages, including those withcatchment management authorities with responsibilities for Inte-grated Water Resource Management.
On these regards, one of the most advanced countriesimplementing such policies within the continent is South Africa.This is a dry country with an average rainfall of less than500 mm year�1, well below the global average, and with expecta-tions of declines associated with climate change over the next cen-tury. Reviews of environmental legislation in South Africa,particularly relating to aquatic resources and the coastal zone,are associated with reviews by the Council for the Environment(1989, 1991) which began proposing policies for coastal zone man-agement. The status of coastal management was subsequently re-viewed by Sowman (1993), preceding the development of a greenpaper (Department of Environmental Affairs and Tourism, 1998)focussed on sustainable coastal development, followed by a whitepaper (Department of Environmental Affairs and Tourism, 2000) onthe same topic. The appearances of these policy documents wereparalleled by publications by Glazewski (1997) and Glavovic(2000a, 2000b) aimed at converting the policies and concernsarticulated in the white paper into an integrated coastal manage-ment bill and ultimately a national Coastal Management Act(www.deat.gov.za) which is presently in the process of ratification.
On the aquatic resources side, including freshwater, estuarineand marine environments, the National Environmental Manage-ment Act 107 of 1998 was superceded/complemented by theNational Water Act of 1998 (www.dwaf.gov.za/documents/publications). This new act represented a radical digression fromthe philosophy inherent in the historical approach to themanagement of aquatic resources, i.e. that aquatic environments,particularly fresh water and estuarine systems, were granted a le-gal persona in that the dependence of the functionality of these sys-tems on a minimal level of freshwater flow was given a legal statuswhich had to be taken into account when any water abstractionwas contemplated. The arguable premise that aquatic systems,such as wetlands, rivers and estuaries, are ultimately dependenton minimal levels of freshwater availability, beyond which theirfunctionality will be impaired, clearly generates the question asto what is this level and how it might be established. This aspectwill be dealt with in the next section.
3.2. Tools and methodologies used in assessing ecological integrity
In the present context the emphasis will be on the determina-tion of the freshwater requirements of estuaries (Department ofWater Affairs and Forestry, 2004), henceforth referred to as the ‘‘re-serve” although the procedure is described as part of a packagedealing also with reserve requirements of rivers and wetlands(http://www.dwaf.gov.za/documents/policies/wrpp). Other meth-odologies have been published for assessing quality using fish(Harrison and Whitfield, 2004, 2006), estuarine health (Cooperet al., 1994; Harrison et al., 2000), or conservation significance(Turpie et al., 2002) as indicators.
3.3. Some examples of integrative assessment
An example of the above where an assessment of the currentstatus was followed by remedial action and the institution of amonitoring system to check on the effectiveness of the measuresused is provided by the Mhlanga estuary (29�420S; 31�60E) on thenorthern outskirts of the city of Durban, east coast of South Afri-ca. This small system with an estuarine area of barely 12 ha(Begg, 1978) is nevertheless typical of many of the 73 systemswhich occur along the 570 km of the KwaZulu-Natal coastlineand further south into the Eastern Cape Province. The majorphysical and chemical features of these systems are determinedby the seasonal rainfall, and consequently variable river flow,coupled with strong wave action as well as longshore sand trans-port which typically result in the closure of these systems duringwinter low flow periods. Under these conditions tidal action islost and with it the organisms dependent on an intertidal habitat.Salinities typically fall due to sustained low levels of fresh waterinput and outward seepage through the bar, but layering may de-velop if the bar is low enough for overwash to occur during highwave conditions. Water levels behind the bar will rise, dependingon the height of the bar, and can result in substantial backfloo-ding such that the overall extent of the aquatic environment, interms of water column and benthic habitat, increases well beyondthat associated with high tides during periods with an openmouth. Under natural conditions this bar would naturally bebreached during summer high flow periods but historically (Begg,1984) this pattern has been disrupted by artificial breaching toprevent flooding of cultivated land or infrastructure in the back-flooded areas.
The Mhlanga estuary has over the last 25 years become one ofthe better known of the smaller KwaZulu-Natal systems by virtueof studies including general surveys of the system carried out in1980–1981 (Begg, 1984), as well as a more intensive focus on thefish fauna producing information on trophic relationships withinthe fish community (Whitfield, 1980a), fish distribution in relationto food resources (Whitfield, 1980b) and factors affecting therecruitment of juvenile fish into the estuary (Whitfield, 1980c).Harrison et al. (2000) produced a nationwide assessment of thestate of South African estuaries based on the geomorphology, ich-thyofauna, water quality and aesthetics. The latter three parame-ters were rated on a scale of poor, moderate or good. The fishfauna was assessed on the basis of species richness and communitycomposition, the water quality on suitability for aquatic life interms of dissolved oxygen, ammonia, faecal coliforms, nitratenitrogen and ortho-phosphate and the aesthetics on a ‘‘visual ap-praisal of the state of development in and around the estuary”incorporating i.a. any type of anthropogenic influence, algalblooms, odours, noise or invasive plants. The fish fauna and aes-thetics of the Mhlanga estuary were rated as good but the waterquality as poor. The poor water quality reflects the vulnerabilityof these small systems during the closed mouth periods whenwater exchange is minimal and tidal effects non-existent. In

1526 A. Borja et al. / Marine Pollution Bulletin 56 (2008) 1519–1537
2002–2003 the South African Water Research Commission spon-sored a multi-disciplinary study incorporating mouth dynamics,physico-chemical conditions, nutrient conditions, phytoplanktonand microphytobenthos, zooplankton, benthos, fish and birds(Perissinotto et al., 2004). This study aimed at contributing to theimplementation of measures for reserve determinations forestuaries. In the local context the project focussed on the ‘‘re-sponses of the biological communities to flow variation and mouthstate in temporarily open/closed estuaries”, one of which was theMhlanga.
In summary, the study supported perceptions and interpreta-tions developed some 20 years earlier (Begg, 1984), that thebroad natural cycle of summer breaching and winter closuredue to the seasonal rainfall pattern was a major driving force inthe functioning of these temporarily open/closed systems.Although these estuaries became non-tidal and salinities droppedto virtual freshwater levels during closed periods, with a conse-quent effect on benthic invertebrate diversity, the fish fauna,which tended to consist largely of juveniles recruited to thesenursery grounds during open mouth periods or through over-wash, appeared able to handle these low salinities. Retentionand accumulation of water behind the bar also resulted in an ex-panded aquatic and benthic environment relative to that existingunder high tide conditions. The increased and stable water col-umn permitted the development of phytoplankton and in turnthe development of a zooplankton and planktivorous fish fauna,while the benthos was able to expand in abundance althoughnot in diversity. Optimisation of these processes depended onregular seasonal cycles of breaching or overtopping, allowing fishor invertebrate migration, followed by periods of closure whichallowed the accumulation of biomass, both plant and animal, be-fore the next exchange. Disruption of this cycle by artificialbreaching and draining of the estuary during winter when waterlevels normally peak would disrupt this cycle. Additional effectswould be imposed by nutrient inputs from agricultural runoffor urban pollution resulting in algal blooms, eutrophication andoxygen depletion.
In the Mhlanga, records of behaviour of the mouth, coupledwith historical observations (Begg, 1978, 1984), calculations ofthe pristine mean annual and monthly runoff and the present sit-uation indicated that outflow of treated water from a sewageworks situated upstream of the estuary significantly increasedthe total flow into the estuary and the frequency of mouth breach-ing, resulting in the type of impacts described above.
At low input levels the variable quality of the treated effluentwas such as to generate localised periodic low or anoxic conditionsresulting in fish kills. The increase in water inflow into the riverfrom the sewage works resulted from the fact that the water usedin the catchment was derived from other catchments and resultedin an overall increase in the Mhlanga flow. In this situation, the im-pacts on the estuary arose from the rather unusual situation of ex-cess flow rather than the more common problems arising fromwater abstraction.
The provisions of the reserve determinations allow for eitherthe maintenance of an existing acceptable ecological status orthe implementation of measures to improve the ecological statusof an estuary. In this case the measures that have been imple-mented by the local municipality involve the installation of a pipe-line to transport the excess water to an adjacent catchment whichhas been subject to significant abstraction as well as improvedtreatment of the waste water from the sewage works. A monitoringoperation has been implemented to assess the success or negativeeffects of the reduction in water input. A closed circuit camera isbeing used to monitor mouth dynamics including the possibilityof anthropogenic interference.
4. Current situation in Asia
4.1. Legislative framework
In Asia, China possesses comprehensive laws and regulationsdealing with coastal areas, including over 25 legislative instru-ments (Zhijie, 1989; Cao and Wong, 2007) addressing issues suchas regulations on dumping (1985, 1992), Marine Protected Areas(1994, 1995, 1997), Environmental Impact Assessment (2002)(Lindhjem et al., 2007), and the implementation of the UNCLOSConvention in 1998 (Keyuan, 2001), together with specific disposi-tions e.g. for fisheries (Keyuan, 2003).
Integrated Coastal Zone Management (ICZM) requires appropri-ate legislation, and benefits from the existence of strong publicparticipation and independent coordination (Lau, 2005) thusavoiding the twin pitfalls of marginalizing stakeholders andencouraging sectoral management. Participation and coordinationissues are not easily achieved in the present-day PRC, however apilot structure for ICZM exists in Xiamen (Xue et al., 2004; Penget al., 2006) and is planned for Shanghai (Lau, 2005). Nevertheless,the concept of integrated assessment, as set down e.g. in the Euro-pean WFD, does not seem to be widely applied.
4.2. Tools and methodologies used in assessing ecological integrity
A review of Chinese literature indicates that progress towardsthe application of extended tools used to assess ecological integrityis incipient (e.g. Xue et al., 2004; Huang et al., 2006; Leung, 2006).At the same time, there is a growing national concern in regard toshifting from methods based on water chemistry and simple bio-logical diversity metrics to more sophisticated approaches whichuse ecological indicators of degradation to provide a more robustassessment; two methods are reviewed below: (i) coastal eutro-phication assessment, which is compared with the ASSETS model(discussed in the North America section), and (ii) the integratedComprehensive Index Assessment Method (CIAM), for marine re-source assessment.
4.2.1. Coastal eutrophication assessmentThe application of the ASSETS index to Chinese coastal waters
(Xiao et al., 2007) provided an opportunity to review the methodscurrently used in China for assessing coastal eutrophication. His-torically, this assessment has focused on chemical indices, usingtechniques such as the Nutrient Index Method (NIM), to studythe effects of system loading by nutrients, and may therefore beconsidered ‘‘Phase I” (sensu Cloern, 2001) approaches (Yao andShen, 2005).
The NIM, proposed by the Chinese National EnvironmentalMonitoring Center, is based on a nutrient index (Ni) in seawater(Lin, 1996), calculated using Eq. (1)
CCOD
SCODþ CTN
STNþ CTP
STPþ CChla
SChlað1Þ
where: CCOD, CTN, CTP and CChla are measured concentrations ofChemical Oxygen Demand (COD), total nitrogen, total phosphorus(in mg L�1) and chlorophyll a (in lg L�1) in sea water, respectively.SCOD, STN, STP and SChla are standard concentrations of COD(3.0 mg L�1), total nitrogen (0.6 mg L�1), total phosphorus(0.03 mg L�1) and chlorophyll a in seawater (10 lg L�1), respec-tively (Lin, 1996). If Ni is greater than 4 the seawater is consideredeutrophic.
While NIM is widely used in Chinese coastal systems, researchin recent decades has identified key differences, in nutrient enrich-ment, between the responses of limnology-originated methods,such as this one, and those of coastal-estuarine ecosystems (Cloern,

A. Borja et al. / Marine Pollution Bulletin 56 (2008) 1519–1537 1527
2001; Bricker et al., 2003; Ferreira et al., 2007a, 2007b). Partly, thisis because coastal environments systems with similar pressuresshow widely varying responses, so there is often no clear relation-ship between nutrient forcing and eutrophication symptoms. Inparticular, nutrient concentrations have often been shown to bepoor indicators of eutrophication symptoms (e.g. Tett et al.,2003), since ecosystem responses are modulated by factors suchas morphology, tidal range, natural turbidity and water residencetime.
4.2.2. Marine resources and ecological quality assessmentMost estuaries and coastal inlets and embayments are also
important fishery grounds. The Comprehensive Index AssessmentMethod (CIAM) was developed and applied to evaluate the ecolog-ical quality of the marine fisheries environment for major coastalareas of China (Jia et al., 2003, 2005; Ma et al., 2006). CIAM incor-porates four assessment modules: seawater quality, nutrient level,primary production level, and diet organism richness; the index isthe mean value of the sub-indices.
Seawater quality assessment in CIAM evaluates water pollutionstatus. The main components of coastal pollution in China includeorganics (indicated as COD), eutrophication, total hydrocarbons,and heavy metals. The organic pollution status is assessed usingthe Organic Pollution Index method (the A value), while the statusof other types of pollution is assessed using Factorial Analysis (Pi)according to Fishery Water Quality GB 11607-1989 and Sea WaterQuality GB 3097-1997. The classification of sea water quality usedin CIAM is given in Table 1. The A value is directly used as Pi duringthe comprehensive ecological quality assessment stage.
Concentrations of dissolved nitrogen (DIN), phosphate and sili-cate and their ratios are used in the sea water nutrient level assess-ment using a NIM (the E value). The seawater nutrient level isclassified as: E = 0–0.5, Grade: 1, Nutrient level: Low; E = 0.5–1,Grade: 2, Nutrient level: Medium; and E > 1, Grade: 3, Nutrient le-vel: Eutrophic. The E value is used as Pi in the CIAM.
Primary productivity level and diet organism richness areimportant indicators for the fishery environment quality status.Since they vary significantly among different areas along the coast,six grades are used to classify the quality status (Table 2). The levelfor each item is taken as Pi in the final CIAM. The CIAM index is cal-culated as
Table 1Classification of sea water quality used in CIAM, including organic pollution assessment, TP2003); and comprehensive ecological quality grade of marine fishery environment (Jia et
Organic pollution assessment
TPH and heavy metal pollution assessment
Comprehensive ecological quality grade of marine fishery environment
Ip ¼1n
Xi¼1
n
Pi ð2Þ
Ip, comprehensive ecological quality index; P, index level assessedfor indicator i (i.e. indices for seawater quality, nutrient, primaryproductivity and diet organism richness); n, total number ofindicators.
The CIAM of the marine fishery environment is classified intosix grades according to quality index Ip, excellent, fine, relativelyfine, moderate, poor and very poor (Table 1).
4.3. Some examples of integrative assessment
4.3.1. Eutrophication assessment of Jiaozhou Bay, Northeast ChinaASSETS was applied to Jiaozhou Bay, and compared with the
evaluation of eutrophication status using chemical indices. Jiaoz-hou Bay is on the west coast of the Yellow Sea (35�570–36�180N,120�060–120�210E), it has a surface area of 397 km2 and a meandepth of 7 m (Editorial Board of ‘‘Bays in China”, 1993). It is asemi-enclosed body of water, connecting to the Yellow Sea througha 2.5 km channel, and has a mean tidal range of 2.5–3.0 m, buttides can reach 4.2 m, resulting in a well mixed water column(Liu et al., 2004).
The bottom of the bay contains spawning, nursery and feedinggrounds for fish, and intensive mariculture. Historically, this hasfocused on the bay scallop (Argopecten irradians) and Pacific oyster(Crassostrea gigas), cultivated on longlines. Recently, the longlineshave been removed and Manila clam (Tapes philippinarum) isnow cultivated, with a production of 200,000 t year�1. The main is-sue in the bay is an increase in both the frequency and magnitudeof harmful algal blooms (HABs), since the 1990s, although mostevents are non-toxic (Han et al., 2004).
Jiaozhou Bay has a volume of 1900 � 106 m3, which, with anitrogen load into the bay of 30 ton per day (Wang et al., 2006), re-sults in a High rating for the nutrient component of IF (0.933).Strong tidal mixing and high river discharge (8 � 108 m3 year�1)contribute to moderate flushing and dilution potential (EditorialBoard of ‘‘Bays in China”, 1993). However, the intensive ‘top-down’control of the food web has a significant impact, mitigating eutro-phic symptoms.
H (Total Petroleum Hydrocarbon), and heavy metal pollution (adapted from Jia et al.,al., 2003)
Quality index (A value) Grades Quality assessment
<0 1 Excellent0–1 2 Clean1–2 3 Relatively clean2–3 4 Slight pollution3–4 5 Medium pollution>4 6 Serious pollution
Pi Grades Quality Assessment<0.4 1 Background0.4–0.6 2 Clean0.6–0.8 3 Relatively clean0.8–1.0 4 Slight pollution1.0–2.0 5 Pollution>2.0 6 Serious pollution
Index range Grades Quality status0.2 1 Excellent0.2–0.4 2 Fine0.4–0.6 3 Relatively fine0.6–0.8 4 Moderate0.8–1.0 5 Poor>1 6 Very poor

Table 2Grade of primary productivity and diet organism richness (Jia et al., 2003)
Grades
Item 1 2 3 4 5 6
Status Low Relatively low Medium Relatively high High Super high
Index level >1.0 1.0–0.8 0.8–0.6 0.6–0.4 0.4–0.2 <0.2Primary productivity (mg C mg�1 day�1) <200 200–300 300–400 400–500 500–600 >600Phytoplankton (104 ind m�3) <20 20–50 50–75 75–100 100–200 >200Zooplankton (mg m�3) <10 10–30 30–50 50–75 75–100 >100Benthos (g m�2) <5 5–10 10–25 25–50 50–100 >100
1528 A. Borja et al. / Marine Pollution Bulletin 56 (2008) 1519–1537
The susceptibility component of the IF, based on only naturalcircumstances, is Moderate but when shellfish aquaculture is takeninto account, the overall susceptibility is Low. This is one exampleof the difficulty in universal application of such methods, since AS-SETS must be potentially adapted to incorporate local societal fac-tors. The combination of High nutrient load and Low susceptibilitygives an overall IF rating of Moderate Low.
Chlorophyll a is the only indicator with information for the pri-mary symptoms. No information exists for macroalgae, which wastherefore classified as Unknown. Maximum chlorophyll a values inJiaozhou Bay did not exceed the threshold indicated in ASSETS forMedium eutrophic conditions. ASSETS uses the 90th percentile va-lue of annual data to provide a typical maximum value for chloro-phyll a, and in the bay this value is 4–5 lg L�1, i.e. in the Lowcategory. Therefore, the rating for primary symptoms is Low basedon chlorophyll a.
Data for dissolved oxygen were collected from various sites overan annual cycle, as a secondary symptom. No information wasfound for SAV, but due to the historical scale of kelp aquaculturein the bay, the level for this secondary symptom would be at worstLow.
Few values below the threshold for biologically stressful dis-solved oxygen condition (5 mg L�1) were detected in JiaozhouBay. As described earlier, the 10th percentile is applied to providea more consistent minimum value for dissolved oxygen. In this sys-tem, the 10th percentile for annual dissolved oxygen data is be-tween 6 and 7 mg L�1, indicating no problems with regard to thisindicator.
Some 69 harmful algal species were observed in Jiaozhou Bay(Han et al., 2004). Toxic blooms are episodic, usually lasting foronly a few days (e.g. Huo et al., 2001). Therefore, the symptom of‘‘nuisance and toxic blooms” is rated as Low.
The highest level of the three secondary symptoms falls into theLow category, and the OEC resulting from the combination of pri-mary and secondary symptoms for this system is Low.
The estimate based on the current development scenario gives a9.3% human population increase over 20 years (P.R.C. National Bu-
Table 3ASSETS application to Jiaozhou Bay
Index Method Indicator Level o
IFa Susceptibility Dilution potential ModeraFlushing potential Modera
Nutrient inputs HighPSMc Chlorophyll a Low
Macroalgae No proOECb Dissolved Oxygen Low
SSMd SAV loss LowNuisance and toxic blooms Low
FOe Future nutrient pressure Decreas
a IF, influencing factors.b OEC, overall eutrophic condition index.c PSM, primary symptoms method.d SSM, secondary symptoms method.e FO, future outlook index.
reau of Statistics, 2001). In addition, Qingdao (the main land nutri-ent source, pop. 8 million) is strongly promoting its tourismindustry and less space is available for mariculture in the bay.Accordingly, reduced top-down control on primary productioncould lead to increased eutrophic symptoms. Additionally, Qing-dao’s preparations to host the Olympic Sailing Regattas in 2008have focused attention on water quality issues and mitigation ofeutrophic symptoms. The government has pledged to build morewastewater treatment plants in the near future, and more restric-tive pollutant emission regulations are coming into effect (Wanget al., 2006).
As a whole, nutrient loads are expected to decrease, despite theincrease in the urban population, and the water quality is likely toimprove. FO can therefore be considered to be Improve low. Table 3summarizes the results obtained from the application of ASSETS toJiaozhou Bay, which resulted in an overall score of High Status,indicative of minimal or no eutrophication problems.
The results are better than expected due to top-down controlrelated to intensive shellfish mariculture. This has importantimplications for successful management of nutrient-related prob-lems, which are not captured by the Chinese ‘‘Phase I” NIM, whichclassifies the system as Eutrophic. Moreover, the NIM cannot bydefinition be clear indicators for a large system, because there isno allowance for spatial differences in impact level within a water-body. The evaluation of the systems using salinity zones, as in AS-SETS, contributes to a more accurate evaluation of the system andsubsystems, necessary to target management efforts. A comparisonof various methods for eutrophication assessment is shown in Ta-ble 4.
The top-down control of the food web in Jiaozhou Bay suggestsa feasible way to manage coastal eutrophication. These controlstrategies, which have traditionally been used in China, are nowbeing discussed in the EU and the USA (e.g. Lindahl et al., 2005;Ferreira et al., 2007b). Paradoxically, the Chinese, USA and othergovernments and scientists currently focus mainly on a bottom-up approach in improving water quality, though there is plentyof scope to promote top-down control. Water quality data col-
f expression Index result ASSETS score
te Low (due to intense shellfish aquaculture)te
blemLow High
e Improve low

Table 4Summary of comparison among ‘‘Phase I/II” methods (adapted after Bricker et al., 2006)
Methods Temporal focus Indicator criteria/thresholds Combination method
Nutrient Index I Not specified Modified after Japanese criteria Sum of four ratiosNutrient Index II Not specified Modified after Japanese criteria Ratio of three indicators to their threshold valuesOSPAR COMPP Growing season, winter for
nutrientsIndividually/regionally determined referencecondition
Integration of scores for four categories
EPA NCA Summer index periods Determined from American national studies Ratio of indicators: good/fair indicators to poor/missing dataASSETS Annual cycle Determined from American national studies Average of primary and highest secondary are combined by
matrix
A. Borja et al. / Marine Pollution Bulletin 56 (2008) 1519–1537 1529
lected in Jiaozhou Bay during 1999–2000 were used to estimatethe gross removal of phytoplankton by Manila clams. On the basisof reported bivalve stocks, these organisms remove about627 t yr�1 of chlorophyll a, which (considering a carbon:chloro-phyll ratio of 50 and a Redfield C:N ratio of 45:7 in mass) corre-sponds to the removal of almost 4,900 t yr�1 of nitrogen, i.e 1.5million population equivalents, or 17% of the population of Qing-dao, and to 45% of the estimated 11,000 t yr�1 nitrogen load. Alongwith economic benefits, the introduction of filter-feeders on a rea-sonable scale thus allows for cost-effective removal of nutrientsand mitigation of eutrophic conditions, which is more environ-mentally-friendly and sustainable for a coastal system (Shastriand Diwekar, 2006).
4.3.2. Marine resources and ecological quality assessment in the SouthChina Sea
To understand the health status and ecological quality of thefishery environment in the northern South China Sea, a compre-hensive and systematic survey program was carried out from1997 to 2002. This included Taiwan bank, East Guangdong, PearlRiver estuary, West Guangdong, Southern waters of Hainan, andBeibu Bay. The quality status of the fishery environment in thenorthern South China Sea was assessed based on the data on sea-water quality, sea water nutrient structure and nutrient level,and primary productivity and diet organism level using CIAM (Jiaet al., 2005).
The results showed that the overall water quality index waswithin the criteria limit of Fishery Water Quality GB 11607-1989 and the Grade criteria of Sea Water Quality GB 3097-1997. The organic pollution index (A value) range was 0.411–0.237, and the nutrient index (E value) range was 0.10–0.34,which indicated the waters were not organically polluted andthe nutrient status was low. The primary productivity of thewaters, ranging from Grade 5 to Grade 1, with an annual averageof Grade 3, was at a the ‘‘medium” level. For the richness of dietorganisms, the grade of phytoplankton, zooplankton and benthic
Table 5Quality indices of the fishery environment of northern South China Sea (according to Jia e
Waters DIN PO34 � P A E DO Primary pro
Northern South China Sea 0.27 0.55 0.23 0.34 0.72 0.58
Taiwan bank waters 0.29 0.52 0.20 0.28 0.67 0.50
East Guangdong waters 0.31 0.61 0.21 0.30 0.78 0.54
Pearl River estuary 0.26 0.58 0.23 0.37 0.74 0.68
West Guangdong waters 0.28 0.54 0.25 0.47 0.72 0.58
Southern waters of Hainan 0.24 0.50 0.20 0.30 0.73 0.64
Beibu Bay 0.24 0.45 0.20 0.30 0.66 0.72
organisms were 3, 5 and 4 respectively, within a relatively high le-vel in general.
The comprehensive quality assessment results (Table 5) showedthat the quality indices of 9 factors (including DO, DIN, PO3
4, A, E,primary productivity, phytoplankton, zooplankton and benthos)were all lower than 1.0 and the comprehensive quality index was0.58, indicating the ecological quality of the overall area was rela-tively fine. However, the comprehensive ecological quality index ofPearl River estuary, East Guangdong waters, West Guangdongwaters and Beibu Bay were all over 0.60; the quality status wasmoderate, far worse than the fine level, a sign of environmentaldegradation along the coast of Guangdong Province. This meansthat due to the continuous and rapid growth of industry and econ-omy of Guangdong, especially in the Pearl River Delta, more atten-tion should be paid to environmental protection and ICZM.
5. Current situation in Australia
5.1. Legislative framework
Australia adopted an Oceans Policy in 1998 and subsequentlyestablished a National Oceans Office that initiated a process of‘marine bioregional planning’. These measures reflected require-ments and obligations that arose for Australia as a signatory tothe United Nations Convention on the Law of the Sea (UNCLOS)which came into force in 1994. Subsequently, the Environment Pro-tection and Biodiversity Conservation Act 1999 (EPBC Act) providedthe overarching framework for management of Australia’s nationaland international marine environmental responsibilities.
In 2005 the Australian Government brought its program of re-gional marine planning directly under the scope of the EPBC Act1999. As a federal nation, however, the situation is complicatedby the history of internal jurisdictional responsibilities for the ori-ginal three nautical mile territorial sea limit that existed prior tothe development of arrangements under UNCLOS. In 1975 adecision of the High Court of Australia upheld legislation vesting
t al., 2005)
ductivity Phytoplankton Zooplankton Benthos Comprehensive index
0.53 0.88 0.78 0.58Relatively fine
0.37 0.75 0.68 0.51Relatively fine
0.79 0.88 0.81 0.61Moderate
0.55 1.00 0.91 0.64Moderate
0.58 0.88 0.77 0.60Relatively fine
0.36 0.87 0.82 0.55Relatively fine
1.00 0.94 0.94 0.66Moderate

1530 A. Borja et al. / Marine Pollution Bulletin 56 (2008) 1519–1537
sovereignty, in respect of the territorial sea, in the Federal Govern-ment. The implications of this were addressed by the Offshore Con-stitutional Settlement of 1979 whereby legislative competence andproprietary rights over the three nautical mile territorial sea weretransferred to the States and Territories through the CoastalWaters (State Titles) Act (1980). This revalidated pre-existing statelegislation, and restored the title, responsibilities and rights ofstates and territories with respect to the seas, seabed and subsea-bed within the three nautical mile territorial sea and internalwaters.
As a consequence the States and Territories have primaryresponsibilities for management of marine environments, naturalresources and the impacts of human activities within internalwaters and the territorial sea limits. The States and Territories havediffering approaches to management of marine ecologicalintegrity.
Federal responsibilities relate primarily to areas beyond thenew limit although Section 23(2) of the EPBC Act (1999) givesthe Federal Government an overarching capacity to address issuesthat actions taken outside Commonwealth marine areas that have,will have, or are likely to have a significant impact upon them.
Currently there is no standard set of environmental indicatorsused across Australia by the states and federal governments. After2001 the implementation of the Australian state of the environ-ment reports (SOE), an attempt was made at the subsequent Aus-tralian and New Zealand environment and conservation council(ANZECC) to obtain some uniformity of indicators across Australia.A core set of 75 indicators was established but efforts to reduce thisto a smaller core set were unsuccessful. Subsequently for the SOE2006 process, a data reporting system (DRS) (http://www.deh.go-v.au/soe/DRS) was developed. However a brief review of the vari-ous SOE’s for each state government, for an evaluation of thestatus of estuarine and inshore coastal waters, revealed no unifor-mity or consistent pattern of indicators being used between thestates. Virtually all the indicators were physical parameters withno biological indicators being used.
In 2004 a comprehensive report was prepared on estuarine,coastal and marine indicators for regional NRM monitoring bythe CRC for Coastal Zone, Estuary and Waterway Management(Souter, 2007). This summarised the issues to be targeted such asinland aquatic ecosystems integrity and estuarine, coastal andmarine habitat integrity as well as nutrients, turbidity and surfacesalinity in freshwater aquatic environments, significant native spe-cies and ecological communities and invasive species. For each ofthese items for targeting the report provides a detailed summaryof useful indicators. However, there is no attempt to discuss the ac-tions to be taken by the relevant authorities (of which there aremany) to act upon the results obtained from any monitoringundertaken. Most important, the situation is confused by theState/Federal boundaries. It is unclear as to whether any real pro-gress has been made in co-ordinating these measures, and thenacting upon them.
5.2. Tools and methodologies used in assessing ecological integrity
In parallel with the development of a broader political and leg-islative framework for marine environmental management in thecontext of UNCLOS, Australia was engaged in the implementationof the Great Barrier Reef Marine Park Act (1975) which providesfor the Great Barrier Reef Region to be managed for conservationand reasonable use.
With an extent of 350,000 km2 and little physical surveyof areas beyond shipping lanes, preparation for ecosystem scalemanagement of the Great Barrier Reef required development ofapproaches to implement a working understanding of bioregional-isation in a data-lean environment (Kenchington, 1990). The initial
tasks included commissioning of a geomorphological classificationof reefs and shoals at a scale of 1:250,000. This was followed by de-tailed surveys of reefs conducted by the Australian Survey Officeand subsequently by the development of 1:250,000 rectified mapsof the Great Barrier Reef region drawing on LANDSAT imagery toinfill ground survey data (Kenchington, 1990). These maps wereused for expert consultation on the distribution of ecological com-munities and fisheries resources. Data on the occurrence and dis-tribution of biological communities were extremely patchy withmajor data sources being reef research stations and expeditionarystudies. The community and resource distribution maps resultingfrom expert consultation were then used to seek comment andamendment during a phase of public consultation prior to develop-ment of a draft zoning plan for a section of the Great Barrier ReefMarine Park (Kenchington, 1990).
The initial zoning of the Great Barrier Reef took account of sea-bed communities known from fisheries surveys and productionand benthic communities such as Halimeda algal beds and spongebeds but focussed largely on coral reef communities. In 1998, theGreat Barrier Reef Marine Park Authority started a process of re-view of zoning in the light of experience, new information andchanged circumstances of use and management of the Marine Park(Lawrence et al., 2002).
A major element identified in the context of managementresponsibilities was the need for an adequate network of highlyprotected (no take) areas representative of all of the bioregionsoccurring within the Great Barrier Reef World Heritage Area.
There are 30 reef and 40 non reefal bioregions which are char-acterised by physical and biological features (Day et al., 2002). Adecision was made that at least 20% of each of these bioregionswas to be declared as a ‘no take’ zone in order to meet the require-ments to maintain World Heritage values. After the completerezoning, many of these bioregions were represented by more than20% no take. The location of these no take zones took into accounteconomic and social factors to minimise, as far as practicable, theimpact of these zones on the users of the GBR. Ongoing monitoringduring the next few years will attempt to obtain data to supportthe declaration of these no take zones and identify if additionalsuch zones need to be declared, especially in the light of ongoingclimate change.
5.3. Some examples of integrative assessment
An example is the Integrated Marine and Coastal Regionalisa-tion for Australia (IMCRA, 1998). The methods developed forassessment of the Great Barrier Reef region were an important in-put to the process of developing a marine biogeographic regionali-sation of Australia which was required to address commitments inconnection with the creation of a national system of representativemarine protected areas. A workshop in 1994 (Muldoon, 1995) ledto the development of an initial interim biogeographic regionalisa-tion (Thackway and Cresswell, 1995), a series of updated versionsand most recently in 2006 to an integrated marine and coastalregionalisation of Australia.
The IMCRA has developed best contemporary understanding ofprovincial bioregions based on regionalisation of demersal fishcommunities (Last et al., 2005). Nested within this, a meso-scaleregionalisation has been developed using finer scale informationprovided by relevant State and Northern Territory agencies. Thethird element is a map of the sea bed classified into 14 classes ofregions of similar geomorphology.
The IMCRA process is dynamic, providing for updates as newdata come to hand indicating need for revisions. Other implemen-tations of integrated oceans management, such as the Australia’ssouth east regional marine plan, can be consulted in Foster et al.(2005) and Vince (2006).

A. Borja et al. / Marine Pollution Bulletin 56 (2008) 1519–1537 1531
6. Current situation in Europe
6.1. Legislative framework
In recent years the European Union has adopted several Direc-tives for nature protection (e.g. for Habitats and Species, WildBirds, or Environmental Impact Assessment). However, increasingpressures and impacts within European estuaries and coasts havelead to the approval of a series of laws which focus on water man-agement, including the water framework directive (WFD), the Rec-ommendation on ICZM, the Directive on Marine Strategy, and theMaritime Policy. Details on these Directives and associated imple-mentations can be consulted in many references, such as Borjaet al. (2004a, in press), Rice et al. (2005), Borja (2005, 2006), Suárezde Vivero (2007), Fletcher (2007), or a recent special issue in Mar-ine Pollution Bulletin (2007: 55(1/6). All these Directives emphasisethe increasing need to protect European coastal and estuarine eco-systems and to move towards marine integrative management.The main objective of the WFD is to achieve a Good Ecological Sta-tus, for all European water bodies, by 2015. On the other hand, theEMS requires the achievement of a ‘Good Environmental Status’,for all European seas, by 2021.
6.2. Tools and methodologies used in assessing ecological integrity
The achieving of the abovementioned objectives requires thefull development of tools and methodologies suitable to assessenvironmental quality in an integrative way. The integration ofseveral elements of the ecosystem, including physico-chemicaland biological elements (phytoplankton, zooplankton, benthos, al-gae, phanerogams, fishes), is essential in the assessment (Rogerset al., 2007).
The European scientific community is developing many differ-ent methodologies for coastal management (Sardá et al., 2005)and separate assessments of the quality of each of the WFD ele-ments. Some of these methodologies can be consulted in volume55 (issues 1–6) of Marine Pollution Bulletin, together with the report‘‘WFD intercalibration technical report. Part 3–Coastal and Transi-tional Waters” (March, 2007, http://circa.europa.eu/Public/irc/jrc/jrc_eewai/library?l=/milestone_reports/milestone_reports_2007/coastaltransitional/coast_nea_gig&vm=detailed&sb=Title). Con-versely, the efforts addressed until now for the EMS implementa-tion have been focused on fisheries management under the EBA(Browman et al., 2004; Nicholson and Jennings, 2004; Rice et al.,2005; Frid et al., 2006; and Apitz et al., 2006).
Despite the above, very few studies have been published whichintegrate all physico-chemical and biological elements into a singleassessment of the ecosystem (Borja et al., 2004a, in press; Aubryand Elliott, 2006), although some guiding principles have beendeveloped at national levels (e.g. in UK, Rogers et al., 2007). Com-parison of methodologies used in the USA and Europe have beenundertaken in recent years, both for measurements of eutrophica-tion (Ferreira et al., 2007b) and biological elements, such asbenthos (Borja et al., 2008a).
6.3. Some examples of integrative assessment
The approach of Borja et al. (2004a) was further detailed inaspects, such as physico-chemical (Bald et al., 2005), chemical(Borja et al., 2004b; Borja and Heinrich, 2005; Rodríguezet al., 2006), phytoplankton (Revilla et al., 2008), and benthiccommunity structure (Borja et al., 2000; Muxika et al., 2007).The use of ecotoxicological approaches within the WFD inves-tigative monitoring has also been discussed (Borja et al.,2008b).
The WFD established two different quality statuses: chemicaland ecological. Chemical status is based upon concentrations ofmetal and organic compounds, and is determined by comparingmonitored concentrations with quality objectives (QO). If concen-trations are below QO, the chemical status is met; if concentrationsare over QO, the chemical status is not met. The WFD mentionswater quality only in assessing the chemical status, but someauthors include sediment and biomonitoring components (Borjaet al., 2004b, 2006; Borja and Heinrich, 2005), or just sediment(Crane, 2003) (Table 6).
The ecological status integrates physico-chemical, chemical andbiological indicators. The physico-chemical indicators used in thisassessment are those supporting the biological elements (thermalconditions, salinity, oxygen, nutrients, and transparency). Thephysico-chemical status is assessed by means of a Factorial Analy-sis (FA). Hence, the projection of each sampling station, to the lineconnecting reference conditions of ‘high’ and ‘bad’ status, is calcu-lated in the new 3-dimensional space defined by the FA (see Baldet al. (2005), for details). Consequently, those stations located nearthe high reference would represent a ‘high’ physico-chemical sta-tus, and stations located near the bad reference, would be classifiedas in ‘bad’ physico-chemical status. Intermediate stations would beclassified in ‘good’, ‘moderate’ or ‘poor’ status.
Pollutant concentrations are also used in assessing the ecolog-ical status, but only to determine ‘high’, ‘good’ and ‘moderate’ sta-tus (see below). In this particular case, the WFD defines ‘high’status, when concentrations of pollutants remain within the rangenormally associated with undisturbed conditions (i.e., below thebackground level). The concentrations between background levelsand QO are in accordance with the WFD ‘good status’ definition,while ‘moderate’ status can be considered when concentrationsare over QO (for details in this assessment, see Rodríguez et al.(2006).
The metrics used in methodologies implemented for the biolog-ical quality assessment within the WFD are very diverse (Table 7),and include multimetric and multivariate approaches (Borja et al.,2004a; Muxika et al., 2007). These authors provide methods to as-sess the quality of each of the individual biological elements (i.e.phytoplankton, macroalgae, benthos and/or fishes). Nevertheless,it is also necessary to integrate these individual results in a uniquequality value (Borja et al., 2004a).
Following some interpretations, the classification of the ecolog-ical status in the WFD should be based upon the worst of the val-ues in the biological elements. Hence, if the phytoplankton has amoderate value and the remainder of the elements is given a highstatus, the global classification should be moderate ecological sta-tus. Taking into account the spatial and temporal variability ofsome of the biological elements, and the absence of accurate meth-odologies in assessing their biological status, Borja et al. (2004a)propose the weighting of those elements, i.e. benthos, with con-trasted and intercalibrated (Borja et al., 2007) methodologies.Hence, a decision tree permits the derivation of a more accurateglobal classification, including the physico-chemical and chemicalelements (Table 8). Some results of the application of such an ap-proach are presented by Borja et al. (in press).
Most of the methodologies used within the WFD determine thequality at the sampling station level. However, this Directive re-quires integrating quality at the water body level. One possibleway to achieve this is illustrated in Table 9, which concerns a waterbody with four sampling stations, each representative of a certainsurface, within the water body. Having derived the status for eachstation, this result can be substituted by an equivalent value (or thevalue of the ecological quality ratio, sensu WFD (see Borja et al.,2004a; Borja, 2005)), which allows weighting the global status,depending on the representativeness of each of the sampling sta-tions or surface. The same approach can be used in a previous step,

Table 6Decision tree when integrating water, sediments and biomonitors in assessing chemical status, within the Water Framework Directive
Water Sediments Biomonitors Status
All variables meet MeetAll variables meet 1 variable does not meet Meet
>= 2 variables do not meet Does not meet
All variables meet MeetAll variables meet Meet
1 variable does not meet 1 variable does not meet No data Meet>= 1 variable does not meet Does not meet
>= 2 variables do not meet Does not meet
>= 2 variables do not meet Does not meet
Note: A variable ‘meets’ when the concentration is under the quality objectives established by the Directive (Table modified and adapted from Borja et al. (2006)).
Table 7Metrics used in assessing the biological elements quality, within the Water Framework Directive, after Borja et al. (2004a)
Phytoplankton Macroalgae Benthos Fishes
Chlorophyll a Richness Richness RichnessSpecies composition Cover of opportunistic and sensitive spp. Diversity Abundance and percentage of resident spp.Number of blooms Ratio green algae/other spp. AMBI Trophic composition
Flat fish percentagePollution indicator spp.Invasive spp.Fish health
AMBI, AZTI’s marine biotic index (Borja et al., 2000); spp, species.
1532 A. Borja et al. / Marine Pollution Bulletin 56 (2008) 1519–1537
when integrating values of biological or physico-chemical ele-ments, as shown in Table 8.
7. Discussion
The marine environment in general, especially estuaries, nowfaces considerable human impacts from multiple causes (Halpernet al., 2008). These result in physical and chemical transformations,as well as changes in biodiversity, and they occur in a scenario ofclimate change (Halpern et al., 2007). As illustrated in our review,more or less comprehensive legislation exists at present in NorthAmerica, Africa, Asia, Australia, and Europe, the intent of which isto assess the ecological quality or integrity within estuarine andcoastal systems for use in several management purposes. Theobjective of this is to promote sustainable use of the seas and con-serve marine ecosystems by maintaining marine and estuarinewaters in a good environmental or ecological status. This conceptof sustainability, applied to ocean governance, has been used morefrequently in recent years (Costanza et al., 1998; Christie, 2005).
As a whole, these legislative measures tend to converge indefining environmental water quality in an integrative way byusing several biological parameters together with physicochemicaland pollution features thereby allowing the ecological status to beassessed at the ecosystem level (Borja, 2005, 2006; Apitz et al.,2006). Although this essential concept is generally widely ac-cepted, the degree of convergence regarding the legislation is var-iable. For instance, in many countries, most of the data supportingthe legislation have been provided by studies carried out in singlesystems, which do not allow generalisation. In our contribution,the Mhlanga estuary (South Africa) has been proposed as an exam-ple of the several inputs, beginning with the hydrologists’ assess-ment of the behaviour of the river mouth, under different flowconditions, followed by the biologists’ assessment of the biologicalresponses, the process involved in the determination of the ‘‘re-serve” (the freshwater needs) for this particular system, as wellas for the management response. Other South African studies canbe also consulted (Harrison et al., 2000; Harrison and Whitfield,2006). Conversely, in China, the concept of integrated assessment
does not seem to be widely applied and the application of supernu-merary tools to assess ecological integrity appears to be incipient(Ma et al., 2006; Cao and Wong, 2007). In addition, in all cases, con-straints in applying ecosystem principles arise from territoriallybased legislation.
Different methods have been designed for evaluating ecologicalintegrity or condition status of coastal waters, focusing on differentissues (sediment and benthic organism based toxicity tests, e.g.Hyland et al., 2000; Kiddon et al., 2003; Barnett et al., 2007; Cook-sey and Hyland, 2007). Some of the authors address the causes forobserved impacts with the intention to inform management (Kellerand Cavallaro, 2008). To improve assessment accuracy and man-agement effectiveness, most of the methods propose schemes ofclassification of the ecological quality status in several categories,based on matrices combining different symptoms or quality ele-ments. Likewise, the need for ‘‘early warning” indicators ofimpending problems or human pressures has been amply recogni-sed (Borja and Dauer, 2008).
In general, we may say that there is an increasing interest indeveloping assessment tools for different physicochemical or bio-logical ecosystems’ elements (e.g. for benthic communities seethe review of Díaz et al., 2004), although very few methodologiesintegrate all these elements into a unique evaluation of a waterbody (Borja et al., 2004a). In practical terms, managers and deci-sion-makers need simple but scientifically well grounded method-ologies, capable of demonstrating to the general public theevolution of a zone (estuary, coastal area, etc.), taking into accounthuman pressures or recovery processes (Borja and Dauer, 2008)and capable of guiding the implementation of successful manage-ment. In this context, there is a major scientific challenge to devel-op tools to define adequately the scale and current condition ofmarine ecosystems and bioregions in terms of biological perfor-mance, as well as to monitor changes through time and identifyand address through management the causes of observed impair-ments (Borja, 2005, 2006).
Among such tools, ecological indicators have been widely usedto supply synoptic information about the state of ecosystems. Mostoften they address ecosystem structure and/or functioning,

Tabl
e8
Dec
isio
ntr
eein
asse
ssin
gth
ein
tegr
ativ
eec
olog
ical
stat
us,w
ithi
nth
eW
ater
Fram
ewor
kD
irec
tive
(mod
ified
from
Borj
aet
al.,
2004
a)
BQ
EsD
oal
lB
QEs
mee
th
igh
stat
us?
Not
Doe
sea
chB
QE
mee
tH
igh
orG
ood
qual
ity?
Doe
sB
enth
osm
eet
Hig
hqu
alit
yan
dfr
omth
ere
mai
nde
r1
or2
mee
tM
oder
ate
qual
ity?
(1)
Do
Ben
thos
and
anot
her
BQ
Em
eet
Goo
dqu
alit
yan
dth
ere
mai
nde
rM
oder
ate?
(2)
Coa
st:
Doe
sB
enth
osm
eet
Goo
dqu
alit
yan
dot
her
Mod
erat
e?(3
)
Not
Doe
son
eB
QE
mee
tM
oder
ate
qual
ity
(exc
ept
1,2,
3)D
oes
Ben
thos
mee
tH
igh
orG
ood
qual
ity
and
no
one
has
Bad
qual
ity?
Not
Oth
erco
mbi
nat
ion
sD
oes
Ben
thos
mee
tPo
orqu
alit
y?
Not
Do
all
BQ
Esm
eet
Bad
qual
ity?
Doe
sB
enth
osm
eet
Bad
qual
ity?
Yes
Yes
Yes
Yes
Yes
BQ
stat
us
Hig
hG
ood
Mod
erat
ePo
orB
adTh
enTh
en
Ph-C
hco
ndi
tion
sD
oPh
-Ch
con
diti
ons
mee
tH
igh
stat
us?
Are
chem
ical
con
cen
trat
ion
s<b
ackg
rou
nd?
Not
Do
Ph-C
hco
ndi
tion
sm
eet
Goo
dst
atu
s?A
rech
emic
alqu
alit
yob
ject
ives
mee
t?N
otTh
enTh
enTh
en
Yes
Yes
Hco
ndi
tion
sD
oH
con
diti
ons
mee
tH
igh
stat
us?
Not
Then
Yes
Ecol
ogic
alst
atu
sH
igh
Goo
dM
oder
ate
Poor
Bad
BQ
E,bi
olog
ical
qual
ity
elem
ent;
BQ
,bio
logi
cal
qual
ity;
Ph-C
h,p
hys
ico-
chem
ical
;H
,Hyd
rom
orph
olog
ical
.
Table 9Example in integrating ecological status of several sampling stations (St) into a singlevalue, for the whole water body (from Borja et al., in press)
Ecological status St.1 St.2 St.3 St.4 Total
Poor Moderate Good Good
Equivalence (E1) 4 6 8 8EQR (E2) 0.35 0.55 0.72 0.75Surface (km2) 0.3 0.5 0.7 1.0 2.5Rate (per one) (R) 0.12 0.20 0.28 0.40 1.0TOTAL (E1 x R) 0.48 1.20 2.24 3.20 7.12TOTAL (E2 x R) 0.04 0.11 0.20 0.30 0.65GLOBAL STATUS Good
E1: When there are not Ecological Quality Ratio (EQR) values (for terminology, seeBorja et al. (2004a)), but only a global quality value; E2: when there are EQR values.Note: when using E1: High: E1 (10), E1 � R (8.4–10); Good: E1 (8), E1 � R (6.8–8.39); Moderate: E1 (6), E1 � R (5.2–6.79); Poor: E1 (4), E1 � R (3.6–5.19); Bad: E1(2), E1 x R (2–3.59).
A. Borja et al. / Marine Pollution Bulletin 56 (2008) 1519–1537 1533
accounting for a certain aspect or component, for instance nutrientconcentrations, water flows, macroinvertebrate and/or vertebratediversity, plant diversity, plant productivity, erosion symptomsand, sometimes, ecological integrity at a system level (Weisberget al., 1997; van Dolah et al., 1999; Llansó et al., 2001). In general,the main attribute of a good ecological indicator is the capacity tocombine numerous environmental factors in a single value, whichwould then be useful in terms of management and for making eco-logical concepts compliant with the general public understanding(Borja and Dauer, 2008). Nevertheless, the application of ecologicalindicators is not exempt from criticisms, the first of which is thatthe aggregation of indices results in oversimplification of the eco-system under observation and is not efficient in capturing qualita-tive modifications resulting from the emergence of newcharacteristics arising from self organisation processes (e.g. in aglobal climate change scenario). Moreover, problems arise oftenfrom the fact that indicators account not only for numerous spe-cific system characteristics, but also other kinds of factors, e.g.physical, biological, ecological and socio-economic.. Indicatorsmust therefore be utilised following the right criteria and in situa-tions that are consistent with their intended use and scope; other-wise they may cause confusing data interpretations.
In view of management needs, what might be the characteris-tics of a good ecological indicator? What kind of information,regarding ecosystem responses, can be obtained from the differenttypes of biological and physicochemical data usually taken intoaccount in evaluating the state of coastal areas and transitionalwaters? The analysis of the current situation in differentcontinents shows that these are indeed pertinent questions.Certainly, coastal shallow water ecosystems are extraordinaryvaluable in terms of goods and services (Costanza et al., 1997;Beaumont et al., 2007), correspondingly subject to strong humanimpact, and at the same time extremely vulnerable to climatechange. Consequently, appropriate, accurate, and efficient informa-tion on ecosystem status and trend constitutes a prerequisite forsustainable use of marine ecosystems and resources, includingnot only environmental protection but also economic growth andsocial welfare (see for instance the Lisbon Agenda, Szyszczak,2006).
Measures and indicators presently proposed focus on the livingpart of aquatic systems and their ‘‘supporting” hydro-morphologi-cal, chemical and physicochemical elements in order to evaluateaquatic ecosystem health and fitness. These can provide reasonabledescription of the current status of an ecosystem in terms of actualcriteria, for instance as outlined in the European WFD (see the spe-cial issue in Marine Pollution Bulletin (2007: 55(1/6)). In this senseand for the time being, they fulfil what appear to be the needs ofmanagers and decision-makers.

1534 A. Borja et al. / Marine Pollution Bulletin 56 (2008) 1519–1537
Despite the above, and with specific regard to coastal and tran-sitional waters, biological elements are limited, within the WFD, tocomposition, abundance (and biomass) of phytoplankton, otheraquatic flora, benthic invertebrate fauna, and fishes. The measuresused to quantify these biological elements describe distributions/gradients, ratios, biodiversity indices and classification schemes(Indicators and Methods for the Ecological Status Assessment un-der the Water Framework Directive, EUR 22314EN). Modelling ap-proaches, for instance, are still rare and limited to sub-systems.
Measures used today may provide ‘‘snapshots” of given ecosys-tem structural properties, but provide little or no information at allabout ecosystem functioning. In fact, the causal links between themeasured quantities/qualities and underlying ecosystem function-ing remain largely uncertain or even unknown. Will this be suffi-cient in the near future? For instance, will it be good enough toachieve some of the objectives within different marine policiesworldwide, which indicate strong demand for more highly inte-grated and holistic approaches towards sustainable development?What about the magnitude and speed of anticipated changes re-lated to global change combined with the increasing intensityand multitude of marine environment uses by man?
In order to fulfil future needs, environmental science must com-plement the ‘‘static” look at structural ecosystem propertiesthrough an approach towards the ecosystem function and dynam-ics, which can provide a sound and reliable basis for successfulmanagement strategies. Common reductionistic approaches canonly partially cope with ecosystem complexity that arises fromtheir large number of components, interactions and spatio-tempo-ral dynamics. Inevitably, we must recognize that the whole be-haves differently from the sum of its parts, and thus neitherexamination of a small subsystem nor reduction to simple relation-ships is an adequate and sufficient approach to understand ecosys-tem functioning. What happens is that specific qualities/features/properties emerge at the ecosystem level, and these must be re-lated to ecosystem functioning.
Trophic interactions (who eats whom) between and amongorganisms, although governed and modulated by external bound-ary conditions, constitute perhaps the most prominent and signif-icant type of ecological relationships. A way to access theecosystem level is to look upon it as a network of such trophic spe-cies-to-species interactions. Through holistic approaches, for in-stance Ecosystem Network Analysis (ENA), properties of bothecosystem network structure and network flow (of matter and en-ergy) can be explored with respect to aspects of ecosystem func-tion, such as overall system stability and resilience. Comparisonof many ecosystems using a standardized approach might enablederivation of principles underlying the relationships between eco-system network, ecosystem functioning, and ecosystem goods andservices, and management of human behaviours that impact uponthem.
8. Conclusions
The present worldwide trend is the implementation of legisla-tively driven measures to assess the ecological integrity of marinesystems (estuarine, coastal and offshore). The final aim of all ofthem is to protect and enhance marine waters, ecosystems andnatural resources, promoting a sustainable use of the oceans.Although there are multiple regional and national methodologies,very few can be considered currently as integrative. Our challenge,as scientists, is to develop methodologies and indicators that cansummarize and simplify complex data, yet are easily understoodby the public, media, resource users, and decision-makers. How-ever, these must be supported by the best scientific knowledge,and take into account that ‘ecological integrity’ refers to the condi-
tion of an ecosystem–particularly the structure, composition, andnatural processes, including function and dynamics, of its bioticcommunities and physical environment.
Acknowledgements
We want to acknowledge the organizers of the ‘EcoSummit2007–Ecological Complexity and Sustainability’ Conference, heldin Beijing (China), in May 2007, for the acceptance of the sessionon ‘Integrative tools and methods in assessing ecological integrityin estuarine and coastal systems’. We thank also to J. Latimer,USEPA, for use of Fig. 1, and two anonymous referees for their com-ments. This paper is contribution number 409 from AZTI-Tecnalia(Marine Research Division).
References
Apitz, S.E., Elliott, M., Fountain, M., Galloway, T.S., 2006. European EnvironmentalManagement: Moving to an ecosystem approach. Integrated EnvironmentalAssessment and Management 2, 80–85.
Arthuron, R., Korateng, K., 2006. Coastal and Marine Environments, Chapter 5, pp.155–195. Section 2: Environmental State and Trends: 20-Year Retrospective. In:Africa Environment Outlook 2–Our Environment, Our Wealth (AEO-2). UnitedNations Environment Programme (UNEP), 540 pp. <www.unep.org/DEWA/Africa/AEO2_Launch>.
Aubry, A., Elliott, M., 2006. The use of environmental integrative indicators to assessseabed disturbance in estuaries and coasts: Application to the humber estuary,UK. Marine Pollution Bulletin 53, 175–185.
Bald, J., Borja, A., Muxika, I., Franco, J., Valencia, V., 2005. Assessing referenceconditions and physico-chemical status according to the European WaterFramework Directive: A case-study from the Basque Country (Northern Spain).Marine Pollution Bulletin 50, 1508–1522.
Barnett, A.M., Bay, S.M., Ritter, K.J., Moore, S.L., Weisberg, S.B., 2007. SedimentQuality in California Bays and Estuaries. Southern California Coastal WaterResearch Project, 41 pp.
Beaumont, N.J., Austen, M.C., Atkins, J.P., Burdon, D., Degraer, S., Dentinho, T.P.,Derous, S., Holm, P., Horton, T., van Ierland, E., 2007. Identification, definitionand quantification of goods and services provided by marine biodiversity:implications for the ecosystem approach. Marine Pollution Bulletin 54, 253–265.
Begg, G.W., 1978. The Estuaries of Natal. Natal Town and Regional Planning Report.41, 1–657.
Begg, G.W., 1984. The Estuaries of Natal. Part 2 Supplement to NTRP Report 41.Natal Town and Regional Planning Report, 55, 1–631.
Borja, A., 2005. The European Water Framework Directive: a challenge fornearshore, coastal and continental shelf research. Continental Shelf Research25 (14), 1768–1783.
Borja, A., 2006. The new European Marine Strategy Directive: Difficulties,opportunities, and challenges. Marine Pollution Bulletin 52, 239–242.
Borja, A., Dauer, D.M., 2008. Assessing the environmental quality status in estuarineand coastal systems: comparing methodologies and indices. EcologicalIndicators 8 (4), 331–337.
Borja, A., Heinrich, H., 2005. Implementing the European Water FrameworkDirective; the debate continues. Marine Pollution Bulletin 50 (4), 486–488.
Borja, A., Franco, J., Pérez, V., 2000. A marine biotic index to establish the ecologicalquality of soft-bottom benthos within European estuarine and coastalenvironments. Marine Pollution Bulletin 40, 1100–1114.
Borja, A., Franco, J., Valencia, V., Bald, J., Muxika, I., Belzunce, M.J., Solaun, O., 2004a.Implementation of the European Water Framework Directive from the BasqueCountry (northern Spain): a methodological approach. Marine Pollution Bulletin48, 209–218.
Borja, A., Valencia, V., Franco, J., Muxika, I., Bald, J., Belzunce, M.J., Solaun, O., 2004b.The water framework directive: water alone, or in association with sedimentand biota, in determining quality standards? Marine Pollution Bulletin 49, 8–11.
Borja, A., Bald, J., Belzunce, M.J., Franco, J., Garmendia, J.M., Muxika, I., Revilla, M.,Rodríguez, G., Tueros, I., Uriarte, A., Valencia, V., Adarraga, I., Aguirrezabalaga, F.,Cruz, I., Laza, A., Marquiegui, M.A., Martínez, J., Orive, E., Ruiz, J.Mª, Sola, J.C.,Trigueros, J.Mª, Manzanos, A., 2006. Red de seguimiento del estado ecológico delas aguas de transición y costeras de la Comunidad Autónoma del País Vasco.AZTI-Tecnalia report to Dirección de Aguas, Departamento de Medio Ambientey Ordenación del Territorio, Gobierno Vasco. 15 Vol, 838 pp. <www.uragentzia.euskadi.net/u81-0003/es/contenidos/informe_estudio/red_osta/es_red_agua/2006.html>.
Borja, A., Josefson, A.B., Miles, A., Muxika, I., Olsgard, F., Phillips, G., Rodríguez, J.G.,Rygg, B., 2007. An approach to the intercalibration of benthic ecological statusassessment in the North Atlantic ecoregion, according to the European WaterFramework Directive. Marine Pollution Bulletin 55, 42–52.
Borja, A., Dauer, D., Díaz, R., Llansó, R.J., Muxika, I., Rodríguez, J.G., Schaffner, L.,2008a. Assessing estuarine benthic quality conditions in Chesapeake Bay: acomparison of three indices. Ecological Indicators 8 (4), 395–403.

A. Borja et al. / Marine Pollution Bulletin 56 (2008) 1519–1537 1535
Borja, A., Tueros, I., Belzunce, M.J., Galparsoro, I., Garmendia, J.M., Revilla, M., Solaun,O., Valencia, V., 2008b. Investigative monitoring within the European WaterFramework Directive: a coastal blast furnace slag disposal, as an example.Journal of Environmental Monitoring 10, 453–462.
Borja, A., Bald, J., Franco, J., Larreta, J., Muxika, I., Revilla, M., Rodríguez, J.G., Solaun,O., Uriarte, A., Valencia, V., in press. Using multiple ecosystem components inassessing ecological status in Spanish (Basque Country) Atlantic marine waters.Marine Pollution Bulletin.
Bricker, S.B., Clement, C.G., Pirhalla, D.E., Orlando, S.P., Farrow, D.R.G., 1999.National Estuarine Eutrophication Assessment. Effects of Nutrient Enrichmentin the Nation’s Estuaries. NOAA, National Ocean Service, Special Projects Officeand National Centers for Coastal Ocean Science, Silver Spring. <http://spo.nos.noaa.gov/projects/cads/nees/Eutro_Report.pdf>.
Bricker, S.B., Ferreira, J.G., Simas, T., 2003. An integrated methodology forassessment of estuarine trophic status. Ecological Modelling 169, 39–60.
Bricker, S., Lipton, D., Mason, A., Dionne, M., Keeley, D., Krahforst, C., Latimer, J.,Pennock, J., 2006. Improving Methods and Indicators for Evaluating CoastalWater Eutrophication: A Pilot Study in the Gulf of Maine. NOAA TechnicalMemorandum NOS NCCOS 20. National Ocean Service, National Centers forCoastal Ocean Science. Center for Coastal Monitoring and Assessment, SilverSpring, MD.
Bricker, S., Longstaff, B., Dennison, W., Jones, A., Boicourt, K., Wicks, C., Woerner, J.,2007. Effects of Nutrient Enrichment in the Nation’s Estuaries: A Decade ofChange, National Estuarine Eutrophication Assessment Update. NOAA CoastalOcean Program Decision Analysis Series No. 26. National Centers for CoastalOcean Science, Silver Spring, MD. 322 pp.
Browman, H.I., Stergiou, K.I., Cury, P.M., Hilborn, R., Jennings, S., Lotze, H.K., Mace,P.M., Murawski, S., Pauly, D., Sissenwine, M., Zeller, D., 2004. Perspectives onecosystem-based approaches to the management of marine resources. MarineEcology Progress Series 274, 269–303.
Burgess, R., Chancy, C., Campbell, S., Detenbeck, N., Engle, V., Hill, B., Ho, K., Lewis,M., Kurtz, J., Norberg-King, T., Pelletier, P., Perez, K., Smith, L., Snarski, V., 2004.Classification Framework for Coastal Systems. United States EnvironmentalProtection Agency, Office of Research and Development, Research Triangle Park,North Carolina. EPA 600/R-04/061, 66 pp.
Canessa, R., Butler, M., LeBlanc, C., Stewart, C., Howes, D., 2007. Spatial informationinfrastructure for Integrated Coastal and Ocean Management in Canada. CoastalManagement 35, 105–142.
Cao, W., Wong, M.H., 2007. Current status of coastal zone issues and management inChina: a review. Environment International 33 (7), 985–992.
Castro, M., Driscoll, C.T., Jordan, T.E., Reay, W.G., Boynton, W.R., Seitzinger, S.P.,Styles, R.V., Cable, J.E., 2001. Contribution of atmospheric deposition to the totalnitrogen loads to thirty four estuaries on the Atlantic and Gulf Coasts of theUnited States. In: Valigura, R.A., Alexander, R.B., Castro, M.S., Meyers, T.P., Paerl,H.W., Stacey, P.E., Turner, R.E. (Eds.), Nitrogen Loading in Coastal Water Bodies:An Atmospheric Perspective, Coastal and Estuarine Studies. AmericanGeophysical Union, Washington, DC, pp. 77–106.
CBD, 2000. Ecosystem Approach. Fifth Conference of the Parties to the Conventionon Biodiversity. Nairobi, Kenya, May 2000. <www.iisd.ca/biodiv/cop5/>.
Christie, P., 2005. Is integrated coastal management sustainable? Ocean and CoastalManagement 48, 208–232.
Cloern, J.E., 2001. Our evolving conceptual model of the coastal eutrophicationproblem. Marine Ecology Progress Series 210, 223–253.
COAST, 2003. European Union Common Implementation Strategy Working Group2.4. Final Draft Guidance on Coastal and Transitional Waters.
COM, 2005a. Proposal for a Directive of the European Parliament and of theCouncil, Establishing a Framework for Community Action in the field ofMarine Environmental Policy. COM (2005), 505 final, SEC (2005), 1290, 31pp. <http://europa.eu.int/eur-lex/lex/LexUriServ/site/en/com/2005/com2005_0505en01.pdf>.
COM, 2005b. Communication from the Commission to the Council and theEuropean Parliament. Thematic Strategy on the Protection and Conservationof the Marine Environment. COM (2005), 504 final, SEC (2005), 1290, 9pp. <http://europa.eu.int/eur-lex/lex/LexUriServ/site/en/com/2005/com2005_0504en01.pdf>.
COM, 2005c. Commission Staff Working Document. Annex to the Communicationfrom the Commission to the Council and the European Parliament. ThematicStrategy on the Protection and Conservation of the Marine Environment, andProposal for a Directive of the European Parliament and of the Council,establishing a Framework for Community Action in the field of MarineEnvironmental Policy. COM (2005), 504 and 505 final, SEC (2005), 1290, 79 pp.
Commonwealth of Australia, 1999. Australia’s Oceans Policy, 2 vols, 104 pp. <http://www.oceans.gov.au/the_oceans_policy_overview.jsp>.
Commonwealth of Australia, 2006. A Guide to the Integrated Marine and CoastalRegionalisation of Australia Version 4.0. Department of the Environment andHeritage, Canberra, Australia. <www.environment.gov.au/coasts/mbp/publications/imcra-4.html>.
Cooksey, C., Hyland, J., 2007. Sediment quality of the Lower St. Johns River,Florida: an integrative assessment of benthic fauna, sediment-associatedstressors, and general habitat characteristics. Marine Pollution Bulletin 54,9–21.
Cooper, J.A.G., Ramm, A.E.L., Harrison, T.D., 1994. The estuarine health index: a newapproach to scientific information transfer. Ocean and Coastal Management 25,103–141.
Costanza, R., D’Arge, R., de Groot, R., Farber, S., Grasso, M., Hannon, B., Limburg, K.,Naeem, S., O’Neill, R.V., Paruelo, J., Raskin, R.G., Sutton, P., van den Belt, M., 1997.
The value of the world’s ecosystem services and natural capital. Nature 387,253–260.
Costanza, R., Andrade, F., Antunes, P., van den Belt, M., Boersma, D., Boesch, D.F.,Catarino, F., Hanna, S., Limburg, K., Low, B., Molitor, M., Pereira, J.G., Rayner, S.,Santos, R., Wilson, J., Young, M., 1998. Principles for sustainable governance ofthe oceans. Science 281, 198–199.
Council for the Environment, 1989. A Policy for Coastal Zone Management in theRepublic of South Africa. Part 1. Principles and Objectives. Pretoria: Joan LotterPublications. <www.deat.gov.za>.
Council for the Environment, 1991. A Policy for Coastal Zone Management in theRepublic of South Africa. Part 2. Guidelines for Coastal Land Use. AcademiaPublications, Pretoria. <www.deat.gov.za>.
Crane, M., 2003. Proposed development of Sediment Quality Guidelines under theEuropean Water Framework Directive: a critique. Toxicology Letters 142, 195–206.
Crossett, K.M., Culliton, T.J., Wiley, P.C., Goodspeed, T.R., 2004. Population Trendsalong the coastal United States: 1980–2008. National Oceanic and AtmosphericAdministration, National Ocean Service, Management and Budget Office, SpecialProjects.
CZMA, 1996. Coastal Zone Management Act as amended through P.L. 104-150, TheCoastal Zone Protection Act of 1996. <www.eutro.org/documents/czma.pdf>.
Day, J., Fernandes, L., Lewis, A., De’ath, G., Slegers, S., Barnett, B., Kerrigan, B., Breen,D., Innes, J., Oliver, J., Ward, T., Lowe, D., 2002. The Representative AreasProgram for protecting biodiversity in the Great Barrier Reef World HeritageArea. In: Kasim Moosa, M. et al. (Eds.), Proceedings of the Ninth InternationalCoral Reef Symposium, Bali, Indonesia, 23–27 October 2000 [Indonesia]:Ministry of Environment, Indonesian Institute of Sciences, InternationalSociety for Reef Studies, pp. 687–696.
Department of Environmental Affairs and Tourism, 1998. Coastal Policy GreenPaper: Towards Sustainable Coastal Development in South Africa. WynlandPrinters. <www.deat.gov.za>.
Department of Environmental Affairs and Tourism, 2000. White Paper forSustainable Coastal Development in South Africa. Printed for the GovernmentPrinter by Formeset Printers, Cape. <www.deat.gov.za>.
Department of Water Affairs and Forestry, 2004. Methodology for theDetermination of the Preliminary Ecological Reserve for Estuaries. Version 2.Pretoria. <www.dwaf.gov.za/documents/publications>.
Díaz, R.J., Solan, M., Valente, R.M., 2004. A review of approaches for classifyingbenthic habitats and evaluating habitat quality. Journal of EnvironmentalManagement 73, 165–181.
Editorial Board of ‘‘Bays in China”, 1993. Bays in China. Ocean Press, Beijing.Engle, V.D., Summers, J.K., Gaston, G.R., 1994. A benthic index of environmental
condition of Gulf of Mexico estuaries. Estuaries 17, 372–384.Engle, V.D., Summers, J.K., 1999. Refinement, validation, and application of a benthic
condition index for northern Gulf of Mexico estuaries. Estuaries 22 (3A), 624–635.
Ferreira, J.G., Hawkins, A.J.S., Bricker, S.B., 2007a. Management of productivity,environmental effects and profitability of shellfish aquaculture–the FarmAquaculture Resource Management (FARM) model. Aquaculture 264, 160–174.
Ferreira, J.G., Bricker, S.B., Simas, T.C., 2007b. Application and sensitivity testing of aeutrophication assessment method on coastal systems in the United States andEuropean Union. Journal of Environmental Management 82, 433–445.
Fletcher, S., 2007. Converting science to policy through stakeholder involvement: ananalysis of the European Marine Strategy Directive. Marine Pollution Bulletin54, 1881–1886.
Foster, E., Haward, M., Coffen-Smout, S., 2005. Implementing integrated oceansmanagement: Australia’s south east regional marine plan (SERMP) and Canada’seastern Scotian shelf integrated management (ESSIM) initiative. Marine Policy29, 391–405.
Frid, C.L.J., Paramor, O.A.L., Scott, C.L., 2006. Ecosystem-based management offisheries: Is science limiting? ICES Journal of Marine Science 63, 1567–1572.
Glavovic, B., 2000a. Our Coast, Our Future. A New Approach to Coastal Managementin South Africa. Mega Digital. <www.deat.gov.za>.
Glavovic, B., 2000b. Building Partnerships for Sustainable Coastal Development. TheSouth African Coastal Policy Formulation Experience. The Process, Pereceptionsand Lessons Learned. Mega Digital. <www.deat.gov.za>.
Glazewski, J., 1997. Towards a Coastal Zone Management Act for South Africa. TheSouth African Journal of Environmental Law and Policy 4 (1), 1–22.
Granek, E.F., Brumbaugh, D.R., Heppell, S.A., Heppell, S.S., Secord, D., 2005. Ablueprint for the oceans: Implications of two national commission reports forconservation practitioners. Conservation Biology 19, 1008–1018.
Halpern, B.S., Selkoe, K.A., Micheli, F., Kappel, C.V., 2007. Evaluating and ranking thevulnerability of global marine ecosystems to anthropogenic threats.Conservation Biology 21, 1301–1315.
Halpern, B.S., Walbridge, S., Selkoe, K.A., Kappel, C.V., Micheli, F., D’Agrosa, C., Bruno,J.F., Casey, K.S., Ebert, C., Fox, H.E., Fujita, R., Heinemann, D., Lenihan, H.S.,Madin, E.M.P., Perry, M.T., Selig, E.R., Spalding, M., Steneck, R., Watson, R., 2008.A global map of human impact on marine ecosystems. Science 319, 948–952.
Han, X.T., Zou, J.Z., Zhang, Y.S., 2004. Harmful algae bloom species in Jiaozhou Bayand the features of distribution. Marine Sciences (in Chinese) 28, 49–54.
Harrison, T.D., Cooper, J.A.G., Ramm, A.E.L., 2000. State of South African Estuaries.Geomorphology, Ichthyofauna, Water Quality and Aesthetics. State of theEnvironment Series Report. No: 2, 127 pp. Department of Environmental Affairsand Tourism, Pretoria, South Africa.
Harrison, T.D., Whitfield, A.K., 2004. A multi-metric fish index to assess theenvironmental condition of estuaries. Journal of Fish Biology 65, 683–710.

1536 A. Borja et al. / Marine Pollution Bulletin 56 (2008) 1519–1537
Harrison, T.D., Whitfield, A.K., 2006. Application of a Multimetric Fish Index toassess the environmental condition of South African Estuaries. Estuaries andCoasts 29, 1108–1120.
Herriges, J.A., Kling, C.L. (Eds.), 1999. Valuing recreation and the environment:revealed preference methods in theory and practice. Edward Elgar, Aldershot,UK.
Howarth, R.W., Marino, R., Scavia, D., 2003. Priority topics for Nutrient Pollution inCoastal Waters: An Integrated National Research Program for the United States.National Ocean Service. NOAA, Silver Spring, MD.
Huang, B., Ouyang, Z., Zheng, H., Wang, X., Miao, H., 2006. Ying Yong Sheng Tai XueBao (in Chinese) 17 (11), 2196–2202.
Huo, W.Y., Yu, Z.M., Zou, J.Z., Song, X.X., Hao, J.H., 2001. Outbreak of Skeletonemacostatum red tide and its relations to environmental factors in Jiaozhou Bay.Oceanologia et Limnologia Sinica 32, 311–318.
Hyland, J.L., Balthis, W.L., Hackney, C.T., Posey, M., 2000. Sediment quality of NorthCarolina estuaries: an integrative assessment of sediment contamination,toxicity, and condition of benthic fauna. Journal of Aquatic Ecosystem Stressand Recovery 8, 107–124.
IMCRA, 1998. Integrated Marine and Coastal Regionalisation for Australia: AnEcosystem-based Classification for Marine and coastal Environments. Version3.3. Environment Australia. <www.environment.gov.au/coasts/mbp/publications/pubs/imcra3-3.pdf>.
Jennings, S., 2005. Indicators to support an ecosystem approach to fisheries. Fishand Fisheries 6, 212–232.
Jia, X., Du, F., Lin, Q., Li, C., Cai, W., 2003. A study on comprehensive assessmentmethod of ecological environment quality of marine fishing ground. Journal ofFishery Sciences of China (in Chinese) 10 (2), 160–164.
Jia, X., Li, C., Gan, J., Lin, Q., Cai, W., Wang, Z., 2005. Diagnosis and assessment onthe health status and quality of the fishery ecoenvironment of the northernSouth China Sea. Journal of Fishery Sciences of China (in Chinese) 12 (6), 757–765.
Keller, A.A., Cavallaro, L., 2008. Assessing the US Clean Water Act 303(d) listingprocess for determining impairment of a waterbody. Journal of EnvironmentalManagement 86, 699–711.
Kenchington, R.A., 1990. Planning the Great Barrier Reef Marine Park. In:Proceedings of Symposium on Marine Heritage and Recreation. University ofWaterloo, Canada, pp. 36–54.
Keyuan, Z., 2001. China’s exclusive economic zone and continental shelf:developments, problems, and prospects. Marine Policy 25 (1), 71–81.
Keyuan, Z., 2003. Sino-Japanese joint fishery management in the East China Sea.Marine Policy 27 (2), 125–142.
Kiddon, J.A., Paul, J.F., Buffum, H.W., Strobel, C.S., Hale, S.S., Cobb, D., Brown, B.S.,2003. Ecological condition of US mid-Atlantic estuaries, 1997–1998. MarinePollution Bulletin 46, 1224–1244.
Kurtz, J.C., Detenbeck, N.D., Engle, V.D., Ho, K., Smith, L.M., Jordan, S.J., Campbell, D.,2006. Classifying coastal waters: current necessity and historical perspective.Estuaries and Coasts 29, 107–123.
Last, P., Lyne, V., Yearsley, G., Gomon, M., Ress, T., White, W., 2005. Validation ofNational Demersal Fish Datasets for Regionalisation of the AustralianContinental Slope and Outer Shelf. CSIRO Report to the National OceansOffice, CSIRO Marine Research Hobart.
Lau, M., 2005. Integrated coastal zone management in the People’s Republic ofChina–An assessment of structural impacts on decision-making processes.Ocean and Coastal Management 48, 115–159.
Lawrence, D.R., Kenchington, R.A., Woodley, S.J., 2002. The Great Barrier Reef:Finding the Right Balance. Melbourne University Press, Melbourne. 263 pp.
Leung, W.S., 2006. Ecological water quality indices in environmental management.M.Sc. Dissertation, The University of Hong Kong.
Lin, R., 1996. Review of assessing methods for coastal eutrophication. MarineEnvironmental Science 15, 28–31.
Lindahl, O., Hart, R., Hernroth, B., Kollberg, S., Loo, L., Olrog, L., Rehnstam-Holm, A.,Svensson, J., Svensson, S., Syversen, U., 2005. Improving marine water quality byMussel Farming: a profitable solution for Swedish Society. Ambio 34 (2), 131–138.
Lindhjem, H., Hu, T., Ma, Z., Skjelvik, J.M., Song, G., Vennemo, H., Wu, J., Zhang, S.,2007. Environmental economic impact assessment in China: problems andprospects. Environmental Impact Assessment Review 27 (1), 1–25.
Lipton, D.W., Hicks, R., 1999. Linking water quality improvements to recreationalfishing values: The case of Chesapeake Bay striped bass. In: Evaluating theBenefits of Recreational Fisheries. Fisheries Centre Research Reports 7(2).University of British Columbia.
Lipton, D.W., Hicks, R., 2003. The cost of stress: low dissolved oxygen andrecreational striped bass (Morone saxatilis) fishing in the Patuxent River.Estuaries 26, 310–315.
Liu, Z., Wei, H., Liu, G., Zhang, J., 2004. Simulation of water exchange in Jiaozhou Bayby average residence time approach. Estuarine, Coastal and Shelf Science 61,25–35.
Llansó, R., Dauer, D.M., Volstad, J.H., Scott, L.C., 2001. Application of the benthicindex of biotic integrity to environmental monitoring in Chesapeake Bay.Environmental Monitoring and Assessment 81, 163–174.
Ma, S., Zhao, J., Chen, B., Chen, J., Cui, Y., Qu, K., Qu, S., 2006. Analysis and syntheticevaluation on environment quality of Laizhou Bay. Marine Fisheries Research(in Chinese) 27 (5), 13–16.
McConnell, K.E., Strand, I.E., 1994. The economic value of Mid and South AtlanticSportfishing. Vol. 2, Report on Cooperative Agreement #CR-811043-01-0between the University of Maryland College Park, the Environmental
Protection Agency, the National Marine Fisheries Service and the NationalOceanic and Atmospheric Administration, 134pp.
Morishita, J., 2008. What is the ecosystem approach for fisheries management.Marine Policy 32, 19–26.
Muldoon, J. (Ed.), 1995. Towards a Marine Regionalisation for Australia. Proceedingsof a workshop held in Sydney, New South Wales, 4–6 March 1994. OceanRescue 2000 Workshop series, Publication No. 1, Great Barrier Reef Marine ParkAuthority.
Muxika, I., Borja, A., Bald, J., 2007. Using historical data, expert judgement andmultivariate analysis in assessing reference conditions and benthic ecologicalstatus, according to the European Water Framework Directive. Marine PollutionBulletin 55, 16–29.
Nicholson, M.D., Jennings, S., 2004. Testing candidate indicators to supportecosystem-based management: the power of monitoring surveys to detecttemporal trends in fish community metrics. ICES Journal of Marine Science 61,35–42.
NOAA, 1996. NOAA’s Estuarine Eutrophication Survey. Vol. 1, South Atlantic Region.National Oceanic and Atmospheric Administration, National Ocean Service,Office of Ocean Resources Conservation and Assessment. Silver Spring.
NOAA, 1997a. NOAA’s Estuarine Eutrophication Survey. Vol. 2: Mid-Atlantic Region.National Oceanic and Atmospheric Administration, National Ocean Service,Office of Ocean Resources Conservation and Assessment. Silver Spring.
NOAA, 1997b. NOAA’s Estuarine Eutrophication Survey. Vol. 3, North AtlanticRegion. National Oceanic and Atmospheric Administration, National OceanService, Office of Ocean Resources Conservation and Assessment. Silver Spring.
NOAA, 1997c. NOAA’s Estuarine Eutrophication Survey. Vol. 4, Gulf of MexicoRegion. National Oceanic and Atmospheric Administration, National OceanService, Office of Ocean Resources Conservation and Assessment. Silver Spring.
NOAA, 1998. NOAA’s Estuarine Eutrophication Survey. Vol. 5, Pacific Coast Region.National Oceanic and Atmospheric Administration, National Ocean Service,Office of Ocean Resources Conservation and Assessment. Silver Spring.
O’Boyle, R., Jamieson, G., 2006. Observations on the implementation of ecosystem-based management: experiences on Canada’s east and west coasts. FisheriesResearch 79, 1–12.
OSPAR, 2002. Common Assessment Criteria, their Assessment Levels and AreaClassification within the Comprehensive Procedure of the Common Procedure.OSPAR Commission for the protection of the marine environment of the North-East Atlantic. <www.ospar.org/eng/html/welcome.html>.
Parsons, S., 2005. Ecosystem considerations in fisheries management: Theory andPractice. Conference on the Governance of High Seas Fisheries and the UN FishAgreement Moving from Words to Action. St. John’s, Newfoundland andLabrador, 1–5 May 5, 2005. 44 pp.
Peng, B., Hong, H., Xue, X., Jin, D., 2006. On the measurement of socioeconomicbenefits of integrated coastal management (ICM): application to Xiamen, China.Ocean and Coastal Management 49 (3), 93–109.
Perissinotto, R., Blair, A., Connell, A., Demetriades, N.T., Forbes, A.T., Harrison, T.D.,Iyer, K., Joubert, M., Kibirige, I., Mundree, S., Simpson, H., Stretch, D., Thomas, C.,Thwala, X., Zietsman, I., 2004. Responses of the biological communities to flowvariation and mouth state in two KwaZulu-Natal temporarily open/closedestuaries (vol. 2). In: Adams, J.B., (Ed.), Contributions to InformationRequirements for the Implementation of Resource Directed Measures forEstuaries. Report to the Water Research Commission by The Consortium forEstuarine Research and Management. WRC Report No, 1247/2/04<www.wrc.org.za>.
P.R.C. National Bureau of Statistics, 2001. Major Figures on 2000 Population Censusof China. China Statistics Press, Beijing.
Revilla, M., Franco, J., Bald, J., Borja, Á., Valencia, V., 2008. The assessment of thephytoplankton ecological status in the Basque coast (northern Spain) accordingto the European Water Framework Directive. Journal of Marine Systems.doi:10.1016/j.seares.2008.05.009.
Rice, J., Trujillo, V., Jennings, S., Hylland, K., Hagstrom, O., Astudillo, A., Jensen, J.N.,2005. Guidance on the Application of the Ecosystem Approach to Managementof Human Activities in the European Marine Environment. ICES CooperativeResearch Report 273, 1–28.
Rodríguez, J.G., Tueros, I., Borja, A., Belzunce, M.J., Franco, J., Solaun, O., Valencia, V.,Zuazo, A., 2006. Maximum likelihood mixture estimation to determine metalbackground values in estuarine and coastal sediments within the EuropeanWater Framework Directive. Science of the Total Environment 370, 278–293.
Rogers, S.I., Tasker, M.L., Earll, R., Gubbay, S., 2007. Ecosystem objectives to supportthe UK vision for the marine environment. Marine Pollution Bulletin 54, 128–144.
Rudd, M.A., 2004. An institutional framework for designing and monitoringecosystem-based fisheries management policy experiments. EcologicalEconomics 48, 109–124.
Sardá, R., Avila, C., Mora, J., 2005. A methodological approach to be used inintegrated coastal zone management processes: the case of the Catalan Coast(Catalonia, Spain). Estuarine. Coastal and Shelf Science 62, 427–439.
Scavia, D., Bricker, S.B., 2006. Coastal eutrophication assessment in the UnitedStates. Biogeochemistry 79 (1–2), 187–208.
Szyszczak, E., 2006. Experimental Governance. The Open Method of Coordination.European Law Journal 12, 486–502.
Shastri, Y., Diwekar, U., 2006. Sustainable ecosystem management using optimalcontrol theory: Part 1. Deterministic systems. Journal of Theoretical Biology241, 506–521.
Smith, R.A., Schwarz, G.E., Alexander, R.B., 1997. Regional interpretation of waterquality monitoring data. Water Resources Research 33, 2781–2798.

A. Borja et al. / Marine Pollution Bulletin 56 (2008) 1519–1537 1537
Souter, R. (Ed.), 2007. Building the bridges: seven years of Australia’s coastalcooperative research. The Cooperative Research Centre for Coastal Zone, Estuaryand Waterway Management (Coastal CRC).
Sowman, M.R., 1993. The status of coastal management in South Africa. Coastalmanagement 21, 163–184.
Suárez de Vivero, J.L., 2007. The European vision for oceans and seas–Social andpolitical dimensions of the Green Paper on Maritime Policy for the EU. MarinePolicy 31, 409–414.
Tett, P., Gilpin, L., Svendsen, H., Erlandsson, C.P., Larsson, U., Kratzer, S., Fouilland, E.,Janzen, C., Lee, J., Grenz, C., Newton, A., Ferreira, J.G., Fernandes, T., Scory, S.,2003. Eutrophication and some European waters of restricted exchange.Continental Shelf Research 23, 1635–1671.
Thackway, R., Cresswell, I.D. (Eds.), 1995. An Interim Biogeographic Regionalisationfor Australia: A Framework for Establishing the National System of Reserves,Version 4.0. Australian Nature Conservation Agency, Canberra.
Turpie, J., Adams, J.B., Joubert, A., Harrison, T.D., Colloty, B.M., Maree, R.C., Whitfield,A.K., Wooldridge, T.H., Lamberth, S.J., Taljaard, S., van Niekerk, L., 2002.Assessment of the conservation priority status of South African estuaries foruse in management and water allocation. Water S.A. 28 (2), 191–206.
UNCLOS, 1982. United Nations Convention on the Law of the Sea, signed at MontegoBay, Jamaica, on 10 December 1982, 202 pp. www.un.org/Depts/los/index.htm.
USEPA, 1998. National Strategy for the Development of Regional Nutrient Criteria.Tech. Report No. EPA 822-R-98-002. US EPA, Office of Water, Washington, DC.
USEPA, 2001a. Environmental Monitoring and Assessment Program (EMAP):National Coastal Assessment Quality Assurance Project Plan 2001–2004.United States Environmental Protection Agency, Office of Research andDevelopment, National Health and Environmental Effects ResearchLaboratory, Gulf Ecology Division, Gulf Breeze, FL. EPA/620/R-01/002.www.epa.gov/emap/nca/html/docs/c2k_qapp.pdf.
USEPA, 2001b. National Coastal Condition Report I. United States EnvironmentalProtection Agency, Office of Research and Development, Office of Water,Washington, DC. EPA-620/R-01/005. www.epa.gov/owow/oceans/nccr/index.
USEPA, 2001c. Nutrient Criteria Technical Guidance Manual: Estuarine and CoastalMarine Waters. Tech. Report No. EPA 822-B-01-003. US EPA, Office of Water,Office of Science and Technology, Washington, DC.
USEPA, 2003. Guidance for 2004 Assessment, Listing and Reporting RequirementsPursuant to Sections 303(d) and 305(b) of the Clean Water Act. United StatesEnvironmental Protection Agency, Office of Water, Office of Wetlands, Oceans,and Watersheds.
USEPA, 2005. National Coastal Condition Report II. Office of Research andDevelopment, Office of Water, Washington, DC. EPA-620/R-03/002 December2004. (www.epa.gov/owow/oceans/nccr2/).
Van Dolah, R.F., Hyland, J.L., Holland, A.F., Rosen, J.S., Snoots, T.T., 1999. A benthicindex of biological integrity for assessing habitat quality in estuaries of thesoutheastern USA. Marine Environmental Research 48 (4–5), 269–283.
Vince, J., 2006. The South East Regional Marine Plan: Implementing Australia’sOceans Policy. Marine Policy 30, 420–430.
Walsh, R.G., Johnson, D.M., McKean, J.R., 1992. Benefit transfer of outdoor recreationdemand studies: 1968–1988. Water Resources Research 28 (3), 707–713.
Wang, X.L., Li, K.Q., Shi, X.Y., 2006. The marine environmental carrying capacity ofmajor pollutants in Jiaozhou Bay. Science Press, Beijing.
Weisberg, S.B., Ranasinghe, J.A., Dauer, D.D., Schnaffer, L.C., Diaz, R.J., Frithsen, J.B.,1997. An estuarine benthic index of biotic integrity (B-IBI) for Chesapeake Bay.Estuaries 20 (1), 149–158.
Whitall, D., Hendrickson, B., Paerl, H., 2003. Importance of atmosphericallydeposited nitrogen to the annual nitrogen budget of the Neuse River estuary,North Carolina. Environment International 29, 393–399.
Whitall, D., Castro, M., Driscoll, C., 2004. Evaluation of management strategies forreducing nitrogen loadings to four US Estuaries. Science of the TotalEnvironment 333, 25–36.
Whitfield, A.K., 1980a. A quantitative study of the trophic relationships within thefish community of the Mhlanga estuary, South Africa. Estuarine and CoastalMarine Science 10, 417–435.
Whitfield, A.K., 1980b. Distribution of fishes in the Mhlanga estuary in relation tofood resources. South African Journal of Zoology 15, 159–165.
Whitfield, A.K., 1980c. Factors influencing the recruitment of juvenile fishes into theMhlanga estuary. South African Journal of Zoology 15, 166–169.
Xiao, Y., Ferreira, J.G., Bricker, S.B., Nunes, J.P., Zhu, M., Zhang, X., 2007. TrophicAssessment in Chinese Coastal Systems – Review of methodologies andapplication to the Changjiang (Yangtze) Estuary and Jiaozhou Bay. Estuariesand Coasts 30 (6), 1–18.
Xue, X., Hong, H., Charles, A.T., 2004. Cumulative environmental impacts andintegrated coastal management, the case of Xiamen, China. Journal ofEnvironmental Management 71 (3), 271–283.
Yao, Y., Shen, Z., 2005. A review on eutrophication research of coastal waters.Marine Sciences (in Chinese) 29, 53–57.
Zhijie, F., 1989. Marine pollution legislation in China: retrospect and prospect.Marine Pollution Bulletin 20 (7), 333–335.