
REVIEW OF TIMBERLAND INVESTMENT DRIVERS, GROWTH AND …
49
Jib A. Davidson, C.F. Columbia Timber & Environmental Services United County Real Estate and Auctions Gainesville, FL • 352-375-1473 [email protected] REVIEW OF TIMBERLAND INVESTMENT DRIVERS, GROWTH AND TIMBER PRICES
Transcript of REVIEW OF TIMBERLAND INVESTMENT DRIVERS, GROWTH AND …

Jib A. Davidson, C.F.Columbia Timber & Environmental Services
United County Real Estate and AuctionsGainesville, FL • 352-375-1473
REVIEW OF TIMBERLAND INVESTMENT DRIVERS, GROWTH AND TIMBER PRICES

TIMBERLAND INVESTMENT DRIVERS
•A driver has a material effect upon the activity of another entity¹
•Drivers are unique •Landowner objectives create drivers •Maximize net income, IRR & NPV
¹Kenton, Will (2018). Investopedia. Retrieved from www.Investopedia.com/terms

CAULFIELD DRIVERS
• Jon P. Caulfield, Professor of Forest Business at Warnell School of Forest Resources at UGA
•“Timberland Return Drivers and Investing Styles of an Asset That Has Come of Age” The Quarterly Review of Commercial Finance Techniques. Volume 14, Number 4. Winter 1998.

CAULFIELD DRIVERS
•Land Price Change•Product Price Change•Biological Growth

CAULFIELD DRIVERS
33.3%
6.2%
Biologicalgrowth
Land price appreciation
Product pricechange
60.5%

KPMG DRIVERS

KPMG DRIVERS
•KPMG International•Operates in 153 countries•207,000 employees•Supply audits, assurance practices, mitigates risk, identifies opportunities

KPMG DRIVERS
•Timberland Investment Case• September 2013
•Real rates of return 4 – 6%

KPMG DRIVERS
•Asset Management•Timber pricing•Biological growth

KPMG DRIVERS
25%
25%50%
Asset management
Biologicalgrowth
Timberpricing

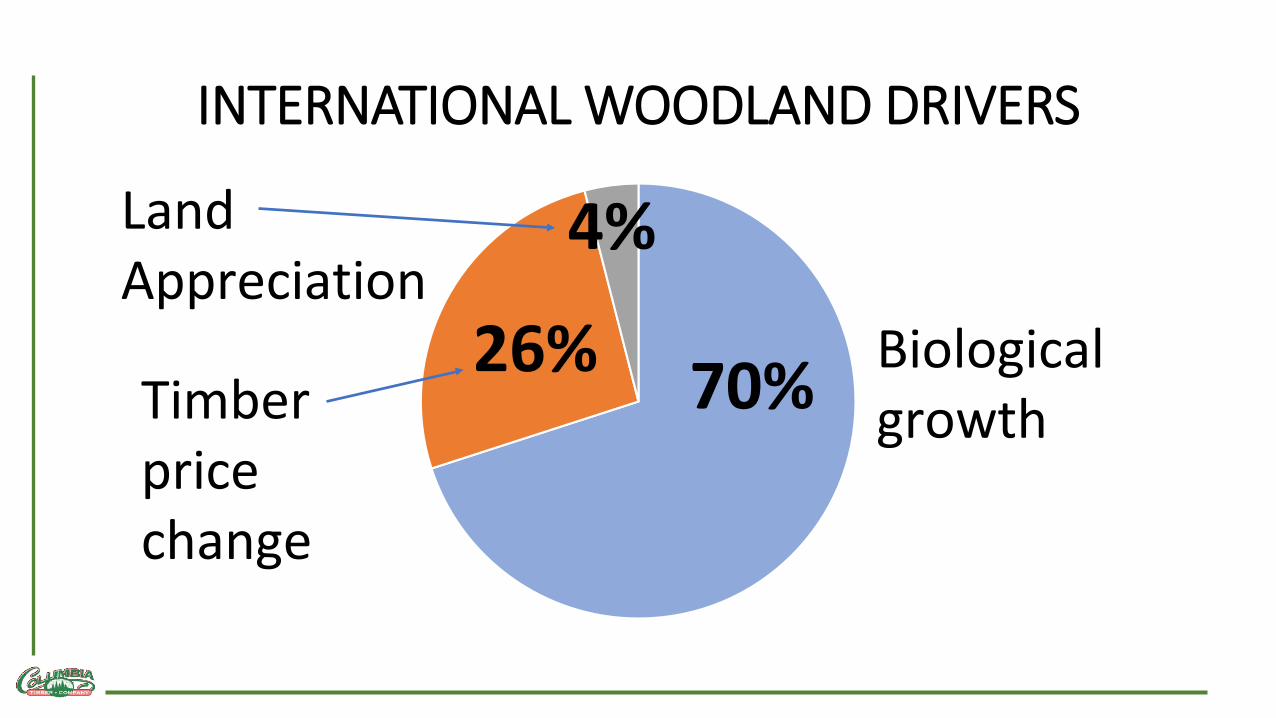
INTERNATIONAL WOODLAND DRIVERS
•International Woodland invests in agriculture and timberland
•Manage 4.5 billion dollars of institutional portfolios

INTERNATIONAL WOODLAND DRIVERS
•Focus on asset management & alternative investments
•Study rates of return and risk

INTERNATIONAL WOODLAND DRIVERS
•Land appreciation•Timber price changes•Biological growth

INTERNATIONAL WOODLAND DRIVERS
•Land appreciation: 2 – 5%•Timber price changes: 25 – 30%•Biological growth: 65 – 75%
INTERNATIONAL WOODLAND DRIVERS
70%26%
4%Land Appreciation
Timber price change
Biologicalgrowth

COLUMBIA TIMBER COMPANY DRIVERS
•Land appreciation•Asset management•Timber price changes•Biological growth

COLUMBIA TIMBER COMPANY DRIVERS
75% Biologicalgrowth
Land Appreciation
Timber prices
AssetManagement
3%10%
12%

Historical and Current Land Management Practices
0
50
100
150
200
250
1940 1950 1960 1970 1980 1990 2000 2010
Establishment period
Volu
me
at h
arve
st (t
ons/
acre
)
Clonal andbiotechnologyTree improvement
Weed control
Fertilization
Site preparation
Planting
Natural stand
Adapted from Fox, T.R., Jokela, and Allen. 2004

ESTABLISHING OPTIMAL ROTATION
CRITERIA FOR SELECTING “PROPER” AGE• Landowner objectives• Age for the “best” size – all timber markets are local• Age for total maximum volume• Age for maximum rate of growth• Maximum economic returns

ESTABLISHING OPTIMAL ROTATION
TRADITIONAL METHODS• Faustmann• Land expectation value, site expectation value, soil
rent & bare land value• Forest rent (maximizes stumpage)• Fisher rotation age (ignores opportunity costs)• Hartman rotation age (non-timber values)• MAI/CAI (no economics)

ESTABLISHING OPTIMAL ROTATION
Rotation age = max (PV benefits – PV costs)

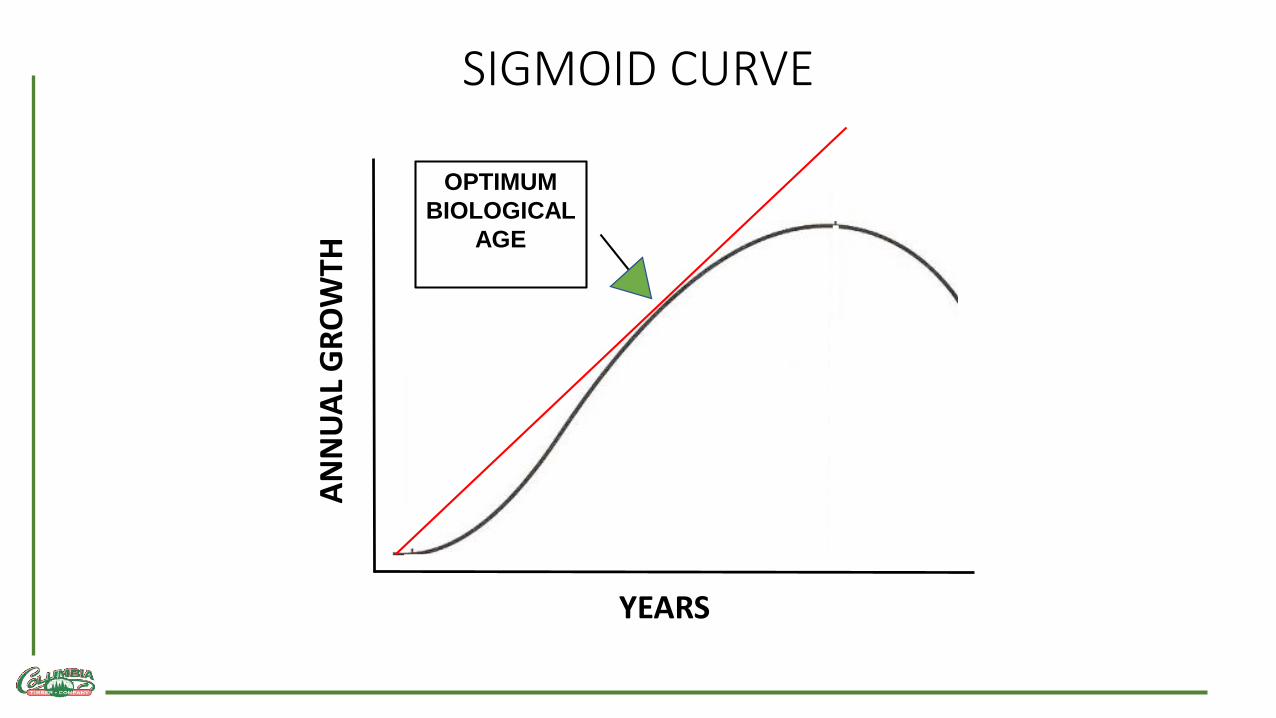
SIGMOID CURVE
ANN
UAL
GRO
WTH
YEARS

SIGMOID CURVE
ANN
UAL
GRO
WTH
YEARS
SEEDLINGESTABLISHMENT

SIGMOID CURVE
ANN
UAL
GRO
WTH
YEARS
TREE GROWTHINCREASES AT ANINCREASING RATE

SIGMOID CURVE
ANN
UAL
GRO
WTH
YEARS
IMPORTANT INFLECTION
POINT

SIGMOID CURVE
ANN
UAL
GRO
WTH
YEARS
TREE GROWTHINCREASES BUT AT ADECREASING RATE

SIGMOID CURVE
ANN
UAL
GRO
WTH
YEARS
MAXIMUMGROWTH
SIGMOID CURVE
ANN
UAL
GRO
WTH
YEARS
OPTIMUM BIOLOGICAL
AGE

MEAN ANNUAL INCREMENT = CURRENT ANNUAL INCREMENT
Zhang, D., &Pearse, H. P. (2011). Figure 7.1 Growth in volume and stumpage vale of a forest stand at it increases in age. Forest Economics. UBC Press, Vancouver, B.C.
CAIMAI

MEAN ANNUAL INCREMENT = CURRENT ANNUAL INCREMENT
Zhang, D., &Pearse, H. P. (2011). Figure 7.1 Growth in volume and stumpage vale of a forest stand at it increases in age. Forest Economics. UBC Press, Vancouver, B.C.
CAIMAI

GROWTH & YIELD EXAMPLE
-
2
4
6
8
10
12
1 2 3 4 5 6 7 8 9 10 11 12 13 14 15 16 17 18 19 20
Gro
wth
tons
/acr
e
Years
GROWTH & YIELD LOBLOLLY PINE
CAI
MAI
SQ = 80600 T/A

GROWTH & YIELD EXAMPLE
-
2
4
6
8
10
12
1 2 3 4 5 6 7 8 9 10 11 12 13 14 15 16 17 18 19 20
Gro
wth
tons
/acr
e
Years
GROWTH & YIELD LOBLOLLY PINE
CAI
MAI
SQ = 80600 T/A
Rotation age = 15

TIMBER PRICING
Delivered prices vs. stumpage?
DELIVERED PRICES

TIMBER PRICING
•Timbermart South•Forest2Market•RISI Fastmarkets

TIMBER PRICING

TMS DATA
y = 1.0307x + 22.147R² = 0.9569
0.00
5.00
10.00
15.00
20.00
25.00
30.00
35.00
40.00
2 0 0 6 2 0 0 7 2 0 0 8 2 0 0 9 2 0 1 0 2 0 1 1 2 0 1 2 2 0 1 3 2 0 1 4 2 0 1 5 2 0 1 6 2 0 1 7 2 0 1 8
NE FL DELIVERED TIMBER PRICES PULPWOOD

TMS DATA
y = 22.734e0.0353x
R² = 0.9546
0.00
5.00
10.00
15.00
20.00
25.00
30.00
35.00
40.00
2 0 0 6 2 0 0 7 2 0 0 8 2 0 0 9 2 0 1 0 2 0 1 1 2 0 1 2 2 0 1 3 2 0 1 4 2 0 1 5 2 0 1 6 2 0 1 7 2 0 1 8
NE FL DELIVERED TIMBER PRICES PULPWOOD

TIMBER PRICE GROWTH RATE
•LINEAR 3.1% •EXPONTIAL 3.5%
THIS IS A NOMINAL GROWTH RATE…IT INCLUDES INFLATION

HISTORICAL INFLATION
-15
-10
-5
0
5
10
15
20
15 20 25 30 35 40 45 50 55 60 65 70 75 80 85 90 95 0 5 10 15
INFLATION 1915 - 2018

HISTORICAL INFLATION
-15
-10
-5
0
5
10
15
20
15 20 25 30 35 40 45 50 55 60 65 70 75 80 85 90 95 0 5 10 15
INFLATION 1915 - 2018
INFLATION LAST 10 YEARS2008 – 2018
1.6%

REAL TIMBER GROWTH RATE
LINEAR EXPO AVERAGE
TIMBER GROWTH 3.1 3.5 3.3LESS INFLATION (1.9) (1.9) (1.9)REAL TIMBER GROWTH
1.2 1.6 1.4

COMBINE TIMBER PRICE WITH GROWTH

COMBINE TIMBER PRICE WITH GROWTH
$-
$500
$1,000
$1,500
$2,000
$2,500
1 2 3 4 5 6 7 8 9 10 11 12 13 14 15 16 17 18
DOLL
AR V
ALU
E
YEARS2 TONS/A/YR 5 TONS/A/YR 8 TONS/A/YR
DOLLAR GROWTH WITH NO TIMBER PRICE INCREASE AT $16 PER TON

COMBINE TIMBER PRICE WITH GROWTH
$-
$500
$1,000
$1,500
$2,000
$2,500
1 2 3 4 5 6 7 8 9 10 11 12 13 14 15 16 17 18
DOLL
AR V
ALU
E
YEARS2 TONS/A/YR 5 TONS/A/YR 8 TONS/A/YR
DOLLAR GROWTH WITH NO TIMBER PRICE INCREASE AT $16 PER TON
P₁ = $16P₁₈ = $16

COMBINE TIMBER PRICE WITH GROWTH
$-
$500
$1,000
$1,500
$2,000
$2,500
1 2 3 4 5 6 7 8 9 10 11 12 13 14 15 16 17 18
DOLL
AR V
ALU
E
YEARS2 TONS/A/YR 5 TONS/A/YR 8 TONS/A/YR
DOLLAR GROWTH WITH NO TIMBER PRICE INCREASE AT $16 PER TON
P₁ = $16P₁₈ = $16
IRR = 22%
IRR = 28%
IRR = 32%

COMBINE TIMBER PRICE WITH GROWTH
-
500
1,000
1,500
2,000
2,500
3,000
3,500
1 2 3 4 5 6 7 8 9 10 11 12 13 14 15 16 17 18
DOLL
AR V
ALU
E
YEARS
DOLLAR GROWTH WITH 1.4% REAL PRICE INCREASE AT $16 PER TON
2 TONS/A/YR 5 TONS/A/YR 8 TONS/A/YR

COMBINE TIMBER PRICE WITH GROWTH
-
500
1,000
1,500
2,000
2,500
3,000
3,500
1 2 3 4 5 6 7 8 9 10 11 12 13 14 15 16 17 18
DOLL
AR V
ALU
E
YEARS
DOLLAR GROWTH WITH 1.4% REAL PRICE INCREASE AT $16 PER TON
2 TONS/A/YR 5 TONS/A/YR 8 TONS/A/YR
IRR = 24%
IRR = 30%
IRR = 34%P₁ = $16P₁₈ = $21

IRR SUMMARY

Questions?


![Impact Investing – The ‘Real’ Deal · − Timberland Investment Management Organization [TIMO] founded in 1976 − Differentiated through conservation investment strategy and](https://static.fdocuments.net/doc/165x107/5f09a3087e708231d427c9bc/impact-investing-a-the-areala-deal-a-timberland-investment-management-organization.jpg)

