Review of the Method of Valuation of the SDR; IMF Policy ... · This paper provides the basis for...
51
INTERNATIONAL MONETARY FUND Review of the Method of Valuation of the SDR Prepared by the Finance Department In consultation with the Legal and Other Departments Approved by Andrew Tweedie October 26, 2010 Contents Page Executive Summary .................................................................................................................. 3 I. Introduction ........................................................................................................................... 4 II. Principles and Methodology of SDR Valuation ................................................................... 5 III. Developments in Valuation-Related Variables ................................................................... 9 A. Exchange Rate Developments ......................................................................................... 9 B. Developments in Exports and Reserve Holdings ........................................................... 11 C. International Financial Developments ........................................................................... 12 IV. Selection and Weighting of Currencies in the SDR Basket ............................................. 15 A. Key Issues and Proposed Approach ............................................................................... 15 B. SDR Currency Basket Composition............................................................................... 18 C. Currency Weights and Rounding of Relative Weights .................................................. 19 D. Currency Amounts in the SDR Basket .......................................................................... 21 V. Review of Financial Instruments in the SDR Interest Rate Basket ................................... 22 VI. Transition to a New Basket, the Next Review, and Issues for Discussion ....................... 25 Tables 1. Exchange Rate Volatility, 2005–2010 ................................................................................ 10 2. Exports of Goods, Services, and Income, 2005–2009 ........................................................ 11 3. Composition of Foreign Exchange Reserves, 2004–2010 .................................................. 12 4. Basis for Determining the Weights of Currencies in the SDR Basket ............................... 19 5. Rounding of Initial Currency Weights ................................................................................ 20 6. Illustrative Currency Amounts ............................................................................................ 21
Transcript of Review of the Method of Valuation of the SDR; IMF Policy ... · This paper provides the basis for...
INTERNATIONAL MONETARY FUND
Review of the Method of Valuation of the SDR
Prepared by the Finance Department
In consultation with the Legal and Other Departments
Approved by Andrew Tweedie
October 26, 2010
Contents Page
Executive Summary .................................................................................................................. 3
I. Introduction ........................................................................................................................... 4
II. Principles and Methodology of SDR Valuation ................................................................... 5
III. Developments in Valuation-Related Variables ................................................................... 9
A. Exchange Rate Developments ......................................................................................... 9
B. Developments in Exports and Reserve Holdings ........................................................... 11
C. International Financial Developments ........................................................................... 12
IV. Selection and Weighting of Currencies in the SDR Basket ............................................. 15
A. Key Issues and Proposed Approach ............................................................................... 15
B. SDR Currency Basket Composition ............................................................................... 18
C. Currency Weights and Rounding of Relative Weights .................................................. 19
D. Currency Amounts in the SDR Basket .......................................................................... 21
V. Review of Financial Instruments in the SDR Interest Rate Basket ................................... 22
VI. Transition to a New Basket, the Next Review, and Issues for Discussion ....................... 25
Tables
1. Exchange Rate Volatility, 2005–2010 ................................................................................ 10
2. Exports of Goods, Services, and Income, 2005–2009 ........................................................ 11
3. Composition of Foreign Exchange Reserves, 2004–2010 .................................................. 12
4. Basis for Determining the Weights of Currencies in the SDR Basket ............................... 19
5. Rounding of Initial Currency Weights ................................................................................ 20
6. Illustrative Currency Amounts ............................................................................................ 21
2
Figures
1. Exchange Rate Movements of the U.S. Dollar, 2006–2010 ................................................. 9
2. Actual Currency Weights in the SDR Basket, 2000–2010 ................................................. 10
3. International Banking Liabilities—Currency Composition (2000-2009) ........................... 13
4. International Debt Securities—Currency Composition (2000-2010) ................................. 14
5. Global Foreign Exchange Market Turnover—Currency Composition .............................. 15
6. Interest Rates on the SDR and its Financial Instrument Components, 2005–10 ................ 23
Boxes
1. Broad Principles Guiding SDR Valuation Decisions ........................................................... 5
2. Decisions under the 2000 and 2005 Reviews .............................................................................. 6
3. Determination of Currency Amounts and Actual Daily Weights ......................................... 8
4. Assessing Freely Usable Currencies ................................................................................... 17
5. SDR Interest Rate Calculation ............................................................................................ 23
Annexes
I. Basic Decisions on SDR Valuation ..................................................................................... 27
II. The Renminbi—Exchange Controls and Recent Developments ....................................... 31
III. SDR Currency Weighting—Current and Alternative Methods ........................................ 36
IV. Official SDR Interest Rate—Maturity and Frequency ..................................................... 45
V. Data for Calculating SDR Currency Weights .................................................................... 50
Annex Tables
II.1. Renminbi Swap Agreements ........................................................................................... 35
III.1. Relative Weights of Exports and Official Holdings of Currency .................................. 37
III.2. SDR Currency Weights Based on Actual Reserve Levels............................................. 39
III.3. SDR Weights ................................................................................................................. 39
III.4. Supplementary Financial Variables—Currency Breakdown ......................................... 41
III.5. SDR Currency Weights: Financial Indicator A ............................................................. 42
III.6. SDR Currency Weights: Financial Indicator B ............................................................. 43
III.7. Currency Weights under Alternative Weighting Schemes for 2005 Review Data ........ 43
Annex Figures
II.1. Cumulative Trade Settlement in Renminbi ..................................................................... 33
II.2. Renminbi Deposits in Hong Kong SAR ......................................................................... 35
III.1. World Trade and Financial Indicators ........................................................................... 40
III.2. Deviation of Calculated SDR/US dollar Exchange Rates from Actual ......................... 44
IV.1. Official SDR Interest Rate and Daily Combined Market Rate ...................................... 46
IV.2. Quarterly, Weekly, and Daily Approaches to the SDR Interest Rate ............................ 48
IV.3. One-Week OIS rate and Official SDR Interest Rate ..................................................... 49
Annex Box
III.1. International Trade Invoicing ........................................................................................ 38
3
EXECUTIVE SUMMARY
This paper provides the basis for the quinquennial review of the method of valuation of the
SDR, and the financial instruments used to determine the SDR interest rate. Under the
governing Board decisions, the new SDR valuation and interest rate baskets would come into
effect on January 1, 2011.
The review examines developments during the 2005–09 period in the variables relevant to
the SDR valuation. These variables include exchange rates, exports of goods, services and
income, and reserve holdings. Data for exports of goods and services show China has
become the third largest exporter among Fund members and monetary unions including Fund
members. Nonetheless, indicators such as reserves and international banking and debt
securities suggest that the currencies in the current SDR basket continue to predominate in
international financial transactions, and these currencies also account for the bulk of global
foreign exchange turnover. At this time, the Chinese renminbi would not appear to meet the
criteria for being determined by the Fund to be a freely usable currency, which is also
required for inclusion in the SDR basket.
Staff therefore recommends no changes in the composition of the SDR basket at this review.
Also no changes are proposed in the method of calculating currency weights, or in the
financial instruments used to determine the official SDR interest rate. To address the
concerns that a number of Directors expressed in the context of the 2005 Review about the
method of rounding used in determining the initial currency weights in the SDR basket, the
paper proposes to move from rounding to the nearest whole percentage point to rounding to
one decimal place.
While no changes are proposed for the current review, the paper proposes a follow-up work
program on several issues relating to the valuation of the SDR and the SDR interest rate
basket. These include the indicators used in selecting currencies to be included in the SDR
valuation basket, the number of currencies in the basket, the methodology to determine the
initial currency weights, and the potential alignment of the maturity of the financial
instruments used to determine the SDR interest rate basket and the frequency of updates in
the official SDR interest rate. This work program is distinct from the ongoing discussions on
the reform of the international monetary system, but would take account of these discussions.
It is proposed that the next review take place by 2015, with any changes taking effect
January 1, 2016. Nonetheless, the Board could decide on an earlier review if warranted by
financial developments. In line with previous practice, it is also proposed that the decision by
the Executive Board regarding this review be adopted well in advance of January 1, 2011
(when the proposed changes will become effective), in order to provide sufficient notice to
interested parties and to complete any consultations that might be required.
4
I. INTRODUCTION1
1. This paper provides the basis for the quinquennial review of the method of
valuation of the SDR currency basket.2 In accordance with past practice, the review of the
financial instruments used to determine the SDR interest rate (the interest rate basket) is
conducted at the same time. Broader issues related to the role of the SDR in the international
monetary system are to be addressed by other papers. The current SDR currency basket
review is due to be completed by December 31, 2010, and the new currency basket would
come into effect on January 1, 2011. Traditionally, the Board has taken the decision on SDR
valuation prior to the effective date in order to provide advance notice to interested parties
and to complete any consultations that might be required.
2. No changes in the composition of the SDR basket, the method of calculating
currency weights, or in the financial instruments used to determine the official SDR
interest rate are proposed at this review. To address the concerns that a number of
Directors expressed in the context of the 2005 Review about the method of rounding used in
determining the currency weights in the SDR basket, staff proposes rounding the initial
currency weights to one decimal place rather than to the nearest whole percentage point.3
3. While no changes are proposed at this time, a number of areas are identified
where follow-up work on the valuation of the SDR may be appropriate. These include
the scope for further developing the indicators used to guide future decisions on the inclusion
of new currencies in the SDR basket, and the possible role for supplementary financial
variables in the calculation of the currency weights in the SDR basket, including alternative
weighting schemes. Possible issues regarding the difference between the frequency of
adjustments in the official SDR interest rate and the maturity of the underlying financial
instruments are also identified. The paper proposes that these issues be considered in more
detail in 2011, following the completion of the current review. Such a timetable would allow
these issues to be considered well in advance of the next review of the SDR valuation basket
and to take account of the broader ongoing work program on the international monetary
system and the role of the SDR.
4. The paper is organized as follows. Section II summarizes the method of SDR
valuation and the broad principles that have guided previous reviews. Developments in
valuation-related variables are reviewed in section III. Section IV covers the proposed
selection and weighting of currencies in the SDR basket for 2011–15, as well as broader
1 This paper was prepared by Messrs. Beaumont, Rossi, Rodriguez, Perez, Kohler, and Attie (all FIN). Ms. Rosenberg and
Mr. Steinki (all LEG) prepared Annex I. Ms. Cheng (APD) and Ms. Kokenyne (MCM) contributed to Annex II.
2 The quinquennial review of the list of currencies, and their amounts, that determine the value of the SDR is provided for
under Decision No. 12281-(00/98) G/S adopted October 11, 2000, which is reproduced in Annex I.
3 See IMF Executive Board Determines New Currency Amounts for SDR Valuation Basket, Public Information Notice No.
05/171 (http://www.imf.org/external/np/sec/pn/2005/pn05171.htm).
5
issues for future work. Section V reviews the financial instruments in the SDR interest rate
basket. Section VI discusses the transition to the new SDR basket, the timing of the next
valuation review, and sets out some issues for discussion.
II. PRINCIPLES AND METHODOLOGY OF SDR VALUATION
5. The Executive Board has reviewed the SDR valuation basket on a 5-yearly basis.
These reviews cover the currencies to be included in the SDR valuation basket and determine
the weights of those currencies. The reviews have been based on criteria adopted by the
Executive Board, which the Board has the authority to modify.4 Past reviews have been
guided by long-standing principles that aim to enhance the attractiveness of the SDR as a
reserve asset (Box 1).
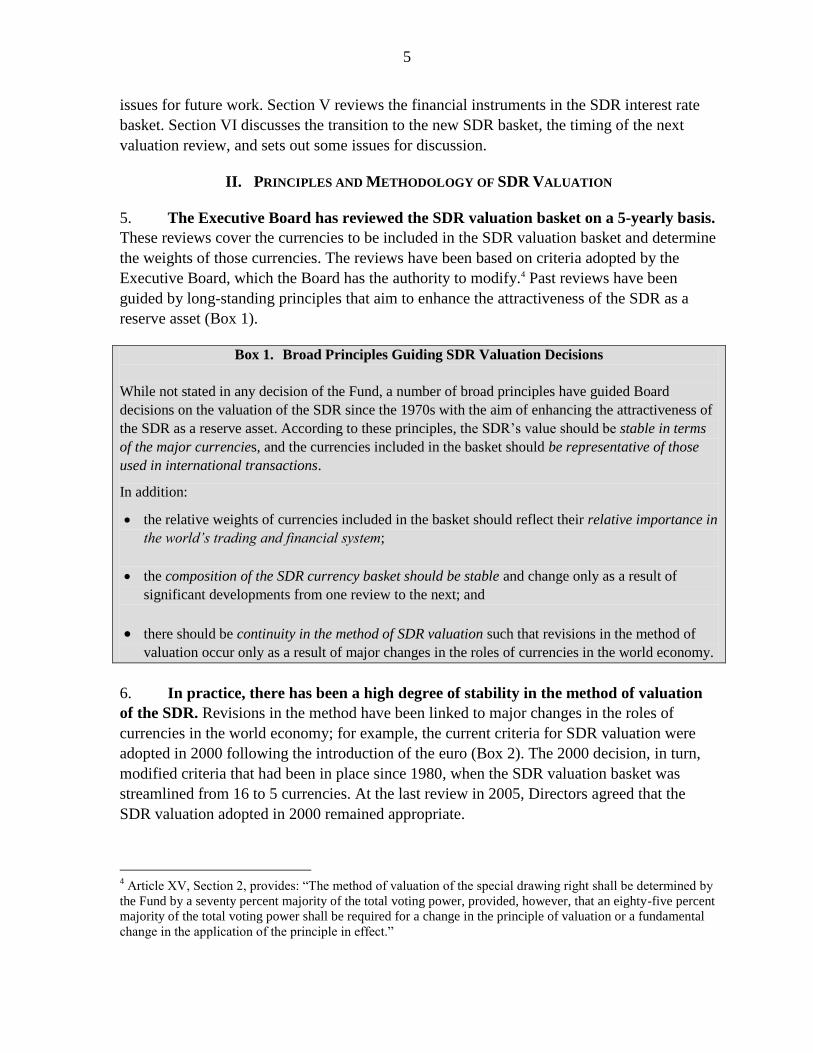
Box 1. Broad Principles Guiding SDR Valuation Decisions
While not stated in any decision of the Fund, a number of broad principles have guided Board
decisions on the valuation of the SDR since the 1970s with the aim of enhancing the attractiveness of
the SDR as a reserve asset. According to these principles, the SDR’s value should be stable in terms
of the major currencies, and the currencies included in the basket should be representative of those
used in international transactions.
In addition:
the relative weights of currencies included in the basket should reflect their relative importance in
the world’s trading and financial system;
the composition of the SDR currency basket should be stable and change only as a result of
significant developments from one review to the next; and
there should be continuity in the method of SDR valuation such that revisions in the method of
valuation occur only as a result of major changes in the roles of currencies in the world economy.
6. In practice, there has been a high degree of stability in the method of valuation
of the SDR. Revisions in the method have been linked to major changes in the roles of
currencies in the world economy; for example, the current criteria for SDR valuation were
adopted in 2000 following the introduction of the euro (Box 2). The 2000 decision, in turn,
modified criteria that had been in place since 1980, when the SDR valuation basket was
streamlined from 16 to 5 currencies. At the last review in 2005, Directors agreed that the
SDR valuation adopted in 2000 remained appropriate.
4 Article XV, Section 2, provides: ―The method of valuation of the special drawing right shall be determined by
the Fund by a seventy percent majority of the total voting power, provided, however, that an eighty-five percent
majority of the total voting power shall be required for a change in the principle of valuation or a fundamental
change in the application of the principle in effect.‖

6
Box 2. Decisions under the 2000 and 2005 Reviews
Following the introduction of the euro on January 1, 1999, the Board agreed to shift from a
member-based to a currency-based method of SDR valuation in 2000, adopting a decision that
superseded the 1980 Decision. Under the new method for SDR valuation, the SDR basket
comprises the currencies of the four largest exporting Fund members or monetary unions—
defined as areas with a single currency and common central bank—that have been determined by
the Fund to be freely usable currencies in accordance with Article XXX (f).
The decision by the Board in 2000 to require that currencies in the SDR basket be freely
usable principally reflected the role of the SDR as a supplementary official reserve asset.
This role suggested that the selection according to exports of goods and services is a necessary,
but not sufficient condition to include a currency in the SDR basket, as a country’s share of world
exports is not necessarily a reliable indicator of the use of its currency in international
transactions, nor an accurate gauge of the depth and breadth of its financial markets. In addition to
encompassing official reserves, the requirement that a currency be freely usable allows for the
consideration of several other indicators on the breadth and depth of financial markets (Box 4).
This requirement was also consistent with previous Board decisions; for instance, one goal of the
1980 decision to reduce the number of currencies in the SDR basket from 16 to 5 was to ensure
that the currencies included had broad and deep foreign exchange markets, which is a key element
of the concept of a freely usable currency.
The method used to determine SDR
currency weights was unchanged at the
2000 and 2005 reviews. Based on
combining the value of exports and official
reserves held by monetary authorities
outside the country or monetary union that
issues the respective currency, it was agreed
that the currency weights of the SDR basket
would be as shown in the table.
At the 2005 review, the Board agreed to maintain the valuation method adopted in the 2000
Decision, but revised the representative interest rate for the euro.1 Directors agreed to replace
the three-month Euribor rate with the three-month Eurepo rate as the applicable rate for the euro,
noting that Eurepo now conforms more closely with the criteria applied to the selection of
instruments, particularly with respect to its risk characteristics.
1 In the initial period following the introduction of the euro, the SDR basket had been modified to include
the euro as the currency of both France and Germany. 2 IMF Executive Board Determines New Currency Amounts for SDR Valuation Basket, Public Information
Notice No. 05/171 (http://www.imf.org/external/np/sec/pn/2005/pn05171.htm).
Initial Weights of Currencies
(In percent)
2000
Review
2005
Review
U.S. dollar 45 44
Euro 29 34
Japanese yen 15 11
Pound sterling 11 11
Source: Finance Department
7
7. The SDR currently derives its value from a basket of four currencies: the
U.S. dollar, the euro, the Japanese yen, and pound sterling. The basket contains fixed
amounts of each of these currency units, which are valued at prevailing market exchange
rates and summed to obtain the SDR’s value. This ―standard basket‖ method, adopted in
1974, has been accepted as the method that best ensures the stability of the SDR in terms of
the major currencies under floating exchange rates.5 Staff’s discussions with regular users of
the SDR basket in the financial markets also indicate that the standard basket method
facilitates replication of the principal value of the SDR using financial instruments available
in the component currencies.6
8. Under the 2000 Decision (Annex I), the composition of the SDR basket reflects
the following criteria:
Currency Selection: the SDR basket comprises the four currencies that are issued by Fund
members (or by monetary unions that include Fund members), whose exports of goods and
services7 during the five-year period ending 12 months before the effective date of the
revision had the largest value,8 and that have been determined by the Fund to be freely usable
currencies in accordance with Article XXX (f), which reads:
A freely usable currency means a member’s currency that the Fund determines
(i) is, in fact, widely used to make payments for international transactions, and
(ii) is widely traded in the principal exchange markets.
It is notable that the concept of a freely usable currency concerns the actual international use
and trading of currencies, and is distinct from whether a currency is either freely floating or
fully convertible.
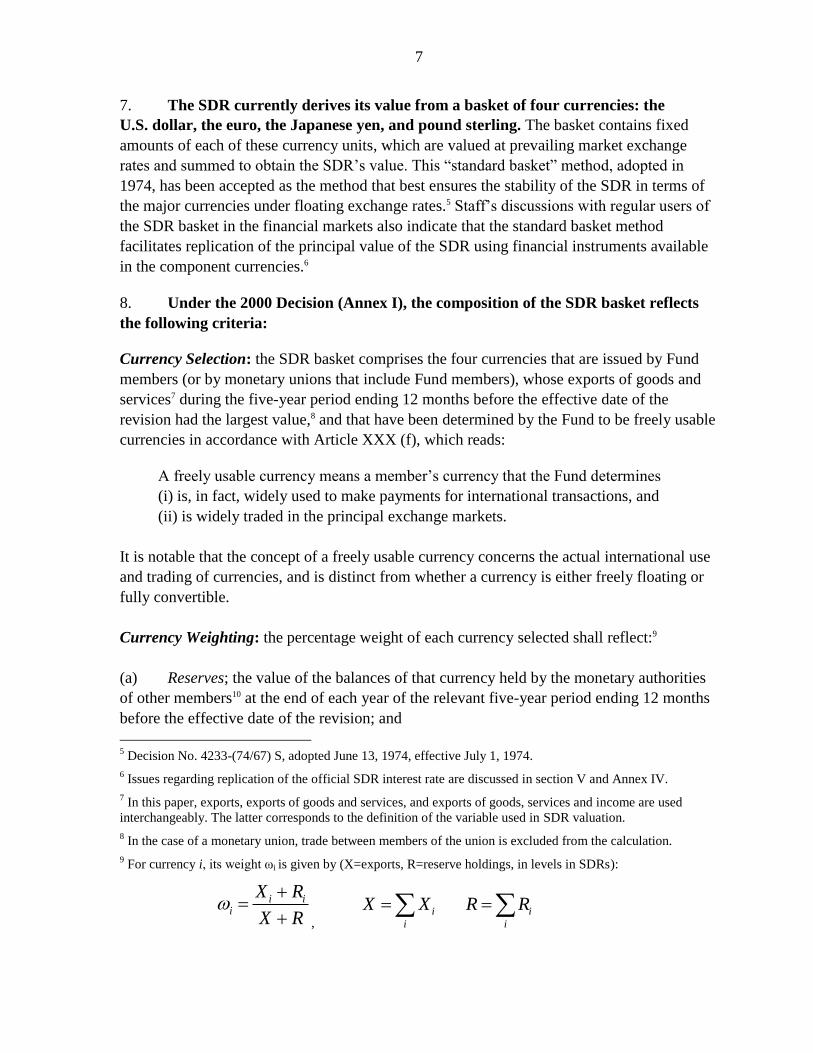
Currency Weighting: the percentage weight of each currency selected shall reflect:9
(a) Reserves; the value of the balances of that currency held by the monetary authorities
of other members10 at the end of each year of the relevant five-year period ending 12 months
before the effective date of the revision; and
5 Decision No. 4233-(74/67) S, adopted June 13, 1974, effective July 1, 1974.
6 Issues regarding replication of the official SDR interest rate are discussed in section V and Annex IV.
7 In this paper, exports, exports of goods and services, and exports of goods, services and income are used
interchangeably. The latter corresponds to the definition of the variable used in SDR valuation.
8 In the case of a monetary union, trade between members of the union is excluded from the calculation.
9 For currency i, its weight ωi is given by (X=exports, R=reserve holdings, in levels in SDRs):
i ii
X R
X R
, i i
i i
X X R R
8
(b) Exports; the value of exports of goods and services of the members or monetary
unions as defined in the method for currency selection.
Review: The currencies and their weights in the valuation basket shall be reviewed every five
years in order to keep the composition of the basket stable for at least that period of time,
unless the Executive Board decides otherwise.11
9. The five-yearly Executive Board decisions specify the initial weights of the
currencies in the basket, but the weights change over time with exchange rate
developments. Specific currency amounts consistent with the initial weights are fixed on the
date on which the decision becomes effective (Box 3). Subsequent daily valuations of the
SDR are based on these fixed currency amounts. Movements in exchange rates alter the
relative weights of the component currencies, with appreciating currencies gaining a larger
share in the basket.
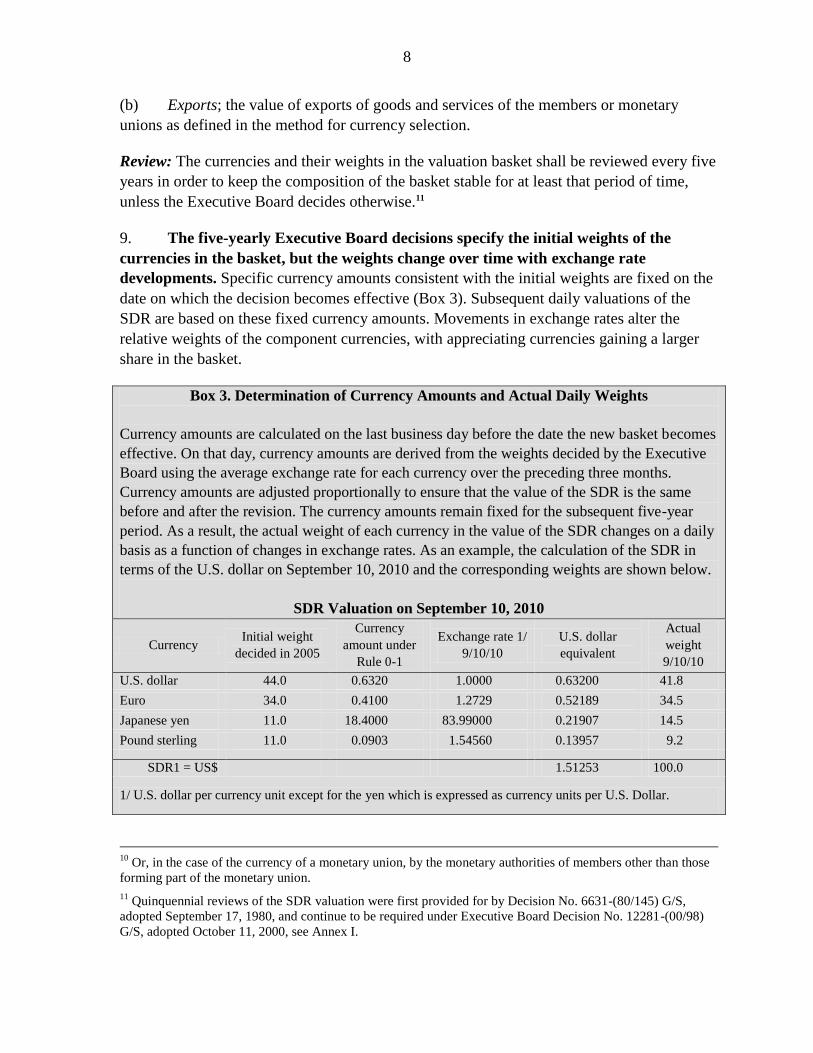
Box 3. Determination of Currency Amounts and Actual Daily Weights
Currency amounts are calculated on the last business day before the date the new basket becomes
effective. On that day, currency amounts are derived from the weights decided by the Executive
Board using the average exchange rate for each currency over the preceding three months.
Currency amounts are adjusted proportionally to ensure that the value of the SDR is the same
before and after the revision. The currency amounts remain fixed for the subsequent five-year
period. As a result, the actual weight of each currency in the value of the SDR changes on a daily
basis as a function of changes in exchange rates. As an example, the calculation of the SDR in
terms of the U.S. dollar on September 10, 2010 and the corresponding weights are shown below.
SDR Valuation on September 10, 2010
Currency Initial weight
decided in 2005
Currency
amount under
Rule 0-1
Exchange rate 1/
9/10/10
U.S. dollar
equivalent
Actual
weight
9/10/10
U.S. dollar 44.0 0.6320 1.0000 0.63200 41.8
Euro 34.0 0.4100 1.2729 0.52189 34.5
Japanese yen 11.0 18.4000 83.99000 0.21907 14.5
Pound sterling 11.0 0.0903 1.54560 0.13957 9.2
SDR1 = US$ 1.51253 100.0
1/ U.S. dollar per currency unit except for the yen which is expressed as currency units per U.S. Dollar.
10
Or, in the case of the currency of a monetary union, by the monetary authorities of members other than those
forming part of the monetary union.
11 Quinquennial reviews of the SDR valuation were first provided for by Decision No. 6631-(80/145) G/S,
adopted September 17, 1980, and continue to be required under Executive Board Decision No. 12281-(00/98)
G/S, adopted October 11, 2000, see Annex I.
9
III. DEVELOPMENTS IN VALUATION-RELATED VARIABLES
10. This section reviews developments in the variables relevant to SDR valuation, both
the selection and weighting of currencies in the basket, including exchange rates, exports,
reserves, and indicators of international financial transactions.
A. Exchange Rate Developments
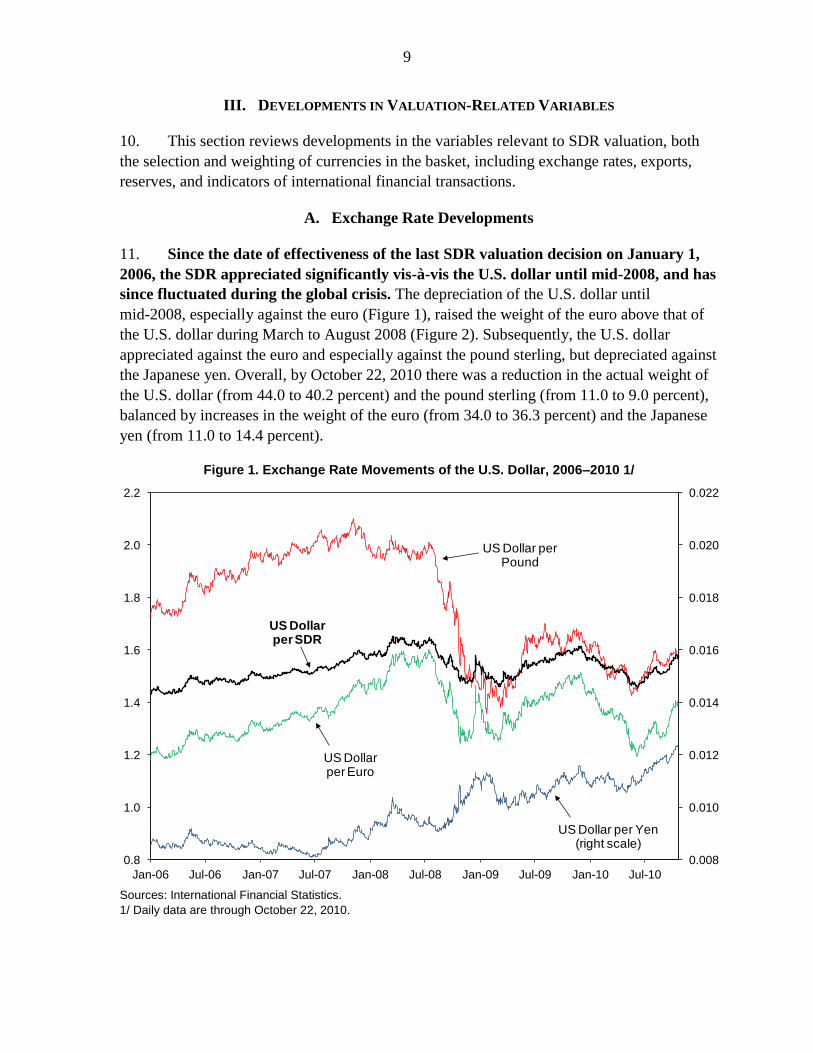
11. Since the date of effectiveness of the last SDR valuation decision on January 1,
2006, the SDR appreciated significantly vis-à-vis the U.S. dollar until mid-2008, and has
since fluctuated during the global crisis. The depreciation of the U.S. dollar until
mid-2008, especially against the euro (Figure 1), raised the weight of the euro above that of
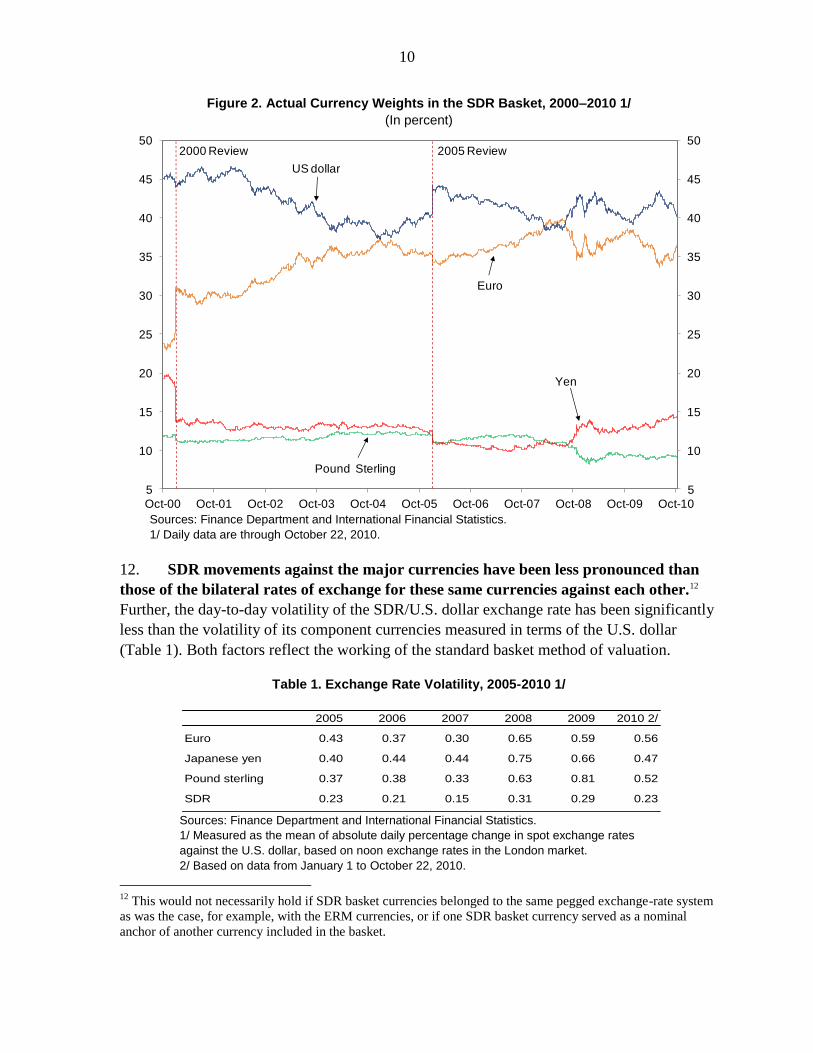
the U.S. dollar during March to August 2008 (Figure 2). Subsequently, the U.S. dollar
appreciated against the euro and especially against the pound sterling, but depreciated against
the Japanese yen. Overall, by October 22, 2010 there was a reduction in the actual weight of
the U.S. dollar (from 44.0 to 40.2 percent) and the pound sterling (from 11.0 to 9.0 percent),
balanced by increases in the weight of the euro (from 34.0 to 36.3 percent) and the Japanese
yen (from 11.0 to 14.4 percent).
Figure 1. Exchange Rate Movements of the U.S. Dollar, 2006–2010 1/
Sources: International Financial Statistics.
1/ Daily data are through October 22, 2010.
0.008
0.010
0.012
0.014
0.016
0.018
0.020
0.022
0.8
1.0
1.2
1.4
1.6
1.8
2.0
2.2
Jan-06 Jul-06 Jan-07 Jul-07 Jan-08 Jul-08 Jan-09 Jul-09 Jan-10 Jul-10
US Dollar per Pound
US Dollar per Euro
US Dollar per Yen (right scale)
US Dollar per SDR
10
Figure 2. Actual Currency Weights in the SDR Basket, 2000–2010 1/
(In percent)
Sources: Finance Department and International Financial Statistics.
1/ Daily data are through October 22, 2010.
12. SDR movements against the major currencies have been less pronounced than
those of the bilateral rates of exchange for these same currencies against each other.12
Further, the day-to-day volatility of the SDR/U.S. dollar exchange rate has been significantly
less than the volatility of its component currencies measured in terms of the U.S. dollar
(Table 1). Both factors reflect the working of the standard basket method of valuation.
Table 1. Exchange Rate Volatility, 2005-2010 1/
Sources: Finance Department and International Financial Statistics.
1/ Measured as the mean of absolute daily percentage change in spot exchange rates
against the U.S. dollar, based on noon exchange rates in the London market.
2/ Based on data from January 1 to October 22, 2010.
12
This would not necessarily hold if SDR basket currencies belonged to the same pegged exchange-rate system
as was the case, for example, with the ERM currencies, or if one SDR basket currency served as a nominal
anchor of another currency included in the basket.
5
10
15
20
25
30
35
40
45
50
5
10
15
20
25
30
35
40
45
50
Oct-00 Oct-01 Oct-02 Oct-03 Oct-04 Oct-05 Oct-06 Oct-07 Oct-08 Oct-09 Oct-10
2000 Review
US dollar
Euro
Yen
Pound Sterling
2005 Review
2005 2006 2007 2008 2009 2010 2/
Euro 0.43 0.37 0.30 0.65 0.59 0.56
Japanese yen 0.40 0.44 0.44 0.75 0.66 0.47
Pound sterling 0.37 0.38 0.33 0.63 0.81 0.52
SDR 0.23 0.21 0.15 0.31 0.29 0.23
11
B. Developments in Exports and Reserve Holdings
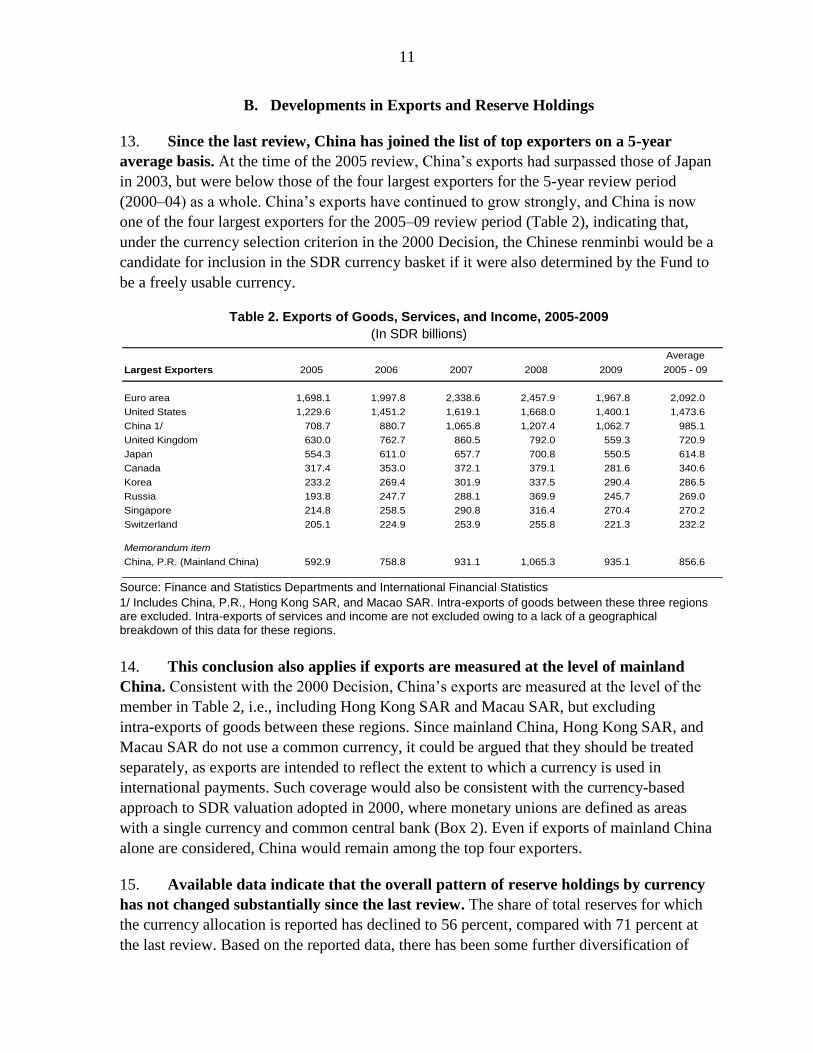
13. Since the last review, China has joined the list of top exporters on a 5-year
average basis. At the time of the 2005 review, China’s exports had surpassed those of Japan
in 2003, but were below those of the four largest exporters for the 5-year review period
(2000–04) as a whole. China’s exports have continued to grow strongly, and China is now
one of the four largest exporters for the 2005–09 review period (Table 2), indicating that,
under the currency selection criterion in the 2000 Decision, the Chinese renminbi would be a
candidate for inclusion in the SDR currency basket if it were also determined by the Fund to
be a freely usable currency.
Table 2. Exports of Goods, Services, and Income, 2005-2009
(In SDR billions)
Source: Finance and Statistics Departments and International Financial Statistics
1/ Includes China, P.R., Hong Kong SAR, and Macao SAR. Intra-exports of goods between these three regions are excluded. Intra-exports of services and income are not excluded owing to a lack of a geographical breakdown of this data for these regions.
14. This conclusion also applies if exports are measured at the level of mainland
China. Consistent with the 2000 Decision, China’s exports are measured at the level of the
member in Table 2, i.e., including Hong Kong SAR and Macau SAR, but excluding
intra-exports of goods between these regions. Since mainland China, Hong Kong SAR, and
Macau SAR do not use a common currency, it could be argued that they should be treated
separately, as exports are intended to reflect the extent to which a currency is used in
international payments. Such coverage would also be consistent with the currency-based
approach to SDR valuation adopted in 2000, where monetary unions are defined as areas
with a single currency and common central bank (Box 2). Even if exports of mainland China
alone are considered, China would remain among the top four exporters.
15. Available data indicate that the overall pattern of reserve holdings by currency
has not changed substantially since the last review. The share of total reserves for which
the currency allocation is reported has declined to 56 percent, compared with 71 percent at
the last review. Based on the reported data, there has been some further diversification of
Average
Largest Exporters 2005 2006 2007 2008 2009 2005 - 09
Euro area 1,698.1 1,997.8 2,338.6 2,457.9 1,967.8 2,092.0
United States 1,229.6 1,451.2 1,619.1 1,668.0 1,400.1 1,473.6
China 1/ 708.7 880.7 1,065.8 1,207.4 1,062.7 985.1
United Kingdom 630.0 762.7 860.5 792.0 559.3 720.9
Japan 554.3 611.0 657.7 700.8 550.5 614.8
Canada 317.4 353.0 372.1 379.1 281.6 340.6
Korea 233.2 269.4 301.9 337.5 290.4 286.5
Russia 193.8 247.7 288.1 369.9 245.7 269.0
Singapore 214.8 258.5 290.8 316.4 270.4 270.2
Switzerland 205.1 224.9 253.9 255.8 221.3 232.2
Memorandum item
China, P.R. (Mainland China) 592.9 758.8 931.1 1,065.3 935.1 856.6

12
foreign reserves, with the share held in U.S. dollars declining by 3.7 percentage points to
62.2 percent from end-2004 to end-2009 (Table 3). This was mostly balanced by an increase
in the share of the euro by 2.6 percentage points to 27.4 percent. Together, the U.S. dollar
and euro continue to account for about 90 percent of reserves for which a currency allocation
is reported. An increase in the share of pound sterling was offset by a similar decline in the
share of the Japanese yen, and the four SDR basket currencies accounted for 96.8 percent of
allocated reserves at end-2009.
Table 3. Composition of Foreign Exchange Reserves, 2004-2010
(In percent)
Source: IMF, Currency Composition of Official Foreign Exchange Reserves (COFER)
1/ Share of total foreign exchange reserves for which the currency is not identified in COFER.
16. The share of other currencies in international reserves rose during the most
recent years, but the COFER database does not offer a further currency breakdown of
these reserves. Looking forward, it may be appropriate to consider expanding the currency
coverage of COFER beyond the four SDR currencies plus the Swiss franc, while taking into
account the additional reporting burden for members. The Statistics Department, which
conducts the COFER survey, is prepared to lead potential further work in this area. Reporting
to COFER is voluntary, nonetheless, a higher reporting rate relative to total foreign exchange
reserves would help ensure the accuracy of reserve composition data used in the
determination of SDR currency weights.
C. International Financial Developments
17. A range of indicators suggest that the four SDR currencies continue to account
for the majority of international financial transactions. Such indicators are relevant to the
freely usable currency requirement for currency selection, and include:
2004 2005 2006 2007 2008 2009 2010
Q2
Share of allocated FX reserves 100.0 100.0 100.0 100.0 100.0 100.0 100.0
U.S. dollars 65.9 66.9 65.5 64.1 64.1 62.2 62.1
Euro 24.8 24.1 25.1 26.3 26.4 27.4 26.5
Pound sterling 3.4 3.6 4.4 4.7 4.0 4.3 4.2
Japanese yen 3.8 3.6 3.1 2.9 3.1 2.9 3.3
Swiss francs 0.2 0.1 0.2 0.2 0.1 0.1 0.1
Other currencies 1.9 1.7 1.8 1.8 2.2 3.1 3.8
Share of unallocated FX reserves 1/ 29.2 34.2 36.9 38.5 42.6 44.1 44.0
13
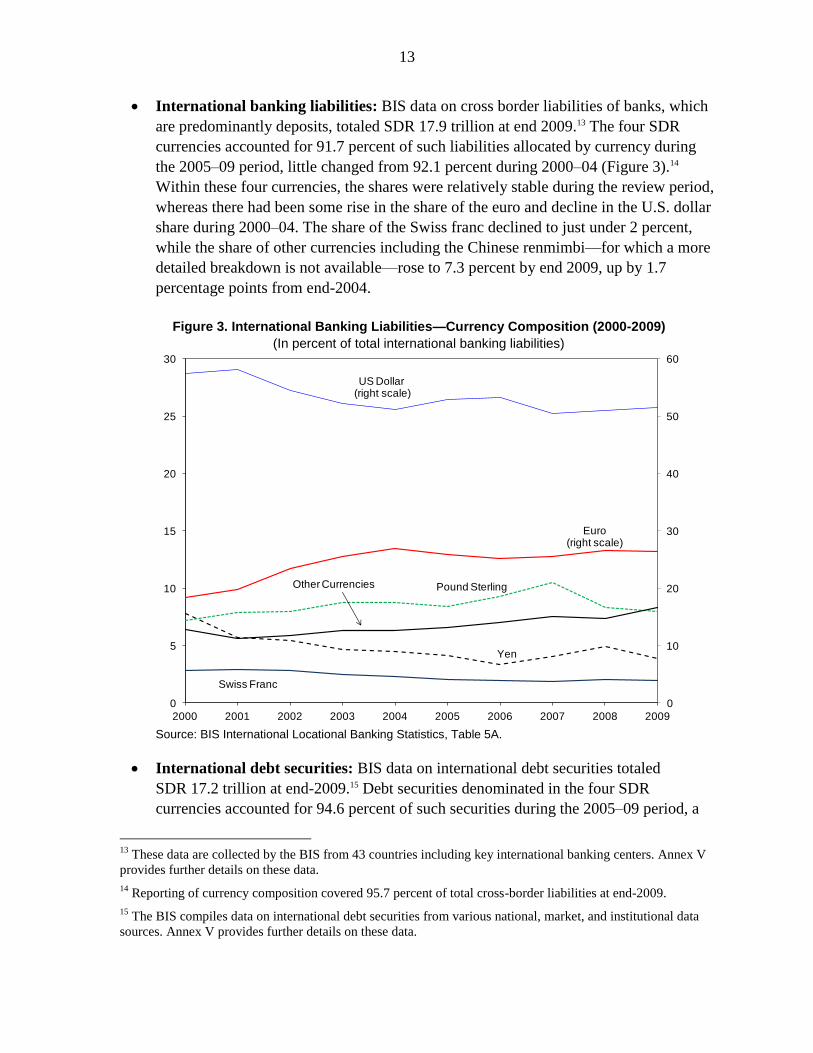
International banking liabilities: BIS data on cross border liabilities of banks, which
are predominantly deposits, totaled SDR 17.9 trillion at end 2009.13 The four SDR
currencies accounted for 91.7 percent of such liabilities allocated by currency during
the 2005–09 period, little changed from 92.1 percent during 2000–04 (Figure 3).14
Within these four currencies, the shares were relatively stable during the review period,
whereas there had been some rise in the share of the euro and decline in the U.S. dollar
share during 2000–04. The share of the Swiss franc declined to just under 2 percent,
while the share of other currencies including the Chinese renmimbi—for which a more
detailed breakdown is not available—rose to 7.3 percent by end 2009, up by 1.7
percentage points from end-2004.
Figure 3. International Banking Liabilities—Currency Composition (2000-2009)
(In percent of total international banking liabilities)
Source: BIS International Locational Banking Statistics, Table 5A.
International debt securities: BIS data on international debt securities totaled
SDR 17.2 trillion at end-2009.15 Debt securities denominated in the four SDR
currencies accounted for 94.6 percent of such securities during the 2005–09 period, a
13
These data are collected by the BIS from 43 countries including key international banking centers. Annex V
provides further details on these data.
14 Reporting of currency composition covered 95.7 percent of total cross-border liabilities at end-2009.
15 The BIS compiles data on international debt securities from various national, market, and institutional data
sources. Annex V provides further details on these data.
0
10
20
30
40
50
60
0
5
10
15
20
25
30
2000 2001 2002 2003 2004 2005 2006 2007 2008 2009
US Dollar(right scale)
Euro (right scale)
Yen
Other Currencies Pound Sterling
Swiss Franc

14
slight decline from 95.4 percent during 2000-04 (Figure 5).16 Within these
four currencies, the shares were relatively stable during the review period, with some
further decline in the share of the Japanese yen. Among other currencies, only the
Swiss franc and the Australian and Canadian dollars exceed 1 percent of international
debt securities, with the remaining 43 currencies for which data are collected
accounting for only about 2 percent of the total. Data for international debt securities
denominated the Chinese renminbi have been reported from June 2005 for bonds and
notes, and accounted for 0.06 percent of international bonds and notes at end- 2009.
Figure 4. International Debt Securities—Currency Composition (2000-2010) 1/
(In percent of total international debt securities)
Source: BIS International Debt Securities Statistics, Tables 13A and 13B.
1/ International bonds and notes plus international money market instruments. Data ends 2010Q1.
18. The four currencies in the SDR basket also dominate turnover in global foreign
exchange markets (Figure 5). The share of the four SDR currencies in total global foreign
exchange turnover has declined since the last review period, from 81.8 percent on average in
2001 and 2004, to 77.6 percent on average in 2007 and 2010.17 Most of this decline is
accounted for by a reduction in the share of turnover of the U.S. dollar. Currencies outside
16
Reporting of currency composition covered 99.95 percent of international debt securities at end-2009.
17 The BIS surveys central banks on a triennial basis regarding foreign exchange and derivatives markets
activity as described in Annex V. Data for 2010 are preliminary, and can be found at:
http://www.bis.org/publ/rpfx10.htm. Final results are to be published in November 2010.
0
5
10
15
20
25
30
35
40
45
50
55
0
2
4
6
8
10
12
14
16
2000 2001 2002 2003 2004 2005 2006 2007 2008 2009 2010
US Dollar(right scale)
Euro (right scale)
Yen
Other Currencies
Pound Sterling
Swiss Franc
CanadianDollar(dashed)
Australian Dollar(solid)
15
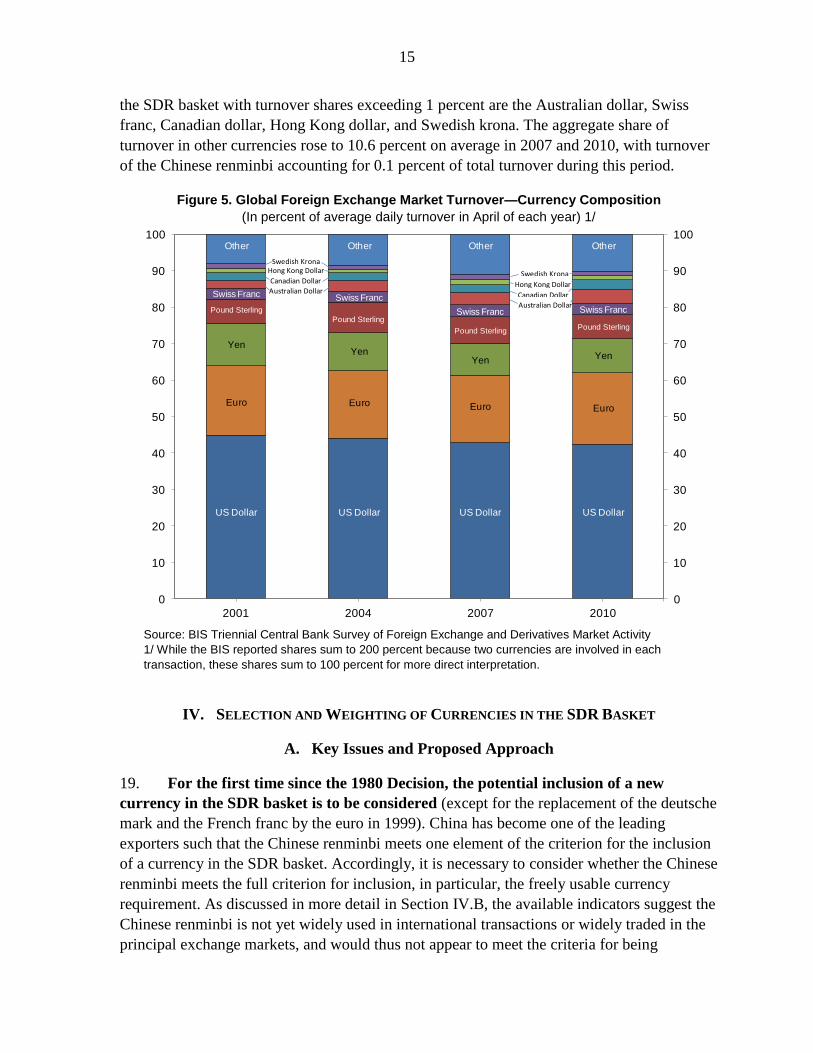
the SDR basket with turnover shares exceeding 1 percent are the Australian dollar, Swiss
franc, Canadian dollar, Hong Kong dollar, and Swedish krona. The aggregate share of
turnover in other currencies rose to 10.6 percent on average in 2007 and 2010, with turnover
of the Chinese renminbi accounting for 0.1 percent of total turnover during this period.
Figure 5. Global Foreign Exchange Market Turnover—Currency Composition
(In percent of average daily turnover in April of each year) 1/
Source: BIS Triennial Central Bank Survey of Foreign Exchange and Derivatives Market Activity
1/ While the BIS reported shares sum to 200 percent because two currencies are involved in each
transaction, these shares sum to 100 percent for more direct interpretation.
IV. SELECTION AND WEIGHTING OF CURRENCIES IN THE SDR BASKET
A. Key Issues and Proposed Approach
19. For the first time since the 1980 Decision, the potential inclusion of a new
currency in the SDR basket is to be considered (except for the replacement of the deutsche
mark and the French franc by the euro in 1999). China has become one of the leading
exporters such that the Chinese renminbi meets one element of the criterion for the inclusion
of a currency in the SDR basket. Accordingly, it is necessary to consider whether the Chinese
renminbi meets the full criterion for inclusion, in particular, the freely usable currency
requirement. As discussed in more detail in Section IV.B, the available indicators suggest the
Chinese renminbi is not yet widely used in international transactions or widely traded in the
principal exchange markets, and would thus not appear to meet the criteria for being
0
10
20
30
40
50
60
70
80
90
100
0
10
20
30
40
50
60
70
80
90
100
2001 2004 2007 2010
US Dollar US Dollar US Dollar US Dollar
EuroEuroEuro
Yen Yen
Swiss Franc
Other
Pound SterlingPound Sterling
Pound Sterling
Pound Sterling
OtherOtherOther
Swiss Franc
Swiss FrancSwiss Franc Australian Dollar
Canadian Dollar
Hong Kong DollarSwedish Krona
Euro
Australian Dollar
Canadian Dollar
Hong Kong Dollar
Swedish Krona
Yen
Yen
16
determined by the Fund to be a freely usable currency at this time. Accordingly, no change in
SDR basket composition is proposed at this review.
20. Given the on-going changes in the international monetary system, however, it
may be appropriate looking forward to review the indicators used to guide future
decisions on the inclusion of new currencies in the SDR basket. The freely usable
currency requirement plays an important role, inter alia, in supporting the status of the SDR
as a supplementary reserve asset (Box 2). The concept has not been examined in depth in
recent periods, however, and was last subject to a detailed review in the late 1970s, with
various indicators proposed by staff for use in that context (Box 4).18 These indicators could
be reviewed in light of the substantial changes in financial markets, the investment practices
of reserve managers, and in the availability of data over the past several years. In addition,
with respect to the export element of the current SDR currency selection criterion, it has long
been recognized that exports may not be a reliable indicator of the use of a currency in
international transactions, so further consideration could be given to whether other indicators
should also play a role. In the case of a member using more than one currency, such work
could also consider whether the coverage of data on exports or other indicators should be at
the level of the member or the economic area issuing and using a particular currency.19
21. Further consideration could also be given to the number of currencies in the
basket. While four currencies are specified in the current SDR valuation decision, the
potential future inclusion of a new currency raises the question of whether it would be added
to the basket or would replace an existing currency.20 Follow-up work could revisit the
considerations underlying past decisions on the number of currencies. For example, the
reduction in the number of currencies from 16 to 5 in 1980 aimed to align the composition of
the SDR currency and interest rate baskets, which required that all currencies have a suitable
interest rate instrument. It was also expected to make it easier for participants in the private
market to cover exchange risks in terms of the SDR, thus improving its acceptability and
encouraging further development of the SDR as a unit of account in the private markets. The
shift from 5 to 4 currencies following the introduction of the euro in 1999 took into
consideration the goal of stability in the currencies included in basket, which argues against
including smaller exporters more likely to have less stable export rankings. The goal of
stability in value of the SDR is another consideration that could be taken into account, which
18
There was no extensive discussion of the relevant indicators when the list of freely usable currencies was last
updated in 1998, as the euro was treated as having the same characteristics as the currencies it replaced, i.e., the
deutsche mark and French franc.
19 This choice would also have implications for the coverage of variables used in determining currency weights.
20 Under the current decision, a new currency meeting the requirements for inclusion would be added to the
basket in replacement of another currency only if at the time of determination its relevant exports exceeded
those of the currency to be replaced by more than 1 percent.
17
could argue against the inclusion of currencies with a high correlation with existing basket
currencies, where such correlations may reflect the exchange rate regime of the member
issuing that currency or other factors.
Box 4. Assessing Freely Usable Currencies
Article XXX(f) defines a freely usable currency as ―a member’s currency that the Fund determines (i)
is, in fact, widely used to make payments for international transactions, and (ii) is widely traded in the
principal exchange markets.‖ Rule O-3 provides that the Fund shall determine the currencies that are
freely usable in accordance with Article XXX(f) and that it shall consult a member before placing its
currency on, or removing it from, the list of freely usable currencies.
In 1977, staff proposed the following criteria for determining which currencies are freely usable:
the assessment of the use of a currency for international transactions should be based on the
extent to which trade in goods and services is paid for in that currency, as well as on the relative
volume of capital transactions denominated in that currency. Given the limited data availability,
however, the staff suggested to use the shares in members’ exports of goods and services and the
currency denomination of official reserve holdings as the relevant indicators of the degree to
which a currency was widely used in international payments;
the assessment of whether a currency was widely traded in the principal foreign exchange
markets should be based on the volume of transactions, the existence of forward markets, and
the spread between buying and selling quotations for transactions denominated in that currency.
A sufficiently deep and broad foreign exchange market was considered as being necessary to
ensure that a member country would be able to sell or buy a sizable amount of the currency at
any time without occurrence of an appreciable change in the exchange rate in the transaction.
Following discussion of the staff paper, the Executive Board determined, in 1978, that the deutsche
mark, French franc, Japanese yen, pound sterling, and the U.S. dollar were freely usable currencies. In
1998, the euro was added to the list of freely usable currencies and the deutsche mark and French
franc were removed from the list.
22. In this context, it could also be beneficial to review some other aspects of SDR
valuation and the SDR interest rate. As discussed in Annex III, under the current method
of determining currency weights, the respective role of trade and financial factors arise
implicitly from data limited to exports and reserves, and alternative approaches could be
considered. In addition, some SDR users have noted the difficulty of replicating or hedging
the official SDR interest rate in financial markets—see section IV.D and Annex IV—and the
18
work program could also consider the desirability of aligning the frequency of adjustments in
the official SDR interest rate and the maturity of the underlying financial instruments.
23. Staff proposes that these issues be considered in 2011, following the completion
of the current review. This would allow time for a more in-depth analysis. While such a
work program is distinct from the ongoing discussions on the reform of the international
monetary system, it could also take account of these discussions.21 Any revisions in
methodology coming out of this work could be agreed well in advance of the next SDR
valuation review, with a view to enhancing the predictability of future decisions for SDR
users and financial market participants.
B. SDR Currency Basket Composition
24. This section proposes currencies to be included in the SDR basket based on the
existing criterion for currency selection. As set out in more detail in section II, under the
2000 Decision the value of the SDR is determined on the basis of the four currencies issued
by members (or by monetary unions including Fund members) whose exports had the largest
value during the five preceding years, and which have been determined by the Fund to be
freely usable currencies in accordance with Article XXX(f). As the Chinese renminbi is
issued by a member (monetary union) with the third largest exports in 2005–09 (Table 2), it
is necessary to consider whether the Chinese renminbi is a freely usable currency, guided by
the criteria in Box 4.
25. Recent developments show no major changes in the international use and
trading of currencies in the world economy. Regarding the currencies used in payment for
international trade in goods and services, timely and comprehensive data are not available,
but based on cross-country data for 2003, the U.S. dollar and the euro account for most
invoicing of exports (Box III.1). As discussed above, the four SDR basket currencies
continue to predominate in relation to international financial transactions, based on data for
international reserves, international bank liabilities, and international debt securities. With
respect to the volume of transactions in the principal foreign exchange markets, the SDR
currencies also account for the bulk of turnover in the global foreign exchange market.
26. At this stage, the Chinese renminbi would not appear to meet the criteria under
the Articles of Agreement for being determined by the Fund to be a freely usable
currency. The Chinese authorities have recently taken a number of steps to facilitate the
international use of the renminbi, including allowing central banks to hold reserve assets in
renminbi, and the volume of China’s international trade settled in renminbi is rising
(Annex II). However, the indicators discussed under section III above suggest that the
Chinese renminbi is not yet widely used to make payments for international transactions, or
widely traded in the principal exchange markets.
21
A forthcoming paper will discuss the potential role for the SDR in enhancing international monetary stability.
19
27. Accordingly, staff proposes that the composition of the SDR currency basket
remain unchanged. The SDR basket would therefore continue to comprise the U.S. dollar,
the euro, the pound sterling and the Japanese yen, as these currencies are issued by the
members or monetary unions with the four largest export values in 2005–09 whose
currencies have also been determined by the Fund to be freely usable currencies.22
C. Currency Weights and Rounding of Relative Weights
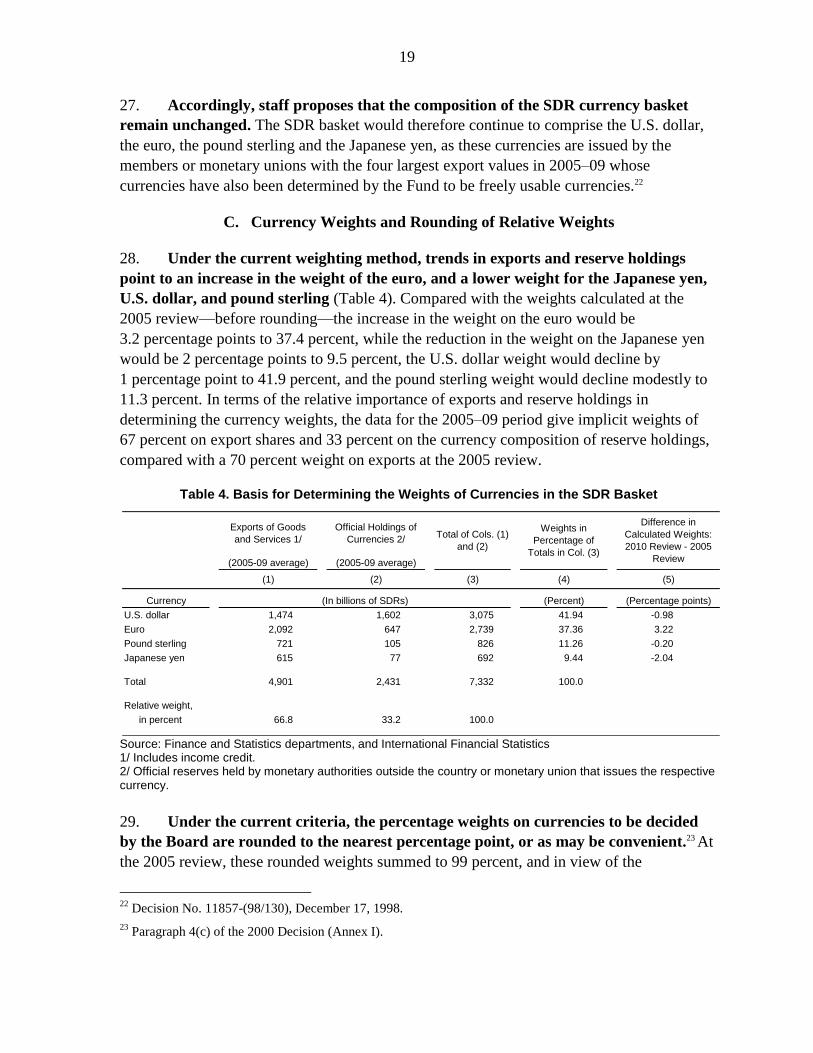
28. Under the current weighting method, trends in exports and reserve holdings
point to an increase in the weight of the euro, and a lower weight for the Japanese yen,
U.S. dollar, and pound sterling (Table 4). Compared with the weights calculated at the
2005 review—before rounding—the increase in the weight on the euro would be
3.2 percentage points to 37.4 percent, while the reduction in the weight on the Japanese yen
would be 2 percentage points to 9.5 percent, the U.S. dollar weight would decline by
1 percentage point to 41.9 percent, and the pound sterling weight would decline modestly to
11.3 percent. In terms of the relative importance of exports and reserve holdings in
determining the currency weights, the data for the 2005–09 period give implicit weights of
67 percent on export shares and 33 percent on the currency composition of reserve holdings,
compared with a 70 percent weight on exports at the 2005 review.
Table 4. Basis for Determining the Weights of Currencies in the SDR Basket
Source: Finance and Statistics departments, and International Financial Statistics 1/ Includes income credit. 2/ Official reserves held by monetary authorities outside the country or monetary union that issues the respective currency.
29. Under the current criteria, the percentage weights on currencies to be decided
by the Board are rounded to the nearest percentage point, or as may be convenient.23 At
the 2005 review, these rounded weights summed to 99 percent, and in view of the
22
Decision No. 11857-(98/130), December 17, 1998.
23 Paragraph 4(c) of the 2000 Decision (Annex I).
(2005-09 average) (2005-09 average)
(1) (2) (3) (4) (5)
U.S. dollar 1,474 1,602 3,075 41.94 -0.98
Euro 2,092 647 2,739 37.36 3.22
Pound sterling 721 105 826 11.26 -0.20
Japanese yen 615 77 692 9.44 -2.04
Total 4,901 2,431 7,332 100.0
Relative weight,
in percent 66.8 33.2 100.0
(Percent) (Percentage points)Currency (In billions of SDRs)
Exports of Goods
and Services 1/
Official Holdings of
Currencies 2/Total of Cols. (1)
and (2)
Weights in
Percentage of
Totals in Col. (3)
Difference in
Calculated Weights:
2010 Review - 2005
Review
20
predominant importance of the U.S. dollar indicated by the supplementary financial
variables, it was decided to allocate the remaining 1 percentage point to the U.S. dollar,
bringing its weight to 44 percent from a calculated weight of 42.92 percent, noting that this
approach had the smallest impact in relative terms on the resulting weights.24 A number of
Directors expressed concern about this method of rounding. If it were applied at this review,
the weights would again sum to 99 percent, leaving 1 percentage point to be allocated.
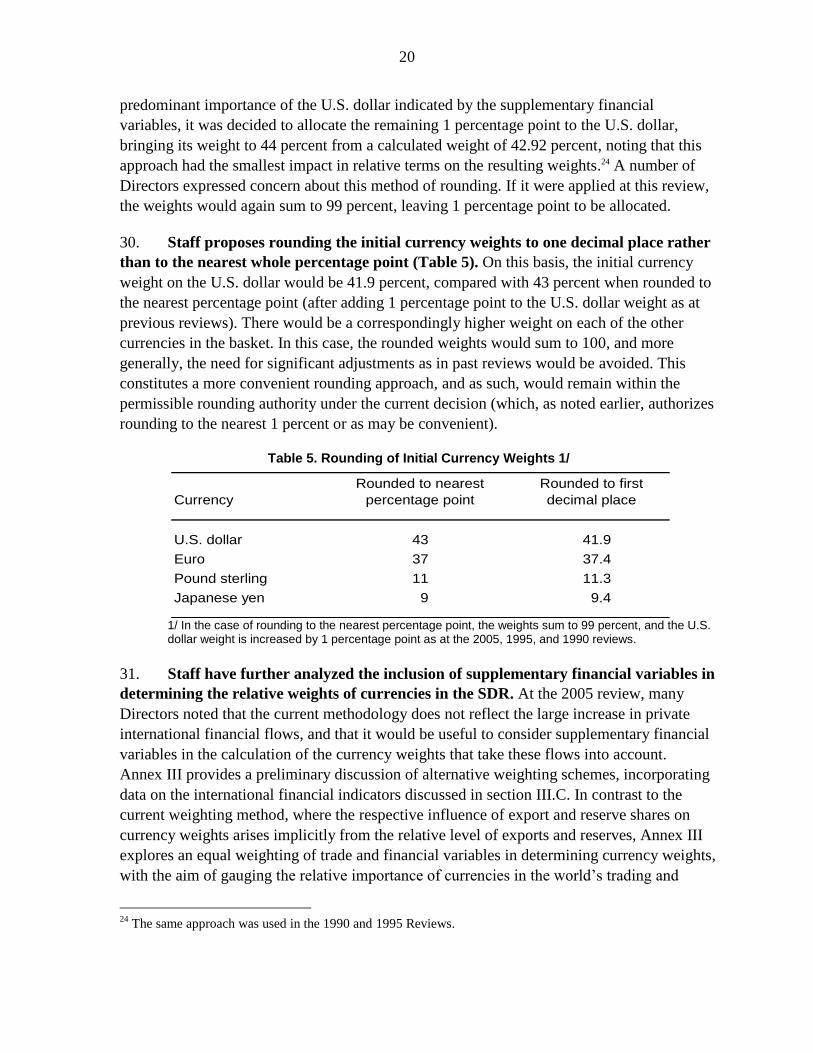
30. Staff proposes rounding the initial currency weights to one decimal place rather
than to the nearest whole percentage point (Table 5). On this basis, the initial currency
weight on the U.S. dollar would be 41.9 percent, compared with 43 percent when rounded to
the nearest percentage point (after adding 1 percentage point to the U.S. dollar weight as at
previous reviews). There would be a correspondingly higher weight on each of the other
currencies in the basket. In this case, the rounded weights would sum to 100, and more
generally, the need for significant adjustments as in past reviews would be avoided. This
constitutes a more convenient rounding approach, and as such, would remain within the
permissible rounding authority under the current decision (which, as noted earlier, authorizes
rounding to the nearest 1 percent or as may be convenient).
Table 5. Rounding of Initial Currency Weights 1/
1/ In the case of rounding to the nearest percentage point, the weights sum to 99 percent, and the U.S. dollar weight is increased by 1 percentage point as at the 2005, 1995, and 1990 reviews.
31. Staff have further analyzed the inclusion of supplementary financial variables in
determining the relative weights of currencies in the SDR. At the 2005 review, many
Directors noted that the current methodology does not reflect the large increase in private
international financial flows, and that it would be useful to consider supplementary financial
variables in the calculation of the currency weights that take these flows into account.
Annex III provides a preliminary discussion of alternative weighting schemes, incorporating
data on the international financial indicators discussed in section III.C. In contrast to the
current weighting method, where the respective influence of export and reserve shares on
currency weights arises implicitly from the relative level of exports and reserves, Annex III
explores an equal weighting of trade and financial variables in determining currency weights,
with the aim of gauging the relative importance of currencies in the world’s trading and
24
The same approach was used in the 1990 and 1995 Reviews.
Currency
Rounded to nearest
percentage point
Rounded to first
decimal place
U.S. dollar 43 41.9
Euro 37 37.4
Pound sterling 11 11.3
Japanese yen 9 9.4
21
financial system, while not giving rise to undue influence of an individual currency on the
value of the SDR. The proposed follow-up work on this topic could address Directors’
comments on the analysis presented in Annex III and some remaining data issues. 25 Such
work could also consider whether additional indicators to exports of goods and services
should be used to reflect the relative importance of currencies in the world’s trading system.
D. Currency Amounts in the SDR Basket
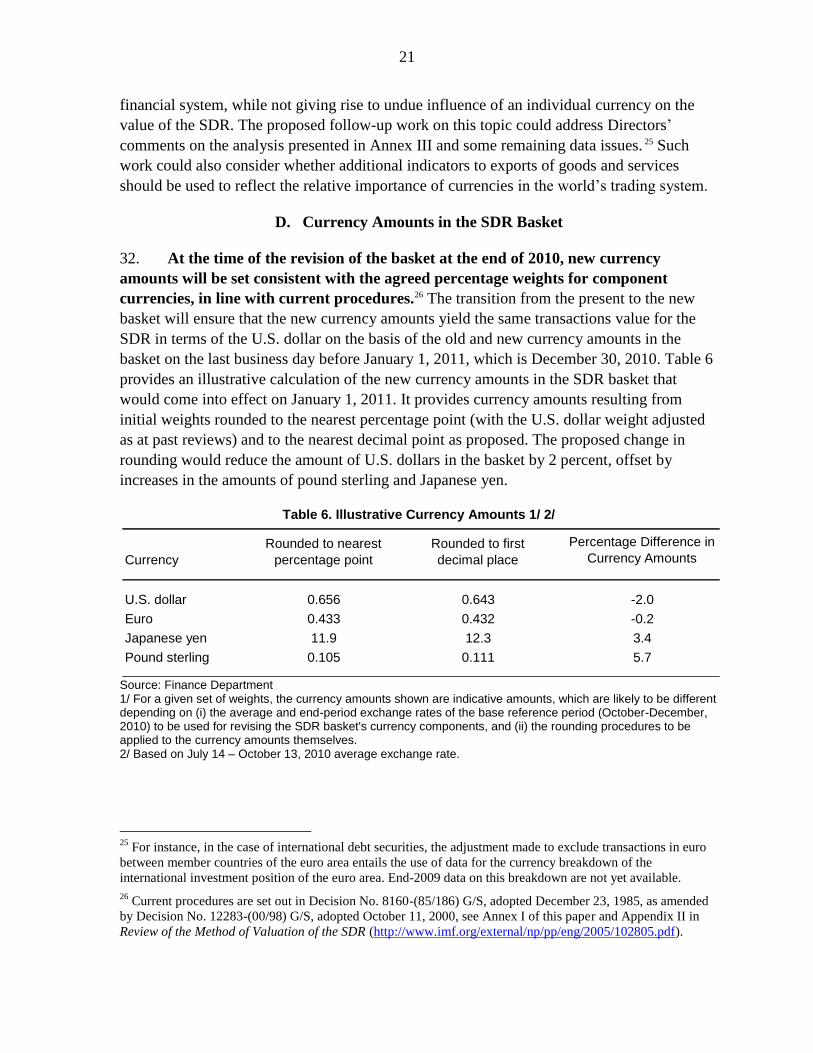
32. At the time of the revision of the basket at the end of 2010, new currency
amounts will be set consistent with the agreed percentage weights for component
currencies, in line with current procedures.26 The transition from the present to the new
basket will ensure that the new currency amounts yield the same transactions value for the
SDR in terms of the U.S. dollar on the basis of the old and new currency amounts in the
basket on the last business day before January 1, 2011, which is December 30, 2010. Table 6
provides an illustrative calculation of the new currency amounts in the SDR basket that
would come into effect on January 1, 2011. It provides currency amounts resulting from
initial weights rounded to the nearest percentage point (with the U.S. dollar weight adjusted
as at past reviews) and to the nearest decimal point as proposed. The proposed change in
rounding would reduce the amount of U.S. dollars in the basket by 2 percent, offset by
increases in the amounts of pound sterling and Japanese yen.
Table 6. Illustrative Currency Amounts 1/ 2/
Source: Finance Department 1/ For a given set of weights, the currency amounts shown are indicative amounts, which are likely to be different depending on (i) the average and end-period exchange rates of the base reference period (October-December, 2010) to be used for revising the SDR basket's currency components, and (ii) the rounding procedures to be applied to the currency amounts themselves. 2/ Based on July 14 – October 13, 2010 average exchange rate.
25
For instance, in the case of international debt securities, the adjustment made to exclude transactions in euro
between member countries of the euro area entails the use of data for the currency breakdown of the
international investment position of the euro area. End-2009 data on this breakdown are not yet available.
26 Current procedures are set out in Decision No. 8160-(85/186) G/S, adopted December 23, 1985, as amended
by Decision No. 12283-(00/98) G/S, adopted October 11, 2000, see Annex I of this paper and Appendix II in
Review of the Method of Valuation of the SDR (http://www.imf.org/external/np/pp/eng/2005/102805.pdf).
Currency
Rounded to nearest
percentage point
Rounded to first
decimal place
Percentage Difference in
Currency Amounts
U.S. dollar 0.656 0.643 -2.0
Euro 0.433 0.432 -0.2
Japanese yen 11.9 12.3 3.4
Pound sterling 0.105 0.111 5.7

22
V. REVIEW OF FINANCIAL INSTRUMENTS IN THE SDR INTEREST RATE BASKET
33. The Executive Board has agreed in previous reviews that the financial
instruments in the SDR interest rate basket should:
be broadly representative of the range of financial instruments that are actually available
to investors in a particular currency, and the interest rate on the instrument should be
responsive to changes in underlying credit conditions in the corresponding money
market; and
have risk characteristics that are similar to the official standing of the SDR itself,
i.e., have a credit risk profile of the highest quality, fully comparable to that of
government paper available in the market or, in the absence of appropriate official paper,
comparable to the credit risk on prime financial instruments. Instruments should also
reflect the actual reserve asset choice of reserve managers, for example, as regards the
form of the financial instrument, its liquidity, and maturity.
34. The benchmark rates currently used as representative interest rates for the four
currencies are as follows:
U.S. dollar: Three-month U.S. Treasury bills;
Euro: Three-month Eurepo;
Japanese yen: Three-month Japanese Treasury Discount Bill; and
Pound sterling: Three-month U.K. Treasury bills.
The yields on these instruments are used to calculate the SDR interest rate for each week
(Box 5). Developments in the SDR interest rate since the 2005 review are shown in Figure 6.
35. No change in these benchmark interest rates is proposed. Staff has consulted with
the authorities issuing the currencies in the SDR basket to determine the appropriate
benchmark rates to use in the calculation of the SDR interest rate. No change in instruments
is deemed appropriate by the relevant authorities at this time; staff concur.
The authorities of the United States consider that the three-month U.S. Treasury bill
continues to meet the criteria applied by the Executive Board for the selection of
financial instruments in the SDR interest rate basket, as it is broadly representative of the
range of financial instruments that are actually available to investors in U.S. dollars, has
risk characteristics similar to the SDR, and continues to reflect actual reserve asset
choices by reserve managers.
The European Central Bank (ECB) considers that the three-month Eurepo continues to
meet the criteria applied by the Executive Board for the selection of financial
instruments in the SDR basket. Although not reflecting the characteristics of an

23
Figure 6. Interest Rates on the SDR and its Financial Instrument Components, 2005–10
(In percent)
Source: Finance Department
1/ Prior to February 2009, this was designated as the thirteen-week Government Financing Bill.
0.0
1.0
2.0
3.0
4.0
5.0
6.0
7.0
0.0
1.0
2.0
3.0
4.0
5.0
6.0
7.0
Jan-05 Jan-06 Jan-07 Jan-08 Jan-09 Jan-10
Euro Area
(3-Mo. Eurepo)
United Kingdom
(3-Mo. T-Bill Rate)
SDR Interest
Rate
United States
(3-Mo. T-Bill Rate)
Japan
(3-Mo. T-Bill Rate 1/)
Box 5. SDR Interest Rate Calculation
For the week of September 13, 2010 to September 19, 2010
(Data as of Friday, September 10, 2010)
Currency
Currency amount
under Rule O-1
(A)
Exchange rate
against the SDR 1/
(B)
Interest rate 2/
(C)
Product
(A) x (B) x (C)
U.S. Dollar 0.6320 0.661143 0.1400 0.0585
Euro 0.4100 0.841304 0.4745 0.1637
Japanese yen 18.4000 0.00786139 0.1100 0.0159
Pound Sterling 0.0903 1.02186 0.4900 0.0452
Total 0.2833
SDR Interest Rate 3/ 0.28
1/ SDR per currency rates are based on the representative exchange rates used in the SDR valuation basket.
2/ Interest rate expressed as an equivalent annual bond yield: three-month U.S. Treasury bills, three-month Eurepo; three-
month Japanese Treasury Discount bills; and three-month UK Treasury bills.
3/ IMF Rule T-1(b) (Annex I(c)) specifies that the SDR interest rate for each weekly period commencing each Monday shall
be equal to the combined market interest rate as determined by the Fund. Under IMF Rule T-1(c), the combined market
interest rate is the sum, as of the Friday preceding each weekly period, rounded to the two nearest decimal places, of the
products that result from multiplying each yield or rate listed above by the value in terms of SDRs of the amount of the
corresponding currency specified in Rule O-1. If a yield or rate is not available for a particular Friday, the calculation shall
be made on the basis of the latest available yield or rate.
24
underlying treasury instrument, the ECB considers that Eurepo rates remain the
benchmark of choice for secured money market transactions in the euro area and
represent funding conditions for the euro area as a whole. Moreover, the European Repo
Council has updated the definition of the Eurepo rates in order to improve the clarity and
precision of the Eurepo benchmark rates, which, while leaving the structure of the rates
unchanged, has made Eurepo rates largely immune to the volatility experienced in some
segments of the euro area government bond markets.27 Accordingly, the ECB deems that
the Eurepo rate remains the most appropriate benchmark rate for the secured money
market in the euro area, and remains the most appropriate euro interest rate for inclusion
in the SDR basket.
The authorities of the United Kingdom assess that the three-month UK Treasury bill
satisfies the selection criteria for financial instruments in the SDR interest rate basket.
The UK Treasury bill market remains liquid and the associated interest rate
representative of changes in credit conditions. The instrument has a credit risk profile of
the highest quality, and reflects the actual reserve asset choice of reserve managers.
The Japanese authorities consider that the three-month Japanese Treasury Discount Bill
continues to meet the existing criteria for inclusion in the SDR interest rate basket.28
They view this instrument as the appropriate benchmark interest rate to be used for the
Japanese yen in calculating the SDR interest rate.
36. As noted earlier, some SDR users have pointed out that the official SDR interest
rate cannot be precisely replicated in financial markets. This is because the maturity of
the underlying instruments (3 months) differs from the frequency of rate adjustments
(weekly). Although all instruments used in the construction of the SDR interest rate are
readily available in the market, this difference makes it difficult to precisely mirror the
income stream of the official SDR interest rate (for those wishing to be ―long‖ the SDR) or to
offset charges due to the Fund (for borrowing members or those wishing to hedge SDR
exposures). Annex IV provides a preliminary discussion of possible alternative approaches to
aligning the maturity of the instruments underpinning the SDR interest rate with the
adjustment frequency. Follow-up work on this issue could take into account Directors’ views,
with the goal of improving the attractiveness of the SDR as a reserve asset.
27
The Eurepo Code of Conduct was revised in December 2008, to redefine the benchmark as: ―Eurepo is the
rate at which one prime bank offers funds in Euro to another prime bank if in exchange the former receives
from the latter the best collateral in terms of rating and liquidity within the Euro GC basket.‖ This clarified that
the Eurepo rate is secured on the best quality collateral, principally German and French government paper. See
http://www.euribor-ebf.eu/assets/files/D0196%20%20Eurepo%20Revision.pdf.
28 The three-month Japanese Treasury Discount Bill replaced the thirteen-week Japanese Government financing
bill in February 2009, reflecting a change in official designation.

25
VI. TRANSITION TO A NEW BASKET, THE NEXT REVIEW, AND ISSUES FOR DISCUSSION
37. From an operational perspective, it is desirable to provide adequate notice to
SDR users, as well as members with outstanding loans to the Fund, of the new weights
and features of the new SDR valuation and interest rate baskets. Accordingly, the
Executive Board has typically taken its decision well in advance of the date when the revised
SDR valuation and interest baskets become effective. As is customary, the Board will receive
further illustrative currency amounts during December. The decision on weights, and the
further illustrative currency amounts in December, will also be published.
38. It is proposed that the next review of the SDR valuation basket take place by
2015. Thus, there would be no change in the 2000 Decision with respect to the five-year
frequency for reviewing the SDR valuation basket and adjusting weights as necessary. The
regular frequency, with a significant period of stability between reviews, has provided
certainty and predictability to the benefit of users of the SDR and SDR-denominated assets.
Nonetheless, as Directors agreed at the 2005 Review, the Board could decide to complete the
review at an earlier date if warranted by financial developments in the interim. Such a
decision could also take account of the results of any follow-up work on SDR valuation.
39. Directors may wish to address the following issues in their comments:
Do Directors support keeping the currencies included in the SDR basket unchanged?
Do Directors support the proposed initial currency weights, including the proposal for
rounding the initial currency weights to one decimal place rather than to the nearest
whole percentage point?
Do Directors agree with the benchmark interest rates in the SDR interest rate basket?
Do Directors support the proposal for a work program on the SDR valuation and interest
rate baskets to be initiated in 2011 following this review?
o Regarding the determination of SDR currency weights, do Directors have
comments on the possibility for an equal weighting of trade and financial
indicators, or on the financial indicators constructed in Annex III?
o Would Directors support consideration of expanding the currency coverage of the
COFER database, while taking into account the reporting burden on members?
o Do Directors have views on the desirability of further work on aligning the
maturity of the instruments underpinning the official SDR interest rate with the
frequency of adjustments in that rate?
26
PROPOSED DECISION
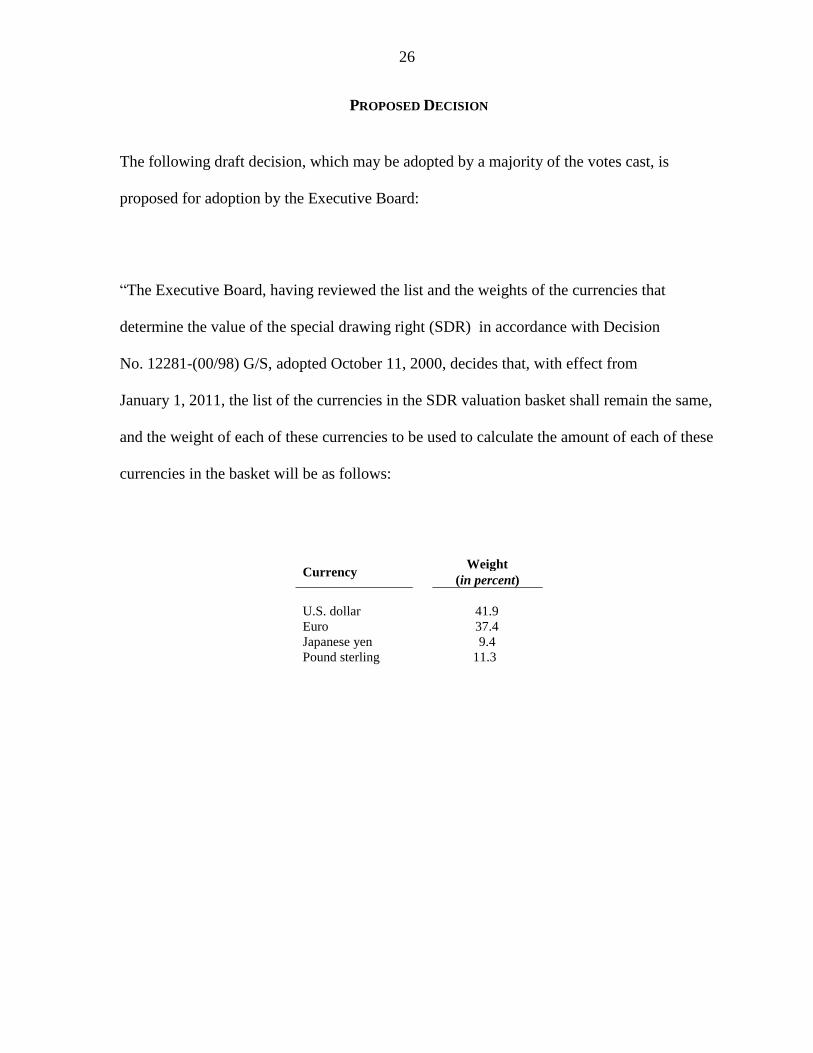
The following draft decision, which may be adopted by a majority of the votes cast, is
proposed for adoption by the Executive Board:
―The Executive Board, having reviewed the list and the weights of the currencies that
determine the value of the special drawing right (SDR) in accordance with Decision
No. 12281-(00/98) G/S, adopted October 11, 2000, decides that, with effect from
January 1, 2011, the list of the currencies in the SDR valuation basket shall remain the same,
and the weight of each of these currencies to be used to calculate the amount of each of these
currencies in the basket will be as follows:
Currency Weight
(in percent)
U.S. dollar 41.9
Euro 37.4
Japanese yen 9.4
Pound sterling 11.3
27
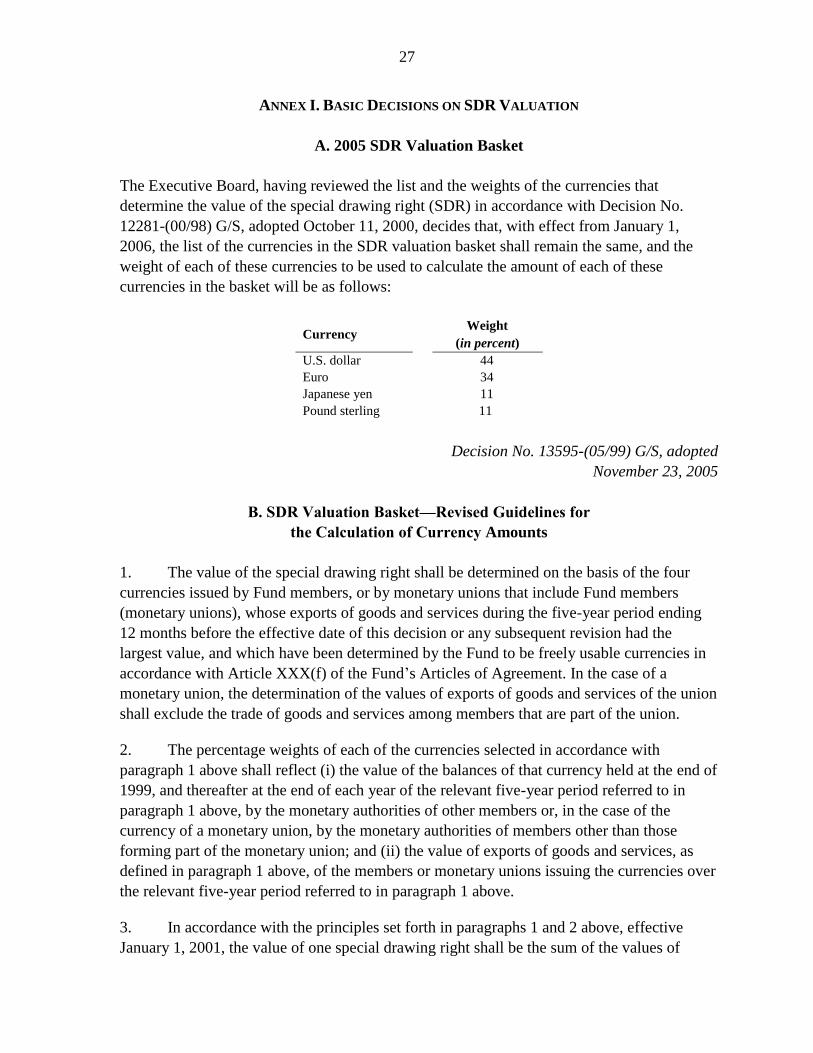
ANNEX I. BASIC DECISIONS ON SDR VALUATION
A. 2005 SDR Valuation Basket
The Executive Board, having reviewed the list and the weights of the currencies that
determine the value of the special drawing right (SDR) in accordance with Decision No.
12281-(00/98) G/S, adopted October 11, 2000, decides that, with effect from January 1,
2006, the list of the currencies in the SDR valuation basket shall remain the same, and the
weight of each of these currencies to be used to calculate the amount of each of these
currencies in the basket will be as follows:
Currency Weight
(in percent)
U.S. dollar 44
Euro 34
Japanese yen 11
Pound sterling 11
Decision No. 13595-(05/99) G/S, adopted
November 23, 2005
B. SDR Valuation Basket—Revised Guidelines for
the Calculation of Currency Amounts
1. The value of the special drawing right shall be determined on the basis of the four
currencies issued by Fund members, or by monetary unions that include Fund members
(monetary unions), whose exports of goods and services during the five-year period ending
12 months before the effective date of this decision or any subsequent revision had the
largest value, and which have been determined by the Fund to be freely usable currencies in
accordance with Article XXX(f) of the Fund’s Articles of Agreement. In the case of a
monetary union, the determination of the values of exports of goods and services of the union
shall exclude the trade of goods and services among members that are part of the union.
2. The percentage weights of each of the currencies selected in accordance with
paragraph 1 above shall reflect (i) the value of the balances of that currency held at the end of
1999, and thereafter at the end of each year of the relevant five-year period referred to in
paragraph 1 above, by the monetary authorities of other members or, in the case of the
currency of a monetary union, by the monetary authorities of members other than those
forming part of the monetary union; and (ii) the value of exports of goods and services, as
defined in paragraph 1 above, of the members or monetary unions issuing the currencies over
the relevant five-year period referred to in paragraph 1 above.
3. In accordance with the principles set forth in paragraphs 1 and 2 above, effective
January 1, 2001, the value of one special drawing right shall be the sum of the values of
28
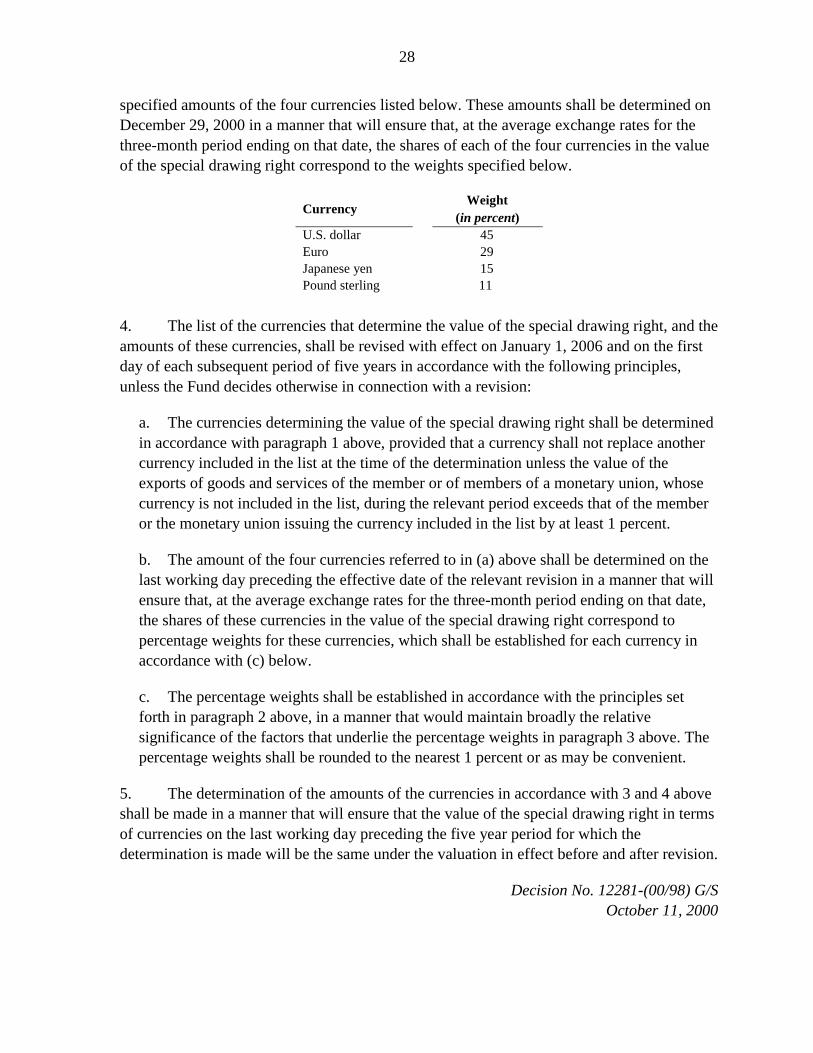
specified amounts of the four currencies listed below. These amounts shall be determined on
December 29, 2000 in a manner that will ensure that, at the average exchange rates for the
three-month period ending on that date, the shares of each of the four currencies in the value
of the special drawing right correspond to the weights specified below.
Currency Weight
(in percent)
U.S. dollar 45
Euro 29
Japanese yen 15
Pound sterling 11
4. The list of the currencies that determine the value of the special drawing right, and the
amounts of these currencies, shall be revised with effect on January 1, 2006 and on the first
day of each subsequent period of five years in accordance with the following principles,
unless the Fund decides otherwise in connection with a revision:
a. The currencies determining the value of the special drawing right shall be determined
in accordance with paragraph 1 above, provided that a currency shall not replace another
currency included in the list at the time of the determination unless the value of the
exports of goods and services of the member or of members of a monetary union, whose
currency is not included in the list, during the relevant period exceeds that of the member
or the monetary union issuing the currency included in the list by at least 1 percent.
b. The amount of the four currencies referred to in (a) above shall be determined on the
last working day preceding the effective date of the relevant revision in a manner that will
ensure that, at the average exchange rates for the three-month period ending on that date,
the shares of these currencies in the value of the special drawing right correspond to
percentage weights for these currencies, which shall be established for each currency in
accordance with (c) below.
c. The percentage weights shall be established in accordance with the principles set
forth in paragraph 2 above, in a manner that would maintain broadly the relative
significance of the factors that underlie the percentage weights in paragraph 3 above. The
percentage weights shall be rounded to the nearest 1 percent or as may be convenient.
5. The determination of the amounts of the currencies in accordance with 3 and 4 above
shall be made in a manner that will ensure that the value of the special drawing right in terms
of currencies on the last working day preceding the five year period for which the
determination is made will be the same under the valuation in effect before and after revision.
Decision No. 12281-(00/98) G/S
October 11, 2000

29
C. SDR Valuation Basket—Guidelines for the Calculation of Currency Amounts
1. Under all circumstances, the currency units will be determined in a manner which
would ensure that the value of the SDR calculated on December 31 on the basis of the new
basket will be the same as that actually prevailing on that day.
2. The currency amounts calculated for the new basket will be expressed in two
significant digits provided that the deviation of the percentage share of each currency in the
value of the SDR, resulting from the application of the average exchange rates for October–
December, from the percentage weight as determined under paragraph 4(c) of Executive
Board Decision No. 12281-(00/98) G/S, adopted October 11, 2000 is the minimum on
average and will not exceed one half percentage point for any currency.
3. If a solution cannot be obtained by the application of the principles set forth in
(2) above, the calculation shall be made applying the same principles but expressing the
amount of each currency in three significant digits, and if no solution is found with three
significant digits then the calculation shall be made applying the same principles but
expressing the amount of each currency in four significant digits.
4. If more than one solution is found in the calculation at the level of two, three, or four
significant digits, the solution that has the smallest average deviation will be employed.
Decision No. 8160-(85/186) G/S,
adopted December 23, 1985, as amended by Decision No. 12283-(00/98) G/S, adopted
October 11, 2000
C. T—Interest, Charges, and Assessments in Respect of SDRs
T.1
(a) Interest and charges in respect of SDRs shall accrue daily at the rate referred to in
(b) below. The amount that has accrued during each quarter of the financial year of the Fund
shall be paid promptly as of the beginning of the following quarter. The accounts of
participants shall be credited with the excess of interest due over charges or debited with the
excess of charges over the interest due. The accounts of holders that are not participants shall
be credited with the interest due.
(b) The rate of interest on holdings of SDRs for each weekly period commencing each
Monday shall be equal to the combined market interest rate as determined by the Fund at the
beginning of the period in the manner described in (c) below.
(c) The combined market interest rate shall be the sum, rounded to the two nearest decimal
places, of the products that result from multiplying each yield or rate listed below, expressed
as an equivalent annual bond yield, for the preceding Friday by the value in terms of the
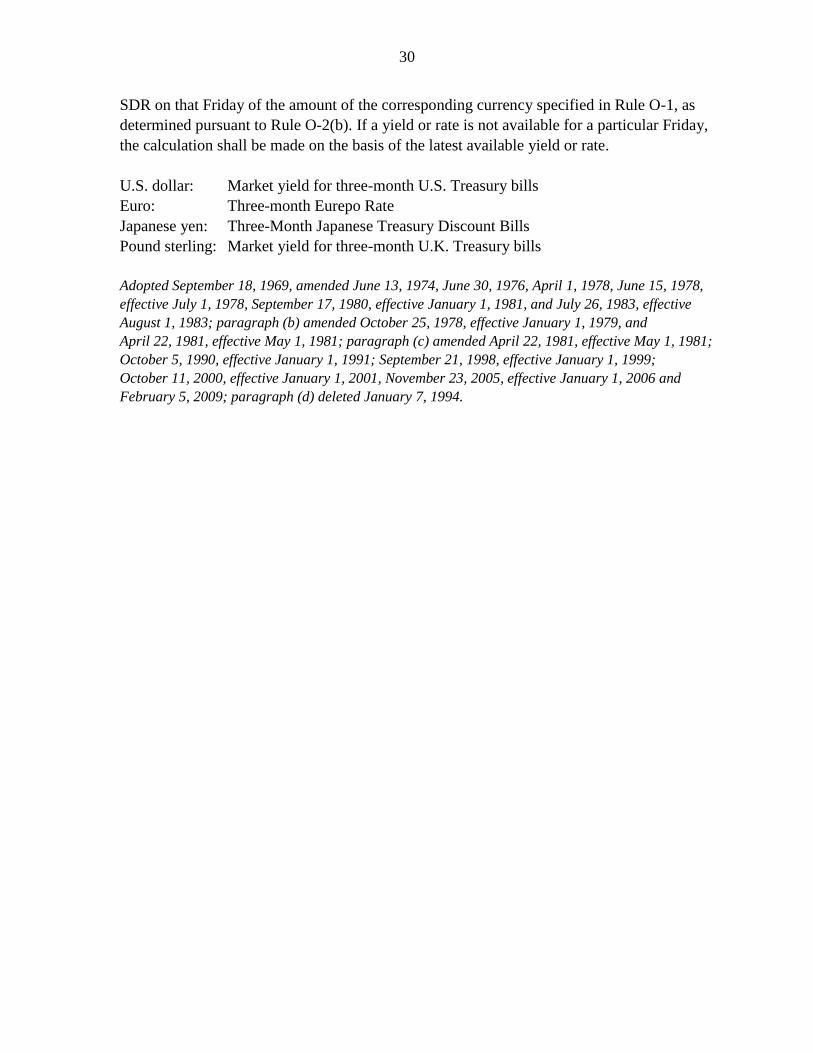
30
SDR on that Friday of the amount of the corresponding currency specified in Rule O-1, as
determined pursuant to Rule O-2(b). If a yield or rate is not available for a particular Friday,
the calculation shall be made on the basis of the latest available yield or rate.
U.S. dollar: Market yield for three-month U.S. Treasury bills
Euro: Three-month Eurepo Rate
Japanese yen: Three-Month Japanese Treasury Discount Bills
Pound sterling: Market yield for three-month U.K. Treasury bills
Adopted September 18, 1969, amended June 13, 1974, June 30, 1976, April 1, 1978, June 15, 1978,
effective July 1, 1978, September 17, 1980, effective January 1, 1981, and July 26, 1983, effective
August 1, 1983; paragraph (b) amended October 25, 1978, effective January 1, 1979, and
April 22, 1981, effective May 1, 1981; paragraph (c) amended April 22, 1981, effective May 1, 1981;
October 5, 1990, effective January 1, 1991; September 21, 1998, effective January 1, 1999;
October 11, 2000, effective January 1, 2001, November 23, 2005, effective January 1, 2006 and
February 5, 2009; paragraph (d) deleted January 7, 1994.
31
ANNEX II. THE RENMINBI—EXCHANGE CONTROLS AND RECENT DEVELOPMENTS
China maintains exchange controls on most capital transactions as summarized in section A.
In recent years the Chinese authorities have taken a range of steps to facilitate the
international use of the renminbi (RMB), as discussed in section B.
A. Exchange Controls
China imposes repatriation requirements on proceeds from exports, invisible
transactions, and current transfers; the previous surrender requirement has been
mostly lifted. Since 2007, all enterprises (domestic institutions) may keep their foreign
exchange revenue from current account operations, according to their operational needs, in
their foreign exchange current accounts with local banks. With State Administration of
Foreign Exchange (SAFE) approval, domestic institutions may open capital account foreign
exchange accounts with local banks and retain capital account foreign exchange revenues.
Exchange controls continue to apply to most capital transactions, although, in recent
years, controls on selected transactions have been eased. The main area where controls
are maintained with very limited exceptions is inward portfolio investments in money market
instruments and financial derivatives:
Direct investment outflows: Since 2006, the rules on foreign exchange purchases for
outward foreign direct investment (FDI) were relaxed by dropping the quotas and
allowing purchases to finance pre-FDI activities. In 2009, the mandatory examination of
the source of foreign exchange funds for outward direct investment has been changed to
ex post registration, and the review and approval requirement for outward remittances of
funds was canceled. The profits from such investments are exempt from the repatriation
requirement.
Portfolio outflows: A qualified domestic institutional investor (QDII) scheme was
expanded in April 2006 to allow qualified insurance companies to invest their own
foreign exchange externally; and to allow qualified banks (May 2007) and qualified
securities and fund-management companies (July 2007) to invest retail funds in foreign
equities within their individual foreign exchange quotas and limits as set by the
respective regulatory bodies.
Portfolio inflows: Since 2002, the domestic stock market has been opened by allowing
nonresidents to purchase B shares (denominated in U.S. dollars or Hong Kong dollars)
and qualified foreign institutional investors (QFIIs) to invest in A shares (denominated
in renminbi) subject to certain restrictions including a mandatory lock-up period, of
between three months and one year, before the investment can be remitted abroad. The
overall QFII quota was increased from US$10 billion to US$30 billion in December
2007 and the principal lock-up period for medium- and long-term investments by

32
pension funds, insurance funds, and open-ended funds has been decreased to three
months from six months to a year; the principal lock-up period for other institutions was
decreased from three years to one year in September 2009. There were 91 QFIIs in 2010
with a total investment limit of $18.2 billion. QFIIs may also purchase bonds and
debentures, within an overall limit in 2009 of US$1 billion, and the same lock-up
periods apply as in the case of A shares.
Renminbi debt securities: In 2004, international financial institutions were approved to
raise funds domestically in renminbi for use offshore, and foreign-funded enterprises
(FFE) were also allowed to issue renminbi bonds (announced in December 2007). Other
nonresidents are still not permitted to issue capital or money market securities in the
domestic market.
Foreign borrowing: An annual foreign borrowing plan sets mandatory ceilings for all
medium- and long-term borrowing by government departments and enterprises (except
FFEs which are subject to individual limits negotiated in the investment approval
process).
Foreign exchange deposits: Since early-2007, residents are allowed to purchase up to
US$50,000 in foreign exchange for depositing in banks or for current account
transactions and documents are only needed for amounts in excess of this.
B. Recent Developments in the International Use of the Renminbi
Renminbi Trade Settlement
Cross border settlement in RMB began in China’s border regions in 2003. To address
demand from exporters and to facilitate the development of trading ties between China and
regional economies, the renminbi settlement pilot scheme was introduced in July 2009. At
that time, the scheme included Shanghai and four cities in the Guangdong province as well as
counterparts in ASEAN, Hong Kong SAR and Macao SAR.
The cumulative value of renminbi settlement grew from RMB 3.6 billion renminbi at end-
2009 to RMB 70.6 billion by mid-2010 (Figure II.1). The bulk of the transactions (over
three-quarters) have involved imports into China with a smaller amount linked to exports. In
the second quarter of 2010, the overall use of renmimbi in trade was about 1 percent of
mainland China’s total exports and imports in that period.
In view of the good response to the scheme, the People’s Bank of China announced an
expansion of the scheme in June 2010, to allow trade transactions between 20 provinces and
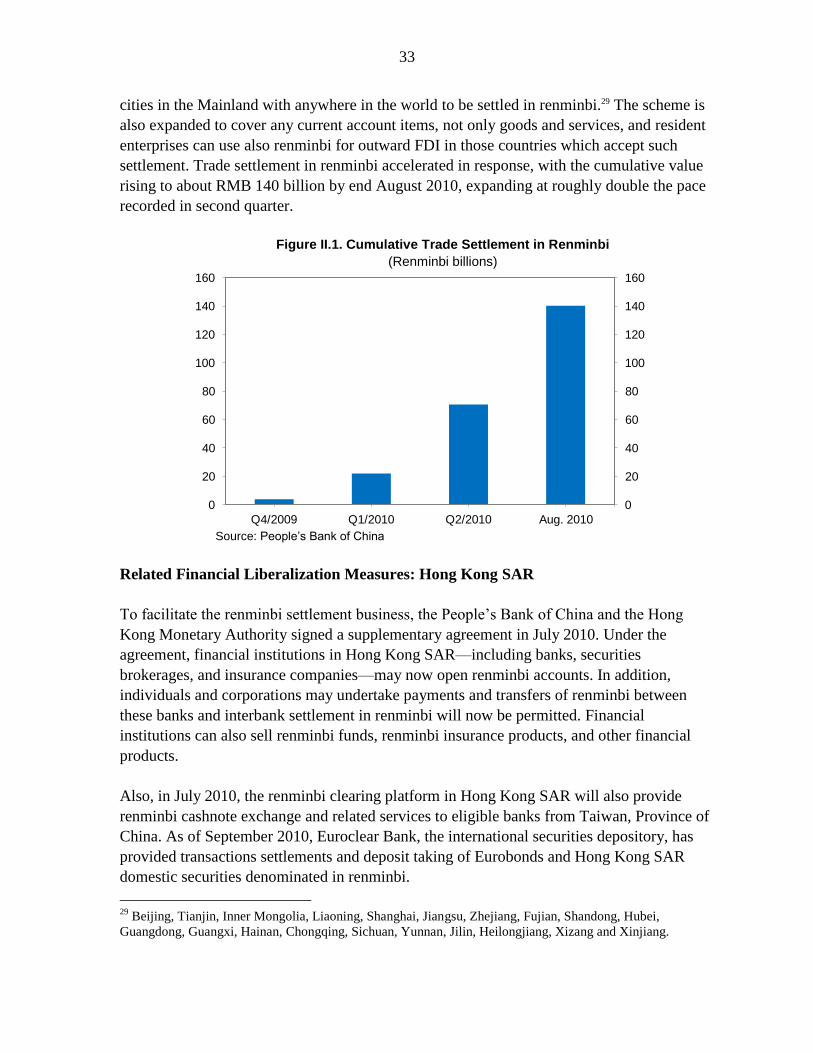
33
cities in the Mainland with anywhere in the world to be settled in renminbi.29 The scheme is
also expanded to cover any current account items, not only goods and services, and resident
enterprises can use also renminbi for outward FDI in those countries which accept such
settlement. Trade settlement in renminbi accelerated in response, with the cumulative value
rising to about RMB 140 billion by end August 2010, expanding at roughly double the pace
recorded in second quarter.
Figure II.1. Cumulative Trade Settlement in Renminbi
(Renminbi billions)
Source: People’s Bank of China
Related Financial Liberalization Measures: Hong Kong SAR
To facilitate the renminbi settlement business, the People’s Bank of China and the Hong
Kong Monetary Authority signed a supplementary agreement in July 2010. Under the
agreement, financial institutions in Hong Kong SAR—including banks, securities
brokerages, and insurance companies—may now open renminbi accounts. In addition,
individuals and corporations may undertake payments and transfers of renminbi between
these banks and interbank settlement in renminbi will now be permitted. Financial
institutions can also sell renminbi funds, renminbi insurance products, and other financial
products.
Also, in July 2010, the renminbi clearing platform in Hong Kong SAR will also provide
renminbi cashnote exchange and related services to eligible banks from Taiwan, Province of
China. As of September 2010, Euroclear Bank, the international securities depository, has
provided transactions settlements and deposit taking of Eurobonds and Hong Kong SAR
domestic securities denominated in renminbi.
29
Beijing, Tianjin, Inner Mongolia, Liaoning, Shanghai, Jiangsu, Zhejiang, Fujian, Shandong, Hubei,
Guangdong, Guangxi, Hainan, Chongqing, Sichuan, Yunnan, Jilin, Heilongjiang, Xizang and Xinjiang.
0
20
40
60
80
100
120
140
160
0
20
40
60
80
100
120
140
160
Q4/2009 Q1/2010 Q2/2010 Aug. 2010
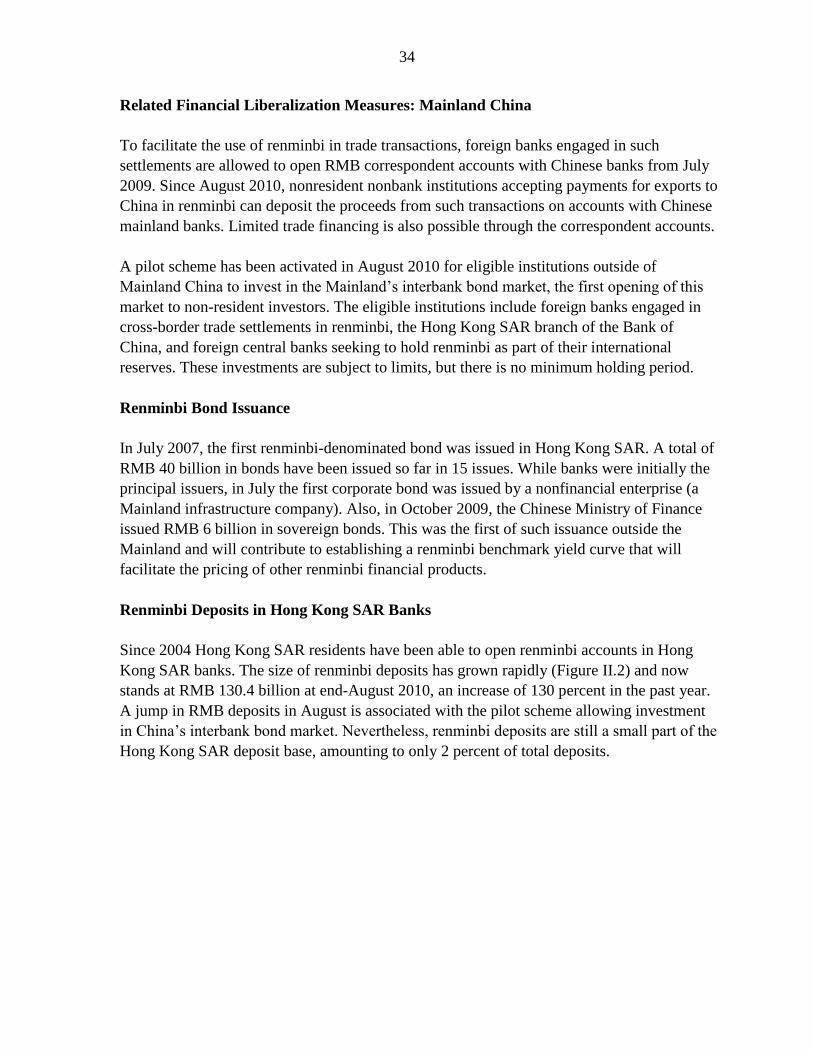
34
Related Financial Liberalization Measures: Mainland China
To facilitate the use of renminbi in trade transactions, foreign banks engaged in such
settlements are allowed to open RMB correspondent accounts with Chinese banks from July
2009. Since August 2010, nonresident nonbank institutions accepting payments for exports to
China in renminbi can deposit the proceeds from such transactions on accounts with Chinese
mainland banks. Limited trade financing is also possible through the correspondent accounts.
A pilot scheme has been activated in August 2010 for eligible institutions outside of
Mainland China to invest in the Mainland’s interbank bond market, the first opening of this
market to non-resident investors. The eligible institutions include foreign banks engaged in
cross-border trade settlements in renminbi, the Hong Kong SAR branch of the Bank of
China, and foreign central banks seeking to hold renminbi as part of their international
reserves. These investments are subject to limits, but there is no minimum holding period.
Renminbi Bond Issuance
In July 2007, the first renminbi-denominated bond was issued in Hong Kong SAR. A total of
RMB 40 billion in bonds have been issued so far in 15 issues. While banks were initially the
principal issuers, in July the first corporate bond was issued by a nonfinancial enterprise (a
Mainland infrastructure company). Also, in October 2009, the Chinese Ministry of Finance
issued RMB 6 billion in sovereign bonds. This was the first of such issuance outside the
Mainland and will contribute to establishing a renminbi benchmark yield curve that will
facilitate the pricing of other renminbi financial products.
Renminbi Deposits in Hong Kong SAR Banks
Since 2004 Hong Kong SAR residents have been able to open renminbi accounts in Hong
Kong SAR banks. The size of renminbi deposits has grown rapidly (Figure II.2) and now
stands at RMB 130.4 billion at end-August 2010, an increase of 130 percent in the past year.
A jump in RMB deposits in August is associated with the pilot scheme allowing investment
in China’s interbank bond market. Nevertheless, renminbi deposits are still a small part of the
Hong Kong SAR deposit base, amounting to only 2 percent of total deposits.
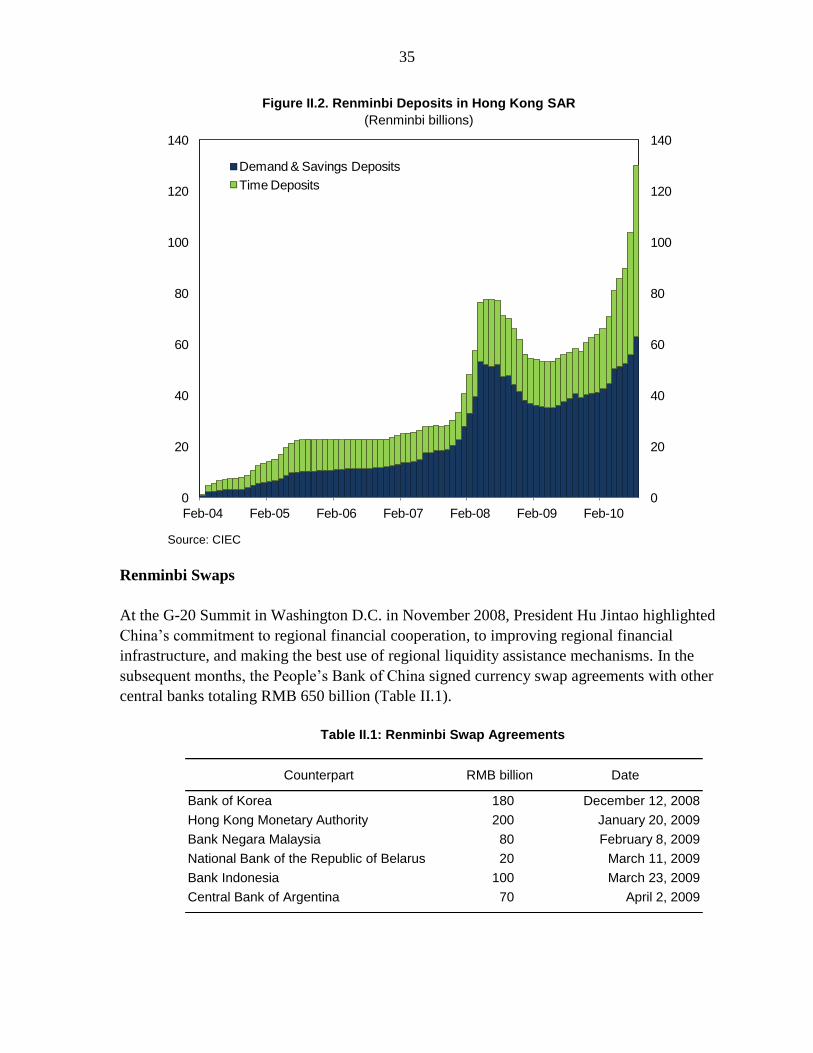
35
Figure II.2. Renminbi Deposits in Hong Kong SAR
(Renminbi billions)
Source: CIEC
Renminbi Swaps
At the G-20 Summit in Washington D.C. in November 2008, President Hu Jintao highlighted
China’s commitment to regional financial cooperation, to improving regional financial
infrastructure, and making the best use of regional liquidity assistance mechanisms. In the
subsequent months, the People’s Bank of China signed currency swap agreements with other
central banks totaling RMB 650 billion (Table II.1).
Table II.1: Renminbi Swap Agreements
0
20
40
60
80
100
120
140
0
20
40
60
80
100
120
140
Feb-04 Feb-05 Feb-06 Feb-07 Feb-08 Feb-09 Feb-10
Demand & Savings Deposits
Time Deposits
Counterpart RMB billion Date
Bank of Korea 180 December 12, 2008
Hong Kong Monetary Authority 200 January 20, 2009
Bank Negara Malaysia 80 February 8, 2009
National Bank of the Republic of Belarus 20 March 11, 2009
Bank Indonesia 100 March 23, 2009
Central Bank of Argentina 70 April 2, 2009
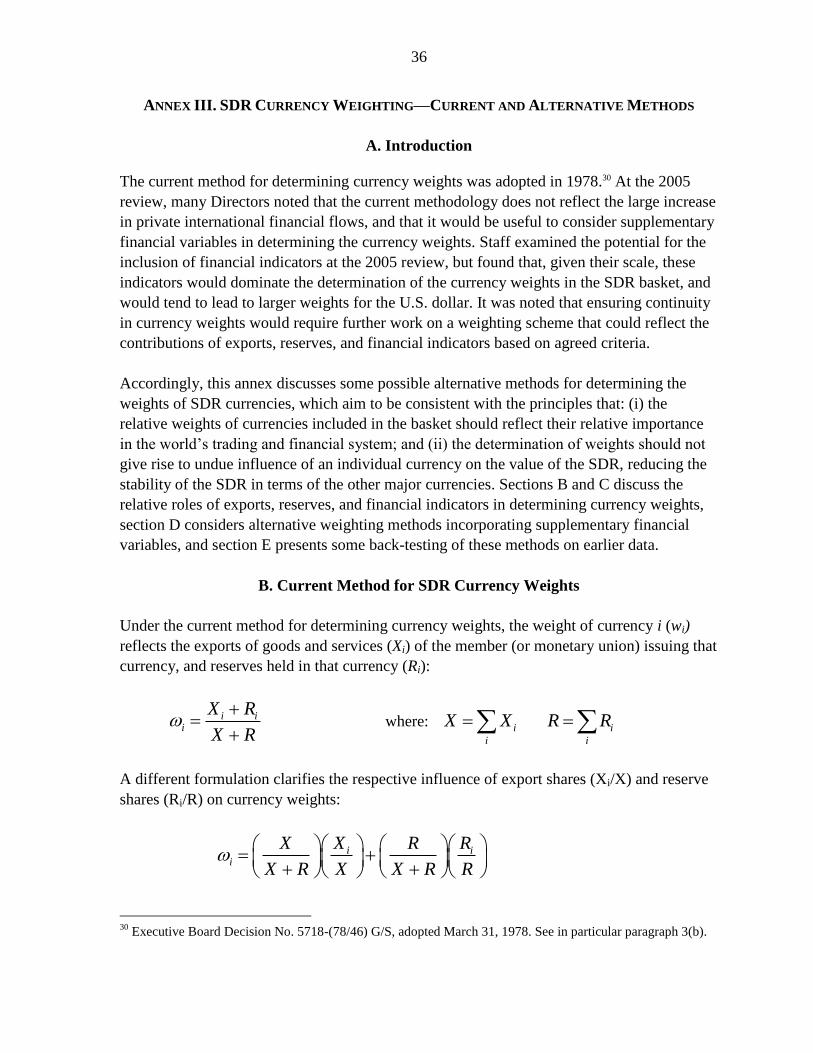
36
ANNEX III. SDR CURRENCY WEIGHTING—CURRENT AND ALTERNATIVE METHODS
A. Introduction
The current method for determining currency weights was adopted in 1978.30 At the 2005
review, many Directors noted that the current methodology does not reflect the large increase
in private international financial flows, and that it would be useful to consider supplementary
financial variables in determining the currency weights. Staff examined the potential for the
inclusion of financial indicators at the 2005 review, but found that, given their scale, these
indicators would dominate the determination of the currency weights in the SDR basket, and
would tend to lead to larger weights for the U.S. dollar. It was noted that ensuring continuity
in currency weights would require further work on a weighting scheme that could reflect the
contributions of exports, reserves, and financial indicators based on agreed criteria.
Accordingly, this annex discusses some possible alternative methods for determining the
weights of SDR currencies, which aim to be consistent with the principles that: (i) the
relative weights of currencies included in the basket should reflect their relative importance
in the world’s trading and financial system; and (ii) the determination of weights should not
give rise to undue influence of an individual currency on the value of the SDR, reducing the
stability of the SDR in terms of the other major currencies. Sections B and C discuss the
relative roles of exports, reserves, and financial indicators in determining currency weights,
section D considers alternative weighting methods incorporating supplementary financial
variables, and section E presents some back-testing of these methods on earlier data.
B. Current Method for SDR Currency Weights
Under the current method for determining currency weights, the weight of currency i (wi)
reflects the exports of goods and services (Xi) of the member (or monetary union) issuing that
currency, and reserves held in that currency (Ri):
i ii
X R
X R
where:
i i
i i
X X R R
A different formulation clarifies the respective influence of export shares (Xi/X) and reserve
shares (Ri/R) on currency weights:
i ii
X X R R
X R X X R R
30
Executive Board Decision No. 5718-(78/46) G/S, adopted March 31, 1978. See in particular paragraph 3(b).
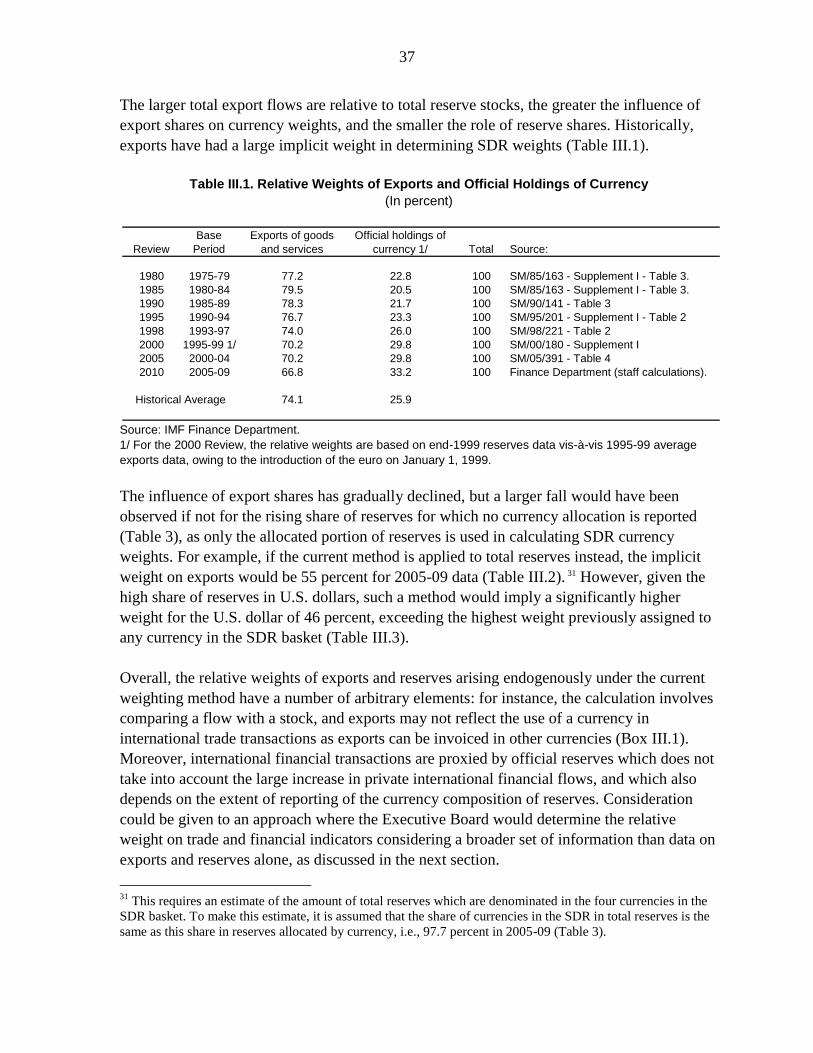
37
The larger total export flows are relative to total reserve stocks, the greater the influence of
export shares on currency weights, and the smaller the role of reserve shares. Historically,
exports have had a large implicit weight in determining SDR weights (Table III.1).
Table III.1. Relative Weights of Exports and Official Holdings of Currency
(In percent)
Source: IMF Finance Department.
1/ For the 2000 Review, the relative weights are based on end-1999 reserves data vis-à-vis 1995-99 average
exports data, owing to the introduction of the euro on January 1, 1999.
The influence of export shares has gradually declined, but a larger fall would have been
observed if not for the rising share of reserves for which no currency allocation is reported
(Table 3), as only the allocated portion of reserves is used in calculating SDR currency
weights. For example, if the current method is applied to total reserves instead, the implicit
weight on exports would be 55 percent for 2005-09 data (Table III.2). 31 However, given the
high share of reserves in U.S. dollars, such a method would imply a significantly higher
weight for the U.S. dollar of 46 percent, exceeding the highest weight previously assigned to
any currency in the SDR basket (Table III.3).
Overall, the relative weights of exports and reserves arising endogenously under the current
weighting method have a number of arbitrary elements: for instance, the calculation involves
comparing a flow with a stock, and exports may not reflect the use of a currency in
international trade transactions as exports can be invoiced in other currencies (Box III.1).
Moreover, international financial transactions are proxied by official reserves which does not
take into account the large increase in private international financial flows, and which also
depends on the extent of reporting of the currency composition of reserves. Consideration
could be given to an approach where the Executive Board would determine the relative
weight on trade and financial indicators considering a broader set of information than data on
exports and reserves alone, as discussed in the next section.
31
This requires an estimate of the amount of total reserves which are denominated in the four currencies in the
SDR basket. To make this estimate, it is assumed that the share of currencies in the SDR in total reserves is the
same as this share in reserves allocated by currency, i.e., 97.7 percent in 2005-09 (Table 3).
Review
Base
Period
Exports of goods
and services
Official holdings of
currency 1/ Total Source:
1980 1975-79 77.2 22.8 100 SM/85/163 - Supplement I - Table 3.
1985 1980-84 79.5 20.5 100 SM/85/163 - Supplement I - Table 3.
1990 1985-89 78.3 21.7 100 SM/90/141 - Table 3
1995 1990-94 76.7 23.3 100 SM/95/201 - Supplement I - Table 2
1998 1993-97 74.0 26.0 100 SM/98/221 - Table 2
2000 1995-99 1/ 70.2 29.8 100 SM/00/180 - Supplement I
2005 2000-04 70.2 29.8 100 SM/05/391 - Table 4
2010 2005-09 66.8 33.2 100 Finance Department (staff calculations).
74.1 25.9Historical Average
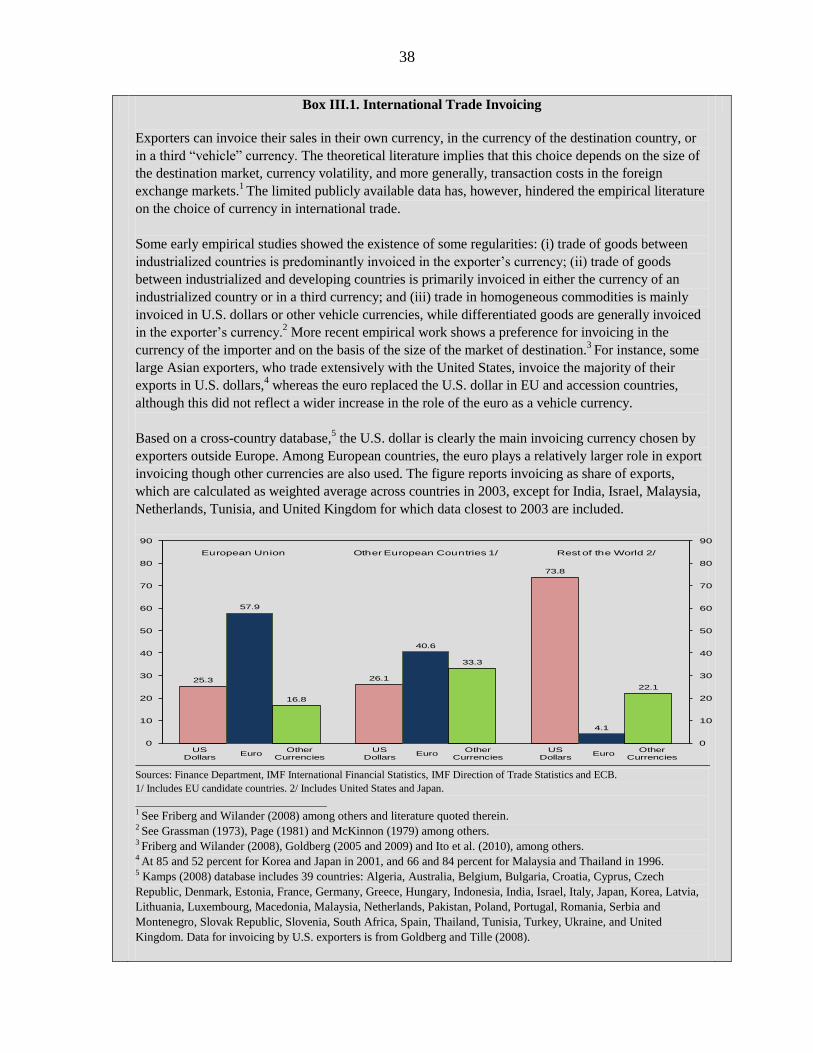
38
Box III.1. International Trade Invoicing
Exporters can invoice their sales in their own currency, in the currency of the destination country, or
in a third ―vehicle‖ currency. The theoretical literature implies that this choice depends on the size of
the destination market, currency volatility, and more generally, transaction costs in the foreign
exchange markets.1 The limited publicly available data has, however, hindered the empirical literature
on the choice of currency in international trade.
Some early empirical studies showed the existence of some regularities: (i) trade of goods between
industrialized countries is predominantly invoiced in the exporter’s currency; (ii) trade of goods
between industrialized and developing countries is primarily invoiced in either the currency of an
industrialized country or in a third currency; and (iii) trade in homogeneous commodities is mainly
invoiced in U.S. dollars or other vehicle currencies, while differentiated goods are generally invoiced
in the exporter’s currency.2 More recent empirical work shows a preference for invoicing in the
currency of the importer and on the basis of the size of the market of destination.3
For instance, some
large Asian exporters, who trade extensively with the United States, invoice the majority of their
exports in U.S. dollars,4 whereas the euro replaced the U.S. dollar in EU and accession countries,
although this did not reflect a wider increase in the role of the euro as a vehicle currency.
Based on a cross-country database,5 the U.S. dollar is clearly the main invoicing currency chosen by
exporters outside Europe. Among European countries, the euro plays a relatively larger role in export
invoicing though other currencies are also used. The figure reports invoicing as share of exports,
which are calculated as weighted average across countries in 2003, except for India, Israel, Malaysia,
Netherlands, Tunisia, and United Kingdom for which data closest to 2003 are included.
Sources: Finance Department, IMF International Financial Statistics, IMF Direction of Trade Statistics and ECB.
1/ Includes EU candidate countries. 2/ Includes United States and Japan.
1 See Friberg and Wilander (2008) among others and literature quoted therein.
2 See Grassman (1973), Page (1981) and McKinnon (1979) among others. 3 Friberg and Wilander (2008), Goldberg (2005 and 2009) and Ito et al. (2010), among others. 4 At 85 and 52 percent for Korea and Japan in 2001, and 66 and 84 percent for Malaysia and Thailand in 1996. 5 Kamps (2008) database includes 39 countries: Algeria, Australia, Belgium, Bulgaria, Croatia, Cyprus, Czech
Republic, Denmark, Estonia, France, Germany, Greece, Hungary, Indonesia, India, Israel, Italy, Japan, Korea, Latvia,
Lithuania, Luxembourg, Macedonia, Malaysia, Netherlands, Pakistan, Poland, Portugal, Romania, Serbia and
Montenegro, Slovak Republic, Slovenia, South Africa, Spain, Thailand, Tunisia, Turkey, Ukraine, and United
Kingdom. Data for invoicing by U.S. exporters is from Goldberg and Tille (2008).
25.3 26.1
73.8
57.9
40.6
4.1
16.8
33.3
22.1
0
10
20
30
40
50
60
70
80
90
0
10
20
30
40
50
60
70
80
90
US Dollars
US Dollars
US Dollars
Euro Euro EuroOther
CurrenciesOther
CurrenciesOther
Currencies
European Union Other European Countries 1/ Rest of the World 2/
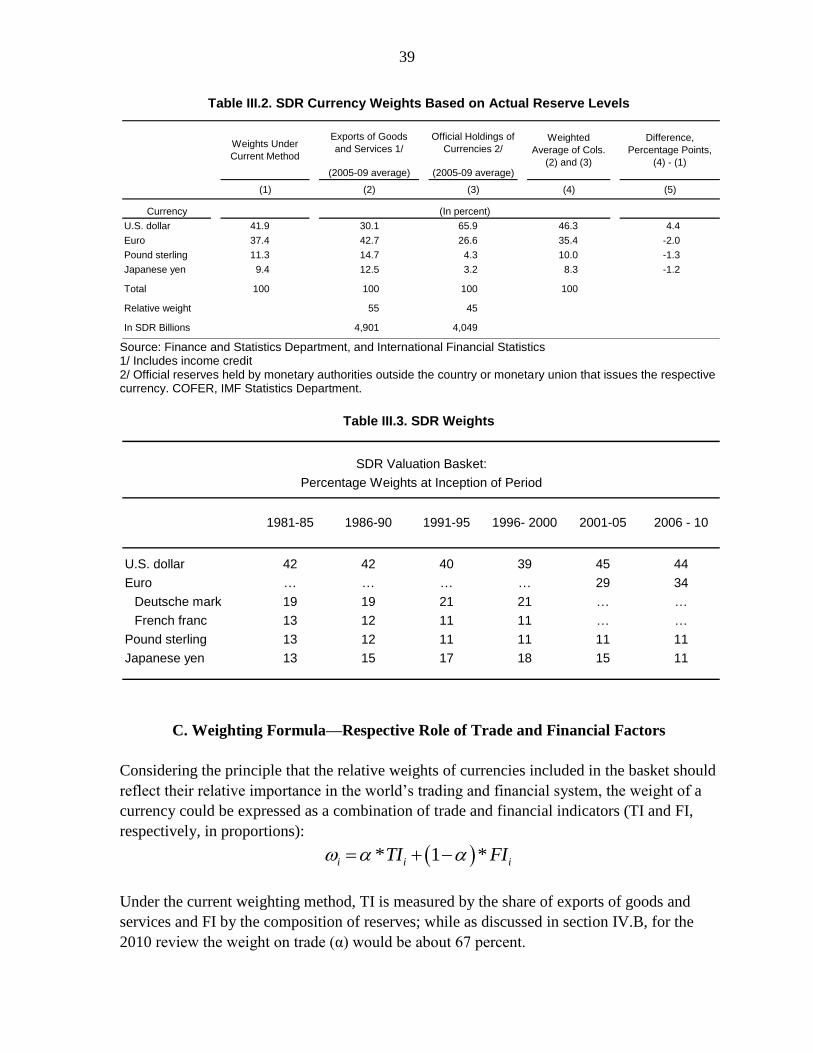
39
Table III.2. SDR Currency Weights Based on Actual Reserve Levels
Source: Finance and Statistics Department, and International Financial Statistics 1/ Includes income credit 2/ Official reserves held by monetary authorities outside the country or monetary union that issues the respective currency. COFER, IMF Statistics Department.
Table III.3. SDR Weights
C. Weighting Formula—Respective Role of Trade and Financial Factors
Considering the principle that the relative weights of currencies included in the basket should
reflect their relative importance in the world’s trading and financial system, the weight of a
currency could be expressed as a combination of trade and financial indicators (TI and FI,
respectively, in proportions):
* 1 *i i iTI FI
Under the current weighting method, TI is measured by the share of exports of goods and
services and FI by the composition of reserves; while as discussed in section IV.B, for the
2010 review the weight on trade (α) would be about 67 percent.
(2005-09 average) (2005-09 average)
(1) (2) (3) (4) (5)
U.S. dollar 41.9 30.1 65.9 46.3 4.4
Euro 37.4 42.7 26.6 35.4 -2.0
Pound sterling 11.3 14.7 4.3 10.0 -1.3
Japanese yen 9.4 12.5 3.2 8.3 -1.2
Total 100 100 100 100
Relative weight 55 45
In SDR Billions 4,901 4,049
Currency (In percent)
Exports of Goods
and Services 1/
Official Holdings of
Currencies 2/Weighted
Average of Cols.
(2) and (3)
Difference,
Percentage Points,
(4) - (1)
Weights Under
Current Method
U.S. dollar 42 42 40 39 45 44
Euro … … … … 29 34
Deutsche mark 19 19 21 21 … …
French franc 13 12 11 11 … …
Pound sterling 13 12 11 11 11 11
Japanese yen 13 15 17 18 15 11
SDR Valuation Basket:
Percentage Weights at Inception of Period
1981-85 1986-90 1991-95 1996- 2000 2001-05 2006 - 10
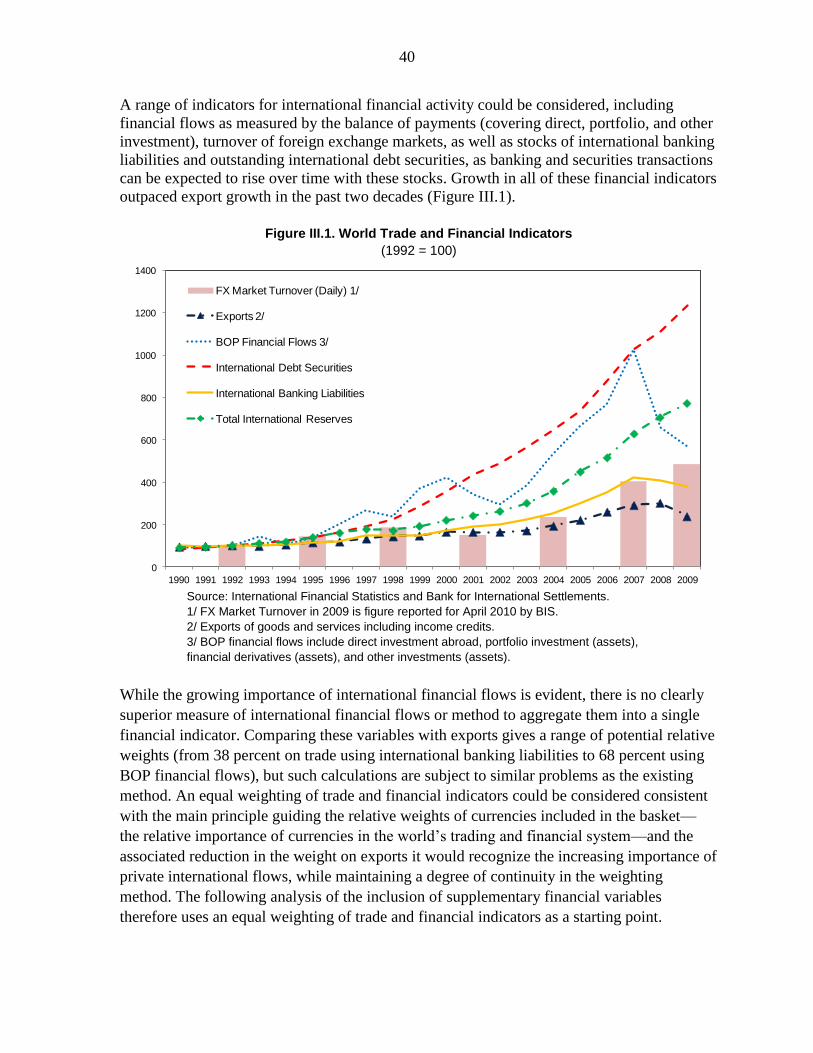
40
A range of indicators for international financial activity could be considered, including
financial flows as measured by the balance of payments (covering direct, portfolio, and other
investment), turnover of foreign exchange markets, as well as stocks of international banking
liabilities and outstanding international debt securities, as banking and securities transactions
can be expected to rise over time with these stocks. Growth in all of these financial indicators
outpaced export growth in the past two decades (Figure III.1).
Figure III.1. World Trade and Financial Indicators
(1992 = 100)
Source: International Financial Statistics and Bank for International Settlements.
1/ FX Market Turnover in 2009 is figure reported for April 2010 by BIS.
2/ Exports of goods and services including income credits.
3/ BOP financial flows include direct investment abroad, portfolio investment (assets),
financial derivatives (assets), and other investments (assets).
While the growing importance of international financial flows is evident, there is no clearly
superior measure of international financial flows or method to aggregate them into a single
financial indicator. Comparing these variables with exports gives a range of potential relative
weights (from 38 percent on trade using international banking liabilities to 68 percent using
BOP financial flows), but such calculations are subject to similar problems as the existing
method. An equal weighting of trade and financial indicators could be considered consistent
with the main principle guiding the relative weights of currencies included in the basket—
the relative importance of currencies in the world’s trading and financial system—and the
associated reduction in the weight on exports it would recognize the increasing importance of
private international flows, while maintaining a degree of continuity in the weighting
method. The following analysis of the inclusion of supplementary financial variables
therefore uses an equal weighting of trade and financial indicators as a starting point.
0
200
400
600
800
1000
1200
1400
1990 1991 1992 1993 1994 1995 1996 1997 1998 1999 2000 2001 2002 2003 2004 2005 2006 2007 2008 2009
FX Market Turnover (Daily) 1/
Exports 2/
BOP Financial Flows 3/
International Debt Securities
International Banking Liabilities
Total International Reserves
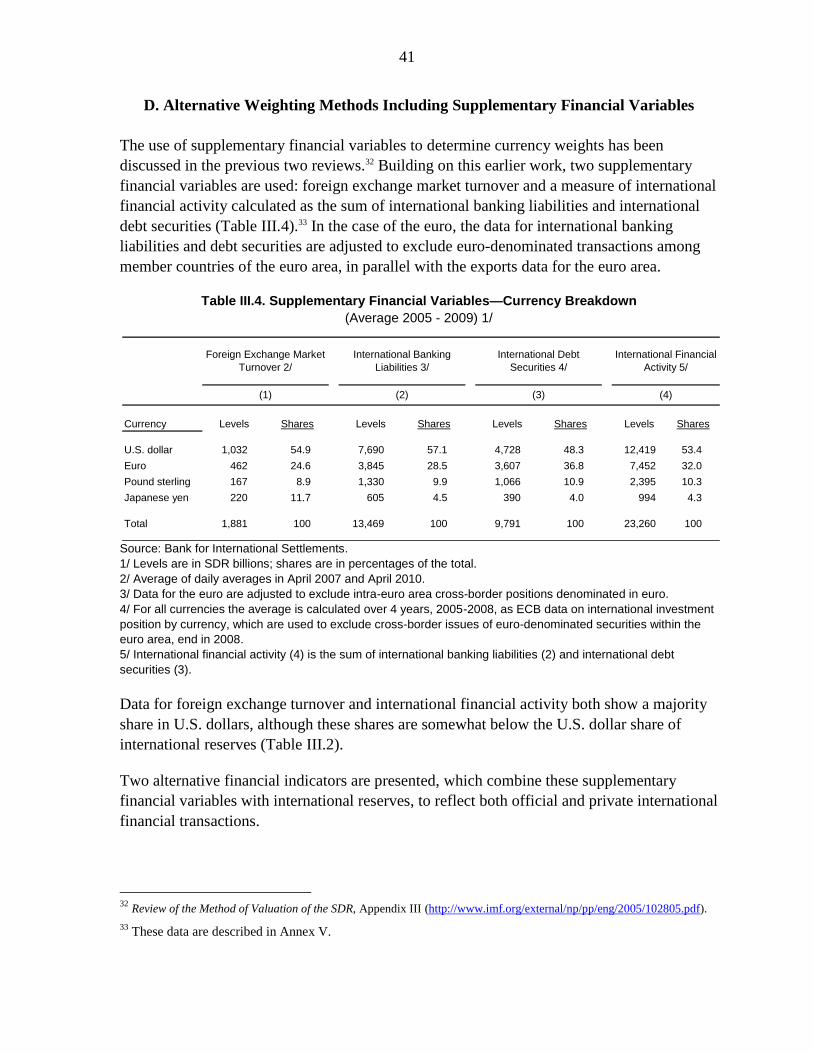
41
D. Alternative Weighting Methods Including Supplementary Financial Variables
The use of supplementary financial variables to determine currency weights has been
discussed in the previous two reviews.32 Building on this earlier work, two supplementary
financial variables are used: foreign exchange market turnover and a measure of international
financial activity calculated as the sum of international banking liabilities and international
debt securities (Table III.4).33 In the case of the euro, the data for international banking
liabilities and debt securities are adjusted to exclude euro-denominated transactions among
member countries of the euro area, in parallel with the exports data for the euro area.
Table III.4. Supplementary Financial Variables—Currency Breakdown
(Average 2005 - 2009) 1/
Source: Bank for International Settlements.
1/ Levels are in SDR billions; shares are in percentages of the total.
2/ Average of daily averages in April 2007 and April 2010.
3/ Data for the euro are adjusted to exclude intra-euro area cross-border positions denominated in euro.
4/ For all currencies the average is calculated over 4 years, 2005-2008, as ECB data on international investment
position by currency, which are used to exclude cross-border issues of euro-denominated securities within the
euro area, end in 2008.
5/ International financial activity (4) is the sum of international banking liabilities (2) and international debt
securities (3).
Data for foreign exchange turnover and international financial activity both show a majority
share in U.S. dollars, although these shares are somewhat below the U.S. dollar share of
international reserves (Table III.2).
Two alternative financial indicators are presented, which combine these supplementary
financial variables with international reserves, to reflect both official and private international
financial transactions.
32
Review of the Method of Valuation of the SDR, Appendix III (http://www.imf.org/external/np/pp/eng/2005/102805.pdf).
33 These data are described in Annex V.
Currency Levels Shares Levels Shares Levels Shares Levels Shares
U.S. dollar 1,032 54.9 7,690 57.1 4,728 48.3 12,419 53.4
Euro 462 24.6 3,845 28.5 3,607 36.8 7,452 32.0
Pound sterling 167 8.9 1,330 9.9 1,066 10.9 2,395 10.3
Japanese yen 220 11.7 605 4.5 390 4.0 994 4.3
Total 1,881 100 13,469 100 9,791 100 23,260 100
International Financial
Activity 5/
(4)(1) (2) (3)
Foreign Exchange Market
Turnover 2/
International Banking
Liabilities 3/
International Debt
Securities 4/
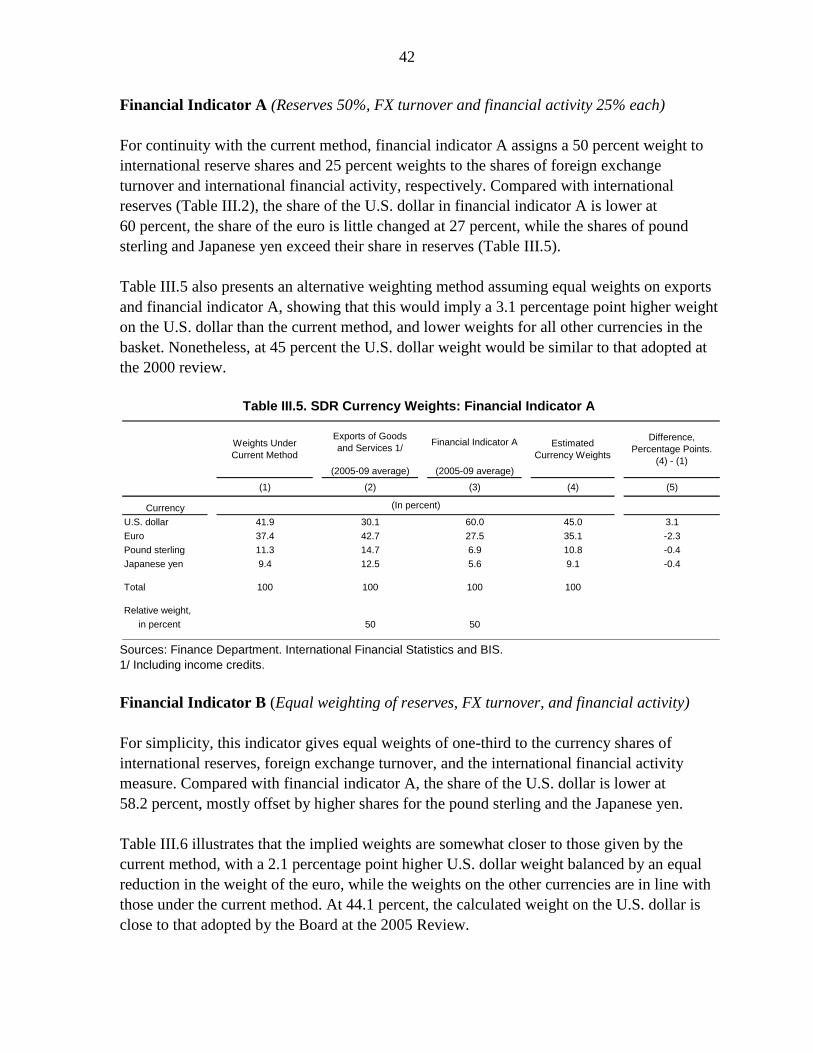
42
Financial Indicator A (Reserves 50%, FX turnover and financial activity 25% each)
For continuity with the current method, financial indicator A assigns a 50 percent weight to
international reserve shares and 25 percent weights to the shares of foreign exchange
turnover and international financial activity, respectively. Compared with international
reserves (Table III.2), the share of the U.S. dollar in financial indicator A is lower at
60 percent, the share of the euro is little changed at 27 percent, while the shares of pound
sterling and Japanese yen exceed their share in reserves (Table III.5).
Table III.5 also presents an alternative weighting method assuming equal weights on exports
and financial indicator A, showing that this would imply a 3.1 percentage point higher weight
on the U.S. dollar than the current method, and lower weights for all other currencies in the
basket. Nonetheless, at 45 percent the U.S. dollar weight would be similar to that adopted at
the 2000 review.
Table III.5. SDR Currency Weights: Financial Indicator A
Sources: Finance Department. International Financial Statistics and BIS.
1/ Including income credits.
Financial Indicator B (Equal weighting of reserves, FX turnover, and financial activity)
For simplicity, this indicator gives equal weights of one-third to the currency shares of
international reserves, foreign exchange turnover, and the international financial activity
measure. Compared with financial indicator A, the share of the U.S. dollar is lower at
58.2 percent, mostly offset by higher shares for the pound sterling and the Japanese yen.
Table III.6 illustrates that the implied weights are somewhat closer to those given by the
current method, with a 2.1 percentage point higher U.S. dollar weight balanced by an equal
reduction in the weight of the euro, while the weights on the other currencies are in line with
those under the current method. At 44.1 percent, the calculated weight on the U.S. dollar is
close to that adopted by the Board at the 2005 Review.
(2005-09 average) (2005-09 average)
(1) (2) (3) (4) (5)
U.S. dollar 41.9 30.1 60.0 45.0 3.1
Euro 37.4 42.7 27.5 35.1 -2.3
Pound sterling 11.3 14.7 6.9 10.8 -0.4
Japanese yen 9.4 12.5 5.6 9.1 -0.4
Total 100 100 100 100
Relative weight,
in percent 50 50
Currency (In percent)
Weights Under
Current Method
Exports of Goods
and Services 1/Financial Indicator A Estimated
Currency Weights
Difference,
Percentage Points.
(4) - (1)
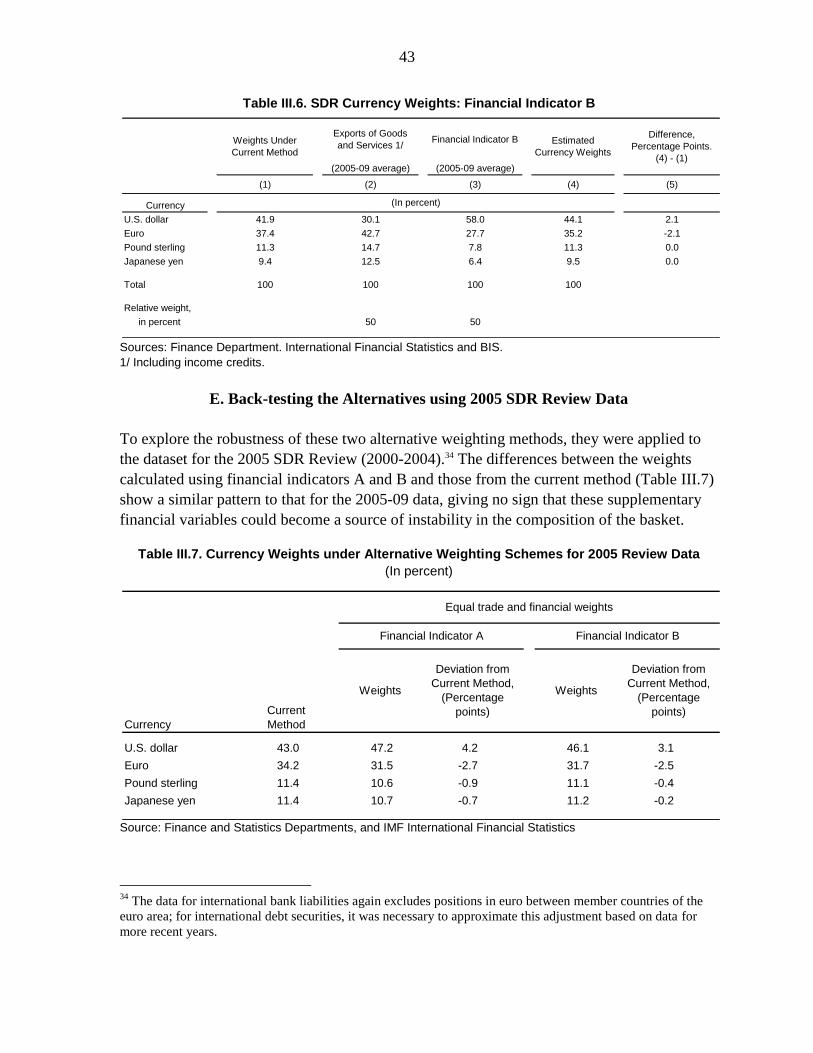
43
Table III.6. SDR Currency Weights: Financial Indicator B
Sources: Finance Department. International Financial Statistics and BIS.
1/ Including income credits.
E. Back-testing the Alternatives using 2005 SDR Review Data
To explore the robustness of these two alternative weighting methods, they were applied to
the dataset for the 2005 SDR Review (2000-2004).34 The differences between the weights
calculated using financial indicators A and B and those from the current method (Table III.7)
show a similar pattern to that for the 2005-09 data, giving no sign that these supplementary
financial variables could become a source of instability in the composition of the basket.
Table III.7. Currency Weights under Alternative Weighting Schemes for 2005 Review Data
(In percent)
Source: Finance and Statistics Departments, and IMF International Financial Statistics
34
The data for international bank liabilities again excludes positions in euro between member countries of the
euro area; for international debt securities, it was necessary to approximate this adjustment based on data for
more recent years.
(2005-09 average) (2005-09 average)
(1) (2) (3) (4) (5)
U.S. dollar 41.9 30.1 58.0 44.1 2.1
Euro 37.4 42.7 27.7 35.2 -2.1
Pound sterling 11.3 14.7 7.8 11.3 0.0
Japanese yen 9.4 12.5 6.4 9.5 0.0
Total 100 100 100 100
Relative weight,
in percent 50 50
Currency (In percent)
Weights Under
Current Method
Exports of Goods
and Services 1/Financial Indicator B Estimated
Currency Weights
Difference,
Percentage Points.
(4) - (1)
Currency
U.S. dollar 43.0 47.2 4.2 46.1 3.1
Euro 34.2 31.5 -2.7 31.7 -2.5
Pound sterling 11.4 10.6 -0.9 11.1 -0.4
Japanese yen 11.4 10.7 -0.7 11.2 -0.2
Current
Method
Equal trade and financial weights
Financial Indicator A
Weights Weights
Deviation from
Current Method,
(Percentage
points)
Deviation from
Current Method,
(Percentage
points)
Financial Indicator B
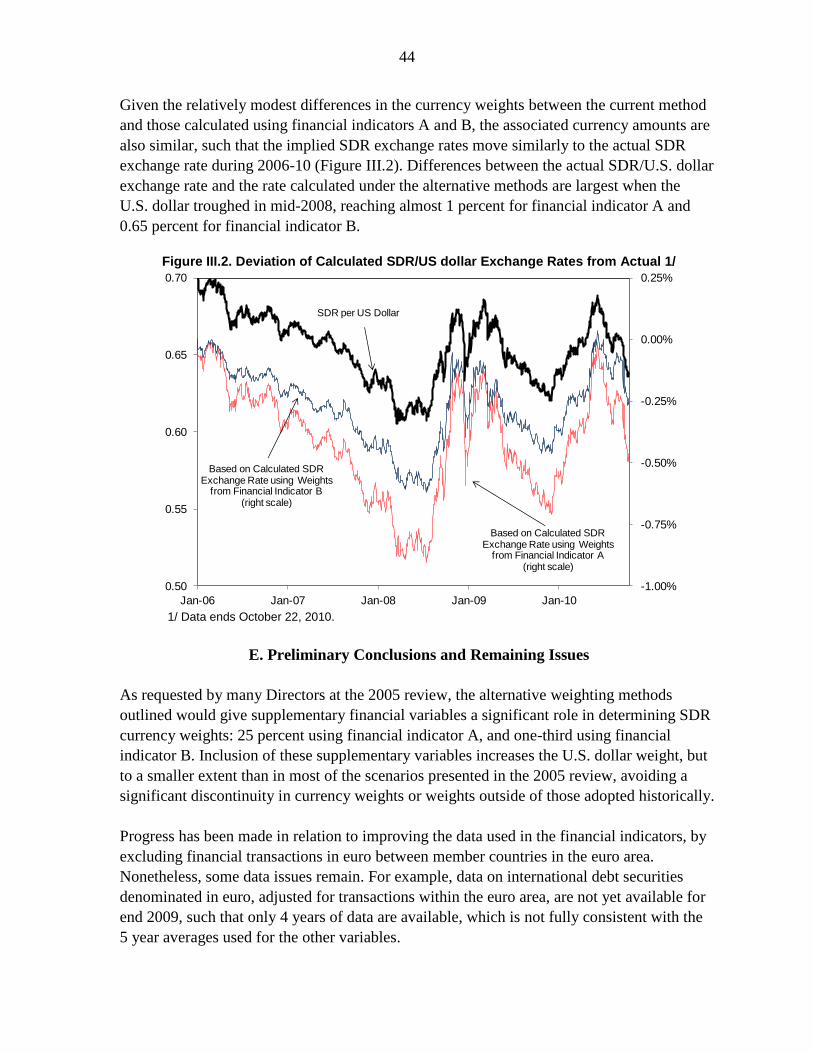
44
Given the relatively modest differences in the currency weights between the current method
and those calculated using financial indicators A and B, the associated currency amounts are
also similar, such that the implied SDR exchange rates move similarly to the actual SDR
exchange rate during 2006-10 (Figure III.2). Differences between the actual SDR/U.S. dollar
exchange rate and the rate calculated under the alternative methods are largest when the
U.S. dollar troughed in mid-2008, reaching almost 1 percent for financial indicator A and
0.65 percent for financial indicator B.
Figure III.2. Deviation of Calculated SDR/US dollar Exchange Rates from Actual 1/
1/ Data ends October 22, 2010.
E. Preliminary Conclusions and Remaining Issues
As requested by many Directors at the 2005 review, the alternative weighting methods
outlined would give supplementary financial variables a significant role in determining SDR
currency weights: 25 percent using financial indicator A, and one-third using financial
indicator B. Inclusion of these supplementary variables increases the U.S. dollar weight, but
to a smaller extent than in most of the scenarios presented in the 2005 review, avoiding a
significant discontinuity in currency weights or weights outside of those adopted historically.
Progress has been made in relation to improving the data used in the financial indicators, by
excluding financial transactions in euro between member countries in the euro area.
Nonetheless, some data issues remain. For example, data on international debt securities
denominated in euro, adjusted for transactions within the euro area, are not yet available for
end 2009, such that only 4 years of data are available, which is not fully consistent with the
5 year averages used for the other variables.
-1.00%
-0.75%
-0.50%
-0.25%
0.00%
0.25%
0.50
0.55
0.60
0.65
0.70
Jan-06 Jan-07 Jan-08 Jan-09 Jan-10
Based on Calculated SDR Exchange Rate using Weights
from Financial Indicator B(right scale)
SDR per US Dollar
Based on Calculated SDR Exchange Rate using Weights
from Financial Indicator A(right scale)
45
ANNEX IV. OFFICIAL SDR INTEREST RATE—MATURITY AND FREQUENCY
This annex discusses issues related to the difficulties of replicating and hedging the official
SDR interest rate owing to the difference between the adjustment frequency of the official
SDR interest rate and the maturity of the instruments used to construct the rate.
Current methodology and issues
The official SDR interest rate is currently set weekly, based on instruments with a
three-month maturity. Component instruments are the three-month rates for U.S. and U.K.
Treasury bills, Japanese Treasury Discount bills, and the three-month Eurepo rate. The SDR
interest rate is published each Monday based on the annual yields on these instruments on the
preceding Friday and weighted according to the respective currency weight in the SDR
basket (Box 6 and Annex I.C). This rate is the basis for interest payments on SDR holdings
and interest due on SDR allocations, the rate of remuneration on members’ reserve tranche
positions and interest payable on outstanding borrowing (including bilateral loans, notes, and
the NAB), and this floating rate is also the basis for the rate of charge on GRA credit.
This approach to adjusting the official SDR interest rate evolved during the 1970s and
1980s with a view to fostering the SDR’s attractiveness as a reserve asset. When the SDR
was redefined as a basket of currencies in 1974, the interest rate on the SDR was set every
six months. In 1976, quarterly interest rate adjustments were introduced based on market
rates during six-week reference periods, shortened to 15-days in 1981. To keep the SDR
interest rate more closely aligned with yields on comparable reserve assets, in July 1983 the
Executive Board decided to reset the official SDR interest rate on a weekly basis.
The three-month maturity of the financial instruments was selected in the early 1970s
to reflect the reserve asset character of the SDR and also took into account market
liquidity and data availability. It was generally agreed that short-term interest rates would
be most appropriate for inclusion in the SDR interest rate basket, as they reflect the reserve
asset character of the SDR and its prompt usability in case of balance of payments needs.
Although some portion of official reserves are frequently invested in longer-term assets, it
was considered that short-term assets more accurately reflect the bulk of official holdings of
member countries. The three-month interest rates were regarded as preferable to other
short-term rates as their markets were generally the broadest and best established.
The current method of establishing the official SDR interest rate tracks market rates
with only temporary deviations (Figure IV.1). When the official SDR interest rate was

46
reset only semiannually or quarterly, the return on the SDR could deviate significantly from
returns available in the market during the same period. While at times the SDR would offer a
return above market rates, at other times the interest rate would lag increases in market rates,
undermining the attractiveness of the SDR. Shifting to a weekly adjustment of the official
SDR interest rate has much reduced the potential for such deviations, and although yields can
still deviate during the subsequent week if short-term rates change, SDR holders can expect
the official SDR interest rate to adjust reasonably soon to reflect this development.35
Figure IV.1. Official SDR Interest Rate and Daily Combined Market Rate
(In percent)
Sources: Bloomberg, staff calculations
1/ Daily combined market rate is an SDR weighted average of the component instruments.
Nonetheless, the lack of alignment between the maturity of the component instruments
(3 months) and the frequency of the SDR rate reset (weekly) hinders the capacity of
members and other parties to replicate the SDR interest rate in the market. Although all
instruments used in the construction of the SDR interest rate are readily available in the
market, this misalignment makes it difficult to precisely mirror the income stream of the
SDR interest rate (for those wishing to be ―long‖ the SDR) or to offset charges due to the
Fund (for borrowing members or those wishing to hedge SDR exposures). This reflects the
fact that, although the SDR interest rate is a weighted average of three-month instruments, its
35
Since the last reweighting of the basket at end-2005, the difference between the official SDR interest rate and
the daily value of the weighted component interest rates averaged less than 1 basis point. The largest deviations
arose during the financial crisis, particularly in the period July 2007–March 2009 when central banks
accelerated the pace of their monetary policy easing, peaking at 26 basis points in the fall of 2008.
0.0
0.5
1.0
1.5
2.0
2.5
3.0
3.5
4.0
0.0
0.5
1.0
1.5
2.0
2.5
3.0
3.5
4.0
Jan-08 Mar-08 May-08 Jul-08 Sep-08 Nov-08 Jan-09 Mar-09
Daily Combined Market Rate 1/
Official SDR Interest Rate
47
return behaves as if it was a bank deposit, i.e., the return of the SDR interest rate does not
include capital gains or losses due to variations in the price of the underlying instruments. As
a result, the interest return of the SDR is unlikely to equate the weighted return of the local
currency instruments bought at the start and sold at the end of the weekly reference period,
and such return differences may cumulate over time depending on interest rate developments.
These issues have been a recurrent concern expressed by some Fund members and could also
reduce the attractiveness of the SDR to the private sector.
Alternative approaches
There are a range of alternative approaches to aligning the maturity of the official SDR
interest rate and the frequency of adjustments in this rate. The following provides a
preliminary discussion of the pros and cons of some alternatives, also considering whether
they fulfill the broader criteria for the official SDR interest rate, i.e., representativeness of the
range of available instruments, responsiveness to credit conditions, appropriate risk
characteristics, and reflecting actual reserve assets choices of reserve managers (section V):
(a) Quarterly: keep the current maturity of the underlying instruments and reduce the
frequency of adjustments to every 90 days. This would improve replication, as it would be
possible to buy and hold to maturity the relevant 90-day Treasury bills and initiate a
three-month collateralized deposit in euro. In addition, these instruments are consistent with
the criteria for the financial instruments in the SDR interest rate basket. However, the
potential duration and scale of divergences between the SDR interest rate and prevailing
market rates during the period between adjustments would rise substantially beyond what
might occur in the current framework. For example, one month after a reset, the
SDR-weighted yield on 2-month instruments may significantly exceed the interest rate on
SDR for the 2-months remaining until the next reset, reducing the attractiveness of the SDR
relative to other reserve assets.
(b) Weekly: keep the current adjustment frequency and shorten the maturity of the
underlying instruments to one week. As very short dated Treasury bill rates are not always
available in the secondary market, one-week Overnight Indexed Swap (OIS) rates could be
used as benchmarks for the SDR interest rate.36 OIS rates are widely used as indicators of
short-term risk-free rates, suggesting that they are representative and responsive to credit
conditions. Nonetheless, OIS swaps are not a perfect substitute for Treasury bills of
equivalent maturity, as they are swap agreements which entail a counterparty risk on the cash
flow difference between the fixed and the floating leg, but this is typically small relative to
the principal amount swapped. The Bank for International Settlements uses OIS swaps as a
36
An Overnight Indexed Swap (OIS) is a fixed/floating interest rate swap with the floating leg tied to a
published index of a daily overnight rate reference. The term usually ranges from one week to two years
(sometimes more). The two parties agree to exchange at maturity, on the agreed notional amount, the difference
between interest accrued at the agreed fixed rate and interest accrued through geometric averaging of the
floating index rate.
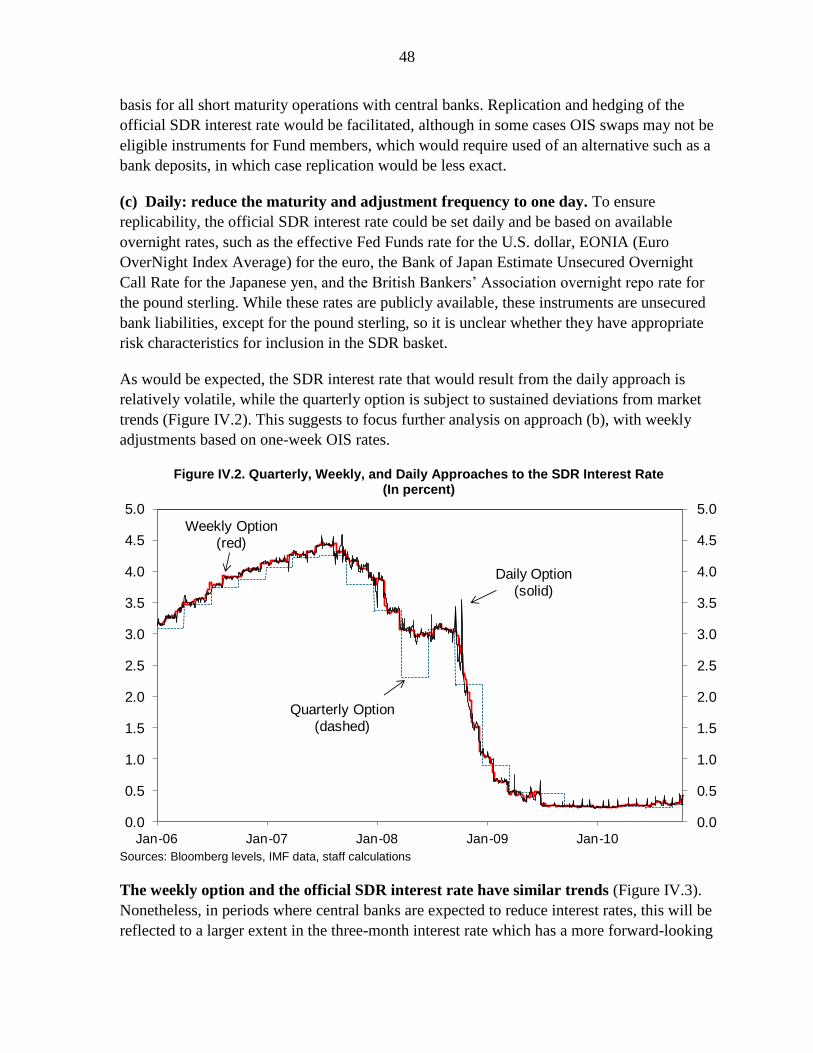
48
basis for all short maturity operations with central banks. Replication and hedging of the
official SDR interest rate would be facilitated, although in some cases OIS swaps may not be
eligible instruments for Fund members, which would require used of an alternative such as a
bank deposits, in which case replication would be less exact.
(c) Daily: reduce the maturity and adjustment frequency to one day. To ensure
replicability, the official SDR interest rate could be set daily and be based on available
overnight rates, such as the effective Fed Funds rate for the U.S. dollar, EONIA (Euro
OverNight Index Average) for the euro, the Bank of Japan Estimate Unsecured Overnight
Call Rate for the Japanese yen, and the British Bankers’ Association overnight repo rate for
the pound sterling. While these rates are publicly available, these instruments are unsecured
bank liabilities, except for the pound sterling, so it is unclear whether they have appropriate
risk characteristics for inclusion in the SDR basket.
As would be expected, the SDR interest rate that would result from the daily approach is
relatively volatile, while the quarterly option is subject to sustained deviations from market
trends (Figure IV.2). This suggests to focus further analysis on approach (b), with weekly
adjustments based on one-week OIS rates.
Figure IV.2. Quarterly, Weekly, and Daily Approaches to the SDR Interest Rate (In percent)
Sources: Bloomberg levels, IMF data, staff calculations
The weekly option and the official SDR interest rate have similar trends (Figure IV.3).
Nonetheless, in periods where central banks are expected to reduce interest rates, this will be
reflected to a larger extent in the three-month interest rate which has a more forward-looking
0.0
0.5
1.0
1.5
2.0
2.5
3.0
3.5
4.0
4.5
5.0
0.0
0.5
1.0
1.5
2.0
2.5
3.0
3.5
4.0
4.5
5.0
Jan-06 Jan-07 Jan-08 Jan-09 Jan-10
Daily Option
(solid)
Quarterly Option
(dashed)
Weekly Option
(red)

49
-20
-10
0
10
20
30
40
50
60
70
0.0
0.5
1.0
1.5
2.0
2.5
3.0
3.5
4.0
4.5
5.0
Jan-06 Jul-06 Jan-07 Jul-07 Jan-08 Jul-08 Jan-09 Jul-09 Jan-10 Jul-10
Weekly Option
(dashed)
Official SDR
Interest Rate (solid)
Spread between Weekly
option and Official SDR Interest Rate
(basis points, right scale)
element. Sharp falls in three-month instruments during the global financial crisis lead to
spreads between the weekly option and the official SDR interest rate widening to 40-70 basis
points in some weeks in late 2008 and early 2009. This behavior can also be expected to
occur during periods when central banks are expected to raise interest rates, in which case the
three-month rates would exceed one-week OIS rates. It is notable that since early 2009, the
spreads have narrowed to no more than +/- 10 basis points.
Figure IV.3. One-Week OIS rate and Official SDR Interest Rate
(In percent)
Sources: Bloomberg levels, IMF data, staff calculations
Overall, this preliminary analysis suggests that moving to including instruments with a
one week maturity in the official SDR interest rate basket could address the current
mismatch between the maturity of the underlying instruments and the reset frequency.
Based on staff work to date, OIS swaps would appear to be a possible candidate in the event
that such a shift was considered desirable. However, this conclusion is highly tentative, and
further work is needed on the pros and cons of such a move, including the liquidity and risk
characteristics of the OIS swaps in each currency, the likely effectiveness of such a change in
facilitating replication and hedging of the official SDR interest rate, and the broader
implications of such a move given the role of the SDR. Further work could also include an
assessment of whether more suitable instruments for the daily option are available.
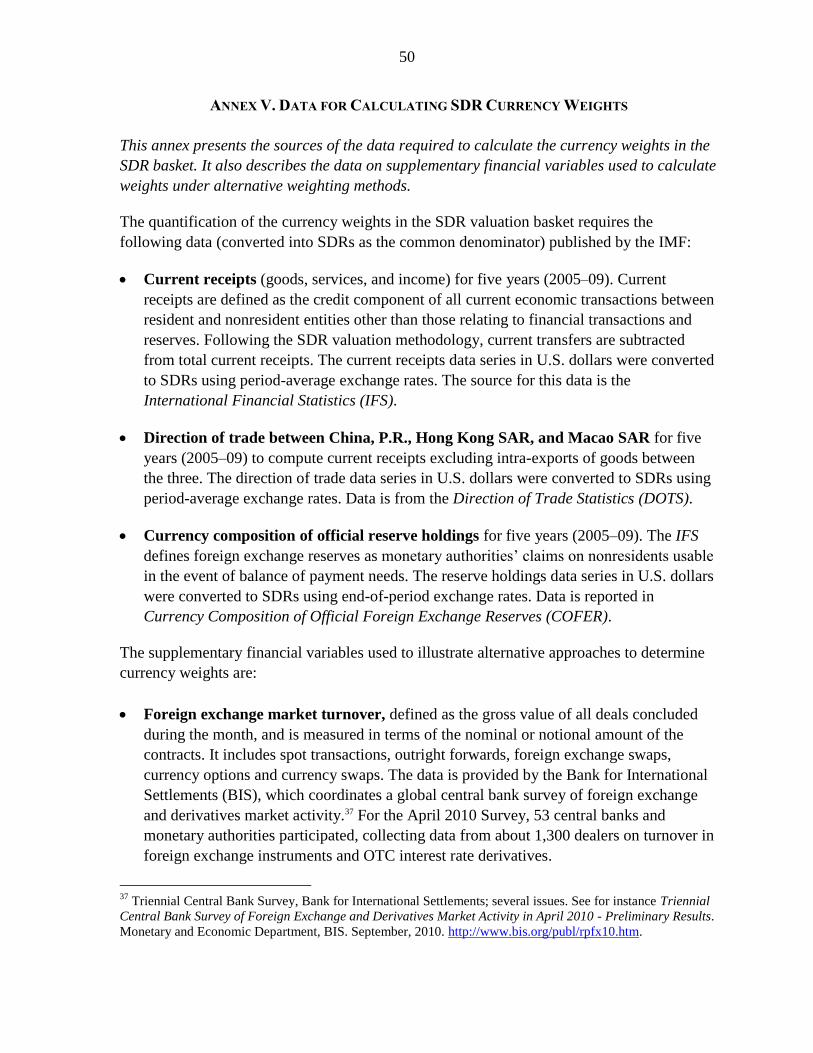
50
ANNEX V. DATA FOR CALCULATING SDR CURRENCY WEIGHTS
This annex presents the sources of the data required to calculate the currency weights in the
SDR basket. It also describes the data on supplementary financial variables used to calculate
weights under alternative weighting methods.
The quantification of the currency weights in the SDR valuation basket requires the
following data (converted into SDRs as the common denominator) published by the IMF:
Current receipts (goods, services, and income) for five years (2005–09). Current
receipts are defined as the credit component of all current economic transactions between
resident and nonresident entities other than those relating to financial transactions and
reserves. Following the SDR valuation methodology, current transfers are subtracted
from total current receipts. The current receipts data series in U.S. dollars were converted
to SDRs using period-average exchange rates. The source for this data is the
International Financial Statistics (IFS).
Direction of trade between China, P.R., Hong Kong SAR, and Macao SAR for five
years (2005–09) to compute current receipts excluding intra-exports of goods between
the three. The direction of trade data series in U.S. dollars were converted to SDRs using
period-average exchange rates. Data is from the Direction of Trade Statistics (DOTS).
Currency composition of official reserve holdings for five years (2005–09). The IFS
defines foreign exchange reserves as monetary authorities’ claims on nonresidents usable
in the event of balance of payment needs. The reserve holdings data series in U.S. dollars
were converted to SDRs using end-of-period exchange rates. Data is reported in
Currency Composition of Official Foreign Exchange Reserves (COFER).
The supplementary financial variables used to illustrate alternative approaches to determine
currency weights are:
Foreign exchange market turnover, defined as the gross value of all deals concluded
during the month, and is measured in terms of the nominal or notional amount of the
contracts. It includes spot transactions, outright forwards, foreign exchange swaps,
currency options and currency swaps. The data is provided by the Bank for International
Settlements (BIS), which coordinates a global central bank survey of foreign exchange
and derivatives market activity.37 For the April 2010 Survey, 53 central banks and
monetary authorities participated, collecting data from about 1,300 dealers on turnover in
foreign exchange instruments and OTC interest rate derivatives.
37
Triennial Central Bank Survey, Bank for International Settlements; several issues. See for instance Triennial
Central Bank Survey of Foreign Exchange and Derivatives Market Activity in April 2010 - Preliminary Results.
Monetary and Economic Department, BIS. September, 2010. http://www.bis.org/publ/rpfx10.htm.
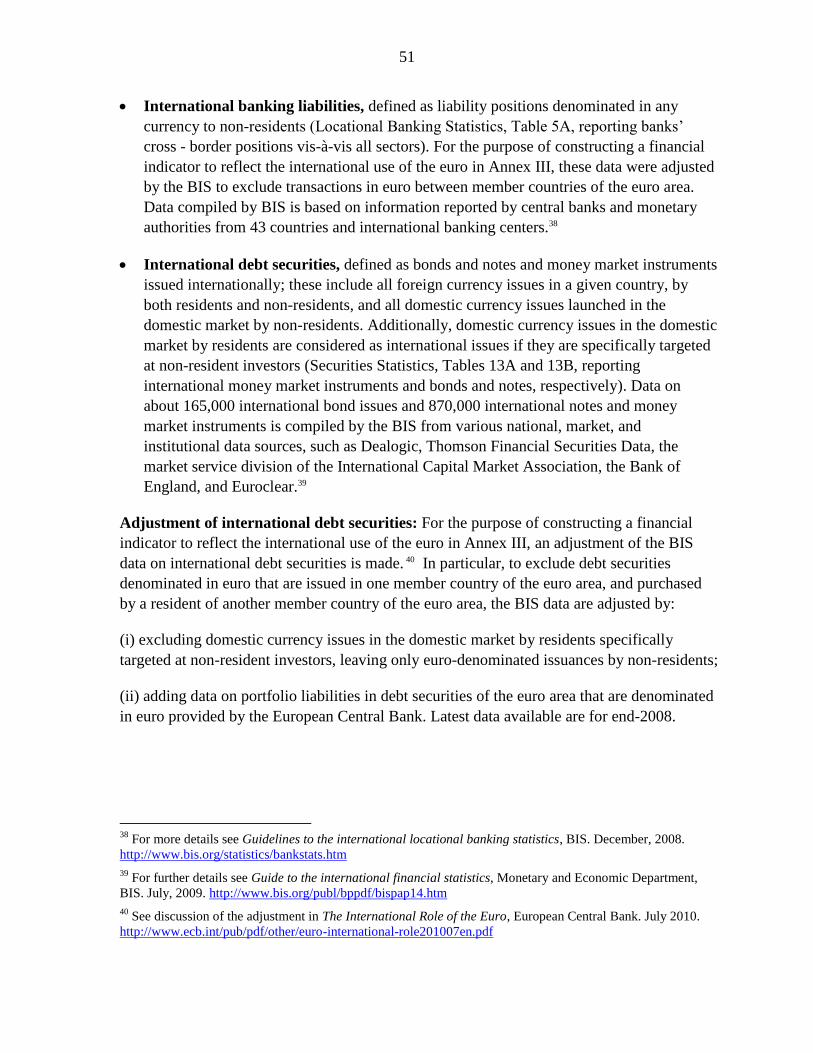
51
International banking liabilities, defined as liability positions denominated in any
currency to non-residents (Locational Banking Statistics, Table 5A, reporting banks’
cross - border positions vis-à-vis all sectors). For the purpose of constructing a financial
indicator to reflect the international use of the euro in Annex III, these data were adjusted
by the BIS to exclude transactions in euro between member countries of the euro area.
Data compiled by BIS is based on information reported by central banks and monetary
authorities from 43 countries and international banking centers.38
International debt securities, defined as bonds and notes and money market instruments
issued internationally; these include all foreign currency issues in a given country, by
both residents and non-residents, and all domestic currency issues launched in the
domestic market by non-residents. Additionally, domestic currency issues in the domestic
market by residents are considered as international issues if they are specifically targeted
at non-resident investors (Securities Statistics, Tables 13A and 13B, reporting
international money market instruments and bonds and notes, respectively). Data on
about 165,000 international bond issues and 870,000 international notes and money
market instruments is compiled by the BIS from various national, market, and
institutional data sources, such as Dealogic, Thomson Financial Securities Data, the
market service division of the International Capital Market Association, the Bank of
England, and Euroclear.39
Adjustment of international debt securities: For the purpose of constructing a financial
indicator to reflect the international use of the euro in Annex III, an adjustment of the BIS
data on international debt securities is made. 40 In particular, to exclude debt securities
denominated in euro that are issued in one member country of the euro area, and purchased
by a resident of another member country of the euro area, the BIS data are adjusted by:
(i) excluding domestic currency issues in the domestic market by residents specifically
targeted at non-resident investors, leaving only euro-denominated issuances by non-residents;
(ii) adding data on portfolio liabilities in debt securities of the euro area that are denominated
in euro provided by the European Central Bank. Latest data available are for end-2008.
38
For more details see Guidelines to the international locational banking statistics, BIS. December, 2008.
http://www.bis.org/statistics/bankstats.htm
39 For further details see Guide to the international financial statistics, Monetary and Economic Department,
BIS. July, 2009. http://www.bis.org/publ/bppdf/bispap14.htm
40 See discussion of the adjustment in The International Role of the Euro, European Central Bank. July 2010.
http://www.ecb.int/pub/pdf/other/euro-international-role201007en.pdf