Review of the December 2007 Flood Event at Doty
24
Review of the December 2007 Flood Event at Doty Technical Workshop Lacey Community Center October 30, 2013
Transcript of Review of the December 2007 Flood Event at Doty
Review of the December 2007 Flood Event at Doty
Technical Workshop Lacey Community Center October 30, 2013

2
December 2007 Flood Event
10/30/2013
0
10000
20000
30000
40000
50000
60000
70000
80000
90000
100000
110000
Disc
harg
e (c
fs)
December 2007 Event Chehalis near DotySF Chehalis near WildwoodNewakum near ChehalisSkookumchuck near BucodaChehalis near Grand MoundChehalis at PorterSatsop near Satsop
3
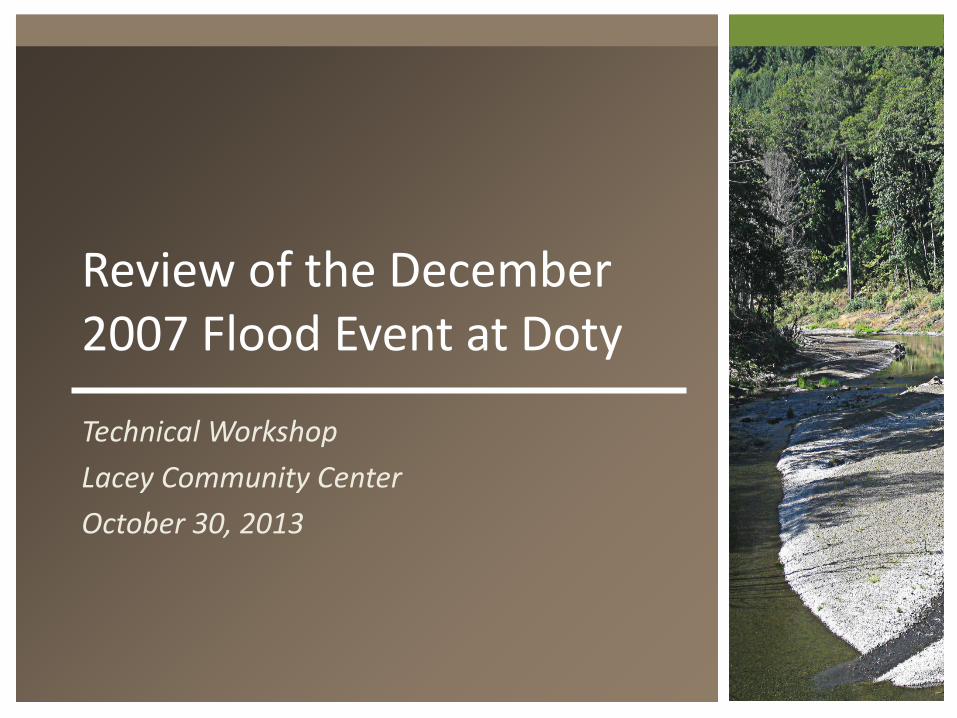
Doty gage – failed at 11 AM on December 3, 2007
10/30/2013
305
310
315
320
325
330
335
340
12/2/2007 0:00 12/2/2007 12:00 12/3/2007 0:00 12/3/2007 12:00 12/4/2007 0:00 12/4/2007 12:00 12/5/2007 0:00
Wat
er S
urfa
ce E
leva
tion
(feet
NAV
D)
Date and Time
December 2007 Event Chehalis near Doty (USGS)

4
Doty Gage Indirect Discharge Measurement
Slope Area Method –
Where: Q = Flow (cfs) V = Velocity (fps) n = Manning’s N (roughness) R = Hydraulic radius = A/Pw
S = Slope (ft/ft)
A = Area (ft2) Pw = Wetted perimeter (ft)
10/30/2013
VAQ
SRn
V
=
= 3/249.1

5
Key Assumption - Manning’s N
Selected based on judgment of the hydraulic engineer considering:
1. Bed material 2. Bank vegetation 3. Form roughness (structure and shape) 4. Turbulence 5. Depth of flow 6. Sediment? 7. Wood in transit?
10/30/2013

6
Channel at site of USGS indirect measurement
10/30/2013
7
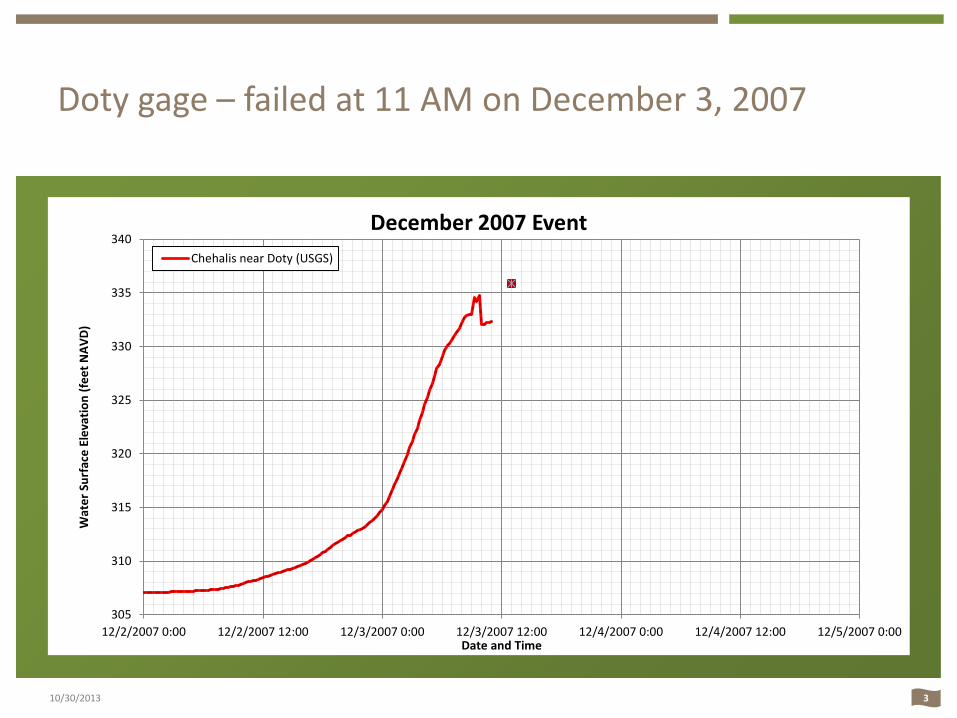
Other key components - Area
Area estimated based on cross section surveys and high water marks (HWMs)
Some potential uncertainties:
1. Wave action at edge of flow (± 0.5 feet) 2. Effect of wood on flow area and depth 3. Velocity drawdown in high velocity zone (versus
edge)
10/30/2013

8
USGS Survey after Dec 2007 Flood
10/30/2013

9
USGS Cross Sections
10/30/2013
10
USGS Rating Curves and Discharge Measurements
10/30/2013
305
310
315
320
325
330
335
340
0 10000 20000 30000 40000 50000 60000 70000
Elev
atio
n (N
AVD)
Discharge (cfs)
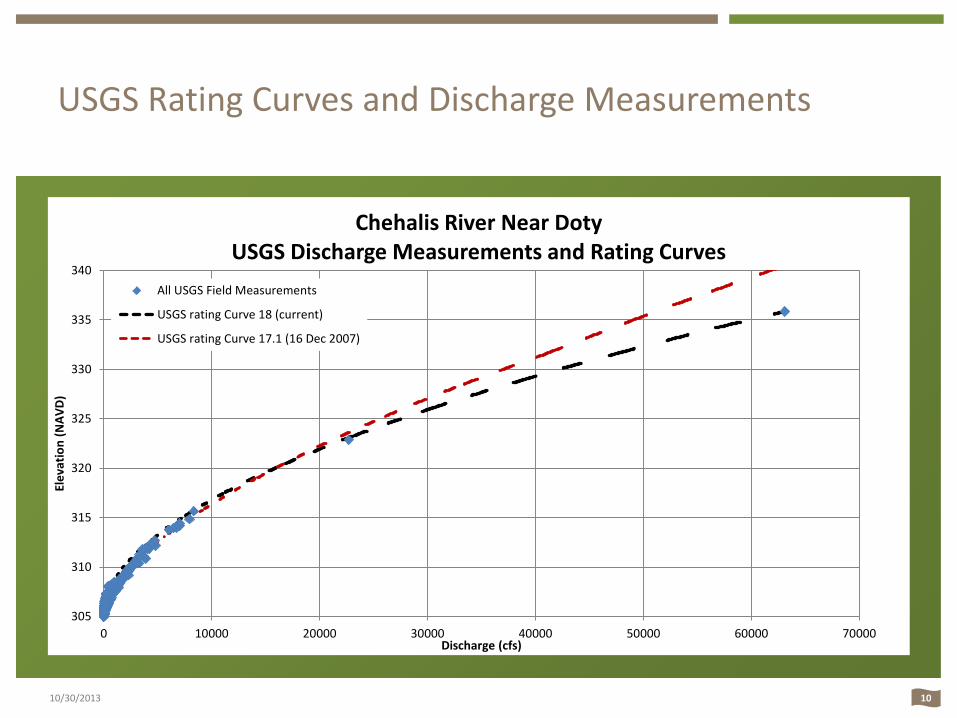
Chehalis River Near Doty USGS Discharge Measurements and Rating Curves
All USGS Field Measurements
USGS rating Curve 18 (current)
USGS rating Curve 17.1 (16 Dec 2007)

11
USGS Rating Curves and Discharge Measurements
10/30/2013
300.00
305.00
310.00
315.00
320.00
325.00
330.00
335.00
340.00
345.00
0 25 50 75 100 125 150 175 200 225 250 275 300 325
Wat
er S
urfa
ce E
leva
tion
(feet
NAV
D)
Chehalis River Near Doty USGS Cross Section near Doty gage
XS-2
Dashed lines represent elevation of actual discharge measurements: 1) Dec 3, 2007 (indirect) - 63,100 cfs 2) Jan 20, 1972 (indirect) - 22,700 cfs 3) Dec 16, 1939 (highest direct measurement) - 8360 cfs 4) March 16, 2012 (highest direct measurement since 2000) - 4580 cfs

12
WSE HEC-RAS Model v. Rating 18
10/30/2013

13
WSE HEC-RAS Model v. Rating 17.1
10/30/2013
14
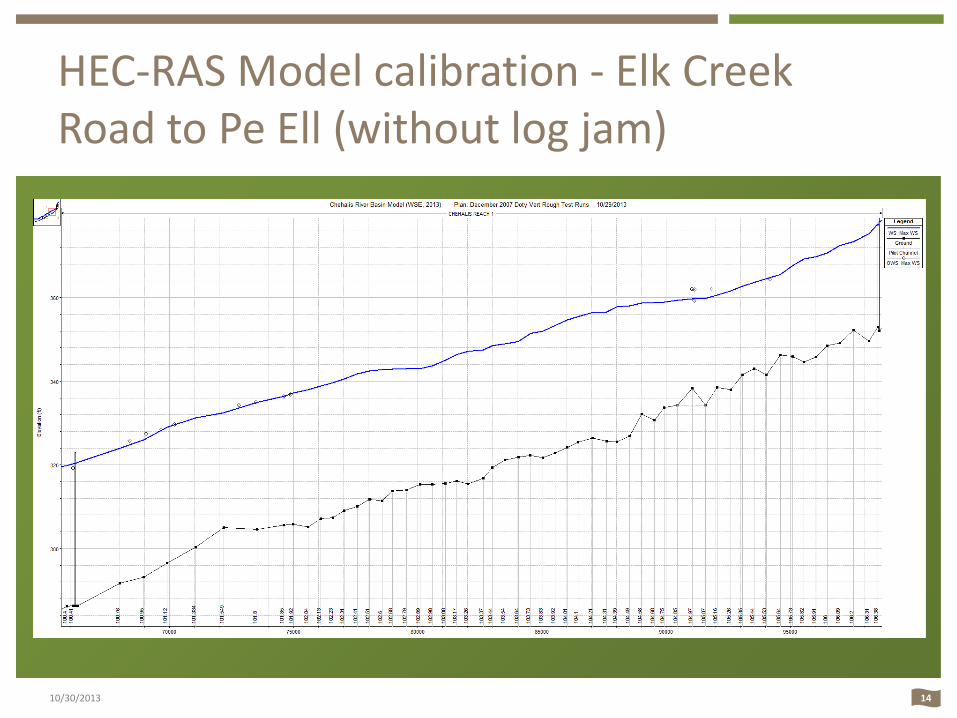
HEC-RAS Model calibration - Elk Creek Road to Pe Ell (without log jam)
10/30/2013
15
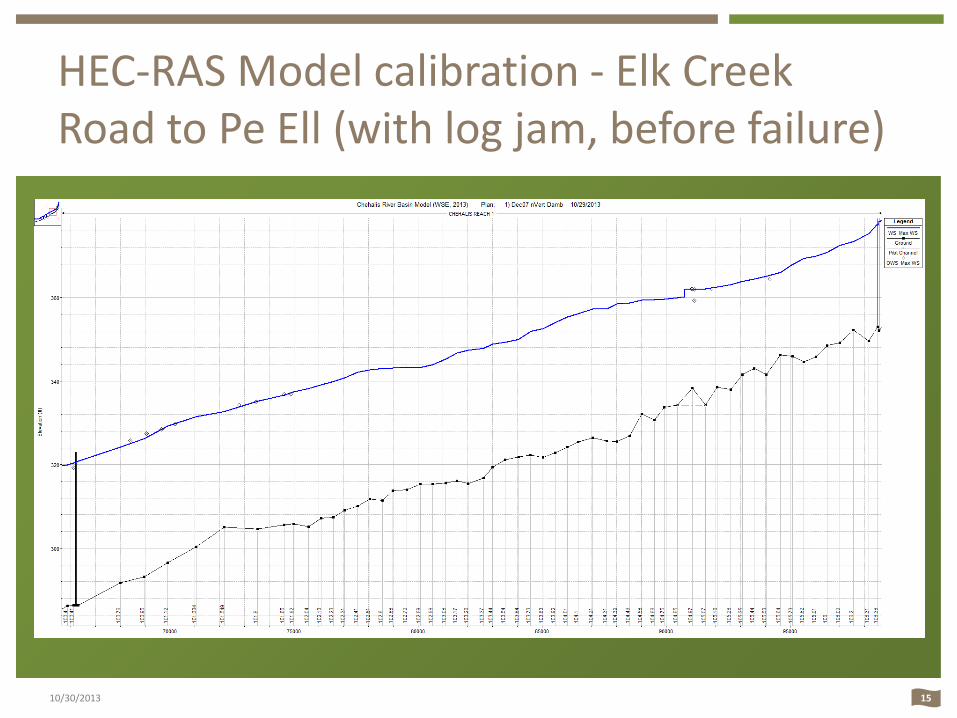
HEC-RAS Model calibration - Elk Creek Road to Pe Ell (with log jam, before failure)
10/30/2013
16
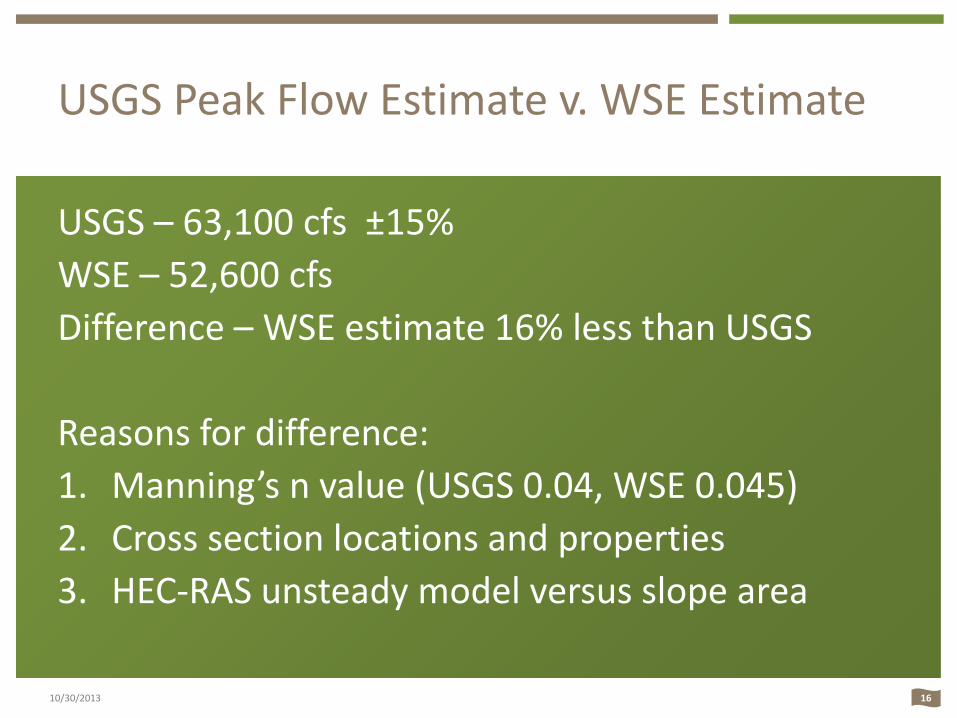
USGS Peak Flow Estimate v. WSE Estimate
USGS – 63,100 cfs ±15% WSE – 52,600 cfs Difference – WSE estimate 16% less than USGS Reasons for difference: 1. Manning’s n value (USGS 0.04, WSE 0.045) 2. Cross section locations and properties 3. HEC-RAS unsteady model versus slope area
10/30/2013
17
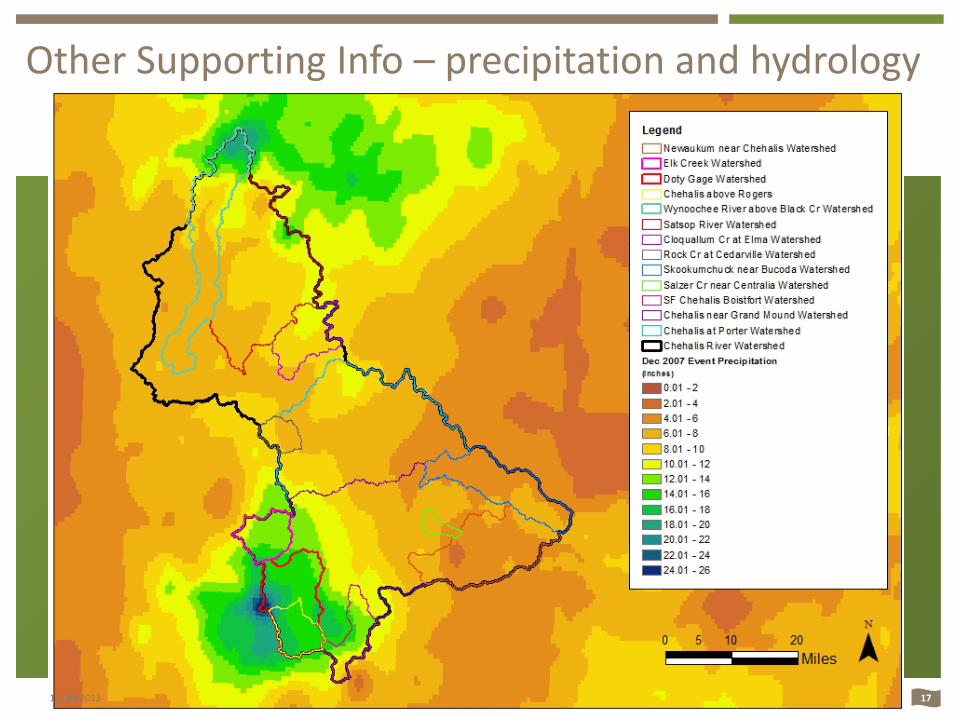
Other Supporting Info – precipitation and hydrology
10/30/2013

18
Precipitation Recurrence
Based on maximum 24-hour period during December 3, 2007 flood event
NEXRAD based data ground controlled using 496 precipitation stations
10/30/2013

19
December 2007 Precipitation Statistics
10/30/2013
Basin Gage No. WSDOT Ave. 100yr24hr precip Dec 2007 Event Ratio (Dec2007:100yr24hr)
Doty - Chehalis 12020000 7.04 16.00 2.27
Elk Creek 12020500 6.89 13.35 1.94
SF Chehalis at Boistfort 12021000 5.99 12.17 2.03
Newaukum 12025000 5.15 5.61 1.09
Skookumchuck 12026400 4.82 5.90 1.23
Grand Mound - Chehalis 12027500 5.39 9.37 1.74
20
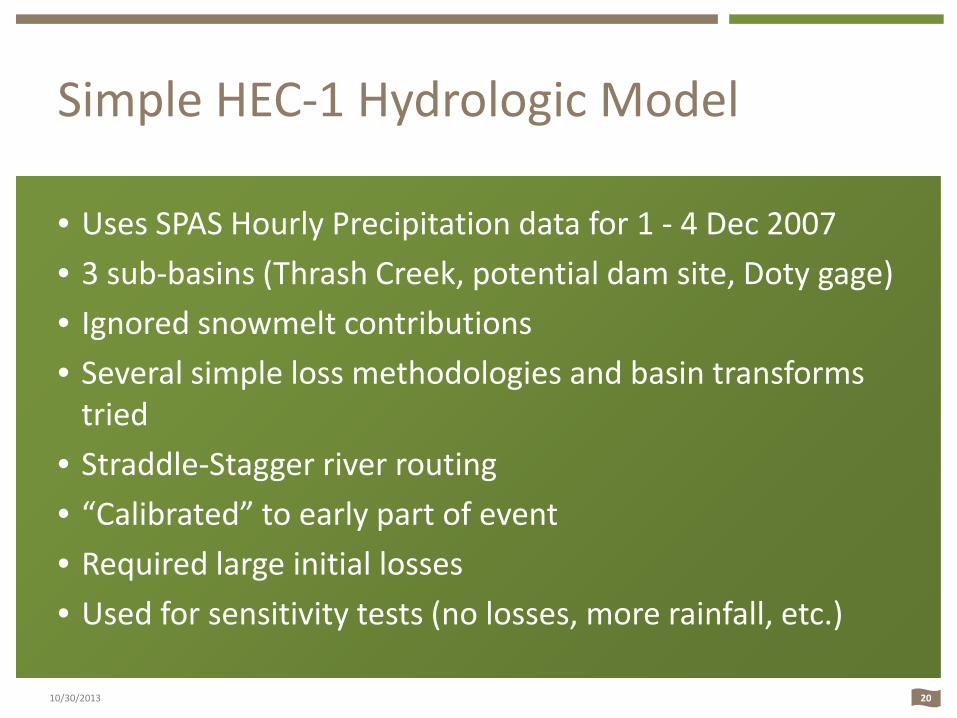
Simple HEC-1 Hydrologic Model
10/30/2013
• Uses SPAS Hourly Precipitation data for 1 - 4 Dec 2007 • 3 sub-basins (Thrash Creek, potential dam site, Doty gage) • Ignored snowmelt contributions • Several simple loss methodologies and basin transforms
tried • Straddle-Stagger river routing • “Calibrated” to early part of event • Required large initial losses • Used for sensitivity tests (no losses, more rainfall, etc.)

21
Simple HEC-1 Hydrologic Model
10/30/2013
0
10000
20000
30000
40000
50000
60000
70000
80000
12/2/2007 0:00 12/2/2007 12:00 12/3/2007 0:00 12/3/2007 12:00 12/4/2007 0:00 12/4/2007 12:00 12/5/2007 0:00
Disc
harg
e (c
fs)
Date
December 2007 Event HEC-1 Simulation Doty - Calib 1HEC-1 Simulation Doty - HoltanHEC-1 Simulation Doty - No LossesHEC-1 Simulation Doty - 60% more rainChehalis near Doty (USGS)
22
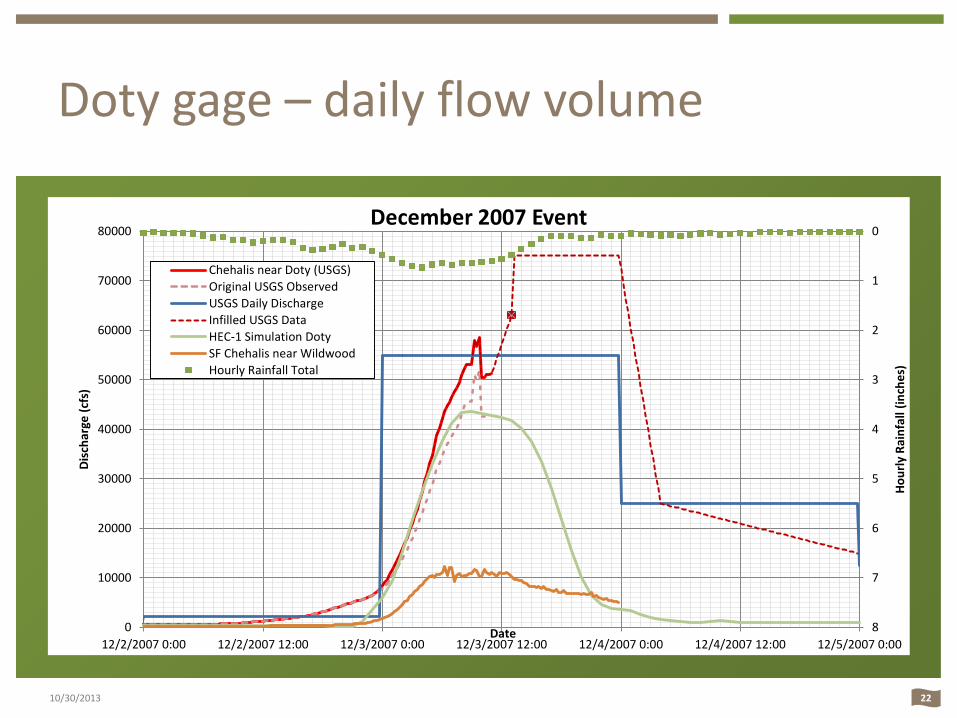
Doty gage – daily flow volume
10/30/2013
0
1
2
3
4
5
6
7
80
10000
20000
30000
40000
50000
60000
70000
80000
12/2/2007 0:00 12/2/2007 12:00 12/3/2007 0:00 12/3/2007 12:00 12/4/2007 0:00 12/4/2007 12:00 12/5/2007 0:00
Hour
ly R
ainf
all (
inch
es)
Disc
harg
e (c
fs)
Date
December 2007 Event
Chehalis near Doty (USGS)Original USGS ObservedUSGS Daily DischargeInfilled USGS DataHEC-1 Simulation DotySF Chehalis near WildwoodHourly Rainfall Total

23
Doty gage – daily flow volume
Basin average rainfall – 1-4 December 2007 = 16.0” Basin average runoff – 2-5 December 2007 = 32.4” Daily discharge for December 3rd is not possible
given hourly discharges through 11 AM and estimated peak discharge
Currently discussing this with USGS
10/30/2013

24
Potential Implications on Hydrology
10/30/2013
Dec 2007 Event Removed
1939 - 2012 With Historic Period 1939 - 2012 With Historic Period 1939 - 2012
0.2 500 59,000 54,000 54,000 50,000 39,000
0.5 200 47,000 43,000 43,000 41,000 34,000
1 100 39,000 37,000 37,000 35,000 30,000
2 50 32,000 30,000 31,000 29,000 26,000
4 25 26,000 25,000 25,000 24,000 22,000
10 10 20,000 19,000 19,000 19,000 18,000
20 5 15,000 15,000 15,000 15,000 14,000
50 2 9,900 9,900 10,000 9,900 10,000
80 1.25 6,900 7,000 7,000 7,000 7,100
90 1.11 5,900 6,000 5,900 6,000 6,000
95 1.05 5,200 5,300 5,200 5,300 5,300
99 1.01 4,300 4,400 4,300 4,300 4,200
Note:
2 Frequency analyses conducted using US Army Corps of Engineers HEC-SSP Software
1 All frequency analyses based on the methods of Bulletin 17B of the Hydrology Subcommittee, Interagency Advisory Committee on Water Data, Revised September 1981
Percent Chance
Exceedence
USGS Doty Gage Computed Frequency Curve - Flow (cfs)
All Observed Data Dec 2007 Event Set to 52,660 cfsReturn Period (years)