REVIEW OF STRIKES IN 1936 - Bureau of Labor · PDF fileReview of Strikes in 1936 1 T HE year...
16
Serial No. R. 569 UNITED STATES DEPARTMENT OF LABOR Frances Perkins, Secretary BUREAU OF LABOR STATISTICS Isador Lubin, Commissioner REVIEW OF STRIKES IN 1936 Prepared by Division of Industrial Relations FLORENCE PETERSON, Chief [From the Monthly Labor Review (May 1937) of the Bureau of Labor Statistics, United States Department of Labor] UNITED STATES GOVERNMENT PRINTING OFFICE WASHINGTON : 1937
Transcript of REVIEW OF STRIKES IN 1936 - Bureau of Labor · PDF fileReview of Strikes in 1936 1 T HE year...

Serial No. R. 569
UNITED STATES DEPARTMENT OF LABORFrances Perkins, Secretary
BUREAU OF LABOR STATISTICSIsador Lubin, Commissioner
REVIEW OF STRIKES IN 1936
Prepared by
Division of Industrial RelationsFLORENCE PETERSON, Chief
[From the Monthly Labor Review (May 1937)of the Bureau of Labor Statistics, United
States Department of Labor]
UNITED STATES
GOVERNMENT PRINTING OFFICE
WASHINGTON : 1937

Review of Strikes in 1936 1
THE year 1936 was characterized by a relatively large number ofstrikes which, on the average, were small as measured in terms of
number of workers involved and length of duration. There were 2,172strikes in 1936—an increase of 8 percent over 1935, an increase of 17percent over 1934, and a larger number than in any year since 1921.However, the number of workers involved in the 1936 strikes (788,648)was 29 percent less than in 1935 and 46 percent less than in 1934.The number of man-days of idleness because of strikes in 1936(13,901,956) was 10 percent less than in 1935 and 29 percent less thanin 1934.
The decline in the number of workers involved in 1936 as comparedwith the 2 previous years is explained in part by the fact that therewere no extremely large strikes during the year, whereas in September1935 there was the short but widespread strike of 400,000 bituminous-coal miners, and in September 1934 there was the general textilestrike, in which more than 300,000 workers were involved.
The Bureau of Labor Statistics obtains its statistical informationon strikes from the companies and unions directly involved in thedisputes, as well as from various Federal and State labor boards andconciliation services. The first information or notice about strikescomes from more than 650 daily papers, labor papers, and journals.Letters or report forms are then sent to representatives of the partiesdirectly involved, in order to get detailed and accurate information.The strike figures include all strikes or lock-outs in which as many assix workers were involved and which lasted as long as 1 day. Therewere press notices of 21 strikes during 1936 on which detailed informa-tion was not obtained and these cases are not included in this report.These were undoubtedly small disputes and some of them wereprobably no more than threatened strikes. With the exception ofthese cases, it is believed that the following tables include all strikesoccurring in 1936 in the United States.
The trend of strikes during the past 21 years is presented in table 1.Prepared by Don Q. Crowther of the Bureau's Industrial Relations Division.
(1)

2
Table 1.-Number of Strikes, Workers Involved, and Man-Days Idle, 1916 to 1936
Year
Number of- Index(1927-29=100)
Strikes Workersinvolved
Man-daysidle Strikes Workers
involvedMan-days
idle
1916 3,789 1, 599, 917 (2) 509 51419171918.
4,4503,353
1, 227, 2541, 239, 989
(2) 598451
495399
)(22)1910 3,630 4,160, 348 (2) 488 1,337 (2)1920 3,411 1, 463, 054 (I) 458 470 (2)
1921 2,385 1, 099, 247 (2) 321 353 (2)1922 1,112 1, 612, 562 (2) 149 617 (2)1923 1,553 756, 584 209 243 (I)1924 1,249 654,641((2)
2) 168 210 (2)1925 1,301 428, 416 (2) 175 138 (2)
1926 1, 035 329, 592 (2) 139 106 (2)1927 707 329, 939 26, 218, 628 95 106 1781928 604 314,210 12, 631, 863 81 101 861929 921 288,572 351, 540 124 93 361930 637 182,975 3, 316, 808 86 59 231931 810 341, 817 893, 244 109 110 471932 841 324,210 10, 502, 033 113 104 711933 695 1, 168, 272 16, 872, 128 228 376 1151934 1,856 1, 466, 695 19, 591, 949 250 472 1331935 2,014 1, 117, 213 15, 456, 337 271 359 1051936 172 788,648 13, 901, 956 292 254 94/737 1,, 7q0 / ta o 4, 2 / 28, 1,25, a 7 L37 598 /5:3/Tile number of workers involved 'n stfikUrrom lt161 g it26 isTioitVklaii for tli3e7eitire nuiger of stria,
The missing information is for the smaller disputes, however, and it is believed that the totals here givenare fairly accurate.
2 No information available.
Monthly Trend
THE number of strikes in progress during the months of 1936followed the usual seasonal trend, with the greatest number duringthe summer and fall and a noticeable decline in the winter months.There were more workers involved, however, and more man-days ofidleness in the strikes in progress, during November and Decemberthan in any previous months of the year. This was due principallyto the fact that a few large strikes, particularly in the water-trans-portation and glass-manufacturing industries, which began in October,continued through the last 2 months of the year.
Comparative monthly figures on strikes for 1935 and 1936 areshown in table 2. The largest number of strikes in any month if).1936 was 234 in September and the smallest was 132 in December.In 1935 the largest number was 239 in August and the smallest wa sp
90 in December. The large number of workers involved in strikesin September 1935 was due to the short strike of 400,000 bituminous-coal miners. The months of December in 1935 and in 1936 were at.the opposite extremes in the yearly story of man-days of idleness.In December 1935 there were fewer man-days of idleness because ofstrikes than in any other month of the year, whereas in December1936 there were more man-days of idleness than in any other month.

-
3Table 2.-Strikes in 1935 and 1936, by Months
Month
Number of strikes- Number of workers involved instrikes-
Man-days idle dur-ing month
Beginningin month
In progressduringmonth
Beginning inmonth
In progress dui,ing month
1935 1936 1935 1936 1935 1936 1935 1936 1935 1936
Year 2, 014 2,172 1,117, 213 788, 648 15, 456, 337 13, 901, 956
January 140 167 213 251 81,194 32,406 92,630 59,153 720,778 635,519February 149 148 232 250 64, 238 63,066 96,533 89,735 836,498 748,491March 175 185 277 304 53, 089 75,191 98, 457 122,162 966, 980 1, 331,162April 180 183 294 313 67, 857 65, 379 124,174 95, 526 1,178, 851 699, 900May 174 206 307 340 102, 491 72, 824 151, 163 123, 030 1, 697, 848 1, 019,171June 189 188 319 309 48,917 63,429 129,784 133,531 1, 311, 278 1, 327, 678July 184 173 317 324 70, 046 38, 017 141, 829 125, 281 1, 297, 730 1,105, 480August 239 228 377 355 74, 313 68, 752 150, 835 118, 268 1,191, 663 911, 216September 162 234 311 379 453, 820 65, 994 514, 427 130, 875 3, 027, 040 1, 063,100October 190 192 332 335 48, 223 100, 845. 133, 742 148, 570 1, 562, 908 1, 053, 878November 142 136 274 252 38,279 70,116 100,732 157,007 1, 003, 852 1,940, 628December 90 132 210 258 14, 746 72,639 61, 782 184, 859 660, 911 2, 065, 733
Industries Affected
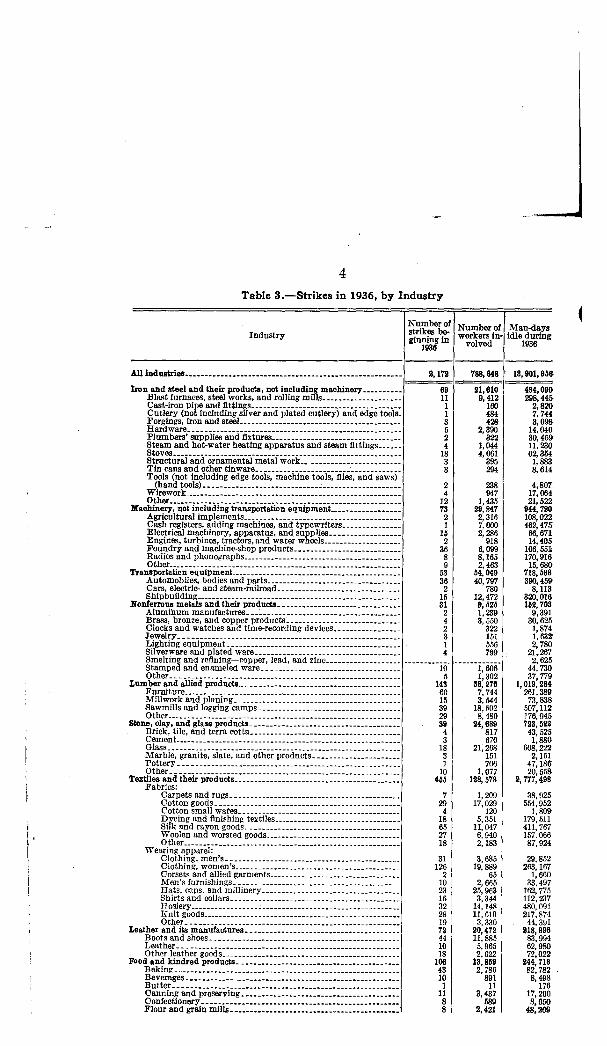
BY FAR the greatest number of strikes in any one industry groupwas in the textile industries where 455 occurred during 1936. Theother industry groups affected by large numbers of strikes were:Building and construction, 230; transportation and communication,165; trade, 164; lumber and allied products, 143; domestic and personalservice, 116; and food and kindred products, 106. The industrygroups with the largest numbers of workers involved in strikes duringthe year were: Textiles, 128,578; transportation and communication,83,231; rubber products, 76,699; domestic and personal service,72,246; extraction of minerals, 56,063; and transportation equipment,54,049. Nearly 60 percent of the 13,901,956 man-days of idlenessbecause of strikes in 1936 occurred in five industry groups: Textiles,2,777,498; transportation and communication, 2,095,435; extractionof minerals, 1,237,470; lumber and allied products, 1,019,284; andmachinery manufacturing industries, 944,720.
Table 3 shows the classification of all strikes beginning in 1936, byindustries. The general strike indicated at the end of the table wasthe 3-day general strike in Pekin, Ill., in February 1936, called insympathy with another strike in the same city.
4Table 3.-Strikes in 1936, by Industry
IndustryNumber ofstrikes be-ginning in
1936
Number ofworkers in-
volved
Man-daysidle during
1936
All industries 2, 172 788, 848 IS, 901, 958
Iron and steel and their products, not including machinery 89 21,810 494, 090Blast furnaces, steel works, and rolling mills 11 9, 412 298, 445Cast-iron pipe and fittings 1 160 2, 820Cutlery (not including silver and plated cutlery) and edge tools_ 1 484 7, 744Forgings, iron and steel 3 428 3, 098Hardware 5 2, 390 14, 040Plumbers' supplies and fixtures 2 322 30, 469Steam and hot-water heating apparatus and steam fittings 4 1, 044 11, 230Stoves 18 4, 061 62, 354Structural and ornamental metal work 3 395 1, 883Tin cans and other tinware 3 294 8, 614Tools (not including edge tools, machine tools, files, and saws)
(hand tools) 2 238 4,807Wirework 4 947 17, 064Other 12 435 21, 522
Machinery, not including transportation equipment 73 29, 247 944, 720Agricultural implements 2 316 108,022Cash registers, adding machines, and typewriters 1 7, 000 462, 475Electrical machinery, apparatus, and supplies 15 2, 286 66, 871Engines, turbines, tractors, and water wheels 2 918 14,405Foundry and machine-shop products 36 6,099 106, 551Radios and phonographs 8 8, 165 170, 916Other 9 2,483 15, 680,
Transportation equipment 53 54, 049 718, 588Automobiles, bodies and parts 36 40, 797 390, 459Cars, electric- and steam-railroad 2 780 8, 113Shipbuilding 15 12,472 320, 016
Nonferrous metals and their products 31 9, 525 152, 703Alumihum manufactures 2 1,239 9,391Brass, bronze, and copper products 4 3, 550 30,825Clocks and watches and time-recording devices 2 322 1, 874Jewelry 3 151 1. 632Lighting equipment 1 556 2, 780Silverware and plated ware 4 799 21, 267Smelting and refining-copper, lead, and zinc 2, 625Stamped and enameled ware 10 1, 606 44, 730Other I, 302 37,779
Lumber and allied products 143 38, 270 1, 019, 284Furniture 60 7, 744 261,389Millwork and planing 15 3, 544 73, 838Sawmills and logging camps 39 18,502 507,112Other 29 8, 480 176, 945
Stone, clay, and glass products 39 24,889 723, 522Brick, tile, and terra cotta 4 817 43, 525Cement 3 670 1,880Glass 18 21, 268 608,222Marble, granite, slate, and other products 3 151 2, 151Pottery 1 706 47,186Other 10 1, 077 20,558
Textiles and their products 455 128, 578 2, 777,498Fabrics:
Carpets and rugs 7 1, 209 38,925Cotton goods 29 17,029 554,952Cotton small wares 4 120 1,809Dyeing and finishing textiles 18 5,351 179, 511Silk and rayon goods 65 11,047 411, 767Woolen and worsted goods 27 6,940 157. 066Other 18 2,183 87, 924
Wearing apparel:Clothing, men's 31 3,685 29,852Clothing, women's 126 19, 889 263, 167Corsets and allied garments 2 65 1, 660Men's furnishings 10 2, 665 33, 497Hats, caps, and millinery 23 25, 963 162, 775Shirts and collars 16 3, 344 112,237Hosiery 32 14,148 480, 091Knit goods 28 11,610 217, 874Other 19 3, 330 44. 391
Leather and its manufactures 72 20, 472 918, 996Boots and shoes 44 11, 885 83, 994Leather 10 5,965 62, 980Other leather goods 18 2,622 72,022
Food and kindred products 106 13, 859 244, 718Baking 43 2, 786 82,782Beverages 10 891 8, 498Butter 1 11 176Canning and preserving 11 3, 437 17, 200Confectionery 8 589 8, 650Flour and grain mills 8 2, 421 48,269

5Table 3.-Strikes in 1936, by Industries-Continued
IndustryNumber ofstrikes be-ginning M
1936
Number ofNumberworkers in-
volved
..,
Man-daysidle during
1936
Food and kindred products-Continued.Ice cream 2 28 268Slaughtering and meat packing 18 2,905 73,059Sugar refining, cane 1 702 5, 610Other 4 89 206
Tobacco manufactures 8 1, 090 12, 573Cigars 6 1, 090 12, 573
Paper and printing 47 5, 203 191, 088Boxes, paper 13 2, 932 91, 575Paper and pulp 7 671 12,840Printing and publishing-
Book and job 8 270 4, 687Newspapers and periodicals 10 808 62, 919
Other 9 522 19,047Chemicals and allied products 20 13, 990 230, 788
Chemicals 4 1, 378 31, 144• Explosives 1 30 870
Fertilizers 1 38 342Paint and varnishes 3 815 13, 398Petroleum refining 4 2, 521 61, 935Rayon and allied products 2 8, 905 114, 715Other 5 503 8,362
Rubber products_ 43 78, 899 477, 288Rubber tires and inner tubes 22 70, 571 443, 700Other rubber goods 21 6, 128 33, 586
Miscellaneous manufacturing 78 9, 538 211, 089Electric light, power, and manufactured gas 9 904 11, 142Broom and brush 3 157 2, 047Furriers and fur factories 19 2, 529 70, 212Other___ 45 5,946 127,668
Extraction of minerals 88 58,083 1, 237, 470Coal mining, anthracite 26 23, 073 264, 545Coal mining, bituminous 38 19, 648 533, 314Metalliferous mining 9 6, 959 247, 528Quarrying and nonmetallic mining 7 6, 274 191, 043Other 3 109 1, 040
Transportation and communication 185 83,231 2, 095, 435Water transportation 79 68, 761 1, 961, 267Motortruck transportation 55 9, 235 75, 953Motorbus transportation 12 920 10, 144Taxicabs and miscellaneous 13 3, 460 23, 561Electric railroad 1 60 240Steam railroad 2 587 22, 870Radio broadcasting and transmitting 1 12 912Other 2 196 488
Trade 184 30,532 328,749Wholesale 51 6,837 115, 798Retail 113 23, 895 210, 951
Domestic and personal service 116 72, 248 881,114Hotels, restaurants, and boarding houses 49 2, 141 38, 283Personal service, barbers, beauty parlors 8 24, 805 289, 960Laundries 26 1, 519 63, 538Dyeing, cleaning, and pressing 18 4, 469 52, 516Elevator and maintenance workers (when not attached to spe-
cific industry) 12 39, 081 417, 094Other 3 231 1, 723
Professional service 24 1, 052 14,394Recreation and amusement 13 766 6, 118Professional 3 86 879Semiprofessional, attendants, and helpers 8 200 7, 400
Building and construction 230 83, 225 345, 351Buildings, exclusive of P. W. A 111 22, 355 180, 208All other construction (bridges, docks, etc., and P. W. A.
buildings) 119 10,870 165, 143Agriculture, etc 42 21, 048 348, 804
Agriculture 28 15, 369 259, 120Fishing 14 5,677 89, 684
W. P. A., relief, and resettlement projects 80 40, 018 282, 214Other nonmanufacturing industries 34 2, 920 29, 042General strike 1 1, 500 4, 600
States Affected
MORE than one-third of the 2,172 strikes in 1936 were in New Yorkand Pennsylvania. The number of strikes in these States was 393

6
and 365 respectively. California experienced 194 strikes during theyear, Ohio 177, New Jersey 126, and Massachusetts 111. The strikesin these six States constituted more than 60 percent of the strikesthroughout the country.
Table 4.—Strikes in 1936, by States
StateNumberof strikesbeginning
in 1936
Workers involved Man-days idle during1936
Number Percentof total
Averageper strike .,•• limnerNumber Percent
of total
All States 2 2,172 788, 648 100.0 363 13, 901, 956 100, 0
Alabama 31 10, 126 1. 3 327 278, 674 2.0Arizona 2 940 .1 470 1, 880 (I)Arkansas 4 2,825 .4 706 64, 602 .5California 194 70, 027 8.9 361 2, 038,101 14.7Colorado 8 1, 707 .2 213 13, 084 .1
Connecticut 45 9, 435 1. 2 210 178, 674 1. 3Delaware 6 249 (I) 42 2, 823 (I)District of Columbia 16 1, 231 .2 77 22, 474 .2Florida 7 1, 491 .2 213 13, 864 .1Georgia 10 2, 558 .3 256 64, 850 .5
Idaho 5 2, 617 .3 523 123, 375 .9Illinois 98 24,094 3. 1 246 409, 748 2.9Indiana 34 11,726 1. 5 345 153, 596 1. 1Iowa 10 1, 210 .2 121 45, 297 .3Kansas 5 265 (I) 53 998 (1)
Kentucky 9 1, 305 .2 145 358, 713 2. 6Louisiana 17 3,082 .4 181 31,858 .2Maine 7 831 .1 119 5,811 (1)Maryland 27 19, 131 2.4 709 203,300 1.5Massachusetts 111 34, 193 4. 3 308 432, 223 3.1
Michigan 45 26,986 3. 4 600 214,182 1.5Minnesota 54 14, 214 1.8 263 249, 744 1. 8Mississippi 3 285 (I) 95 2, 800 (1)Missouri 35 9, 821 1.2 281 158, 194 1.1Montana 6 1, 215 .2 203 10, 628 .1
Nebraska 5 290 (I) 58 1, 715 (I)Nevada 3 169 (I) 56 247 (9New Hampshire 5 1, 093 1 219 13, 288 .1New Jersey 126 30, 024 3.8 238 560, 953 4.0New Mexico 4 885 .1 221 35, 165 .3
New York 393 160, 734 20. 5 409 1, 943, 992 14.0North Carolina 13 5, 319 .7 409 85, 707 .8North Dakota 4 647 .1 162 1, 878 (I)Ohio 177 124, 803 15.9 705 1, 742, 788 12.5Oklahoma 6 871 .1 145 40, 396 .3
Oregon 53 16, 009 2.0 302 391, 174 2.8Pennsylvania 365 118, 204 15.0 324 2, 016, 541 14. 5Rhode Island 27 5, 810 .7 215 82, 289 .6South Carolina 16 4, 445 .6 278 257, 375 1.9Tennessee 23 2,760 .3 120 62,322 .4
Texas 38 7,058 .9 186 93, 641 .7Utah 4 3, 382 .4 846 136, 995 1.0Vermont 3 168 (I) 56 57, 044 .4Virginia 7 1, 659 .2 237 8, 311 .1Washington 82 28,073 3. 6 342 846,825 8.1
West Virginia 30 7,333 .9 244 140,968 1.0Wisconsin 50 16, 417 2. 1 328 233, 200 1. 7Wyoming 3 800 .1 267 12, 120 .1Interstate (unable to determine num-
ber of workers in each State) I 2 131 (I) 66 57, 529 .4
I Less than Ma of 1 percent.I The sum of this column is more than 2,172. This is due to the fact that 33 strikes which extended across
State lines have been counted as separate strikes in each State affected, with the proper allocation of numberof workers involved and man-days idle. In 2 strikes it was impossible to allocate accurately the workersand man-days to the various States into which the strikes extended.

C
7
The greatest number of workers involved in strikes in any Stateduring the year was in New York, where 160,734 were involved.There were 124,803 workers involved in strikes in Ohio, 118,204 inPennsylvania, and 70,027 in California. Approximately 60 percentof the total number of workers involved in all strikes during the yearwas in these four States.
California experienced the greatest number of man-days of idlenessbecause of strikes during 1936. This was due principally to themaritime strike along the West coast, which began in October andcontinued into 1937.
Cities Affected
THERE were more than twice as many strikes in New York as inany other city of the United States in 1936. New York, with 287strikes, was followed by Philadelphia with 102, San Francisco with76, Los Angeles with 50, and Akron with 43. With the exception ofNew York, and excluding the effect of intercity strikes as explainedbelow, there were more workers involved in strikes and more man-daysof idleness in Akron than in any other city in 1936. This was dueprincipally to a few large strikes in the rubber industry.
Table 5.-Strikes in 1936 in Cities Which Had 10 or More Strikes in Any YearFrom 1927 to 1936
City
Num-ber ofstrikesbegin-ningin 1936
,,,„;1;4377work-ers in-
Man-days idleduring
a,,,,.,--volved
City
Num-ber of
strikesbegin-ning
in 1936
Num-ber of
erwork-vosiveind
Man-days idleduring
1936
Akron_ 43 70, 797 488, 346 Milwaukee 1 24 4, 512 60, 360Allentown 5 811 11,114 Minneapolis 1 30 5, 230 194, 642Baltimore 1 15 2, 961 33, 887 Newark, N. J. 1 7 888 12, 073Birmingham 3 1, 455 5, 005Boston 1 17 7, 226 63, 504 New Bedford 1 7 1,882 38,684
New York (Greater) 1._ _ 287 128, 644 1,368,8138Buffalo 1 13 1, 683 36, 815 Paterson, N. J. 1 14 2, 302 26, 508Chattanooga 2 123 1, 701 Philadelphia 1 102 31, 901 347,198Chicago 39 3, 221 68, 418 Pittsburgh 1 16 3, 256 54, 807Cincinnati 7 600 7, 506Cleveland 1 39 13, 918 124, 928 Portland, Oreg.' 31 3, 632 75, 294
Providence 1 10 2, 070 30, 474Columbus 2 489 23, 705 Reading 6 5, 784 153,144Detroit 1 18 12, 603 102, 690 Rochester 10 3, 941 36, 662Easton, Pa.' 14 1, 586 144, 254 St. Louis 1 20 2, 369 28, 311Elizabeth, N. J 1 8 2, 200 24, 739Erie 3 92 1,909 SanFrancisco(bay area) 1 78 18,882 422,737
Seattle 1 21 2, 775 105, 698Fall River, Mass . 1 9 9, 010 49, 631 Scranton, Pa 5 681 8, 266Haverhill Terre Haute, Ind 2 114 785Houston 1 11 1, 056 14, 467 Toledo 1 22 4, 811 117, 561Jersey City 1 5 812 3, 632Kansas City, Mo 2 2, 472 24, 940 Washington, D. C 16 1, 231 22, 474
Woonsocket 1 7 1, 437 19, 243Los Angeles 1 50 10, 502 239, 497 Worcester, Mass 4 93 4, 083Lynn 1 11 3, 638 25, 464 York, Pa! 2 88 354
1 In addition to the figures shown, this city was also affected by 1 or more strikes which extended into2 or more cities. It was not possible accurately to determine how many workers involved in these intercity
. strikes were employed in each of the cities affected, hence the figures in this table are exclusive of intercitystrikes.
147181-37-2
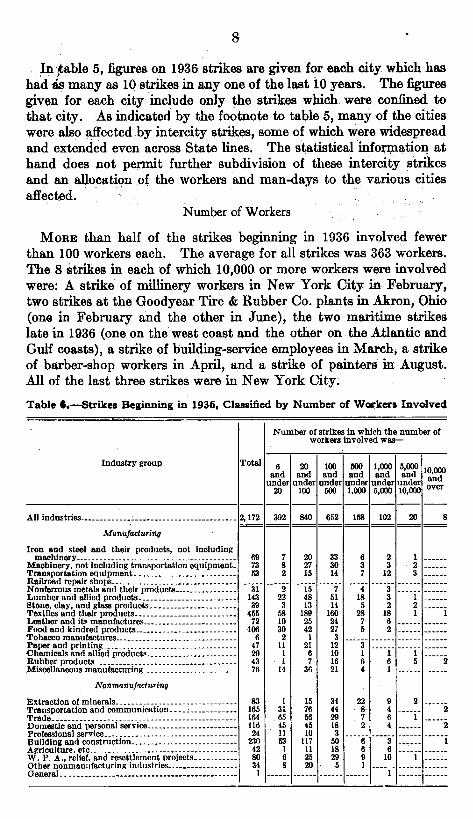
In table 5, figures on 1936 strikes are given for each city which hashad as many as 10 strikes in any one of the last 10 years. The figuresgiven for each city include only the strikes which were confined tothat city. As indicated by the footnote to table 5, many of the citieswere also affected by intercity strikes, some of which were widespreadand extended even across State lines. The statistical information athand does not permit further subdivision of these intercity strikesand an allocation of the workers and man-days to the various citiesaffected. -
Number of Workers
MORE than half of the strikes beginning in 1936 involved fewerthan 100 workers each. The average for all strikes was 363 workers.The 8 strikes in each of which 10,000 or more workers were involvedwere: A strike of millinery workers in New York City in February,two strikes at the Goodyear Tire Sr Rubber Co. plants in Akron, Ohio(one in February and the other in June), the two maritime strikeslate in 1936 (one on the west coast and the other on the Atlantic andGulf coasts), a strike of building-service employees in March, a strikeof barber-shop workers in April, and a strike of painters hi August.All of the last three strikes were in New York City.Table 6.—Strikes Beginning in 1936, Classified by Number of Workers Involved
Industry group Total
Number of strikes in which the number ofworkers involved was—
6and
under20
20and
under100
100and
under500
500and
under1,000
1,000and
under5,000
5,000and
under10,000
,,.....,"'"'"andover
All industries
•
2, 172 392 840 652 158 102 20 8Manufacturing
Iron and steel and their products, not includingmachinery 69 7 20 33 6 2 1
Machinery, not including transportation equipment_ 73 8 27 30 3 3 2 Transportation equipment 53 2 15 14 7 12 3 Railroad repair shops Nonferrous metals and their products 31 2 15 7 4 3 Lumber and allied products 143 22 48 51 18 3 1 Stone, clay, and glass products 39 3 13 14 5 2 2 Textiles and their products 455 58 189 160 28 18 1 1Leather and its manufactures 72 10 25 24 7 6 Food and kindred products 106 30 42 27 5 2 Tobacco manufactures 6 2 1 3 Paper and printing 47 11 21 12 3 Chemicals and allied products 20 1 8 10 1 1 1 Rubber products 43 1 7 16 6 6 5 2Miscellaneous manufacturing 76 14 36 21 4 1
Nonmanufacturing
Extraction of minerals 83 1 15 34 22 9 2 Transportation and communication 165 31 76 44 8 4 2Trade 164 65 56 29 7 6 1 ______Domestic and personal service 116 4.5 45 18 2 4 2Professional service 24 11 10 3 Building and construction 230 53 117 50 6 3 1Agriculture. etc 42 1 11 18 6 6 W. P. A., relief, and resettlement projects 80 6 25 29 9 10 1 Other nonmanufacturing industries_ 34 8 20 5 IGeneral 1 1
C
C
9
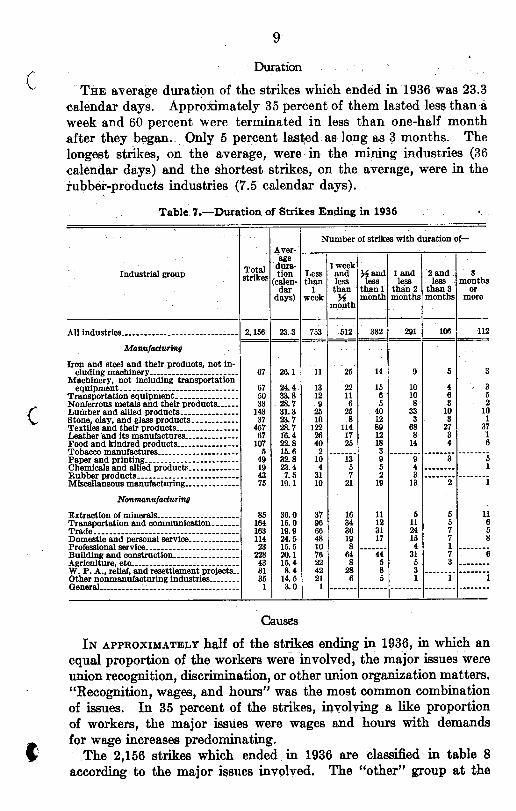
DurationTHE average duration of the strikes which ended in 1936 was 23.3
calendar days. Approximately 35 percent of them lasted less than aweek and 60 percent were terminated in less than one-half monthafter they began. Only 5 percent lasted as long as 3 months. Thelongest strikes, on the average, were in the mining industries (36calendar days) and the shortest strikes, on the average, were in therubber-products industries (7.5 calendar days).
Table 7.—Duration of Strikes Ending in 1936
Industrial group Totalstrikes
agedura. -ton
(calen-dar
days)
Number of strikes with duration of—
Lessthan
1week
1 weekandlessthanX
month
-A andless
than 1month
1 andless
than 2months
2 andless
than 3months
3months
ormore
All industries 2,156 23.3 753 512 382 291 106 112
Maim"acturing
Iron and steel and their products, not in-cluding machinery 67 26.1 11 25 14 9 5
Machinery, not including transportationequipment 67 24.4 13 22 15 10 4 . 3
Transportation equipment 50 33.8 12 11 6 10 6 5Nonferrous metals and their products_ 33 28.7 9 6 5 8 3 2Lumber and allied products 143 31.3 25 25 40 33 10 ICStone, clay, and glass products 37 23.7 10 8 12 3 3 1Textiles and their products 457 28.7 122 114 89 68 27 37Leather'and its manufactures 67 16.4 26 17 12 8 3 1Food and kindred products 107 22. 8 40 25 18 14 4 CTobacco manufactures 5 15.6 2 3 Paper and printing 49 32.8 10 13 9 9 3 1Chemicals and allied products 19 23.4 4 5 5 4 1Rubber products 43 7.5 31 7 2 3 Miscellaneous manufacturing 75 19. 1 19 21 19 13 2 1
Nonmanufacturing
Extraction of minerals 85 36.0 37 16 11 5 5 11Transportation and communication 164 15.0 96 34 12 11 5 fTrade 163 19.9 66 30 31 24 7 1Domestic and personal service 114 24.5 48 19 17 15 7 E
Professional service 23 15.5 10 8 4 1 Building and construction 228 20.1 76 64 44 31 7 fAgriculture, etc 43 15.4 22 8 5 6 3 W. P. A., relief, and resettlement projects__ 81 8.4 42 28 8 3 Other nonmanufacturing industries 35 14.5 21 6 5 1 1 1General 1 3.0 1
CausesIN APPROXIMATELY half of the strikes ending in 1936, in which an
equal proportion of the workers were involved, the major issues wereunion recognition, discrimination, or other union organization matters."Recognition, wages, and hours" was the most common combinationof issues. In 35 percent of the strikes, involving a like proportionof workers, the major issues were wages and hours with demandsfor wage increases predominating.
The 2,156 strikes which ended in 1936 are classified in table 8according to the major issues involved. The "other" group at the

10
end of the table includes strikes over delayed pay, unsafe and unsani-tary working conditions, protests against certain foremen or super-visors, and all miscellaneous demands and grievances not properlyclassifiable under the other headings.
Table Se-Major Issues Involved in Strikes Ending in 1936
Major issues
Strikes Workers involved
Number Percent oftotal Number Percent of
total
All Issues 2, 156 100.0 709, 748 100.0
Wages and hours 756 35.1 250, 672 36.3Wage increase 413 19. 1 142, 663 20.1Wage decrease 151 7.0 45, 031 6.3Wage increase, hour decrease 146 8.8 37,178 5.2Wage decrease, hour increase 19 .9 2, 665 .4Hour increase 15 .7 17, 676 2.5Hour decrease 12 .6 5, 459 .8
Union organization 1, 083 50.2 385, 019 51.4Recognition 173 8.0 47,347 6.7Recognition and wages 272 103, 521 14. 6Recognition and hours 7
12.66. 3 325 (I)
Recognition, wages, and hours 357 16. 6 120, 820 17. 0Closed shop 130 6.0 42, 543 6.0Violation of agreement 24 1.1 24, 444 3.4Discrimination 120 5.6 28, 019 3.7
Miscellaneous 317 14.7 94, 057 13.8Sympathy_ 25 L 2 4, 976 .7Rival unions or factions 2 .1 4,040 .6Jurisdiction 37 L7 4, 236 .6Other 251 1L6 80, 647 11.4Not reported 2 .1 158 (9
Less than lie of 1 percent.Results
THE difficulties in determining the net results of a strike or lock-outin terms of success or failure are obvious to anyone familiar with themany complex factors involved. The only approach is a comparisonof the terms of settlement with the demands or aims of the partiesinitiating the stoppage of work. Such a comparison can only beapproximate, since, for strategic purposes, each of the opposingparties may demand much more than it expects or hopes to obtain.An attempt has been made in each case to determine the basic andunderlying issues in the dispute and then to compare the terms ofsettlement with these issues or demands.
Table 9.-Results of Strikes Ending in 1936
Results
Strikes Workers involved
NumberPercent
oftotal
NumberPercent
oftotal
Total 2,156 100. 0- 709 748 100.0Substantial gains to workers Partial gains or compromises
991508
45.923.6
288,952254.751
40.7sa. 9
Little or no gains to workers 592 27.5 120, 288 18.9Jurisdiction, rival unions, or factions 89 1.8 8, 276 1.2Indeterminate 22 1.0 36, 879 6.2Not reported 4 2 602 .1

11
Almost 46 percent of the strikes ending in 1936, including 41 percentof the workers involved, resulted in the workers obtaining substan-tially all of their basic demands. Nearly 24 percent of the strikes,including 36 percent of the workers, resulted in partial gains or com-promises, and 27% percent of the strikes, including 17 percent of theworkers, resulted in little or no gains to the workers.Table 10.-Results of Strikes Ending in 1936 in Relation to Major Issues Involved
Major issues Total
Strikes resulting in-
Sub-stan-tial
gainsto
'work-ers
Partialgains
orcom-pro-
mises
LittleOr nogains
towork-
ers
Jurisdic-tion,rivalunion, orfactionsettle-ments
Inde-ter-mi-nate
Not re-ported
Number of strikes
All issues 2, 156 991 508 592 39 22 4
Wages and hours 756 347 205 201 3 Wage increase 413 195 117 100 1 Wage decrease 151 49 38 63 1 Wage increase, hour decrease 146 81 42 23 Wage decrease, hour increase 19 6 5 8 Hour increase 15 10 2 3 Hour decrease 12 6 1 4 1
Union organization 1, 083 540 237 296 8 2Recognition 173 72 17 81 3 Recognition and wages 272 136 81 55 Recognition and hours 7 4 3 Recognition, wages, and hours 357 199 91 64 3 Closed shop 130 68 24 37 Violation of agreement 24 16 5 3 Discrimination 120 45 19 53 2 1
Miscellaneous 317 104 66 95 39 11 2Sympathy 25 9 5 5 6 Rival unions or factions 2 2 Jurisdiction 37 37 Other 251 95 61 89 5 1Not reported 2 1
Number of workers involved
All issues 709, 748 288, 952 254,751 120, 288 8, 276 36,879 602
Wages and hours 250, 672 94, 717 110, 472 43, 781 1, 702 Wage increase 142, 663 53, 587 66, 506 22, 493 77 Wage decrease 45, 031 15, 407 14, 160 15, 339 125 Wage increase, hour decrease 37, 178 6, 170 28,176 2,832 Wage decrease, hour increase 2, 665 487 1,201 977 Hour increase 17, 676 16, 787 409 480 Hour decrease 5, 459 2, 279 20 1, 660 1, 500
Union organization 365, 019 169, 522 120, 812 55, 057 19, 158 470Recognition 47, 347 17,608 5, 144 9,628 14, 907 Recognition and wages 103, 521 54, 165 31,970 17, 386 Recognition and hours 325 226 99 Recognition, wages, and hours 120, 820 53, 085 59,510 7, 724 501 Closed shop 42, 543 13,10'7 13,836 15, 230 370Violation of agreement 24, 444 16, 967 7,344 133 Discrimination 26, 019 14, 304 3,008 4, 857 3, 750 100
Miscellaneous 94, 057 24, 713 23,467 21,450 8, 276 16, 019 132Sympathy 4, 976 1,240 1,339 175 2, 222 Rival unions or factions 4,040 4, 040 Jurisdiction 4, 236 4, 236 Other SO, 647 23,473 22,128 21, 237 13, 797 12Not reported 158 38 120

12
The results of the strikes ending in 1936 are shown in table 10 inrelation to the major issues involved. This table indicates that theworkers striking over union-organization matters were slightly moresuccessful than those striking over wage-and-hour issues where nounion organization questions were involved. Where wages and hourswere the major issues, the workers won their demands in 46 percentof the strikes, obtained compromises in 27 percent, and lost in 27percent. Where union-organization matters were the major issues,they won their demands in 50 percent of the strikes, obtained compro-mises in 22 percent, and lost in 27 percent. Of the workers involvedin strikes over wage and hour issues, 38 percent won their demands,44 percent obtained compromises, and 17% percent lost; of thosestriking over union-organization, matters, 46 percent won theirdemands, 33 percent obtained compromises, and 15 percent lost.Where the issues were miscellaneous matters other than wages andhours or union organization, the workers who won, lost, and obtainedcompromises were about equal in number.
Methods of Negotiating Settlements
SETTLEMENTS of 43 percent of the strikes, including about an equalproportion of the workers involved, were negotiated directly by theemployers and representatives of the organized workers. In about 30percent of the strikes, including 41 percent of the workers involved,the parties were assisted by Government conciliators or labor boardsin working out settlements of their disputes. In most of these casesthe workers were represented by union officials. Of these 644 cases,611 were settled by conciliation or mediation methods and 33 weresettled by arbitration. Private conciliators or arbitrators were instru-mental in negotiating settlements of 66, or 3 percent, of the strikes.Forty-one of these were settled by conciliation methods and 25 byarbitration.
Table 11.—Methods of Negotiating Settlements of Strikes Ending in 1936
Negotiations toward settlements carried on by—
Strikes Workers involved
Number Percent oftotal Number Percent of
total
Total 2,156 100. 0 709, 748 100. 0
Employers and workers directly 114 5. 3 17, 276 Li: 2.4Employers and representatives of organized workers
directly_ 938 43. 4 299, 132 42. 2Government conciliators or labor boards 644 29. 9 292, 600 41. 2Private conciliators or arbitrators 66 3. 1 20, 348 2.9Terminated without formal settlement 394 18. 3 80, 392 11. 3
There were no formal settlements of 394, or 18 percent, of the strikesterminated during 1936. In most of these cases the workers simply

C
13
dropped their demands and returned to work without settlements orthey lost their jobs when employers went out of business or hired newworkers to fill the places of the strikers.
Labor Organizations Involved
UNIONS affiliated with the American Federation of Labor wereinvolved in more than three-fourths of the strikes which ended in 1936.Independent organizations were involved in 7.4 percent of the strikes.Unions affiliated with the Committee for Industrial Organization wereinvolved in 133 (6.2 percent) strikes after the time of their suspensionby the American Federation of Labor in September.
The unions indicated did not in all cases officially call the strikes.Some of the strikes were unauthorized by union officials, althoughafter the workers were out the unions assisted in negotiating settle-ments. In some cases the workers were unorganized when the strikesbegan and the unions stepped in and offered leadership and assistancein settling the disputes, as a means of organizing the workers. Intable 12 the union which identified itself with the strike, either at thebeginning or later, is regarded as the organization involved.Table 12.—Strikes Ending in 1936 by Types of Labor Organizations Involved
Labor organization involved
Strikes Workers involved
Number Percent oftotal Number Percent of
total
Total 2, 156 100.0 709,748 100.0American Federation of Labor 1,649 76.4 488, 643 68.8Committee for Industrial Organization 133 6.2 105, 814 14.9Railroad brotherhoods 2 .1 560 .1Independent 159 7.4 76,183 10.6American Federation of Labor and another 2 .1 4, 040 .6Company unions 10 .5 1, 743 .2Organization involved but type not reported 7 .3 360 .1No organization 183 8. 5 32, 941 4.6Not reported as to whether or not any organization was
involved 11 .5 464 .1
I Does not include strikes after September 1936, of unions suspended by the American Federation of Labor.See footnote 2.I Includes the 10 international unions suspended by the American Federation of Labor because of affilia-tion with the C. I. 0. and independent unions which affiliated with the C. I. 0. The figures include onlythe strikes occurring after the date of the A. F. of L. convention in September.
Sit-Down Strikes During 1936SO-CALLED "sit-down" or "stay-in" strikes seem to fall into five
groups: 2A stoppage for a few moments or a few hours until a specific
grievance is settled, at which time work is resumed.A stoppage by a group of workers which arouses sentiment for
a general walk-out. The general walk-out thereupon develops into aregular picketing strike.
3 Many sit-down strikes are difficult to distinguish from regular picket strikes. This is especially true inthe outdoor trades. When longshoreinen or building-construction workers stay around their workplacesbut do no work, it is a question whether such action should be classified as picketing or sit-down strikes.

14
A si•-down for a few hours, when the employer forces theemployees out and closes the plant. This dispute thereupon assumesthe nature of a lock-out.
A procedure whereby dissatisfied employees report for workeach day or shift but sit at their places and refuse to work. They gohome at the end of each shift
(5) A stay-in strike, in which a portion or all of the strikers stay inthe plant overnight.
In 48 of the 2,172 strikes which began in 1936, the strikers stayed inthe plants for 1 day or longer after quitting work. In some of thesecases the disputes were settled by the close of the day and work wasresumed the following day. In others, workers were ejected or walkedout at the close of the shift and set up picket lines around the plantsuntil the disputes were adjusted. In 22 instances the strikers stayedin the building one or more nights. Usually the "stay-in" was onlya night or two. Some, however, lasted a week or more. In one casethe strikers stayed in the plant fizn. 8 weeks.
About 53,250 workers were involved in the 24 strikes in whichworkers sat at their places for 1 day but did no work. Approximately381,000 man-days of idleness resulted from these strikes. In the 22stay-in-strikes lasting more than 1 day, 34,565 workers were involvedand 290,000 man-days of work were lost during the entire progress ofthe strikes. This does not mean that all these man-days of idlenesswere spent within the plant. In most cases only a portion of theworkers actually stayed in the plant. Also, in many instances, thestay-in lasted only a few days, although the strike continued for alonger period.
Of these 48 stay-in strikes lasting 1 day or longer, 1 was called by acompany union, in 1 the workers were unorganized, and 3 were calledby independent or unaffiliated unions. In 8 instances the strikerswere members of unions affiliated with the American Federation ofLabor, and in 35 cases by unions affiliated with the Committee forIndustrial Organization. Matters of union organization, such asrecognition, discrimination, wearing of union buttons, etc., were themajor factors causing most of these stay-in strikes. Few of themwere formally authorized by the unions, although after they werestarted the unions endorsed them and assisted in getting settlements.
In addition to the strikes in which workers stayed at their placesbut did no work for 1 day or longer, there were numerous such stop-pages lasting from a few moments to several hours. The exact numberof such stoppages is not known, since the Bureau of Labor Statisticskeeps no record of strikes lasting less than 1 day. A number occurredin the garment trades, when disputed piece-work rates on new stylesof work were being adjusted. Longshoremen, especially on the westcoast, engaged in what they called "quickie" strikes when they weredissatisfied with certain working conditions. There were a number in

15
the rubber industry. One rubber concern in Akron reported havinghad over 50 such stoppages, lasting from 15 minutes to several hours.A large proportion of these brief sit-downs were due to union workers'suspicions that they were being discriminated against, or that nonunionmembers were being given special consideration.
0
C