Review of Stats Fundamentals Emily Falk, Ph.D. University of Michigan (with slides from Thad Polk,...
37
Review of Stats Fundamentals Emily Falk, Ph.D. University of Michigan (with slides from Thad Polk, Sky Chafin, Guillaume Flandin, Jeff Grynaviski, Luiz Pessoa, and Tor Wager) 1
-
Upload
maria-naomi-porter -
Category
Documents
-
view
214 -
download
0
Transcript of Review of Stats Fundamentals Emily Falk, Ph.D. University of Michigan (with slides from Thad Polk,...
Review of Stats Fundamentals
Emily Falk, Ph.D.University of Michigan
(with slides from Thad Polk, Sky Chafin, Guillaume Flandin, Jeff Grynaviski, Luiz Pessoa,
and Tor Wager)
1
Lecture Outline
1. Hypothesis TestingNull hypothesis vs. alternative hypothesis; Testing hypotheses about population based on a sample; Sampling distributions & Central Limit Theorem; t-statistic, t-distribution, t-tests, p-values; Interpreting results, Type I error, Type II error; One-tailed vs. two-tailed tests; Multiple comparisons
Tomorrow:
2. General Linear ModelRegression, multiple regression, model fitting, assumptions, matrix notation, design matrix, example, issues
3. Overview of fMRI data analysisBuild design matrix, fit model to get betas, contrasts, statistical parametric maps, threshold for significance (correcting for multiple comparisons)
2

What is true about the world?
3

Does fMRI competence make people hotter?
4

Are fMRI researchers rated as more attractive than your
average academic?
5
Hypothesis Testing
1. Define the Research Hypothesis.A Research or Alternative Hypothesis is a statement derived from theory about what the researcher expects to find in the data.
2. Define the Null Hypothesis. The Null Hypothesis is a statement of what you would not expect to find if your research or alternative hypothesis was consistent with reality.
3. Conduct an analysis of the data to determine whether or not you can reject the null hypothesis with some pre-determined probability.
If you can reject the null hypothesis with some probability, then the data is consistent with the research hypothesis.
6
Population vs. Sample• Hypotheses are about population
parameters:– E.g., The true population mean (not the
sample mean) for fMRI researchers is greater than zero on the attractiveness index– E.g., the true population mean (not the
sample mean) is 1000ms
7
Population vs. Sample
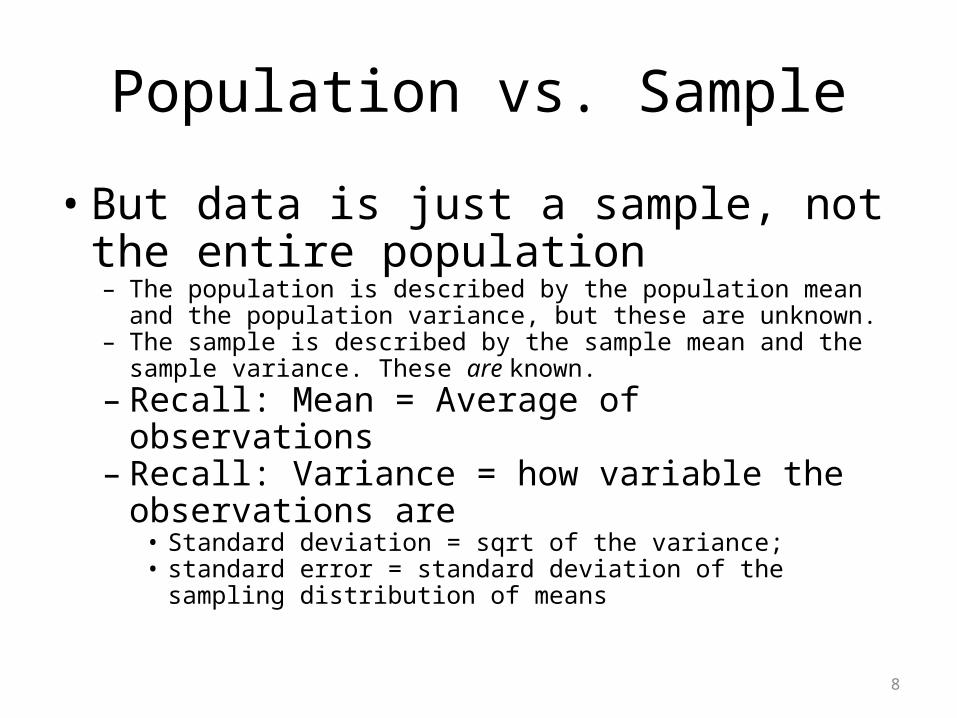
• But data is just a sample, not the entire population– The population is described by the population mean and the
population variance, but these are unknown.– The sample is described by the sample mean and the sample variance.
These are known.– Recall: Mean = Average of observations– Recall: Variance = how variable the observations
are• Standard deviation = sqrt of the variance; • standard error = standard deviation of the sampling distribution of
means
8
Population vs. Sample• The sample mean and variance provide
estimates of the true mean and variance of the entire population–But in general they won’t be right
9
Population vs. Sample
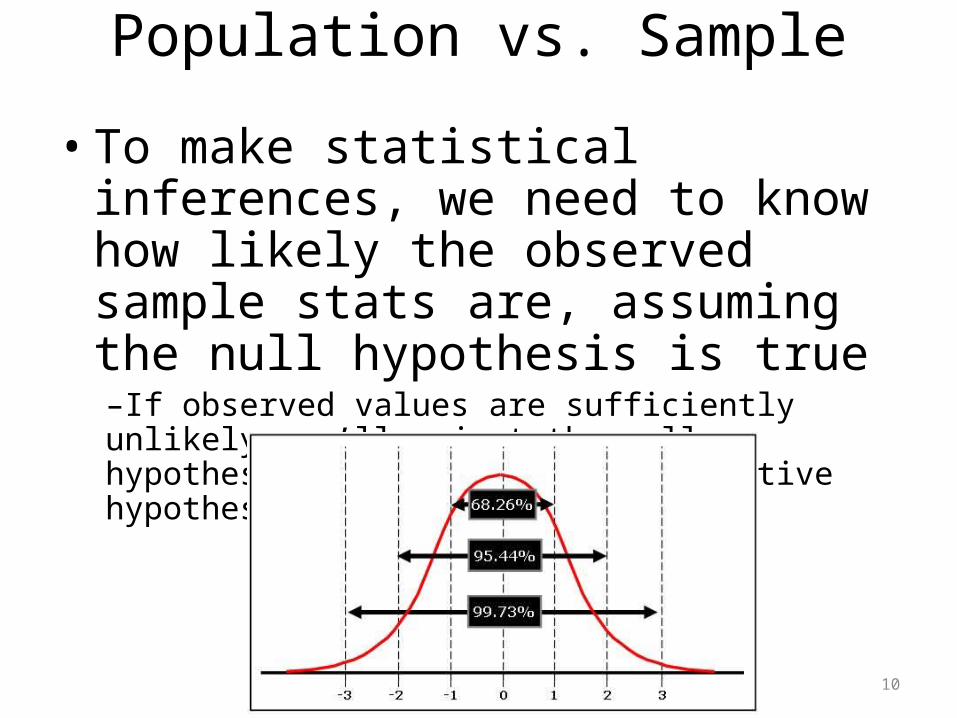
• To make statistical inferences, we need to know how likely the observed sample stats are, assuming the null hypothesis is true–If observed values are sufficiently unlikely, we’ll reject the null hypothesis in favor of the alternative hypothesis
10
How do we judge the probability of the observed results?
• Assume that our null hypothesis is that the population mean is zero
• Observed sample mean equals two.
• Want to know:
– How likely is it to draw a sample with mean of two, if population mean is actually zero?
– If this is very unlikely, then we would reject the null hypothesis and claim that the population mean isn’t zero
11
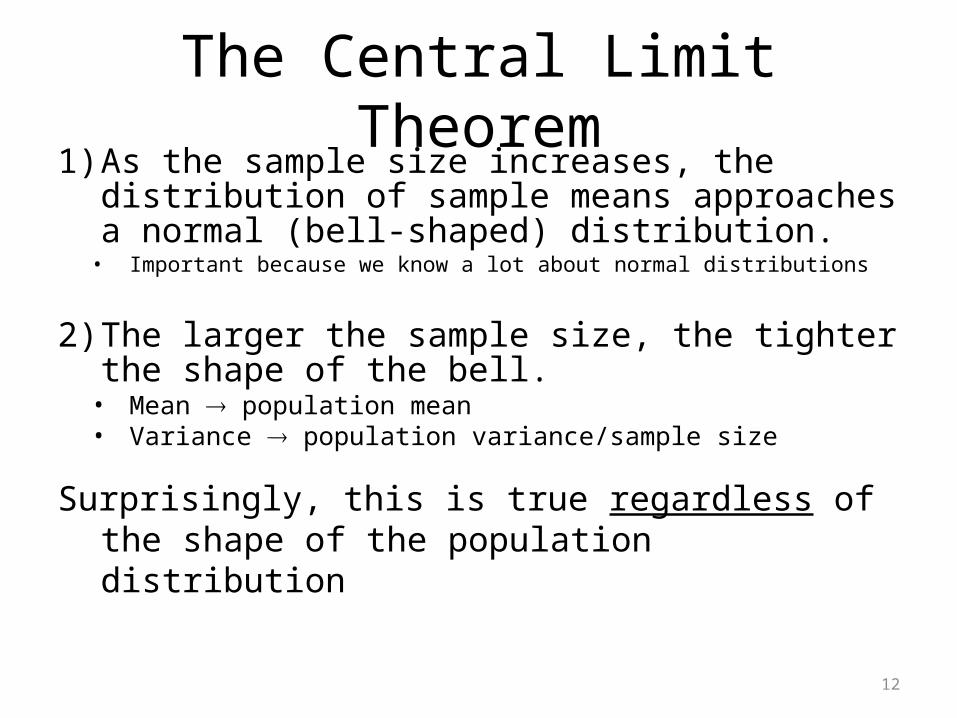
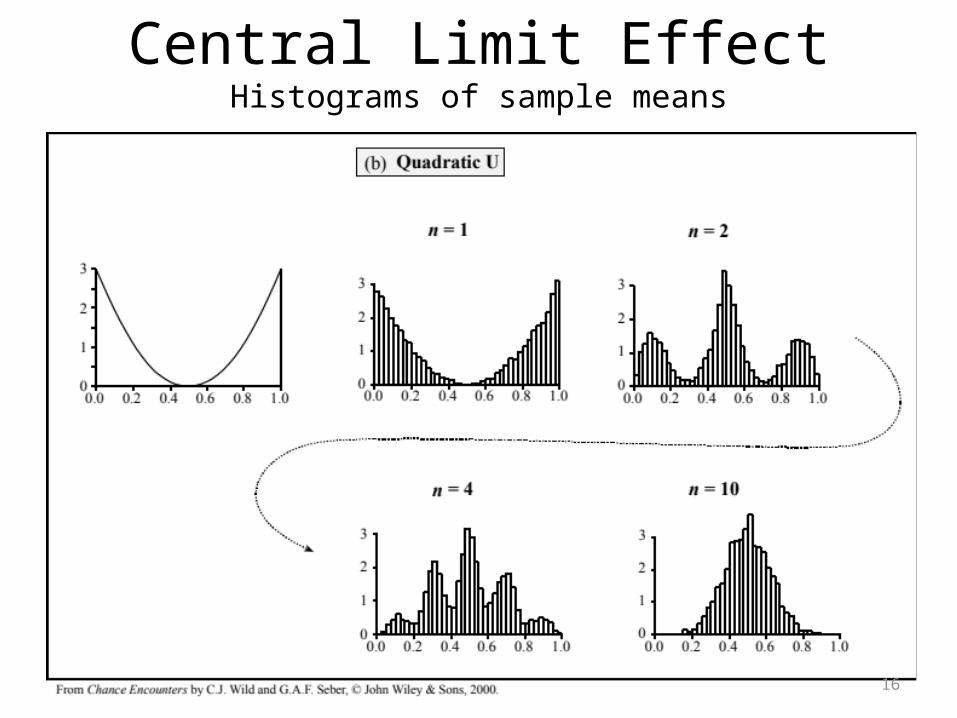
The Central Limit Theorem1) As the sample size increases, the distribution of
sample means approaches a normal (bell-shaped) distribution.• Important because we know a lot about normal distributions
2) The larger the sample size, the tighter the shape of the bell.• Mean population mean• Variance population variance/sample size
Surprisingly, this is true regardless of the shape of the population distribution
12
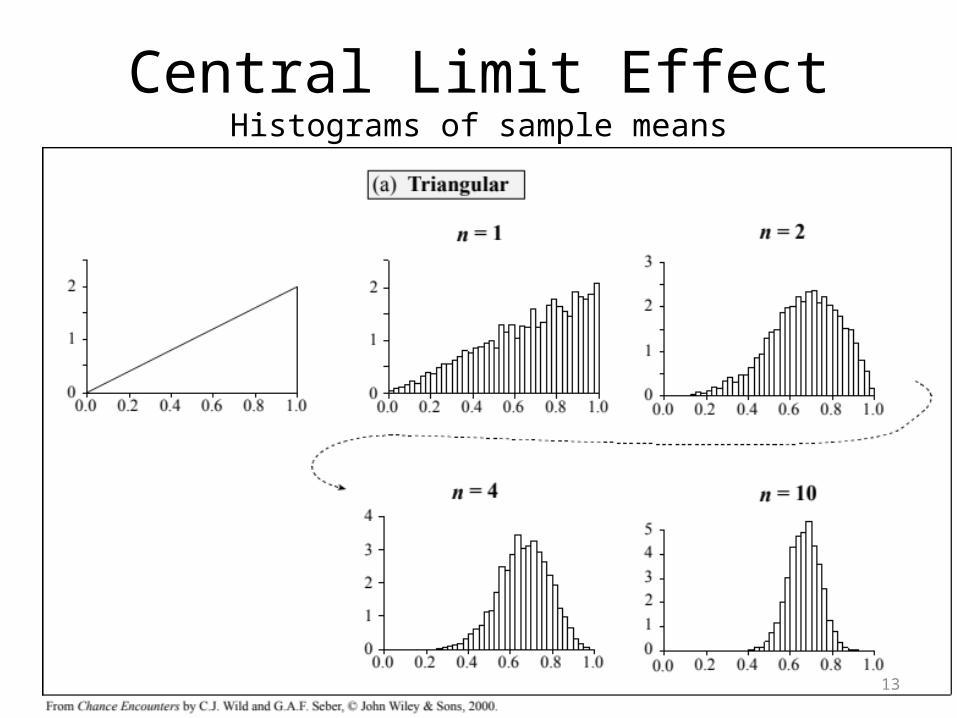
Central Limit EffectHistograms of sample means
13
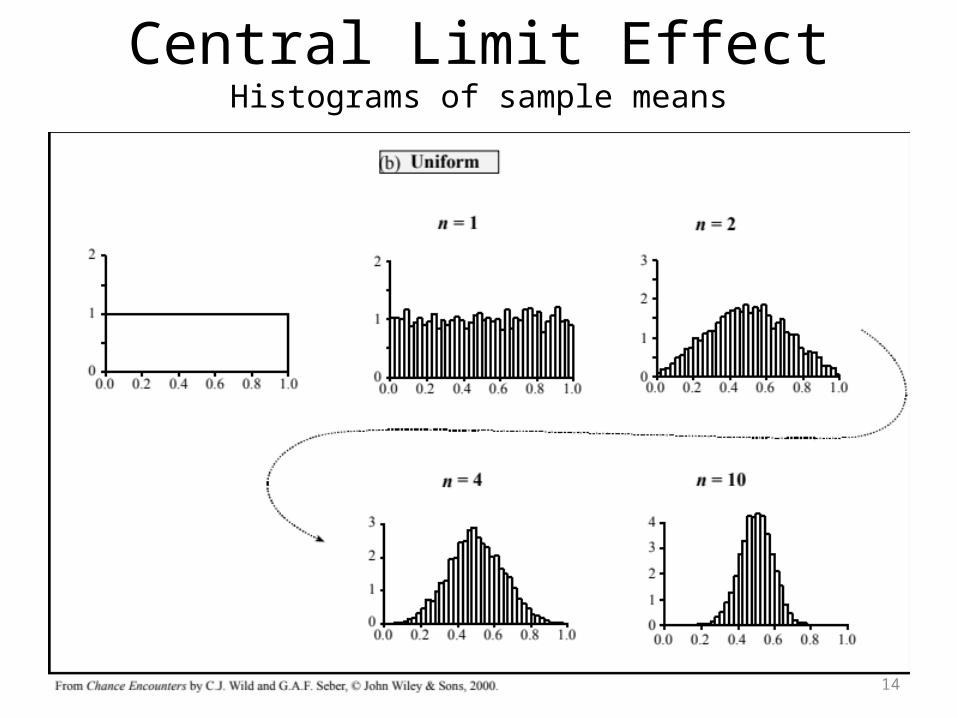
Central Limit EffectHistograms of sample means
14
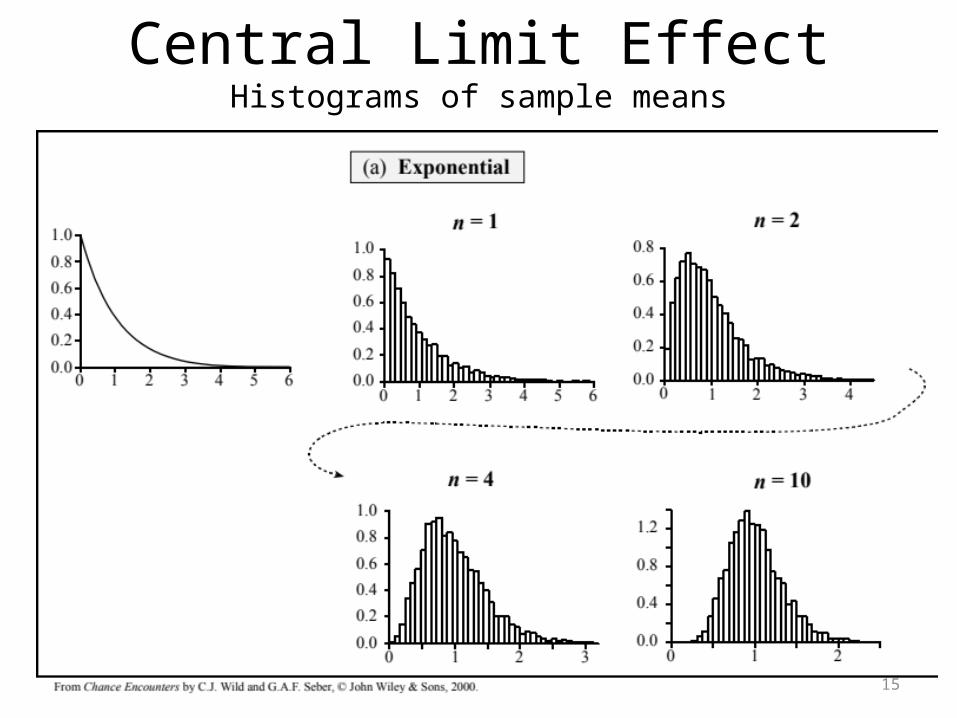
Central Limit EffectHistograms of sample means
15
Central Limit EffectHistograms of sample means
16
When I say…• Central
• When n goes up…• Big n
• When n goes up…• Big n
You say…• Limit
• We get a bell• Known shape
• The bell gets tight• Tight bell
17
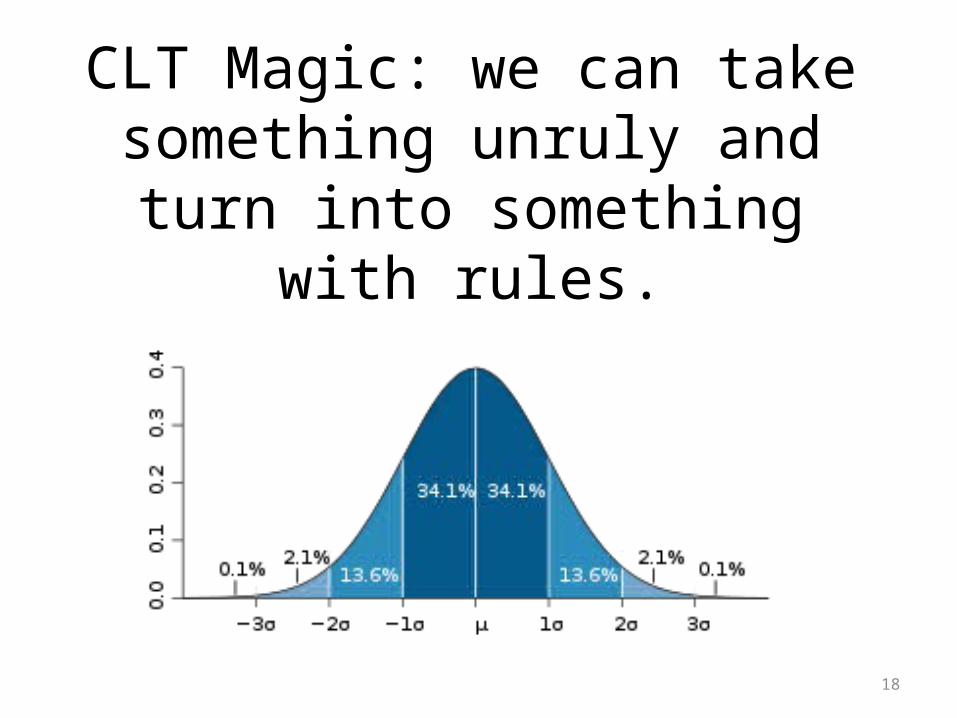
CLT Magic: we can take something unruly and turn into
something with rules.
18
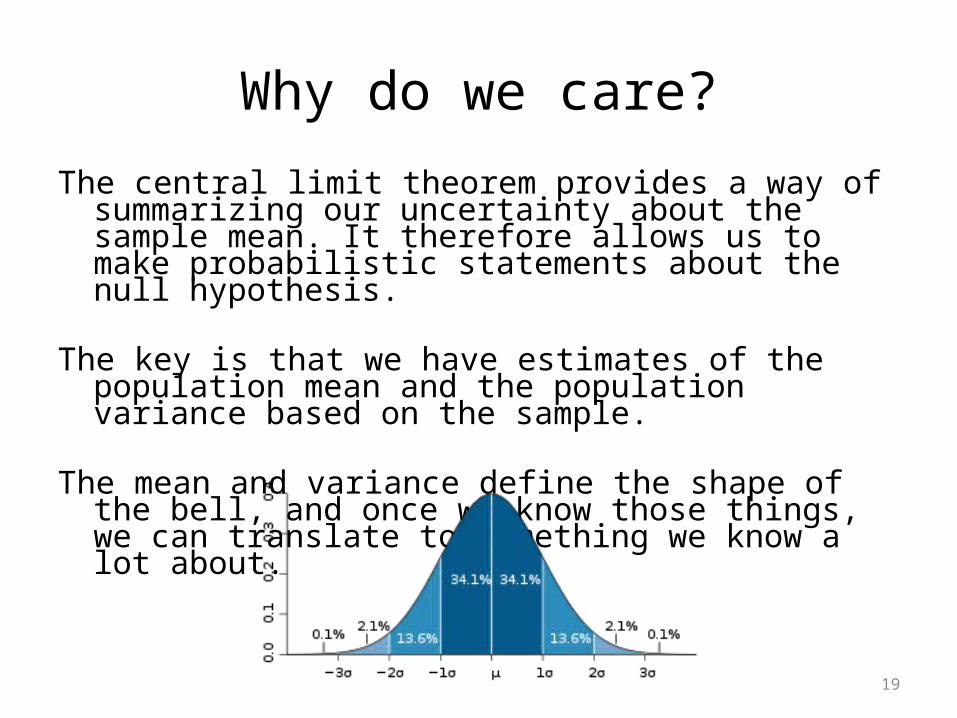
Why do we care?
The central limit theorem provides a way of summarizing our uncertainty about the sample mean. It therefore allows us to make probabilistic statements about the null hypothesis.
The key is that we have estimates of the population mean and the population variance based on the sample.
The mean and variance define the shape of the bell, and once we know those things, we can translate to something we know a lot about.
19
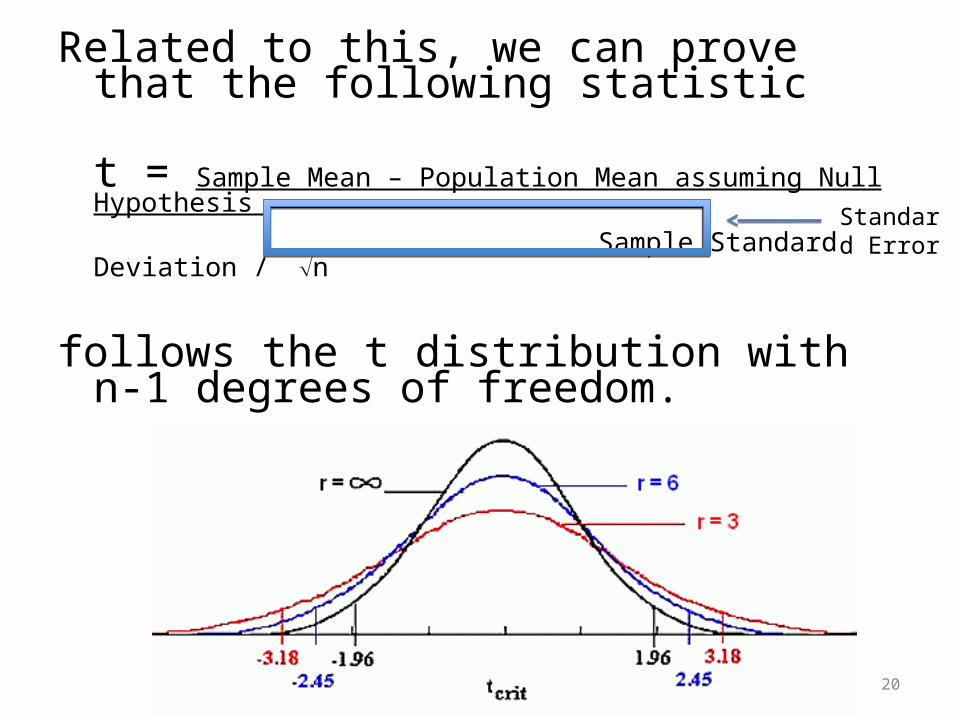
Related to this, we can prove that the following statistic
t = Sample Mean – Population Mean assuming Null Hypothesis
Sample Standard Deviation / n
follows the t distribution with n-1 degrees of freedom.
20
Standard Error
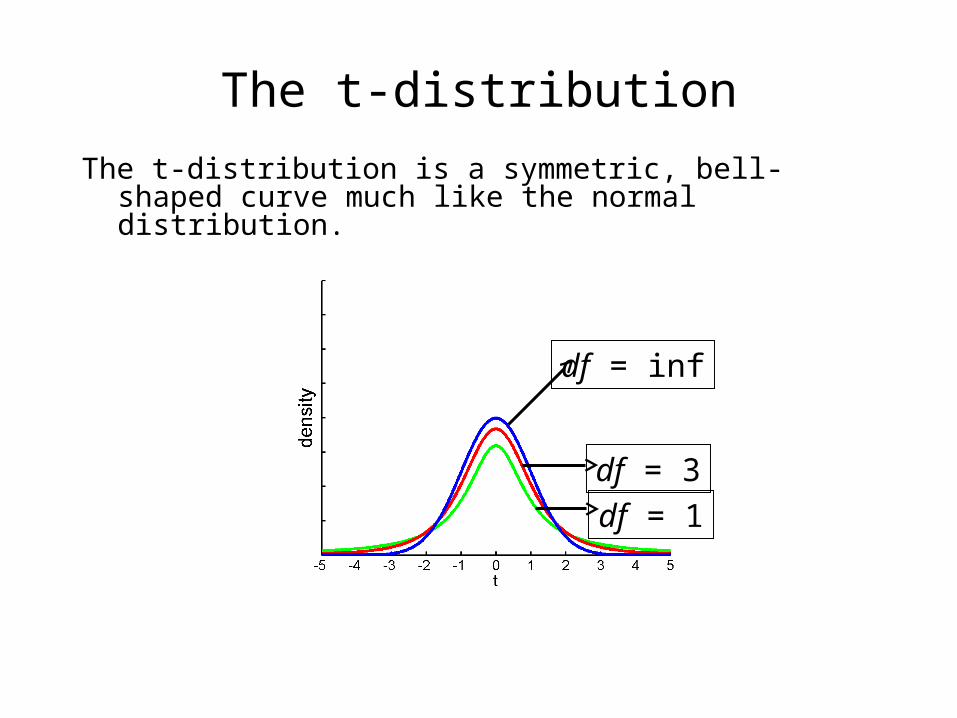
The t-distributionThe t-distribution is a symmetric, bell-shaped curve much like the
normal distribution.
df = inf
df = 1df = 3
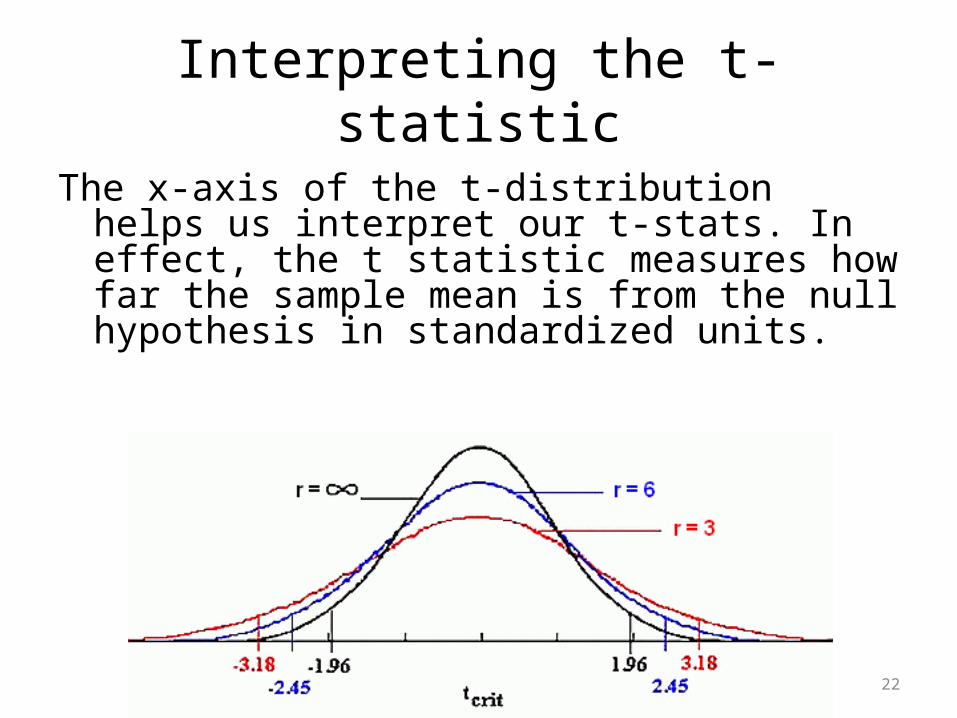
Interpreting the t-statistic
The x-axis of the t-distribution helps us interpret our t-stats. In effect, the t statistic measures how far the sample mean is from the null hypothesis in standardized units.
22
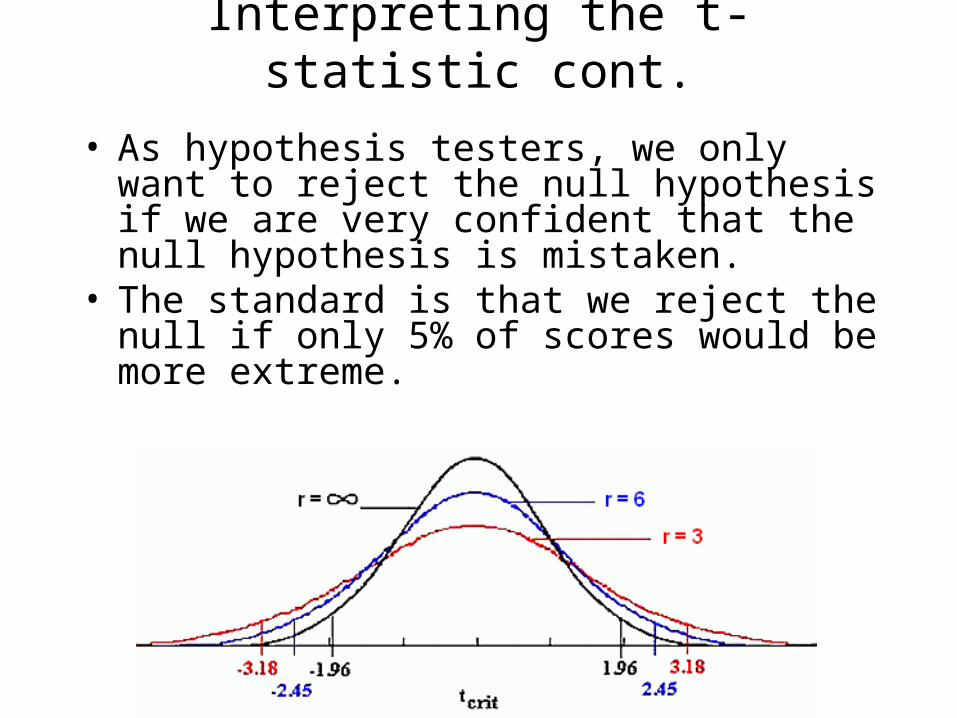
Interpreting the t-statistic cont.
• As hypothesis testers, we only want to reject the null hypothesis if we are very confident that the null hypothesis is mistaken.
• The standard is that we reject the null if only 5% of scores would be more extreme.
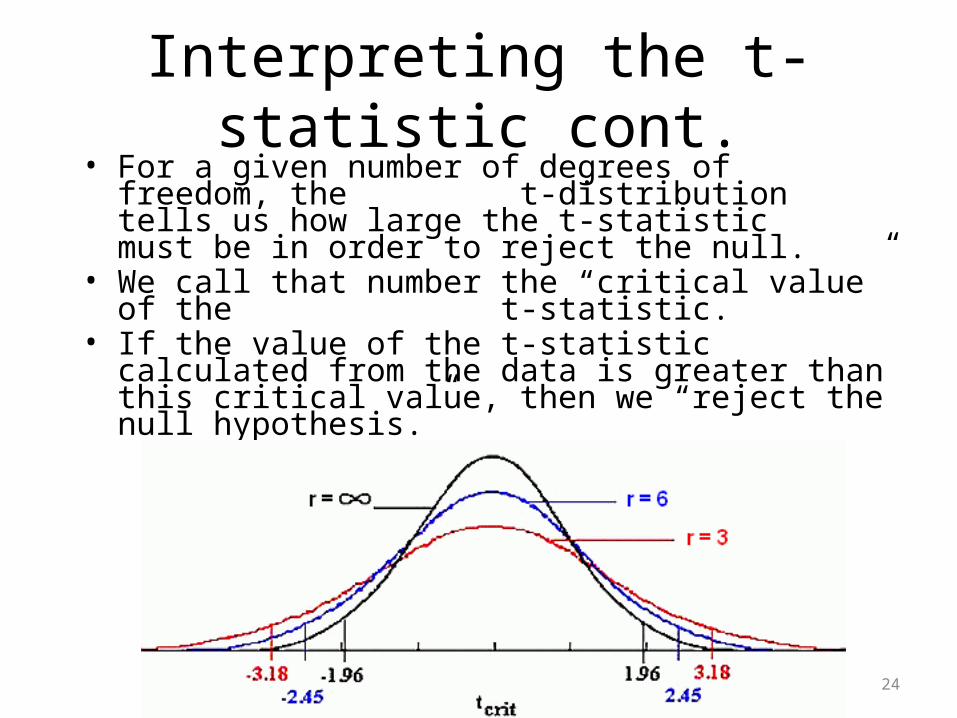
Interpreting the t-statistic cont.• For a given number of degrees of freedom, the t-
distribution tells us how large the t-statistic must be in order to reject the null.
• We call that number the “critical value” of the t-statistic.
• If the value of the t-statistic calculated from the data is greater than this critical value, then we “reject the null hypothesis.”
24
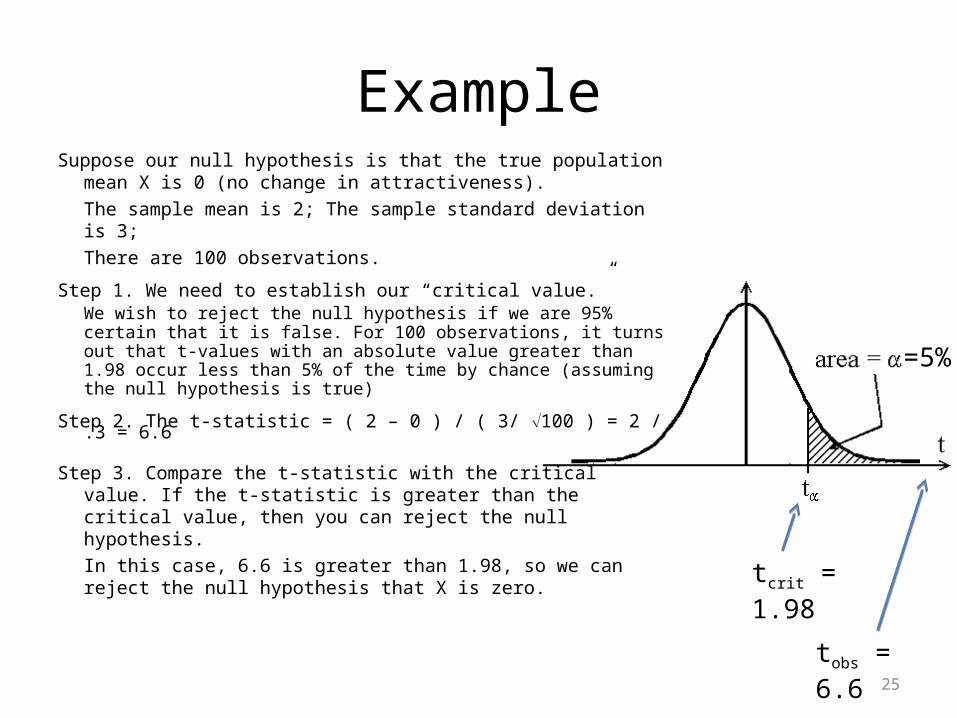
ExampleSuppose our null hypothesis is that the true population mean X is
0 (no change in attractiveness). The sample mean is 2; The sample standard deviation is 3;There are 100 observations.
Step 1. We need to establish our “critical value.” We wish to reject the null hypothesis if we are 95% certain that it is false. For 100 observations, it turns out that t-values with an absolute value greater than 1.98 occur less than 5% of the time by chance (assuming the null hypothesis is true)
Step 2. The t-statistic = ( 2 – 0 ) / ( 3/ 100 ) = 2 / .3 = 6.6
Step 3. Compare the t-statistic with the critical value. If the t-statistic is greater than the critical value, then you can reject the null hypothesis.In this case, 6.6 is greater than 1.98, so we can reject the null hypothesis that X is zero.
25
=5%
tcrit = 1.98
tobs = 6.6
P-values
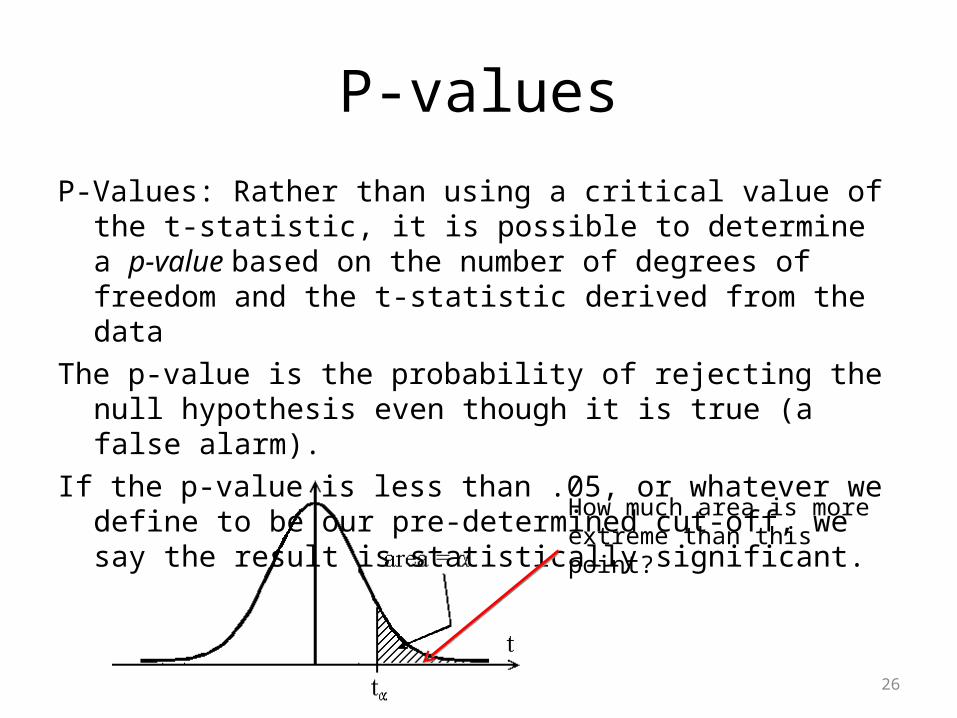
P-Values: Rather than using a critical value of the t-statistic, it is possible to determine a p-value based on the number of degrees of freedom and the t-statistic derived from the data
The p-value is the probability of rejecting the null hypothesis even though it is true (a false alarm).
If the p-value is less than .05, or whatever we define to be our pre-determined cut-off, we say the result is statistically significant.
26
How much area is more extreme than this point?

If we retain H0, what can we conclude?
• The decision to retain H0 does not mean that it is likely that H0 is true.– This is the fallacy of accepting the null hypothesis
• We simply do not have sufficient evidence to reject the null hypothesis.
• Retaining the null hypothesis is a weak decision.
If we reject H0, what can we conclude?• Rejecting the null hypothesis means that H0 is
probably false, a strong decision.
27
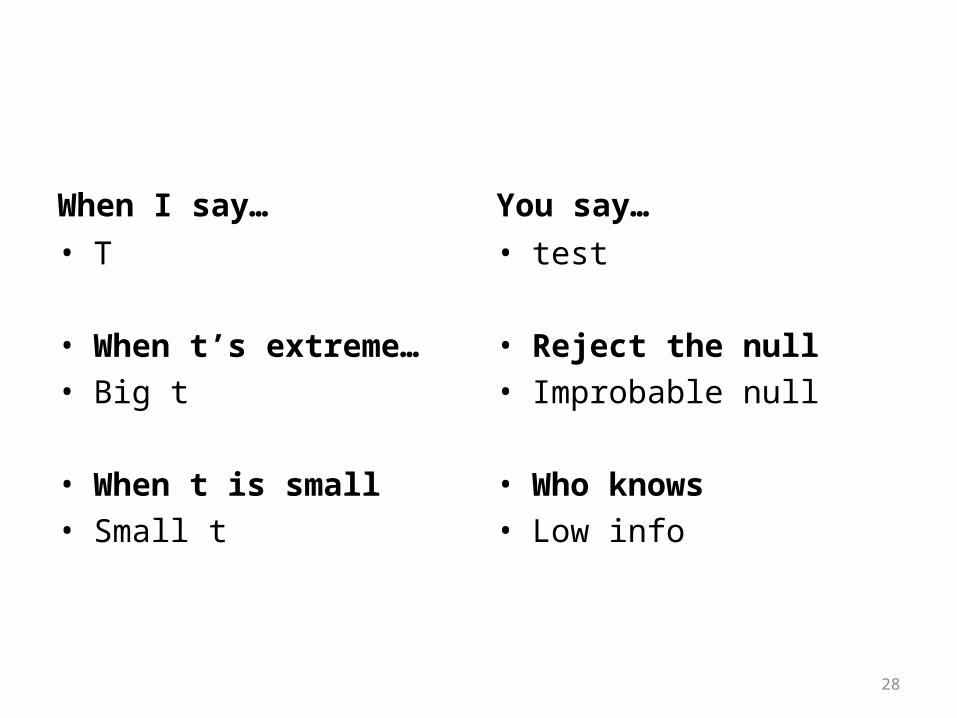
When I say…• T
• When t’s extreme…• Big t
• When t is small• Small t
You say…• test
• Reject the null• Improbable null
• Who knows• Low info
28
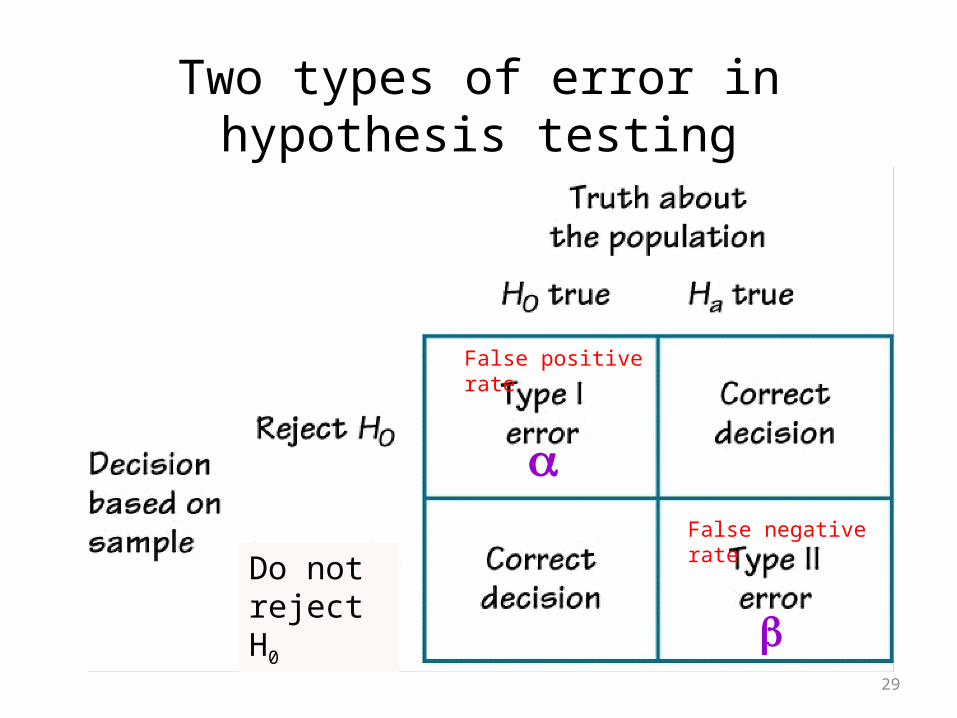
False positive rate
False negative rateDo not
reject H0
Two types of error in hypothesis testing
29
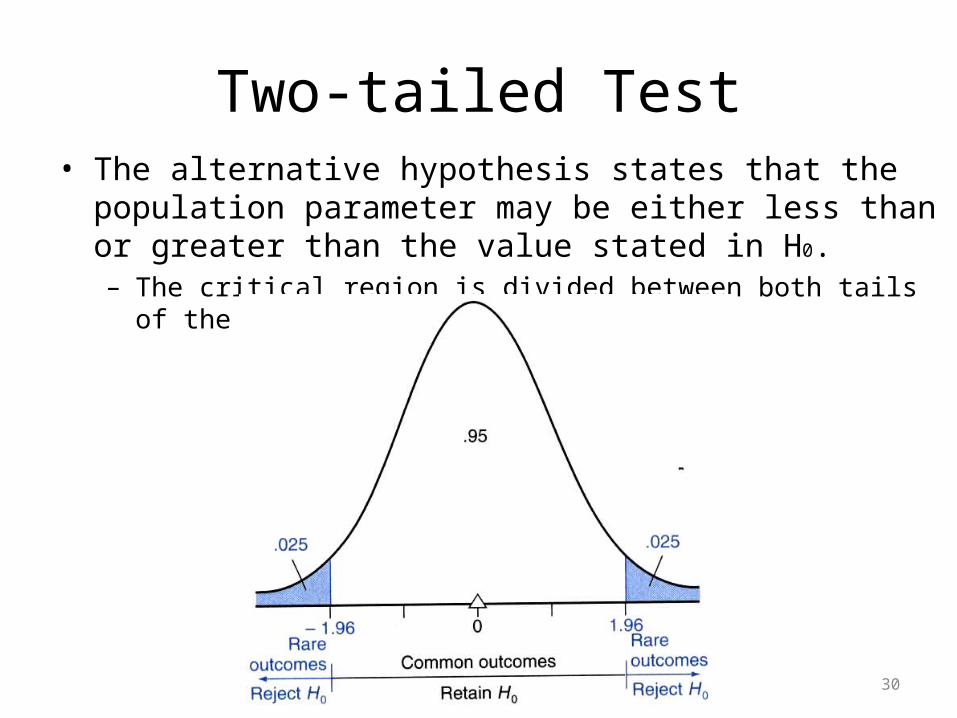
Two-tailed Test• The alternative hypothesis states that the population parameter
may be either less than or greater than the value stated in H0.– The critical region is divided between both tails of the sampling
distribution
30

Two-tailed Test
• This type of test is used when you predict some effect, but not the direction of the effect– For example, in most cases in which the
performance of a group is compared to a known standard, it would be of interest to discover that the group is superior or inferior.
31
One-tailed Test
• The alternative hypothesis states that the population parameter differs from the value stated in H0 in one particular direction.– The critical region is located only in one tail of the
sampling distribution.
32
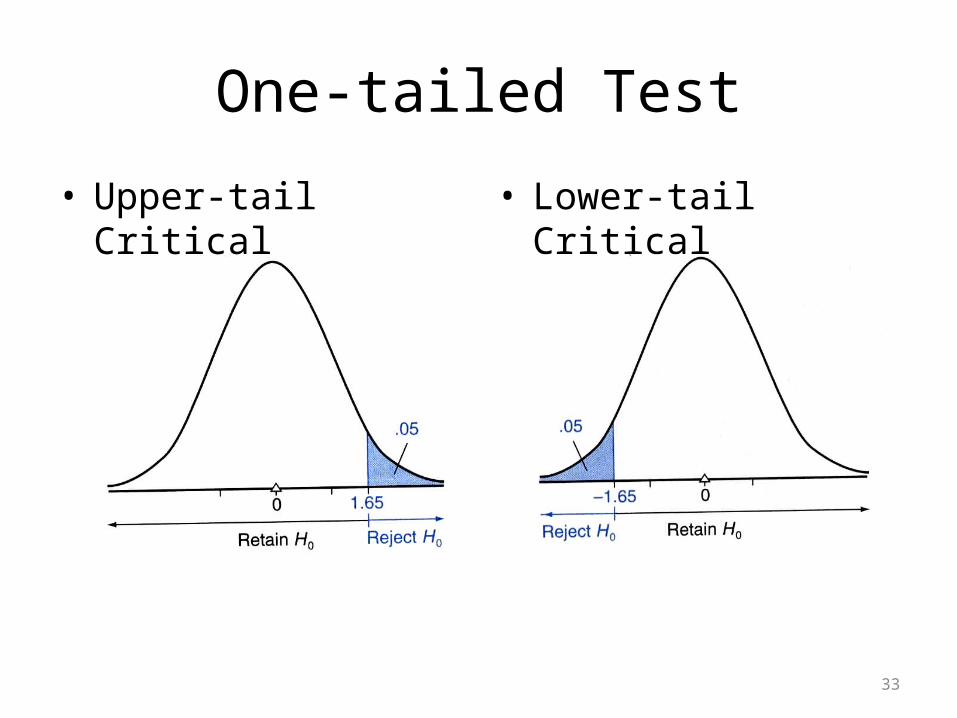
One-tailed Test
• Upper-tail Critical • Lower-tail Critical
33
One-tailed Test
• The advantage of a one-tailed test is that it is more sensitive to rejecting the null hypothesis in the predicted direction than a two-tailed test.
• The major disadvantage of a one-tailed test is that it precludes any chance of discovering that reality is just the opposite of what the alternative hypothesis says.
34
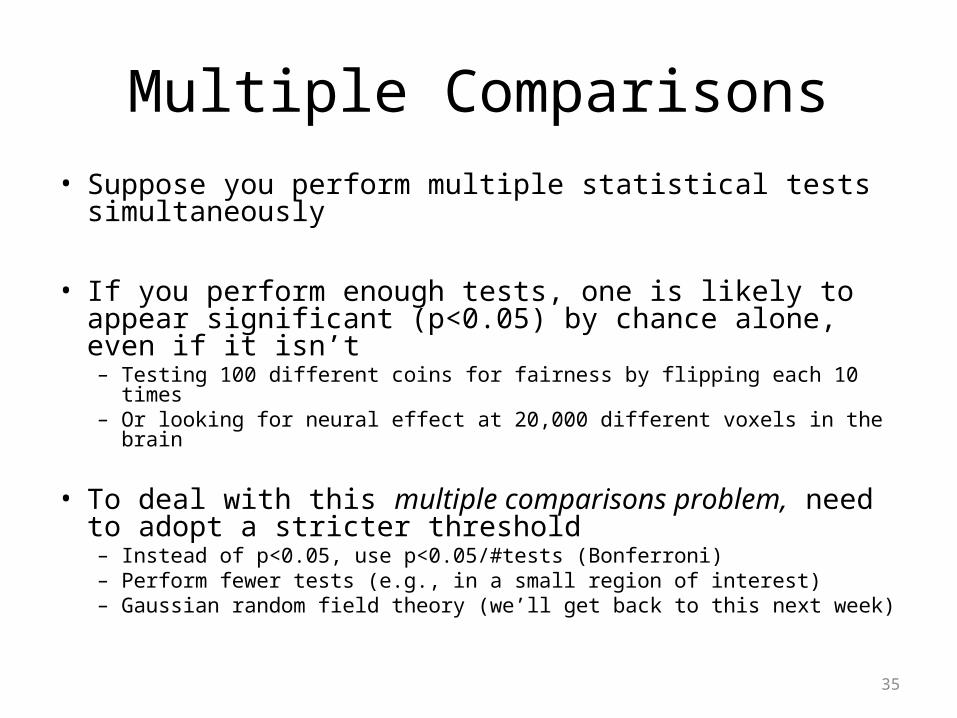
Multiple Comparisons• Suppose you perform multiple statistical tests
simultaneously
• If you perform enough tests, one is likely to appear significant (p<0.05) by chance alone, even if it isn’t– Testing 100 different coins for fairness by flipping each 10 times– Or looking for neural effect at 20,000 different voxels in the brain
• To deal with this multiple comparisons problem, need to adopt a stricter threshold– Instead of p<0.05, use p<0.05/#tests (Bonferroni)– Perform fewer tests (e.g., in a small region of interest)– Gaussian random field theory (we’ll get back to this next week)
35
When I say…• False• Type
• With lots of tests…
When I say• False• With strict thresholds• Trade• More
You say…• Positive• One
• False positives
You say• Negatives• False negatives• Offs• Tuesday
36
Lecture Outline
1. Hypothesis TestingNull hypothesis vs. alternative hypothesis; Testing hypotheses about population based on a sample; Sampling distributions & Central Limit Theorem; t-statistic, t-distribution, t-tests, p-values; Interpreting results, Type I error, Type II error; One-tailed vs. two-tailed tests; Multiple comparisons
QUESTIONS?
37