REVIEW OF SOUTH AFRICA’S APPLIANCE ENERGY CLASSES AND ...
31
REVIEW OF SOUTH AFRICA’S APPLIANCE ENERGY CLASSES AND IDENTIFICATION OF THE NEXT SET OF ELECTRICAL EQUIPMENT FOR INCLUSION IN THE NATIONAL STANDARDS AND LABELLING PROJECT: NEW ELECTRICAL APPLIANCES Industry Stakeholder Workshop: Televisions 3 April 2019
Transcript of REVIEW OF SOUTH AFRICA’S APPLIANCE ENERGY CLASSES AND ...

REVIEW OF SOUTH AFRICA’S APPLIANCE ENERGY CLASSES AND
IDENTIFICATION OF THE NEXT SET OF ELECTRICAL EQUIPMENT FOR
INCLUSION IN THE NATIONAL STANDARDS AND LABELLING PROJECT:
NEW ELECTRICAL APPLIANCES
Industry Stakeholder Workshop: Televisions
3 April 2019
Agenda
1. Policy tools considered
2. Scope of work and boundaries
3. Screening process
4. Methodology
5. International MEPS trends
6. SA analysis
7. Recommendations
8. Open discussion
1. Policy tools considered
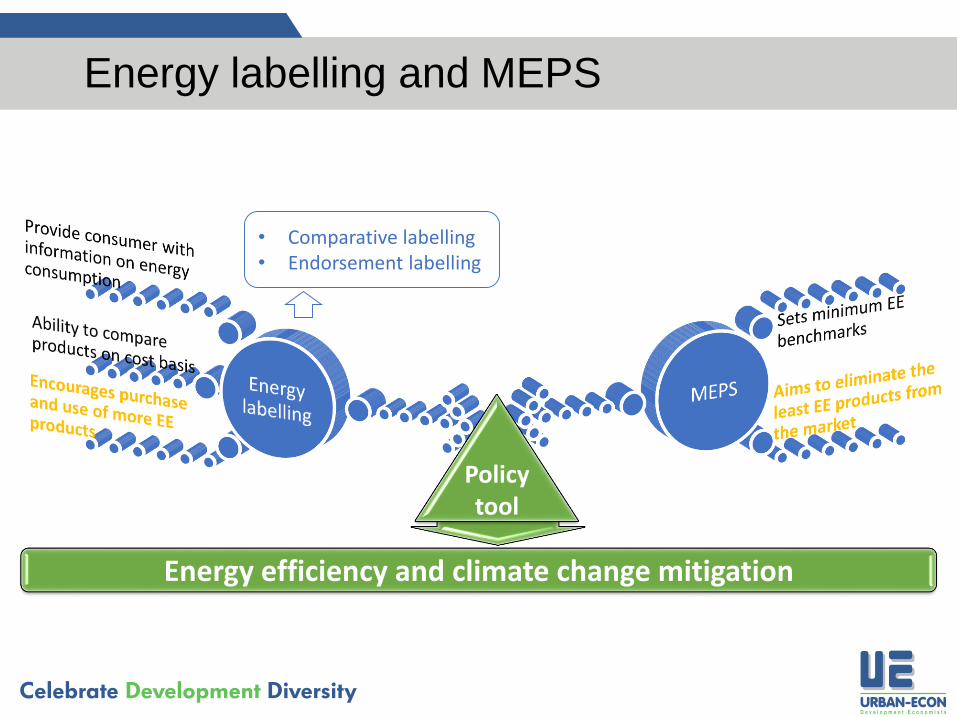
Energy labelling and MEPS
Energy efficiency and climate change mitigation
Policy tool
• Comparative labelling• Endorsement labelling

Policy options to improve energy efficiency
• Two main policy options considered are energy labelling and Minimum Energy Performance Standards (MEPS)
• These are typically enacted through government legislation and regulations
• When is labelling most effective?– When consumers purchase products and pay the energy
bills– When products are on display at purchase and can be
compared– Where there is a wide range of energy efficiency on the
market
• Labelling creates market pull to encourage suppliers to offer more efficient products to the market

Policy options to improve energy efficiency
• When is MEPS most effective?
– When product purchasers do not pay energy bills (can be different parts of a company, landlord and tenant)
– When products are not on display for sale (purchased on specifications or from catalogues)
– When there is a significant range of efficiency available (internationally) but this is not always present on the local market
• MEPS is a market push to ensure that all products offered for sale meet a minimum efficiency level

2. Scope of work and boundaries

Study objectives (as per TOR)
1. To identify a new set of electrical equipment (residential or commercial) to which compulsory minimum energy efficiency MEPS and/or labelling could be introduced
2. To recommend timelines for implementation of improved and new minimum energy performance levels for the next set of electrical equipment
3. To conduct an impact assessment analysis of the proposed mandatory requirements for each appliance on consumers, retailers, South African manufacturers, and importers
4. To quantify the potential energy and greenhouse gas emission savings that could be achieved through new MEPS and/or labelling over a 10 and 30-year period
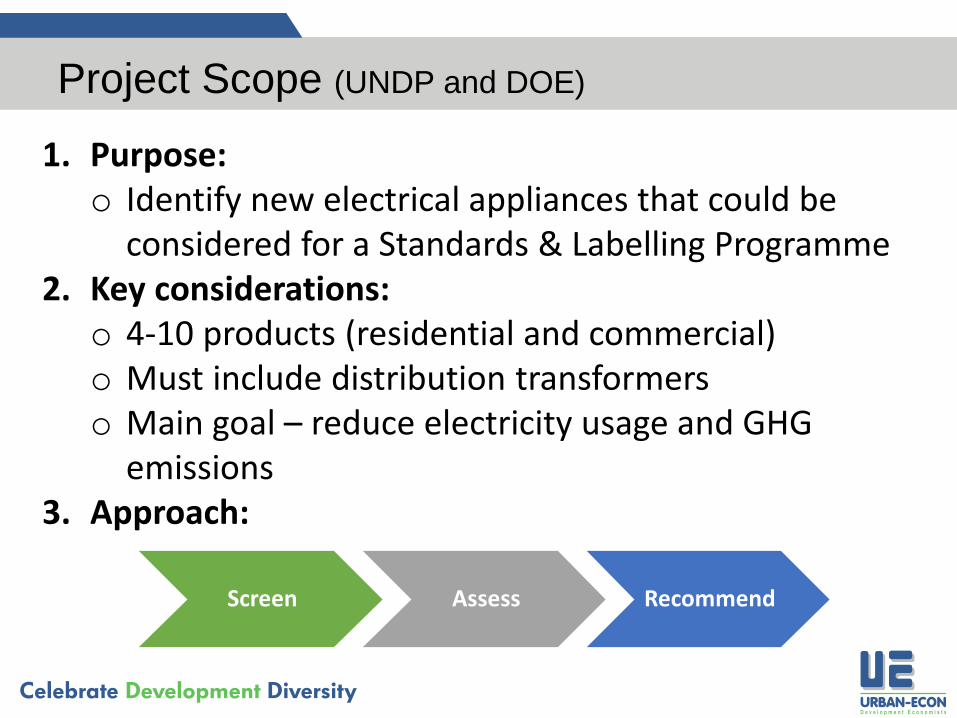
Project Scope (UNDP and DOE)
1. Purpose:o Identify new electrical appliances that could be
considered for a Standards & Labelling Programme 2. Key considerations:
o 4-10 products (residential and commercial)o Must include distribution transformers o Main goal – reduce electricity usage and GHG
emissions 3. Approach:
Screen Assess Recommend

3. Screening

Screening process
• List all lights and appliances products
• MEPS and labelling in 75 countries All lights,
appliances
• Boundaries - Remove products out of scope
• Products covered by MEPS in SA already
• Remove any non-electric products 0. Scope
• Globally regulated products
• At least two countries/economic blocks
• EU MEPS/Ecodesign counted as one
1. MEPS elsewhere
• Likley future energy savings from new MEPS
• Efficiency range, sales, usage levels and power
• Relative significant future potential energy savings
2. Energy Savings
• Check for adoption, implementation and operation issues
• Relevant test procedures in place, ideally SAN (or IEC, ISO)
• MVE issues, especially any verification issues
3. Ease of adoption
• SA appropriate - technical or other barriers
• Technologies, increased purchase costs, rate of market change, local manufacturing impacts
4. Other barriers
96
72
24
9

Shortlisted electric equipment
Note: Large ACs (>7.1kW) to be covered in a separate study

4. Methodology

Methodology
1. Data sources:o In-house developed database of electric appliances (web crawling, brochures,
etc.)o Euromonitor, 2017o AMPS datao Shop visits
2. Approach:
Pro
du
ct p
rofi
ling Euromonitor,
2017
AMPS data
Shop visits
Development of product database
MEP
S id
en
tifi
cati
on Analysis of MEPS in other countries
Product testing requirements
Identifying MEPS for consideration in S.A.
Imp
act
asse
ssm
en
t Country related impacts
Consumer-specific impacts
Re
com
me
nd
atio
ns Implementation
plan
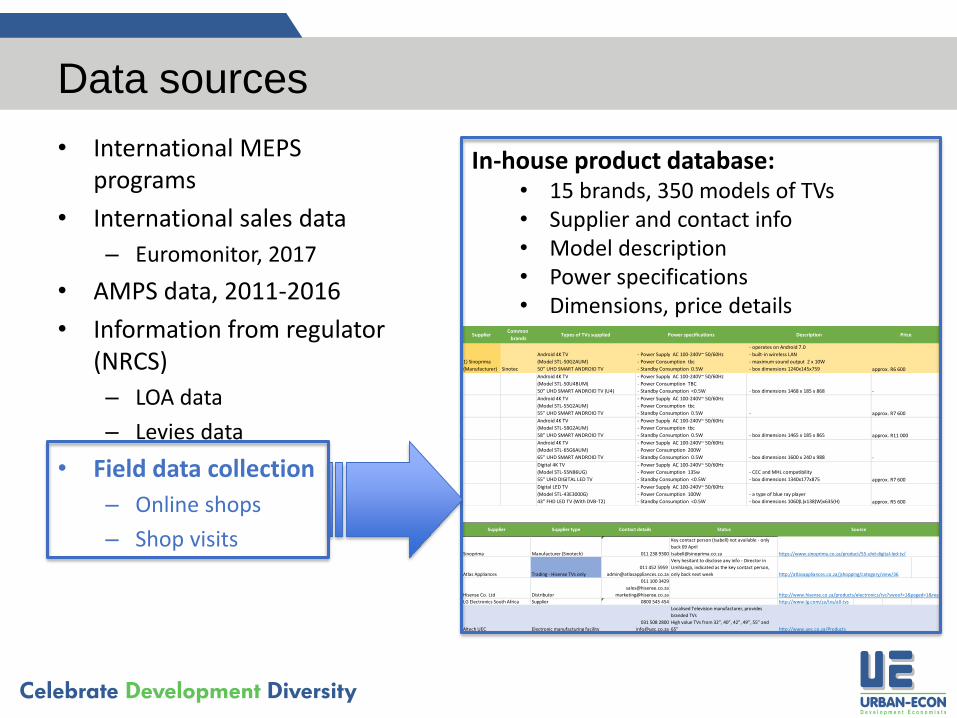
Data sources
• International MEPSprograms
• International sales data
– Euromonitor, 2017
• AMPS data, 2011-2016
• Information from regulator (NRCS)
– LOA data
– Levies data
• Field data collection
– Online shops
– Shop visits
1) Sinoprima
(Manufacturer) Sinotec
Android 4K TV
(Model STL-50G2AUM)
50” UHD SMART ANDROID TV
- Power Supply AC 100-240V~ 50/60Hz
- Power Consumption tbc
- Standby Consumption 0.5W
- operates on Android 7.0
- built-in wireless LAN
- maximum sound output 2 x 10W
- box dimensions 1240x145x759 approx. R6 600
Android 4K TV
(Model STL-50U4BUM)
50” UHD SMART ANDROID TV (U4)
- Power Supply AC 100-240V~ 50/60Hz
- Power Consumption TBC
- Standby Consumption <0.5W - box dimensions 1468 x 185 x 868 -
Android 4K TV
(Model STL-55G2AUM)
55” UHD SMART ANDROID TV
- Power Supply AC 100-240V~ 50/60Hz
- Power Consumption tbc
- Standby Consumption 0.5W - approx. R7 600
Android 4K TV
(Model STL-58G2AUM)
58” UHD SMART ANDROID TV
- Power Supply AC 100-240V~ 50/60Hz
- Power Consumption tbc
- Standby Consumption 0.5W - box dimensions 1465 x 185 x 865 approx. R11 000
Android 4K TV
(Model STL-65G6AUM)
65” UHD SMART ANDROID TV
- Power Supply AC 100-240V~ 50/60Hz
- Power Consumption 200W
- Standby Consumption 0.5W - box dimensions 1600 x 240 x 988 -
Digital 4K TV
(Model STL-55N86UG)
55” UHD DIGITAL LED TV
- Power Supply AC 100-240V~ 50/60Hz
- Power Consumption 135w
- Standby Consumption <0.5W
- CEC and MHL compatibility
- box dimensions 1340x177x875 approx. R7 600
Digital LED TV
(Model STL-43E3000G)
43” FHD LED TV (With DVB-T2)
- Power Supply AC 100-240V~ 50/60Hz
- Power Consumption 100W
- Standby Consumption <0.5W
- a type of blue ray player
- box dimensions 1060(L)x138(W)x635(H) approx. R5 600
Supplier PriceTypes of TVs suppliedCommon
brands Power specifications Description
Sinoprima Manufacturer (Sinotech) 011 238 9300
Key contact person (Isabell) not available - only
back 09 April
Atlas Appliances Trading - Hisense TVs only
011 452 5959
Very hesitant to disclose any info - Director in
Umhlanga, indicated as the key contact person,
only back next week http://atlasappliances.co.za/jshopping/category/view/36
Hisense Co. Ltd Distributor
011 100 3429
[email protected] http://www.hisense.co.za/products/electronics/tvs?swoof=1&paged=1&really_curr_tax=96-product_cat
LG Electronics South Africa Supplier 0800 545 454 http://www.lg.com/za/tvs/all-tvs
Altech UEC Electronic manufacturing facility
031 508 2800
Localised Television manufacturer, provides
branded TVs
High value TVs from 32”, 40”, 42”, 49”, 55” and
65” http://www.uec.co.za/Products
https://www.sinoprima.co.za/product/55-uhd-digital-led-tv/
Supplier Supplier type Contact details Status Source
In-house product database:• 15 brands, 350 models of TVs • Supplier and contact info • Model description• Power specifications • Dimensions, price details
5. International MEPS trends

International Review of MEPS for televisions
• A range of countries have introduced MEPS in the past 10 years– Most have been left behind by market improvements
• Most stringent regulation in force is currently in California
• SEAD has been doing work to encourage global alignment of efficiency metrics– SEAD recommends Energy Star approach to defining
efficiency
• Most countries also have energy labelling with MEPS
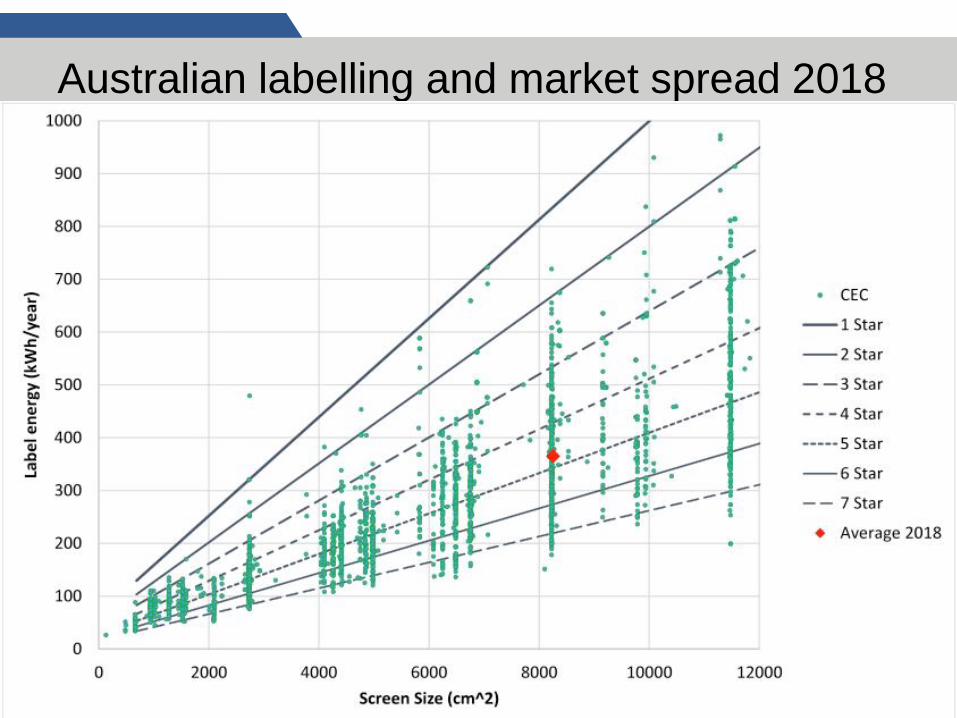
Australian labelling and market spread 2018

Comparison of television MEPS requirements
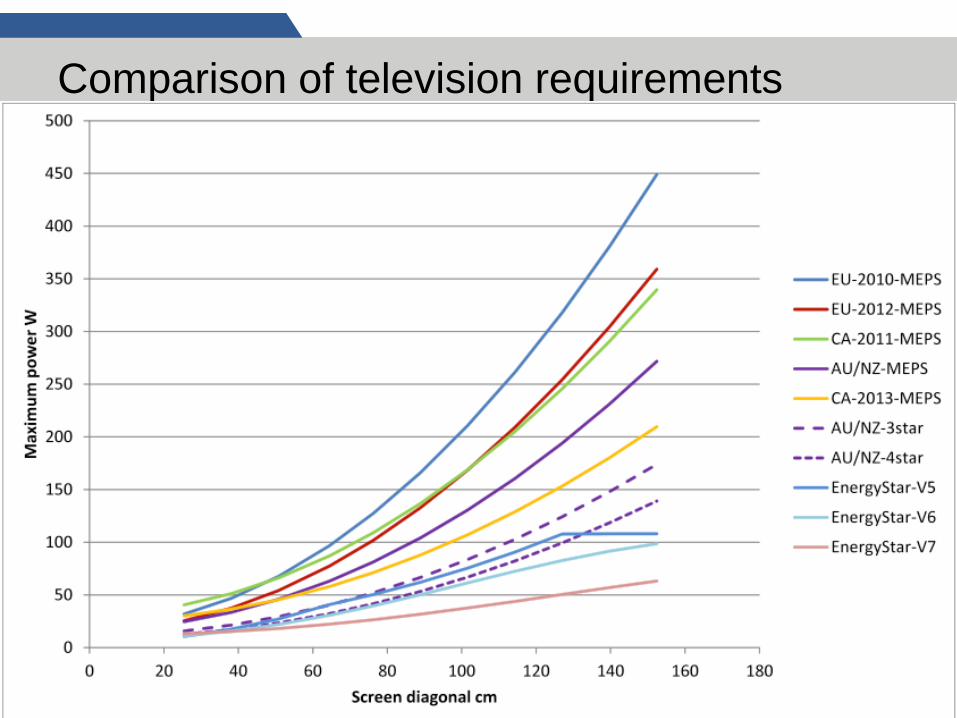
Comparison of television requirements
6. SA analysis
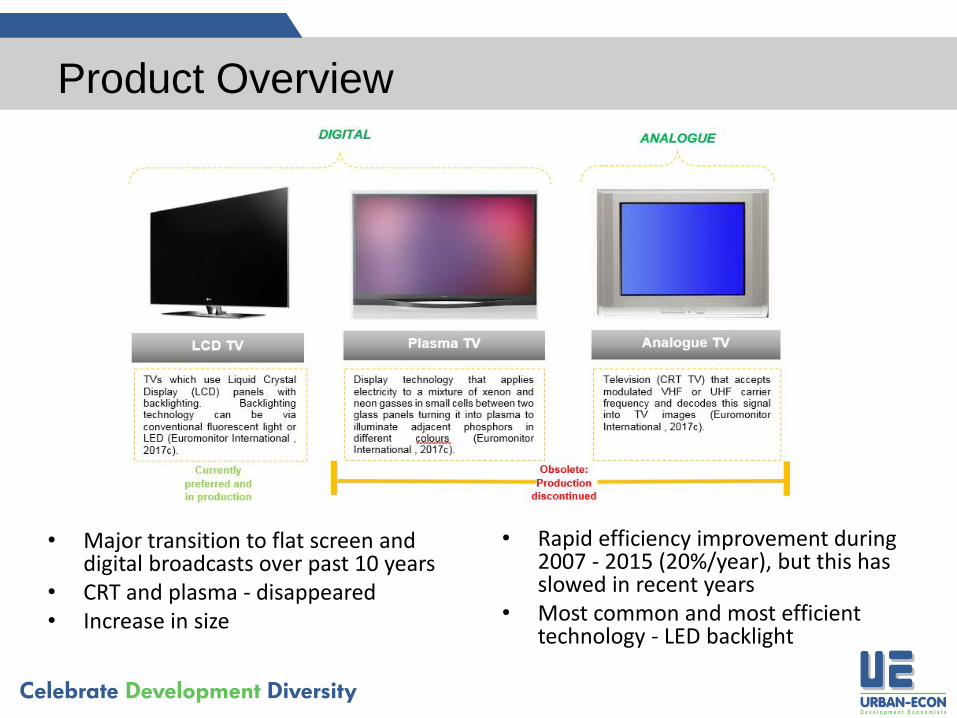
Product Overview
• Major transition to flat screen and digital broadcasts over past 10 years
• CRT and plasma - disappeared• Increase in size
• Rapid efficiency improvement during 2007 - 2015 (20%/year), but this has slowed in recent years
• Most common and most efficient technology - LED backlight
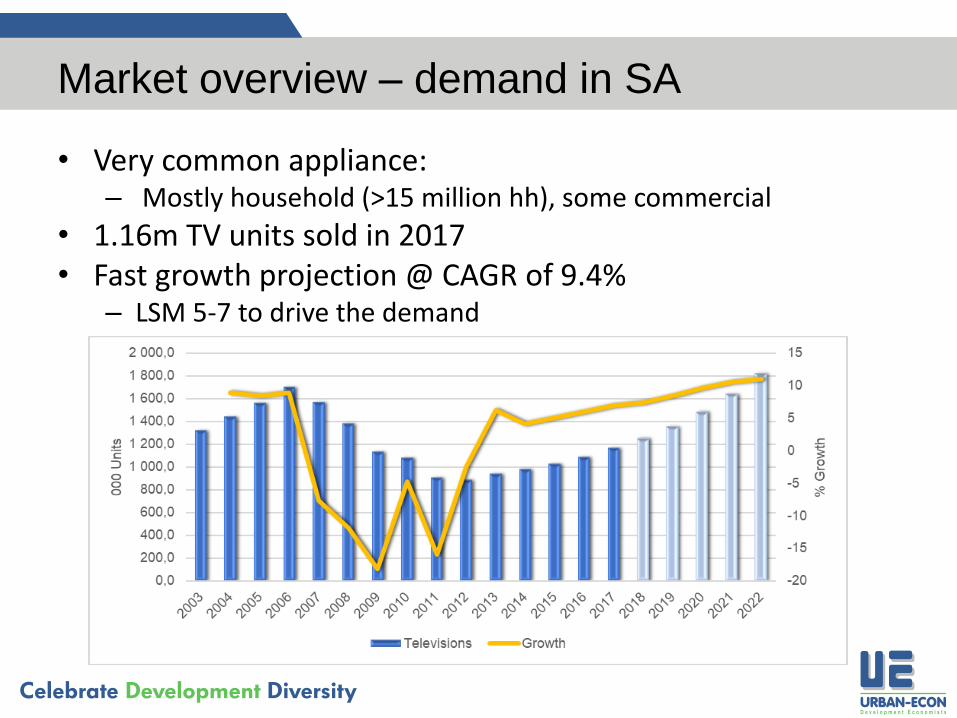
Market overview – demand in SA
• Very common appliance:– Mostly household (>15 million hh), some commercial
• 1.16m TV units sold in 2017• Fast growth projection @ CAGR of 9.4%
– LSM 5-7 to drive the demand
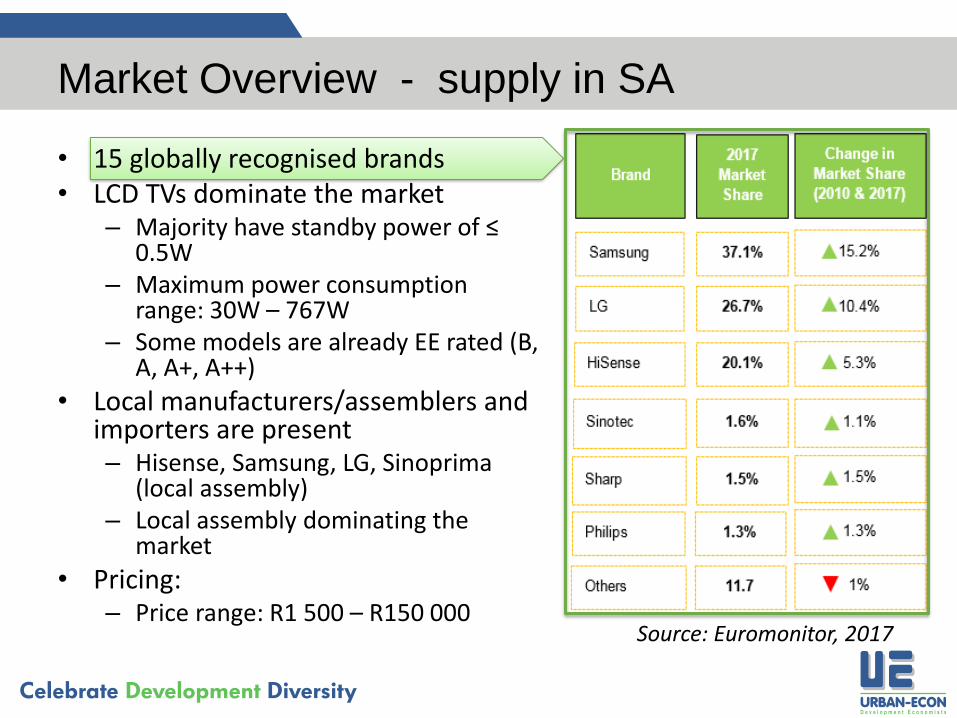
Market Overview - supply in SA
• 15 globally recognised brands • LCD TVs dominate the market
– Majority have standby power of ≤ 0.5W
– Maximum power consumption range: 30W – 767W
– Some models are already EE rated (B, A, A+, A++)
• Local manufacturers/assemblers and importers are present – Hisense, Samsung, LG, Sinoprima
(local assembly) – Local assembly dominating the
market
• Pricing:– Price range: R1 500 – R150 000
Source: Euromonitor, 2017

Impact Analysis – Assumptions
Sector TypeRepresentative
DiagonalArea
Energy consumption Market
shareBAU MEPS Standby
Residential Small 24-inch 1669 cm2 38.6W 30.9W 0.5 30%
Residential Medium 40-inch 4273 cm2 81.3W 65.0W 0.5 40%
Residential Large 59-inch 9614 cm2 168.8W 135.0W 0.5 20%
Commercial Large 55-inch 8375 cm2 148.5W 118.8W 0.5 10%
• Average product life: 10 years
• Annual sales: 1.16 million units
• BAU base case - AU/NZ 3 star
• Proposed MEPS - AU/NZ 4 star (slightly weaker to MEPS in Energy Star V5.0)
• The annual hours of operation:– Residential: 1 825
– Commercial: 2 200
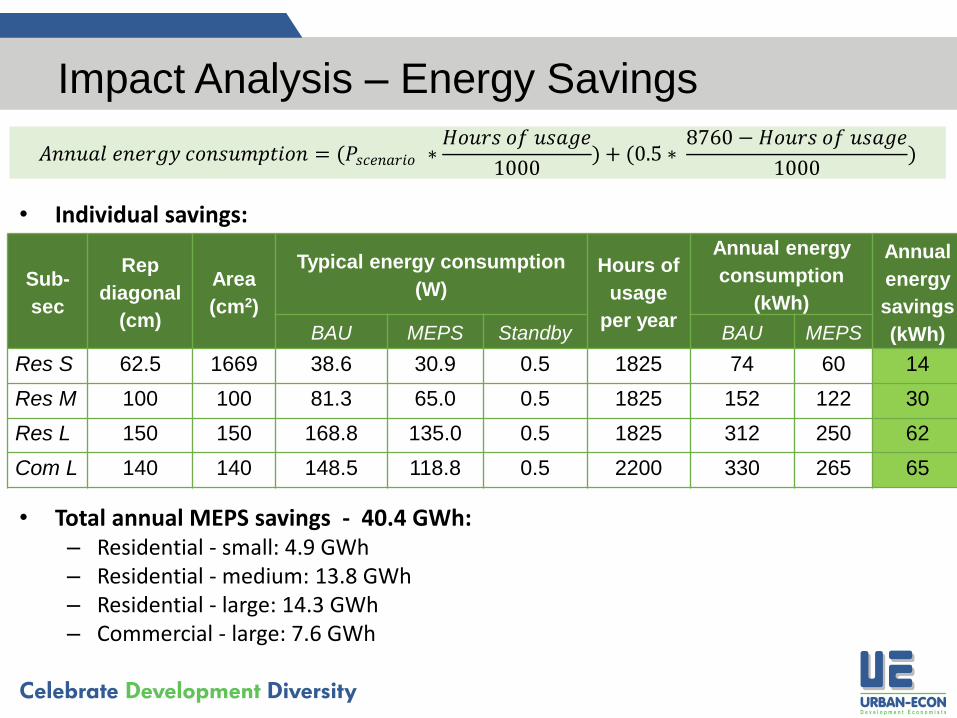
Impact Analysis – Energy Savings
• Individual savings:
• Total annual MEPS savings - 40.4 GWh:– Residential - small: 4.9 GWh– Residential - medium: 13.8 GWh– Residential - large: 14.3 GWh– Commercial - large: 7.6 GWh
𝐴𝑛𝑛𝑢𝑎𝑙 𝑒𝑛𝑒𝑟𝑔𝑦 𝑐𝑜𝑛𝑠𝑢𝑚𝑝𝑡𝑖𝑜𝑛 = (𝑃𝑠𝑐𝑒𝑛𝑎𝑟𝑖𝑜 ∗𝐻𝑜𝑢𝑟𝑠 𝑜𝑓 𝑢𝑠𝑎𝑔𝑒
1000) + (0.5 ∗
8760 −𝐻𝑜𝑢𝑟𝑠 𝑜𝑓 𝑢𝑠𝑎𝑔𝑒
1000)
Sub-
sec
Rep
diagonal
(cm)
Area
(cm2)
Typical energy consumption
(W)
Hours of
usage
per year
Annual energy
consumption
(kWh)
Annual
energy
savings
(kWh)BAU MEPS Standby BAU MEPS
Res S 62.5 1669 38.6 30.9 0.5 1825 74 60 14
Res M 100 100 81.3 65.0 0.5 1825 152 122 30
Res L 150 150 168.8 135.0 0.5 1825 312 250 62
Com L 140 140 148.5 118.8 0.5 2200 330 265 65

Impact Analysis – Cost implications
• TV prices are based on many aspects e.g. size, design, technologies, internet connectivity, brand name, features etc
• Efficiency does not appear to be a major determining factor of TV prices – There are cases where an energy efficient TV can cost less than an equivalent inefficient
model
• More energy efficient TV ≠ more expensive unit
COMPARISON OF 65” TELEVISIONS
Brand and model Brand X (Model X) Brand X (Model Y)
Description 65” Super UHD TV 65” OLED TV
EU energy efficiency class A+ A
Annual energy consumption 155kWh 214kWh
Retail price R29,049 R39,799
COMPARISON OF 55” TELEVISIONS
Brand and model Brand X (Model A) Brand X (Model B)
Description 55” Super UHD TV 55” OLED TV
EU energy efficiency class A+ A
Average Power Consumption 106W 112W
Retail price R16,271 R23,373

7. Recommendations

Recommendations for Televisions
• Option 1:– Most stringent existing MEPS level currently in operation: equivalent to
those in California in 2013
• Option 2:– MEPS level equivalent to 3 stars under the Aus/NZ labelling scheme – Modest impact
• Option 3: – MEPS level equivalent to 4 stars under the Aus/NZ labelling scheme – Moderate impact
• Option 4 (recommended):– MEPS levels comparable to Energy Star V5.0 (roughly similar to Option 3)
• Option 5:– MEPS levels comparable to Energy Star V6.0
• Energy labelling also recommended in parallel

7. Discussion and questions?