Review of prices for Sydney Water Corporation’s …...Contents Review of prices for Sydney Water...
244
Independent Pricing and Regulatory Tribunal Review of prices for Sydney Water Corporation’s water, sewerage, stormwater drainage and other services From 1 July 2012 to 30 June 2016 Water — Final Report June 2012
Transcript of Review of prices for Sydney Water Corporation’s …...Contents Review of prices for Sydney Water...

Independent Pricing and Regulatory Tribunal
Review of prices for Sydney Water Corporation’s water, sewerage, stormwater drainage and other servicesFrom 1 July 2012 to 30 June 2016
Water — Final ReportJune 2012


Review of prices for Sydney Water Corporation’s water, sewerage, stormwater drainage and other services From 1 July 2012 to 30 June 2016
Water — Final Report June 2012

ii IPART Review of prices for Sydney Water Corporation’s water, sewerage, stormwater drainage and other services
© Independent Pricing and Regulatory Tribunal of New South Wales 2012
This work is copyright. The Copyright Act 1968 permits fair dealing for study, research, news reporting, criticism and review. Selected passages, tables or diagrams may be reproduced for such purposes provided acknowledgement of the source is included.
ISBN 978-1-922127-04-4
The Tribunal members for this review are:
Dr Peter Boxall AO, Chairman
Mr James Cox PSM, Chief Executive Officer and Full Time Member
Ms Sibylle Krieger, Part Time Member
Inquiries regarding this document should be directed to a staff member:
Lucy Garnier (02) 9290 8453
Scott Chapman (02) 9290 8449
Independent Pricing and Regulatory Tribunal of New South Wales PO Box Q290, QVB Post Office NSW 1230 Level 8, 1 Market Street, Sydney NSW 2000
T (02) 9290 8400 F (02) 9290 2061
www.ipart.nsw.gov.au

Contents
Review of prices for Sydney Water Corporation’s water, sewerage, stormwater drainage and other servicesIPART iii
Contents
1 Executive summary 1 1.1 Overview of determination 1 1.2 Impact on residential customer bills 9 1.3 Impact on non-residential customers 11 1.4 Impact of Sydney Desalination Plant on customers 13 1.5 Impact on Sydney Water 14 1.6 Structure of this report 19
2 Context for this review 20 2.1 Other reviews that have affected our decisions and inputs 21 2.2 IPART’s review process 22 2.3 Matters we are required to consider 23 2.4 Overview of Sydney Water’s submissions 25
3 IPART’s approach to setting prices 29 3.1 Overview of price setting approach 29 3.2 Length of the determination period 30 3.3 Approach for determining the notional revenue requirement 33 3.4 Approach for converting the notional revenue requirement into prices 35 3.5 Approach for addressing the risk of significant variation between actual and
forecast water sales 38 3.6 Approach to addressing uncertainty about SDP’s operating schedule and its
impact on Sydney Water’s costs 40 3.7 Obligations on Sydney Water to report on its progress against output
measures 41
4 Overview of IPART’s findings and decisions on Sydney Water’s revenue requirements 43 4.1 Summary of findings and decisions on revenue requirements 44 4.2 Sydney Water’s proposed notional revenue requirement 44 4.3 IPART’s finding on the notional revenue requirement 45 4.4 IPART’s decision on target revenue 47 4.5 IPART’s finding on revenue from trade waste services and other fees and
charges 48

Contents
iv IPART Review of prices for Sydney Water Corporation’s water, sewerage, stormwater drainage and other services
5 Operating expenditure 52 5.1 Summary of IPART’s finding 52 5.2 Sydney Water’s submission 53 5.3 Stakeholder comments 58 5.4 Atkins Cardno’s review 59 5.5 IPART’s analysis 65
6 Capital expenditure 69 6.1 Summary of IPART’s decisions 70 6.2 Assessing Sydney Water’s past capital expenditure 71 6.3 Assessing Sydney Water’s forecast capital expenditure 75 6.4 Calculating the annual value of the RAB over the determination period 83 6.5 Calculating the allowance for a return on assets 85 6.6 Calculating the allowance for regulatory depreciation 87
7 Sydney Water’s forecast water sales 90 7.1 Decisions 91 7.2 Sydney Water’s Proposed Approach 92 7.3 Alternatives to Sydney Water’s Model 95 7.4 Stakeholder Consultation 96 7.5 IPART’s Analysis 98
8 Outcomes from review of price structures 99 8.1 Price structures review for the 4 water utilities 99 8.2 Price structures for Sydney Water 101 8.3 Impacts on Sydney Water’s customers from proposed price reform 104
9 Pricing decisions for Sydney Water’s water services 107 9.1 Water charges 107 9.2 Unfiltered water charges 113 9.3 Sewerage charges 115 9.4 Stormwater drainage charges 121 9.5 Charges for the Rouse Hill Area 124 9.6 Recycled water 130 9.7 Trade waste charges 134 9.8 Miscellaneous charges 148 9.9 Minor service extension charges 151 9.10 Exempt land 152 9.11 Combination and mixed development 153 9.12 Unmetered properties 154

Contents
Review of prices for Sydney Water Corporation’s water, sewerage, stormwater drainage and other servicesIPART v
10 Implications of pricing decisions for Sydney Water customers 156 10.1 Summary of findings on implications for customers 156 10.2 Impact of price restructuring on different customers 157 10.3 Impact on the affordability of services for residential customers 161 10.4 Impact on the affordability of services for non-residential customers 174 10.5 Impact of 2008 decision to limit Sydney Water’s ability to levy developer
charges 179
11 Implications of pricing decisions for Sydney Water’s service standards, financial viability and other issues 181 11.1 Implications for Sydney Water’s service standards 181 11.2 Impact on Sydney Water’s financial viability and shareholders 182 11.3 Implications for general inflation 186 11.4 Implications for the environment 186
Appendices 187 A Matters to be considered by IPART under section 15 of the IPART Act 189 B Sydney Water’s output measures and capital expenditure program 191 C Weighted average cost of capital 197 D Calculating the tax allowance 213 E Long Run Marginal Cost of Water 215 F Water and sewerage bills and disposable income analysis for Sydney Water 225 G List of decisions 229
Glossary 233


1 Executive summary
Review of prices for Sydney Water Corporation’s water, sewerage, stormwater drainage and other servicesIPART 1
1 Executive summary
The Independent Pricing and Regulatory Tribunal of NSW (IPART) is responsible for regulating the prices Sydney Water Corporation (Sydney Water) can charge for the water supply, sewerage and stormwater drainage services it provides to its residential and non-residential customers, as well as some of its recycled water services and a range of miscellaneous services (including trade waste). We recently completed our review and made our determination on the maximum prices Sydney Water can charge for these services over the 4-year period from 1 July 2012 to 30 June 2016 (the 2012 determination period).
This report explains our determination, including our key decisions and the analysis and rationale that underpin those decisions.
1.1 Overview of determination
While Sydney Water proposed average price increases of around 15% in real terms1 over the determination period, our determination means that water supply prices will go down in real terms over this period. As a result, most customers will experience a slight decrease in their annual water and sewerage bills in real terms (and a slight increase once inflation is incorporated into prices). For example, the annual bill for a typical residential customer living in a freestanding house will fall by $29 in real terms between 2012 and 2016. The main reason for this is that our decision that Sydney Water’s revenue requirement over this period is lower than it proposed.
However, some customers will experience larger decreases and others real increases in their annual water and sewerage bills. This is due to our decision to restructure water, sewerage and stormwater prices to remove cross-subsidies between customer groups and improve the cost-reflectivity of these prices. This price restructuring will not increase the total revenue Sydney Water receives for services. Rather, it removes inequities and improves the balance between fixed service charges and variable usage charges so customers in all groups pay bills that better represent the costs they impose on Sydney Water. The price restructuring also ensures that Sydney Water’s prices send efficient price signals.
1 That is, before inflation is applied.

1 Executive summary
2 IPART Review of prices for Sydney Water Corporation’s water, sewerage, stormwater drainage and other services
To mitigate the impacts of these price changes on Sydney Water and its customers, we have adopted a glide path approach in setting prices. That is, we have calculated the prices required in the final year and set prices in the interim years to transition to those prices. This smooths out the price fluctuations that would otherwise occur.
1.1.1 Our decision on Sydney Water’s revenue requirement
Sydney Water estimated that its revenue requirement will increase by an average of 4.2% per year over the determination period,2 and therefore proposed average price increases of around 15% (in real terms). However, based on our analysis and calculations, we decided that its revenue requirement will remain fairly stable during the period, increasing by an average of only 0.7% per year (real terms).
There are 4 main reasons why our decision on the revenue requirement is lower than Sydney Water’s estimate, the first 2 of which are methodological:
1. We used a real post-tax Weighted Average Cost of Capital (WACC) in calculating the allowances for returns on and of assets and included tax liabilities as a separate cost building block, in line with our recent decision on our approach for determining water utilities’ revenue requirements.3 In its submission, Sydney Water used a real pre-tax WACC, in line with our previous approach.
2. We set prices based on the assumption that the Sydney Desalination Plant (SDP) will be in water security mode for the full 4 years of the determination period, and any costs associated with periods of plant operation will be passed through to customers in the next year.4 Sydney Water proposed prices on the basis that SDP will be in full operation mode, and any savings associated with periods of shutdown will be passed through in the next year.
3. We decided that the appropriate level of post-tax WACC for Sydney Water is 5.6%, which is lower than Sydney Water proposed. This decision is consistent with, and similar to, the WACC we used in determining prices for the Sydney Desalination Plant (although we used a pre-tax WACC for SDP’s determination, in line with our approach at that time).5 In reaching this decision, we took account of the current uncertainties in the market by considering long-term averages and selecting a WACC at the top end of the range.
2 Sydney Water proposed an increase of $401 million (around 17%) over its 2011/12 revenue for
2015/16. 3 IPART, The incorporation of company tax in price determinations, June 2011. 4 Our determination allows for any additional bulk water costs incurred by Sydney Water due to
SDP operating and supplying water (in accordance with the Metropolitan Water Plan) to be passed through to customers’ bills in the following year. This will increase typical residential bills by around $30 in 2015/16. Quoted bills include approximately $100 per year to cover payments to SDP operating in water security mode.
5 Our decision was that the real pre-tax WACC for SDP is 6.7%. Our calculations indicated that our decision that the real post-tax WACC of 5.6% for Sydney Water is equivalent to a real pre-tax WACC of approximately 6.6% (using the same input parameters for both calculations). For more information about these parameters see Appendix C.

1 Executive summary
Review of prices for Sydney Water Corporation’s water, sewerage, stormwater drainage and other servicesIPART 3
4. We allowed for lower capital and operating expenditure than Sydney Water proposed, in line with our view that there are opportunities for it to make efficiency savings in some areas of its proposed expenditure.
To illustrate the impact of our decisions for the final determination (including those discussed above), Table 1.1 shows how a typical residential bill would have changed under Sydney Water’s proposal and compares it to the change under our draft and final determinations.
Table 1.1 Change in a typical residential water and sewerage bill between 2011/12 and 2015/16 under Sydney Water’s proposal and IPART’s draft and final determinations ($2011/12)
$2011/12
Change in current bill under Sydney Water’s proposal +166 +166
Impact of IPART decisions: Draft Final
Use post-tax rather than pre-tax WACCa -54 -52
Use of post-tax WACC of 5.5% (draft determination) 5.6% (final determination)
-89 -64
Set prices on basis that SDP is in water security shutdown mode -38 -38
Update proposed SDP-related costs to reflect our final determination on SDP’s pricesb
-12 -12
Apply efficiency savings to proposed operating expenditure -9 -9
Apply efficiency savings to proposed capital expenditurec -19 -18
Other (including changes to price structures) -3 -3
Total impact of IPART decisions on bill on Sydney Water’s proposal -223 -195
Total change in current bill under IPART’s determination -57 -29a The change between the draft and final reports incorporates a correction to our calculation to include a tax allowance on Assets Free of Charge. b As Sydney Water made its submission before we completed our determination on SDP’s prices, it included SDP’s proposed prices. These proposed prices were higher than those we subsequently determined. c The change between the draft and final reports is due to our decision to allow additional stormwater capital expenditure and the avoided costs of Rouse Hill recycled water plant.
Note: Assumes 200kL consumption. Totals may vary due to rounding.
1.1.2 Our decision to restructure prices
In making our 2012 determination, we considered the findings of our recent broad review of the price structures of Sydney Water and the other metropolitan water utilities we regulate.6 This review found that under the current price structures, the fixed charges that some Sydney Water customers pay do not reflect the cost of making the services available to them. As a result, other customer groups are paying more than the cost of providing their service.
6 IPART, Review of price structures for metropolitan water utilities – Final Report, March 2012.

1 Executive summary
4 IPART Review of prices for Sydney Water Corporation’s water, sewerage, stormwater drainage and other services
To remove these cross-subsidies and improve the equity and cost-reflectivity of Sydney Water’s prices for all customers, we made decisions to:
Introduce a standard water service charge of $94.88 per year for all residential customers, regardless of their property type. Currently, there is no standard water service charge for residential customers with a unit in a multi-dwelling property with a shared meter. On average, these customers pay around $70 per year, but some pay as little as $5 to $10 a year.7 In contrast, residential customers with a single-dwelling property or a unit with an individual meter pay a standard water service charge of $144.79 per year.
We consider all residential customers impose similar costs on Sydney Water in having a water supply service to their home, and so should all pay the same price for this availability. We note that differences in customers’ water usage are already accounted for through the variable water usage charge. Therefore, we have decided to introduce a standard water service charge for all residential customers.
As a result of this decision, many households in units with a shared meter will pay a higher service charge than currently, while all those in houses and units with an individual meter will pay a lower service charge. To minimise the impacts of this price restructuring on customers and Sydney Water, we have set water services charges so they transition towards the standard charge over several years. All customers will pay the standard charge by 1 July 2015.
Remove the standard sewerage service charge for non-residential customers with a strata unit in a property with a shared meter, and replace it with a meter-based charge. These customers currently pay a service charge equal to the sewerage service charge for customers with an individual 20mm meter. In contrast, those in single-owner properties with a shared meter pay a pro-rata share of the applicable sewerage service charge for the property’s meter size.8 This means that non-residential customers in properties with the same size meter can pay very different charges for the same service, depending on the property’s title. It also means that collectively, those in strata units contribute more than their share of Sydney Water’s fixed sewerage costs, and thus cross-subsidise those in non-strata properties.
To remove this cross-subsidisation, we have decided to restructure sewerage service charges so that all non-residential customers in a property with a shared meter pay a pro-rata share of charge applicable to the property’s meter size. This results in increases in the total building charge for single owner properties with a meter size of 25mm or larger. However, once this charge is shared, the charge applicable to many non-residential customers within those properties will decrease as they will no longer be subject to the standard charge.
7 This is because Sydney Water charges these customers on the basis of a share of a meter based
charge. 8 Sydney Water invoices the property owner a single charge based on the meter size.

1 Executive summary
Review of prices for Sydney Water Corporation’s water, sewerage, stormwater drainage and other servicesIPART 5
Reduce the sewerage usage charge for non-residential customers so it moves towards a level that reflects the short run marginal cost of treating sewage. Currently, the level of Sydney Water’s sewerage usage charge is above the estimated unit cost of collection, treatment and disposal of sewage. We are concerned that this provides a poor pricing signal and could provide perverse incentives for some large customers to adopt on-site recycling where this is not efficient. If this were to occur, Sydney Water may lose some of its sewerage revenue stream and need to recover costs through higher charges to its remaining customers. As the estimated unit cost of collection, treatment and disposal of sewage is significantly less that the current usage charge, we have decided to transition the charge towards this cost over the determination period. As a result, the sewerage usage charge decreases by 32% over the period.
Set area-based stormwater drainage charges. Sydney Water supplies stormwater drainage services to a small proportion of its customers.9 These customers currently pay a fixed charge, based on whether they are residential or non-residential. However, as the area of land serviced is a key determinant of the costs of a drainage system, a customer’s property size can be used as a simple proxy for their contribution to these costs.10 Given this, we have decided to introduce area-based stormwater drainage charges over the determination period to make the charges more cost reflective.
Residential customers will pay fixed charges ($/year) based on their property type (single or multi-dwelling) as a proxy for property size. Non-residential customers will pay fixed charges depending on which of 5 property-size bands they fall into. As a result of this decision, customers with relatively small properties (such as units) will pay lower charges, while those with larger properties will pay higher charges.
1.1.3 Price outcomes
Under the determination, the prices for some services for most customers decrease over the determination period, while those for others increase or stay the same (in real terms).11
For water supply services (Table 1.2):
The fixed service charges ($ per year) decrease in each year of the period. For residential customers with individual meters, the standard charge falls by 34.5% from its current level by 2015/16. For non-residential customers, it falls by 17% by 2015/16.
9 There are just over 500,000 customers, mostly located in the inner west and inner south west of
Sydney who receive stormwater drainage services from Sydney Water. For the remaining customers, stormwater drainage services are supplied by their local council.
10 There are also other determinants such as such as slope of the ground, the percentage of impervious ground, the percentage of water that drains off the property, on-site retention and storage devices and the nature of the land usage that also drive costs.
11 That is, the price before adjusting for inflation.

1 Executive summary
6 IPART Review of prices for Sydney Water Corporation’s water, sewerage, stormwater drainage and other services
The variable usage charge ($ per kilolitre) for drinking water does not change over the determination period, and the charge for unfiltered water increases by only 1.4% compared to its current level.
Table 1.2 Prices for water supply services ($2011/12)
Current (2011/12) 2012/13 2013/14 2014/15 2015/16
Total change
Service charges ($/year) Residential - individual meter
144.79 132.99 120.15 107.49 94.88 -34.5%
Residential - common meter
N/A a 70.00 78.29 86.59 94.88 NA
Non residential
20mm individual meter 144.79 132.99 120.15 107.49 94.88 -34.5%
20mm meter 144.79 138.07 132.09 126.02 120.14 -17.0%
25mm meter 226.24 215.73 206.39 196.91 187.72 -17.0%
32mm meter 370.66 353.45 338.15 322.62 307.56 -17.0%
40mm meter 579.17 552.27 528.36 504.09 480.56 -17.0%
50mm meter 904.95 862.92 825.56 787.64 750.88 -17.0%
80mm meter 2,317 2,209 2,113 2,016 1,922 -17.0%
100mm meter 3,620 3,452 3,302 3,151 3,004 -17.0%
150mm meter 8,145 7,766 7,430 7,089 6,758 -17.0%
200mm meter 14,479 13,807 13,209 12,602 12,014 -17.0%
300mm meter 32,579 31,065 29,720 28,355 27,032 -17.0%
Usage charges ($/kilolitre)
Usage - drinking water 2.10 2.10 2.10 2.10 2.10 0%
Usage - unfiltered water 1.78 1.80 1.80 1.80 1.80 1% a Customers with a shared meter such as apartments currently pay a share of the service charge which is based on the size of the meter. This share depends on the number of units being served by the meter and the size of the meter. Under our determination, all apartments will now pay a set annual service charge.
For sewerage services (Table 1.3):
The fixed service charge ($ per year) for residential customers and for almost half of non-residential customers increases by 4% over the determination period. For other non-residential customers – those with individual meters of 25mm diameter or greater – this charge increases by around 78%.
The variable usage charge ($ per kilolitre) for non-residential customers decreases by around one-third over the period. However, the threshold volume of sewerage discharge above which non-residential customers are liable to pay the charge also decreases by 50 kL per year to 300kL in 2015/16.
1 Executive summary
Review of prices for Sydney Water Corporation’s water, sewerage, stormwater drainage and other servicesIPART 7
Table 1.3 Prices for sewerage services ($2011/12)
Current(2011/12) 2012/13 2013/14 2014/15 2015/16
Total change
Availability charges ($/year)
Residential 539.53 546.34 551.78 556.29 560.85 4.0%
Non residential
20mm meter (individual) 539.53 546.34 551.78 556.29 560.85 4.0%
20mm meter (shared) 539.53 623.32 720.05 832.25 960.01 77.9%
25mm meter 843.02 973.94 1,125 1,300 1,500 77.9%
32mm meter 1,381 1,596 1,843 2,131 2,458 77.9%
40mm meter 2,158 2,493 2,880 3,329 3,840 77.9%
50mm meter 3,372 3,896 4,500 5,202 6,000 77.9%
80mm meter 8,633 9,973 11,521 13,316 15,360 77.9%
100mm meter 13,488 15,583 18,001 20,806 24,000 77.9%
150mm meter 30,349 35,062 40,503 46,814 54,001 77.9%
200mm meter 53,954 62,332 72,005 83,225 96,001 77.9%
300mm meter 121,396 140,247 162,012 187,256 216,003 77.9%
Usage charge ($/kilolitre)
Non-residential 1.49 1.38 1.25 1.12 1.01 -32.4%
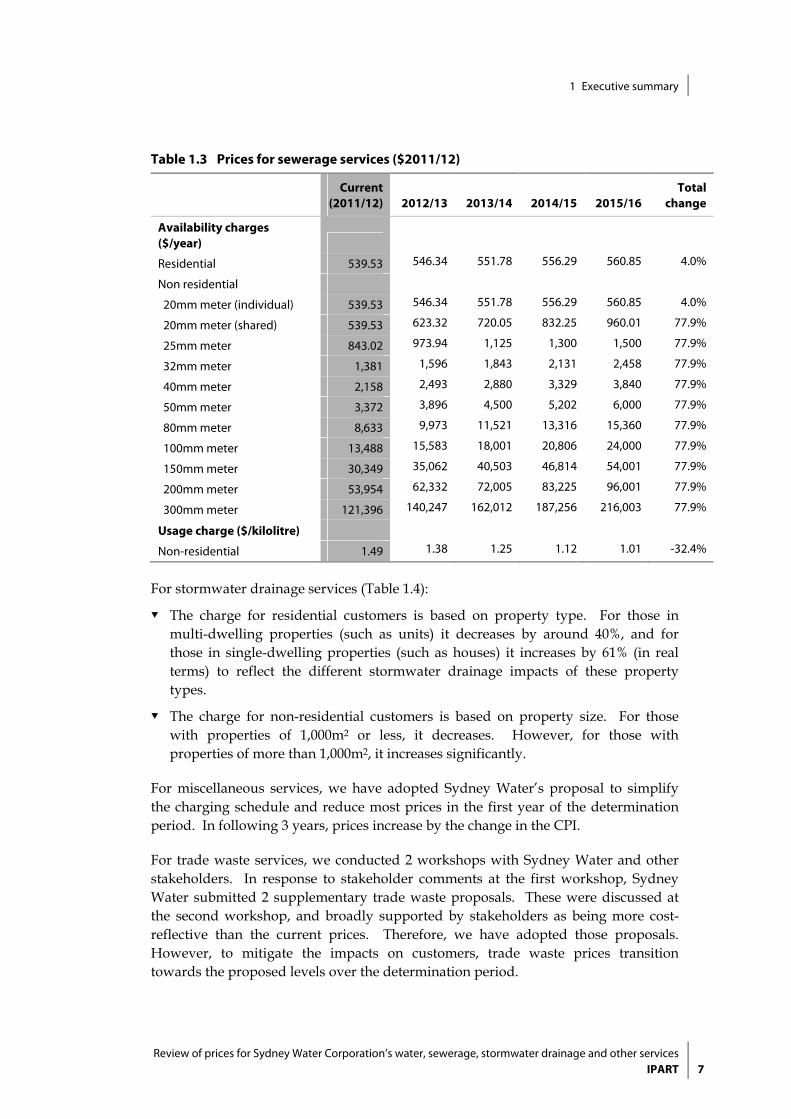
For stormwater drainage services (Table 1.4):
The charge for residential customers is based on property type. For those in multi-dwelling properties (such as units) it decreases by around 40%, and for those in single-dwelling properties (such as houses) it increases by 61% (in real terms) to reflect the different stormwater drainage impacts of these property types.
The charge for non-residential customers is based on property size. For those with properties of 1,000m2 or less, it decreases. However, for those with properties of more than 1,000m2, it increases significantly.
For miscellaneous services, we have adopted Sydney Water’s proposal to simplify the charging schedule and reduce most prices in the first year of the determination period. In following 3 years, prices increase by the change in the CPI.
For trade waste services, we conducted 2 workshops with Sydney Water and other stakeholders. In response to stakeholder comments at the first workshop, Sydney Water submitted 2 supplementary trade waste proposals. These were discussed at the second workshop, and broadly supported by stakeholders as being more cost-reflective than the current prices. Therefore, we have adopted those proposals. However, to mitigate the impacts on customers, trade waste prices transition towards the proposed levels over the determination period.
1 Executive summary
8 IPART Review of prices for Sydney Water Corporation’s water, sewerage, stormwater drainage and other services
Table 1.4 Prices for stormwater drainage services ($2011/12)
Current
(2011/12) 2012/13 2013/14 2014/15 2015/16 Total
change
Stormwater drainage
Availability charges
Residential
Apartments 49.08 48.31 39.60 35.20 29.04 -40.8%
Houses 49.08 48.31 66.00 74.81 79.21 61.4%
Non-residential
Non-residential strata and 0-200m2 127.74 125.73 39.60 35.20 29.04 -77.3%
Non-residential 201-1,000m2a 127.74 125.73 105.61 88.01 79.21 -38.0%
Non-residential 1,001-10,000m2 127.74 125.73 193.61 264.02 396.03 210%
Non-res. 10,001m2 – 45,000m2 127.74 125.73 880.06 1,320 1,760 1,278%
Non-res. > 45,000m2 127.74 125.73 1,760 3,080 4,400 3,345%
Rouse Hill River Management Charge
Residential 128.58 128.58 128.58 128.58 128.58 0.0%
Non-residential 128.58 128.58 128.58 128.58 128.58 0.0%a And customers defined by Sydney Water as low impact.
1.1.4 Key differences between draft and final determinations
Our final determination is largely the same as our draft determination. However, we have made changes to some of the inputs we used in our calculation of Sydney Water’s revenue requirement, which underpins the determination. Collectively, these changes meant that our final decision on the revenue requirement for the 4-year determination period is slightly higher ($236 million ($2011/12) or 2.6%) when compared to our draft decision.
As we indicated in the draft report, we have updated the inputs for our estimate of the feasible range for Sydney Water’s WACC to reflect current market conditions. As a result of this, we used a real post-tax WACC of 5.6% in making our final determination, compared to 5.5% for the draft determination.
We made other changes in response to stakeholder submissions on our draft determination, including representations from Sydney Water. All of these changes contributed to the increase in the revenue requirement. In particular, we:
Adjusted our calculation for the allowance for tax obligations included in the revenue requirement to add the tax liability associated with Assets Free of Charge.
Corrected our calculation for the allowance for a return of capital (depreciation) in the revenue requirement to reflect a more accurate allocation of assets between asset classes with different asset lives, which increases the depreciation allowance.

1 Executive summary
Review of prices for Sydney Water Corporation’s water, sewerage, stormwater drainage and other servicesIPART 9
Adjusted the operating expenditure included in the revenue requirement to incorporate additional filtration costs12 and account for lower forecast revenue from the Rosehill-Camellia recycled water scheme.
Increased the value of the Regulatory Asset Base used to calculate the allowances for a return on assets and depreciation to allow for higher stormwater capital expenditure over the determination period and include the value of avoided costs arising from the Rouse Hill recycled water scheme.
Updated trade waste revenues and costs to reflect our final decision to adopt Sydney Water’s supplementary trade waste proposals and allow it to recover the under-recovery due to the transition period from all sewerage customers.
In addition, we considered stakeholder submissions on the move to area based stormwater drainage charges and replaced the variable charge for very large properties with an additional fixed price band.
1.2 Impact on residential customer bills
As a result of the determination, most residential customers’ water and sewerage bills will decrease slightly in real terms over the determination period, and increase modestly in nominal terms. For example, the bill for a household with an individual water meter and water usage of 200kL per year13 will decrease in real terms by 2.6% (or $29) over the 4-year period, or by an average of 0.7% per year. When inflation is included in prices, this bill will increase by 6.5% (or $72) over 4 years, or by an average of 1.6% per year.14 This means that water and sewerage bills will increase at a slower rate than other household items, and typically income.
However, households with a shared water meter (such as many of those with a unit in a multi-dwelling property) will experience different changes to their bill, due to our decision to set a standard water service charge of $94.88 ($2011/12) for all residential customers by 2015/16 (see section 1.1.2 above). The impact of this decision will depend on the customer’s current water service charge, which varies from property to property. For example, the bill for a household with a current water service charge of $70 (the average for customers in units with a shared meter) and water usage of 135kL per year15 will increase in real terms by 5.1% (or $45.80) over the determination period, or an average of 1.3% per year. However, this increase will be offset by the reduction in the stormwater drainage charge for those customers who receive this service.
12 As a result of the Sydney Desalination Plant operating assumptions. 13 This is the average water usage for residential customers in houses. 14 Assuming forecast change in the CPI of 2.5% from 2013/14 onwards, in line with the midpoint
of the Reserve Bank of Australia’s inflation target range. 15 Based on our household survey 135 kL is the median consumption for residential customers in
flats and units.

1 Executive summary
10 IPART Review of prices for Sydney Water Corporation’s water, sewerage, stormwater drainage and other services
Table 1.5 shows the indicative impact of the determination on residential water and sewerage bills for customers with individual meters and various levels of water usage (with and without inflation).
Table 1.5 Impact of determination on annual water and sewerage bills for residential customers with individual meters
Water usage pa
Current (2011/12)
2012/13 2013/14 2014/15 2015/16 Total change
Without inflation
100 kL 895 889 882 874 866 -29
change -0.6% -0.8% -0.9% -0.9% -3.2%
200 kL 1,105 1,099 1,092 1,084 1,076 -29
change -0.5% -0.7% -0.7% -0.7% -2.6%
300 kL 1,315 1,309 1,302 1,294 1,286 -29
Change -0.4% -0.6% -0.6% -0.6% -2.2%
With inflation
100 kL 895 904 918 933 947 53
Change 1.0% 1.6% 1.6% 1.6% 5.9%
200 kL 1,105 1,117 1,137 1,157 1,177 72
Change 1.1% 1.8% 1.7% 1.7% 6.5%
300 kL 1,315 1,330 1,356 1,381 1,407 92
Change 1.1% 1.9% 1.9% 1.9% 7.0%
Note: Totals may vary due to rounding.
Households that include pensioners will be largely unaffected by our determination, regardless of their property type.16 Their water and sewerage bills will stay fairly constant, increasing by $3 in real terms over the determination period.
Households that receive stormwater drainage services from Sydney Water will experience other changes to their bills, due to our decision to transition to area-based charges for these services (see section 1.1.2):
For households in units, these charges will decrease over the determination period, moving from $49 in 2012/13 to $29 in 2015/16 (in real terms). On average, this will offset almost half of the increase in their water and sewerage bills due to our decision to introduce a standard water service charge for residential customers (discussed above). As a result, the combined water, sewerage and stormwater drainage bill for a typical household in a unit should increase only slightly over the determination period in real terms.
16 See chapter 10 for an explanation of the concessions for pensioners.

1 Executive summary
Review of prices for Sydney Water Corporation’s water, sewerage, stormwater drainage and other servicesIPART 11
For households in houses, these charges will increase over the determination period, moving from $49 in 2012/13 to $79 in 2015/16 (in real terms). To mitigate the impact on these households, we decided to transition to the new stormwater drainage charges over this determination period.
1.3 Impact on non-residential customers
Non-residential customers with individual, 20mm meters – who make up nearly half of Sydney Water’s non-residential sewerage customers – will experience a reduction in their total water and sewerage bills.17 This is largely due to decreases in the water service and sewerage usage charges applicable to these customers.
However, those with individual, 25mm or larger meters will face higher bills. This is due to our decision to restructure sewerage service charges, which resulted in increases in these charges per property (see section 1.1.2). The customers most affected are those with relatively low sewage discharge volumes.18 For those with large sewage volumes, the impact of higher sewerage service charges is offset by lower usage charges, so their bill increases are lower in percentage terms.
Table 1.6 shows the indicative impact of the determination on non-residential water and sewerage bills for customers with individual meters, various levels of water usage and average sewerage discharge volumes (in real terms).
Table 1.6 Impact of determination on annual water and sewerage bills for non-residential customers with individual meters ($2011/12)
Water usage pa
Meter size
Current(2011/12)
2012/13 2013/14 2014/15 20/1516 Total change
260 kL 20mm 1,231 1,225 1,218 1,210 1,202 -29
%increase -0.5% -0.6% -0.7% -0.7% -2.4%
350 kL 25mm 1,628 1,720 1,830 1,959 2,108 479
%increase 5.6% 6.4% 7.0% 7.6% 29.4%
1,000 kL 40mm 4,820 5,090 5,391 5,729 6,107 1,287
%increase 5.6% 5.9% 6.3% 6.6% 26.7%
10,000 kL 100mm 46,354 47,028 47,886 49,075 50,605 4,251
%increase 1.5% 1.8% 2.5% 3.1% 9.2%
Note: Totals may vary due to rounding.
Note: Average sewage discharge factors used.
17 We have assumed water usage of 260 kL per year, which is the average water consumption by
this customer group as reported by Sydney Water. 18 Customers may elect to move from a larger meter size to a 20mm meter if an assessment of their
requirements confirms that a 20mm meter is adequate. Customers requesting to move from a larger meter to a 20mm meter will pay a charge to move to a smaller meter.

1 Executive summary
12 IPART Review of prices for Sydney Water Corporation’s water, sewerage, stormwater drainage and other services
Non-residential customers with a shared meter will experience varied impacts on their bills, depending on whether or not they are in a strata property, the number of customers that share the property’s meter, and their sewage volumes. Most customers in strata properties will see decreases in their bills, due to our decision to remove the minimum sewerage service charge currently applicable to them (see section 1.1.2). For example, a typical19 non-residential strata premises will see its bill decrease by around $4,000 ($2011/12) or 40%. Strata properties likely to experience increases are larger users, whose current sewerage service charge exceeds the minimum charge, due to the decrease in the sewerage discharge allowance for strata properties.
Table 1.7 shows the indicative impact of the determination on non-residential water and sewerage bills for customers with shared meters, various levels of water usage and average sewerage discharge volumes (in real terms).
Table 1.7 Indicative annual water and sewerage charges for strata units sharing a meter ($2011/12)
Water use (kL pa)
Meter size
Equal strata connections
2011/ 12
2012/ 13
2013/ 14
2014/ 15
2015/ 16
Change 2011/12 to 15/16
75 kL pa per unit
25mm 3 773 486 523 566 615 -158
% increase -37% 8% 8% 9% -20%
350 kL pa per unit
25mm 3 1,351 1,238 1,279 1,323 1,370 20
% increase -8% 3% 3% 4% 1%
75 kL pa per unit
25mm 8 726 285 306 328 351 -375
% increase -61% 7% 7% 7% -52%
350 kL pa per unit
40mm 8 1,348 1,354 1,368 1,388 1,415 67
% increase 0% 1% 2% 2% 5%
75 kL pa per unit
40mm14 739 375 396 420 447 -292
% increase -49% 6% 6% 6% -40%
Note: Non-residential customers on shared maters will not actually receive a bill from Sydney Water for the amounts shown above. They will receive an invoice from Sydney Water directly for their water and sewerage service charges, but will be paying for their water usage charge via their strata levies.
We have applied an average discharge factor of 79%, calculated from information submitted by Sydney Water in early November 2011 in response to requests from IPART. We have also distributed the free threshold allowance for sewerage evenly between strata units.
Note: Totals may vary due to rounding.
Source: IPART analysis.
19 Sydney Water email 22 May 2012. Typical property is 14 units connected to a 40mm meter and
water consumption of around 1,050kL per year.

1 Executive summary
Review of prices for Sydney Water Corporation’s water, sewerage, stormwater drainage and other servicesIPART 13
Non-residential customers who receive stormwater drainage services from Sydney Water will also experience varied impacts, depending on the size of their property. Those whose property area is 1,000m2 or less – who make up the majority of these customers – will pay lower stormwater drainage charges over the determination period. In 2015/16, they will pay up to $99 less than in 2012.
Those whose property area is 10,001m2 or more – who number around 500 – will pay increasingly higher stormwater drainage charges over the period. We recognise that these price increases are large, and may have a significant impact on some customers. However, after considering the submissions received from stakeholders in response to our draft report, we have replaced the variable charge applicable to the very largest properties (those with property areas greater than 45,000m2) with a capped fixed charge.
1.4 Impact of Sydney Desalination Plant on customers
As section 1.1.1 above discussed, in making the determination we assumed that SDP will be in water security mode over the full 4-year determination period. If this is not the case, and Sydney Water is required to purchase drinking water from the SDP in any year of this period, we have provided for Sydney Water to pass through the associated costs to customers by adjusting prices in the following year.
The size of these costs and their impact on customers will depend on SDP’s actual operating schedule. However, as an indication, if SDP operates at 100% capacity for any full year it will cost Sydney Water an additional $50 million to $65 million ($2011/12).20 For residential customers and most non-residential customers (those with a 20mm individual meter), this will add an additional $25 to $31 ($2011/12) to their annual water and sewerage bill in the following year. For other non-residential customers, it will add varied amounts to their annual bill, depending on their meter size and whether that meter is shared with other customers. However, those with an individual 25mm meter will pay an additional $44 to $61 ($2011/12) each year and those with larger meters will pay proportionately higher amounts.21
Table 1.8 shows the likely impact on residential water and sewerage bills if SDP is required to operate at full capacity for the full 4 years.
20 The actual amount varies from approximately $50 million ($2011/12) in the first year to
approximately $65 million ($2011/12) in 2015/16. 21 If SDP has to restart and/or shut down over the period, Sydney Water will incur large one-off
charges of up to $5.5 million. If this occurs, this will also add to customer bills.

1 Executive summary
14 IPART Review of prices for Sydney Water Corporation’s water, sewerage, stormwater drainage and other services
Table 1.8 Impact of determination on annual water and sewerage bills for residential customers with individual meters if SDP operates at full capacity ($2011/12) – SDP operating at full capacity
Water usage pa
Current (2011/12)
2012/13 2013/14 2014/15 2015/16 Total change SDP on
100 kL 895 889 907 902 896 1
change -0.6% 2.0% -0.5% -0.7% 0.1%
200 kL 1,105 1,099 1,117 1,112 1,106 1
change -0.5% 1.6% -0.4% -0.5% 0.1%
300 kL 1,315 1,309 1,327 1,322 1,316 1
change -0.4% 1.3% -0.3% -0.5% 0.1%
Note: Totals may vary due to rounding.
Note: The 2012/13 bills are the same for whether SDP is operating or not because the cost pass-through is implemented in the year following the year of operation. If SDP is operating in 2015/16 this will be accounted for in the first year of the next determination.
1.5 Impact on Sydney Water
Under our determination, Sydney Water is expected to generate a total of $9,150.4 million ($2011/12) in revenue over the 4-year determination period. We consider this is sufficient to recover its efficient costs and earn a reasonable rate of return on its assets over this period. This is approximately $145 million more than the target revenue for the draft determination, and approximately $1,176 million (or 11%) less than Sydney Water’s proposed revenue requirement.
In its submission, Sydney Water indicated that its revenue requirement will increase over the determination period, due to forecast increases in the costs of maintaining and renewing its assets, servicing urban growth, implementing the Priority Sewerage Program, and other factors including the carbon price. However, based on our views of the efficiency and prudence of its past and forecast expenditures and the market cost of capital, we found that its revenue requirement should remain fairly stable (within 1% to 2%) over determination period.
Table 1.9 compares our final decision on the notional revenue requirement with our draft decision and Sydney Water’s proposal.

1 Executive summary
Review of prices for Sydney Water Corporation’s water, sewerage, stormwater drainage and other servicesIPART 15
Table 1.9 Notional revenue requirement ($million, 2011/12)
2012/13 2013/14 2014/15 2015/16
Sydney Water’s proposal
Return on assets 955.5 995.5 1,034.9 1,069.4
Return of assets (depreciation) 211.1 226.4 241.4 255.1
Operating expenditurea 1,361.7 1,372.1 1,374.3 1,374.3
Total notional revenue requirement 2,528.3 2,594.0 2,650.7 2,698.8
IPART’s draft decision
Return on assetsb 721.9 751.5 781.6 804.0
Return of assets (depreciation) 207.1 219.8 232.0 242.6
Operating expenditure 1,268.5 1,265.8 1,259.6 1,252.5
Total notional revenue requirement 2,197.5 2,237.1 2,273.2 2,299.0
IPART’s final decision
Return on assetsb 761.7 791.8 822.4 844.9
Return of assets (depreciation) 213.1 226.6 239.4 250.3
Operating expenditure 1,283.5 1,276.2 1,270.6 1,263.4
Total notional revenue requirement 2,258.3 2,294.6 2,332.4 2,358.5a Includes costs of bulk water and desalinated water, and an allowance for a return on working capital. b Includes an allowance for a return on working capital and an allowance for tax obligations.
Note: Totals may not add due to rounding.
Note: Figures differ slightly from those presented in Sydney Water’s submission because IPART includes income from some activities that Sydney Water has excluded from its calculation of notional revenue requirement.
Source: Sydney Water submission to IPART’s Review of prices for Sydney Water Corporation’s water, sewerage, stormwater drainage and other services, 16 September 2011, p109.
We consider that our determination will allow Sydney Water to deliver its services to the required standard and earn a real post-tax rate of return of at least 5.6%. Our modelling shows that the determination will allow Sydney Water to maintain its financial viability, and pay a 70% dividend, and pay a proportion of its capital expenditure in cash in each year of the determination period, assuming that it operates at efficient costs.
1.5.1 Service standards
Our decision on Sydney Water’s revenue requirement assumes that it will maintain its current services levels, and not reduce these levels to achieve cost reductions and efficiency savings. We consider that our prices will continue to allow Sydney Water to meet the service standards required by its operating licence while reducing the potential for price increases to fund over-performance.

1 Executive summary
16 IPART Review of prices for Sydney Water Corporation’s water, sewerage, stormwater drainage and other services
1.5.2 Rate of return
As section 1.1.1 discussed, in determining the revenue requirement we used a real post-tax WACC to calculate the allowances for a return on assets and depreciation, and calculated a separate allowance for tax liability. Our recent research22 indicates that this approach leads to a more accurate estimate of a water utility’s tax liability than using a real pre-tax WACC (as we have in previous determinations). We estimate that the move to a post-tax WACC and separate tax allowance has reduced Sydney Water’s notional revenue requirement by around $95 million per annum (or 4%).23
In determining the appropriate level for Sydney Water’s post-tax WACC, we estimated that the feasible range for this level is 4.0% to 5.6%, with a midpoint of 4.6%. We decided that a WACC of 5.6% – the top of this range – is appropriate, largely due to the current market uncertainties with reference to the longer term averages for market parameters.
We consider that our pricing decisions will allow Sydney Water to achieve at least the total notional revenue requirement in each year of the determination period, and thus earn a real post-tax rate of return of 5.6% on its Regulatory Asset Base (RAB) in each year.24
1.5.3 Efficiency savings
In reaching our decision on Sydney Water’s notional revenue requirement, we allowed for lower levels of operating and capital expenditure than it proposed, in line with our view that there are opportunities for it to improve the efficiency of its forecast expenditure programs. This view reflects the findings and recommendations of our consultants, WS Atkins International Ltd and Cardno (Atkins Cardno), who conducted a rigorous review of Sydney Water’s forecast expenditures.25
We allowed for $32.8 million (or around 0.9%) less operating expenditure than Sydney Water proposed over the determination period, to reflect opportunities for making efficiency savings through innovation and technological development, and the catch up efficiency required for Sydney Water to achieve the performance of a Frontier Company over time. However, our final decision on forecast operating expenditure is higher than our draft decision, as it includes the higher filtration expenses Sydney Water incurs when purchasing water from Sydney Catchment Authority rather than the Sydney Desalination Plant.
22 IPART, The incorporation of company tax in price determinations, June 2011. 23 Our calculation of Sydney Water’s allowance for tax liability is set out in Appendix D. 24 If it delivers its services at efficient costs and delivers its capital expenditure program. 25 WS Atkins International and Cardno, Detailed review of Sydney Water’s operating and capital
expenditure, Final Report November 2011.

1 Executive summary
Review of prices for Sydney Water Corporation’s water, sewerage, stormwater drainage and other servicesIPART 17
We allowed for $468 million (or 15.6%) less capital expenditure than Sydney Water proposed. This decision reflects a rephasing of capital programs to beyond the end of the determination period, as well as a slight change in the growth assumptions and the introduction of stretch efficiency targets for Sydney Water, in line with Atkins Cardno’s recommendations. Our final decision on capital expenditure is $16.1 million higher than our draft decision, as we allowed for higher capital expenditure on stormwater assets (as discussed further below).
We also incorporated $65 million less past capital expenditure into Sydney Water’s RAB than it proposed. This reflects our findings that Sydney Water did not consider all the potential options for Priority Sewerage Program projects, some of its expenditure on IT and meter replacement was imprudent, and its property-related expenditure was higher than necessary. We also adjusted Sydney Water’s proposal to reflect the timing of payments made through Developer Commercial Agreements.
Prior to the release of our draft report, Sydney Water wrote to us contesting a number of findings in Atkins Cardno’s report. It argued that at least $285 million of the identified efficiency savings be reinstated and expressed concerns about future service quality. Atkins Cardno provided a response, which can be found on our website. In summary, it put the view that:
Sydney Water’s proposal to increase spending on renewing existing water mains is overly ambitious. It considers it more realistic to increase this spending steadily each year, rather than step it up as Sydney Water proposed. Atkins Cardno reiterated that its recommended expenditure on these programs is still significantly higher than Sydney Water’s actual expenditure since 2008.
Sydney Water’s proposed expenditures for system reliability works and wet weather overflow abatement were not fully developed.
Some of Sydney Water’s proposed expenditure on providing infrastructure for growth could be deferred due to the uncertainty of future growth rates.
Sydney Water could achieve capital efficiency savings of $143 million over the determination period.
Some of Sydney Water’s proposed spending on IT and water meters was not adequately justified.
We considered the arguments put forward by Sydney Water and Atkins Cardno and, for our draft report, decided to adopt the forward capital expenditure program proposed by Atkins Cardno, subject to 2 arithmetical corrections confirmed by Atkins Cardno.

1 Executive summary
18 IPART Review of prices for Sydney Water Corporation’s water, sewerage, stormwater drainage and other services
Since the release of our draft report, Sydney Water has made a number of further representations with respect to the capital efficiency savings. We have reconsidered its arguments and have maintained our draft decisions with respect to water and sewerage capital expenditure. However, we decided to reinstate Sydney Water’s capital expenditure for stormwater assets. This decision was based on a commitment by Sydney Water to improve the condition of stormwater assets. We note that Sydney Water has proposed and we have allowed for higher stormwater capital expenditure under previous determinations, but it has not delivered its proposed program. In order to monitor this, we have included an output measure to be considered at the next price review.
We note that Atkins Cardno found little evidence of Sydney Water having either a long-term investment plan or a long-term business plan in place. We are concerned by this and the implications for Sydney Water’s asset management and efficient expenditure. We expect Sydney Water to have developed these long-term plans over the 2012 determination period.
1.5.4 Financial viability
We assessed the impact of our final determination we considered Sydney Water’s likely financeability in each year of the determination period using its forecast cash flows under this determination and its actual gearing ratio to compute the following financial ratios:
funds from operations interest cover
funds from operations/total debt
debt gearing.
For this modelling, we applied a 70% dividend payout ratio rather than the fixed dividend assumptions contained in Sydney Water’s submission. We consider that this approach reflects NSW Treasury’s standard reference point of a dividend payout ratio of 70% of post-tax profit for Government businesses.26
However, we note that our decisions on the inputs to the revenue calculations, such as the rate of return on assets, are based on market conditions and are independent of the revenue requirements generated by dividend agreements.
In addition, we considered the financial ratios and dividend payments of other comparable organisations to ensure that the outcomes for Sydney Water were consistent with industry standards.
26 NSW TC 09/11, Treasury Circular – Distribution Policy.

1 Executive summary
Review of prices for Sydney Water Corporation’s water, sewerage, stormwater drainage and other servicesIPART 19
Overall, our financial modelling indicates that Sydney Water’s financial ratios will continue to be sound under the final determination and are improved over the draft determination. We also considered the forecast cash flows and are confident that revenues under our determination are sufficient for Sydney Water to pay a 70% dividend and a proportion of capital expenditure, consistent with a benchmark company. Our conclusions partly depend on whether Sydney Water delivers its services at efficient costs and on demand forecasts. The outcomes of our financial modelling are included in Chapter 11.
1.6 Structure of this report
The following chapters explain our review and determination in detail, including our key decisions and the analysis that guided these decisions:
Chapter 2 outlines the scope and context for the review, including our review process, Sydney Water’s operating and regulatory environment, and Sydney Water’s submission and proposed prices
Chapter 3 outlines our price setting approach and decisions related to the regulatory framework
Chapter 4 explains the ‘building block’ approach we used to establish Sydney Water’s notional revenue requirement, and provides an overview of our decisions on this revenue requirement and its individual components
Chapters 5 and 6 discuss our decisions on these individual components in more detail:
– Chapter 5 explains the decisions on Sydney Water’s efficient operating expenditure
– Chapter 6 explains the decisions on the allowances for a return on assets and regulatory depreciation
Chapter 7 discusses our decisions on Sydney Water’s forecast water sales
Chapters 8 and 9 explain the decisions on Sydney Water’s price structure and set out the price levels
Chapter 10 assesses the implications of our pricing decisions on customers
Chapter 11 assesses the implications of our pricing decisions on Sydney Water, general inflation and the environment.

2 Context for this review
20 IPART Review of prices for Sydney Water Corporation’s water, sewerage, stormwater drainage and other services
2 Context for this review
The purpose of this review is to determine the maximum prices Sydney Water can charge for the water, sewerage and stormwater drainage services it provides to residential and non-residential customers in the Sydney, Illawarra and Blue Mountains areas. It is also to determine maximum prices for some recycled water services, trade waste services and the range of miscellaneous services Sydney Water provides.
The review is being conducted in an environment that is significantly different from the one in which we undertook the previous 2 determinations for Sydney Water. Those determinations were made in a time of severe drought in the Sydney area which saw dam levels falling and water restrictions introduced. With the passing of the drought and the commissioning of the SDP, dam levels are currently at, or close to 100%, and water restrictions have been replaced with less stringent Water Wise Rules. The changed environment has some important implications for Sydney Water’s costs, sales, pricing, and financial position. These implications are discussed in the relevant chapters throughout this report.
The sections below outline some other contextual issues that have influenced our review, including other recent reviews that have affected our decisions and inputs, our review process, the matters we are required to consider in making our determination, and Sydney Water’s pricing submissions to the review. Appendix A provides some background information on Sydney Water’s operating and regulatory environment.

2 Context for this review
Review of prices for Sydney Water Corporation’s water, sewerage, stormwater drainage and other servicesIPART 21
2.1 Other reviews that have affected our decisions and inputs
We have recently completed or are concurrently conducting 3 reviews that affect the inputs of our calculations of Sydney Water’s costs and prices. These are:
the review of prices to be charged by the Sydney Catchment Authority27 (SCA) for its bulk water services
the review of prices to be charged by SDP Pty Limited28 for its bulk water services
the review of price structures for metropolitan water utilities.29
Sydney Water purchases most of the bulk water it needs to supply its customers from SCA. For this determination, we have calculated Sydney Water’s bulk water costs on the basis of our determination of SCA’s prices.30
The SDP was built to increase the security of Sydney’s water supply in times of low rainfall, rather than to operate continuously. Under contractual arrangements, it is obliged to operate when Sydney’s dam storage levels fall below 70% of their capacity and continue to operate until they return to 80%. Sydney Water is obliged to purchase the water produced by SDP during such times.
The prices in our determination are set on the basis of SDP being in water security shutdown mode throughout the determination period. If it operates in a different mode and produces water, we have provided that Sydney Water can pass through to customers in the following year the additional costs it incurs. These costs will be calculated on the basis of our 2011 determination on SDP’s prices.
In addition to these reviews, we recently completed a review of price structures for the metropolitan water utilities we regulate. We have decided to restructure Sydney Water’s prices to remove cross-subsidies and improve cost reflectivity for all customer groups. These findings are discussed briefly in Chapter 8. However, for detailed information on the principles, please see the final report on this review on our website.31
27 This review is being conducted concurrently with our Sydney Water review, see IPART, Review
of Sydney Catchment Authority’s Operating Licence and Prices from 1 July 2012. 28 This review was completed in November 2011, see IPART, Review of water prices for Sydney
Desalination Plant Pty Limited from 1 July 2012, November 2011. 29 This review was completed in March 2012, see IPART, Review of price structures for metropolitan
water utilities, March 2012. 30 IPART, Review of prices for Sydney Catchment Authority - Final Report, June 2012. 31 IPART, Review of price structures for Metropolitan Water Utilities, March 2012.

2 Context for this review
22 IPART Review of prices for Sydney Water Corporation’s water, sewerage, stormwater drainage and other services
2.2 IPART’s review process
As part of our review process, we have undertaken an extensive investigation and public consultation process. We have:
released an Issues Paper in June 2011 to assist in identifying and understanding the key issues for review
invited Sydney Water to make a submission to the review detailing its pricing proposal, and requiring it to provide extensive financial and performance data on the future capital and operating expenditure necessary to maintain service levels and respond to regulatory demands32
invited other interested parties to make submissions on the Issues Paper and Sydney Water’s submission33
held a public hearing on 22 November 2011 to discuss a wide range of issues raised by Sydney Water and other stakeholders
engaged an independent consultant, W.S. Atkins International Ltd in association with Cardno (Atkins Cardno), to review Sydney Water’s capital expenditure, asset planning and operating expenditure proposals34
engaged an independent consultant, Deloitte Touche Tohmatsu Ltd (Deloitte), to review Sydney Water’s proposals for Trade Waste charges35
conducted public workshops to consider the method for forecasting water sales and Trade Waste charges
released a draft report and draft determination and invited stakeholders to make submissions in response to the drafts.
IPART’s Issues Paper, stakeholder submissions, the transcript from the public hearing, information on the public workshops and Atkins Cardno’s report and Deloitte’s report are available on our website (www.ipart.nsw.gov.au).
In making our final determination for Sydney Water, we have considered the matters raised in submissions in response to the issues paper and the draft report and determination. The new charges are expected to apply from 1 July 2012.
32 Sydney Water’s submission was received on 16 September, 2011. 33 A total of 25 written submissions were received from other interested parties. 34 Atkins Cardno’s final report was received in November 2011. 35 Deloitte’s final report was received on 16 December 2011.

2 Context for this review
Review of prices for Sydney Water Corporation’s water, sewerage, stormwater drainage and other servicesIPART 23
2.3 Matters we are required to consider
Our power to determine prices is derived from our governing Act, the Independent Pricing and Regulatory Tribunal Act 1992 (IPART Act). This review is being conducted under Section 11 of the IPART Act. Section 11 provides IPART with a standing reference to conduct investigations and make reports to the Minister on the determination of the pricing for a government monopoly service supplied by a government agency.36
Section 15 of this Act requires IPART to consider a broad range of matters when making determinations.37 These matters include:
consumer protection – the protection of consumers from abuses of monopoly power; the quality, reliability and safety standards of the services concerned; and the social impact of pricing decisions and their effect on inflation
economic efficiency – the need for greater efficiency in the use and supply of services; the need to promote competition; and the need to consider demand management and least-cost planning
financial viability – the cost of providing the services concerned, the appropriate rate of return on public sector assets; and the impact of pricing decisions on the agency’s borrowing, capital and dividend requirements
environmental protection – the need to promote ecologically sustainable development through appropriate pricing policies.
In considering these matters, we aim to balance the diverse needs and interests of stakeholders (including customers), while also ensuring that Sydney Water is adequately recompensed for the services it provides. We also take into account the principles issued by the Council of Australian Governments (COAG) and contained in the National Water Initiative.38
With these requirements in mind, we have developed a general approach to determining monopoly prices for water agencies. That approach is set out in Figure 2.1 below. We have followed this approach in our review of Sydney Water’s prices.
36 The government agency must be specified in Schedule 1 of the IPART Act. Sydney Water is
listed as a government agency for the purposes of Schedule 1 of the IPART Act. 37 The Section 15 requirements are listed in full in Appendix A. 38 The National Water Initiative has built on the principles established in the 1994 COAG Water
Reform Framework.

2 Context for this review
24 IPART Review of prices for Sydney Water Corporation’s water, sewerage, stormwater drainage and other services
Figure 2.1 IPART’s determination process
Obligations for service provision
Regulatory framework
What is the most appropriate approach to regulating the revenue and prices of agencies in this industry?
Given accuracy of forecasts and current industry dynamics, over what period should prices be set?
Revenue requirements
What are the efficient costs of providing these services?
How much will costs differ with variations in the levels of service provided?
What is an appropriate rate of return on the investment in the agency?
Will the agency have adequate access to capital to fund works that meet required standards and maintain services in the long term?
Price structure
How should the costs of delivering services be spread amongst customer groups?
How prices should be structured to encourage consumer and agency responses that best achieve sustainability objectives?
What are the likely impacts of prices on the affordability of services for different groups of consumers?
What are the potential environmental impacts?
What does the proposed outcome imply for the ongoing viability of the agency and its credit ratings?
What are the likely impacts on competition?
Determining a regulatory balance
What are the services that water agencies are required to deliver to customers and to what standard?
What are consumers' expectations about the level of service to be provided?
What are the broader environmental and operational constraints within which water agencies must operate and what impacts do these have on their capacity to deliver services?

2 Context for this review
Review of prices for Sydney Water Corporation’s water, sewerage, stormwater drainage and other servicesIPART 25
2.4 Overview of Sydney Water’s submissions
Sydney Water provided its initial pricing submission to this review on 16 September 2011. Its submission proposes a real increase in prices of around 15% over the period from 1 July 2012 to 30 June 2016. For a typical residential household consuming 200 kL of water a year, this represents a $166 increase ($2011/12) in their water and sewerage bill over the period (Table 2.1).
Table 2.1 Annual water and sewerage bill for a residential customer consuming 200 kL per year under Sydney Water’s proposal ($2011/12)
2011/12 2012/13 2013/14 2014/15 2015/16 Total
Annual Bill ($) 1,105 1,208 1,231 1,252 1,271
Annual Increase ($) - 103 23 21 19 166
Annual Increase (%) - 9.3% 1.9% 1.7% 1.5% 15.0%
Note: Excludes stormwater charges.
Source: Sydney Water submission to IPART’s Review of prices for Sydney Water Corporation’s water, sewerage, stormwater and other services, September 2011, p 125.
Sydney Water’s submission identifies a range of cost pressures contributing to the proposed increase including:
increased capital expenditure on renewing existing assets
capital expenditure on servicing growth areas which is currently not recovered from developer charges39
reduced water demand40
the impact of growth on the Regulatory Asset Base (RAB) over recent determinations.
Sydney Water considers that the consequence of IPART not granting the proposed increase will be a significant reduction in Sydney Water’s financial viability:
Failure to achieve full cost recovery will put Sydney Water under financial stress and make its financial position unsustainable.41
39 Revenue from developer charges was used to fund the capital cost of providing services to new
developments in Sydney Water’s operating area. On 17 December 2008, the NSW Government decided to set developer charges in the Sydney Water area at zero.
40 The level of prices is influenced by the forecast demand for water ie, the higher the demand the lower the prices needed to recover the costs (particularly the fixed costs) and vice-versa.
41 Sydney Water submission to IPART’s Review of prices for Sydney Water Corporation’s water, sewerage, stormwater and other services, September 2011, p 25.

2 Context for this review
26 IPART Review of prices for Sydney Water Corporation’s water, sewerage, stormwater drainage and other services
2.4.1 Sydney Water’s proposed annual revenue requirement
Sydney Water’s submission sets out its proposed annual revenue requirements over the 4 years to 2015/16 (Table 2.2).
Table 2.2 Sydney Water’s proposed annual revenue requirement ($million, 2011/12)
2011/12a 2012/13 2013/14 2014/15 2015/16
Return on assetsb 955.5 995.5 1,034.9 1,069.4
Return of assets (depreciation) 211.1 226.4 241.4 255.1
Operating costsc 1,361.7 1,372.1 1,374.3 1,374.3
Adjustments -36.0 -36.5 -37.9 -37.0
Total Annual Revenue Requirement 2,451 2,492.3 2557.5 2,612.7 2,661.9 a This is an estimate for the period 1 July 2011 to 30 June 2012. b Includes return on working capital. c Includes bulk water purchase costs.
Note: Totals may vary due to rounding.
Source: Sydney Water submission to IPART’s Review of prices for Sydney Water Corporation’s water, sewerage, stormwater and other services, September 2011, p 109.
Sydney Water argues its revenue requirements for price setting purposes need to increase in each of these years, partly because in the period since 2005/06, its actual revenue has failed to achieve the levels forecast in IPART’s determinations. In its submission Sydney Water estimated that, in nominal terms, its total revenue over this period will be $920 million short of that forecast. Table 2.3 compares the revenue forecast in IPART’s past determinations to Sydney Water’s actual revenue since 2005/06.
Table 2.3 Sydney Water forecast revenue versus actual revenue ($million, nominal)
Revenue 2005/06 2006/07 2007/08 2008/09 2009/10 2010/11 2011/12 Total
Forecast in IPART’s determinations
1,548 1,630 1,704 1,903 2,204 2,332 2,451 13,773
Actual 1,417 1,503 1,528 1,831 2,080 2,202 2,292 12,852
Difference -131 -127 -176 -73 -124 -131 -160 -920
Note: Totals may vary due to rounding.
Source: : Sydney Water submission to IPART’s Review of prices for Sydney Water Corporation’s water, sewerage, stormwater and other services, September 2011, p 27.
In addition to receiving revenue levels less than forecast, Sydney Water argues that it has forgone a further $238 million in contributions toward capital expenditure because of the decision of the previous NSW government to set some developer charges to zero in December 2008.

2 Context for this review
Review of prices for Sydney Water Corporation’s water, sewerage, stormwater drainage and other servicesIPART 27
2.4.2 Sydney Water’s estimates for water demand
Sydney Water explains that another reason for it not achieving forecast levels of revenue in the past was the lower than forecast sales of water. Over the current determination period, water consumption was below that forecast in the 2008 determination as a result of water restrictions continuing for longer than expected and forecast changes in customer consumption patterns not eventuating. In total, in the 4 years to June 2012, Sydney Water forecasts that the cumulative volumetric difference in water sales between the 2008 determination estimates and the actual demand will be 182 gigalitres (GL).
2.4.3 Other proposals
Other proposals put forward in Sydney Water’s submission include:
Using a pass-through mechanism to take account of the uncertainty about whether and for how long the Sydney Desalination Plant will operate over the 2012 determination period. In its forecasts for the volume of bulk water it will need to purchase, Sydney Water has set its proposed prices on the basis that the desalination plant will operate at 100% capacity at all times during the determination period, and that Sydney Water will take all of the output. This adds around $64 million a year to its forecast operating costs (or $33 a year per customer) in comparison to assuming that the plant will be in shutdown mode. Sydney Water also proposes that if the plant does shutdown at any time during the determination period, any cost savings will be passed through to consumers at the end of each financial year. Sydney Water suggests that this pass-through would be calculated and applied to prices at the beginning of each financial year from 1 July, 2013. This issue is discussed in section 5.5.
Restructuring some liquid trade waste charges. This proposal is discussed in section 9.7.
Reducing the number of miscellaneous charges it levies, and reducing the charge for a number of those services. Sydney Water has completed a comprehensive review of its miscellaneous charges, which has resulted in a reduction in the number of charges, number of transactions, and revenue generated from miscellaneous service charges. These proposals are discussed in section 9.8.
Allocating the costs associated with the Rouse Hill River Management function to all sewerage customers. This proposal is discussed in section 9.5.

2 Context for this review
28 IPART Review of prices for Sydney Water Corporation’s water, sewerage, stormwater drainage and other services
Addressing issues from the last pricing review. Following the 2008 determination, we identified a number of issues requiring further analysis. In the lead-up to this review, IPART and Sydney Water have conducted a program of quarterly meetings to discuss the results of this analysis, particularly the analysis of price structures. Sydney Water’s submission includes a range of proposals for addressing the issues and responding to the analysis,42 including:
– Levying the standard residential water service charge on each unit in multi-residential dwellings. Most of these units currently pay a proportion of the building’s water service charge.
– Levying the standard residential water service charge on each unit in non-residential strata properties.
Regulating recycled water prices for Rouse Hill development area and including $21.6 million in avoided costs arising from the Rouse Hill recycled water scheme.
2.4.4 Sydney Water’s submission on the draft report and determination
Sydney Water provided a submission on our draft report and determination on 13 April 2012. The submission explains Sydney Water’s concern regarding its financial position and financeability. Sydney Water argues that the WACC has been set too low in the draft determination and that our draft prices may put its long term financial viability at risk. These issues are discussed in sections 6.5 and 11.2.
While Sydney Water broadly accepts the operating and capital expenditures included in the draft determination, it believes that:
The operating expenditure should be increased by $36.4m to reflect higher costs for the Build Own Operate water filtration plants, SDP shutdown costs, and lower than expected revenue from the Rosehill-Camellia recycled water scheme. These issues are discussed in Section 5.5.
The stormwater drainage capital expenditure should be increased from $9m to $33m to maintain the condition of these assets and ensure service standards are met. This issue is considered in Section 6.3.5.
In relation to tariff reforms, Sydney Water has accepted most of the proposed tariff structures in the draft determination but considers that implementation will be challenging. However, it has requested that:
The area based charges for stormwater drainage be either removed; or simplified and delayed by 12 months. This issue is discussed in section 9.4.
The Rouse Hill Land Charge for new customers in Rouse Hill be removed and the capital costs recovered from all Sydney Water’s sewerage customers. This issue is considered in section 9.5.
42 IPART completed a review of this issue in March 2012, see IPART, Review of price structures for
Metropolitan Water Utilities, March 2012. Sydney Water implemented many of the results of the review in its pricing submission.

3 IPART’s approach to setting prices
Review of prices for Sydney Water Corporation’s water, sewerage, stormwater drainage and other servicesIPART 29
3 IPART’s approach to setting prices
The approach a regulator uses to set prices can be defined as the rules and methodologies it uses to determine, monitor and change prices for regulated services over a determination period. For this review, we used the same broad approach we have used in past determinations to set prices for Sydney Water’s water, sewerage and stormwater drainage services. We have made a range of decisions related to applying this approach. The sections below provide an overview of our price setting approach and discuss these decisions in more detail, including our decisions on:
the length of the 2012 determination period
our approach for determining the notional revenue requirement
our approach for converting the notional revenue requirement into prices
how to address the risk of significant variation between Sydney Water’s forecast water sales and actual water sales over the 2012 determination period
how to address the uncertainty associated with the operation of Sydney Desalination Plant during the 2012 determination period and the impact on Sydney Water’s operating costs
what obligations to impose on Sydney Water to report on its progress against output measures.
Note that we used slightly different approaches to set trade waste, miscellaneous and recycled water charges. These are explained in Chapter 9 which discusses our decisions on these charges.
3.1 Overview of price setting approach
The first step of our price setting approach was to decide on the appropriate length of the 2012 determination period. Our decision is for a 4-year determination, ending 30 June 2016.
We then calculated Sydney Water’s notional revenue requirement in each year of this period. The notional revenue requirement represents IPART’s view of Sydney Water’s full, efficient costs in providing the regulated services during each year (or the amount it needs to generate through prices to recover those costs). To calculate the notional revenue requirement, we used the building block approach (see section 3.3) as we have done in previous determinations.

3 IPART’s approach to setting prices
30 IPART Review of prices for Sydney Water Corporation’s water, sewerage, stormwater drainage and other services
Once we had calculated Sydney Water’s notional revenue requirement, we decided on the approach we would use to convert this amount into prices. This involved deciding on the target revenue for each year – that is, the actual revenue we will expect Sydney Water to generate from prices and charges for that year. We considered a range of factors, including the implications of the notional revenue requirement on the level of prices and the rate and way in which they would change, and the impact of this on Sydney Water and customers.
We made a decision to smooth out the year-to-year variations in revenue requirement, so that Sydney Water’s prices and revenue will move steadily from their current levels to those required to recover the projected efficient costs in the last year of the determination period, given assumed sales volumes. This ‘glide path’ approach balances the impacts on customers and Sydney Water, and ensures that there is a smooth transition from the 2011/12 price levels.
Next, we made decisions on Sydney Water’s forecast customer numbers and water sales over the determination period, and the structure of its individual prices. We then applied these decisions to calculate the individual price levels required to yield the target revenue requirement for each year.
Finally, we made a decision to continue to monitor Sydney Water’s performance in delivering on its proposed capital programs over the determination period, and to require it to report on a range of activities, output measures and its major capital projects. In addition, as licence regulator, we will continue to conduct annual audits of Sydney Water’s compliance with its operating licence obligations, which include service performance obligations.
A full list of our decisions is shown at Appendix F.
3.2 Length of the determination period
Decision
1 IPART’s decision is to adopt a 4-year determination period from 1 July 2012 to 30 June 2016.
For each water pricing review, we make a decision on the length of the determination period taking into account the circumstances at that time. The main issue we consider is whether to adopt a long-term or a short-term price path. The advantages of a longer determination period include stronger incentives for Sydney Water to increase efficiency; greater stability and predictability (which may lower Sydney Water’s business risk and assist investment decision making); and reduced regulatory costs. However, there are also disadvantages which include increased risk associated with potential inaccuracies in the data used to make the determination; possible delays in customers benefitting from efficiency gains (because prices are not set to account for these gains until the next determination);

3 IPART’s approach to setting prices
Review of prices for Sydney Water Corporation’s water, sewerage, stormwater drainage and other servicesIPART 31
and the risk that changes in the industry will affect the appropriateness of the determination.
In resolving this question for this review, we particularly considered the following factors:
the confidence we could place in Sydney Water’s forecasts
the advantages of aligning the determination period for Sydney Water’s prices with the determination periods for Sydney Water’s bulk water suppliers (ie, Sydney Catchment Authority (SCA) and Sydney Desalination Plant (SDP))
the advantages of aligning the determination period for Sydney Water prices with the length of the review period for Sydney Water’s Operating Licence.
We also took into account the proposals made by Sydney Water and comments from stakeholders.
3.2.1 Sydney Water’s proposal
Sydney Water’s submission proposes that a 4-year determination period is appropriate. It comments that a 3-year timeframe would offer consistency with its Operating Licence, but would not provide long-term financial certainty for planning purposes. Regarding whether a 5-year term is appropriate, Sydney Water considers that the current regulatory system does not provide sufficient flexibility to cater for the changing operating environment for that length of time – in particular, to deal with any major issues that arise unexpectedly.
3.2.2 Stakeholder views
No stakeholder raised objections to Sydney Water’s proposal for a 4-year determination period. When the issue was raised at the public hearing, most stakeholders agreed that 4 years seemed reasonable. At the same time, no stakeholder displayed any strong preference for any particular determination period.
3.2.3 IPART’s analysis
To decide on the appropriate length for the determination period, we considered 3 main issues. The first is how much confidence we can place in Sydney Water’s forecasts. We note there is considerable uncertainty about the forecasts for water demand/consumption in the coming years, due to the changes in the environment since the 2008 determination (see Chapter 2). It may be appropriate to address this uncertainty by setting a shorter period, introducing an adjustment mechanism, or both.

3 IPART’s approach to setting prices
32 IPART Review of prices for Sydney Water Corporation’s water, sewerage, stormwater drainage and other services
The second issue we considered was the benefits of aligning Sydney Water’s determination period with those of its bulk water suppliers, SCA and SDP. These benefits may be considerable, given the significance of bulk water charges for Sydney Water’s operating costs. This is likely to be achievable, as we are conducting a price review for SCA concurrently with this review of Sydney Water. We made our first determination on SDP’s prices in 2011, and the terms of reference for this determination provided by the NSW Government required a 5-year determination period, from 30 July 2012 to 30 June 2017. Thus aligning Sydney Water’s determination period with SDP’s would also result in a 5-year period for Sydney Water.
Finally, we analysed the merits of aligning Sydney Water’s determination period with the Operating Licences of Sydney Water or SCA. We could set the determination period to end at the same time as Sydney Water’s current licence, 30 June 2015. This would result in a 3-year period for Sydney Water. Alternatively, we set the period to end at the same time as SCA’s next licence, 30 June 2017.43 This would result in a 5-year determination period for Sydney Water.
After considering these issues, we decided that on balance, a 4-year determination period is appropriate for Sydney Water at this time. The main benefit is that this will align Sydney Water’s determination period with SCA’s, and thus increase certainty about around half of Sydney Water’s bulk water costs. In addition, we consider:
the uncertainty in water demand forecasts can be addressed by adopting an adjustment mechanism for the next review
it is not appropriate to align the determination period with SDP’s, as we agree with Sydney Water’s view that a 5-year period does not provide sufficient flexibility to cater for the changing operating environment
it is not as appropriate to align the determination period with either Sydney Water’s or SCA’s operating licences terms because:
– a 3-year determination period would incur additional resource costs for both Sydney Water and IPART and reduce incentives for Sydney Water to pursue efficiencies
– a 5-year period does not provide sufficient flexibility to cater for the changing operating environment.
43 SCA’s current licence finishes on 30 June 2012 and is currently being reviewed. It is likely that
this review will decide on a 5-year term for the next licence, ending on 30 June 2017.

3 IPART’s approach to setting prices
Review of prices for Sydney Water Corporation’s water, sewerage, stormwater drainage and other servicesIPART 33
3.3 Approach for determining the notional revenue requirement
As noted previously, the notional revenue requirement represents IPART’s view of Sydney Water’s full, efficient costs in providing the regulated services for each year of the determination period. As in previous reviews, we used a building block approach to calculate Sydney Water’s notional revenue requirement over the determination period. To apply this approach, we estimated the amount of revenue it will require in each year of the period, including:
The revenue required for operating expenditure over the period. This amount represents our estimate of Sydney Water’s forecast efficient operating, maintenance and administration costs.
An allowance for a return on the assets used to provide the regulated services. This amount represents our assessment of the opportunity cost of the capital invested in Sydney Water by its owner, and ensures that it can continue to make efficient investments in capital in the future.
An allowance for a return of assets (regulatory depreciation). This allowance recognises that through the provision of services to customers, a water utility’s capital infrastructure will wear out over time and therefore revenue is required to recover the cost of maintaining the regulatory asset base.
An allowance for working capital. This allowance represents the holding cost of net current assets.
An allowance for meeting tax obligations. In December 2011, after consultation, we decided to calculate a more accurate and commercially based tax allowance as a discrete building block, and to use a post-tax WACC.44 Our previous approach used a pre-tax WACC with an assumed statutory tax rate. In most cases, this overstated the tax that would be paid by a comparable commercial business. In this Determination, the amount allowed for tax is lower than the amount Sydney Water expects to pay, primarily because its actual gearing ratio and interest expense are lower than the benchmarks used for the WACC.
The 2012 Determinations for Sydney Water’s prices is the first time we have implemented our changed approach to tax. Sydney Water’s submission was on a real pre-tax basis as it was made before we changed our tax policy. All figures in this report are shown on a real post-tax basis, and Appendix C provides an estimate of the impact on Sydney Water’s revenue of moving from a pre-tax WACC to a post-tax WACC. Appendix D sets out our calculations in determining Sydney Water’s allowance for tax obligations.
The sum of these amounts represents IPART’s view of Sydney Water’s total efficient costs over the determination period, or its notional revenue requirement (Figure 3.1).
44 IPART, The incorporation of company tax in pricing determinations – Final Decision, December 2011.

3 IPART’s approach to setting prices
34 IPART Review of prices for Sydney Water Corporation’s water, sewerage, stormwater drainage and other services
Figure 3.1 Building block approach
IPART considers the building block approach has advantages over alternative approaches. In particular, it ensures that the full, efficient costs of providing the regulated services are measured and monitored in a rigorous and transparent way. It enables us to create incentives for the regulated business to improve its economic efficiency over the determination period and is consistent with the approach we use in regulating other water businesses and industries in NSW.
In the past, we have used a real pre-tax WACC in calculating Sydney Water’s returns on and of the RAB. For this review, we used a real post-tax WACC and calculated its tax liability as a separate cost block. This approach reflects our decision, made as part of a recent review of our approach for incorporating taxation into our WACC estimate,45 to use a real post-tax WACC and to estimate the tax liability on broadly the same basis as the Australian Taxation Office. We consider this method most accurately estimates the tax liability that would be achievable by a similar well-managed, privately owned business.
Our findings on the notional revenue requirement are presented in Chapter 4, and discussed in detail in Chapters 5 and 6.
45 IPART, The incorporation of company tax in pricing determinations, December 2011.

3 IPART’s approach to setting prices
Review of prices for Sydney Water Corporation’s water, sewerage, stormwater drainage and other servicesIPART 35
3.4 Approach for converting the notional revenue requirement into prices
Having calculated Sydney Water’s notional revenue requirement for the determination period, we then converted that requirement into prices. To do this, we needed to make a number of decisions, including:
the target revenue for each year
the revenue expected from trade waste, miscellaneous services and other sources
the forecasts of Sydney Water’s customer numbers and water sales over the determination period
the structure for Sydney Water’s prices, and the ratio of the revenue to be generated from each type of charge
the level of prices.
3.4.1 Target revenue
Decision
2 IPART’s decision is to determine the target revenue using an adjusted glide path approach.
Before we convert the notional revenue requirement into prices, we need to consider what it means for the level of prices, and the rate and way in which they will change over the determination period. This impact has implications for both customers and Sydney Water. For example, when the annual revenue requirement goes up and down from year to year, it can lead to price and revenue volatility. This can affect both customers and the utility in an undesirable way, and we generally try to avoid such outcomes.
Our analysis of Sydney Water’s notional annual revenue requirement shows that in the first year of the determination period, revenue requirement falls significantly compared to the target revenue for the previous year. It then rises steadily in the each year of the determination period. Setting prices to target these annual revenue requirements would result in volatile prices, which could create price shocks for some customers and harm Sydney Water’s short-term financial position.
Therefore, we decided to adopt a ‘glide path’ approach that will ensure that prices change smoothly over the determination period in real terms, and that the targeted revenue in the final year of the determination period equals the notional revenue requirement for that year.
This decision and the resulting target revenue are discussed in more detail in Chapter 4.

3 IPART’s approach to setting prices
36 IPART Review of prices for Sydney Water Corporation’s water, sewerage, stormwater drainage and other services
3.4.2 Revenue from trade waste, miscellaneous services and other sources
Since the notional revenue requirement will be used as the basis for setting the prices of water, sewerage and stormwater drainage services only, we need to estimate and subtract the amount of revenue Sydney Water will generate from other prices and sources over the determination period. This ensures that water, sewerage and stormwater prices reflect only the costs of the services to which they relate.
Our findings on revenue from other sources are discussed in Chapter 4.
3.4.3 Forecast customer numbers and water sales
Our next step was to determine prices to recover revenues in line with the glide path. Pricing calculations are particularly dependent on the assumptions made about forecast customer numbers and water demand. Forecasts of customer numbers are important in determining fixed service charges, as the revenue these charges generate depends on how many customers pay the charges. Forecasts of water sales are important in determining the variable water usage charge, as the revenue this charge generates depends on how much water customers use.
As part of its submission, Sydney Water forecast its customer numbers and metered water sales over the determination period. We reviewed these forecasts to check whether they are reasonable, and made decisions on the forecasts we would use. This review and our decisions are discussed in detail in Chapter 7. We also considered whether to introduce a mechanism to take account of variations between the forecast water sales used in setting prices and actual water sales. This is discussed in section 3.6 below.
3.4.4 Price structure and ratio of revenue to be generated from each type of charge
As Chapter 2 discussed, we recently completed a review of price structures for the metropolitan water utilities we regulate (with assistance from these utilities). This review analysed the basis for individual charges, and investigated why some customers receiving a similar service are charged different amounts. We found that in some cases, the structure of Sydney Water’s current prices does not reflect the costs to service some customer groups, and results in cross-subsidies between groups.
In this price review, we have maintained the key features of Sydney Water’s current pricing structure, including:
uniform or ’postage stamp’ pricing for water and sewerage services across Sydney Water’s area of operations
recovery of most costs associated with sewerage and stormwater services through fixed charges

3 IPART’s approach to setting prices
Review of prices for Sydney Water Corporation’s water, sewerage, stormwater drainage and other servicesIPART 37
water usage charges designed to encourage efficient water consumption and set with reference to the Long Run Marginal Cost (LRMC) of water supply, and
calculation of fixed charges for water services as the residual of the revenue requirement not recovered through usage charges.
However, we considered the results of the price structure review, as well as Sydney Water’s proposals to respond to those results, by adjusting the structure of some prices for some customer groups. We adopted many of these proposals in deciding on the price structure.
This price restructuring aims to remove cross-subsidies, improve cost reflectivity and make prices more equitable. It does not increase the total revenue generated by the prices, or change the relative percentage of total revenue collected from residential and non-residential customers. Rather, it alters the proportion of revenue that will be generated through particular charges and from particular customer groups within the residential and non-residential categories. Our decisions on price structure are discussed in detail in Chapter 8.
3.4.5 Price levels
In deciding on pricing levels, IPART takes into account the matters set out in section 15 of the IPART Act, including Sydney Water’s financial viability and the impact of its prices on customers. Balancing these competing interests may mean that the target revenue derived by prices is greater than the determined notional revenue requirement.
To consider the impact on Sydney Water’s financial viability, we examined Sydney Water’s forecast credit rating, taking into account its existing cash and debt levels and its ability to pay dividends. We considered Sydney Water’s ‘benchmark financial structure’ and had regard to the WACC parameter assumptions it made in determining the return on assets and return of asset cost blocks.
In considering economic efficiency, we took account of the extent to which the prices send appropriate signals to customers and reflect the costs of the services provided, and the consistency of the variable usage charge with the LRMC of water. As much as possible, the usage charge each customer class or group pays should reflect the marginal cost that their consumption imposes. We applied marginal cost principles to sewerage prices, and considered the appropriate price signals customers receive regarding the costs of the sewerage service and the transport, treatment and disposal of wastes. The total cost to the community of the services provided is reflected in the aggregate of the fixed and usage charges. These services are capital intensive and the costs of the capital employed include the return that these resources could otherwise earn. Therefore, it is important that prices are sufficient to allow Sydney Water to earn a return on capital comparable to that earned by other water businesses. Signalling the true costs of water and sewerage services encourages customers to use these services wisely.

3 IPART’s approach to setting prices
38 IPART Review of prices for Sydney Water Corporation’s water, sewerage, stormwater drainage and other services
These principles are consistent with the National Water Initiative Pricing Principles and with the Intergovernmental Agreement on a National Water Initiative.
We consider that our approach for converting the notional revenue requirement into prices will provide prices for Sydney Water’s customers that are appropriate and equitable.
3.5 Approach for addressing the risk of significant variation between actual and forecast water sales
Decision
3 IPART’s decision is to introduce a demand volatility adjustment to mitigate possible revenue over/under recovery due to a material variation between the net level of actual water demand over the 2012 determination period and the forecast demand used in making the determination, and to:
– define material variation as more than 10% (+ or -) over the whole determination period
– indicate that only the impact of variation outside of this 10% variation level will be adjusted for
– decide how best to make the revenue adjustment in our next price review, if a material variation eventuates.
Sydney Water’s total water demand over the current determination period was around 175 GL (8.1%) below what we forecast at the 2008 determination. This variance was mostly caused by customers using less water in response to ongoing drought conditions and Sydney Water’s Water Wise Rules. Sydney Water has forecast that current consumption levels, of around 490 GL per year, will continue over the next 4 years46 leading to approximately the current level of total water demand. In the past when drought restrictions were lifted, water demand has bounced back relatively quickly. Since restrictions were lifted in 2009 and Water Wise Rules applied, total water demand has not significantly increased. There is some uncertainty regarding the level of demand in the future and whether a more delayed bounce back will occur and if so, to what extent or whether total demand will continue at its current level or even decline further.
46 Sydney Water submission to IPART’s Review of prices for Sydney Water Corporation’s water,
sewerage, stormwater and other services, September 2011.

3 IPART’s approach to setting prices
Review of prices for Sydney Water Corporation’s water, sewerage, stormwater drainage and other servicesIPART 39
Given the uncertainty around demand forecasts, we have decided to consider applying a demand volatility adjustment that allows us to make an adjustment in the 2016 Determination to account for net revenue over/under recovery of more than 10% for the full 4 years of the 2012 regulatory period if that occurs. This demand volatility adjustment could be implemented by comparing the forecast and actual water demand over the 2012 Determination and adjusting either the revenue requirement or the Regulatory Asset Base (RAB) for the 2016 Determination if the net level of actual demand over the 2012 Determination diverges by more than 10% from forecast demand. Only the level of over/under recovery that exceeds the 10% dead-band level would be considered for adjustment. This decision allows discretion in the 2016 Determination as to whether and how the adjustment should be made.
This mechanism is similar in design to that used in the 2005 Determination47 for Sydney Water, Hunter Water and the SCA. In the 2005 Determination, we stated that if actual water demand was outside a 10% dead-band, we were able to consider adjusting the revenue requirement for the subsequent determination to account for the effect of the difference.48 We were also able to determine the manner in which the adjustment was made during the subsequent determination period.
The use of such a mechanism has limitations in that it may not provide complete certainty to customers or Sydney Water as it is not binding on future Tribunal decisions, the amount by which prices may change is not known in advance and the manner in which the adjustment is made is not pre-determined. These limitations arise because it is not until the time of the 2016 price review that the next Tribunal can determine whether and how any adjustment to prices is made. We cannot incorporate the mechanism into the 2012 legal Determination as the adjustment relates to 2016 prices, which is beyond the powers of the 2012 Tribunal. Therefore it has been included in our report but a degree of discretion surrounding its future use remains.
We consider that this mechanism has a number of advantages in that it does not create yearly price volatility, it only adjusts where there are material differences between actual and forecast demand (the net level of actual demand diverges from forecast demand by more than 10%), and there are a number of ways in which an adjustment can be made.
47 IPART, Sydney Water Corporation Prices of Water Supply, Wastewater and Stormwater Services,
September 2011. 48 IPART, Sydney Water Corporation, Hunter Water Corporation, Sydney Catchment Authority, Prices of
Water Supply, Wastewater and Stormwater Services - Determination and Final Report, September 2005.

3 IPART’s approach to setting prices
40 IPART Review of prices for Sydney Water Corporation’s water, sewerage, stormwater drainage and other services
On balance, we considered that this mechanism was the most appropriate means of adjusting for revenue over/under recovery as it:
allows flexibility in how the adjustment to prices would be implemented in the following Determination
does not result in price volatility in the current determination that would result from the use of a mechanism that adjusts prices in the following year, based on sales in the current year.
3.6 Approach to addressing uncertainty about SDP’s operating schedule and its impact on Sydney Water’s costs
Decision
4 IPART’s decision is to set prices on the basis that SDP is in water security shutdown mode for the whole 2012 determination period, and pass through the annual actual extra costs Sydney Water incurs due to it being in a different operational mode in the subsequent year, using the mechanism described in Box 3.1.
3.6.1 Sydney Water’s proposal
In its pricing proposal, Sydney Water has calculated prices on the basis that SDP will be in full operation mode, producing 90GL of desalinated drinking water per year, in each year of the determination period. It also proposes that if SDP is in a different mode of operation for some or all of that year, the resulting savings will be passed through to customers in the following year via a refund.
3.6.2 Stakeholder submissions
The Total Environment Centre recommended that the price of drinking water should increase when the desalination plant is operating. It also recommended that the plant should only commence operations when storage levels fall below 30% and should cease when levels recover to more than 40%.
Ross Flynn of Wollongong suggested that only Sydney Water customers that consume desalinated water should pay for the plant, and its operations.
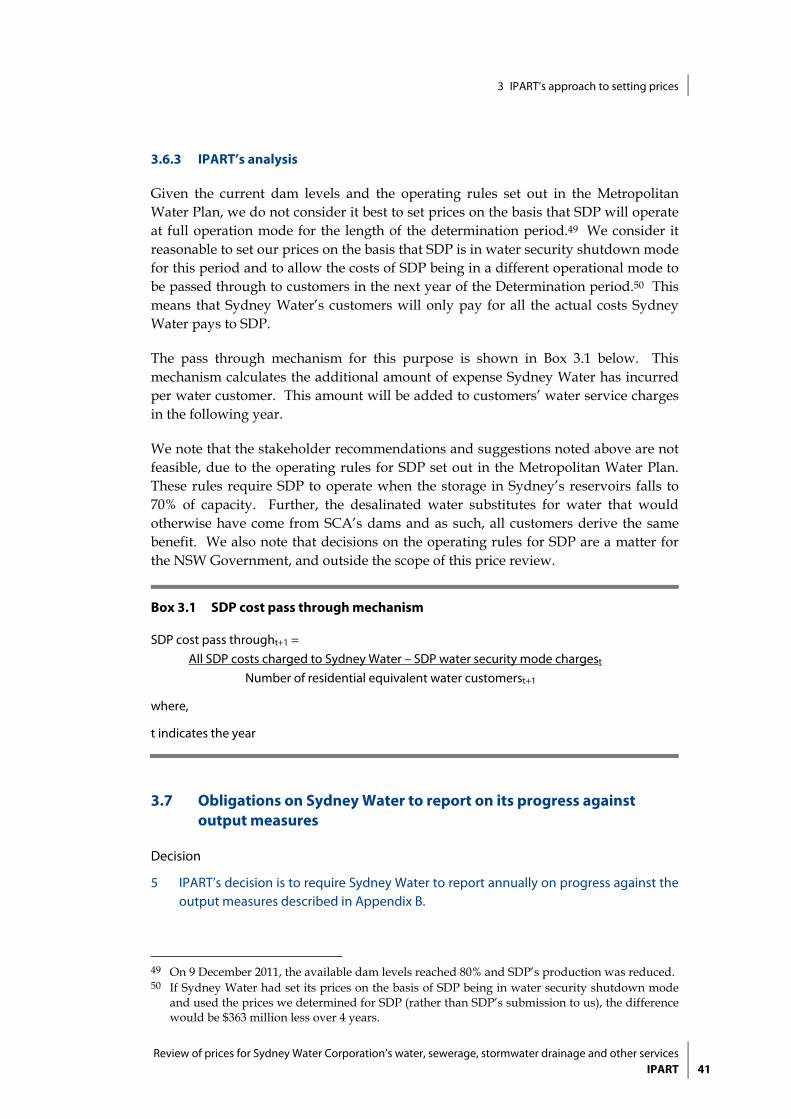
3 IPART’s approach to setting prices
Review of prices for Sydney Water Corporation’s water, sewerage, stormwater drainage and other servicesIPART 41
3.6.3 IPART’s analysis
Given the current dam levels and the operating rules set out in the Metropolitan Water Plan, we do not consider it best to set prices on the basis that SDP will operate at full operation mode for the length of the determination period.49 We consider it reasonable to set our prices on the basis that SDP is in water security shutdown mode for this period and to allow the costs of SDP being in a different operational mode to be passed through to customers in the next year of the Determination period.50 This means that Sydney Water’s customers will only pay for all the actual costs Sydney Water pays to SDP.
The pass through mechanism for this purpose is shown in Box 3.1 below. This mechanism calculates the additional amount of expense Sydney Water has incurred per water customer. This amount will be added to customers’ water service charges in the following year.
We note that the stakeholder recommendations and suggestions noted above are not feasible, due to the operating rules for SDP set out in the Metropolitan Water Plan. These rules require SDP to operate when the storage in Sydney’s reservoirs falls to 70% of capacity. Further, the desalinated water substitutes for water that would otherwise have come from SCA’s dams and as such, all customers derive the same benefit. We also note that decisions on the operating rules for SDP are a matter for the NSW Government, and outside the scope of this price review.
Box 3.1 SDP cost pass through mechanism
SDP cost pass throught+1 = All SDP costs charged to Sydney Water – SDP water security mode chargest Number of residential equivalent water customerst+1
where,
t indicates the year
3.7 Obligations on Sydney Water to report on its progress against output measures
Decision
5 IPART’s decision is to require Sydney Water to report annually on progress against the output measures described in Appendix B.
49 On 9 December 2011, the available dam levels reached 80% and SDP’s production was reduced. 50 If Sydney Water had set its prices on the basis of SDP being in water security shutdown mode
and used the prices we determined for SDP (rather than SDP’s submission to us), the difference would be $363 million less over 4 years.

3 IPART’s approach to setting prices
42 IPART Review of prices for Sydney Water Corporation’s water, sewerage, stormwater drainage and other services
We set output measures for the water agencies we regulate as a means of determining whether they are delivering on the capital expenditure plans they outline in their pricing submissions. This is important because we set prices to enable them to recover the forecast costs of those plans.
While meeting output measure targets is important, conclusions about an agency’s performance should not be drawn wholly on the basis of whether or not it has met or even exceeded these targets. There may be reasonable explanations why it does not meet targets. In fact, as circumstances evolve over a determination period, changing a target may result in a better outcome for stakeholders. However, ongoing inability to meet output measure targets may also indicate that the required levels of service, to which we have linked our prices, are not being met and there is a deficiency in the planning and delivery of capital projects.
Sydney Water has reported on the output measures that were set in the 2008 Determination to track the delivery of its capital program over the period from 2008 to 2012. Sydney Water reports that it has met (or will meet) 47% of the target measures, has exceeded 11%, and has not met 42%.51 This information was used by Atkins Cardno in its assessment of Sydney Water’s progress. A full report of delivery against output measures over the period 2008 to 2012 can be found at Appendix B.
IPART supports maintaining the use of output measures as a starting point for the assessment of prudent capital expenditure and the basis for reporting on any deviation from targets established. Sydney Water has provided a list of the capital projects it plans to undertake over the 2012 determination period. We have revised the output measures for the 2008 period to reflect this proposed capital program. The list of these capital projects and their output measures with targets is presented in Appendix B. In light of the increase in allowed stormwater expenditure of $16.2m from the draft report, we will closely monitor this expenditure over the 2012 determination period.
We expect Sydney Water to monitor its expenditure on these projects and provide annual progress reports. In addition, Sydney Water should provide a reconciliation of its expenditure and outcomes against the IPART capital and operating expenditure allowances.
51 Atkins Cardno, Final Report - Detailed Review of Sydney Water’s Operating and Capital Expenditure,
November 2011, p 65.
4 Overview of IPART’s findings and decisions on Sydney Water’s revenue requirements
Review of prices for Sydney Water Corporation’s water, sewerage, stormwater drainage and other servicesIPART 43
4 Overview of IPART’s findings and decisions on Sydney Water’s revenue requirements
As Chapter 3 discussed, we used a building block approach to calculate Sydney Water’s notional revenue requirement in each year of the determination period. This represents our view of Sydney Water’s total efficient costs over the determination period. It includes:
the revenue required for operating expenditure
an allowance for a return on the assets
an allowance for a return of assets (regulatory depreciation)
an allowance for meeting tax obligations
an allowance for working capital.
Next, we determined the target revenue for each year – that is, the amount of revenue that the price levels we will set are intended to generate. This revenue is not necessarily the same as the notional revenue requirement. We sometimes target more or less than this revenue to achieve an acceptable balance between the interests of customers, the utility and economic efficiency.
Finally, we estimated the amount of revenue we expect Sydney Water to generate from trade waste services and a range of other fees and charges. We subtracted this amount from the target revenue, as the target revenue is the basis for setting the prices for water, sewerage and stormwater drainage services only.
The section below summarises our findings and decisions on Sydney Water’s revenue requirements. The subsequent sections summarise:
Sydney Water’s proposed notional revenue requirement
our findings and decisions on the notional and target revenue requirements
the revenue from other sources.
Chapter 3 explains the approach we used to calculate the revenue requirements in more detail. Chapters 5 and 6 discuss our findings on the individual components of the notional revenue requirement in detail.

4 Overview of IPART’s findings and decisions on Sydney Water’s revenue requirements
44 IPART Review of prices for Sydney Water Corporation’s water, sewerage, stormwater drainage and other services
4.1 Summary of findings and decisions on revenue requirements
6 IPART’s findings and decision on Sydney Water’s notional revenue requirement and target revenue are shown in Table 4.1.
Table 4.1 IPART’s findings and decisions on Sydney Water’s notional revenue requirement and target revenue ($million, 2011/12)
2012/13 2013/14 2014/15 2015/16
Final decision
Operating expenditure 1,283.5 1,276.2 1,270.6 1,263.4
Allowance for return on assets 725.3 750.1 772.8 790.8
Allowance for regulatory depreciation 213.1 226.6 239.4 250.3
Allowance for tax obligations 30.3 35.4 42.6 46.6
Allowance for return on working capital 6.1 6.3 6.9 7.4
Total notional revenue requirement 2,258.3 2,294.6 2,332.4 2,358.5
Target revenue 2,297.0 2,308.8 2,331.3 2,358.5
Rate of return (real post-tax) 5.9% 5.7% 5.6% 5.6%
Note: Totals may vary due to rounding.
4.2 Sydney Water’s proposed notional revenue requirement
Sydney Water’s proposed notional revenue requirement is shown in Table 4.2 below. Compared to its target revenue of $2,293 million in 2011/12, this proposal represents an increase of $406 million or 17.7% over the period. In developing this proposal, Sydney Water set its prices on the basis that SDP would operate at 100% capacity for the entire period, and that any savings arising from variations in this operating schedule be refunded to customers in the following year. This accounts for between $54 million and $63 million of the difference in the proposed revenue requirement per year, or a total of around $238 million over the whole period.52
52 Sydney Water estimated these costs based on SDP’s proposed prices, as we had not issued our
Determination. Since it made its proposal, we have determined prices for SDP.

4 Overview of IPART’s findings and decisions on Sydney Water’s revenue requirements
Review of prices for Sydney Water Corporation’s water, sewerage, stormwater drainage and other servicesIPART 45
Table 4.2 Sydney Water’s proposed notional revenue requirement ($million, 2011/12) – including costs of SDP operating at 100%
2012/13 2013/14 2014/15 2015/16
Operating expenditurea 1,361.7 1,372.1 1,374.3 1,374.3
Allowance for return on assetsb 955.5 995.5 1,034.9 1,069.4
Allowance for regulatory depreciation 211.1 226.4 241.4 255.1
Total notional revenue requirement (NRR) 2,528.3 2,594.0 2,650.7 2,698.8
Estimate of NRR excluding SDP production costs 2,473.9 2,534.8 2,588.4 2,636.3a Includes an allowance for tax. b Includes costs of bulk water and desalinated water, and an allowance for a return on working capital.
Note: Totals may vary due to rounding.
Note: Figures differ slightly from those presented in Sydney Water’s submission because IPART includes income from some activities that Sydney Water has excluded from its calculation of notional revenue requirement.
Source: Sydney Water submission to IPART’s Review of prices for Sydney Water Corporation’s water, sewerage, stormwater and other services, September 2011, p 109.
Sydney Water calculates that to meet its proposed revenue requirement, a typical53 household’s water and sewerage bill needs to increase from $1,105 in 2011/12 to $1,271 in 2015/16 (in 2011/12 dollars). This represents an increase of $166 or 15% increase over 4 years (in addition to inflation).
4.3 IPART’s finding on the notional revenue requirement
Finding
7 IPART’s finding is that Sydney Water’s notional revenue requirement is as shown in Table 4.3.
53 Based on a residential property consuming 200 kL of water per year.

4 Overview of IPART’s findings and decisions on Sydney Water’s revenue requirements
46 IPART Review of prices for Sydney Water Corporation’s water, sewerage, stormwater drainage and other services
Table 4.3 IPART’s finding on the notional revenue requirement ($million, 2011/12)
2012/13 2013/14 2014/15 2015/16
Draft finding
Operating expenditure 1,268.5 1,265.8 1,259.6 1,252.5
Allowance for return on assetsa 721.9 751.5 781.6 804.0
Allowance for regulatory depreciation 207.1 219.8 232.0 242.6
Total notional revenue requirement (excluding any SDP production costs)
2,197.5 2,237.1 2,273.2 2,299.0
Final finding
Operating expenditure 1,283.5 1,276.2 1,270.6 1,263.4
Allowance for return on assetsa 761.7 791.8 822.4 844.9
Allowance for regulatory depreciation 213.1 226.6 239.4 250.3
Total notional revenue requirement (excluding any SDP production costs)
2,258.3 2,294.6 2,332.4 2,358.5
a Includes an allowance for a return on working capital and an allowance for tax obligations.
Note: Totals may vary due to rounding.
Our finding on the notional revenue requirement is $1.23 billion lower than Sydney Water’s proposal over 4 years. On average, it is around $18 million per year higher than the target revenue requirement of 2011/12. The main reasons for this difference are our decisions to:
Use a post-tax real WACC of 5.6% which is lower than Sydney Water’s proposed WACC. We estimate that Sydney Water’s proposed pre-tax real WACC of 7.5% would be around 6.5% in post-tax real terms.
Include approximately $500 million less capital expenditure in our calculations for the allowances for a return on assets and regulatory depreciation, and $33 million less operating expenditure over 4 years than Sydney Water proposed to reflect the efficiency savings the utility can make over the determination period.
Include operating costs for SDP in water security shutdown mode for the entire determination period (and that any costs arising from variations in this operating schedule will be passed through to customers in the following year). As noted above, Sydney Water assumed the plant will be running at full capacity. If Sydney Water had set its prices on the basis of SDP being in water security shutdown mode and used the prices we determined for SDP (rather than SDP’s submission to us), the difference would be $363 million less, over 4 years.

4 Overview of IPART’s findings and decisions on Sydney Water’s revenue requirements
Review of prices for Sydney Water Corporation’s water, sewerage, stormwater drainage and other servicesIPART 47
4.4 IPART’s decision on target revenue
Decision
8 IPART’s decision is that Sydney Water’s target revenue is as shown in Table 4.4.
Table 4.4 IPART’s decision on Sydney Water’s target revenue ($million, 2011/12)
2011/12 2012/13 2013/14 2014/15 2015/16 Total
Draft decision
Target revenue 2,293 2,278 2,284 2,289 2,299 9,150
Notional revenue requirement 2,197 2,237 2,273 2,299 9,007
Difference 80 47 16 0 143
Difference (%) 3.7% 2.1% 0.7% - 1.6%
Final decision
Target revenue 2,293 2,297 2,309 2,331 2,359 9,296
Notional revenue requirement 2,258 2,295 2,332 2,359 9,244
Difference 39 14 (1) 0 52
Difference (%) 1.7% 0.6% - - 0.6%
Note: Totals may vary due to rounding.
To avoid a situation where prices (and revenue) drop significantly at the start of 2012/13, and then rise again each year to 2015/16, we decided to target revenue that is higher than the total notional revenue requirement in the first 2 years of the determination period, and equal to the total notional revenue requirement in the final 2 years. As Chapter 3 discussed, this approach ensures there is a smooth transition from the price levels under the current determination, and allows Sydney Water time to adjust to lower revenue levels.
Sydney Water is expected to generate about $52 million ($50 million in NPV terms) more from charges than the notional revenue requirement. This over-recovery assists Sydney Water’s transition to lower charges.

4 Overview of IPART’s findings and decisions on Sydney Water’s revenue requirements
48 IPART Review of prices for Sydney Water Corporation’s water, sewerage, stormwater drainage and other services
4.5 IPART’s finding on revenue from trade waste services and other fees and charges
Finding
9 IPART’s finding on the revenue to be deducted from Sydney Water’s revenue requirement to reflect the revenue it will raise through ‘other fees and charges’ is as shown in Table 4.5.
Table 4.5 IPART’s finding on revenue from ‘other fees and charges’ ($million, 2011/12)
2012/13 2013/14 2014/15 2015/16 Total
Draft decision
Total to be deducted from revenue requirement
38.7 39.8 40.7 41.7 160.9
Final decision
Total to be deducted from revenue requirement
42.6 34.6 37.2 39.8 154.2
Note: Totals may vary due to rounding.
Sydney Water’s overall revenue requirement includes revenue for all regulated services including water, sewerage, stormwater and revenue for ‘other fees and charges’. ‘Other fees and charges’ include charges such as trade waste charges, unfiltered water charges and ancillary and miscellaneous customer service charges. To calculate the revenue to be recovered from water, sewerage and stormwater charges only, we subtract revenue required from ‘other fees and charges’ from the overall notional revenue requirement.
We derive the revenue for other fees and charges from information supplied by Sydney Water. For example, the revenue for miscellaneous charges was derived from data in Sydney Water’s 2010/11 Annual Information Return (AIR) and supplementary data54. The following sections discuss our calculation of the revenue required for other fees and charges.
4.5.1 Trade waste charges
The trade waste revenue to be deducted from the notional revenue requirement is shown in Table 4.6 below.
54 Sydney Water supplementary data, 12 October 2011.

4 Overview of IPART’s findings and decisions on Sydney Water’s revenue requirements
Review of prices for Sydney Water Corporation’s water, sewerage, stormwater drainage and other servicesIPART 49
Table 4.6 Trade waste revenue ($million, 2011/12)
2012/13 2013/14 2014/15 2015/16 Total
Draft decision
Trade waste revenue 25.3 26.3 27.0 27.8 106.3
Final decision
Trade waste revenue 28.9 20.8 23.2 25.6 98.5
Note: Totals may vary due to rounding.
Source: IPART calculations.
For the 2012 Determination, we undertook a comprehensive review of trade waste charges. As part of this review, Sydney Water undertook a project that estimated the costs of corrosion it incurs in managing trade waste discharges, as well as a review of trade waste charges and development of proposed prices. We engaged consultants Deloitte to review Sydney Water’s proposed trade waste costs and charges and provide recommendations on these.
Sydney Water proposed significant changes to the structure of many of its trade waste charges. We also requested that it provide a supplementary submission to address some concerns we had with phasing in changes to charges and gaining a better understanding of customer impacts. We accepted the majority of Sydney Water’s proposed charges in its supplementary submission; however we made some changes to accommodate the recommendations of our consultants and stakeholder feedback. Trade waste charges are discussed in greater detail in Chapter 9.

4 Overview of IPART’s findings and decisions on Sydney Water’s revenue requirements
50 IPART Review of prices for Sydney Water Corporation’s water, sewerage, stormwater drainage and other services
4.5.2 Miscellaneous services
Sydney Water’s submission includes expected revenue of $6.8 million 55per annum from miscellaneous services. Sydney Water subsequently provided us with updated forecasts which showed revenue was expected to be around $7.2 million per annum.56 This is a reduction on recent years of about $1.6 million per annum. This reduction is due to Sydney Water rationalising the miscellaneous services it provides and transferring some functions to the NSW Office of Fair Trading. Sydney Water’s estimate of revenue from miscellaneous charges is shown in Table 4.7.
Table 4.7 Miscellaneous service revenue ($million, 2011/12)
2012/13 2013/14 2014/15 2015/16 Total
Miscellaneous services 7.2 7.2 7.3 7.2 29.0
Note: Totals may vary due to rounding.
Source: Sydney Water submission to IPART’s Review of prices for Sydney Water Corporation’s water, sewerage, stormwater and other services, September 2011, Appendix 21, pp386-409 and email to IPART dated 12 October 2011.
We have accepted Sydney Water’s proposals for miscellaneous charges which will increase by the change in CPI over the determination period (see section 9.8). We have also accepted Sydney Water’s revenue estimates for miscellaneous services.
4.5.3 Rental income
Sydney Water generates around $12 million per year in rental income.57 In our 2008 determination, we decided to deduct 50% of this rental income from the notional revenue requirement. 58 This means the benefit of this revenue was shared equally between Sydney Water and its customers. It also means that Sydney Water may earn more than our projected rate of return on some of its assets, as we have counted only 50% of income generated through rental of assets. However, it also gives Sydney Water a financial incentive to pursue more rental income where appropriate – while ensuring that 50% of the benefits of which will eventually flow on to customers through lower prices.
We have decided to maintain this principle and have deducted 50% of Sydney Water’s expected rental income from the notional revenue requirement as shown in Table 4.8.
55 Sydney Water submission to IPART’s Review of prices for Sydney Water Corporation’s water,
sewerage, stormwater and other services, September 2011, p 386. 56 Sydney Water supplementary data 12 October 2012. 57 Ibid. 58 IPART, Review of prices for Sydney Water Corporation’s water, sewerage, stormwater and other
services, June 2008, p 37.

4 Overview of IPART’s findings and decisions on Sydney Water’s revenue requirements
Review of prices for Sydney Water Corporation’s water, sewerage, stormwater drainage and other servicesIPART 51
Table 4.8 Rental revenue ($million, 2011/12)
2012/13 2013/14 2014/15 2015/16 Total
Total rental income 11.2 11.4 11.6 12.0 46.2
50% (deducted from notional revenue requirement)
5.6 5.7 5.8 6.0 23.1
Note: Totals may vary due to rounding.
Source: Sydney Water supplementary data 12 October, 2011.
4.5.4 Unfiltered water charges
Sydney Water sells unfiltered water to a small number of industrial customers. Historically, this has generated between $5 million and $6 million a year in extra revenue.59 Sydney Water has forecast that there will be a large reduction in the volume of unfiltered water sold and thus in the revenue it generates. This is largely a result of reduced production by industrial customers.
We have reviewed Sydney Water’s forecast sales revenue from unfiltered water and accept the forecast. The forecast revenue from unfiltered water is shown in Table 4.9.
Table 4.9 Unfiltered water revenue ($million, 2011/12)
2012/13 2013/14 2014/15 2015/16 Total
Unfiltered water revenue 0.9 0.9 0.9 0.9 3.6
Source: IPART analysis.
59 Sydney Water, 2010/11 Annual Information Return.

5 Operating expenditure
52 IPART Review of prices for Sydney Water Corporation’s water, sewerage, stormwater drainage and other services
5 Operating expenditure
In building up Sydney Water’s total costs, we assessed Sydney Water’s forecast of the operating expenditure it will incur in providing regulated services over the determination period, and the information it provided in its submission on its past and forecast expenditures. As part of this assessment, we engaged Atkins Cardno, an independent engineering consultant, to review the efficiency of these expenditures and recommend the scope for Sydney Water to achieve operating efficiencies over the period.60 We also invited submissions from stakeholders and conducted our own analysis.
The section below summarises our finding on the allowance for operating expenditure. The following sections discuss our considerations in reaching this finding, including Sydney Water’s submission, Atkins Cardno’s review and recommendations, stakeholders’ comments and our own analysis and conclusions.
5.1 Summary of IPART’s finding
Finding
10 IPART’s finding is that the efficient level of Sydney Water’s operating expenditure is as shown in Table 5.1.
Table 5.1 Finding on revenue required for operating expenditure ($million, 2011/12)
2012/13 2013/14 2014/15 2015/16 Total
Water services (excluding bulk water purchases) 387 385 383 380 1,535
Bulk water purchasesa 379 379 378 375 1,511
Sewerage services 503 495 493 491 1,982
Stormwater drainage services 14 17 17 17 65
Total 1,283 1,276 1,271 1,263 5,094 a Including desalinated water.
Note: Totals may vary due to rounding.
60 Atkins Cardno, Detailed Review of Sydney Water Corporation’s Operating and Capital Expenditure,
November 2011.

5 Operating expenditure
Review of prices for Sydney Water Corporation’s water, sewerage, stormwater drainage and other servicesIPART 53
5.2 Sydney Water’s submission
Sydney Water submits that in real terms, its operating costs (excluding bulk water purchases) for the 2008 determination period are slightly above the levels we allowed for in setting prices for that period. It forecasts that over the 2012 determination period, these costs will be about 2% above the level we allowed for in 2011/12 (the last year of the current period).61
Sydney Water’s submission notes that about 70% of its operating costs are non-controllable,62 and in its view its ability to reduce the remaining 30% of costs is limited if its current operating performance is to be maintained. Nevertheless, it submits that it plans to deliver significant operating efficiencies over the 2012 period, which will achieve real decreases in its operating costs per property.
The following sections summarise Sydney Water’s submission on its past operating expenditure over the 2008 determination period and its forecast operating expenditure over the 2012 period.
5.2.1 Past operating expenditure
Sydney Water’s submission compares its operating expenditure over the 2008 period with the expenditure IPART allowed for in making the 2008 determination. It notes that its non-bulk-water-related costs63 are in line with allowed expenditure:
…because upward pressures on some cost categories have been offset by savings and business efficiencies made in other areas64.
Its bulk water costs are lower than allowed for because of:
…lower than forecast bulk water purchases from SCA due to subdued water demand and delays in commissioning the Sydney desalination plant65.
Non-bulk-water-related operating costs
Sydney Water’s non-bulk-water-related operating expenditure over the 2008 determination period is shown below in Table 5.2.
61 The construction of the Sydney Desalination Plant has had a significant impact on the cost of
bulk water for Sydney Water. Therefore, bulk water costs are treated separately in Sydney Water’s submission and in IPART’s analysis of Sydney Water’s operating costs (see section 5.5).
62 That is, Sydney Water has little or no ability to reduce them. 63 Non-bulk-water-related operating expenditure represents Sydney Water’s core operating,
maintenance and administration costs. Bulk water related operating expenditure is addressed separately.
64 Sydney Water submission to IPART, 16 September 2011. 65 Ibid.

5 Operating expenditure
54 IPART Review of prices for Sydney Water Corporation’s water, sewerage, stormwater drainage and other services
Table 5.2 Sydney Water’s past operating expenditure excluding bulk water ($million, nominal)
2008/09 2009/10 2010/11 2011/12 Total
Allowed for in 2008 determination 811.0 832.9 846.9 863.3 3,354.0
Actuala 810.7 834.4 845.5 887.0 3,377.5
Variation ($m) -0.3 1.4 -1.4 23.7 23.5
Variation (%) 0.0% 0.2% -0.2% 2.7% 0.7% a For comparison purposes, these figures exclude Sydney Water costs not included in the current determination, namely: Blue Mountains Tunnel finance lease costs ($11.2m in 2011/12); and Climate Change Fund reimbursement offset ($2.5m in 2011/12).
Note: Totals may vary due to rounding.
Source: Sydney Water submission to IPART’s Pricing Review, 16 September 2011, Table 4.1, p 40.
Sydney Water submits that the main categories in which its operating costs exceeded the forecast levels over the 2008 period are:
service contractors (+$73 million)
energy (+$33 million)
materials, plant and equipment (+$25 million)
chemicals (+$12 million).
The categories in which it has made savings, to offset these increases, are data management, insurance, demand management activities and property taxes.
Sydney Water also submits that there has been significant growth in the number of properties it services over the 2008 period. Therefore, although its total non-bulk-water-related operating expenditure is slightly higher than the total allowed for in IPART’s 2008 determination, these costs have declined on a per-property basis – falling from $391 per property in 2008/09 to a forecast $368 per property in 2011/12 or 5.9%.
Bulk water operating expenditure
Sydney Water purchases bulk water from Sydney Catchment Authority (SCA) and Sydney Desalination Plant (SDP). Sydney Water forecasts that bulk water costs over the 2008 determination period will be $80.7 million ($nominal) below those allowed for in the 2008 determination. This is due to:
the lower than expected water demand from its customers, which reduced the cost of bulk water purchases from SCA by $33.9 million
the later than expected handover of SDP plant, which reduced costs by a further $46.8 million.

5 Operating expenditure
Review of prices for Sydney Water Corporation’s water, sewerage, stormwater drainage and other servicesIPART 55
5.2.2 Forecast operating expenditure
Table 5.3 shows Sydney Water’s forecast operating expenditure over the 2012 determination period and compares it to the last year of the current period (2011/12). It shows that Sydney Water’s forecast annual:
non-bulk-water-related operating costs are lower than in 2011/12
bulk water costs are higher than for 2011/12.
Table 5.3 Sydney Water’s forecast operating expenditure ($million, 2011/12)
Current (2011/12)
2012/13 2013/14 2014/15 2015/16 Total (excluding
2011/12)
Non-bulk- water
Water
326 306 307 305
303 1,221
Sewerage 368 379 380 379 378 1,515
Stormwater 13 11 13 13 13 50
Recycled water (s. 16A)
23 24 24 26 26 99
Less revenue Rosehill schemea
-8 -8 -8 -8 -9 -33
Corporate 179 177 180 180 184 720
Total non-bulk water
901 888 894 894 896 3,571
Bulk Water
SCA 199 203 205 206 207 820
SDPd 270 271 273 275 272 1,091
Total bulk water 469 474 478 481 479 1,911
Subtotal 1,370 1,362 1,372 1,374 1,374 5,482
Total non-regulatedb
15 14 14 14 15 58
Totalc 1,385 1,376 1,386 1,389 1,389 5,540a Sydney Water funds the difference between the charges paid to the owner of the Rosehill scheme and revenue received from the sale of recycled water to customers. b Non-regulated includes all non-regulated (not s. 16A) recycled water schemes. c Includes Blue Mountains Tunnel and Macarthur WFP lease payments. d The SDP related costs in Sydney Water’s submission were based on the proposed charges contained in SDP’s submission to IPART in July 2011. Sydney Water has also set its prices based on the desalination plant operating at full capacity for the full 4 years of the new determination period.
Note: Totals may vary due to rounding.
Source: Sydney Water’s submission to IPART’s review of Prices for Sydney Water Corporation’s water, sewerage, stormwater and other services, September 2011, Table 4.5, p 49.

5 Operating expenditure
56 IPART Review of prices for Sydney Water Corporation’s water, sewerage, stormwater drainage and other services
Forecast non-bulk water related expenditure
Sydney Water plans to deliver significant operating efficiencies over the 2012 determination period. It predicts that, with a forecast increase in property numbers of approximately 73,000 between 2012 and 2016, its operating cost per property66 will fall by 4% in real terms over the period.
It forecasts increases in a number of operating categories, but expects these will be offset by expected decreases in other categories. The forecast increases include:
$136 million in service contractor costs for IT, maintenance and trunk main repairs (trunk main repairs were previously capitalised but are now recorded as operating expenditure)
$98 million in energy costs (excluding the Commonwealth’s proposed carbon price)67 due to additional assets and network tariff increases
a further $62 million in energy costs for the proposed carbon price
a cumulative $16 million more in chemicals due to price increases
$47 million in tariff payments to the owner of the Blue Mountains sewage transfer tunnel.
The forecast decreases include a total of $140 million ($2011/12) due to savings and efficiency gains over the 4 years to 2015/16 relative to the 2011/12 baseline. These include reduced direct labour costs, savings in the operational and maintenance areas (in addition to labour savings) and various other operating cost reductions, including lower Wastesafe costs and plumbing inspection costs.
66 This measure excludes the costs of bulk water, BOO water filtration, the carbon price, s 16A
recycled water schemes, and the Climate Change Fund. 67 Sydney Water’s submission contains its estimates of the impact of the Commonwealth
Government’s carbon price mechanism on its operating cost projections, an average impact of $15.4 million per year. It indicated that it has specifically excluded the carbon price impact on its capital cost projections as it is willing to defer recovery in increase in costs until the next determination.

5 Operating expenditure
Review of prices for Sydney Water Corporation’s water, sewerage, stormwater drainage and other servicesIPART 57
Forecast bulk water expenditure
The proportion of bulk water that Sydney Water will purchase from SDP compared to SCA depends on the 2010 Metropolitan Water Plan Operating Rules. In turn, the operation of these rules depends on weather conditions.68 For the purpose of projecting its operating costs and setting its proposed prices, Sydney Water has:
forecast that the desalination plant will operate at full capacity for the duration of the price path and SCA will provide the balance of bulk water required by Sydney Water
used the cost to Sydney Water for SDP’s desalinated water as calculated in line with the prices proposed by SDP’s pricing submission to our review of SDP’s prices.69
Sydney Water submits that its costs won’t be as high as it forecasts if the desalination plant does not operate for the full period of the determination. To take account of this, it proposes that IPART introduce a pricing mechanism that will pass on the impact of reduced costs to its customers. Sydney Water proposes that the adjustment be incorporated as part of the annual indexation of Sydney Water’s prices for inflation.70
Sydney Water’s submission to our draft report and determination
In its submission to our draft report, Sydney Water requested that operating costs be increased by $36.4 million over the 4 years of the new determination.71 Sydney Water argues that these additional costs are efficient and should be recovered through prices. The proposed additional costs are:
A further $20.9 million in BOO filtration costs. Sydney Water argues that our decision to set prices on the basis that SDP is in water security mode necessitates the parallel assumption that more water will be treated at the water filtration plants than Sydney Water had assumed in its submission. Hence, the operating costs relating to these BOO costs need to be included.
A further $1.5 million to allow for a one-off SDP “transition to shutdown fee”.
68 Under the Operating Rules, the desalination plant will commence operating at full capacity
when the total dam storage level falls below 70% and will continue operating until the level reaches 80%.
69 SDP submission to IPART’s pricing determination, July 2011, but note that IPART determined prices for SDP in the period after receiving Sydney Water’s submission, see IPART, Review of water prices for SDP, November 2011.
70 IPART often determines prices in real terms and then allows agencies to adjust the prices annually in line with movements in inflation.
71 Sydney Water submission on IPART’s draft determination, 13 April 2012, pp 17-20.
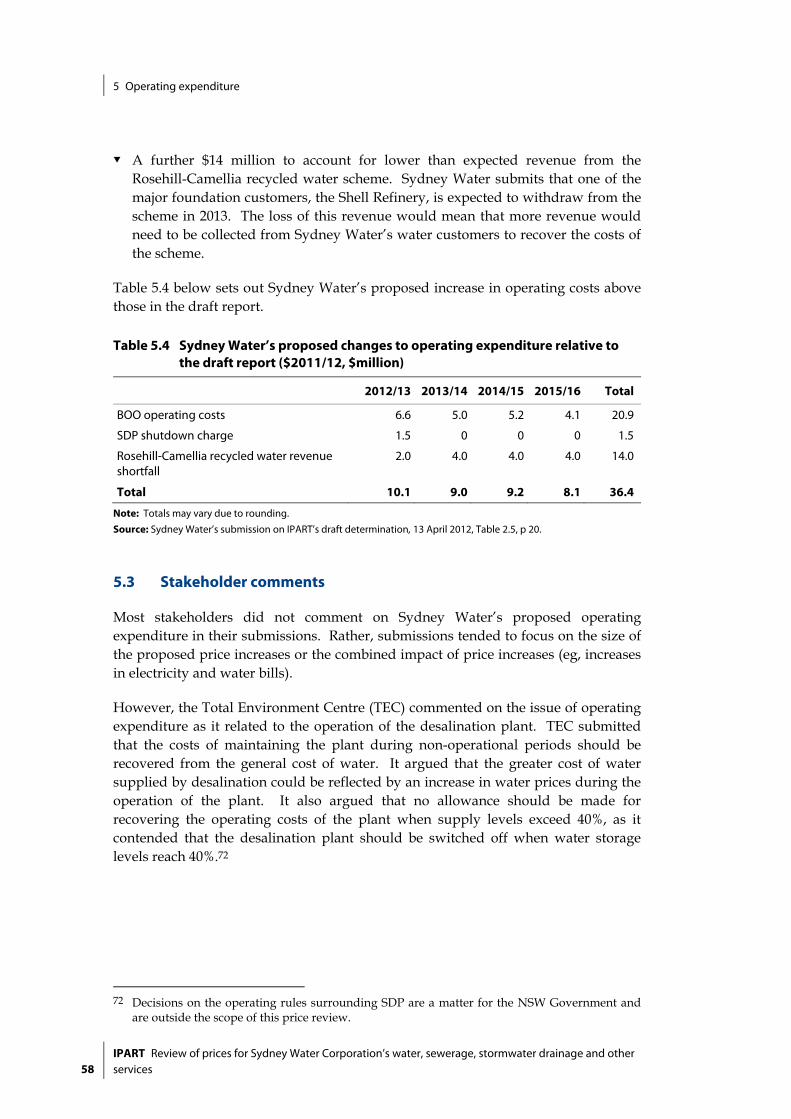
5 Operating expenditure
58 IPART Review of prices for Sydney Water Corporation’s water, sewerage, stormwater drainage and other services
A further $14 million to account for lower than expected revenue from the Rosehill-Camellia recycled water scheme. Sydney Water submits that one of the major foundation customers, the Shell Refinery, is expected to withdraw from the scheme in 2013. The loss of this revenue would mean that more revenue would need to be collected from Sydney Water’s water customers to recover the costs of the scheme.
Table 5.4 below sets out Sydney Water’s proposed increase in operating costs above those in the draft report.
Table 5.4 Sydney Water’s proposed changes to operating expenditure relative to the draft report ($2011/12, $million)
2012/13 2013/14 2014/15 2015/16 Total
BOO operating costs 6.6 5.0 5.2 4.1 20.9
SDP shutdown charge 1.5 0 0 0 1.5
Rosehill-Camellia recycled water revenue shortfall
2.0 4.0 4.0 4.0 14.0
Total 10.1 9.0 9.2 8.1 36.4
Note: Totals may vary due to rounding.
Source: Sydney Water’s submission on IPART’s draft determination, 13 April 2012, Table 2.5, p 20.
5.3 Stakeholder comments
Most stakeholders did not comment on Sydney Water’s proposed operating expenditure in their submissions. Rather, submissions tended to focus on the size of the proposed price increases or the combined impact of price increases (eg, increases in electricity and water bills).
However, the Total Environment Centre (TEC) commented on the issue of operating expenditure as it related to the operation of the desalination plant. TEC submitted that the costs of maintaining the plant during non-operational periods should be recovered from the general cost of water. It argued that the greater cost of water supplied by desalination could be reflected by an increase in water prices during the operation of the plant. It also argued that no allowance should be made for recovering the operating costs of the plant when supply levels exceed 40%, as it contended that the desalination plant should be switched off when water storage levels reach 40%.72
72 Decisions on the operating rules surrounding SDP are a matter for the NSW Government and
are outside the scope of this price review.

5 Operating expenditure
Review of prices for Sydney Water Corporation’s water, sewerage, stormwater drainage and other servicesIPART 59
5.4 Atkins Cardno’s review
Atkins Cardno assessed Sydney Water’s operating expenditure over the 2008 determination period and its forecast operating expenditure over the 2012 period. It also recommended an efficient level of operating expenditure for the 2012 period.
In assessing the efficiency of the forecast expenditure, Atkins Cardno formed views on the level of increased efficiency Sydney Water could achieve over the 2012 period. Its views on future efficiencies are based on the hypothesis of a ‘frontier company’,73 the continuing efficiencies that it makes through innovation and technological development, and the catch-up efficiency Sydney Water needs to achieve the performance of the frontier company over time.
After the release of Atkins Cardno’s report, Sydney Water provided comments on its recommendations to IPART (which we published on our website). Atkins Cardno’s response to these comments is included below and in Chapter 6.
5.4.1 Past operating expenditure74
Atkins Cardno noted that the 2008 determination set Sydney Water operating efficiency targets of 0.7% per annum, and that its performance over the 2008 period was generally consistent with the determination. Sydney Water also achieved good performance against its service standards, and complied with its Operating Licence.
Atkins Cardno found that Sydney Water’s operating expenditure over the 2008 period was prudent with one exception. It noted that some sewerage expenditure was not flagged in the 2008 determination, and considered that this indicates that there were some shortfalls in the decision processes and implementation associated with that expenditure. It estimated this imprudent expenditure at $7.2 million, and took this expenditure into account when formulating its recommendations on the efficient level of forecast operating expenditure. Atkins Cardno also noted that in reaching this view, it is not questioning the need for the work or the associated expenditure.
73 A frontier company, in this context, is a similar water business which delivers water supply and
sewerage services in the most efficient manner. 74 Note that the main purpose of a review of past operating expenditure is to help ascertain likely
future performance.

5 Operating expenditure
60 IPART Review of prices for Sydney Water Corporation’s water, sewerage, stormwater drainage and other services
Atkins Cardno compared Sydney Water’s current operating expenditure to that forecast in IPART’s 2008 determination. During the determination period, Sydney Water changed its costing methodology from an activity based cost (ABC) approach to a Regulatory Cost Model (RCM) method. The change of methodology for recording costs made it difficult to compare costs forecast in the 2008 determination against actual costs, particularly at a detailed level. Nonetheless, Atkins Cardno found that there was an overall increase in expenditure of $34.3 million above the determination, or $122.6 million above when desalination and bulk water costs are excluded. At the service level it found expenditure on:
Water services was $27.3 million (or -4.2%) lower than we forecast at the 2008 determination. Higher spending in 2008/09 and 2009/10 was more than offset by significantly lower spending in 2010/11 and 2011/12. Sydney Water spent higher than forecast on energy, the Water Savings Fund, materials and lease payments for the MacArthur Water filtration Plant. It spent lower than forecast on BOO plant costs, contracting costs, labour costs and corporate expenses.
Sewerage services was $147.9 million (8.6%) above what we forecast at the 2008 determination, largely due to increases in energy and chemicals costs, the Blue Mountains lease costs, contractors’ costs and labour costs.
Stormwater drainage services was $9.4 million higher than we forecast at the 2008 determination, due mainly to an increase in contractor costs.
Regulated recycled water services was $7.5 million lower than we forecast at the 2008 determination, mainly due to delays in the commissioning of projects.
Bulk water purchase costs was lower than forecast due to lower than expected water demand, and the deferral of costs associated with a later than expected handover of the desalination plant.
5.4.2 Forecast operating expenditure
Atkins Cardno analysed Sydney Water’s forecast operating expenditure for the 2012 determination period. It concluded that Sydney Water could achieve efficiencies in excess of those proposed in its submission, particularly in the latter part of the period. Table 5.5 shows its recommended efficient level of forecast operating expenditure and compares it to Sydney Water’s proposed expenditure.
Table 5.5 Atkins Cardno’s recommended and Sydney Water’s proposed operating expenditure ($2011/12, $million)
2012/13 2013/14 2014/15 2015/16
Sydney Water proposed 1,369.9 1,380.4 1,382.7 1,382.8
Atkins Cardno annual efficiency adjustment 0.0 -6.1 -10.6 -16.1
Atkins Cardno recommended 1,369.9 1,374.3 1,372.1 1,366.7
Note: Totals may vary due to rounding.
Source: Atkins Cardno, Detailed Review of Sydney Water’s Operating and Capital Expenditure, Table 6.9, p 93.

5 Operating expenditure
Review of prices for Sydney Water Corporation’s water, sewerage, stormwater drainage and other servicesIPART 61
Atkins Cardno stated that, while the overall change in Sydney Water’s proposed operating expenditure (compared to the last year of the current determination) is marginal, the underlying increases and reductions are important to understand. Therefore, it performed variance analysis on Sydney Water’s proposed operating expenditure compared to the base year by:
analysing Sydney Water’s proposed variances (compared to the base year of 2011/12) based on whether they relate to factors that Sydney Water either can or cannot control
analysing these variances based on the function they relate to.
It then used findings of these analyses to form its recommendations on the efficiency targets IPART should apply to Sydney Water’s proposed operating expenditure over the determination period.
Variances by uncontrollable and controllable factors
Atkins Cardno found that many of the material variances between Sydney Water’s proposed operating expenditure for the 2012 determination period and allowed expenditure in the base year of 2011/12 are due to factors that are outside of Sydney Water’s control. These include:
higher electricity costs as a result of tariff increases, increased consumption and the introduction of the carbon price, which are partly offset by lower costs due to the cessation of payments to the Climate Change Fund
lower Wastesafe costs because of a shift to using contractors to perform the work
lower plumbing inspection costs due to the transfer of this role to the Office of Fair Trading
higher costs due to some expenses for trunk mains being reclassified as operating rather than capital costs
other higher costs, such as increases in payments to the Blue Mountains Tunnel owners.
However, some of the material variances are due to factors that Sydney Water can control. These include:
lower labour costs equivalent to a 8.3% reduction over the determination period
higher service contract and data management costs of $8.2 million and $4.8 million respectively over the period
lower road restoration costs due to carrying out the work in-house, and
lower vehicle lease and materials costs.

5 Operating expenditure
62 IPART Review of prices for Sydney Water Corporation’s water, sewerage, stormwater drainage and other services
Variances by function
For the purposes of its analysis, Atkins Cardno categorised the variances into 3 functional groups: operations, maintenance and corporate. The operations function includes Sydney Water’s Operations, Customer and Community Relations and Sustainability Divisions. Variances related to these divisions include:
higher Operations Division costs due to increases in electricity costs, partly offset by decreases in labour costs
lower Customer and Community Relations Division costs due to reductions in water demand management activities, and decreases in plumbing inspection, Wastesafe and labour costs
lower Sustainability Division costs due to the cessation of payments to the Climate Change Fund and decreases in labour costs.
The Maintenance function includes the Maintenance, Asset Management and Asset Creation Divisions. Total costs related to this function decrease by 4.2% over the period, mostly due to a 2.4% reduction in Maintenance Division costs. Nearly all this reduction relates to water services because of factors such as a lower level of forecast burst repairs from pressure reductions now in place. In addition, labour costs are forecast to decrease by $9.7 million.
The Corporate function includes the Human Resources and Finance and Regulation Divisions, and covers Corporate Adjustments for the Carbon Tax. The variance related to this function (excluding Corporate Adjustments for the Carbon Tax) is an increase of $11 million over the period. This is mainly due to increases in Corporate Services IT costs.
Atkins Cardno’s recommendations on scope for efficiency gains and recommendations on efficient levels of operating expenditure
Atkins Cardno identified several areas where it considers there is scope for making efficiency gains across Sydney Water’s business. In particular, it noted that:
The current structure of the business of 10 divisions is unwieldy, which leads to duplication of some activities.
There is a lack of effective strategic planning, evident from the apparent lack of robust long- and medium-term business plans.
There is room for reductions in the level of corporate costs.
There is scope for further efficiencies from Sydney Water’s new risk-based approach to maintenance.
There is an opportunity to improve the way that the business is planning its Information Systems. In particular, there should be a clear, rational and comprehensive strategy for the whole business. The justification for significant additional operating expenditure on Information Systems and its timing is not well founded.

5 Operating expenditure
Review of prices for Sydney Water Corporation’s water, sewerage, stormwater drainage and other servicesIPART 63
Based on these findings, and its professional experience and judgement, Atkins Cardno assessed the scope for continuing and catch-up efficiencies Sydney Water can achieve. Continuing efficiency reflects the efficiency that can be gained through innovation and new technologies. Catch-up efficiency reflects the catch-up needed to move from the company’s current position to that of a ‘frontier’ or benchmark utility. This assessment involved comparing Sydney Water’s operational control processes to the current best practice in Australia and England.
It then took account of the efficiency gains Sydney Water has planned in its submission to determine the net scope for efficiency gains. Finally, it recommended what efficiency targets IPART should apply to Sydney Water’s proposed operating expenditure to ensure only efficiency expenditure is recovered through prices.
Overall, Atkins Cardno concluded that although Sydney Water proposes to make significant efficiencies over the 2012 determination period, it can achieve further efficiencies mainly in the latter part of this period. It acknowledges that achieving these additional efficiencies will be challenging, but considers that Sydney Water is in a position to meet this challenge because it has highly experienced professionals who are motivated to deliver.
Atkins Cardno’s findings on the scope for operating efficiency gains and its recommended efficiency adjustments are summarised in Table 5.6 below. Its recommended efficient levels of non-bulk water related operating expenditure are shown in Table 5.7.75
Table 5.6 Atkins Cardno’s findings on scope for operating efficiency gains (%)
2012/13 2013/14 2014/15 2015/16
Continuing efficiency (annual) 0.25 0.25 0.25 0.25
Continuing efficiency (cumulative) 0.25 0.50 0.75 1.00
Catch-up efficiency (annual) 1.50 2.00 2.00 2.00
Total continuing and catch-up (cumulative) 1.75 4.00 6.25 8.50
Sydney Water planned labour efficiency (annual) 1.46 0.47 0.62 0.47
Sydney Water planned other efficiency (annual) 0.31 -0.03 0.31 0.15
Total Sydney Water planned efficiency 1.76 2.21 3.14 3.76
Net scope for efficiency gains -0.01 1.79 3.11 4.74
Sydney Water controllable costs as % of total operating costs (net of bulk water)
38 38 38 38
Recommended efficiency adjustment 0.00 0.7 1.2 1.8
Note: Totals may vary due to rounding. Source: Atkins Cardno, Detailed Review of Sydney Water’s Operating and Capital Expenditure, Table 6.7, p 90.
75 Note that bulk water and desalination water costs are excluded from the efficiency process and
that revenue from the Rosehill Recycled Water Scheme is deducted from the final operating expenditure level in line with the section 16A direction by the NSW Government. The direction is that Sydney Water is to fund the difference between the charges paid to the owner of the Rosehill scheme and revenue received from the sale of recycled water to customers.

5 Operating expenditure
64 IPART Review of prices for Sydney Water Corporation’s water, sewerage, stormwater drainage and other services
Table 5.7 Atkins Cardno’s recommended efficient levels of non-bulk water related operating expenditure ($2011/12, $million)
2011/12 2012/13 2013/14 2014/15 2015/16 Total 2012/13-2015/16
Sydney Water proposed expenditure
1,378.1 1,369.9 1,380.4 1,382.7 1,382.8 5,515.8
Adjustments to remove inconsistencies
Less Rosehill scheme revenue -8.1 -8.2 -8.3 -8.4 -8.5 -33.4
Less bulk water costs -198.8 -203.3 -204.6 -205.6 -206.5 -820.1
Less desalinated water costs -270.4 -270.8 -273.4 -274.9 -272.0 -1,091.1
Net Sydney Water proposed expenditure
900.7 887.5 894.1 893.8 895.7 3,571.2
Atkins Cardno annual efficiency target
0.0 -6.1 -10.6 -16.1 -32.8
Atkins Cardno recommended expenditure
900.7 887.5 887.9 883.2 879.5 3,538.4
Atkins Cardno recommended expenditure by service
Water 326.0 306.2 304.4 301.4 297.9 1,209.9
Sewerage 368.1 378.8 376.9 374.2 371.3 1,501.2
Stormwater drainage 13.1 10.7 12.9 12.7 12.7 49.0
Recycled water 23.0 23.5 23.6 25.2 25.7 98.0
Corporate 178.6 176.5 178.4 178.2 180.4 713.5
Less Rosehill Scheme revenue -8.1 -8.2 -8.3 -8.4 -8.5 -33.4
Atkins Cardno recommended expenditure
900.7 887.5 887.9 883.2 879.5 3,538.1
Note: Totals may vary due to rounding.
Source: Atkins Cardno, Detailed review of Sydney Water’s Operating and Capital Expenditure, Table 6.9, p 93.

5 Operating expenditure
Review of prices for Sydney Water Corporation’s water, sewerage, stormwater drainage and other servicesIPART 65
5.5 IPART’s analysis
In relation to Sydney Water’s non-bulk water related operating costs, we have accepted Atkins Cardno’s findings and recommendations, and annual expenditures shown in Table 5.7 above. We considered the concerns Sydney Water raised in response to these recommendations, particularly that cumulative efficiency target:
…$33 million higher than Sydney Water's own ambitious savings target of $140 million which is built into the pricing submission.
This increased target will be difficult to achieve, but we will critically review operating expenditure to maximise savings. However, Sydney Water will not cut costs to a point where service standards are compromised or where the operating savings do not make sense in total life cycle costs. In essence, we are keen not to reduce costs in the short term where costs to the customer in the longer term will be higher.76
We also considered Atkins Cardno’s response to these concerns:
We agree that the opex efficiency targets are challenging. Our assessment is based on a continuing efficiency of 0.25% per annum, the same as applied by Ofwat in the 2009 Determination. Ofwat had applied catch-up efficiency in a range 0 to 2.9% per annum over and above efficiencies proposed by companies. For comparison, we applied an average 0.75% per annum above efficiencies proposed by Sydney Water. Thus the efficiencies we have applied are within the range of efficiencies applied to England and Wales water agencies. We have taken into account the level of efficiency savings that the Company has proposed so that our efficiency challenge is applied mainly to the latter two years of the price path.77
We recognise that Sydney Water has included significant efficiency gains in its pricing proposal, and that Atkins Cardno’s further efficiency target of $16 million per annum by 2015/16 is challenging. We also note that Sydney Water has already announced structural changes to increase customer satisfaction whilst containing costs. However, we have adopted Atkins Cardno’s recommended operating expenditure efficiency targets as it better represents the industry benchmark in continuous improvement.
In its submission to our draft report, Sydney Water proposed increasing the operating costs for 3 items as set out in Section 5.2.2. These are:
$20.9 million for increased BOO filtration costs
$1.5 million for an SDP shutdown charge
$14.0 million to offset reduced revenue from the Rosehill-Camellia recycled water scheme.
76 Sydney Water letter to IPART 11 January 2012. 77 Atkins Cardno letter to IPART, 14 February 2012.

5 Operating expenditure
66 IPART Review of prices for Sydney Water Corporation’s water, sewerage, stormwater drainage and other services
In its detailed submission in September 2011, Sydney Water based its costs and prices on the assumption that SDP would be operating at 100% of production capacity for the whole of the period. As we have based our prices on SDP being in water security mode and therefore not producing water, we consider that Sydney Water’s request for increased operating costs to reflect the additional BOO filtration cost that it will face when SDP is not operating is reasonable.
We also accept Sydney Water’s argument that one of the major foundation customers, the Shell Refinery, is likely to withdraw from the scheme in 2013. The loss of this revenue means that more revenue needs to be collected from Sydney Water’s water customers to recover the costs of the scheme.
With respect to Sydney Water’s request for an SDP shutdown charge, our draft determination included an SDP cost pass-through mechanism. This mechanism allows all additional SDP-related costs above those in water security mode to be recovered from customers. This includes any one-off shutdown charges. As such, we consider that no allowance for this charge should be included in the operating costs.
In respect to trade waste costs, Sydney Water proposed in its original submission that its trade waste tariffs be reformed. This proposal included a significant reduction in the revenue and costs associated with its Wastesafe program from 1 July 2012. In our draft report and determination, we included the costs and revenue as proposed by Sydney Water as an interim measure. In January and April, we held stakeholder workshops regarding trade waste tariffs and Sydney Water’s proposed reforms. Having considered the issues raised, Sydney Water agreed to delay the introduction of the new Wastesafe program to 1 July 2013. We consider that this delay is appropriate given the impact on the industry and customers. To allow for this, we have included an extra $7.4 million in the first year of the determination to reflect the costs above those included in the draft report. These extra operating costs are covered through Wastesafe charges and are not borne by Sydney Water’s general sewerage customer base. Trade Waste tariffs are discussed in detail in Section 9.7.
Our finding on Sydney Water’s non-bulk water related operating expenditure over the 2012 determination period is shown in Table 5.8 below.

5 Operating expenditure
Review of prices for Sydney Water Corporation’s water, sewerage, stormwater drainage and other servicesIPART 67
Table 5.8 Finding on non-bulk water related operating expenditure ($million, 2011/12)
2012/13 2013/14 2014/15 2015/16 Total
Draft Report
Water (excluding bulk water purchases) 377 376 374 371 1,498
Sewerage 496 495 493 491 1,975
Stormwater drainage 14 17 17 17 65
Total 888 888 883 880 3,538
Final Report
Water (excluding bulk water purchases) 387 385 383 380 1,535
Sewerage 503 495 493 491 1,982
Stormwater drainage 14 17 17 17 65
Total 904 897 893 888 3,583
Note: Totals may vary due to rounding.
In relation to bulk water purchase costs, Sydney Water will source most of its bulk water from SCA. We are determining SCA’s prices it will charge Sydney Water concurrently with this review. We have decided to allow Sydney Water the bulk water costs of sourcing its forecast amount of water usage from SCA. We have allowed Sydney Water to recover the cost of all SCA water charges in accordance with SCA’s determination.
Sydney Water may also be required to source some desalinated water from SDP. However, given current dam levels and the operating rules set out in the Metropolitan Water Plan, we have set our prices on the basis that SDP is in a water security shutdown mode for the duration of the determination. If the SDP does operate in a different mode, this will increase the costs to Sydney Water above the level included in Sydney Water’s prices. Therefore, we have decided to allow the net incremental costs associated with SDP being in a different mode of operation to be passed through to customers in prices in the following year of the determination period.
Our finding on Sydney Water’s bulk water purchase costs is shown in Table 5.9 below.

5 Operating expenditure
68 IPART Review of prices for Sydney Water Corporation’s water, sewerage, stormwater drainage and other services
Table 5.9 Finding on Sydney Water’s bulk water purchase costs ($million, 2011/12)
2012/13 2013/14 2014/15 2015/16 Total
Draft report
SCA 193 193 193 194 773
SDP 188 185 183 180 735
Total 381 378 377 373 1,508
Final report
SCA 192 194 195 196 776
SDP 188 185 183 179 735
Total 379 379 378 375 1,511
Note: Totals may vary due to rounding.
6 Capital expenditure
Review of prices for Sydney Water Corporation’s water, sewerage, stormwater drainage and other servicesIPART 69
6 Capital expenditure
Together, the allowances for a return on assets and regulatory depreciation make up around 43% of Sydney Water’s total notional revenue requirement over the 2012 determination period, and so have a significant impact on prices. To calculate these allowances we took the following steps:
assessed Sydney Water’s past capital expenditure over the 2008 determination period to decide whether it was prudent and should therefore be incorporated into the opening value of Sydney Water’s Regulatory Asset Base (RAB)
assessed Sydney Water’s forecast capital expenditure to determine whether it is efficient and should therefore be included when rolling forward the RAB
calculated the annual value for the RAB over the determination period, taking into account our decisions on past and forecast capital expenditure and making other adjustments as necessary
calculated the allowance for a return on assets by deciding on an appropriate rate of return for Sydney Water, and multiplying the annual value of the RAB by this rate
calculated the allowance for depreciation by deciding on an appropriate depreciation method and asset lives for Sydney Water’s existing and new assets.
To assist us in assessing Sydney Water’s capital expenditure, we engaged a consultant, Atkins Cardno, to conduct a detailed review of Sydney Water’s past and future capital programs. References to Atkins Cardno’s findings and recommendations in this chapter are drawn from its final report, Detailed Review of Sydney Water Corporation’s Operating and Capital Expenditure, November 2011, and have been updated to reflect the arithmetical corrections it provided after this report was released.78
The sections below provide an overview of our decisions on the allowances for a return on assets and depreciation, and then discuss each of the above steps in detail.
78 Atkins Cardno Response to IPART Tribunal request for comments on the Sydney Water
Corporation letter dated 11th January 2012, 14 February, 2012.

6 Capital expenditure
70 IPART Review of prices for Sydney Water Corporation’s water, sewerage, stormwater drainage and other services
6.1 Summary of IPART’s decisions
Decisions
11 IPART’s decisions on the allowances for a return on assets and depreciation, and the key inputs that gave rise to these findings are as shown in Table 6.1 and Table 6.2.
Table 6.1 Decision on Sydney Water’s past efficient and prudent capital expenditure ($million, 2011/12)
2008/09 2009/10 2010/11 2011/12 Total
Past capital expenditure 906 857 612 664 3,040
Table 6.2 Decisions on Sydney Water’s forecast capital expenditure, RAB, WACC, allowance for a return on capital and depreciation ($million, 2011/12)
2012/13 2013/14 2014/15 2015/16
Forecast capital expenditure 692.0 703.1 618.1 540.1
Value of RAB at 30 June 13,421 13,876 14,242 14,525
Rate of return (WACC) 5.6% 5.6% 5.6% 5.6%
Allowance for return on assets 725.3 750.1 772.8 790.8
Allowance for regulatory depreciation 213.1 226.6 239.4 250.3
These allowances reflect our decisions to:
allow for $40.5 million (or 1.4%) less in past capital expenditure than Sydney Water proposed, to reflect our view that this expenditure was not efficient and prudent
allow for $468.1 million (or 15.6%) less in forecast capital expenditure than Sydney Water proposed, to reflect our view of the scope for efficiency improvements and the rephasing of some expenditure
calculate the allowance for a return on assets using a rate of return of 5.6%, to reflect our view of the real post-tax weighted average cost of capital (WACC) for Sydney Water
calculate the allowance for regulatory depreciation using straight line deprecation and the asset lives Sydney Water proposed.
In reaching the findings, we had regard to the NSW Government’s submission to this review79, which urged us to carefully consider the necessity and prudence of Sydney Water’s capital expenditure. We also had regard to the overall finding of Atkins Cardno’s review of Sydney Water’s operating and capital expenditure, which was that there is little evidence of Sydney Water having a comprehensive long-term investment plan or a long-term business plan.
79 NSW Government Submission to IPART, Review of Sydney Water’s Water, Wastewater and
Stormwater Prices, November 2011.

6 Capital expenditure
Review of prices for Sydney Water Corporation’s water, sewerage, stormwater drainage and other servicesIPART 71
We consider that our findings on the allowances for a return on assets and regulatory depreciation will ensure that Sydney Water only earns a return on capital expenditure that was efficient and prudent (ie, in the circumstances existing at the time, the decision to invest in an asset is one that Sydney Water, acting prudently, would be expected to make).
6.2 Assessing Sydney Water’s past capital expenditure
To assess the prudence and efficiency of Sydney Water’s past capital expenditure over the 2008 determination period, we considered Sydney Water’s submission80 and Atkins Cardno’s findings and recommendations on this capital expenditure, and conducted our own analysis.
6.2.1 Sydney Water’s submission on past capital expenditure
Table 6.3 shows Sydney Water’s actual capital expenditure over the 2008 period, and compares it to the amounts we allowed for in making the 2008 determination. It indicates that in some areas, Sydney Water’s expenditures were the same or similar to the amounts allowed and in others there were significant differences. In particular, there was significantly more expenditure on property and IT than we included in our 2008 determination and significantly less expenditure on drainage and sewerage assets.
Table 6.3 Sydney Water’s cumulative capital expenditure 2008/09 to 2011/12 ($million, nominal)
Allowed Actual Difference % Diff.
Water 865 853 -12 -1.4%
Sewerage 1,528 1,401 -127 -8.3%
Drainage/stormwater 52 14 -38 -73.1%
Recycled Water 185 176 -8 -4.3%
Property 79 224 144 182.3%
IT 142 260 118 83.1%
Other 50 50 0 0%
Total 2,901 2,978 77 2.7%
Source: Sydney Water’s submission to IPART’s review of Prices for Sydney Water Corporation’s water, sewerage, stormwater and other services, September 2011 and 2010/11 Annual Information Return (AIR).
Note: Totals may vary due to rounding. Excludes capital expenditure on Sydney desalination plant.
80 Sydney Water’s submission to IPART’s review of Prices for Sydney Water Corporation’s water,
sewerage, stormwater and other services, September 2011.

6 Capital expenditure
72 IPART Review of prices for Sydney Water Corporation’s water, sewerage, stormwater drainage and other services
In its submission, Sydney Water argues that:
Its lower capital expenditure than allowed for in water and sewerage was due to lower than expected growth, which meant that investments were not needed in the time previously forecast.
Its higher capital expenditure than allowed for in property was the result of delayed delivery of projects from the previous determination period and $118 million on the purchase of land and easements acquired in the course of Sydney Water’s ordinary business.
Its lower capital expenditure than allowed for in stormwater was due to a detailed condition assessment that found that the assets were in better condition than previously assumed. It found that of the 75% of conduits assessed, 80% of them were found to be in good condition.
The higher IT expenditure was the result of the need to replace several core systems after a period of significant under investment, and the need for several IT investments that emerged during the period. These were not planned for in Sydney Water’s submission to the 2008 review.
Sydney Water also sought to include $21.6 million of avoided costs arising from the Rouse Hill recycled water scheme be included in the water and sewerage regulatory asset bases. Our decisions on avoided costs are set out in Chapter 9.
6.2.2 Atkins Cardno’s review of the prudence of Sydney Water’s past capital expenditure
In assessing the prudence and efficiency of Sydney Water’s past capital expenditure, Atkins Cardno recommended $40.5m of this expenditure be excluded from the RAB. This included:
$18 million of IT expenditure which Atkins Cardno found not prudent. This finding was based on Atkins Cardno’s review of Sydney Water’s Maximo and CMS systems. It found that:
…there was a lack of good planning to scope out the work, the impact on other systems and quantify the risks. This has impacted significantly on the cost and timing of the projects81.
$14.1 million of expenditure on the Priority Sewerage Program (PSP) projects, including spending on stage 2 of the Freemans Reach, Glossodia and Wilberforce sewerage scheme. Atkins Cardno considered that Sydney Water had prematurely excluded options for consideration. Atkins Cardno found that Sydney Water may have given undue weight to the concerns of customers and stakeholders at the expense of the wider customer base who are liable for paying for the assets.
81 WS Atkins and Cardno, Final Report Detailed Review of Sydney Water Corporation’s Operating and
Capital Expenditure, November 2011, p 137.

6 Capital expenditure
Review of prices for Sydney Water Corporation’s water, sewerage, stormwater drainage and other servicesIPART 73
$2.4 million expenditure on the meter replacement program, based on its concerns about the efficiency of a procurement contract which placed all the risk for non-standard installations onto Sydney Water.
$6 million in property expenditure which Atkins Cardno found did not fully meet the prudence definition because of the lack of an up to date property strategy which clearly sets out the company’s plans and objectives.
6.2.3 IPART’s analysis of Sydney Water’s past capital expenditure
After considering Sydney Water’s submission and Atkins Cardno’s report, we decided to accept Atkins Cardno’s recommendations to exclude $40.5 million of Sydney Water’s past expenditure. We are concerned at the significant expenditure on IT and property over the 2008 determination period. Our 2008 determination forecast efficient IT expenditure at $142 million to 2012. Sydney Water’s submission shows that the actual capital expenditure was $260 million over the same period. For property-related capital expenditure, the difference between our 2008 forecast and the actual expenditure was even greater, $79 million and $224 million respectively.
While we recognise that capital programs need to be flexible, we share Atkins Cardno’s concerns regarding whether the planning and strategy for both IT and property capital expenditure was robust enough to ensure prudent and efficient expenditure.
In addition to Atkins Cardno’s recommendations, we decided to exclude a further $23.5m to take into account the actual capital expenditure paid by Sydney Water under Developer Commercial Agreements (DCA).
In 2008/09, Sydney Water put in place the DCA framework which allows developers to develop land without having to wait for Sydney Water to build the necessary water-related assets. Sydney Water purchases the relevant assets from developers in line with take-up of lots by customers.
When a DCA is entered into between Sydney Water and a developer, all assets are transferred to Sydney Water's books. However, Sydney Water’s payment to the developers may not occur for some time. Based on current experience, Sydney Water has spread the payments of each DCA over 5 years to approximate when actual payment may occur.
The past and future capital expenditure in Sydney Water’s submission and 2010/11 Annual Information Return (AIR) is based on the assets transferred to Sydney Water’s books. For pricing purposes, we have adjusted both the past and forecast capital expenditure to reflect the actual annual amounts paid by Sydney Water under the DCAs. We consider that this is a more accurate reflection of Sydney Water’s expenditure on those capital items. In our 2008 determination, Sydney Water had not implemented its DCA process and so we did not take these adjustments into account in setting prices for the 2008 period.

6 Capital expenditure
74 IPART Review of prices for Sydney Water Corporation’s water, sewerage, stormwater drainage and other services
Sydney Water proposed its capital expenditure associated with the Rouse Hill recycled water scheme should be considered avoided costs for water and sewerage. Avoided costs are recovered by water and sewerage customers. Our decision is to award $20.1 million of avoided costs.
Decision
12 IPART’s decision is that past capital expenditure shown in Table 6.4 was prudent and efficient and should be incorporated in the opening value of Sydney Water’s RAB.
Table 6.4 Decision on Sydney Water’s past efficient and prudent capital expenditure ($million, 2011/12)
2008/09 2009/10 2010/11 2011/12 Total
Sydney Water actual 941 858 627 679 3,105
Atkins Cardno’s recommended adjustments
IT expenditure -4.5 -3.5 -6.5 -3.5 -18.0
Meters expenditure 0.0 0.0 -1.2 -1.2 -2.4
PSP projects -2.7 -5.1 -3.3 -3.0 -14.1
Property -2.4 -1.5 -0.9 -1.2 -6.0
Total adjustments -9.6 -10.1 -11.9 -8.9 -40.5
Atkins’ recommended total 931 848 615 670 3,064
IPART’s additional adjustments
Developer Commercial Agreement adjustment
-24.5 9.9 -2.5 -6.1 -23.5
IPART’s decision 906 857 612 664 3,040
Note: Totals may vary due to rounding.
Sydney Water also proposes $21.6 million of its capital expenditure from expanding the Rouse Hill recycled water scheme should be considered avoided costs for water and sewerage. Avoided costs are recovered by water and sewerage customers. Our draft decision was to not award any avoided costs. On the basis of evidence provided at that time, we were not adequately convinced that the Rouse Hill recycled water scheme had been robustly ring-fenced.
In a letter to IPART, Sydney Water has subsequently provided further information regarding its process for ring-fencing Rouse Hill recycled water costs.82 In light of this, we reviewed the available data and information and our assessment is that there is enough evidence to award avoided costs. However, our assessment is that Sydney Water’s proposed avoided costs of $21.6 million have been incorrectly calculated. Our analysis suggests the correct figure to be awarded is $20.1 million.
This decision is discussed in more detail in section 9.6.
82 Sydney Water letter to IPART on outstanding issues from Sydney Water’s draft determination,
4 May 2012.
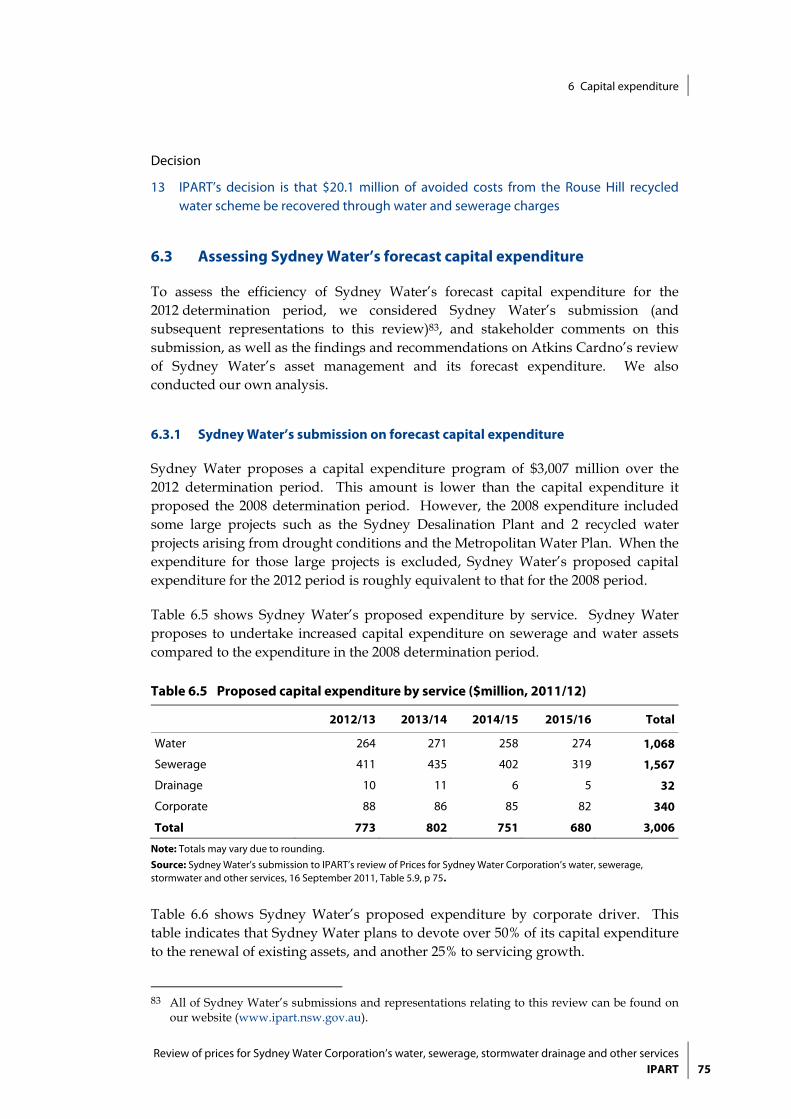
6 Capital expenditure
Review of prices for Sydney Water Corporation’s water, sewerage, stormwater drainage and other servicesIPART 75
Decision
13 IPART’s decision is that $20.1 million of avoided costs from the Rouse Hill recycled water scheme be recovered through water and sewerage charges
6.3 Assessing Sydney Water’s forecast capital expenditure
To assess the efficiency of Sydney Water’s forecast capital expenditure for the 2012 determination period, we considered Sydney Water’s submission (and subsequent representations to this review)83, and stakeholder comments on this submission, as well as the findings and recommendations on Atkins Cardno’s review of Sydney Water’s asset management and its forecast expenditure. We also conducted our own analysis.
6.3.1 Sydney Water’s submission on forecast capital expenditure
Sydney Water proposes a capital expenditure program of $3,007 million over the 2012 determination period. This amount is lower than the capital expenditure it proposed the 2008 determination period. However, the 2008 expenditure included some large projects such as the Sydney Desalination Plant and 2 recycled water projects arising from drought conditions and the Metropolitan Water Plan. When the expenditure for those large projects is excluded, Sydney Water’s proposed capital expenditure for the 2012 period is roughly equivalent to that for the 2008 period.
Table 6.5 shows Sydney Water’s proposed expenditure by service. Sydney Water proposes to undertake increased capital expenditure on sewerage and water assets compared to the expenditure in the 2008 determination period.
Table 6.5 Proposed capital expenditure by service ($million, 2011/12)
2012/13 2013/14 2014/15 2015/16 Total
Water 264 271 258 274 1,068
Sewerage 411 435 402 319 1,567
Drainage 10 11 6 5 32
Corporate 88 86 85 82 340
Total 773 802 751 680 3,006
Note: Totals may vary due to rounding.
Source: Sydney Water’s submission to IPART’s review of Prices for Sydney Water Corporation’s water, sewerage, stormwater and other services, 16 September 2011, Table 5.9, p 75.
Table 6.6 shows Sydney Water’s proposed expenditure by corporate driver. This table indicates that Sydney Water plans to devote over 50% of its capital expenditure to the renewal of existing assets, and another 25% to servicing growth.
83 All of Sydney Water’s submissions and representations relating to this review can be found on
our website (www.ipart.nsw.gov.au).

6 Capital expenditure
76 IPART Review of prices for Sydney Water Corporation’s water, sewerage, stormwater drainage and other services
Table 6.6 Proposed capital expenditure by driver ($million, 2011/12)
2012/13 2013/14 2014/15 2015/16 Total
Business efficiency 35 33 29 29 126
Existing standards 415 420 440 382 1,657
Growth 176 194 204 200 774
New standards 74 84 30 45 233
Government programs 73 71 48 24 217
Total 773 802 751 680 3,006
Note: Totals may vary due to rounding.
Source: Sydney Water’s submission to IPART’s review of Prices for Sydney Water Corporation’s water, sewerage, stormwater and other services, 16 September 2011, Table 5.10, p 75.
In its submission,84 Sydney Water indicates that its proposed capital program includes:
$740 million on renewing and maintaining existing water supply infrastructure
$328 million on water infrastructure to service growth
$390 million on renewing and maintaining sewerage network assets including pipes and pumping stations
$420 million on sewerage infrastructure to service growth
$263 million on sewerage overflow abatement to comply with its Environmental Protection Licences
$231 million upgrading and renewing its sewerage treatment plants
$215 million on the Priority Sewerage Program
$32 million on stormwater drainage infrastructure renewals and to service growth
$204 million on IT renewals and new projects.
6.3.2 Stakeholder comments
In its submission, the NSW Government stated that it may be possible for Sydney Water to defer some of its proposed capital expenditure related to discretionary standards, where this wouldn’t impact negatively on the protection of public health or the environment. It also stated:
It is also important to ensure that all the proposed growth-related capital expenditure is in fact needed over the coming price path. Any reasonable deferral of growth-related capital expenditure into future price periods will lead to a reduction in revenue requirements and this in turn will mitigate impacts on prices.85
84 Sydney Water’s submission to IPART’s review of Prices for Sydney Water Corporation’s water,
sewerage, stormwater and other services, 16 September 2011. 85 NSW Government submission to IPART’s Review of Sydney Water’s Water, Wastewater and
Stormwater Prices, October 2011.

6 Capital expenditure
Review of prices for Sydney Water Corporation’s water, sewerage, stormwater drainage and other servicesIPART 77
We did not receive other submissions about Sydney Water’s proposed capital expenditure program.
6.3.3 Atkins Cardno review of Sydney Water’s asset management
Atkins Cardno undertook a detailed review of Sydney Water’s performance against the asset management obligations in its operating licence. Atkins Cardno found that Sydney Water’s management practices, systems and documentation are well developed, and have been refined over many years. The organisation has shown a comprehensive understanding of asset management, and commitment to continuous improvement.86
Atkins Cardno also found that there has been a significant improvement in Sydney Water’s planning systems and processes over the past 6 years. However, it highlighted a number of issues including:
limited evidence of a structured business plan approach
a long-term investment strategy that is not comprehensive
potentially higher costs than necessary from over-servicing and a conservative approach to risk assessment, and
an inadequate IT and property investment strategy.
Atkins Cardno stated:
We consider effective long term investment plans and a more rigorous business plan process would deliver efficiencies both in capital and operating expenditure in the medium and long term.87
These planning and investment process issues were a contributing factor in Atkins Cardno recommending that a portion of Sydney Water’s past capital expenditure be excluded from the RAB (discussed in section 6.2 above), and that the forecast capital expenditure allowed for in the 2012 determination period be less than Sydney Water proposed (discussed below).
86 IPART, Sydney Water Corporation Operational Audit 2010/11 - Report to the Minister, November
2011, Appendix B, p 5. 87 WS Atkins and Cardno, Final Report Detailed Review of Sydney Water Corporation’s Operating and
Capital Expenditure, November 2011, p 14.

6 Capital expenditure
78 IPART Review of prices for Sydney Water Corporation’s water, sewerage, stormwater drainage and other services
6.3.4 Atkins Cardno’s review of Sydney Water’s forecast capital expenditure
Atkins Cardno recommended that we allow for significantly lower capital expenditure over the 2012 determination than Sydney Water proposed. In total, Atkins Cardno recommended that Sydney Water’s proposed capital expenditure be reduced by $468 million (or 15.6%) as follows:
Timing of outputs: Atkins Cardno recommended that $179 million of Sydney Water’s proposed capital expenditure be deferred (or 'rephased’) to beyond 2016. All of this rephased expenditure comes from Sydney Water’s programs for renewing existing water and sewerage infrastructure. The consultant’s recommended reduction is not a reduction in existing capital expenditure. Instead, it defers some of Sydney Water’s proposed expenditure into the next price path. Sydney Water has proposed a large expenditure increase from the first year of the new determination in a number of these renewal programs. Rather than adopting a step approach in the first year, Atkins Cardno recommend that a more realistic and achievable timeframe would be a steady increase across the next 4 years and into the next determination period.
Growth reprofiling: Atkins Cardno recommends reducing the total expenditure driven by growth by $97 million. This is based on uncertainty regarding the levels of growth and the potential for deferring some of the annual expenditure into the following year.
Corporate expenditure: Atkins Cardno recommended reducing expenditure for IT by $30 million and expenditure for the meter replacement program by $8 million. It was not satisfied that Sydney Water’s proposed expenditure on these items could be justified. It found that Sydney Water did not demonstrate clearly a link between the expenditure’s effect on overall efficiency and customer service targets. Atkins Cardno recommended disallowing the proposed expenditure on the remote meter reading project. It also recommended reducing the number of meter replacements by 25,500 over the new determination period.
Capital efficiency: Atkins Cardno concluded that Sydney Water can be more efficient with the way it plans and delivers its capital works program. Over the 4 years of the new determination period, Atkins Cardno estimates that Sydney Water could save $143 million through efficiency improvements.
Following Atkins Cardno issuing its Final Report, Sydney Water wrote to IPART requesting that around $285 million of capital expenditure reductions recommended by Atkins Cardno be reinstated.88 Sydney Water argued that:
Atkins Cardno’s recommended capital expenditure deferral on programs for renewing or improving Sydney Water’s existing assets would lead to lower service standards including more main breaks and a greater number of sewage overflows. Sydney Water requested that $146 million of Atkins Cardno’s recommended $184 million reduction on Sydney Water’s proposed expenditure be restored.
88 Sydney Water Letter to IPART, 11 January 2012.

6 Capital expenditure
Review of prices for Sydney Water Corporation’s water, sewerage, stormwater drainage and other servicesIPART 79
Atkins Cardno’s recommended $97 million deferral of growth related capital expenditure was unreasonable as growth was outside of Sydney Water’s control. Sydney Water requested all proposed capital expenditure on growth be restored.
Atkins Cardno’s recommended efficiency saving of $26 million on the Priority Sewerage Program (PSP) should be reinstated. Sydney Water argues that the forecast capital expenditure per lot on the future PSP is significantly lower than Stage 2 of the program and this represents an efficiency gain.
We asked Atkins Cardno to assess Sydney Water’s arguments regarding its requests for the above forecast capital expenditure to be reinstated. Atkins Cardno found that:89
The recommended deferral of $179 million capital expenditure on renewing and improving Sydney Water’s assets would not impact on Sydney Water’s system performance over the 4 years of the 2012 Determination period. Its recommended capital expenditure on these programs is still a real increase above what Sydney Water spent over the 2008 Determination.
The recommended deferral of some of Sydney Water’s proposed expenditure for growth was based on the inherent uncertainty surrounding growth projections. It also points out that Sydney Water spent considerably less on growth in the 2008 Determination than what was forecast at that time, and redirected that expenditure to other areas.
The recommended $26 million reduction for the PSP be maintained. It assessed that there were a number of further improvements in the planning and construction process of this program that would potentially reduce the costs of PSP.
6.3.5 IPART’s analysis of Sydney Water’s forecast capital expenditure
After considering Sydney Water’s submission, the NSW Government’s comments and Atkins Cardno’s findings and recommendations, our decision is that Sydney Water’s forecast efficient capital expenditure over the 2012 determination period is $2,553 million. This is $468.1 million (15.6%) less than Sydney Water proposes.
In reaching this decision, we accepted Atkins Cardno’s recommendations on the efficiency of Sydney Water’s proposed capital expenditure over the 2012 determination period. Atkins Cardno’s review process involved detailed analysis and scrutiny of Sydney Water’s asset management and forecast expenditure. We are satisfied that the conclusions and findings from that process are sound and that there is sufficient evidence to use Atkins Cardno’s recommended reductions in expenditure as the basis for determining Sydney Water’s levels of forecast capital expenditure.
89 Atkins Cardno Response to IPART Tribunal request for comments on the Sydney Water
Corporation letter dated 11 January 2012, 14 February, 2012.

6 Capital expenditure
80 IPART Review of prices for Sydney Water Corporation’s water, sewerage, stormwater drainage and other services
In line with Atkins Cardno’s recommendations, we expect Sydney Water to be able to make significant savings by:
deferring some of its expenditure on renewing existing assets ($179 million) and providing new assets to growth areas ($97 million)
spending less on IT and customer meters ($38 million)
being more efficient in planning and executing its overall capital works program ($143 million).
In addition, using Atkins Cardno’s recommendations as a basis, we have decided to:
increase the level of forecast capital expenditure by $10.3 million to take account of the DCA process (discussed in section 6.2.3)
The level of forecast capital expenditure is $16.2 million higher than in our draft report. This is a result of our assessment of Sydney Water’s forecast capital expenditure on stormwater drainage assets.
In the 2008 determination, we forecast Sydney Water’s stormwater drainage capital expenditure over the 4 years to 2012 would be $35 million (excluding land purchases associated with the Rouse Hill Development Area). Sydney Water’s submission to the 2012 review shows that the actual expenditure over this period was $14 million (a difference of -60%). Sydney Water explains this $21 million variance in its submission:
Detailed condition assessments have shown that the [drainage] assets are in better condition than previously assumed. This has meant that significant expenditure could be deferred.90
In our draft report, we considered that Sydney Water had not made a solid case for an increase in drainage capital expenditure above the actual expenditure over the 2008 determination period - particularly given its statement that $21 million less expenditure than we allowed for at the 2008 determination was prudent given the current asset condition. As a result, our draft report allowed for $15 million in stormwater drainage capital expenditure, based on Sydney Water’s actual capital expenditure on this service over the 2008 determination period. After applying the DCA adjustment of -$5.6 million, the total forecast capital expenditure in the draft report was $9.4 million for drainage over the period 2012/13 to 2015/16.
90 Sydney Water’s submission to IPART’s review of Prices for Sydney Water Corporation’s water,
sewerage, stormwater and other services, September 2011, p 68.

6 Capital expenditure
Review of prices for Sydney Water Corporation’s water, sewerage, stormwater drainage and other servicesIPART 81
In its submission to our draft report and determination91 and again in further correspondence92, Sydney Water argued that its proposed stormwater drainage capital program was based on sound business cases. It also provided further evidence of the condition assessments of its assets and the need to undertake this capital expenditure to maintain service standards. Importantly it has made a commitment to achieve the outputs in areas where it previously underspent.
After reviewing our draft decision and Sydney Water’s arguments, we have decided to set prices based on Atkins Cardno’s recommended level of capital expenditure of $31.2 million. With DCA adjustments, this means that the allowed level of stormwater drainage capital expenditure over the 2012 determination period is $25.5 million.
Decision
14 IPART’s decision is that the forecast capital expenditure shown in Table 6.7 is efficient and should be included when rolling forward the RAB in this determination period.
91 Sydney Water’s submission on IPART’s draft determination, 13 April 2012, p 16. 92 Sydney Water letter to IPART on outstanding issues from Sydney Water’s draft determination,
4 May 2012.

6 Capital expenditure
82 IPART Review of prices for Sydney Water Corporation’s water, sewerage, stormwater drainage and other services
Table 6.7 Decision on level of Sydney Water’s efficient and prudent forecast capital expenditure ($million, 2011/12)
Sydney Water forecast
2012/13 2013/14 2014/15 2015/16 Total
Water 264 271 258 274 1,068
Sewerage 411 435 402 319 1,567
Drainage 10 11 6 5 32
Corporate 88 87 85 82 340
Total 773 803 751 680 3,007
Atkins’ recommended
Water 217 228 204 206 854
Sewerage 383 391 332 260 1,365
Drainage 10 11 6 4 31
Corporate 78 72 66 66 288
Total 688 701 613 536 2,538
IPART’s draft decision
Water 220.5 232.8 207.6 209.8 870.7
Sewerage 377.8 389.3 330.8 258.2 1,356.1
Drainage 4.0 3.4 1.6 0.6 9.4
Corporate 84.6 72.0 75.2 69.2 300.9
Total 686.9 697.6 614.9 537.8 2537.1
IPART’s final decision
Water 220.5 232.8 207.6 209.8 870.7
Sewerage 377.8 389.3 330.8 258.2 1,356.1
Drainage 9.1 9.0 4.5 2.9 25.5
Corporate 84.6 72.0 75.2 69.2 300.9
Total 692.0 703.1 618.1 540.1 2,553.3
Note: Totals may vary due to rounding.
Source: IPART analysis.
We note that Sydney Water is willing to defer recovery of any “second round” cost increase in capital expenditure as a result of the impact of the carbon price mechanism on the general economy. In the next determination, we will examine actual expenditure including actual carbon related increases to allow any efficient costs to be included in the RAB roll forward from 1 July 2012.

6 Capital expenditure
Review of prices for Sydney Water Corporation’s water, sewerage, stormwater drainage and other servicesIPART 83
6.4 Calculating the annual value of the RAB over the determination period
To determine both the allowance for a return on assets and the allowance for regulatory depreciation, we must calculate the value of Sydney Water’s RAB in each year of the determination period93. We established the methodologies for calculating the value of the RAB at the start of the determination period (the opening value of the RAB), and for rolling forward the RAB to the end of the determination period. We then made some further adjustments. The sections below outline these methodologies and adjustments, and the resulting RAB values.
6.4.1 Methodologies for establishing opening value of the RAB and rolling forward the RAB
To establish the opening value of Sydney Water’s RAB (ie, as at 1 July 2012), we:
rolled forward the 1 July 2008 RAB to 30 June 2012 by including the actual capital expenditure over this period we found to be prudent94 (as discussed in section 6.1 above)
made other necessary adjustments, including
– deducting any actual capital contributions from the RAB
– deducting regulatory depreciation as allowed for in the 2008 determination95
– deducting actual asset disposals for 2008/09 to 2010/11 and estimated disposals for 2011/12
– adding avoided costs from the Rouse Hill recycled water scheme
indexed the annual closing RAB for actual/forecast inflation. In making this calculation, we assumed that half the capital expenditure and disposals occurred at the beginning of the year (and therefore receive a full year of indexation), while the other half occurred at the end of the period (and therefore is not indexed).
93 These methodologies are explained more fully in Chapter 4. 94 Given that actual expenditure for 2011/12 is not fully known at the time of the Determination,
we have used the estimated expenditure for this year. This estimate has been assessed by us as part of the review and adjusted where appropriate. At the next review, the RAB will be adjusted to reflect the difference between this estimate and actual expenditure for 2011/12.
95 Regulatory depreciation refers to the depreciation amounts allowed for in the 2008 Determination. We use regulatory depreciation, rather than actual depreciation, because the impact of any over/under-expenditure of capital expenditure during the determination period is limited to the return it earns on its expenditure. This provides agencies with an incentive not to overestimate their forecast expenditure at price reviews.

6 Capital expenditure
84 IPART Review of prices for Sydney Water Corporation’s water, sewerage, stormwater drainage and other services
To roll forward the RAB to the end of the 2012 determination period (ie, 30 June 2016), we:
added the forecast capital expenditure we found to be efficient (as discussed in section 6.1 above) to the closing value of the RAB for the previous year
made other necessary adjustments to the value of the RAB for each year, including
– deducting regulatory depreciation
– deducting forecast disposals of assets.
Both methodologies are the same as those we used in making the 2008 determination.
6.4.2 Further adjustments to the RAB
After applying the above methodologies, we made some further adjustments to the value of the RAB, including adjustments to account for past and forecast capital contributions, past and forecast disposal of assets and regulatory depreciation.
Adjustments for capital contributions
For water utilities, ‘capital contributions’ generally refer to revenue received from developer charges or government grants. Sydney Water did receive some revenue from developer charges over the period 2007/08 to 2009/10. Therefore, we made adjustments to the RAB account for these capital contributions.
Adjustments for disposal of assets
We made a $51.3 million adjustment to the RAB to account for asset disposals over the period 2012/13 to 2015/16. This is the same amount as submitted by Sydney Water and part of our normal practice.
Adjustments for regulatory depreciation
The RAB is adjusted each year to account for regulatory depreciation. To determine the opening value of Sydney Water’s RAB at 1 July 2012, we deducted the allowance for regulatory depreciation it included in making the 2008 determination. To calculate future regulatory depreciation to be deducted from the RAB (to roll forward the RAB to the end of the 2012 determination period) we have used the straight-line depreciation method. The amounts deducted are shown on Table 6.8 below.

6 Capital expenditure
Review of prices for Sydney Water Corporation’s water, sewerage, stormwater drainage and other servicesIPART 85
Other adjustments
We have adjusted the sewerage RAB by $6.26m to reflect the capital expenditure (excluding land purchases) for stormwater and drainage at Rouse Hill Development Area over the period 2012/13 to 2015/16. This reflects our assessment that the capital expenditure on drainage related civil works in the Rouse Hill Development Area improves the quality of water discharged into the Hawkesbury-Nepean river system. This water quality improvement benefits all residents of the Sydney basin and under the beneficiary pays principle, all Sydney Water’s sewerage customers should share the associated costs. This decision is discussed in detail in section 9.5.
Table 6.8 Adjustments for regulatory depreciation ($million, 2011/12)
2012/13 2013/14 2014/15 2015/16
Water depreciation 73.8 78.8 83.4 87.6
Sewerage depreciation 136.4 144.8 152.8 160.3
Stormwater drainage depreciation 2.9 3.0 3.1 2.4
Combined business depreciation 213.1 226.6 239.4 250.3
Note: Totals may vary due to rounding.
Source: IPART analysis.
6.4.3 Resulting annual values for the RAB
As a result of incorporating the forecast capital expenditure and making the adjustments discussed above, we calculated the annual value of Sydney Water’s RAB as shown in Table 6.9 below.
Table 6.9 Decision on annual value of Sydney Water’s RAB over the 2012 determination period ($million 2011/12)
2012/13 2013/14 2014/15 2015/16
Opening RAB 12,978 13,421 13,876 14,242
Capital expenditure 692.0 703.1 618.1 540.1
Disposals 29.5 15.3 6.5 0.0
Depreciation 219.0 232.8 246.0 257.2
Closing RAB 13,421 13,876 14,242 14,525
Note: Totals may vary due to rounding.
Source: IPART analysis.
6.5 Calculating the allowance for a return on assets
Decision
15 IPART’s decision is that for the purposes of calculating the allowance for a return on assets, a post-tax real WACC of 5.6% is appropriate.

6 Capital expenditure
86 IPART Review of prices for Sydney Water Corporation’s water, sewerage, stormwater drainage and other services
An important step in determining Sydney Water’s notional revenue requirement is deciding on the appropriate rate of return on its RAB. The allowance for a return on assets is calculated by multiplying the rate of return by the value of the RAB in each year of the determination period.
There are several approaches for deciding on an appropriate rate of return. We decided in December 2011 to change to a post-tax real building block model after consultation with stakeholders96. In previous reviews we have used a pre-tax real WACC. We consider that the post-tax real WACC provides a superior estimate of the tax liability of a similar well-managed, privately owned business.
We developed a range for the water utility’s post-tax real WACC, and then made a judgement on the most appropriate rate of return for Sydney Water within this range. In exercising our judgement, we considered Sydney Water’s original proposal and subsequent submissions, the views of stakeholders, the views of finance experts and our own analysis. We also considered the implications of the chosen rate of return for Sydney Water and its customers.
Our final decision is that for the allowance for a return on assets, a post-tax real WACC of 5.6% will be applied. Due to current market uncertainty and historically low parameter estimates we decided that the upper bound of our range, 4.0% to 5.6% was an appropriate point estimate for the WACC.
The WACC parameters underpinning our WACC valuation are presented in Table 6.10. Market based parameters – the risk free rate, inflation adjustment and the debt margin – have been sampled over the 20 days to 16 April 2012. Our decision on the debt margin has used a range to account for current market conditions. Further details on our WACC final decision, including the parameters used to calculate the WACC range, are provided in Appendix C.
96 IPART, The incorporation of company tax in pricing determinations, December 2011.

6 Capital expenditure
Review of prices for Sydney Water Corporation’s water, sewerage, stormwater drainage and other servicesIPART 87
Table 6.10 Rate of return range and parameters – IPART’s decision for the final determination
WACC parameters Value
Nominal risk free rate 3.6%
Inflation adjustment 2.8%
Market risk premium 5.5% to 6.5%
Debt margin 3.3% to 4.8%
Debt to total assets 60%
Gamma 0.25
Equity beta 0.6 to 0.8
Cost of equity 6.9% to 8.8%
Cost of debt 6.9% to 8.4%
WACC range (pre-tax real) 4.8% to 6.6%
WACC midpointa (pre-tax real) 5.5%
WACC range (post-tax real) 4.0% to 5.6%
WACC midpointa (post-tax real) 4.6%
WACC point estimate (post-tax real) 5.6%a The midpoint WACC is calculated using the midpoint of the MRP and equity beta range, and the median of the debt margin observations.
6.6 Calculating the allowance for regulatory depreciation
Decision
16 IPART’s decision is to calculate regulatory depreciation using straight-line depreciation and the asset lives Sydney Water proposed in their submission, as shown in Table 6.11.
To calculate the allowance for regulatory depreciation, we decided on a depreciation method and asset lives for Sydney Water’s new and existing assets then calculated depreciation accordingly.
6.6.1 Depreciation method
As for previous determinations, we chose to use the straight-line depreciation method. Under this method, the assets in the RAB are depreciated by an equal value in each year of their economic life, so that their real written down value follows a straight line over time, from the initial value of the asset to zero at the end of the asset’s life. We consider that this method is superior to alternatives in terms of simplicity, consistency and transparency.

6 Capital expenditure
88 IPART Review of prices for Sydney Water Corporation’s water, sewerage, stormwater drainage and other services
6.6.2 Asset lives
To decide on the appropriate asset lives, we considered Sydney Water’s proposal, sought Atkins Cardno’s advice and conducted our own analysis.
Sydney Water’s proposal
In its submission, Sydney Water set asset lives consistent with the 2008 determination, with one exception. Sydney Water proposed extending the economic life of corporate electronic assets from 6 years to 10 years. Table 6.11 below shows Sydney Water’s proposed economic lives for each asset category.
Table 6.11 Sydney Water’s proposed asset lives
Proposed asset lives
Corporate Civil 65.6
Electronic 8.0
Mechanical 6.1
Electrical 0.0
Water Civil 89.9
Electronic 11.6
Mechanical 32.2
Electrical 21.7
Sewerage Civil 83.8
Electronic 7.2
Mechanical 18.6
Electrical 18.3
Drainage Civil 114.4
Electronic 0.0
Mechanical 3.0
Electrical 0.0
Source: Sydney Water’s submission to IPART’s review of prices for Sydney Water Corporation’s water, sewerage, stormwater and other services, September 2011, Table 8.2, p 107.
Atkins Cardno’s advice
Atkins Cardno’s assessment of the asset lives assumptions of Sydney Water was that they were robust and consistent with other water utilities. It expressed concern regarding the short asset lives of water meters, but notes that Sydney Water has indicated that there will likely be a lengthening of the asset lives of 20mm domestic water meters.

6 Capital expenditure
Review of prices for Sydney Water Corporation’s water, sewerage, stormwater drainage and other servicesIPART 89
IPART’s analysis
We accepted Sydney Water’s proposal to calculate depreciation using the asset lives it put forward, given Atkins Cardno’s advice that these lives were appropriate. In addition, Sydney Water’s asset lives were subject to a detailed review at the 2008 determination, so we are confident Sydney Water’s process is robust.
In line with this decision and the straight-line depreciation method, Sydney Water’s assets will be depreciated at a rate of approximately 1.7% over the 2012 determination period. This means that, in general terms, we calculated the allowance for regulatory depreciation by multiplying the annual value of the RAB over the determination period by 1.7%. This resulted in the annual allowances shown in Table 6.12 below.
Table 6.12 Sydney Water’s allowance for depreciation ($million, 2011/12)
2012/13 2013/14 2014/15 2015/16
Draft determination
Water depreciation 67.9 72.2 76.2 80.0
Sewerage depreciation 136.3 144.7 152.8 160.3
Drainage depreciation 2.9 2.9 3.0 2.3
Combined business depreciation 207.1 219.8 232.0 242.6
Final determination
Water depreciation 73.8 78.8 83.4 87.6
Sewerage depreciation 136.4 144.8 152.8 160.3
Drainage depreciation 2.9 3.0 3.1 2.4
Combined business depreciation 213.1 226.6 239.4 250.3
Note: Totals may vary due to rounding.
Source: IPART analysis.
The total of depreciation included in the final report is $27.9 million higher than in the draft report. This is a result of the following changes since the draft report:
Increasing stormwater drainage capital expenditure by $16.1 million.
The inclusion of $20.1 million of Rouse Hill recycled water avoided costs, which increased the water RAB by $2.1 million and the sewerage RAB by $18.0 million.
Our reallocation of water capital expenditure between electrical and electronic assets. In its submission to our draft report, Sydney Water argued that we had categorised too much water capital expenditure as ‘electrical’ and not enough as ‘electronic’. After reviewing our draft report, we agree and have allocated more of the water capital expenditure to ‘electronic’ and less to ‘electrical’. As electrical assets have longer asset lives than electronic, this redistribution of capital expenditure leads to higher depreciation.

7 Sydney Water’s forecast water sales
90 IPART Review of prices for Sydney Water Corporation’s water, sewerage, stormwater drainage and other services
7 Sydney Water’s forecast water sales
Demand (water sales) forecasts play a pivotal role in the pricing process as they determine how much revenue will be recovered via the usage charge. The usage charge and the demand forecast determine the expected usage revenue. After the revenue from usage charges is calculated, fixed charges are set to recover the remainder of the revenue requirement. Since the fixed service charge is calculated as a residual, demand forecasts will also have a bearing on the level of the fixed charge. If forecasts are lower than actual demand this will mean that fixed charges are calculated on lower volumes and will be set too high. This will result in utilities over-recovering their efficient costs. Forecasts that are higher than actual sales will lead to revenue under recovery. The selection of an appropriate methodology for forecasting demand therefore impacts Sydney Water and its customers.
Sydney Water’s forecasts and the actual level of water demand for the 2005 and 2008 Determinations are shown in Table 7.1 below. In both the 2005 and 2008 price reviews we adopted Sydney Water’s forecasts of demand.
Table 7.1 Past forecast and actual water use, GL (or billion litres)
Previous Determination Period Current Determination Period
2005/06 2006/07 2007/08 2008/09 2009/10 2010/11 2011/12
Forecast 559 575 590 519 560 544 534
Actual 528 510 482 492 506 496 NA
Difference -31 -65 -108 -27 -54 -48 NA
Source: Sydney Water submission, p 94.
Table 7.1 shows that over the past 6 years Sydney Water’s sales have consistently been less than its forecasts. Over these 6 years, actual total water demand has been about 10% less than forecast.
Sydney Water claims that the forecasting error was due to several assumptions:
In the 2005 Determination, it was assumed that drought restrictions would be gradually eased and be lifted by January 2007. This did not occur and the level of drought restrictions was increased to level 3 in June 2005, which then remained in force over the 2005 Determination.
In the 2008 Determination, it was assumed that drought restrictions would be gradually lifted during the first year. Drought restrictions were not actually lifted until late June 2009, when they were replaced by Water Wise Rules.

7 Sydney Water’s forecast water sales
Review of prices for Sydney Water Corporation’s water, sewerage, stormwater drainage and other servicesIPART 91
In the 2008 Determination, it was further assumed that after drought restrictions were replaced by Water Wise Rules, customers would increase their total water use by about 50 GL to 60 GL a year. However, residents, businesses and institutions have not significantly increased their average level of water use since the lifting of drought restrictions.
Sydney Water states that a reduction in the volume of water demand does not greatly reduce its costs, as costs of water delivery networks and other assets are largely fixed. Consequently, a reduction in the forecast demand volumes means that, to maintain revenue levels that cover costs, prices must increase.
7.1 Decisions
Decision:
17 IPART’s decision is to use Sydney Water’s proposed approach to forecast water demand for the 2012 Determination. This results in the levels of forecast demand shown in Table 7.2.
18 IPART’s decision is to introduce a demand volatility adjustment to mitigate possible revenue over/under recovery.
Sydney Water has developed new econometric models that it proposes to use for forecasting water demand for the 2012 Determination. These models take into account a range of factors that affect both residential and non-residential demand to develop forecasts for the 2012 Determination. Sydney Water says these models will provide the most accurate forecasts of water demand available, and that they represent a considerable improvement when compared with the approaches used to forecast demand in previous determinations.
On balance, we consider that Sydney Water’s proposed approach to forecasting demand should be accepted as it represents an improvement on the previous approach. Sydney Water’s approach was supported by a consultant report that was commissioned by Sydney Water to assess its overall modelling approach and outcomes.97 We also held a demand forecasting workshop to discuss Sydney Water’s proposed approach to demand forecasting, and the use of possible alternative approaches. External expert stakeholders at our demand forecasting workshop agreed that Sydney Water’s model was likely to be the best available approach to forecast water demand.
97 Sapere Research Group, Review of Demand Forecasting: Summary Paper, August 2011.

7 Sydney Water’s forecast water sales
92 IPART Review of prices for Sydney Water Corporation’s water, sewerage, stormwater drainage and other services
However, while the approach and inputs to the model are generally sound, it may be that the response of customers’ demand to the ending of restrictions and introduction of the Water Wise Rules may change. This change could lead to significant over-recovery in time. Conversely, if the risks of selling less water than forecast materialise, as Sydney Water contends is more likely, this may lead to significant under-recovery. For this reason, we have decided to implement a demand volatility adjustment for the 2012 Determination. Our examination of and decision on the demand volatility adjustment are discussed in section 3.5.
7.2 Sydney Water’s Proposed Approach
Sydney Water acknowledges the difficulties in accurately forecasting water demand during and immediately after severe and sustained drought. The assumptions that must be made about the timing of lifting drought restrictions and the community’s subsequent response, have large impacts on forecast water demand levels. To assist this process Sydney Water has developed new econometric models that replace the models used to provide forecasts for the 2005 and 2008 reviews.
Since 2008, Sydney Water has undertaken new econometric demand modelling and a price elasticity study to forecast water demand for the 2012 Determination. Based on this modelling Sydney Water expects that forecast water demand will stay at around 2010/11 levels (below 500 GL a year) until 2015/16. Prior to the 2004 drought water sales ranged from 600 GL to 620 GL.
Sydney Water expects that increases in water use due to growth will be offset by increases in water efficiency.
Despite a growing population and the lifting of drought restrictions, Sydney Water identifies a number of factors that will maintain water use at current low levels of around 490 GL per year. These factors are:
The Rosehill-Camellia recycling project, replacing about 4 GL per year of potable water use for industry, and the Kurnell recycling project replacing around 1.4 GL per year.
Setting the water usage price at the long-run marginal cost (LRMC) of water will encourage continued improvements in household water efficiency.
Sydney Water maintaining low levels of leakage from the water supply network.
The decision by BlueScope steel to reduce its annual production from its Port Kembla steel works. Depending on actual production levels and recycled water volumes supplied, Blue Scope’s unfiltered water use is expected to decline substantially.

7 Sydney Water’s forecast water sales
Review of prices for Sydney Water Corporation’s water, sewerage, stormwater drainage and other servicesIPART 93
Using its model Sydney Water says it is now possible to forecast water demand based on an extended period of observed outcomes that can reasonably be expected to continue into the future, as Water Wise Rules have been in place for over 2 years. Sydney Water’s previous forecast models relied on broad assumptions about water use patterns that would occur after the lifting of drought restrictions.
Sydney Water initially ran its model using its proposed usage prices. Our proposed demand forecasts are based on Sydney Water’s re-run of its demand forecasting models using our final decision on usage charges.
Sydney Water’s forecasts of water demand are shown in Table 7.2 below.
Table 7.2 Sydney Water Forecast Water Demand for the 2012 Determination
Current determination 2012 Determination
2011/12 2012/13 2013/14 2014/15 2015/16
Total Water Demand 489 487 489 491 495
Source: Sydney Water submission, p 95 and supplementary submission to IPART, 23 November 2011.
7.2.1 Demand Forecasting Models
Sydney Water’s new models are based on detailed analysis of the water use of residential and non-residential properties by user group. Sydney Water’s analysis provides estimates of the impact on water demand from water usage price changes, water efficiency program participation and the implementation of Water Wise Rules. It says that its assessment of water use by user group and forward looking models provide the best basis for forecasting water demand.
Sydney Water engaged the services of a consultant, Sapere Research Group, to review their demand forecasting methodology and assess Sydney Water’s overall approach and outcomes of demand forecasting. The consultants found that Sydney Water’s approach was justified, and that there was no reason why the new approach should not be used. This assessment was confirmed by expert stakeholders who participated in an IPART workshop, who concluded that Sydney’s Water’s new approach represented the best available method for forecasting demand.

7 Sydney Water’s forecast water sales
94 IPART Review of prices for Sydney Water Corporation’s water, sewerage, stormwater drainage and other services
7.2.2 Residential Water Demand
Sydney Water says that residents account for around 65% of Sydney’s total water use and over 70% of metered water use. 70% of residential water demand is attributable to houses, while units, flats, townhouses and dual occupancies account for the remaining 30%. The average water use of houses has fallen by around 25% since the beginning of the drought. The variability in water demand across seasons has also fallen significantly.
Sydney Water attributes the reduction in residential water demand to:
water efficiency programs
increases in water usage prices since October 2005
choices about water use given drought conditions, and
restrictions on outdoor water use.
Sydney Water has developed new models to provide separate forecasts of residential and non-residential water demand. These new models measure the observed response by residents from replacing drought restrictions with Water Wise Rules in late June 2009. The residential models incorporate data from June 2004 to December 2010.98
The new forecasting method applies an econometric model to household-level water use data. The average daily water use of a household (per quarter) was modelled against a range of factors that affect water demand, including the households previous water use (habit formation), the price of water, whether drought restrictions or Water Wise Rules were in place, participation in a water efficiency program, the season, and weather conditions.
Key outputs were the estimated impact on residential water use from:
changes in water use prices ($ per kL)
replacing drought restrictions with Water Wise Rules
changes in the season and weather conditions during the year.
The key parameters that Sydney Water used in forecasting residential water use to 30 June 2016 were that:
residents have fully adjusted to Water Wise Rules
water usage prices are set based on our determination
new residential properties will achieve water efficiency standards required under BASIX
drought restrictions would not be imposed over the 2012 Determination.
98 It should be noted that over this entire period either restrictions were in force or Water Wise
Rules were in force.

7 Sydney Water’s forecast water sales
Review of prices for Sydney Water Corporation’s water, sewerage, stormwater drainage and other servicesIPART 95
An important parameter is that households have adjusted fully to Water Wise Rules. This is based on only 18 months of data under Water Wise Rules.
Sydney Water expects forecast residential water demand to increase slightly from 320 GL in 2011/12 to 327 GL by 2015/16. Sydney Water has forecast total water demand (residential and non-residential) to average 491 GL per year over the 2012 Determination.
7.2.3 Non-Residential Water Demand
Sydney Water provided evidence of a steady decline in the average water demand of non-residential properties over the last 20 years. Since 1989/90, total water use by non-residential properties has fallen by around 30% from 186 GL to 125 GL in 2009/10. The long term reduction in non-residential water demand is attributed to pricing reforms since the early 1990s that placed an increased emphasis on usage-based charging, business water efficiency programs, and the gradual shift away from manufacturing towards service industries. The impacts of drought on businesses and their attempts to reduce water use during the drought have also played a role in reducing non-residential water demand.
Based on these long term trends and interviews of the major customer, Sydney Water expects the rate of decline in non-residential water use to be modest over the 2012 Determination. Sydney Water expects forecast demand for non-residential properties to decrease from around 116 GL in 2011/12 to 111 GL in 2015/16. Non-residential demand is around 23%of total water demand.
Sydney Water has modelled the forecast long-term trend in observed water use for identified groups of non-residential properties. The business efficiency plans of large water users have been included in the forecasting process.
7.3 Alternatives to Sydney Water’s Model
We examined the use of a moving average model to forecast demand as an alternative to Sydney Water’s proposed model. The strengths of a moving average model are:
it is simple to construct and run for each period
it is transparent and can be easily understood and verified by stakeholders
it reflects recent actual demand conditions.

7 Sydney Water’s forecast water sales
96 IPART Review of prices for Sydney Water Corporation’s water, sewerage, stormwater drainage and other services
The weaknesses of a moving average model are:
it can include periods that do not reflect current demand conditions
there may be permanent revenue over/under recovery if the time series is not stationary
it may not take into account current sectoral trends in water use.
If a 10-year moving average was adopted forecast water demand would be around 536 GL as compared to Sydney Water’s proposal of around 491 GL.
We decided to adopt Sydney Water’s proposed demand forecasting models in combination with a demand volatility adjustment in preference to a moving average approach as Sydney Water’s models were regarded as the best available approach by expert stakeholders and were supported by a peer review commissioned by Sydney Water. In combination with a demand volatility adjustment it should ensure that demand forecasts are as accurate as possible and mitigate the possibility of revenue over/under recovery.
The alternative option of using a moving average was not used as it may result in permanent revenue over/under recovery if the demand time series is not stationary and may also incorporate periods that are not reflective of current demand conditions.
7.4 Stakeholder Consultation
We held a public workshop to inform and elicit views from invited modelling experts and other water industry stakeholders. Sydney Water presented its methodology for demand forecasting at the workshop. Stakeholders were invited to comment.
It was recognised at the workshop that Sydney Water’s proposed model is a significant improvement on past techniques and represents best practice. However, some stakeholders did express a concern that the algorithm may mask post drought bounce-back in other variables. Some experts questioned Sydney Water’s finding that all post drought bounce back had occurred and noted that a limitation of the model was the short data set post drought.

7 Sydney Water’s forecast water sales
Review of prices for Sydney Water Corporation’s water, sewerage, stormwater drainage and other servicesIPART 97
A number of actions arose as a result of suggestions from the workshop. These included Sydney Water agreeing to:
Provide information comparing the forecasts of its model and actual water demand over as many past quarters as available. This would show the relative accuracy of its forecasts.
Re-run their demand forecasting model holding the water usage price constant in real terms and providing new forecast information.
Provide additional information regarding alternative demand forecasts that were used for infrastructure planning included in its price submission.
The above actions assisted us in refining Sydney Water’s approach to demand forecasting for the 2012 Determination.
Sydney Water provided this additional information. Figure 7.1 below compares model results to actual demand figures. The figure shows that Sydney Water forecasts have generally been accurate using its model. However, in quarter 3 of 2010/11 there was a divergence of actual demand of 5.5 GL or 4.2% from the forecast demand (this occurred during a summer period).
Figure 7.1 Forecast Demand vs. Actual Demand 2008/09 to 2011/12
0
20
40
60
80
100
120
140
160
Q1 Q2 Q3 Q4 Q1 Q2 Q3 Q4 Q1 Q2 Q3 Q4 Q1
2008‐09 2009‐10 2010‐11 2011‐12
Water use (GL)
Bulk demand (actual) Forecast (Actual weather)
Data source: Sydney Water.

7 Sydney Water’s forecast water sales
98 IPART Review of prices for Sydney Water Corporation’s water, sewerage, stormwater drainage and other services
7.5 IPART’s Analysis
In order to gain confidence in the demand forecasts we asked Sydney Water a number of questions. When asked about the risks of its model, Sydney Water stated that only a number of downside risks to forecasting residential and non-residential water demand were present due to the:
impact of increases in utility prices
risk of an unexpected downturn in the Sydney economy
impact of the high Australian dollar on the competitiveness of businesses, or
possible reintroduction of level 3 drought restrictions.
While Sydney Water’s model is detailed and represents an improvement over current practice, we consider that the calibration period on which Sydney Water has based its model, being composed largely of restrictions and Water Wise Rules, may not be reflective of future conditions as Water Wise Rules are not as restrictive as restrictions. The inclusion of the period of restrictions in the modelling may be distorting the results.
At an aggregate level, there is a possibility that Sydney Water’s model may understate actual demand. There is around 18 months of data included in Sydney Water’s models on customer response to Water Wise Rules. It is possible that consumer behaviour may change and that a further bounce back in demand may yet occur.
When the 2016 Determination is drafted there will be a longer period for calibration. We consider that the accuracy of the forecasts will increase for the 2016 Determination. An assessment of the performance of Sydney Water’s model will be made at the 2016 Determination. If the model does not perform adequately over the 2012 Determination, then Sydney Water and IPART would explore alternative options for forecasting consumption for the 2016 Determination.

8 Outcomes from review of price structures
Review of prices for Sydney Water Corporation’s water, sewerage, stormwater drainage and other servicesIPART 99
8 Outcomes from review of price structures
In June 2011, we commenced a separate review of the price structures99 of water and sewerage charges for the 4 metropolitan water utilities. As part of this review, we developed a range of principles on the fixed and usage charges for the water and sewerage services for residential and non-residential customers.
As part of our program of work following the 2005 and 2008 Determinations we have also reviewed the structure of stormwater drainage charges.
This chapter outlines our decisions on the price structures review and on stormwater drainage, explains how these decisions have been applied to our decision for Sydney Water, and identifies the key impacts on different customer groups.
8.1 Price structures review for the 4 water utilities
Over the past 18 months we have been conducting a detailed review of the price structures for Sydney Water, Hunter Water Corporation, Gosford City Council and Wyong Shire Council. We released an Issues Paper in June 2011 and held a public workshop on 29 August 2011. Following the public workshop we continued to receive submissions from stakeholders and held further meetings to clarify the issues raised. A final report was released in March 2012.100
In the review we found that there was a lack of consistency and cost-reflectivity in the structure of water and sewerage charges across the 4 water utilities. This has resulted in a number of inequities in the pricing arrangements for different customers. Firstly, customers located in the 4 water utilities’ service areas that create similar costs within the networks pay significantly different prices. Secondly, there are inconsistencies within each water utility so that customers that create similar costs within the network can pay considerably different prices.
After we considered submissions to the price structures review and held a public workshop, we adopted the price structure principles, shown in Box 8.1, for water and sewerage services for the 4 water utilities.
99 A price structure is the relationship between fixed (service) charges and variable (usage)
charges, and the proportion of the total fixed and usage charges each customer group pays. 100 IPART, Review of metropolitan water utility price structures – Final Report, March 2012.

8 Outcomes from review of price structures
100 IPART Review of prices for Sydney Water Corporation’s water, sewerage, stormwater drainage and other services
Box 8.1 Price structure principles
The price structures principles we have adopted are as follows:
General principles
Changes to the structure of water and sewerage prices are to be phased in over a transitionperiod where necessary to minimise customer impacts.
The total revenue collected from residential customers is to reflect the costs incurred inserving those customers. The total revenue collected from non-residential customers is toreflect the costs incurred in serving those customers.
Customers imposing similar costs on the system should pay similar charges.
Residential and non-residential water usage charges
The water usage charge is to be a standard variable charge for all customers – residentialand non-residential – and be set with reference to the utility’s long run marginal cost ofsupply.
Residential water and sewerage service charges
The residential water service charge is to be a standard annual chargea for all residentialdwellings unless there is evidence that there are material differences in the costs ofservicing different residential property types.
The residential sewerage service charge is to be a standard annual chargea for all residentialdwellings unless there is evidence that there are material differences in the costs ofservicing different residential property types.
Non-residential water service charges and sewerage usage and service charges
The non-residential sewerage usage charge is to be a standard variable charge for allcustomers set with reference to, but not necessarily equal to, the utility’s short run marginalcost of transporting, treating and disposing of domestic-strength effluent.
The total sewerage revenue (usage and service charges) collected from non-residentialcustomers is to reflect the costs incurred in servicing those customers.
The total water revenue (usage and service charges) collected from non-residentialcustomers is to reflect the costs incurred in servicing those customers.
a It may be billed on a quarterly or 4-monthly pro-rata basis by the utility.
Our Price Structure Report101 provides a detailed discussion of the price structure issues across the 4 water utilities. It also sets out how we considered stakeholder submissions and input from the public workshop in making our decisions which are set out in the report.
101 IPART, Review of metropolitan water utility price structures – Final Report, March 2012.
8 Outcomes from review of price structures
Review of prices for Sydney Water Corporation’s water, sewerage, stormwater drainage and other servicesIPART 101
In reviewing stormwater drainage charges we engaged in a review of literature and international drainage charging practice and the price structures of Sydney Water, Hunter Water, Gosford City Council and Wyong Shire Council. Our research confirmed that the area of a property is a key factor - but not the only factor - in driving stormwater costs. Other issues such as slope of the ground, the percentage of impervious ground, the percentage of water that drains off the property, on-site retention and storage devices and the nature of the land usage also drive costs. We also found that there is a community benefit to stormwater because people benefit from cleaner waterways, rivers and beaches. We have made changes to the draft report that now recognise these other cost drivers whilst preserving an area based approach.
8.2 Price structures for Sydney Water
We have applied the principles set out in Box 8.1 and the findings of our stormwater drainage review to Sydney Water’s price structures. The section below explains our decisions and what this means for our decision-making about Sydney Water’s water, sewerage and stormwater drainage charges.
8.2.1 Water
Water usage charge
We have decided to maintain the current method for calculating the water usage charge applied to all the retail water suppliers that we regulate. We usually set the usage price of water for retail customers with reference to the long run marginal cost of the next increment of augmentation (LRMC), to provide a price signal of the incremental costs of consumption. To determine LRMC, we calculate the net present value (NPV) of the capital and operational costs of the augmentation project over its expected life, and divide this by the NPV of the benefits over the same period. The detailed calculation for LRMC is in Appendix E.
The usage price has no impact on Sydney Water’s revenue. After the annual revenue requirement for water is determined the usage price and demand forecast will determine the expected usage revenue. The fixed service charges will be set to recover the residual.
Water service Charge
For residential customers we will introduce a standard water service charge for all residential dwellings (such as houses, townhouses, flats and units). Currently the service charges paid by houses are subsidising the services received by flats and units. We note that residential customers impose a range of costs for the availability of water supply services in their home. These costs vary more by location than property type and even across property types there is significant overlap in the cost

8 Outcomes from review of price structures
102 IPART Review of prices for Sydney Water Corporation’s water, sewerage, stormwater drainage and other services
imposed. Therefore we have decided that all residential premises should pay the same price for this availability. It is the simplest price structure to understand and has the lowest administration cost.
This is a change in the structure of the charges paid by apartments and is implemented over the 4-year determination period.
For non-residential customers, all properties that have an individual 20mm water meter connection will pay the same service charge as residential dwellings. All other non-residential customers will pay a water service charge based on the size of their water meter connection. This charge is levied in full on individually metered customers and is shared between all customers on a shared meter. This ensures that all non-residential customers that impose similar costs on Sydney Water pay the same price for that service.
We considered introducing a standard water service charge for all non-residential 20mm standalone properties, strata tenancies and single owner multi-premise tenancies but we found that this introduced new inequities between non-residential customers.
In setting the water service charge, we have maintained the current proportion of the revenue collected from residential and non-residential customers.102 This is to prevent new inequities and cross subsidies being introduced between the different customer groups.
Together with the water utilities, we will undertake a detailed cost of service analysis to assess whether the water revenue ratios between the 2 groups should be amended in the future to better reflect the costs incurred in providing services to each of the customer groups.
8.2.2 Sewerage
Sewerage service charge
For residential customers we have decided to maintain the current method of setting a single fixed charge for all residential sewerage customers regardless of property type. As was the case with water we found that costs imposed by customers varied more by location than property type and even across property types there is significant overlap in the cost imposed. Sydney Water has said that sewerage costs are driven more by wet weather sewerage overflow licence conditions than by any other factor.103 In the absence of any evidence to the contrary, a standard sewerage service charge for residential customers is appropriate given that it is the simplest price structure to understand and has the lowest administration costs.
102 The current ratio of water revenue from residential and non-residential customers is 87 to 13. 103 Transcript of Proceedings – IPART - Review of Price Structures for Metropolitan Water
Agencies (Public round table), Monday 29 August 2011, p 19.

8 Outcomes from review of price structures
Review of prices for Sydney Water Corporation’s water, sewerage, stormwater drainage and other servicesIPART 103
For non-residential customers we have decided to maintain the current arrangements for all 20mm individually metered properties and to charge them the same standard service charge as residential sewerage customers. We have also decided to charge all other non-residential customers a meter based charge, whether they have a stand-alone meter or are serviced by a common meter or multiple common meters. This means that non-residential customers in properties with the same size meter will now pay the same charges.
This decision for non-residential properties reflects our analysis for the water service charge. We have moved to a meter based charge to remove the cross subsidy that strata properties are currently providing to single owner multi-premise tenancies. This represents a significant reduction in the relative cost paid by non-residential strata premises.
Sewerage usage charge
Sydney Water levies sewerage usage charges on its non-residential customers. In setting the sewerage charge for residential customers we have assumed an average residential sewerage discharge of 150 kL per annum and included this in the single service charge.
Our review revealed that the current sewerage usage charge encourages customers to implement on-site recycling schemes that are not efficient. To improve cost-reflectivity, and send appropriate price signals, we consider that this charge should reflect Sydney Water’s short run marginal cost (SRMC) of sewage transportation, treatment and disposal, which is estimated to be $0.23/kL.104 As this cost is significantly less that the current usage charge (of $1.49/kL), we have decided to transition the charge towards this cost. The usage charge is to be reduced by $0.10/kL in nominal terms in each year over the determination period. We will consider in subsequent determinations whether the sewerage usage charge should be further reduced towards SRMC and at what rate.
Sydney Water currently allows its non-residential customers to discharge 500 kL per year before it charges the usage charge. We propose to reduce the current discharge allowance of 500 kL per year for non-residential customers to be closely aligned with the deemed discharge of 150 kL per year for residential customers. The non-residential discharge allowance is to be reduced by 50 kL per year over the determination period.
In setting the sewerage service and usage charges, we have maintained the proportion of current revenue collected from residential and non-residential customers to prevent new inequities and cross subsidies being introduced between the different customer groups.105
104 Reported by Sydney Water to the Inter-Agency Working group meeting of 7 April 2010. 105 The current ratio of sewerage revenue from residential and non-residential customers is 81.5 to
18.5.

8 Outcomes from review of price structures
104 IPART Review of prices for Sydney Water Corporation’s water, sewerage, stormwater drainage and other services
Together with the water utilities, we will undertake a cost of service analysis to assess whether the sewerage revenue ratios between the 2 groups should be amended in the future to better reflect the costs incurred in providing services to each of the customer groups.
8.2.3 Stormwater Drainage
Sydney Water supplies stormwater drainage services to a small proportion of its customers. These customers currently pay a fixed charge, based on whether they are residential or non-residential.
Area based charges reflect that land area is a key determinant of the costs of providing stormwater drainage services. However, other cost drivers such as: slope of the ground, the percentage of impervious ground, the percentage of water that drains off the property, on-site retention and storage devices and the nature of the land usage also contribute. We also found that there is a community benefit from stormwater drainage services. That is, all people benefit from cleaner waterways, rivers and beaches.
Stormwater Drainage Service charge
For residential properties our decision sets a single fixed charge for single dwelling customers, primarily houses, and a single fixed charge for multi-premise dwellings, primarily flats, units and townhouses. The multiple premise charge is lower than the house charge to reflect the average smaller area per dwelling in multi-premise dwellings.
For non-residential customers we have set 5 area based bands of non-residential properties: properties in the 0-200m2, 201m2-1,000m2, 1,001m2–10,000m2 10,001m2-
45,000m2 and >45,000m2 bands will have a single fixed charge for each band. Larger properties that meet Sydney Water’s criteria may be deemed “low impact” stormwater customers. Low impact stormwater customers will be charged the same as properties in the 201m2-1,000m2 band.
The next section of the report explains, at a high level, the impacts on different customer groups from implementing these pricing reforms.
8.3 Impacts on Sydney Water’s customers from proposed price reform
The implementation of these pricing reforms for Sydney Water will benefit certain customer groups whilst others will need to pay more. This price restructuring does not increase the total revenue received by Sydney Water for services. Rather it removes the inequities and improves that balance between fixed service charges and variable usage charges so that customers in all groups pay bills that represent the costs they impose on Sydney Water, and prices send efficient price signals.

8 Outcomes from review of price structures
Review of prices for Sydney Water Corporation’s water, sewerage, stormwater drainage and other servicesIPART 105
Some customer groups, such as non-residential customers with larger individual meters, are currently being subsidised by other customer groups; notably non-residential strata premises. These 2 customer classes will now pay the same meter based charge which will significantly reduce the charges for non-residential strata customers but cause a modest rise in large single owner non-residential properties. Our decisions improve the equity and cost-reflectivity of Sydney Water’s prices for all customers. That is, the new price structure will mean that all customers will pay their fair share of the costs imposed on Sydney Water’s system.
We are committed to implementing fairer prices. We note that with prices decreasing, this is the ideal time to make changes to price structures as some of the inevitable customer impacts of reform will be moderated. Where there are significant impacts on certain groups of customers, we have tried to minimise these impacts by transitioning prices over a period of time. The section below describes the major impacts on Sydney Water’s customers for water and sewerage services.
8.3.1 Impact of price structure changes on residential customers
Residential customers living in houses (or other individually metered properties) will gain from a much lower water service charge. For example, in 2011/12 the service charge for a house is $144.79 per year, which will be reduced to $94.88 per year by 2015/16.
Residential customers living in flats and units that have a common water meter will generally pay more for their water service charge. The size of the increase will depend on the number of dwellings in the property that share the common meter. In 2011/12, these customers pay on average $70 per year which will increase to $78.29 per year in 2013/14 and will be $94.88 by 2015/16. However, there will be customers above and below this average so the individual impacts will vary.
Residential customers that are living in flats, units and townhouses will see a decrease in their stormwater drainage service charge. This is because the service charge is now based on the land area of a property. For example, in 2011/12 the service charge for a unit is $49.08 per year, which will be reduced to $29.04 per year by 2015/16.
Residential customers that are living in houses will see an increase in their stormwater drainage service charge. This is because the service charge is now based on the land area of a property. For example, in 2011/12 the service charge for a house is $49.08 per year, which will be increased to $79.21 per year by 2015/16.
8.3.2 Impact of price structure changes on non-residential customers
Non-residential customers that are individually metered will gain from a lower water service charge. For example, in 2011/12 the 25mm water meter charge is $226.24 per year, which will be reduced to $187.72 per year by 2015/16.

8 Outcomes from review of price structures
106 IPART Review of prices for Sydney Water Corporation’s water, sewerage, stormwater drainage and other services
Non-residential customers in strata properties will generally gain from a lower sewerage service charge. This is because the service charge is now based on a proportion of the meter size which services the property rather than the individual strata units paying separate service charges. This is much fairer for all non-residential customers as they will be all paying the same meter based charge for sewerage services. We estimate that about 25% of Sydney Water’s non-residential customers will be affected by this price change. For example, a strata property (comprising 4 individual units) with a 25mm water meter connection would currently be paying a total sewerage service charge of $2,158.12 per year. Under the new price structure, the total sewerage charge paid by this strata premise is $973.94. This is the same charge that a single owner premise with a 25mm connection will pay.106
As a result, small shops and businesses will no longer be subsidising larger commercial customers (such as shopping centres) and industrial customers.
Non-residential customers for whom usage comprises a large proportion of their sewerage bill will benefit from significant reductions in the usage charge over 4 years.
Non-residential customers with a meter connection of 25mm or greater (that are not strata units) will see an increase in their sewerage service charge. Where these customers have low water consumption and low discharge factors, the impacts will be larger. This is because the increase in the service charge will not be offset by reductions in the usage component of their sewerage charges.
Non-residential customers with an area of 1,000m2 or less will see a decrease in their stormwater drainage service charge. This is because the service charge is now based on the land area of a property. For example, in 2011/12 the service charge for a 500m2 business is $127.74 per year, which will be reduced to $79.21 per year by 2015/16.
Non-residential customers with an area greater than 1,000m2 will see an increase in their stormwater drainage service charge. This is because the service charge is now based on the land area of a property. For example, in 2012/12 the service charge for a factory on 20,000m2 of land is $127.74 per year, which will be increased to $1,760 per year by 2015/16.
Chapter 10 of this report provides a more detailed analysis of the impacts on different types of customers. Chapter 9 explains the prices for all the services provided by Sydney Water.
106 This assumes a 100% discharge factor for both premises. So long as both premises have the
same discharge factor they will pay the same charge.
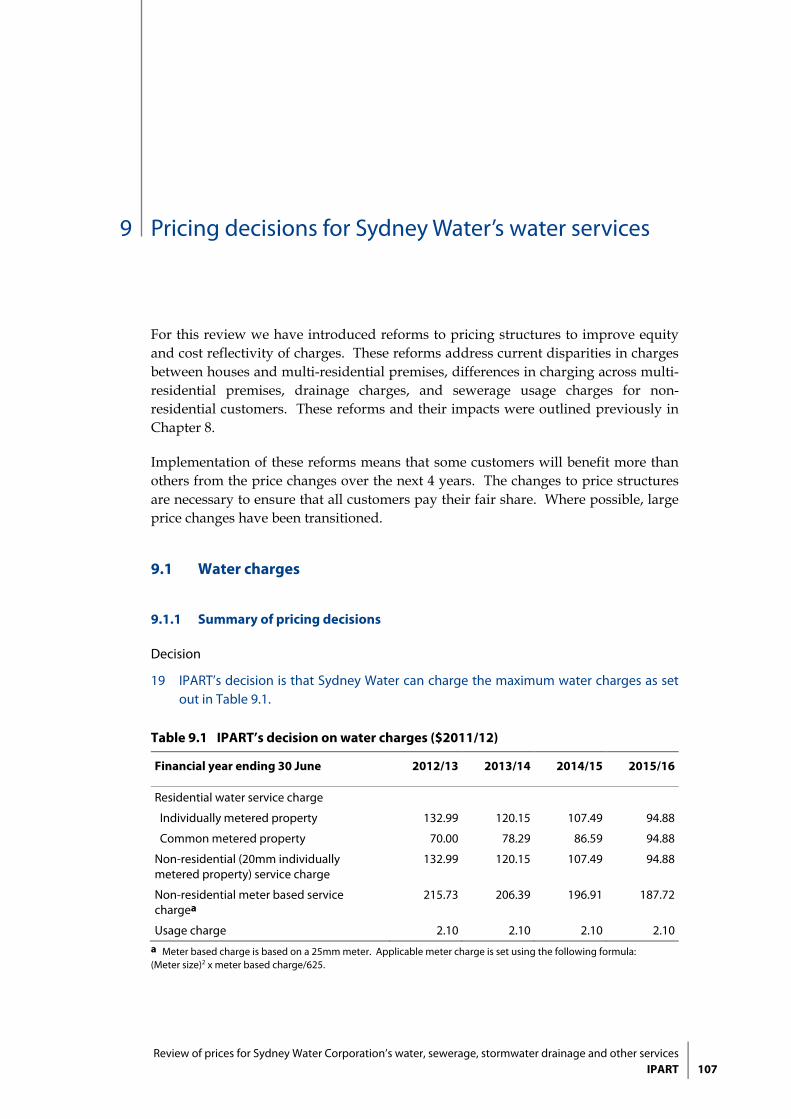
9 Pricing decisions for Sydney Water’s water services
Review of prices for Sydney Water Corporation’s water, sewerage, stormwater drainage and other servicesIPART 107
9 Pricing decisions for Sydney Water’s water services
For this review we have introduced reforms to pricing structures to improve equity and cost reflectivity of charges. These reforms address current disparities in charges between houses and multi-residential premises, differences in charging across multi-residential premises, drainage charges, and sewerage usage charges for non-residential customers. These reforms and their impacts were outlined previously in Chapter 8.
Implementation of these reforms means that some customers will benefit more than others from the price changes over the next 4 years. The changes to price structures are necessary to ensure that all customers pay their fair share. Where possible, large price changes have been transitioned.
9.1 Water charges
9.1.1 Summary of pricing decisions
Decision
19 IPART’s decision is that Sydney Water can charge the maximum water charges as set out in Table 9.1.
Table 9.1 IPART’s decision on water charges ($2011/12)
Financial year ending 30 June 2012/13 2013/14 2014/15 2015/16
Residential water service charge
Individually metered property 132.99 120.15 107.49 94.88
Common metered property 70.00 78.29 86.59 94.88
Non-residential (20mm individually metered property) service charge
132.99 120.15 107.49 94.88
Non-residential meter based service chargea
215.73 206.39 196.91 187.72
Usage charge 2.10 2.10 2.10 2.10a Meter based charge is based on a 25mm meter. Applicable meter charge is set using the following formula: (Meter size)2 x meter based charge/625.

9 Pricing decisions for Sydney Water’s water services
108 IPART Review of prices for Sydney Water Corporation’s water, sewerage, stormwater drainage and other services
The fall in the water service charge for individually metered residential properties and non-residential properties shown in Table 9.1 is due in part to our decision to set a standard water service charge for all residential dwellings. This is a part of our price structure reforms. Also contributing to lower water service charges are:
our decision to use a lower WACC than in the previous determination
our decision to move from a pre-tax to a post-tax WACC
lower bulk water costs due to our prices being set on the basis that the desalination plant will remain in water security shutdown mode for the full 4 years of the determination.
Charges for common metered properties increase over the 4 years of the determination period. These customers will pay the same service charges as individually metered residential properties in the last year of the 2012 Determination. This is a result of our decision to transition water service charges for all residential properties to the same level.
The water usage charge has remained constant in real terms at $2.10/kL as a result of our investigation of LRMC. Estimates of LRMC are examined in Appendix E.
9.1.2 Sydney Water’s submission
Residential Water Service Charges
Sydney Water proposed to charge all residential dwellings (houses, flats and units) a standard residential service charge. Sydney Water proposed to transition this change over 2 years.
Sydney Water also proposed to charge houses that have water connections greater than 20mm a higher service charge. Sydney Water did not make any allowance for an increase in revenue from this charge in their modelling as they believed nearly all customers would opt to have their larger meter replaced with a 20mm meter. Table 9.2 shows Sydney Water’s proposed water service charges for houses, and Table 9.3 shows Sydney Water’s proposed water service charges for residential units not individually metered.

9 Pricing decisions for Sydney Water’s water services
Review of prices for Sydney Water Corporation’s water, sewerage, stormwater drainage and other servicesIPART 109
Table 9.2 Sydney Water’s proposed water service charges for houses ($2011/12)
2011/12 2012/13 2013/14 2014/15 2015/16 Total Increase
Annual Charge
144.79 162.64 162 .64 162.64 162.64 17.85
Annual Increase
12.3% 0.0% 0.0% 0.0% 12.3%
Source: Sydney Water’s submission to IPART’s review of Prices for Sydney Water Corporation’s water, sewerage, stormwater and other services, September 2011, p110.
Table 9.3 Sydney Water’s proposed water service charges for residential units not individually metered ($2011/12)
2011/12 2012/13 2013/14 2014/15 2015/16 Total Increase
Annual Charge
70.05a 82.64 122.64 162.64 162.64 92.59
Annual Increase
18.0% 48.4% 32.6% 0% 132.2%
a Average service charge paid by common-metered multi-tenancies.
Non-Residential Water Service Charges
Sydney Water proposed to charge all non-residential multi-premise strata tenancies a standard water service charge set at the same level as houses and apartments. Sydney Water’s proposed non-residential water service charges are shown below in Table 9.4.
Table 9.4 Sydney Water’s proposed non-residential water service charges ($2011/12)
2011/12 2012/13 2013/14 2014/15 2015/16 Total Increase
Annual Charge - Houses and strata with individual meters
144.79 162.64 162.64 162.64 162.64 17.85
Annual Increase 12.3% 0.0% 0.0% 0.0% 12.3%
Annual Charge – Multi-tenancy single owner and strata with common metera
70.05 73.19 73.19 73.19 73.19 73.19
Annual Increase 4.5% 0.0% 0.0% 0.0% 12.3%
a Average service charge payed by common-metered multi-tenancies.
Source Sydney Water’s submission to IPART’s review of Prices for Sydney Water Corporation’s water, sewerage, stormwater and other services, September 2011 and supplementary data; IPART analysis.
Charges for all the different meter sizes are listed in Table 3 of the Determination.

9 Pricing decisions for Sydney Water’s water services
110 IPART Review of prices for Sydney Water Corporation’s water, sewerage, stormwater drainage and other services
Water Usage Charges
Sydney Water currently charges all water usage at the rate of $2.10/kL. Sydney Water proposed to increase the water usage charge to $2.35/kL by 2015/16. This is based on their calculation of the range of the Long Run Marginal Cost (LRMC)107. This calculation is included in Appendix E of our report, together with our own analysis.
Table 9.5 Water Usage Charges ($2011/12)
2011/12 2012/13 2013/14 2014/15 2015/16
Usage ($/kL) 2.10 2.20 2.25 2.30 2.35
Annual Change 4.6% 2.3% 2.2% 2.2%
Source: Sydney Water’s submission to IPART’s review of Prices for Sydney Water Corporation’s water, sewerage, stormwater and other services, September 2011, p110.
9.1.3 Submissions from other stakeholders
Submissions that addressed the issue of changes to water price structures were generally opposed, or argued for an increased period of time to phase in the changes. Alternative suggestions for changes to price structures were also espoused by some stakeholders. These submissions were primarily concerned with changes to fixed charges for multi-residential properties.
The submission by Luke Foley MLC contended that the proposed changes to the pricing structure for multi-premises residential properties will result in excessive price increases.108 The Owners Corporation Strata Plan 6006 argued that the current arrangements for charging multi-residential properties should remain in place.109 Conversely, the Owners Corporation Network argued that multi-premise dwellings should be charged a fixed percentage of the residential house water service charge with the fixed percentage being lower than for houses. The Owners Corporation Network also recommended gradual implementation of water service charge changes for multi-residential dwellings governed by a strata scheme.110
107 Sydney Water’s submission to IPART’s review of Prices for Sydney Water Corporation’s water,
sewerage, stormwater and other services, September 2011, p 351. 108 Luke Foley, MLC, submission to IPART Review of Prices for Sydney Water Corporation’s
Water, Sewerage, Stormwater and Other Services, 18 October 2011, pp 3-4. 109 The Owners Corporation Strata Plan 6006, submission to Review of Sydney Water
Corporation’s Water, Sewerage, Stormwater and Other Service Prices from 1 July 2012, 4 October 2011, p 3.
110 The Owners Corporation Network, submission to IPART review of prices for Sydney Water Corporation’s Water, Sewerage, Stormwater and Other Services, 6 October 2011, p 3.

9 Pricing decisions for Sydney Water’s water services
Review of prices for Sydney Water Corporation’s water, sewerage, stormwater drainage and other servicesIPART 111
We have taken these comments into account in our review of price structures that is discussed in Chapter 8. We consider that the changes we have made to price structures will result in charges that are more cost-reflective and remove existing cross-subsidies.
For a discussion of these submissions, refer to our Review of price structures for metropolitan water utilities available on our website (www.ipart.nsw.gov.au).
9.1.4 IPART’s analysis
Residential water service charge
Decision
20 IPART’s decision is that all residential dwellings (including houses, flats and units) will pay the standard residential water service charge.
IPART and Sydney Water have together conducted a review of water and sewerage price structures. Our review of price structures is covered in detail in Chapter 8.
Many properties changing from a common meter charge to a standard residential water service charge will face an increase in their water bills. To manage this, we have transitioned prices over the 4 years of the determination period. By the end of the current determination period, all residential dwellings - be they house or apartments - will be paying the same residential service charge. Table 9.6 presents the residential water service charge for residential customers on an individual meter and for residential customers on a common meter (previously levied a share of a meter based charge). Residential customers already pay the same sewerage service charge.
Table 9.6 Residential water service charge ($2011/12)
2011/12 2012/13 2013/14 2014/15 2015/16 % change 2012 to 2016
Individually metered 144.79 132.99 120.15 107.49 94.88 -34.5%
Common meter NA 70.00 78.29 86.59 94.88 NA
Note: The price impact for a property with a common meter will vary with the property’s different circumstances.
Non-residential water service charge
In an effort to maintain equity amongst similar customers, IPART’s determination is to charge all 20mm individually metered non-residential customers the residential water service charge.

9 Pricing decisions for Sydney Water’s water services
112 IPART Review of prices for Sydney Water Corporation’s water, sewerage, stormwater drainage and other services
All other non-residential customers will be levied a meter based charge which is either:
paid by the individual customer or,
shared by the number of customers on that meter.
We have maintained the previous proportions between revenue received from residential and non-residential water service charges. The non-residential water service charges are presented in Table 9.7 below.
Table 9.7 Non-residential water service charge
2011/12 2012/13 2013/14 2014/15 2015/16 % change 2012 to
2016
20mm individually metered property
144.79 132.99 120.15 107.49 94.88 -34.5%
Individual water service charge based on meter size of:
25mm connection 226.24 215.73 206.39 196.91 187.72 -17.0%
32mm connection 370.66 353.45 338.15 322.62 307.56 -17.0%
40mm connection 579.17 552.27 528.36 504.09 480.56 -17.0%
50mm connection 904.95 862.92 825.56 787.64 750.88 -17.0%
80mm connection 2,317 2,209 2,113 2,016 1,922 -17.0%
100mm connection 3,620 3,452 3,302 3,151 3,004 -17.0%
150mm connection 8,145 7,766 7,430 7,089 6,758 -17.0%
200mm connection 14,479 13,807 13,209 12,602 12,014 -17.0%
300mm connection 32,579 31,065 29,720 28,355 27,032 -17.0%
For meter sizes not specified above, the following formula applies
(Meter size)2 x 25mm charge/625
Where a meter is shared, the customer pays a share of the charge. For example, if there are 10 customers that share a 50mm meter, each customer would pay one tenth of the charge applicable to the 50mm meter.
Water usage charge
In past reviews, we set water usage charges with reference to LRMC derived on an average incremental cost (AIC) basis. As requested, Sydney Water has provided calculations for its estimates of LRMC which range from $1.76 to $2.50/kL and are consistent with IPART’s own calculated estimates ranging from $1.82 to $2.54/kL. The mid points of these ranges are $2.13 and $2.18/kL respectively. Whilst the current $2.10/kL water usage price paid by all Sydney Water’s customers is slightly below the midpoint of the range, we decided to maintain the current level in real terms for the duration of the determination.

9 Pricing decisions for Sydney Water’s water services
Review of prices for Sydney Water Corporation’s water, sewerage, stormwater drainage and other servicesIPART 113
Table 9.8 Water usage charges ($2011/12)
2011/12 2012/13 2013/14 201415 2015/16 % change 2012 to 2016
Water usage charge 2.10 2.10 2.10 2.10 2.10 0.0%
9.2 Unfiltered water charges
9.2.1 Summary of pricing decisions
Decision
21 IPART’s decision is to maintain the current approach to setting charges for unfiltered water. This means that the fixed service charge for unfiltered water will be the same as the fixed service charge for drinking water and the usage charge for unfiltered water will be $0.30 less than the usage charge for drinking water.
Unfiltered water is water that has been subject to chemical treatment, but not treated at a water filtration plant. Sydney Water currently only sells unfiltered water to BlueScope Steel’s Port Kembla plant in Wollongong.
There is a cost difference between unfiltered and drinking water, primarily in the cost of treating the water. Also, unfiltered water does not postpone investment in any form of water augmentation because it is dam water that would otherwise be treated and sold as drinking water. There may, however, be a very small amount of avoided costs of deferred investment in new treatment plants.
In the 2008 determination, IPART considered that the cost differential between unfiltered and drinking water should be reflected in the usage charge rather than the fixed service charge because unfiltered water is water that would have otherwise been treated and sold as drinking water. Therefore, the usage charge for unfiltered water was set as a uniform price so that it was $0.30 less than the usage charge for drinking water.
IPART has decided to maintain the usage charge for unfiltered water so that it is $0.30 less than the usage charge for drinking water because:
based on Sydney Water’s submission, the average cost of filtration can range from $0.26 to $0.32 depending on varying forecasts of how much drinking water its contracted filtration plants will provide
the discount of $0.30 used in the 2008 Determination is still within the range of possible average filtration costs.
Given that we have maintained our decision to reflect the cost difference between unfiltered water and drinking water in the usage charge, we have also left the fixed service charge so that it is the same as the fixed service charge for drinking water.

9 Pricing decisions for Sydney Water’s water services
114 IPART Review of prices for Sydney Water Corporation’s water, sewerage, stormwater drainage and other services
9.2.2 Sydney Water’s submission
Sydney Water has explored 2 broad approaches in setting the unfiltered water price:
setting a uniform price for the unfiltered water usage charge by subtracting the costs of filtration from the drinking water usage charge
setting a location specific charge for unfiltered water.
Sydney Water has submitted that its preferred approach is setting a uniform price for the unfiltered water usage charge by subtracting an average cost of filtration of $0.32. This is based on its contracts with private third party, build, own and operate (BOO) filtration plants and estimates of how much drinking water they will provide and is shown in Table 9.9.
Table 9.9 Estimated average BOO filtration costs ($2011/12)
2011/12 2012/13 2013/14 2014/15 2015/16
BOO filtered water (ML) 364,856 364,270 363,190 364,955 368,393
BOO payments ($'000, $2011/12)
116,153 116,365 116,830 117,631 117,662
BOO costs ($/kL, $2011/12) 0.32 0.32 0.32 0.32 0.32
Note: IPART adjusted using 2.5% for inflation to convert to BOO payments into $2011/12 which is consistent with SWC’s approach stated on p 461.
Source: Sydney Water’s submission to IPART’s review of Prices for Sydney Water Corporation’s water, sewerage, stormwater and other services, September 2011, Appendix 25, p 455,461 & IPART calculations.
Sydney Water has not commented on the fixed service charge for unfiltered water in its submission.
9.2.3 IPART’s analysis
IPART considers that Sydney Water has forecast somewhat low estimates for the amount of water that the BOO plants will filter, because they have set their proposed prices on SDP operating at full capacity over the next 4 years. In its submission, Sydney Water has estimated that it will provide about 490,000 ML of drinking water per year over the determination period of which some will be from the Sydney Desalination Plant (SDP).
As shown in Table 9.10 below, if the SDP were to operate at full capacity throughout this determination period, the average BOO cost would be around $0.32. If the SDP does not provide any drinking water to Sydney Water then the average BOO cost per kL would decrease to about $0.26 per kL.
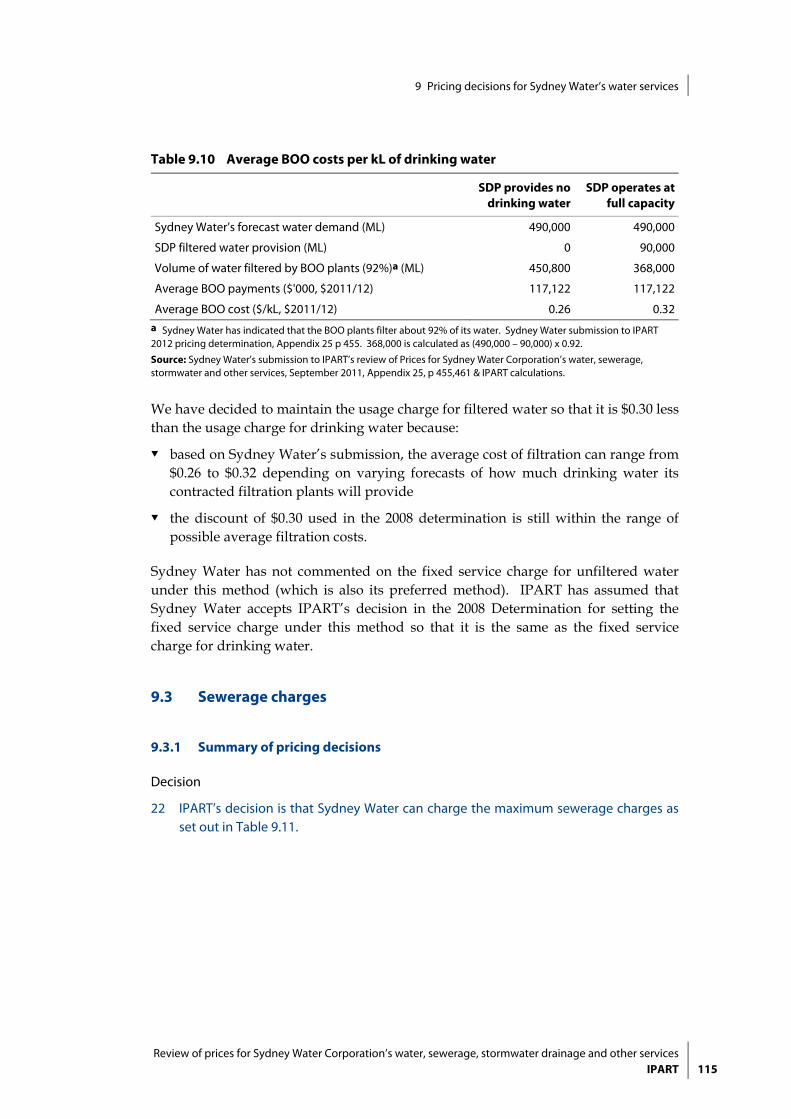
9 Pricing decisions for Sydney Water’s water services
Review of prices for Sydney Water Corporation’s water, sewerage, stormwater drainage and other servicesIPART 115
Table 9.10 Average BOO costs per kL of drinking water
SDP provides no drinking water
SDP operates at full capacity
Sydney Water’s forecast water demand (ML) 490,000 490,000
SDP filtered water provision (ML) 0 90,000
Volume of water filtered by BOO plants (92%)a (ML) 450,800 368,000
Average BOO payments ($'000, $2011/12) 117,122 117,122
Average BOO cost ($/kL, $2011/12) 0.26 0.32 a Sydney Water has indicated that the BOO plants filter about 92% of its water. Sydney Water submission to IPART 2012 pricing determination, Appendix 25 p 455. 368,000 is calculated as (490,000 – 90,000) x 0.92.
Source: Sydney Water’s submission to IPART’s review of Prices for Sydney Water Corporation’s water, sewerage, stormwater and other services, September 2011, Appendix 25, p 455,461 & IPART calculations.
We have decided to maintain the usage charge for filtered water so that it is $0.30 less than the usage charge for drinking water because:
based on Sydney Water’s submission, the average cost of filtration can range from $0.26 to $0.32 depending on varying forecasts of how much drinking water its contracted filtration plants will provide
the discount of $0.30 used in the 2008 determination is still within the range of possible average filtration costs.
Sydney Water has not commented on the fixed service charge for unfiltered water under this method (which is also its preferred method). IPART has assumed that Sydney Water accepts IPART’s decision in the 2008 Determination for setting the fixed service charge under this method so that it is the same as the fixed service charge for drinking water.
9.3 Sewerage charges
9.3.1 Summary of pricing decisions
Decision
22 IPART’s decision is that Sydney Water can charge the maximum sewerage charges as set out in Table 9.11.

9 Pricing decisions for Sydney Water’s water services
116 IPART Review of prices for Sydney Water Corporation’s water, sewerage, stormwater drainage and other services
Table 9.11 IPART’s decision on sewerage charges
2012/13 2013/14 2014/15 2015/16
Residential sewerage service charge ($2011/12)
546.34 551.78 556.29 560.85
Non-residential (20mm individually metered property) service charge ($2011/12)
546.34 551.78 556.29 560.85
Non-residential meter based service chargea ($2011/12) 973.94 1,125.08 1,300.39 1,500.02
Sewerage usage charge ($nominal) 1.40 1.30 1.20 1.10
a Meter based charge is based on a 25mm meter. Applicable meter charge is set using the following formula: (Meter size)2 x 25mm service charge/625.
Note: Charges for all possible meter sizes are listed in the Determination.
Table 9.11 shows that sewerage service charges for residential and 20mm individually metered non-residential customers remain relatively flat compared to the current charge of $539.53. This is because the costs of providing sewerage services remain relatively constant. Non-residential meter based service charges increase significantly, as these properties were previously cross-subsidised by non-residential strata properties, and the usage charge has declined, meaning that in order to recover a given amount of revenue, service charges need to increase.
The usage charge has decreased by $0.10 per year in nominal terms in order to transition to more cost-reflective levels.
9.3.2 Sydney Water’s submission
Residential sewerage service charges
Sydney Water currently charges all residential dwellings (houses, flats and units) a standard residential sewerage service charge with no additional sewerage usage charge.
Sydney Water proposes no change to this structure. However, its proposed sewerage service charge did increase substantially from the current 2011/12 level of $539.53 to $638.84 by the last year of this determination. Sydney Water also proposed a larger increase in the sewerage service charge of 12.3% in the first year of this determination. Sydney Water’s proposed sewerage service charges are shown below in Table 9.12.

9 Pricing decisions for Sydney Water’s water services
Review of prices for Sydney Water Corporation’s water, sewerage, stormwater drainage and other servicesIPART 117
Table 9.12 Residential sewerage service charges ($2011/12)
2011/12 2012/13 2013/14 2014/15 2015/16
Service ($/year) 539.53 605.82 618.40 629.00 638.84
Increase (%) 12.3% 2.1% 1.7% 1.6%
Source: Sydney Water’s submission to IPART’s review of Prices for Sydney Water Corporation’s water, sewerage, stormwater and other services, September 2011, p110.
Non-Residential sewerage service charges
Sydney Water currently charges 20mm stand-alone properties and multi-tenancy strata tenancies a standard sewerage service charge. Multi-tenancy single owner properties are charged a common meter charge.
Sydney Water did not propose a change to the non-residential sewerage service price structure. The proposed price increases for stand-alone properties and multi-tenancy stratas were the same as for residential sewerage service charges, and involved larger increases in prices in the first year of this determination. Sydney Water’s proposed non-residential sewerage service charges are shown in Table 9.13 below.
Table 9.13 Non-Residential Sewerage Service Charges ($2011/12)
2011/12 2012/13 2013/14 2014/15 2015/16
Stand-alone properties and multi-tenancy stratas
539.53 605.82 618.40 629.00 638.84
Annual Change 12.3% 2.1% 1.7% 1.6%
Source: Sydney Water’s submission to IPART’s review of Prices for Sydney Water Corporation’s water, sewerage, stormwater and other services, September 2011, p 110.
Non-residential sewerage usage charges
Sydney Water currently charges all non-residential sewerage customers $1.49/kL for all domestic strength effluent discharges above 500 kL pa. Sydney Water proposes to increase the sewerage usage charge to $1.59/kL and lower the discharge threshold to 200 kL pa. Sydney Water’s proposed sewerage usage charges are shown below in Table 9.14.
Table 9.14 Sewerage Usage Charges ($2011/12)
2011/12 2012/13 2013/14 2014/15 2015/16
Usage ($/kL) 1.49 1.52 1.55 1.57 1.59
Annual Change 2.0% 2.0% 1.3% 1.3%
Note: If the discharge allowance is not reduced to 200 kL Sydney Water is proposing to increase the sewerage usage charge to $1.77/kL.
Source: Sydney Water’s submission to IPART’s review of Prices for Sydney Water Corporation’s water, sewerage, stormwater and other services, September 2011, p138.

9 Pricing decisions for Sydney Water’s water services
118 IPART Review of prices for Sydney Water Corporation’s water, sewerage, stormwater drainage and other services
9.3.3 Submissions from other stakeholders
Submissions to the Sydney Water review tended to focus generally on the size of the overall bill increases rather than on price increases for individual services.
Many of the submissions received from stakeholders objected to the size of Sydney Water’s proposed price increases and argued that the size of the increases was excessive. Also of concern was that a large portion of the price increase occurred in the first year of the price path (this is reflected in the sewerage service charges with the majority of the overall increase occurring in the first year). As a means of overcoming the negative impacts of the price increases, some stakeholders suggested the phasing-in of price increases over the determination period.
For non-residential sewerage usage charges, stakeholder feedback has been received through our review of price structures. In the price structure review, Hunter Water, Gosford and Wyong Councils supported setting the non-residential sewerage usage charge with reference to the short run marginal cost (SRMC). The SRMC is the cost to Sydney Water of collecting, treating and disposing of an extra kilolitre of sewage. A move towards SRMC would see Sydney Water’s non-residential sewerage charges fall from current levels. The Property Council and Total Environment Centre both argue that the sewerage usage charge should remain closer to long run marginal cost to create incentives to minimise discharge. Issues surrounding charges for sewerage are addressed further in our price structures review that is being undertaken concurrently with this review.
9.3.4 IPART’s analysis
Residential sewerage service charge
Decisions
23 IPART’s decision is that Sydney Water can charge the maximum residential sewerage charges as set out in Table 9.15.
Table 9.15 Residential sewerage service charges ($2011/12)
2011/12 2012/13 2013/14 2014/15 2015/16 % change 2012 to 2016
Residential 539.53 546.34 551.78 556.29 560.85 4.0%
We have made no price structure changes to the residential sewerage service charge. As was the process for water, we have maintained the previous proportions between revenue received from residential and non-residential sewerage charges. This is to remove the potential for introducing cross subsidies between residential and non-residential customers when implementing the price structure changes made to non-residential charges.

9 Pricing decisions for Sydney Water’s water services
Review of prices for Sydney Water Corporation’s water, sewerage, stormwater drainage and other servicesIPART 119
Non-Residential sewerage service charge
24 IPART’s decision is that Sydney Water can charge the maximum non-residential sewerage service charges as set out in Table 9.16.
Consistent with the pricing decisions made for water, we have set the charge for a 20mm individually metered non-residential property to be equal to the residential sewerage service charge. All other non-residential customers will be levied a meter based charge which is either paid by the individual customer or shared by the number of customers on that meter. Also, customers who share a meter will no longer be individually subject to a minimum sewerage charge which was the 20mm service charge. The sewerage service charges are presented in Table 9.16 below.
Table 9.16 Non-residential sewerage service charge ($2011/12)
2011/12 2012/13 2013/14 2014/15 2015/16 % change 2012 to
2016
Non-residential 20mm individually metered property
539.53 546.34 551.78 556.29 560.85 4.0%
Individual water service charge based on meter size of:
25mm connection 843.02 974 1,125 1,300 1,500 77.9%
32mm connection 1,381 1,596 1,843 2,131 2,458 77.9%
40mm connection 2,158 2,493 2,880 3,329 3,840 77.9%
50mm connection 3,372 3,896 4,500 5,202 6,000 77.9%
80mm connection 8,633 9,973 11,521 13,316 15,360 77.9%
100mm connection 13,488 15,583 18,001 20,806 24,000 77.9%
150mm connection 30,349 35,062 40,503 46,814 54,001 77.9%
200mm connection 53,954 62,332 72,005 83,225 96,001 77.9%
300mm connection 121,396 140,247 162,012 187,256 216,003 77.9%
For meter sizes not specified above, the following formula applies
(Meter size)2 x 25mm charge/625
We note that the 77.9% increase in non-residential meter based service charges is substantial. However, we note that most non-residential customers will face lower increases. These charges are applicable for customers on stand-alone meters only. The current sewerage charging structure gave rise to significant inequities between similar multi-premise properties and a cross subsidisation between non-residential customers on an individual meter and those on a common meter. Changing the pricing structure removes these inequities, and ensures that all customers pay a fair share, but results in larger price increases for some customers. Customers who share a meter will no longer be subject to a minimum service charge of about $546 but will now pay a share of the service charge for that meter. For example, if there were 8 equal strata units sharing a 40mm meter then in the first year of this determination,

9 Pricing decisions for Sydney Water’s water services
120 IPART Review of prices for Sydney Water Corporation’s water, sewerage, stormwater drainage and other services
each strata unit would pay about $312 ($2011/12) each rather than the 20mm charge of about $546 ($2011/12).
Another reason for the increase in sewerage service charges is the reduction in the sewerage usage charge, to better reflect costs. The reduction in the free allowance threshold offsets this to some extent because some customers will pay more in usage charges as the free allowance threshold falls below their discharge volumes. Overall however, the result is a reduction in revenue collected from sewerage usage charges, resulting in an increase in the revenue required from service charges.
Customers should be advised that they may elect to move from a larger meter size to a 20mm meter if an assessment of their requirements confirms that a 20mm meter is adequate. Customers requesting to move from a larger meter to a 20mm meter will pay a charge to move to a smaller meter.
Non-Residential sewerage usage charge
25 IPART’s decision is to phase-in a decrease in the usage charge for sewerage from the current $1.49 per kL to $1.10 (in nominal terms) per kL by 2015/16.
26 IPART’s decision is to phase-in a reduction to the free allowance threshold from the current 500 kL per year to 300 kL per year by the end of the determination period.
Our decision is to reduce the sewerage usage charge throughout the determination period. This is because we estimate that the short run marginal cost of collecting, transporting, treating and disposing of sewage is less than $0.30 per kL and so we have phased-in a decrease in the usage charge for sewerage from the current $1.49 per kL to $1.10 (in nominal terms) per kL by 2015/16. We have decided to set the usage charge having regard to the SRMC rather than LRMC because the disaggregated nature of sewerage catchments makes it difficult to calculate a single LRMC and applying the LRMC of one catchment across the whole network would be distortionary.
We have also decided to lower the free allowance threshold from the current 500 kL to 150 kL per year. This is because we estimate that the average discharge volume from residential properties is about 150 kL per year and this is embodied in their service charge, hence the service charge for non-residential properties should embody a similar amount. Given the potential impact on some customers, we have decided to phase-in the reduction by decreasing the threshold by 50 kL per year. This means that for this determination, the free allowance threshold decreases from the current 500 kL per year to 300 kL per year by the end of this determination period, with a view to reducing it ultimately to 150 kL per year in the following Determination period.
Table 9.17 shows our decisions for the usage charge and the free allowance threshold.

9 Pricing decisions for Sydney Water’s water services
Review of prices for Sydney Water Corporation’s water, sewerage, stormwater drainage and other servicesIPART 121
Table 9.17 Sewerage usage charges and free allowance threshold ($nominal)
2011/12 2012/13 2013/14 2014/15 2015/16 Change 2011/12 to
2015/16
Sewerage usage charge 1.49 1.40 1.30 1.20 1.10 -0.39
% change -6% -7% -8% -8% -26%
Free allowance threshold (kL pa)
500 450 400 350 300 200
The service charge for sewerage is calculated as a residual from the sewerage usage charge and the free allowance threshold so that in total Sydney Water receives the revenue we determine as required for sewerage services.
Customers can also request to have their discharge factor reassessed if they think their current discharge factor is not accurate.
9.4 Stormwater drainage charges
9.4.1 Summary of pricing decisions
Decision
27 IPART’s decision is that stormwater drainage charges will transition to area based charges, with a low impact discount for large non-residential customers who have minimal stormwater runoff, as shown in Table 9.18.
Stormwater drainage services are largely the responsibility of the local councils in Sydney Water’s area of operations. Sydney Water owns and operates some stormwater drainage assets, primarily trunk drainage. Sydney Water supplies stormwater drainage services to around 520,000 customers which is approximately 25% of the total customer base. At present there is 1 residential charge and 1 non-residential charge.
In 2005, we requested Sydney Water develop a proposal for an area based stormwater drainage charging scheme. At the time of the 2008 Determination, Sydney Water had not completed its proposal. In its submission to this review Sydney Water included an area based stormwater drainage charge, but did not endorse the proposal. Sydney Water proposes that we maintain the current price structure.

9 Pricing decisions for Sydney Water’s water services
122 IPART Review of prices for Sydney Water Corporation’s water, sewerage, stormwater drainage and other services
Table 9.18 Prices for stormwater drainage services ($2011/12)
2012/13 2013/14 2014/15 2015/16
Apartments 48 40 35 29
Houses 48 66 75 79
Non-residential 0-200m2 126 40 35 29
Non-residential 201-1,000m2 and low impact
126 106 88 79
Non-residential 1,001-10,000m2 126 194 264 396
Non-residential 10,000-45,000m2 126 880 1,320 1,760
Non-residential > 45,000m2 126 1,760 3,080 4,400
9.4.2 Sydney Water’s submission
Sydney Water’s submission recommended maintaining the current price structure. They consider the current structure to be working well, citing very few complaints from customers.
Sydney Water includes an area based stormwater drainage charge, as we requested in the 2008 price review.
Sydney Water has analysed this proposal extensively and cannot see sufficient justification to change the current structure.111
Sydney Water analyses 2 options:
a ‘pure’ area based charge where every customer’s charge is linked to its property size
a ‘simplified/smoothed’ area based charge where residential properties are grouped into single premise dwellings and multi-premise dwellings, and non-residential properties are grouped into 4 bands with those over 10,000m2
having a charge linked to their property size.
Sydney Water notes that property size is not perfectly correlated with contribution to stormwater. It notes that other factors such as localised rainfall, topography and soil type also have an effect. Sydney Water also states that it does not support discounts for large properties with a low impact.
9.4.3 Submissions from other stakeholders
The Total Environment Centre’s submission indicates that it supports an area based stormwater drainage charge, and recommends properties with a low ratio of impervious area and take measures to mitigate stormwater runoff should be given allowances.
111 Sydney Water’s submission to IPART’s review of Prices for Sydney Water Corporation’s water,
sewerage, stormwater and other services, September 2011, p 120.

9 Pricing decisions for Sydney Water’s water services
Review of prices for Sydney Water Corporation’s water, sewerage, stormwater drainage and other servicesIPART 123
The Shopping Centre Council of Australia (SCCA) in its submission to the draft report highlighted that may larger developments are required to install rainwater detention and/or reuse facilities which lowers the cost imposed by large customers on the stormwater network by reducing peak flows.
9.4.4 IPART’s analysis
We have considered Sydney Water’s and stakeholder submissions, and whilst we still consider area to be a key driver of stormwater/drainage costs we have refined our draft decision to also take account of other drivers of stormwater costs including slope, proportion of impervious area, land use and soil, localised rainfall and nature of land use and onsite retention and reuse facilities of many larger customers. We have also taken account of the community benefit that accrues equally to all of cleaner waterways, rivers and beaches.
Even within the differentiated residential band and the 5 band non-residential structure we have considered that there may be some large properties in Sydney Water’s area that have minimal runoff due to having a low level of impervious area or a slope that retains stormwater or water retention eg, golf courses that capture and reuse most of the water that falls on them. So the charges to these properties remain cost reflective we have allowed a low impact charge equal to the 200m2-1000m2 non-residential band provided the property meets the criteria determined by Sydney Water. Sydney Water will be required to provide these criteria to IPART for approval and publish them on their website no later than 31 March 2013 in time for the implementation of the new area based stormwater price structure from 1 July 2013.
Our decision has significant price impacts for some customers. The charge will be reduced for multi-premise dwellings and non-residential properties with an area smaller than 1,000m2; however, the charge will increase for houses and non-residential properties larger than 1,000m2, compared to the current charges. To mitigate the impact of these changes we have decided to transition to these charges over the determination period.
We recognise that for over 500 non-residential properties, there will be significant price increases. Under the current cost structure these large properties are being subsidised by small non-residential customers and multi-premise dwellings. These small properties currently contribute most of the stormwater drainage revenue while covering a small proportion of Sydney Water’s stormwater drainage catchment. Under our decision this cross subsidy will end.
9 Pricing decisions for Sydney Water’s water services
124 IPART Review of prices for Sydney Water Corporation’s water, sewerage, stormwater drainage and other services
9.5 Charges for the Rouse Hill Area
The stormwater drainage system in the Rouse Hill Area112 consists of large areas of open space to accommodate flood flows, natural creeks and grass lined channels, and artificial wetlands.
Currently Sydney Water owns and manages the trunk drainage services and about 215 hectares of flood prone land. Sydney Water also manages an additional 27 hectares of flood-prone land owned by other parties.
9.5.1 Summary of pricing decision on the Rouse Hill Stormwater Drainage Charge
Decision
28 IPART’s decision is that Sydney Water is to maintain, in real terms, the Rouse Hill Stormwater Drainage Charge (formerly the River Management Charge) over the determination period.
9.5.2 Sydney Water’s submission
As part of the 2008 price determination, Sydney Water agreed to review the River Management Charge (now called the Rouse Hill Stormwater Drainage Charge) including a review of costs and the level of cost recovery being achieved against the original charging methodology.113 In this methodology the River Management Charge would recover operating costs only (such as cleaning out trash racks, bush regeneration, weed and ground management).
In its submission Sydney Water presented the results of modelling the historic stormwater drainage operating costs for Rouse Hill. The estimated costs were derived from actual costs incurred in 2009/10. It should be noted that only one year of actual data was used. These operating costs were extrapolated using the historic profile of capital expenditures (such as land acquisitions and trash racks), assumed land covered by service contracts, customer numbers and other assumptions.
Using the extrapolated cost estimates, Sydney Water found that it did not recover its direct operating costs through the River Management Charge in any year until 2007/08. It estimated that the present value of the charge less direct operating costs between 1993 and 2025 is -$4.2 million ($2010/11). If an allocation is made for overhead costs, the present value drops to -$19.4 million.114
112 The Rouse Hill Area is defined in Schedule 8 and Attachment A of the 2012 Determination. 113 IPART, Review of prices for Sydney Water Corporation’s water, sewerage, stormwater and other services
- Final Report, June 2008, p 99. 114 Sydney Water’s submission to IPART’s review of Prices for Sydney Water Corporation’s water,
sewerage, stormwater and other services, September 2011, Appendix 20, p 370.

9 Pricing decisions for Sydney Water’s water services
Review of prices for Sydney Water Corporation’s water, sewerage, stormwater drainage and other servicesIPART 125
Assuming that the current charges are indexed by inflation and growth forecasts are achieved, Sydney Water concludes in its submission that it would finally recover its cumulative total operating costs in 2022/23.115
Sydney Water proposes to maintain the River Management Charge in real terms at $128.58 ($2011/12)116 over the determination period.
9.5.3 Submissions from other stakeholders
Lend Lease’s submission117 explained that residences in the Rouse Hill Regional Centre development (referred to as `The New Rouse Hill’) will operate a community title scheme. Under this scheme extensive areas of open space will remain in community ownership with ongoing operating and maintenance activities to be at the community cost. These costs will be met through a community scheme fee levied each year.
In its submission Lend Lease argued that Sydney Water’s River Management Charge should not be charged by Sydney Water on certain categories of land (such as, Community Titled Land), or it should be substantially adjusted, to remedy the situation of the current double charging.
We asked Sydney Water to provide a response to Lend Lease’s submission. Sydney Water explained that a Community Titled Scheme is not an exempt property under Schedule 2 of the Sydney Water Act 1994.118 All properties within the declared catchment area are subject to the service charges.
Sydney Water clarified that the New Rouse Hill development is a small part of a declared catchment area that is serviced by Sydney Water’s trunk drainage system. It argued the levying of a River Management Charge is appropriate and justified to contribute towards Sydney Water’s costs of operating and maintaining the drainage system.
While Sydney Water is entitled to charge properties for services provided by it in the exercise of its functions, we consider the reporting of the operating expenditure to the Rouse Hill community needs to be improved to provide greater transparency to customers of what they are being charged for.
9.5.4 IPART’s analysis
Sydney Water’s modelling of the operating costs associated with the River Management Charge was limited as only one year of actual data was used and a number of assumptions were used to reconstruct data over a 30-year period.
115 Ibid, p 370. 116 Ibid, p 171. 117 Lend Lease GPT (Rouse Hill) Pty Ltd, submission dated 5 September 2011. 118 Sydney Water letter dated 11 November 2011.

9 Pricing decisions for Sydney Water’s water services
126 IPART Review of prices for Sydney Water Corporation’s water, sewerage, stormwater drainage and other services
Despite the limitations of the modelling, we accept Sydney Water’s proposal that the River Management Charge should be maintained in real terms over the determination period.
Currently there are a number of stormwater drainage charges that a resident at Rouse Hill could be paying to different parties depending on who owns and manages the stormwater drainage assets including:
Sydney Water’s River Management Charge (now the Rouse Hill Stormwater Drainage Charge): covers the operating costs of Sydney Water’s trunk drainage assets including flood prone land and wetlands.
Council rates: covers council’s existing stormwater drainage costs such as reticulated lot and street drainage. For example, a resident in Rouse Hill could be paying rates to The Hills Shire Council.
Community levies: pays for the maintenance of Community Titled land which includes open space that provides stormwater drainage service.
We believe that Sydney Water’s record keeping and reporting of the operating costs for their trunk drainage assets at Rouse Hill should improve. There is a need to provide greater transparency of Sydney Water’s expenditure to its customers at Rouse Hill.
9.5.5 Summary of pricing decision on Rouse Hill Stormwater Drainage Charge (Rouse Hill Land Charge)
Decision
29 IPART’s decision is to determine a Rouse Hill Stormwater Drainage Charge (Rouse Hill Land Charge) of $953.94 per year for new properties in the Rouse Hill Area for 5 years following the date of connection of a new property, noting that these are not stormwater drainage charges for the purposes of s65 of the Sydney Water Act 1994.
9.5.6 Sydney Water’s submissions
Historically Sydney Water charged a Rouse Hill Trunk Drainage System Developer charge to all development that drained to this system.119 In December 2008, the NSW Government decided to set this developer charge to zero to lower the costs of development in Sydney’s greenfield areas.
Currently, Sydney Water has no means of recovering the capital costs for the Rouse Hill trunk drainage system. In its submission, Sydney Water argues that the funding model needs to change as there are significant future land purchases required at Rouse Hill.
119 The developer charge for one equivalent tenement of development in the drainage system was
$4,098 ($2000/01). Sydney Water Corporation, 2001 Development Servicing Plan – Rouse Hill Trunk Drainage System, Executive Summary.

9 Pricing decisions for Sydney Water’s water services
Review of prices for Sydney Water Corporation’s water, sewerage, stormwater drainage and other servicesIPART 127
Land purchases make up the majority of Sydney Water’s capital expenditure in Rouse Hill. Sydney Water states that it is obligated under the Baulkham Hills and Blacktown Local Environment Plans, as the designated acquisition authority for land zoned for trunk drainage, to acquire land when landowners satisfy certain conditions.120
Sydney Water proposes that these capital costs should be recovered from all sewerage customers. Sydney Water reasons that all customers are indirectly benefiting from the stormwater drainage capital expenditure at Rouse Hill by reducing nutrients in the Hawkesbury-Nepean river system. Sydney Water estimates that the annual sewerage charge would increase by $2 by 2015/16 and $4 by 2019/20 ($ nominal).121
In its submission to the draft report,122 Sydney Water raised a number of concerns with the proposed new charge:
It is inequitable because it singles out one group of Sydney Water’s customers and requires them to pay more for the service and imposes a major charge in the North West Growth Centre.
It will have a major impact on customers, especially those who may not be aware of the charge when buying or moving into new Rouse Hill properties.
It will not allow Sydney Water to recover its costs.
It is expected to lead to an increase in bad debt.
It will require a substantial effort and costs to implement, administer and maintain.
Rouse Hill is not a declared stormwater drainage area under s65 of the Sydney Water Act 1994, and as a result the charges cannot be levied as stormwater drainage area charges under s65.
9.5.7 Submissions from other stakeholders
There were no submissions from other stakeholders on this issue.
120 Sydney Water’s submission to IPART’s review of Prices for Sydney Water Corporation’s water,
sewerage, stormwater and other services, September 2011, Appendix 20, p 370. 121 Sydney Water’s submission to IPART’s review of Prices for Sydney Water Corporation’s water,
sewerage, stormwater and other services, September 2011, Appendix 20, p 385. 122 Sydney Water’s submission on IPART’s draft determination, 13 April 2012, pp 22-23.

9 Pricing decisions for Sydney Water’s water services
128 IPART Review of prices for Sydney Water Corporation’s water, sewerage, stormwater drainage and other services
9.5.8 IPART’s analysis
To address the question of who should pay for the provision of stormwater drainage infrastructure at Rouse Hill it is important to establish:
what services are being provided by this infrastructure
who benefits from these services either directly or indirectly.
Rouse Hill residents are directly benefiting as the land purchases help to prevent their properties from flooding. The remainder of the capital expenditure is for civil projects (such as constructing grass lined channels or artificial wetlands) and the provision of trash racks to remove rubbish from the water. This expenditure improves the quality of the water entering the Hawkesbury-Nepean river system and indirectly benefits Sydney Water’s general customers.
We believe that Sydney Water’s proposal to recover costs from sewerage customers does not reflect the fact that Rouse Hill customers are the major and direct beneficiary of Sydney Water’s land purchases as this protects their properties from flooding.
Therefore, we have decided that the most appropriate funding model is to apportion costs using a `beneficiary pays principle’. Applying this principle, 70% of the costs of future land purchases for drainage and stormwater management should be borne by the new residents at Rouse Hill. The remainder, or 30%, of the capital expenditure on civil projects should be recovered from Sydney Water’s sewerage customers. We believe that this is the most equitable approach as customers are being asked to pay for the benefits they receive. These proportions have been calculated using the NPV model outlined below.
Capital costs to be recovered
As part of the operating and capital expenditure review, Atkins Cardno were asked to review the efficiency and prudence of historic and forecast capital expenditure of Sydney Water’s stormwater drainage activities in the Rouse Hill Area.
Atkins Cardno123 found that the historic expenditure at Rouse Hill was prudent. In terms of future expenditure, Atkins Cardno argued that the $7m that customers have funded for land acquisition in the current determination period should be carried forward into the 2012 price path. Also given uncertainties in timing of capital expenditure, Atkins Cardno proposed to defer $2.5m of expenditure. This would result in a reduction in allowable capital expenditure of $9.5m in the future price path (ie, $7m + $2.5m). We have made an adjustment of $2.375m of future capital expenditure for each of the 4 years commencing 2012/13.
123 Email from Nigel Jones from Atkins Cardno on 18 December 2011.

9 Pricing decisions for Sydney Water’s water services
Review of prices for Sydney Water Corporation’s water, sewerage, stormwater drainage and other servicesIPART 129
In response to Sydney Water’s comment that they will not recover their full costs over 10 years, we have adjusted the financial model to recover capital costs of $5.95m over 4 years commencing from 2016/17. It should be noted that there is some uncertainty as to the timing of Sydney Water’s purchases of flood prone land.
Net Present Value (NPV) model
We have developed a NPV model to calculate the value of a capital charge for new Rouse Hill residents. The model uses the following information:
Capital expenditure data over 10 years provided by Sydney Water in its submission124. This data has been converted to $2011/12 using an inflation rate of 2.5%.
Capital expenditure data has been adjusted to reflect advice from Atkins Cardno and to allow Sydney Water to recover its costs, as described above.
A discount rate of 6.6% pre-tax WACC reflecting pre-tax cash flows provided by Sydney Water.
The timing of revenues are for a quarterly payment of the charge, reflecting Sydney Water’s billing preference.
An annual residential growth rate of 4.5% and non-residential growth rate of 0.7%. These rates use information provided in Sydney Water’s Annual Information Return.
These adjustments to the NPV model increase the charge to $953.94 per year over a 5 year period.
We considered a number of options for recovering the capital charges from new customers at Rouse Hill. We decided that a 5-year charge of $953.94 per year was the most appropriate for new customers at Rouse Hill and for Sydney Water to recover its costs.
Other issues
In its submission on the draft report, Sydney Water noted that Rouse Hill is not a declared stormwater drainage area under s65 of the Sydney Water Act 1994 and that the charge cannot therefore be levied under that section.
To address Sydney Water’s concerns, the determination notes that the Rouse Hill Stormwater Drainage Charge (Rouse Hill Land Charge) are not stormwater drainage area charges for the purpose of s65 of the Sydney Water Act 1994.
124 Sydney Water’s submission to IPART’s review of Prices for Sydney Water Corporation’s water,
sewerage, stormwater and other services, September 2011, Appendix 20, p 383.

9 Pricing decisions for Sydney Water’s water services
130 IPART Review of prices for Sydney Water Corporation’s water, sewerage, stormwater drainage and other services
9.6 Recycled water
9.6.1 Summary of pricing decisions
Decision
30 IPART’s decision is that Sydney Water can charge customers of the Rouse Hill recycled water scheme a usage charge of 80% of the potable water price and remove the service charge.
31 IPART’s decision is that Sydney Water is to set the prices for all other mandated recycled water schemes in accordance to IPART’s 2006 Guidelines “Pricing arrangements for recycled water and sewer mining – SWC, HWC, GSC, WSC”.
32 IPART’s decision is that Sydney Water is able to include $20.1 million in avoided costs for the expansion of the Rouse Hill recycled water network in the RAB and therefore in prices.
Recycled water is highly treated sewage that is suitable for gardens, toilet flushing, steel making, replacing dam flows into river systems and other non-consumption uses. As per our 2006 Guidelines,125 we considered the avoided costs of recycled water and the prices charged to customers of mandated recycled water schemes. Sydney Water currently has, or is building, 5 mandated recycled water schemes:
Rouse Hill
Hoxton Park
Colebee
Oran Park and Turner Road
Ropes Crossing.
There is a cost difference between recycled and drinking water, primarily in the higher cost of treating sewage for re-use compared to the lower cost of treating fresh water. Recycled water can also provide avoided costs elsewhere in the distribution and supply system. For example, the construction of recycled water systems delays the need for water supply augmentation and may avoid additional costs to traditional sewerage systems.
In the 2005 and 2008 Determination, we set prices for the Rouse Hill recycled water scheme. These prices were set in line with our pricing guidelines.
125 IPART, Pricing Arrangements for Recycled Water and Sewer Mining – SWC, HWC, GSC, WSC, 2006.

9 Pricing decisions for Sydney Water’s water services
Review of prices for Sydney Water Corporation’s water, sewerage, stormwater drainage and other servicesIPART 131
In their submission, Sydney Water requested we set prices for Rouse Hill recycled water scheme, but not for the other mandated schemes as they are not sufficiently established. Sydney Water proposed that the recycled water usage charge remain pegged at 80% of the charge for drinking water and that the recycled water service charge be removed. Sydney Water also proposed that $19.3 million and $2.3 million in avoided costs should be added to the sewerage and water RABs, respectively.
We have decided to set prices for Rouse Hill again in this determination. We have decided to accept Sydney Water’s proposal to set the recycled water usage charge at 80% of the charge for drinking water and to remove the recycled water service charge. It is our intention for this to be the last time we set prices for recycled water schemes.
In future determinations we expect that a more ‘light handed’ approach to recycled water pricing be taken, with Sydney Water required to set prices according to our guidelines, and we will perform a price monitoring role. We are making this change as it was foreshadowed by the Guidelines, there are an increasing number of small schemes that would require increased resources to regulate them, and that setting prices for these schemes requires detailed information and we consider Sydney Water may be better placed than us to set these prices. This approach will result in proportionate regulation. Details of this approach are explained in section 9.6.4.
Our decision is that Sydney Water can include $20.1 million of avoided costs for the expansion of the Rouse Hill recycled water network in the RAB and therefore in prices.
9.6.2 Sydney Water’s submission
Recycled water prices
In its submission, Sydney Water proposes that the Rouse Hill recycled water usage charge remains at 80% of the potable water price and the recycled water service charge be removed. Sydney Water considers the recycled water service charge to be unfair to small customers. It notes that if a recycled water customer uses less than 34kL of recycled water, they would pay more for their service than customers using the same amount of water but only connected to the potable water system. 23.5% of Rouse Hill customers are in this situation.
Sydney Water does not propose that we set prices for the other mandated recycled water schemes.

9 Pricing decisions for Sydney Water’s water services
132 IPART Review of prices for Sydney Water Corporation’s water, sewerage, stormwater drainage and other services
Avoided costs included in prices
In 2009, Sydney Water expanded the Rouse Hill recycled water network to reduce the nutrient load on the Hawkesbury-Nepean river system. Sydney Water considered 4 options to reduce the load and decided the expansion of the recycled water network was the most cost effective option. Sydney Water is seeking avoided costs, of $19.3 million, to transfer the burden of costs of expanding the network to sewerage customers. Sydney Water is also seeking to reduce recycled water developer charges in line with the savings water customers realise due to delays in water supply augmentation. Sydney Water calculates these savings to be $2.3 million.
Sydney Water does not seek avoided costs for any other recycled water scheme.
9.6.3 Atkins Cardno’s review of recycled water avoided costs
We asked Atkins Cardno to look at the ring-fencing of Sydney Water’s recycled water schemes. Atkins Cardno looked at Sydney Water’s ability to ring-fence its recycled water projects.
Overall [they] were satisfied that Sydney Water is able to ring-fence recycled water costs in an approximate manner but to an acceptable degree of accuracy.126
However, Atkins Cardno did express some concerns about the ring-fencing arrangements particularly that corporate overheads are not allocated to recycled water schemes. In addition, we note Atkins Cardno’s comment this applies to Sydney Water’s current ring-fencing arrangements for recycled water in general and is not an assessment of the Rouse Hill recycled water scheme ring-fencing in the previous determination.
9.6.4 IPART’s analysis
Recycled water prices
We intend for this to be the last time we set prices for Rouse Hill or any mandated recycled water schemes. In future determinations, we expect to implement ‘light handed’ regulation of recycled water prices for mandatory schemes.
We have considered Sydney Water’s submission with reference to our pricing guidelines. Our guidelines require that all operating costs are recovered and that the price balances supply and demand. Setting the recycled water price to 80% of the drinking water price, as we did in the 2008 Determination, has achieved a healthy balance between supply and demand. At 80% of the drinking water price, the Rouse Hill recycled water scheme recovers its operating costs. As such, we consider the
126 Atkins Cardno, Final Report Detailed Review of Sydney Water Corporation’s Operating and Capital
Expenditure, November 2011, p 152.

9 Pricing decisions for Sydney Water’s water services
Review of prices for Sydney Water Corporation’s water, sewerage, stormwater drainage and other servicesIPART 133
recycled water usage charge to be priced well and have decided to continue to peg it at 80% of the drinking water charge. Since all operating costs will be recovered by the usage charge, our decision is to adopt Sydney Water’s proposal to remove the recycled water service charge.
We have decided to require Sydney Water to set the prices of new schemes in accordance to our 2006 Guidelines because:
this change was foreshadowed by the 2006 Guidelines
the number of recycled water schemes is growing and determining prices for an increasing number of schemes would require more resources, increasing the costs of regulation
given the detailed information necessary to set prices, the small size of schemes, and that prices are set on a scheme by scheme basis, we consider that Sydney Water may be better placed, than we are, to determine prices for these schemes on an individual basis.
Our general approach is to undertake proportionate regulation which is best practice and ensures that prices are only regulated in proportion to the costs and benefits of regulation. The benefits of us determining each of numerous different small schemes are unlikely to outweigh the costs of regulation. Rather, we intend to move to robust price monitoring the implementation of the 2006 Guidelines.
For the reasons outlined above, we consider it unnecessary for us to determine prices for mandated recycled water schemes, instead we will price monitor.127 Over regulation in the future in such instances is likely to be unwarranted given the costs and benefits of regulation.
We expect that our ‘light handed’ regulatory approach to recycled water would require utilities to set their prices in accordance with our pricing principles, and we would monitor the prices they set. We anticipate our price monitoring regime will function as follows:128
we will undertake a review once every 5 years of the utilities’ application of the Guidelines and supporting calculations
a draft of the review report will be provided to the utility for comment prior to us finalising the review
review findings will be published and communicated to the customers of the recycled water scheme
depending on the review findings, we may make recommendations to the utility and/or Minister regarding the implementation of the Guidelines.
127 We note that while some customers are obliged to connect, they are free to disconnect from the
service for a fee. 128 However, we will consult more fully on this process when we revise our 2006 guidelines.

9 Pricing decisions for Sydney Water’s water services
134 IPART Review of prices for Sydney Water Corporation’s water, sewerage, stormwater drainage and other services
Recycled water avoided costs
We agree with Sydney Water that the option they chose was the least expensive option of those it surveyed. We note ring-fencing is a requirement of our recycled water guidelines and a pre-requisite for the consideration of inclusion of avoided costs. We also note that over the working life of the Rouse Hill recycled water scheme operating and capital costs have not been fully recovered by prices. In our draft report, we found that Sydney Water did not provide information on how Rouse Hill’s historical losses will be recovered. As such, without further information, we were concerned that the rest of Sydney Water’s operations may have subsidised these losses. If so, this would suggest that robust ring-fencing was not in place.
Our draft decision was to not award any avoided costs. On the basis of evidence provided at that time, we were not adequately convinced that the Rouse Hill recycled water scheme had been robustly ring-fenced.
In a letter to IPART, Sydney Water has subsequently provided further information regarding its process for ring-fencing Rouse Hill recycled water costs.129 In light of this, we reviewed the available data and information and our assessment is that there is enough evidence to award avoided costs. However, our assessment is that Sydney Water’s proposed avoided costs of $21.6 million have been incorrectly calculated. Our analysis suggests the correct figure to be awarded is $20.1 million.
9.7 Trade waste charges
Trade waste is defined as wastewater from commercial and industrial customers in which the concentrations of pollutants exceed a domestic equivalent.130 Sydney Water levies 3 types of trade waste charges:
pollutant charges, which are based on the mass of pollutants discharged to the sewer that are above domestic equivalents and recover the costs of transport, treatment and disposal of trade waste, as well as the corrosion costs of high strength wastes
trade waste ancillary and quarterly agreement charges, which recover the cost of establishing and processing applications for new trade waste agreements, administering existing agreements and conducting inspections
Wastesafe charges, which recover the cost of its electronic tracking system for monitoring the generation, collection, transportation and disposal of trade waste.
129 Sydney Water letter to IPART on outstanding issues from Sydney Water’s draft determination,
4 May 2012. 130 A domestic equivalent is a concentration or level that is the same as would be found in
household wastewater.

9 Pricing decisions for Sydney Water’s water services
Review of prices for Sydney Water Corporation’s water, sewerage, stormwater drainage and other servicesIPART 135
In our report on the 2008 determination, we indicated we would conduct a comprehensive review of Sydney Water’s trade waste charging arrangements as part of our 2012 review. Sydney Water agreed to participate in this review. It provided detailed information on its trade waste costs, and proposed substantial changes in its trade waste charges in its initial submission to the 2012 review.
We considered this submission, and held a workshop with Sydney Water and key trade waste stakeholders to discuss the proposed trade waste charges. We also engaged an independent consultant, Deloitte, to review the submission and considered its findings and recommendations. This process identified a range of concerns about the initial submission, so we asked Sydney Water to provide a supplementary submission that addressed those concerns.
We did not receive the supplementary submission in time to consider it before making our draft determination, and so did not make draft decisions on pollutant, ancillary or quarterly agreement charges. We did make a draft decision on Wastesafe charges, and Sydney Water commented on that decision in its response to our draft report. We then held a second workshop with Sydney Water and key stakeholders to discuss the utility’s supplementary submission and response to our draft decision on Wastesafe charges. We took account of all stakeholders’ views in making our final decisions on trade waste charges.
9.7.1 Summary of pricing decisions
IPART’s decisions on maximum prices for Sydney Water’s trade waste services are mostly in line with the prices proposed in Sydney Water’s supplementary submission and discussed at the second trade waste workshop.131 In summary:
We accepted the industrial pollutant charges proposed in the supplementary submission. These provide for prices to transition to cost-recovery levels more gradually than initially proposed, and clarify that new temperature and pH charges will be levied on customers discharging to ‘corrosion impacted’ sewerage systems only, as well as the thresholds beyond which these charges will apply.
We generally accepted the commercial pollutant charges proposed in the supplementary submission. These charges:
– no longer differentiate between customers based on whether they discharge to a primary or a secondary or tertiary sewage treatment plant (STP)
– continue to differentiate based on the quality of the trade waste they discharge, but there is a smaller number of quality categories
– transition to cost-recovery levels over the determination period.
131 Held on 26 April 2012.

9 Pricing decisions for Sydney Water’s water services
136 IPART Review of prices for Sydney Water Corporation’s water, sewerage, stormwater drainage and other services
While Sydney Water proposed to set ‘site specific’ charges for shopping centres with centralised pre-treatment equipment, we decided to set maximum charges for these customers in line with the low strength BOD food charge. This is because we are required under the IPART Act to set maximum prices for all Sydney Water’s regulated services.
We accepted the trade waste ancillary charges proposed in Sydney Water’s submission, which involve increases in some of these charges and no change in others.
We accepted the industrial trade waste quarterly agreement charges proposed in the initial and supplementary submissions, which include differential charges based on the customer’s ranking on a risk index.
We generally accepted the new Wastesafe charging system proposed in the submission. This system includes a fixed charge per waste trap, plus charges for inspections due to missed pump-outs. However, we decided to set the fixed charge per waste trap at $23.21 per quarter, in line with Deloitte’s recommendation. We also decided that the new system will be introduced on 1 July 2013, as discussed at the second workshop, to give customers reasonable time to adjust.
Although stakeholders did not have the opportunity to comment on most of these decisions in draft form, we consider they had adequate opportunities to provide comment on Sydney Water’s proposals through the trade waste workshops we conducted and in writing. We note that many stakeholders commented that they had found the workshops useful in resolving trade waste issues in a short timeframe, and felt that their views had been taken into account.
9.7.2 Sydney Water’s submissions on trade waste charges
As part of its initial submission to the 2012 review (which we received in September 2011), Sydney Water proposed significant changes to its trade waste charges. After considering this submission, the findings and recommendations of Deloitte’s review of the submission, and the views expressed by stakeholders at the first trade waste workshop, we identified a number of shortcomings and concerns with the submission. In particular, we considered that the initial submission:
Did not provide a full breakdown of the costs of providing some individual trade waste services. In addition, the costs of corrosion used to set some of the proposed prices were based on a study of 3 primary STPs, and it was not clear that these costs apply equally to secondary and tertiary STPs.
Did not provide sufficient detail on the cost allocation methodology Sydney Water had used for trade waste charges. This meant we were not able to assess the rationale for and robustness of this methodology, or determine whether it was appropriate and the proposed charges were efficient and cost reflective (and thus consistent with the 2004 Trade Waste Pricing Principles).

9 Pricing decisions for Sydney Water’s water services
Review of prices for Sydney Water Corporation’s water, sewerage, stormwater drainage and other servicesIPART 137
Did not provide information or analysis on the total impacts of the proposed charges on trade waste customers’ total bills. We considered these impacts were likely to be significant, and that further analysis was needed.
Where the proposed charges were likely to lead to large bill impacts, did not provide for prices to transition to the level required to recover costs over the determination period, to mitigate adverse impact on customers.
Did not clearly explain the circumstances in which several proposed new charges would apply.
We also considered that Sydney Water had not adequately consulted customers in developing the proposed prices for trade waste services included in the initial submission, and that further consultation was necessary.
In light of the above concerns, we asked Sydney Water to make a supplementary submission on trade waste charges that addressed these concerns. It provided the supplementary submission in March 2012. We held a second trade waste workshop to discuss this submission with Sydney Water and other trade waste stakeholders in April 2012.
Overall, we were satisfied that the supplementary submission addressed all of the above concerns. The submission showed that Sydney Water had comprehensively revised the proposed trade waste charges included in its initial submission. While the proposed charges stayed broadly the same, there was provision for prices to transition to cost-recovery levels to mitigate adverse impacts on customers. The submission also included analysis of the impacts of its proposed prices on customers’ total bills, and this analysis demonstrated that these impacts were not excessive.
Sydney Water noted that the transition arrangements included in the supplementary submission would mean it under-recovered some of its trade waste costs during the 2012 determination period. It requested that IPART take the under-recovery amount into account when setting water and sewerage charges, in line with the approach we have taken in previous determinations. We have done this and expect that together, our pricing decisions will allow Sydney Water to recover the full efficient costs of providing its trade waste services by 2015/16.

9 Pricing decisions for Sydney Water’s water services
138 IPART Review of prices for Sydney Water Corporation’s water, sewerage, stormwater drainage and other services
9.7.3 Industrial pollutant charges
Decision
33 IPART’s decision is that Sydney Water can charge maximum industrial pollutant charges shown in Table 9.19.
Table 9.19 Maximum pollutant charges for industrial customers ($2011/12)
Charge Unit 2011/12 2012/13 2013/14 2014/15 2015/16
BOD – primary WWTPsa
$/kg of mass above domestic
strength
a:0.124
b:0.0184
0.177
0.050
0.203
0.070
0.229
0.090
0.255
0.110
BOD – secondary and
tertiary WWTPsa
$/kg of mass above domestic
strength
a:0.698
b:0.0184
1.080
0.050
1.271
0.070
1.462
0.090
1.652
0.110
SS-primary WWTPs
$/kg of mass above domestic
strength
0.887 0.455 0.458 0.460 0.462
SS – secondary and tertiary
WWTPs
$/kg of mass above domestic
strength
0.887 1.067 1.157 1.247 1.337
Grease – primary WWTPs
$/kg of mass above domestic
strength
1.250 0.410 0.413 0.415 0.416
Grease – secondary and
tertiary WWTPs
$/kg of mass above domestic
strength
1.250 1.261 1.266 1.272 1.277
Nitrogen – secondary/terti
ary inland WWTP
$/kg of mass above domestic
strength
0.175 0.711 0.979 1.247 1.514
Phosphorous – secondary/terti
ary inland WWTP
$/kg of mass above domestic
strength
1.386 3.003 3.811 4.619 5.428
pH – corrosion impacted
catchment only
$/pH/ML of wastewater of
pH < 7.0
N/A 23.003 34.504 46.005 57.506
Temperature – corrosion impacted
catchment only
$/ºC/ML of wastewater of temperature >
25ºC
N/A 2.547 3.820 5.093 6.367
a Where the BOD charge is calculated as: BOD $/kg = a + [b x (BOD mg/L)/600].
Source: Sydney Water submission to IPART’s Review of prices for Sydney Water Corporation’s water, sewerage, stormwater and other services, 16 September 2011.

9 Pricing decisions for Sydney Water’s water services
Review of prices for Sydney Water Corporation’s water, sewerage, stormwater drainage and other servicesIPART 139
Sydney Water’s submission
In its supplementary submission, Sydney Water revised its proposed pollutant charges for industrial customers so prices to transition to the cost-recovery level more gradually, in response to stakeholder feedback. It also clarified that the new temperature and pH charges it proposed to introduce would apply only to customers discharging trade waste to sewerage systems it has declared to be ‘corrosion impacted’ and who are not committed to or complying with an effluent improvement program.132 It also indicated that the relevant charge would apply where the customer’s trade waste:
has a temperature greater than 25ºC, or
has a pH less than 7.
Sydney Water stated that it regularly assesses its sewerage networks to identify systems affected by corrosion and odour. Sydney Water publishes this assessment on its website. Businesses affected will be notified in writing. Charges for affected customers will only apply one year after the sewerage system is declared to be ‘corrosion impacted,’ which gives customers time to commit to an effluent improvement program to improve their sewage quality.
IPART’s analysis
After considering the supplementary submission and the comments made at the second workshop, we are satisfied the industrial pollutant charges Sydney Water proposed in that submission are efficient, cost-effective and consistent with our Trade Waste Pricing Principles. We are also satisfied that the proposed charges provide a reasonable transition to the new higher price levels. Although some customers will experience considerable increases in their trade waste bills, the analysis included in supplementary submission demonstrated the increases in their total Sydney Water bills are reasonable.133 Therefore, we have decided to set maximum industrial pollutant charges in line with those proposed in Sydney Water’s supplementary submission.
9.7.4 Commercial pollutant charges
Decision
34 IPART’s decision is that Sydney Water can charge maximum commercial pollutant charges as shown in Table 9.20.
132 This is an agreement with Sydney Water to achieve the required standards within an approved
length of time. 133 Sydney Water, Supplementary Submission, Trade Waste Costs and Charges, 8 March 2012,
pp 441-444.
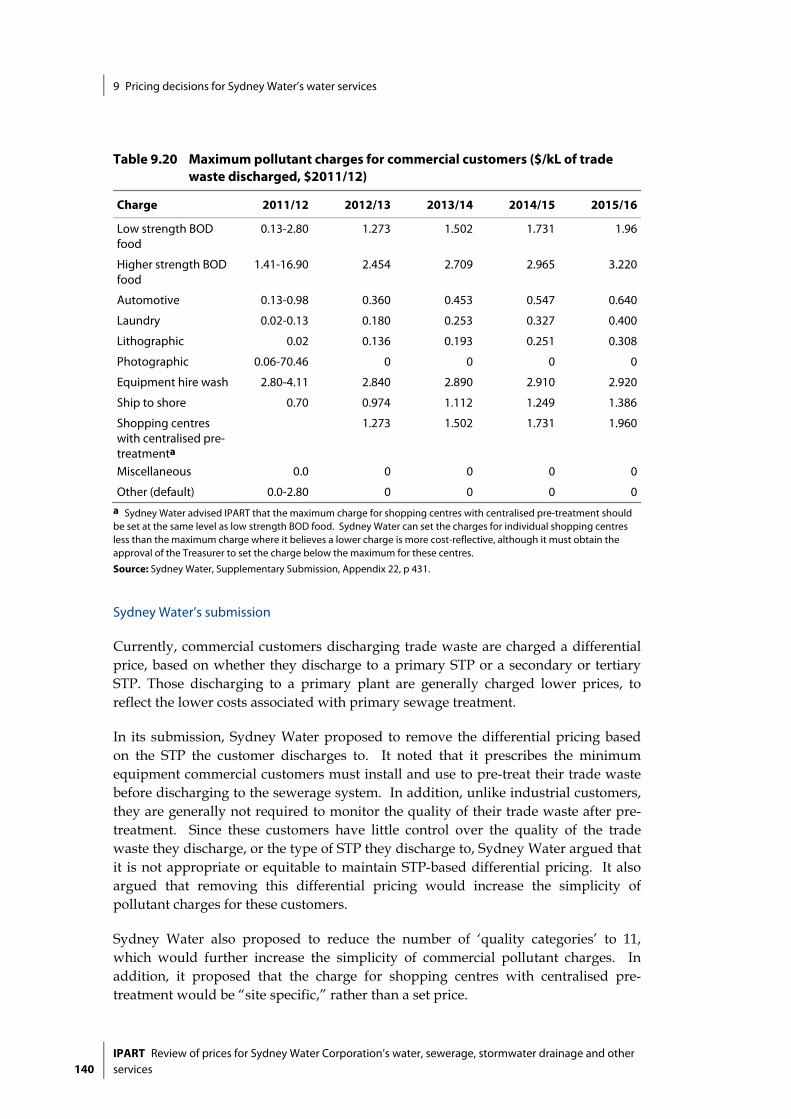
9 Pricing decisions for Sydney Water’s water services
140 IPART Review of prices for Sydney Water Corporation’s water, sewerage, stormwater drainage and other services
Table 9.20 Maximum pollutant charges for commercial customers ($/kL of trade waste discharged, $2011/12)
Charge 2011/12 2012/13 2013/14 2014/15 2015/16
Low strength BOD food
0.13-2.80 1.273 1.502 1.731 1.96
Higher strength BOD food
1.41-16.90 2.454 2.709 2.965 3.220
Automotive 0.13-0.98 0.360 0.453 0.547 0.640
Laundry 0.02-0.13 0.180 0.253 0.327 0.400
Lithographic 0.02 0.136 0.193 0.251 0.308
Photographic 0.06-70.46 0 0 0 0
Equipment hire wash 2.80-4.11 2.840 2.890 2.910 2.920
Ship to shore 0.70 0.974 1.112 1.249 1.386
Shopping centres with centralised pre-treatmenta
1.273 1.502 1.731 1.960
Miscellaneous 0.0 0 0 0 0
Other (default) 0.0-2.80 0 0 0 0 a Sydney Water advised IPART that the maximum charge for shopping centres with centralised pre-treatment should be set at the same level as low strength BOD food. Sydney Water can set the charges for individual shopping centres less than the maximum charge where it believes a lower charge is more cost-reflective, although it must obtain the approval of the Treasurer to set the charge below the maximum for these centres.
Source: Sydney Water, Supplementary Submission, Appendix 22, p 431.
Sydney Water’s submission
Currently, commercial customers discharging trade waste are charged a differential price, based on whether they discharge to a primary STP or a secondary or tertiary STP. Those discharging to a primary plant are generally charged lower prices, to reflect the lower costs associated with primary sewage treatment.
In its submission, Sydney Water proposed to remove the differential pricing based on the STP the customer discharges to. It noted that it prescribes the minimum equipment commercial customers must install and use to pre-treat their trade waste before discharging to the sewerage system. In addition, unlike industrial customers, they are generally not required to monitor the quality of their trade waste after pre-treatment. Since these customers have little control over the quality of the trade waste they discharge, or the type of STP they discharge to, Sydney Water argued that it is not appropriate or equitable to maintain STP-based differential pricing. It also argued that removing this differential pricing would increase the simplicity of pollutant charges for these customers.
Sydney Water also proposed to reduce the number of ‘quality categories’ to 11, which would further increase the simplicity of commercial pollutant charges. In addition, it proposed that the charge for shopping centres with centralised pre-treatment would be “site specific,” rather than a set price.

9 Pricing decisions for Sydney Water’s water services
Review of prices for Sydney Water Corporation’s water, sewerage, stormwater drainage and other servicesIPART 141
In its initial submission, Sydney Water proposed to set the new commercial pollutant charges at the level required to fully recover all trade waste costs from the start of the determination period. However, stakeholders at the first trade waste workshop expressed concern that this would involve significant price increases for some customers. In response to this, in its supplementary submission, Sydney Water proposed to transition these charges to the levels required to fully recover trade waste costs by 2015/16. It noted that this will mean it does not fully recover its trade waste costs until the last year of the 2012 period, and that the shortfall in the first 3 years will need to be recovered from other customers through sewerage prices.
IPART’s analysis
In general, we consider that the commercial pollutant charges Sydney Water proposed in its supplementary submission are reasonable and will not have an excessive adverse impact on commercial customers or other customer classes. Although many commercial customers will face considerable increases in the trade waste component of their bills over the 2012 determination period, the overall impact on their total Sydney Water bills over this period will be much lower, and in many instances their total bills will decrease. We consider that the proposed prices transition to cost-recovery levels at an appropriate rate, which balances the needs to move towards efficient prices and to mitigate adverse impacts on customers. For this reason, we decided to set most commercial pollutant charges in line with Sydney Water’s proposal.
The only exception was the charge for shopping centres with centralised pre-treatment. As noted above, Sydney Water proposed not to set a price for these customers, but make them “site specific”. However, this is not consistent with the IPART Act, which requires us to set maximum charges for all of Sydney Water’s regulated services. Following discussions with Sydney Water, we decided to set the commercial pollutant charge for customers in this category at the same level as the charge for “low strength BOD food” customers.
9.7.5 Trade waste ancillary charges
Decision
35 IPART’s decision is that Sydney Water can charge maximum trade waste ancillary charges as shown in Table 9.21.

9 Pricing decisions for Sydney Water’s water services
142 IPART Review of prices for Sydney Water Corporation’s water, sewerage, stormwater drainage and other services
Table 9.21 Maximum trade waste ancillary charges ($2011/12)
Charge Unit 2011/12 2012/13 2013/14 2014/15 2015/16
Commercial agreement (permit) charges – first process
$/process/quarter 20.84 32.63 32.63 32.63 32.63
Commercial agreement (permit) charges – each additional process
$/process/quarter 6.94 11.20 11.20 11.20 11.20
Additional inspection charge (excluding GST)a
$/hour
$ minimum per inspection
71.36
35.95
86.96
173.91
86.96
173.91
86.96
173.91
86.96
173.91
Trade waste application fee for industrial customers – standard
$/application 285.55 419.80 419.80 419.80 419.80
Trade waste application fee for industrial customers – non-standard
$/hour 128.60 128.60 128.60 128.60 128.60
Trade waste application fee for industrial customers – variation
$/application 343.35 504.72 504.72 504.72 504.72
Trade waste application fee – renewal
$/application N/A N/A N/A N/A N/A
Sale of trade waste data
$/hour 125.32 125.32 125.32 125.32 125.32
a The current charge assumes that the Sydney Water representative was already on-site and that the additional inspection did not require additional travel or administrative effort. The increase to the additional inspection charge reflects the additional travel time, on-site inspection activities, on-site discussions and administrative effort required to manage a non-compliant customer towards compliance.
Source: Sydney Water, Supplementary Submission, Trade Waste Costs and Charges, 8 March 2012, p 432.
Sydney Water’s submission
Sydney Water submitted that its trade waste ancillary costs are driven primarily by labour and vehicle costs, and a smaller component is driven by trade waste monitoring at customer sites (sampling and analysis).
9 Pricing decisions for Sydney Water’s water services
Review of prices for Sydney Water Corporation’s water, sewerage, stormwater drainage and other servicesIPART 143
Sydney Water also indicated that its trade waste ancillary costs are expected to decrease by $0.267 million over the 2012 period – from $4.538 million in 2012/13 to $4.271 million by 2015/16.134 However, because its actual costs for 2011/12 exceeded its revenue from trade waste ancillary charges by $1.85 million, it would need to increase some of these charges to ensure full cost recovery. In particular, it proposed to increase:
commercial agreement (permit) charges – first process
commercial agreement (permit) charges – each additional process
additional inspection charge – both the hourly charge, and the minimum charge per inspection
trade waste application fee for industrial customers – standard
trade waste application fee for industrial customers – variation.
It proposed to increase these charges to cost-recovery levels from 1 July 2012 (ie, without transitioning).
Sydney Water proposed not to change the levels of other trade waste ancillary charges, and to continue not charging customers for the renewal of industrial agreements.
IPART’s analysis
Under Sydney Water’s proposal, number of its trade waste ancillary charges increase considerably. However, when we assessed Sydney Water’s analysis of the impacts of these higher charges on trade waste customers’ total Sydney Water bills,135 we found that they are reasonable. Many customers will still experience slight decreases in their total bills. Therefore, we decided to accept the proposed charges.
We note that the analysis of the impacts of its proposed ancillary charges on customers total bills in Sydney Water’s supplementary submission does not incorporate some of the prices from the final determination. Nevertheless, we consider that this analysis provides a good indication of customer impacts over the 2012 determination period.
9.7.6 Industrial trade waste quarterly agreement charges
Decision
36 IPART’s decision is that Sydney Water can charge maximum industrial trade waste quarterly agreement charges as shown in Table 9.22.
134 Sydney Water, Supplementary Submission, Trade Waste Costs and Charges, 8 March 2012,
pp 441-444. 135 Sydney Water, Supplementary Submission, Trade Waste Costs and Charges, 8 March 2012,
pp 441-444.

9 Pricing decisions for Sydney Water’s water services
144 IPART Review of prices for Sydney Water Corporation’s water, sewerage, stormwater drainage and other services
Table 9.22 Maximum industrial trade waste quarterly agreement charges ($/quarter, $2011/12)
Risk Level 2011/12 2012/13 2013/14 2014/15 2015/16
1 6,434.52 1,806 1,806 1,806 1,806
2 5,808.44 1,806 1,806 1,806 1,806
3 2,712.93 1,806 1,806 1,806 1,806
4 1,530.36 834 834 834 834
5 591.25 556 556 556 556
6 208.65 556 556 556 556
7 139.10 556 556 556 556
Source: Sydney Water, Supplementary Submission, Trade Waste Costs and Charges, 8 March 2012, p 432.
Sydney Water’s submission
In both its initial and supplementary submissions, Sydney Water proposed differential industrial trade waste agreement charges based on the customer’s position on a risk index. It indicated that it developed the proposed charges by first estimating the unit cost of an inspection event (including administrative and travel effort and sample analysis costs) using a top down approach. Then, it determined the appropriate number of planned inspections and sampling events for each risk level, and multiplied this number by the unit cost. It allocates its industrial customers to a risk level based on its assessment of their risk profile.
Compared to currently, it proposes to provide a lower number of planned inspections for customers with a risk level of 1 to 5, the same number for customers with a risk level of 6, and a higher number for those with a risk level of 7. In particular, it proposes that customers with a:
risk level of 1 to 3 will receive 13 planned inspections per annum
risk level of 4 will receive 6 planned inspections per annum
risk level of 5 to 7 will receive 4 planned inspections per annum.
IPART’s analysis
We are satisfied that the approach Sydney Water has used to calculate its proposed industrial trade waste quarterly agreement charges is reasonable. Under this approach, customers with risk levels of 1 to 4 will see their quarterly agreement charges decrease, while those with risk levels of 6 and 7 will see their charges increase. We consider the impact of the price increases on those customers with risk levels of 6 and 7 are reasonable, particularly when the impact on their total Sydney Water bills is taken into account. On this basis, we have decided to accept Sydney Water’s proposed industrial trade waste quarterly agreement charges.

9 Pricing decisions for Sydney Water’s water services
Review of prices for Sydney Water Corporation’s water, sewerage, stormwater drainage and other servicesIPART 145
9.7.7 Wastesafe charges
Decision
37 IPART’s decision is that Sydney Water can charge maximum Wastesafe charges as shown in Table 9.23, with the new Wastesafe charging arrangements commencing from 1 July 2013.
Table 9.23 Maximum Wastesafe charges ($2011/12)
Charges Unit 2011/12 2012/13 2013/14 2014/15 2015/16
Wastesafe $/litre 0.127 0.127 N/A N/A N/A
Fixed $/liquid waste trap charge
$/liquid waste
trap/quarter
N/A N/A 23.21 23.21 23.21
Missed service (pump-out) inspection charge for liquid waste traps <=2kL
$ liquid waste
trap/event
N/A N/A 255.75 255.75 255.75
Missed service (pump-out) inspection charge for liquid waste traps >2kL
$ liquid waste
trap/event
N/A N/A 511.50 511.50 511.50
Sydney Water’s submission
Sydney Water proposed significant changes to its Wastesafe charging arrangements. Currently:
contractors are responsible for cleaning customers’ liquid waste traps and transporting the liquid waste to (privately owned) depots for treatment
these contractors bill customers directly for cleaning the traps and transporting the waste
Sydney Water charges customers a volumetric charge for processing and treatment of the liquid waste plus a premium to recover the on-going costs of running the Wastesafe system, and the depots bill Sydney Water for providing processing and treatment.
However, under Sydney Water’s proposed arrangements for the 2012 period, contractors will bill customers for cleaning, transport, processing and treatment, and the depots will bill the contractors for providing processing and treatment. Sydney Water will introduce new customer charges to recover the ongoing costs of running the Wastesafe system. These charges include:
a fixed quarterly charge per waste trap, and
charges per inspection required as a result of missed pump-outs – 1 for customers with liquid waste traps of 2 kL or less capacity, and 1 for those with liquid waste traps of more than 2 kL capacity.

9 Pricing decisions for Sydney Water’s water services
146 IPART Review of prices for Sydney Water Corporation’s water, sewerage, stormwater drainage and other services
In its initial submission, Sydney Water proposed that the new charging arrangements commence from 1 July 2012. In our draft report, we indicated that stakeholders were concerned that this did not give them time to transition to the new arrangements. To address these concerns we proposed delaying the introduction of the arrangements until 1 July 2014, giving stakeholders 2 years to adjust.136 In its supplementary submission, Sydney Water proposed that the new arrangements commence from 1 October 2012, giving stakeholders 3 months to adjust.
In its response to our draft report, which included its final proposal on Wastesafe charges, Sydney Water proposed a lower level for the fixed quarterly charge per waste trap in 2014/15 and 2015/16, in line with Deloitte’s recommendation (discussed below). However, its proposed charge in 2013/14 remained higher than Deloitte’s recommendation.
Deloitte’s recommendations
In relation to the fixed waste trap charge, Deloitte’s review found there were inconsistencies between the IT costs Sydney Water had used to set this charge and the IT costs approved in the contract variation documentation the utility provided to the review. To ensure this charge reflected the costs set out in the contract variation documentation (which were based on current expectations of the number of traps as set out in Sydney Water’s Trade Waste Cost Model), Deloitte recommended that the fixed charge per waste trap be reduced from $25.58 (as Sydney Water proposed) to $23.21 per quarter.137
In relation to the charges per inspection required as a result of missed pump-outs, Deloitte found that Sydney Water’s proposed charge for customers with waste traps of 2 kL or less capacity were reasonable and reflected the costs it would incur per inspection. It noted that Sydney Water had not provided evidence to support the level of its proposed charge for customers with waste traps of more than 2 kL capacity. Nevertheless, it recommended we accept both charges.
Deloitte also recommended that Sydney Water ensure that its policy for applying missed service charges is made clear to customers prior to the introduction of the new charging arrangements, and that Sydney Water include revenue forecasts for missed service events in the calculation of its Wastesafe charges for future reviews.
136 In the draft report and determination, the Wastesafe charge for processing grease trap waste
contained some minor errors in relation to the inclusion of GST, and in the case of the draft determination this charge should also have been adjusted for CPI so that it was in $2012/13. A fact sheet has been placed on our website identifying these errors and providing corrections.
137 Deloitte, Review of Sydney Water’s Trade Waste Costs and Charges, December 2011, p 42.

9 Pricing decisions for Sydney Water’s water services
Review of prices for Sydney Water Corporation’s water, sewerage, stormwater drainage and other servicesIPART 147
Stakeholder comments
At the first trade waste workshop, and at the public hearing held on 22 November 2011, the Waste Contractors and Recyclers Association (WCRA) raised several concerns about Sydney Water’s proposal to introduce new Wastesafe charging arrangements. It put the view that:
waste generators and contractors needed time to adjust to the new arrangements, so their introduction should be delayed
the proposed arrangements may result in more missed services, environmental damage, and less investment in waste processing infrastructure because Sydney Water would be relying on waste processing businesses to invest in infrastructure
waste generators may not receive a price signal until up to 3 months after a missed service
the new system may create confusion for waste generators because they would pay a fixed fee per liquid waste trap, rather than per litre of liquid waste as currently.
At the second trade waste workshop, stakeholders generally agreed that a period of 1-year would provide a reasonable timeframe for adjusting to the new Wastesafe charging arrangements, and thus the new charges should be introduced from 1 July 2013. Sydney Water commented that delaying their introduction more than a year was unnecessary and would stifle innovation.
IPART’s analysis
We considered Sydney Water’s proposals, Deloitte’s recommendations, and the views of the WCRA and other stakeholders. In relation to the fixed charge per waste trap, we found that Deloitte’s recommended adjustment to these charges to ensure they reflect the IT costs set out in the contract variation documentation is appropriate. Therefore, we decided set these charges in line with Deloitte’s recommended level in each year.
In relation to the charges for inspections for missed services, we accepted Deloitte’s finding that the charge for waste traps of 2 kL or less was appropriate. We decided to accept both charges as proposed. However, we expect Sydney Water to provide evidence for the next review that the level of the charge for customers with waste traps of more than 2 kL capacity is appropriate.
In relation to the concerns of the WCRA, we consider the charges for missed service pump-outs will provide an appropriate incentive for customers to maintain their liquid waste traps. In addition, we note that the revenue raised by the fixed charge per waste trap will ensure Sydney Water is able to maintain the Wastesafe system, to monitor whether customers continue to meet their obligations in relation to servicing these waste traps. Therefore, we do not agree that the new arrangements may lead to more missed services and environmental damage.

9 Pricing decisions for Sydney Water’s water services
148 IPART Review of prices for Sydney Water Corporation’s water, sewerage, stormwater drainage and other services
We also consider that the new charging arrangements are simple and transparent. We are satisfied that they are not likely to create confusion, provided Sydney Water provides customers with sufficient advance notice of the change and information about the new arrangements.
In relation to the timing of the introduction of the new arrangements, we consider that 1-year will provide an adequate amount of time for stakeholder to prepare for and adjust to the new system. Therefore, we have decided that the new Wastesafe charges will apply from 1 July 2013. We expect Sydney Water to ensure it provides Wastesafe customers with the information they need to adjust to the new Wastesafe charging arrangements well before this date.
In reaching this decision, we took account of the fact that stakeholders at the second workshop generally agreed that 1 year’s notice would provide sufficient time to adjust to the new charging arrangements, and Sydney Water’s view that maintaining the current rebate system for longer than 1-year may discourage innovation and beneficial re-use of grease trap waste. In response to these views, we brought forward the introduction of the new Wastesafe charges by 1-year relative to our draft decision.
9.8 Miscellaneous charges
9.8.1 Summary of pricing decisions
Decision
38 IPART’s decision is that the maximum prices Sydney Water can charge for Miscellaneous Charges are as proposed in its pricing submission to IPART.
39 IPART’s decision is that Miscellaneous Charges will be maintained in real terms over the remainder of the determination period.
9.8.2 Sydney Water’s submission
In the 2008 determination of Sydney Water’s prices, we alerted Sydney Water that we would undertake a detailed review of its miscellaneous charges for the next determination in 2012/13. In response, Sydney Water has completed a comprehensive review of its miscellaneous services138 which analysed customer requirements and calculated the cost of providing the services in line with our Pricing Principles for Miscellaneous Charges (see Box 9.2 which shows our calculation formula for Miscellaneous Charges). The review identified an opportunity to streamline the number and magnitude of the charges and the structure of the services.
138 Sydney Water also terms some of these services as Ancillary Services.

9 Pricing decisions for Sydney Water’s water services
Review of prices for Sydney Water Corporation’s water, sewerage, stormwater drainage and other servicesIPART 149
Sydney Water proposes to simplify charging arrangements for the services by the introduction of charging bands and proposes a range of structural changes that help reduce the number of chargeable services from 55 to 23. Box 9.1 shows the results of Sydney Water’s review.
Box 9.1 Results of Sydney Water’s review into its Miscellaneous Charges
9 plumbing-related services will be transferred to the Department of Services Technologyand Administration (DSTA) pending passing of new plumbing regulations in April 2012
8 charges could be discontinued
a redefined service ‘Integrated Service Connection Application’ could allow 12 Services tobe recovered through 2 current charges and 1 new charge on a common Integrated ServiceConnection Application form – these charges will only apply to complex connections and not standard connections, 10 of the old services will now be listed with a nil charge
3 Services with different hourly rates could be combined (banded) into a common SydneyWater hourly rate
the charge for Workshop Test of Water Meter (currently 1 common charge) needs to vary according to meter size
3 trade waste related ancillary services have been moved to the trade waste servicescharging schedule
the Road Closure Application service could also be reduced to a nil charge
6 other Services could be consolidated into 3 Services of similar nature
2 new charges need to be introduced – they are a Monthly Meter Reading Request by Customer charge (generally industrial customers) and a Replacement of Meter Damaged byCustomer charge
all chargeable Services could be placed in one of 13 charging bands.
Sydney Water reports that the review found that Sydney Water’s costs for most of the miscellaneous services have fallen since 2004/05 because:
Efficiencies have been delivered in customer operations through the use of more cost effective customer service channels, and implementation of business and process improvements.
Customers now pay third party service providers directly, instead of Sydney Water levying charges and passing these fees on to contracted service providers. For example, Property Link conveyancing brokers charge customers direct for their service.
Lower overheads as a result of efficiency, and the change in calculation of overheads to align with our revised method.

9 Pricing decisions for Sydney Water’s water services
150 IPART Review of prices for Sydney Water Corporation’s water, sewerage, stormwater drainage and other services
This has allowed a proposed average reduction in charges of 15%.139 Sydney Water estimates that revenue will decrease from $11.8 million per annum to $6.8 million per annum ($2011/12) in 2012/13.140 This is largely due to a decrease of $4 million due to the transfer of several plumbing related services to the DSTA.141 The remaining decrease is attributed to the reduction in costs for the other miscellaneous services.
Sydney Water also reports that it has adopted a method for calculation of its charges which it considers is consistent with, although slightly different to, our formula.142 We have established Pricing Principles for Miscellaneous Charges143 with the main principle being that charges should be cost reflective. The 2 formulae are compared in Box 9.2 below.
Box 9.2 Comparison of IPART’s and Sydney Water’s Miscellaneous Charges formulae
IPART’s Miscellaneous Charges formula:
Miscellaneous Charge = [(direct cost of labour including on costs + transport + equipment) x(business unit overheads)] + direct material cost
Sydney Water has calculated its costs in line with the following formula:
Miscellaneous Charge = Direct payroll cost (including on costs) + direct agency/contract costs +direct business unit overheads (inclusive of transport costs etc) + direct system support costs
Sydney Water has calculated business unit overheads as a cost per transaction rather than as a percentage of direct costs. This is a slight variation to our formula. However, Sydney Water considers that its approach means that overheads do not vary across services depending on the direct cost inputs.
9.8.3 Submissions from other stakeholders
We did not receive any submissions that commented on Sydney Water’s proposals for miscellaneous charges.
139 Sydney Water’s submission to IPART’s review of Prices for Sydney Water Corporation’s water,
sewerage, stormwater and other services, September 2011, Appendix 21, p 386. 140 Ibid. 141 Ibid, p 400. 142 Sydney Water has not incorporated corporate overheads in its formula for calculating
Miscellaneous Charges. Our interpretation of its method is that corporate overheads should be allocated to miscellaneous charges otherwise this would lead to other charges bearing the cost of those overheads. This is a minor difference in principle and outcome but we will consult with Sydney Water on this issue before the next determination.
143 IPART, Pricing principles for miscellaneous charges, September 2004.

9 Pricing decisions for Sydney Water’s water services
Review of prices for Sydney Water Corporation’s water, sewerage, stormwater drainage and other servicesIPART 151
9.8.4 IPART’s analysis
We have examined Sydney Water’s proposals and consider that they will result in a better service for customers and more cost reflective charges.
We consider that Sydney Water’s charging method is a reasonable interpretation of our Pricing Principles and appropriate for Sydney Water’s circumstances. Charges will reduce on average by 15% and while Sydney Water’s revenue will decrease, the proposed charges are cost reflective overall. There will be increases in some charges, but these are limited in number and many charges will be reduced or set at zero.
After receiving its submission, we asked Sydney Water if it had any information that would indicate the level of satisfaction of those customers that use its miscellaneous services. Sydney Water provided the following evidence144 in support of its claim that the majority of customers are satisfied with the services provided:
there are over 300,000 miscellaneous services transactions per year
in the 2010/11 year, Sydney Water only received 26 customer complaints in the delivery of miscellaneous services (1 complaint for every 12,500 applications)
the majority of the complaints were around the delay in the availability of products, where information had not been yet provided by an external party and the customer was frustrated with the delay.
In view of the simplification of the charging schedule, the reduction in the level of charges on average and the establishment of cost reflectivity, we have decided to support Sydney Water’s proposals for its miscellaneous charges for 2012/13 and to increase the charges annually by the change in CPI for the remainder of the determination period.
9.9 Minor service extension charges
9.9.1 Summary of pricing decisions
Decision
40 IPART’s decision is that the existing minor service extensions methodology is robust and should remain in place.
Minor service extensions are a service provided by Sydney Water to extend the sewerage system and the water supply to properties which are not connected. Owners of those properties must request to be connected. In 2003, we first regulated the price of minor service extensions. We established a methodology for Sydney Water to set the maximum price.
144 Meeting between Sydney Water and IPART, 1 December 2011.

9 Pricing decisions for Sydney Water’s water services
152 IPART Review of prices for Sydney Water Corporation’s water, sewerage, stormwater drainage and other services
)(
)(Re)(0 TenamentsEquivalentPV
CostsvenuesPVenditureCapitalExpPVP
Where PV stands for the present value, and the revenues and costs are those attributable to the minor service extension. This formula mirrors the formula for calculating developer charges.
9.9.2 Sydney Water’s submission
Sydney Water considers it unfair that customers in growth areas receive a similar service for free, since developer charges were set to zero, while those receiving a minor service extension are charged an upfront capital cost.145
Sydney Water proposes a change to the way it calculates customer contributions to minor service extensions. Under Sydney Water’s proposal all minor service extension customers would receive a subsidy, from Sydney Water, to the value of its average contribution, to supplement developer charges, for connecting properties to its network in growth areas.
9.9.3 IPART’s analysis
We consider the methodology we set out in 2003 to be sound. Under Sydney Water’s proposal other water and sewerage customers would be forced to subsidise a service they do not benefit from. This subsidy would be made without government direction, unlike the decision to set developer charges to zero. Further, Sydney Water cannot predict how many applications for minor service extensions they will receive. As a result, we have decided to maintain the current pricing formula, as it is the most appropriate means of allocating those costs.
9.10 Exempt land
Decision
41 IPART’s decision is that the existing urinal closet and water closet based sewerage charges for exempt land be removed and replaced with the non-residential sewerage usage charge and discharge allowance.
Exempt properties currently benefit from a discount for water and sewerage services. Currently, exempt properties pay the water usage charge for their water usage and we set a fixed charge per water closet or urinal closet for exempt properties. Exempt properties do not pay the water service or the sewerage service charge.
145 Sydney Water’s submission to IPART’s review of Prices for Sydney Water Corporation’s water,
sewerage, stormwater and other services, September 2011, Appendix 26, p 465.
9 Pricing decisions for Sydney Water’s water services
Review of prices for Sydney Water Corporation’s water, sewerage, stormwater drainage and other servicesIPART 153
9.10.1 Sydney Water’s submission
In its submission, Sydney Water proposes that the urinal closet charge and water closet charge be removed. Sydney water proposes that from 1 July 2012, exempt properties will pay:
a water usage charge
a sewerage usage charge for discharges above the allowed threshold.
9.10.2 IPART’s analysis
Under Sydney Water’s proposed charging structure, exempt properties would pay only the usage charges associated with using the water and sewerage systems. This is consistent with Sydney Water’s obligations regarding exempt properties under the Sydney Water Act 1994. Further, the sewerage and water usage charges send appropriate pricing signals regarding water usage and sewerage discharge.
We consider that Sydney Water’s proposal is sound and as such we have decided to remove maximum charges for urinal closets and water closets and introduce sewerage usage charges for exempt properties.
9.11 Combination and mixed development
Decision
42 IPART’s decision is to set a standard residential water charge and a standard residential sewerage service charge for all mixed development dwellings and occupancies and all dwellings and occupancies in combination strata properties.
9.11.1 IPART’s analysis
Mixed Developments are single-owner multi-premises which comprise a mixture of residential dwellings and non-residential shops or suites. They have a common meter (or number of common meters) and as such it is not possible to determine the level of water consumption or the quantity of sewerage discharge for any individual residential dwelling or non-residential occupancy.
Mixed Development properties currently attract:
a single meter based water service charge for the entire property
a standard residential sewerage service charge for each of the residential dwellings in the development
a single standard residential sewerage service charge for the non-residential occupancies regardless of the number of occupancies.

9 Pricing decisions for Sydney Water’s water services
154 IPART Review of prices for Sydney Water Corporation’s water, sewerage, stormwater drainage and other services
Combination properties are also a mixture of residential and non-residential dwellings and shops/offices, also with only a common meter. The difference between combination properties and mixed developments is that combination properties are strata title properties.
Combination properties currently attract:
a single meter based water service charge for the entire property
a standard residential sewerage service charge for each of the residential dwellings in the development
a standard residential sewerage service charge for each of the non-residential occupancies.
Sydney Water’s data shows that on average, there are 6 residential dwellings for every one non-residential occupancy in combination properties. While no equivalent data is available for mixed developments, we assess that the ratio of residential to non-residential occupancies will be similar.
Given the high proportion of residential dwellings as a total of all combination properties, our decision is to set a standard residential service charge and standard residential sewerage service charge for all residential dwelling and non-residential occupancies in both combination properties and mixed developments.
9.12 Unmetered properties
Decision
43 IPART’s decision is to set the same unmetered water service charge for unmetered residential and unmetered non-residential properties. This will comprise the residential water service charge plus a deemed usage component of 180kL per annum.
9.12.1 IPART’s analysis
Currently unmetered residential properties pay water charge that comprises a residential water service charge plus deemed usage of 200 kL pa. Unmetered non-residential properties pay the same residential water service charge but only have a deemed usage component of 130 kL per annum.
In its pricing submission Sydney Water stated that it had conducted research and analysis and on unmetered water consumption and that this revealed that there was no discernible difference between residential and non-residential unmetered consumption and that the average level of unmetered consumption was 180 kL per annum.

9 Pricing decisions for Sydney Water’s water services
Review of prices for Sydney Water Corporation’s water, sewerage, stormwater drainage and other servicesIPART 155
IPART has accepted Sydney Water’s analysis, we note that this change is revenue neutral and represents a relative decrease in unmetered charges for residential properties and an increase in unmetered non-residential charges. IPART notes that if unmetered customers feel they are consuming less than the deemed amount they are at liberty to have a meter installed. Sydney Water will provide the meter free of charge. The customer is responsible for the cost of installation.

10 Implications of pricing decisions for Sydney Water customers
156 IPART Review of prices for Sydney Water Corporation’s water, sewerage, stormwater drainage and other services
10 Implications of pricing decisions for Sydney Water customers
In making our determination, we had regard to s15 of the IPART Act. (Appendix A lists these matters in full and indicates where each matter is discussed in this report.) We are satisfied that the determination achieves an appropriate balance between these matters, particularly the needs and interests of water customers, Sydney Water and its shareholder, general inflation and the environment. This chapter discusses our analysis of the implications for customers; Chapter 11 focuses on the implications for Sydney Water, inflation and the environment.
Before finalising our pricing decisions, we assessed their implications for residential and non-residential customers. In particular, we analysed the impacts of our decisions to restructure some prices (discussed in Chapter 8), as well as the impacts of our determination overall on the affordability of Sydney Water’s services for various customer groups, including pensioners and other vulnerable customers. We also looked at the of the impact of the previous NSW Government’s 2008 decision to limit Sydney Water’s ability to levy developer charges for water infrastructure on customers in general, and on customers in the Rouse Hill area.
The sections below summarises our findings, then discuss our analysis of the implications for customers in detail.
10.1 Summary of findings on implications for customers
Under the determination, prices for Sydney Water’s water services decrease in real terms, and as a result many customers will experience reductions in their annual water and sewerage bills over the determination period. However, some customers will experience bill increases, because our decisions to restructure some prices affect customer groups in different ways.
For most residential customers, the change in their annual water and sewerage bill will be a decrease of greater than 2.6% over the 4-year determination period, in real terms.
For non-residential customers, most will face annual water and sewerage bill increases over the 4-year determination period.

10 Implications of pricing decisions for Sydney Water customers
Review of prices for Sydney Water Corporation’s water, sewerage, stormwater drainage and other servicesIPART 157
Residential customers who receive a pensioner rebate will be largely unaffected by bill changes, as the most significant changes for residential customers stem from the restructuring of the fixed water service charge, and Sydney Water provides pensioners with a rebate for 100% of this charge.
It is important to note that the prices discussed in this report do not reflect the costs Sydney Water will incur if it is required to purchase drinking water from the Sydney Desalination Plant (SDP) during the determination period. If Sydney Water does need to purchase drinking water from the SDP in any year of the period, the determination provides for Sydney Water to pass through the associated costs to customers by adjusting prices in the following year.
The size of these costs and their impact on customers will depend on SDP’s operating schedule. However, as an indication, if SDP operates at 100% capacity in any year it will cost Sydney Water an additional $49 million to $62 million ($2011/12) each year.146 For residential customers, this will add an additional $25 to $31 ($2011/12) to their total bill each year. For non-residential customers, the amount it will add to their total bill will depend on their meter size. However, those with an individual 25mm meter will pay an additional $44 to $61 ($2011/12) each year and those with larger meters will pay proportionately higher amounts.147
In our 2008 Determination of Sydney Water’s prices, we included a mechanism to pass through to customers any increased costs resulting from changes to SCA’s charges to Sydney Water for bulk water purchases. We reviewed and set SCA’s prices in 2009. In this determination, we have included all of Sydney Water’s bulk water costs from the SCA in our prices. As such, there is no pass through mechanism for SCA’s charges in this determination.
10.2 Impact of price restructuring on different customers
As noted above, our determination includes changes in the structure of some prices, which will affect customers differently. As Chapter 8 explains, these changes in price structure do not aim to increase the total revenue Sydney Water recovers from its customer base. Rather, they are intended to improve horizontal equity between customer groups. Thus, they reflect the principle that customers who receive similar services in Sydney Water’s network should pay similar charges.
146 The actual amount varies from approximately $50 million ($2011/12) in the first year to
approximately $65 million ($2011/12) in 2015/16 according to the 2012 SDP Determination. 147 If SDP has to restart and/or shut down over the period, Sydney Water will incur large one-off
charges of up to $5.5 million according to the 2012 SDP Determination. If this occurs, this will also add to customer bills.

10 Implications of pricing decisions for Sydney Water customers
158 IPART Review of prices for Sydney Water Corporation’s water, sewerage, stormwater drainage and other services
Our decisions on price restructuring result in changes to:
Water service charges for residential customers. By the last year of the determination period, all residential customers will pay a standard water service charge of $94.88 ($2011/12). Those with an individual water meter (mostly houses) currently pay $144.79 and thus will pay a lower service charge. Those with a shared meter (mostly apartments) currently pay around $70.05 (on average)148 and thus will pay a higher service charge.
Sewerage service charges for residential customers. All residential customers will continue to pay the residential sewerage service charge.
Water and sewerage service charges for non-residential customers with an individual 20mm meter. The water and sewerage service charge for non-residential with an individual 20mm meter is currently equal to the water and sewerage service charge for residential customers. This will be maintained in this determination. However, this does not apply to non-residential customers sharing a 20mm meter.
Sewerage service charges for non-residential customers sharing a meter. Non-residential properties sharing a meter will no longer be charged the 20mm service charge for sewerage. This means that most non-residential customers who were previously paying 20mm service charge will now pay less because they will now pay an equal share of the service charge for the meter they are connected to, which will typically be less than the 20mm service charge.
Sewerage usage charge for non-residential customers. We have made decisions to decrease the usage charge towards the short run marginal cost associated with discharging, and have decided to reduce the free threshold allowance from 500 kL to 300 kL per year by the end of the determination period. Strata titled non-residential customers will now pay a sewerage usage charge and will share a single discharge allowance with the other strata lots within the property. In the past, non-residential strata customers did not pay a sewerage usage charge. This additional charge is likely to be more than offset by a decrease in the sewerage service charge for most non-residential strata customers.
Stormwater drainage service charges for residential and non-residential customers. We have made a decision to set different prices for apartments, houses and for non-residential properties of different sizes. We decided not to use the area based stormwater charge from our draft determination to mitigate impacts to large non-residential customers. Residential customers currently pay a fixed charge of $49.08. Over the determination period, this charge will decrease to $29.04 ($2011/12) for customers with an apartment, and increase to $79.21 ($2011/12) for those with a house. Non–residential customers currently pay a fixed charge of $127.74. For non-residential customers with a property of 1000m2 or smaller, this charge will decrease to the levels paid by residential customers with similar-sized properties. For those with larger properties, it will increase.
148 Calculated from Sydney Water’s 2010/11 AIR projected to 2011/12.

10 Implications of pricing decisions for Sydney Water customers
Review of prices for Sydney Water Corporation’s water, sewerage, stormwater drainage and other servicesIPART 159
Residential customers
In this determination, customers living in individually metered residential properties such as houses will face:
A decrease in water bills.
Modest increase in sewerage bills (overall 4% in real terms).
A change in their stormwater drainage charge. Houses will pay more and individually metered apartments will pay less. There are currently 27% of Sydney Water’s customers receiving stormwater drainage services from Sydney Water.
The above effects, combined with our decision on Sydney Water’s revenue, lead to an overall decrease in water, sewerage and stormwater drainage bills for customers residing in individually metered apartments and no change for customers residing in houses.
Customers living in residential properties on a shared meter, such as apartments, will face:
an increase in their water service charge
a modest increase in their sewerage service charge (overall 4% in real terms)
a decrease in their stormwater drainage charge.
We note that for residential customers living in properties on shared meters, they are charged for their water usage by their owners’ corporation via strata levies and are not billed directly by Sydney Water.149 Later in this chapter we have shown illustrative examples of the changes that some residential customers can expect to face in their annual water, sewerage and stormwater charges over the determination period.
Residential customers living in properties on shared meters can expect to face an increase in their annual water and sewerage charge (service charge billed by Sydney Water and usage charge paid via strata levies) because we have increased their water and sewerage service charges and maintained the usage charge at $2.10 ($2011/12). Residential customers who also receive stormwater services from Sydney Water, will experience decreases in their stormwater charge but the overall impact will be dependent on how much they are affected by the increase in the water service charge to the standard $94.88 ($2011/12) for all residential customers living in properties with a shared meter.
149 Sydney Water bills customers directly for service charges.
10 Implications of pricing decisions for Sydney Water customers
160 IPART Review of prices for Sydney Water Corporation’s water, sewerage, stormwater drainage and other services
There are also individually metered residential apartments that receive services from Sydney Water. These customers will also face an overall decrease in water, sewerage and stormwater drainage bills and the decrease will be larger compared to customers residing in houses. This is because individually metered residential apartments will be charged the lower stormwater drainage charge and will pay a lower water service charge.
Non-residential customers
Individually metered non-residential customers will face:
A decrease in water bills (customers on 20mm meters will face a larger decrease since they pay the same water service charge as houses and the water service charge for houses decreases by 34.5% over the determination period compared to the decrease in the water service charge of 17.0% for stand-alone non-residential properties on a 25mm meter or larger, over the same period).
An increase in sewerage bills for most customers (the service charge will increase due to a decrease in the usage charge and a decrease in the service charge for non-residential properties sharing a meter – they will no longer be subject to the 20mm meter charge).150 For customers on 20mm meters the increase in sewerage bills will be modest (overall 4%) as their service charge for sewerage will also be the same as houses.151 Customers on 25mm meters or greater will face larger increases. For large water users, some of the increase in service charge will be offset by the decrease in the usage charge.
A decrease in stormwater drainage bills if they are on property less than 1,000m2 (which covers small and medium sized properties).
An increase in stormwater drainage bills if they are on property greater than 1,000m2 (due to larger non-residential properties paying more).
The above effects, combined with our decision on Sydney Water’s revenue, mean that customers on a stand-alone 20mm meter will face overall decreases in their water, sewerage and stormwater drainage bills and customers on stand-alone 25mm meters or larger will face increases. Customers on larger properties in excess of 1,000m2 will face greater bill increases for water, sewerage and stormwater drainage.
150 There is a small effect of the reduction in the free threshold allowance increasing sewerage bills.
This has a relatively bigger effect for smaller water users than larger water users. 151 These non-residential customers on stand-alone 20mm meter will not be subject to a usage
charge for sewerage.
10 Implications of pricing decisions for Sydney Water customers
Review of prices for Sydney Water Corporation’s water, sewerage, stormwater drainage and other servicesIPART 161
Strata titled non-residential properties sharing a meter will face:
a decrease in the water service charge
a decrease in sewerage service charge152
a decrease in stormwater drainage charges if they are situated on property less than 1,000m2
an increase in stormwater drainage charges if they are situated on property greater than 1,000m2.
We note that non-residential customers occupying properties on shared meters are charged for their water usage by their owner’s corporation via strata levies and are not billed directly by Sydney Water.153
Customers with strata titled non-residential properties on shared meters can expect to face a decrease in their annual water and sewerage charge (service charge billed by Sydney Water and usage charge paid via strata levies) as they were previously subjected to the 20mm meter service charge for sewerage.
Customers with strata titled non-residential properties on shared meters who also receive stormwater services from Sydney Water can expect to receive a decrease in annual water, sewerage and stormwater charges. For other customers with non-residential properties on shared meters, different circumstances will give rise to different price impacts.
Later in this chapter we have shown illustrative examples of the changes they can expect to face in their annual water, sewerage and stormwater charges over the determination period.
10.3 Impact on the affordability of services for residential customers
To assess the impact of our determination on the affordability of Sydney Water’s services for residential customers we analysed the overall impact of our pricing decisions on the annual bills for a range of customers. We analysed the impact on:
water and sewerage bills for customers with a range of water usage
water, sewerage and stormwater drainage bills for customers with a range of water usage
water and sewerage bills for pensioner customers with a rebate.
152 There may be some exceptions where the meter based service charge divided by the number of
strata titled lots within the property is greater than the 20mm service charge. This is only likely to occur for strata complexes that have high water demand.
153 Sydney Water bills customers directly for service charges.
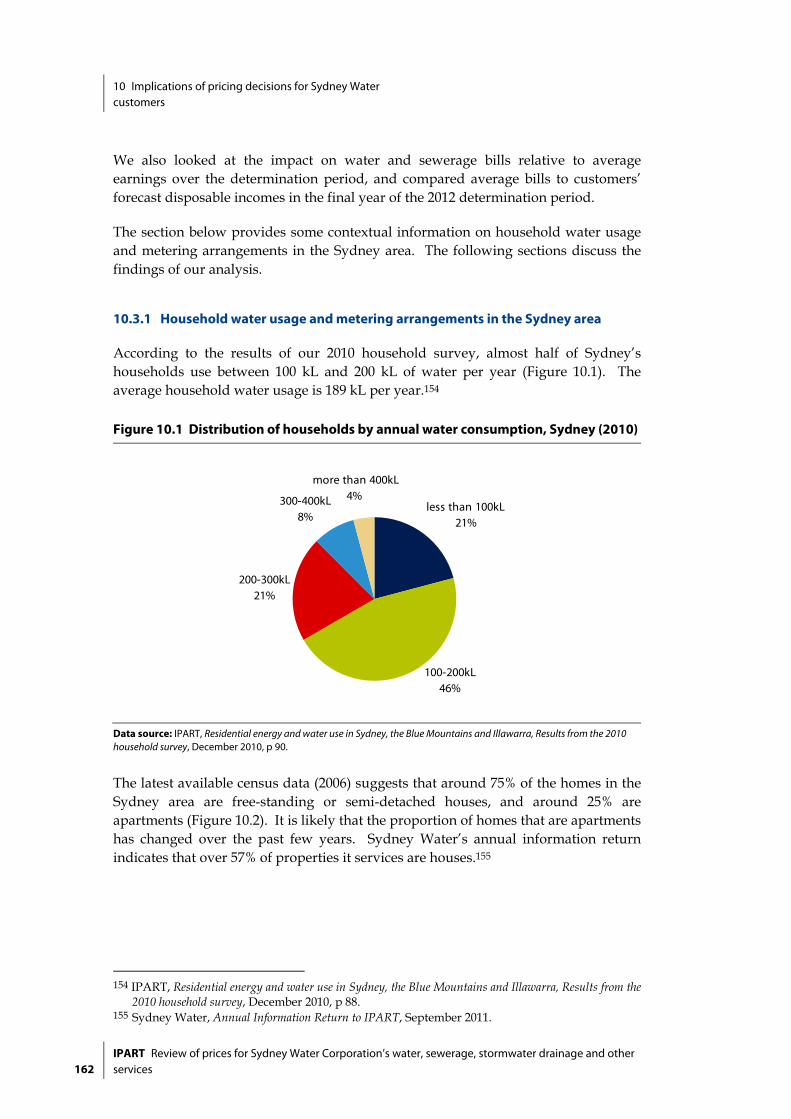
10 Implications of pricing decisions for Sydney Water customers
162 IPART Review of prices for Sydney Water Corporation’s water, sewerage, stormwater drainage and other services
We also looked at the impact on water and sewerage bills relative to average earnings over the determination period, and compared average bills to customers’ forecast disposable incomes in the final year of the 2012 determination period.
The section below provides some contextual information on household water usage and metering arrangements in the Sydney area. The following sections discuss the findings of our analysis.
10.3.1 Household water usage and metering arrangements in the Sydney area
According to the results of our 2010 household survey, almost half of Sydney’s households use between 100 kL and 200 kL of water per year (Figure 10.1). The average household water usage is 189 kL per year.154
Figure 10.1 Distribution of households by annual water consumption, Sydney (2010)
less than 100kL21%
200-300kL21%
300-400kL8%
more than 400kL4%
100-200kL46%
Data source: IPART, Residential energy and water use in Sydney, the Blue Mountains and Illawarra, Results from the 2010 household survey, December 2010, p 90.
The latest available census data (2006) suggests that around 75% of the homes in the Sydney area are free-standing or semi-detached houses, and around 25% are apartments (Figure 10.2). It is likely that the proportion of homes that are apartments has changed over the past few years. Sydney Water’s annual information return indicates that over 57% of properties it services are houses.155
154 IPART, Residential energy and water use in Sydney, the Blue Mountains and Illawarra, Results from the
2010 household survey, December 2010, p 88. 155 Sydney Water, Annual Information Return to IPART, September 2011.
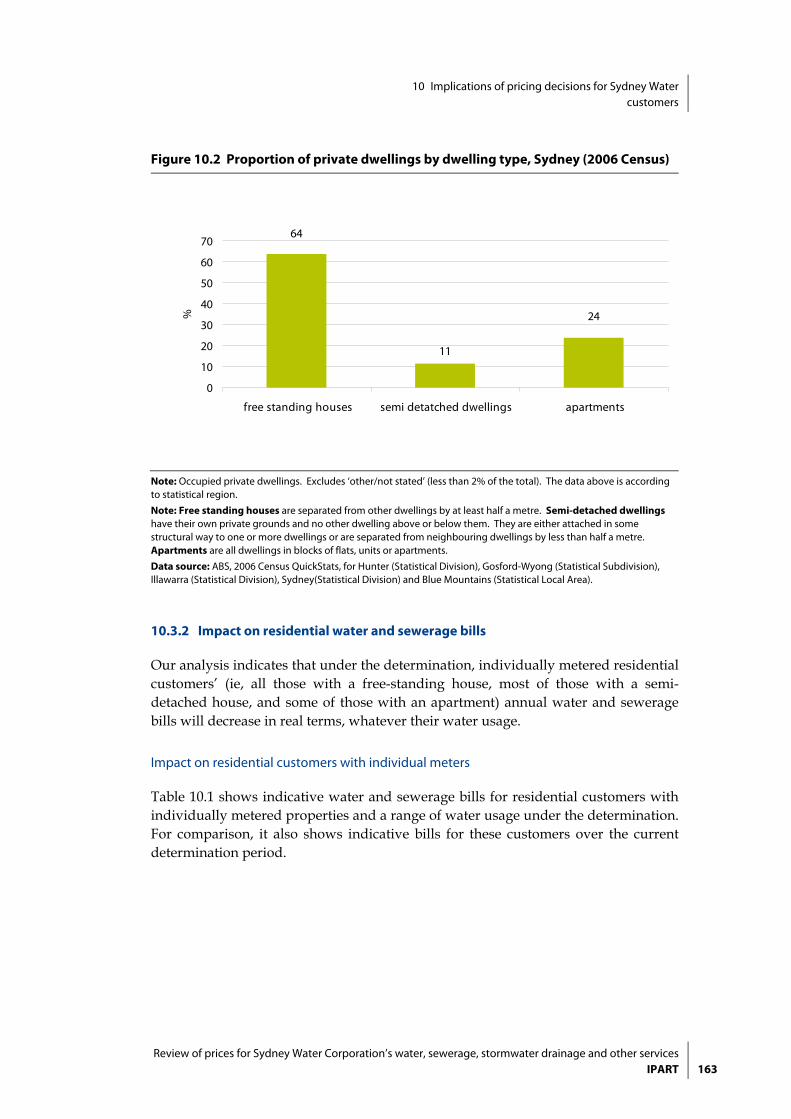
10 Implications of pricing decisions for Sydney Water customers
Review of prices for Sydney Water Corporation’s water, sewerage, stormwater drainage and other servicesIPART 163
Figure 10.2 Proportion of private dwellings by dwelling type, Sydney (2006 Census)
11
24
64
0
10
20
30
40
50
60
70
free standing houses semi detatched dwellings apartments
%
Note: Occupied private dwellings. Excludes ‘other/not stated’ (less than 2% of the total). The data above is according to statistical region.
Note: Free standing houses are separated from other dwellings by at least half a metre. Semi-detached dwellings have their own private grounds and no other dwelling above or below them. They are either attached in some structural way to one or more dwellings or are separated from neighbouring dwellings by less than half a metre. Apartments are all dwellings in blocks of flats, units or apartments.
Data source: ABS, 2006 Census QuickStats, for Hunter (Statistical Division), Gosford-Wyong (Statistical Subdivision), Illawarra (Statistical Division), Sydney(Statistical Division) and Blue Mountains (Statistical Local Area).
10.3.2 Impact on residential water and sewerage bills
Our analysis indicates that under the determination, individually metered residential customers’ (ie, all those with a free-standing house, most of those with a semi-detached house, and some of those with an apartment) annual water and sewerage bills will decrease in real terms, whatever their water usage.
Impact on residential customers with individual meters
Table 10.1 shows indicative water and sewerage bills for residential customers with individually metered properties and a range of water usage under the determination. For comparison, it also shows indicative bills for these customers over the current determination period.

10 Implications of pricing decisions for Sydney Water customers
164 IPART Review of prices for Sydney Water Corporation’s water, sewerage, stormwater drainage and other services
The table indicates that over the 2012 determination period, the bills for a customer with average water usage (200 kL per year) will decrease by 2.6% (or $29) in real terms over the 4-year period. This represents an average decrease of 0.6% per year. The bills of a customer with lower than average water usage will decrease by more than this, while those of a customer with higher than average usage will decrease by less. This is because the decrease in these customers’ bills stems from decreases in their fixed water service charge, and this charge represents a larger proportion of the bill for customers with lower water usage.
Table 10.1 Annual water and sewerage bills for residential customers with an individual meter under the 2008 and 2012 determinations ($2011/12)
2008 Determination 2012 Determination
2008/
09 2009/
10 2010/
11 2011/
12 2012/
13 2013/
14 2014/
15 2015/
16
Change 2011/12
to 2015/16
100 kL pa 778 837 868 895 889 882 874 866 -29
% increase 7.6% 3.6% 3.1% -0.6% -0.8% -0.9% -0.9% -3.2%
150 kL pa 865 936 971 1,000 994 987 979 971 -29 increase 8.2% 3.7% 2.9% -0.5% -0.8% -0.8% -0.7% -2.9% 200 kL pa 953 1,036 1,075 1,105 1,099 1,092 1,084 1,076 -29
% increase 8.7% 3.8% 2.8% -0.5% -0.7% -0.7% -0.7% -2.6%
300 kL pa 1,127 1,234 1,282 1,315 1,309 1,302 1,294 1,286 -29
% increase 9.4% 3.9% 2.6% -0.4% -0.6% -0.6% -0.6% -2.2%
400 kL pa 1,302 1,432 1,488 1,526 1,519 1,512 1,504 1,496 -30
% increase 10.0% 3.9% 2.5% -0.4% -0.5% -0.5% -0.5% -2.0%
Source: IPART analysis.
The bill decreases under the determination reverse the trend over the 2008 determination period, when bills increased fairly significantly eg, in 2009/10,156 and continued to increase over the rest of the 2008 Determination period. For example, the bill increase for a residential customer with an individual meter and water usage of 200 kL per year was about 35% over the 4-year 2008 Determination period or an average of 7.8% per year.157 Had we accepted Sydney Water’s pricing proposal for the 2012 determination period, these customers’ bills would have continued to increase broadly in line with the trend over the 2008 determination period (Figure 10.3).
156 The relatively large increase in 2009/10 was mainly due to costs associated with the Sydney
Desalination Plant, recycled water and increases in Sydney Water’s operating expenditure. 157 The annual water and sewerage bill for an individually metered residential customer using
200 kL per year was $818.86 ($2011/12) in 2007/08.
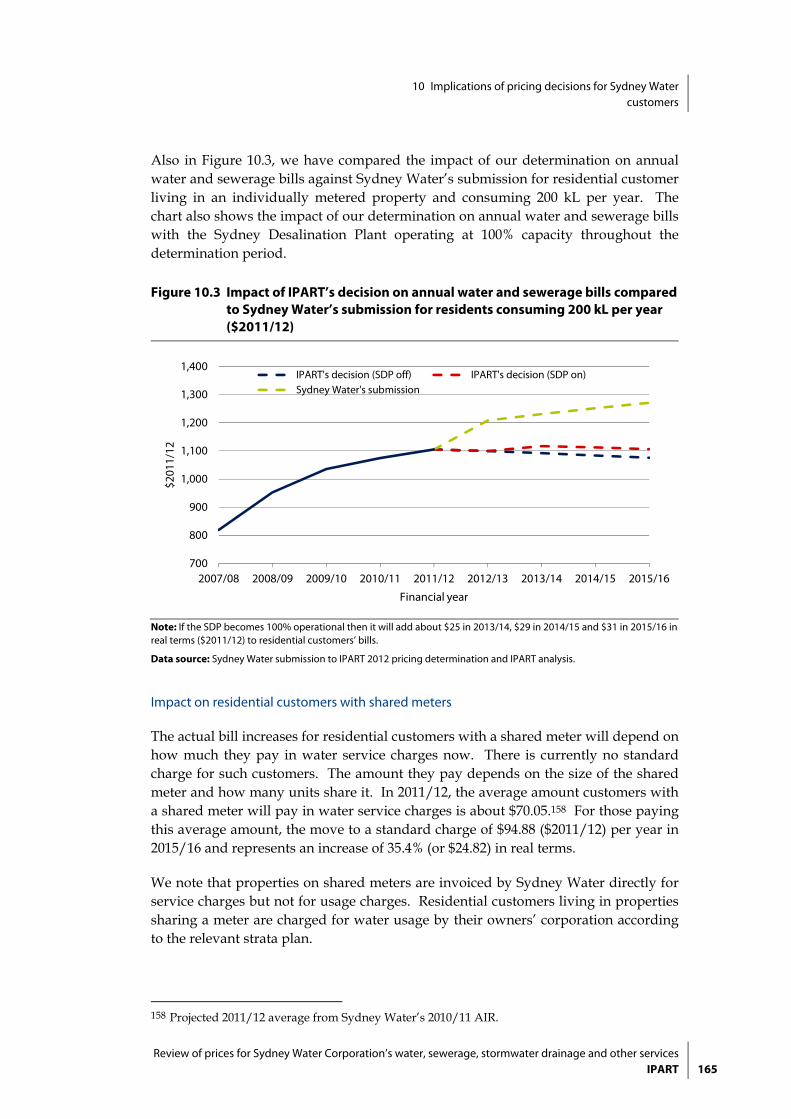
10 Implications of pricing decisions for Sydney Water customers
Review of prices for Sydney Water Corporation’s water, sewerage, stormwater drainage and other servicesIPART 165
Also in Figure 10.3, we have compared the impact of our determination on annual water and sewerage bills against Sydney Water’s submission for residential customer living in an individually metered property and consuming 200 kL per year. The chart also shows the impact of our determination on annual water and sewerage bills with the Sydney Desalination Plant operating at 100% capacity throughout the determination period.
Figure 10.3 Impact of IPART’s decision on annual water and sewerage bills compared to Sydney Water’s submission for residents consuming 200 kL per year ($2011/12)
700
800
900
1,000
1,100
1,200
1,300
1,400
2007/08 2008/09 2009/10 2010/11 2011/12 2012/13 2013/14 2014/15 2015/16
$201
1/12
Financial year
IPART's decision (SDP off) IPART's decision (SDP on)Sydney Water's submission
Note: If the SDP becomes 100% operational then it will add about $25 in 2013/14, $29 in 2014/15 and $31 in 2015/16 in real terms ($2011/12) to residential customers’ bills.
Data source: Sydney Water submission to IPART 2012 pricing determination and IPART analysis.
Impact on residential customers with shared meters
The actual bill increases for residential customers with a shared meter will depend on how much they pay in water service charges now. There is currently no standard charge for such customers. The amount they pay depends on the size of the shared meter and how many units share it. In 2011/12, the average amount customers with a shared meter will pay in water service charges is about $70.05.158 For those paying this average amount, the move to a standard charge of $94.88 ($2011/12) per year in 2015/16 and represents an increase of 35.4% (or $24.82) in real terms.
We note that properties on shared meters are invoiced by Sydney Water directly for service charges but not for usage charges. Residential customers living in properties sharing a meter are charged for water usage by their owners’ corporation according to the relevant strata plan.
158 Projected 2011/12 average from Sydney Water’s 2010/11 AIR.

10 Implications of pricing decisions for Sydney Water customers
166 IPART Review of prices for Sydney Water Corporation’s water, sewerage, stormwater drainage and other services
Table 10.2 shows indicative water and sewerage charges that residential customers with a shared meter and a range of water usage could expect to face under the determination. This is an average across all residential customers living in properties on shared meters. Table 10.2 indicates that these customers’ charges will increase over the 2012 determination period, with an increase in the first year due to an increase in their fixed water service charge. The total increase over the determination period is larger for customers with lower water usage because the service charge represents a larger proportion of their total charge.
Table 10.2 Indicative annual water and sewerage charges for residential customers with a shared meter ($2011/12)
Current (2011/12)
2012/13 2013/14 2014/15 2015/16 Change 2011/12 to
2015/16
100 kL pa per property
820 826 840 853 866 46
%increase 0.8% 1.7% 1.5% 1.5% 5.6%
150 kL pa per property
925 931 945 958 971 46
%increase 0.7% 1.5% 1.4% 1.3% 4.9%
200 kL pa per property
1030 1,036 1,050 1,063 1,076 46
%increase 0.6% 1.3% 1.2% 1.2% 4.4% Note: For ‘current, 2011/12”, we have applied the average amount that properties on shared meters pay for water service charges which is about $70.05. Also, residential customers on shared maters will not actually receive a bill from Sydney Water for the amounts shown above. They will receive an invoice from Sydney Water directly for their water and sewerage service charges, but will be paying for their water usage charge via their strata levies. The service charge for water and sewerage combined will increase by 6% from $621.17 ($2011/12) to $655.73 ($2011/12) by 2015/16.
Source: IPART analysis.
We have also provided some specific examples for properties sharing different meter sizes and indicative impacts of our pricing decisions on their water and sewerage charges. Table 10.3 shows that in percentage terms, the increase in total charges (service charge billed by Sydney Water and the usage charge paid via strata levies) is expected to be larger for customers who live in blocks with a relatively large number of units for their particular meter size. This is because such customers currently pay a relatively small share of the water service charge applicable to the meter size, and so will be more affected by the introduction of a standard water service charge of $94.88 ($2011/12) for all residential properties on shared meters.

10 Implications of pricing decisions for Sydney Water customers
Review of prices for Sydney Water Corporation’s water, sewerage, stormwater drainage and other servicesIPART 167
Table 10.3 Indicative annual water and sewerage service charges for residential customers with units in different sized blocks and sharing different sized meters ($2011/12)
Water use
Meter size
No of units
2011/12 2012/13 2013/14 2014/15 2015/16 Change2011/12 to
2015/16
150 kL pa per unit
40mm 10 913 931 945 958 971 58
2.0% 1.5% 1.4% 1.3% 6.3%
150 kL pa per unit
65mm 26 914 931 945 958 971 57
1.9% 1.5% 1.4% 1.3% 6.2%
Note: Residential customers on shared meters will not actually receive a bill from Sydney Water for the amounts shown above. They will receive an invoice from Sydney Water directly for their water and sewerage service charges, but will be paying for their water usage charge via their strata levies. The service charge for water and sewerage combined will increase by 6% from $621.17 ($2011/12) to $655.73($2011/12) by 2015/16.
Source: IPART analysis.
10.3.3 Impact on residential water, sewerage and stormwater drainage bills
Impact on residential customers with individual meters
Sydney Water provides stormwater drainage services to 27% of its customers.159 The tables below set out the determination’s indicative impacts on the total water, sewerage and stormwater drainage bills for these customers with varying levels of water usage.
Table 10.4 indicates that the bills of customers with an individually metered house, and stormwater services, do not change significantly in real terms, regardless of the customer’s water usage. However, they do not get the decrease received for similar customers who only receive water and sewerage services (see Table 10.1). This is because stormwater charges for customers in a house increase over the determination period due to price restructuring.
159 It provides these services to just over 500,000 residential and non-residential customers, mostly
located in the inner west and inner south west of Sydney. For the remaining customers, stormwater drainage services are supplied by their local council.

10 Implications of pricing decisions for Sydney Water customers
168 IPART Review of prices for Sydney Water Corporation’s water, sewerage, stormwater drainage and other services
Table 10.4 Annual water, sewerage and stormwater drainage bills for residential customers residing in a house ($2011/12)
2011/12 2012/13 2013/14 2014/15 2015/16 Change 2011/12 to
2015/16
100 kL pa 944 938 948 949 945 1
%increase -0.6% 1.1% 0.1% -0.4% 0.1%
150 kL pa 1,049 1,043 1,053 1,054 1,050 1
%increase -0.6% 1.0% -0.1% -0.3% 0.1%
200 kL pa 1,154 1,148 1,158 1,159 1,155 1
%increase -0.6% 0.9% 0.1% -0.3% 0.1%
300 kL pa 1,364 1,358 1,368 1,369 1,365 1
%increase -0.5% 0.8% 0.1% -0.3% 0.0%
400 kL pa 1,575 1,568 1,578 1,579 1,575 0
%increase -0.4% 0.7% 0.0% -0.2% 0.0%
Source: IPART analysis.
Table 10.5 shows that the bills of customers who reside in individually metered apartments will decrease. The difference between these customers and those who live in houses are lower stormwater charges. The stormwater charge for these customers will decrease over the determination period because of our price restructuring.
Table 10.5 Indicative water, sewerage and stormwater drainage bills for residential customers residing in an individually metered apartment ($2011/12)
2011/12 2012/13 2013/14 2014/15 2015/16 Change 2011/12 to
2015/16
100 kL pa 944 938 922 909 895 -49
%increase -0.6% -1.7% -1.4% -1.6% -5.2%
150 kL pa 1,049 1,043 1,027 1,014 1,000 -49
%increase -0.6% -1.5% -1.2% -1.4% -4.7%
200 kL pa 1,154 1,148 1,132 1,119 1,105 -49
%increase -0.6% -1.4% -1.1% -1.3% -4.3%
300 kL pa 1,364 1,358 1,342 1,329 1,315 -50
%increase -0.5% -1.2% -0.9% -1.1% -3.6%
400 kL pa 1,575 1,568 1,552 1,539 1,525 -50
%increase -0.4% -1.0% -0.8% -0.9% -3.2%
Source: IPART analysis.

10 Implications of pricing decisions for Sydney Water customers
Review of prices for Sydney Water Corporation’s water, sewerage, stormwater drainage and other servicesIPART 169
Impact on residential customers with shared meters
Table 10.6 shows indicative impacts of our determination on the total charges that residential customers residing in properties (same size unit and same water usage) on a shared meter can expect to face for water, sewerage and stormwater charges. Residential customers who live in properties sharing a meter can expect an overall increase in water, sewerage and stormwater charges. This is because of the increase in the water service charge due to our price restructuring.
Table 10.6 Indicative annual water, sewerage and stormwater service charges for residential customers with units in different sized blocks and sharing different sized meters ($2011/12)
Water Meter size
No of propertie
s
2011/12 2012/13 2013/14 2014/15 2015/16 Change2011/12 to
2015/16
150 kL pa per unit
40mm 10 962 980 985 993 1,000 38
%increase 1.8% 0.5% 0.9% 0.7% 3.9%
150 kL pa per unit
65mm 26 963 980 985 993 1,000 37
%increase 1.7% 0.5% 0.9% 0.7% 3.8%
Note: Residential customers on shared maters will not actually receive a bill from Sydney Water for the amounts shown above. They will receive an invoice from Sydney Water directly for their water, sewerage and stormwater service charges, but will be paying for their water usage charge via their strata levies. The service charge for water, sewerage and stormwater combined will decrease by 3.0% from $664.65 ($2011/12) in 2012/13 to $684.77 ($2011/12) by 2015/16.
Source: IPART analysis.
10.3.4 Impact on pensioners
Sydney Water provides rebates for service charges to pensioners. The concessions are 100% of the service charge for water, 83% of the service charge for sewerage, and 50% of the service charge for stormwater drainage.
Eligible pensioners will be largely unaffected by the pricing changes under the determination. Table 10.7 below shows that their average annual water and sewerage bill are likely to increase by about $3 in real terms over the 4-year period.160 As pensioners receive a concession of 100% of the water service charge, they are unaffected by our decision to restructure this charge.
160 Based on an average consumption of 150 kL per year for pensioners.

10 Implications of pricing decisions for Sydney Water customers
170 IPART Review of prices for Sydney Water Corporation’s water, sewerage, stormwater drainage and other services
Table 10.7 Annual water and sewerage bills for pensioners ($2011/12)
2011/12 2012/13 2013/14 2014/15 2015/16 Change 2011/12 to
2015/16
100 kL pa 302 303 304 305 305 3
%increase 0.3% 0.3% 0.3% 0.3% 1.1%
150 kL pa 407 408 409 410 410 3
%increase 0.2% 0.2% 0.2% 0.2% 0.8%
200 kL pa 512 513 514 515 515 3
%increase 0.1% 0.2% 0.1% 0.2% 0.6%
250 kL pa 617 618 619 620 620 3
%increase 0.1% 0.1% 0.1% 0.1% 0.5%
300 kL pa 723 723 724 725 725 3
%increase 0.0% 0.1% 0.1% 0.1% 0.4%
Note: Concessions of 100% and 83% have been applied to the water and sewerage service charge respectively.
Source: IPART analysis.
10.3.5 Impact on residential water and sewerage bills relative to average earnings
To help assess the impact of the determination on the affordability of Sydney Water’s service, we compared the indicative annual water and sewerage bills for customers with an individual water meter and average water usage to actual and forecast average earnings in NSW over the 2008 and 2012 determination periods (Table 10.8). We found that water and sewerage bills have been a relatively stable proportion of average earnings over the past few years, increasing from 1.8% in 2008/09 to 2.0% in 2011/12. Assuming that earnings increase at a rate of 0.98% per year in real terms,161 average bills should be less than the recent high of 2% of average earnings, by 2015/16.
161 NSW Treasury has forecast the wages price index to increase at 3.5% per year until 2014/15 (see
NSW Treasury, Half-Yearly Review 2011-12, 15 December 2011, p 19). We have assumed that the wage price index will also increase by 3.5% over 2014/15 to 2015/16, and also applied our inflation forecast of 2.5% to forecast a real wage price index of 0.98%.
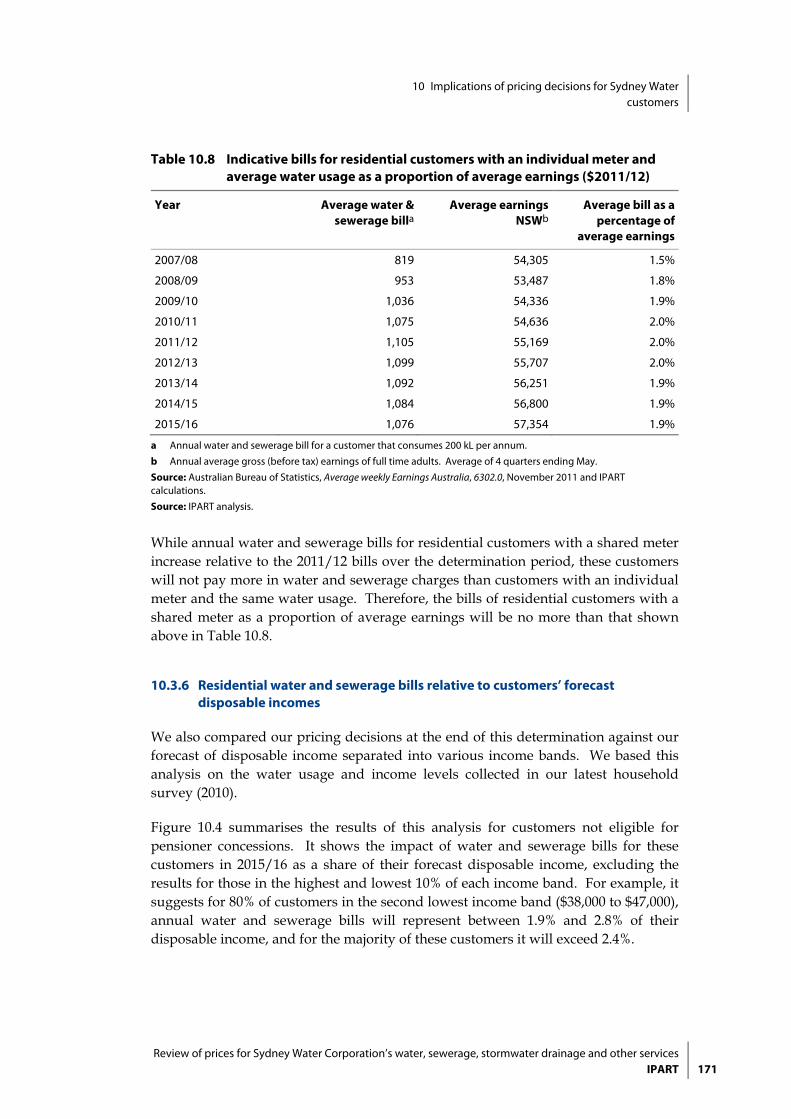
10 Implications of pricing decisions for Sydney Water customers
Review of prices for Sydney Water Corporation’s water, sewerage, stormwater drainage and other servicesIPART 171
Table 10.8 Indicative bills for residential customers with an individual meter and average water usage as a proportion of average earnings ($2011/12)
Year Average water & sewerage billa
Average earnings NSWb
Average bill as a percentage of
average earnings
2007/08 819 54,305 1.5%
2008/09 953 53,487 1.8%
2009/10 1,036 54,336 1.9%
2010/11 1,075 54,636 2.0%
2011/12 1,105 55,169 2.0%
2012/13 1,099 55,707 2.0%
2013/14 1,092 56,251 1.9%
2014/15 1,084 56,800 1.9%
2015/16 1,076 57,354 1.9%
a Annual water and sewerage bill for a customer that consumes 200 kL per annum.
b Annual average gross (before tax) earnings of full time adults. Average of 4 quarters ending May.
Source: Australian Bureau of Statistics, Average weekly Earnings Australia, 6302.0, November 2011 and IPART calculations.
Source: IPART analysis.
While annual water and sewerage bills for residential customers with a shared meter increase relative to the 2011/12 bills over the determination period, these customers will not pay more in water and sewerage charges than customers with an individual meter and the same water usage. Therefore, the bills of residential customers with a shared meter as a proportion of average earnings will be no more than that shown above in Table 10.8.
10.3.6 Residential water and sewerage bills relative to customers’ forecast disposable incomes
We also compared our pricing decisions at the end of this determination against our forecast of disposable income separated into various income bands. We based this analysis on the water usage and income levels collected in our latest household survey (2010).
Figure 10.4 summarises the results of this analysis for customers not eligible for pensioner concessions. It shows the impact of water and sewerage bills for these customers in 2015/16 as a share of their forecast disposable income, excluding the results for those in the highest and lowest 10% of each income band. For example, it suggests for 80% of customers in the second lowest income band ($38,000 to $47,000), annual water and sewerage bills will represent between 1.9% and 2.8% of their disposable income, and for the majority of these customers it will exceed 2.4%.

10 Implications of pricing decisions for Sydney Water customers
172 IPART Review of prices for Sydney Water Corporation’s water, sewerage, stormwater drainage and other services
Figure 10.4 Distribution of residential water and sewerage bills relative to customers’ forecast 2015/16 disposable income for customers without pensioner concessions ($2011/12)
0.0%
1.0%
2.0%
3.0%
4.0%
5.0%
$21 to$38k
$38 to$47k
$47 to$70k
$70 to$100k
$100 to$147k
$147 to$176k
$176k +
Bills
as
a sh
are
of d
ispo
sabl
e in
com
e
Income band ( 2015/16 pre-tax income , $2011/12)
Owners without concessionsMedian
Median all owners without concessions
10th percentile
90th percentile
Note: We have inflated income by 0.98% per annum based on our analysis of NSW Treasury’s wage price index forecast and our inflation adjustment of 2.5%.
Data source: Calculations based on IPART’s household survey, 2010.
For those in the lowest income band, these bills will generally represent a higher percentage of their income, ranging from 2.6% to 4.1% for 80% of customers in this band (with 50% of customers in the band having bills representing 3.2% of their income). This range is much wider than the range for customers in higher income bands.
Overall, we consider that our pricing decisions will not adversely affect vulnerable customers without concessions, including those in the lowest income categories, given that they generally result in small decreases in customer bills in real terms. We note that the decisions mean that by 2015/16, all residential customers will pay the same water and sewerage service charges. Thus, the variability between customers’ total annual water and sewerage bills in 2015/16 will only be due to differences in their water usage.
Some customers in the lower income categories and who have larger families may consume large amounts of water. These customers may experience some difficulty paying their bills. We note that Sydney Water has a range of social programs aimed at assisting vulnerable customers. These assistance measures are shown in Box 10.1.
Figure 10.5 summarises the results of the analysis for customers who are pensioners. It indicates that for 80% of pensioners in the lowest income band ($15,000 to $21,000), water and sewerage bills will represent between 0.8% and 2.6% of their disposable income in 2015/16. For the majority of these pensioners – and the majority in all the other income bands – water and sewerage bills will represent less than 1.5% of their disposable income.

10 Implications of pricing decisions for Sydney Water customers
Review of prices for Sydney Water Corporation’s water, sewerage, stormwater drainage and other servicesIPART 173
Figure 10.5 Distribution of residential water and sewerage bills relative to forecast 2015/16 disposable income for pensioners ($2011/12)
0.0%
0.5%
1.0%
1.5%
2.0%
2.5%
3.0%
$15 to $21k $21 to $38k $38 to $47k $47 to $70k $70 to $100k
Bills
as
a sh
are
of d
ispo
sabl
e in
com
e
Income band ( 2015/16 pre-tax income , $2011/12)
Owners with concessionsMedian all owners with concessions
Median
10th percentile
90th percentile
Note: We have inflated income by 0.98% per annum based on our analysis of NSW Treasury’s wage price index forecast and our inflation adjustment of 2.5%.
Data source: Calculations based on IPART’s household survey, 2010.

10 Implications of pricing decisions for Sydney Water customers
174 IPART Review of prices for Sydney Water Corporation’s water, sewerage, stormwater drainage and other services
Box 10.1 Social programs
Sydney Water has a range of social programs aimed to assist vulnerable customers pay theirwater and sewerage bills. They include:
Extended payment options – Sydney Water offers customers flexible extended paymentterms and a range of payment options to help them manage their bills. Sydney Water alsointends to introduce bill smoothing as another regular payment option.
No interest loan scheme – Sydney Water contributes to this scheme to assist low-incomehouseholds purchase water-efficient appliances. Sydney Water intends to expand thescheme to include general plumbing, sewerage connections and products for hot watersystems.a
Payment assistance scheme – under this scheme, participating welfare agencies assess thefinancial position of customers and provide payment vouchers to customers in financialdifficulty.
Pensioner rebates – eligible pensioners can receive, on their service charges, a rebate of100% for water, 83% for sewerage and 50% for stormwater drainage.
PlumbAssist program – Sydney Water’s previous retrofit program where domesticproperties were fitted with water efficient devices free of charge if they meet certaineligibility criteria will now be extended to include plumbing repairs or replacements.
a Sydney Water submission to IPART 2012 pricing determination, p 129.
10.4 Impact on the affordability of services for non-residential customers
We assessed the determination’s implications for the affordability of Sydney Water’s services for non-residential customers by analysing its impact on the annual bills for a range of customers. We analysed the impact on:
water and sewerage bills for customers with varied water usage and metering arrangements
water, sewerage and stormwater drainage bills with varied water usage and metering arrangements.
Non-residential customers may have an individual meter or share a meter, and meters range from 20mm to 600mm in diameter. Those with an individual meter pay the full water, sewerage and stormwater service charge applicable to their meter’s size. Those with a shared meter will now pay an equal share of the service charges applicable for the meter they are connected to, without being subject to a minimum charge per customer (prior to this determination, non-residential customers were subject to a minimum sewerage service charge of the 20mm service charge for sewerage).

10 Implications of pricing decisions for Sydney Water customers
Review of prices for Sydney Water Corporation’s water, sewerage, stormwater drainage and other servicesIPART 175
10.4.1 Impact of water and sewerage bills for non-residential customers with individual meters
Table 10.9 shows indicative annual water and sewerage bills for non-residential customers with individual meters of different sizes and varied levels of water usage. It shows that the bills for customers with an individual 20mm meter and 260 kL water usage a year decrease by 2.4% (or $29) over the determination period (in real terms). This bill decrease is due to our decision to set water service charges for these customers in line with those for residential customers. We estimate that non-residential customers with an individual 20mm meter are expected to comprise around 51% of Sydney Water’s non-residential water meter connections in 2012/13.162
However, the bills of non-residential customers with an individual meter larger than 20mm (and larger water usage) may increase over the determination period (in real terms). This is due largely to the increase in fixed sewerage service charges for these customers, which may offset the decrease in their sewerage usage charge. The size of the bill increase in percentage terms is larger for those with lower water usage, as the sewerage service charge makes a larger proportion of their total bill. In addition, those with higher discharges benefit more from the decrease in sewerage usage charges.163
Table 10.9 shows for example, that an individually metered non-residential property on a 40mm meter and consuming 1,000 kL of water per year is expected to face water and sewerage bill increases of approximately 27%. This represents an average yearly increase over the 4 years of approximately 6.1% per annum. However, larger dischargers may experience bill decreases due to the relatively high proportion of the bill being sewerage usage charges which is decreasing.
162 Sydney Water is estimated to have 96,254 non-residential water meter connections of which
49,522 are estimated to be on individual 20mm size connections in 2012/13. 163 We have also reduced the free threshold allowance for sewerage from 500 kL pa to 300 kL pa
over the determination period. This has more of an impact for lower water users.

10 Implications of pricing decisions for Sydney Water customers
176 IPART Review of prices for Sydney Water Corporation’s water, sewerage, stormwater drainage and other services
Table 10.9 Indicative annual water and sewerage bills for non-residential customers with individual meters ($2011/12)
Water usage pa
Meter size
Current(2011/12)
2012/13 2013/14 2014/15 20/1516 Change 2011/12
to 2015/16
260 kL 20mm 1,231 1,225 1,218 1,210 1,202 -29
%increase -0.5% -0.6% -0.7% -0.7% -2.4%
350 kL 25mm 1,628 1,720 1,830 1,959 2,108 479
%increase 5.6% 6.4% 7.0% 7.6% 29.4%
1,000 kL 40mm 4,820 5,090 5,391 5,729 6,107 1,287
%increase 5.6% 5.9% 6.3% 6.6% 26.7%
10,000 kL 100mm 46,354 47,028 47,886 49,075 50,605 4,251
%increase 1.5% 1.8% 2.5% 3.1% 9.2%
Note: Average sewage discharge factors used.
Note: We have applied an average discharge factor of 79%, calculated from information submitted by Sydney Water in early November 2011 in response to requests from IPART.
10.4.2 Impact on water and sewerage bills for non-residential customers with shared meters
We note that non-residential properties on shared meters are also invoiced by Sydney Water directly for service charges but not for their usage charges. Non-residential customers on properties sharing a meter are charged for their water usage by their owners’ corporation according to the relevant strata plan.
The wide variation in non-residential properties with shared meters makes it difficult to estimate increases in charges for these customers. However, we have shown indicative water and sewerage charges for strata units that are equal in size and water consumption as an example so that customers can gauge what the impact of our pricing decisions might be on the total charges that some non-residential properties on a shared meter can expect to pay.164
The increase in indicative water and sewerage charges in Table 10.10 for larger users is largely due to the decrease in the sewerage discharge allowance for strata properties. The customers illustrated in Table 10.10 will experience a decrease in the service charge for sewerage because they will no longer be subject to the 20mm meter service charge for sewerage. For example, currently (2011/12) each strata is paying $539.53 for their annual sewerage service charge, but for a strata unit connected to a 25mm with 2 other equal strata units, they will now pay $256.49 ($2011/12) each in 2012/13. This represents a 52.5% decrease in the service charge.
164 The service charge is billed by Sydney Water and the indicative usage charges are paid by non-
residential customers via their strata levies.

10 Implications of pricing decisions for Sydney Water customers
Review of prices for Sydney Water Corporation’s water, sewerage, stormwater drainage and other servicesIPART 177
Table 10.10 Indicative annual water and sewerage charges for strata units sharing a meter ($2011/12)
Water use (kL pa)
Meter size
Equal strata connections
2011/ 12
2012/ 13
2013/ 14
2014/ 15
2015/ 16
Change2011/12
to 2015/16
75 kL pa per unit
25mm 3 773 486 523 566 615 -158
% increase -37.1% 7.5% 8.2% 8.8% -20.4%
350 kL pa per unit
25mm 3 1,351 1,238 1,279 1,323 1,370 19
% increase -8.4% 3.3% 3.4% 3.6% 1.4%
75 kL pa per unit
25mm 8 726 285 306 328 351 -375
% increase -60.7% 7.4% 7.2% 7.0% -51.6%
350 kL pa per unit
40mm 8 1,348 1,354 1,368 1,388 1,415 67
% increase 0.5% 1.1% 1.4% 2.0% 5.0%
75 kL pa per unit
40mm 14 739 375 396 420 447 -292
% increase -49.2% 5.6% 6.0% 6.4% -39.5%
Note: Non-residential customers on shared maters will not actually receive a bill from Sydney Water for the amounts shown above. They will receive an invoice from Sydney Water directly for their water and sewerage service charges, but will be paying for their water usage charge via their strata levies.
We have applied an average discharge factor of 79%, calculated from information submitted by Sydney Water in early November 2011 in response to requests from IPART. We have also distributed the free threshold allowance for sewerage evenly between strata units.
Source: IPART analysis.
10.4.3 Impact on non-residential water, sewerage and stormwater drainage charges
Sydney Water provides stormwater drainage services to a small proportion of its non-residential customers.165 Around 90% of these customers are small to medium sized business with a property size of less than 1,000m2.166 As noted above, we have made a decision to change the structure of these prices.
The tables below set out the determination’s indicative impacts on the total water, sewerage and stormwater drainage bills for these customers with various property sizes, meter arrangements and water usage.
165 It provides these services to just over 500,000 residential and non-residential customers, mostly
located in the inner west and inner south west of Sydney. For the remaining customers, stormwater drainage services are supplied by their local council.
166 Sydney Water submission to IPART 2012 pricing determination, September 2011, p 359.

10 Implications of pricing decisions for Sydney Water customers
178 IPART Review of prices for Sydney Water Corporation’s water, sewerage, stormwater drainage and other services
Table 10.11 shows indicative bills for customers with an individual meter. It indicates that a small business with property area under 200m2, an individual 25mm meter and water usage of 350 kL per year will face total bill increases of about 21.7% by 2015/16 in real terms. This increase is mainly driven by increases in its sewerage service charge, which more than offsets the decrease in its stormwater drainage charges. This is due to the removal of the cross-subsidy that these customers are currently receiving.
Table 10.11 Indicative annual water, sewerage and stormwater drainage bills for non-residential customers with individual meters ($2011/12)
Meter size
Stormwater drainage
charge category
2011/ 12
2012/ 13
2013/ 14
2014/ 15
2015/ 16
Change 2011/12 to
2015/16
260 kL pa 20mm 0 - 200m2 1,359 1,351 1,258 1,245 1,231 -128
% increase -0.6% -6.9% -1.0% -1.1% -9.4%
350 kL pa 25mm 0 - 200m2 1,756 1,846 1,870 1,994 2,137 381
% increase 5.1% 1.3% 6.7% 7.1% 21.7%
1,000 kL pa 40mm 201 - 1,000m2 and low
impact
4,948 5,216 5,496 5,817 6,186 1,238
% increase 5.4% 5.4% 5.8% 6.4% 25.0%
10,000 kL pa
100mm 1,001 - 10,000m2
46,482 47,154 48,079 49,339 51,001 4,519
% increase 1.4% 2.0% 2.6% 3.4% 9.7%
Note: We have applied an average discharge factor of 79%, calculated from information submitted by Sydney Water in early November 2011 in response to requests from IPART.
Source: IPART analysis.
Table 10.11 shows the impact of our stormwater pricing decisions on total water, sewerage and stormwater charges that non-residential customers on shared meters can expect to pay. Non-residential customers with 20mm water connections on properties on land less than 200m2 can expect to face an overall decrease in their water, sewerage and stormwater bills. Non-residential customers with meters larger than 20mm can expect to face an overall increase in their water, sewerage and stormwater bills. Non-residential strata titled properties can expect to face a decrease in their overall water, sewerage and stormwater bill.

10 Implications of pricing decisions for Sydney Water customers
Review of prices for Sydney Water Corporation’s water, sewerage, stormwater drainage and other servicesIPART 179
Table 10.12 Indicative annual water, sewerage and stormwater drainage charges for non-residential customers with shared meters ($2011/12)
Meter size
Equal strata connections
2011/ 12
2012/ 13
2013/ 14
2014/ 15
2015/ 16
Change2011/12
to 2015/16
75 kL pa per strata
25mm 3 900 612 562 601 644 -256
%increase -32.1% -8.1% 6.9% 7.2% -28.5%
350 kL pa per strata
25mm 3 1479 1364 1319 1357 1400 -79
%increase -7.8% -3.3% 2.9% 3.1% -5.3%
75 kL pa per strata
40mm 8 853 411 346 363 380 -473
%increase -51.9% -15.8% 5.1% 4.7% -55.5%
350 kL pa per strata
40mm 8 1476 1480 1408 1423 1445 -31
%increase 0.3% -4.8% 1.0% 1.6% -2.1%
75 kL pa per strata
40mm 14 866 501 436 455 476 -391
%increase -42.2% -13.0% 4.4% 4.6% -45.1%
Note: Non-residential customers on shared maters will not actually receive a bill from Sydney Water for the amounts shown above. They will receive an invoice from Sydney Water directly for their water, sewerage and stormwater service charges, but will be paying for their water usage charge via their strata levies.
We have applied an average discharge factor of 79%, calculated from information submitted by Sydney Water in early November 2011 in response to requests from IPART. We have also distributed the free threshold allowance for sewerage evenly between strata units.
Source: IPART analysis.
10.5 Impact of 2008 decision to limit Sydney Water’s ability to levy developer charges
Prior to December 2008, Sydney Water was able to levy a range of developer charges for water infrastructure. The total revenue it received from developer charges over one determination period was subtracted from the value of its regulatory asset base before rolling it forward to the start of the subsequent determination for price setting purposes. This ensured Sydney Water only earned a return on the funds that it had invested in infrastructure, and not on the developer charges it had raised.
However, in December 2008, the former NSW Government decided that some of these developer charges would be set to zero to help increase housing supply and affordability. This meant that Sydney Water did not raise the expected revenue from developer charges in the 2008 determination period.

10 Implications of pricing decisions for Sydney Water customers
180 IPART Review of prices for Sydney Water Corporation’s water, sewerage, stormwater drainage and other services
Given that Sydney Water collected about $44 million to $54 million in developer charges per year in the determination period prior to the 2008 determination period,167 our preliminary view is that the decision to set some developer charges at 0 adds about $27 to a typical residential customers’ annual Sydney Water bill over the 2012 determination period.168
10.5.1 Impact on Rouse Hill customers
During the 2008 determination, Sydney Water built stormwater drainage infrastructure in a development area in Rouse Hill. As a result of the Government’s 2008 decision on developer charges, Sydney Water cannot recover the stormwater drainage capital costs from developer charges. We have made a decision to charge a stormwater drainage charge (Rouse Hill Land Charge) on new customers (residential and non-residential) in Rouse Hill of $953.94 ($2011/12) each year over a 5-year period (see section 9.5).
In addition, Sydney Water currently levies a River Management Charge (now called the Rouse Hill stormwater drainage charge) on all customers in Rouse Hill. This charge recovers the operating costs of Sydney Water’s trunk drainage assets used on flood-prone land and wetlands in Rouse Hill. We have made a decision to allow Sydney Water to collect this charge from Rouse Hill customers and have maintained this charge in real terms at $128.58 ($2011/12) for both residential and non-residential customers throughout the determination period.
As a result of these decisions:
new customers in Rouse Hill will pay $1,082.52 ($2011/12) per year in addition to their water and sewerage bills
existing customers will pay $128.58 ($2011/12) in addition to their water and sewerage bills.
These are the only stormwater drainage charges payable to Sydney Water by Rouse Hill customers. They do not pay the stormwater drainage charges outlined above.
167 Sydney Water Annual Information Return to IPART, September 2011. 168 IPART analysis.

11 Implications of pricing decisions for Sydney Water’s service standards, financial viability and other issues
Review of prices for Sydney Water Corporation’s water, sewerage, stormwater drainage and other servicesIPART 181
11 Implications of pricing decisions for Sydney Water’s service standards, financial viability and other issues
In addition to considering the implications of our determination on customers (see Chapter 10), we had regard to the other matters listed in the IPART Act (see Appendix A). In particular we considered the implications of our pricing decisions for Sydney Water’s service standards, financial viability and shareholders, and for general inflation and the environment. We are satisfied the determination achieves an appropriate balance between these matters.
11.1 Implications for Sydney Water’s service standards
Under our determination, Sydney Water is expected to achieve both operating and capital efficiency savings. We are satisfied that Sydney Water can achieve these efficiency savings and thus can generate sufficient revenue to maintain its service standards. Indeed, we have set prices in the expectation that current services levels will be maintained and that efficiency savings will not be obtained at the expense of service standards.
Sydney Water is licensed under the Sydney Water Act 1994. The Act requires Sydney Water to hold an operating licence that is issued by the Minister and reviewed annually by IPART. This licence contains a number of standards that Sydney Water must meet, or risk facing penalties associated with a breach of licence conditions. Sydney Water’s pricing submission identified the expenditure required for it to meet its obligations under both its operating and environmental licences. The operating licence also includes performance indicators against which Sydney Water’s performance is reviewed as part of the annual audit of its compliance with the licence.169
In its review of Sydney Water’s operating and capital expenditure for this determination, Atkins Cardno noted that Sydney Water performed well over the 2008 determination period. It maintained its service standards related to water pressure, continuity, leakage and sewage overflows, and reported no breaches of its operating licence conditions.170 This is consistent with the findings of the audits of Sydney Water’s operating licence compliance over the same period.
169 The 2010/11 audit was completed in November 2011. The report can be accessed at
www.ipart.nsw.gov.au 170 WS Atkins International Ltd, Detailed review of Sydney Water Corporation’s Operating and Capital
Expenditure, November 2011, p 16.

11 Implications of pricing decisions for Sydney Water’s service standards, financial viability and other issues
182 IPART Review of prices for Sydney Water Corporation’s water, sewerage, stormwater drainage and other services
Sydney Water raised concerns over Atkins Cardno’s recommendations on the efficient level of Sydney Water’s operating and capital expenditures for the 2012 determination period (discussed in Chapters 5 and 6). It indicated that the efficiency targets incorporated in these recommendations will be difficult for it to achieve. It also held the view that the proposed capital expenditure Atkins Cardno recommended be deferred until the next determination period should be carried out in the 2012 period.
Sydney Water proposed that at least $285 million of the identified expenditure savings be reinstated, and indicated that it is unwilling to cut costs if it means compromising service standards.171 Atkins Cardno provided a response, which can be found on our website. Given the robust analysis provided by Atkins Cardno, and the fact that Sydney Water provided no new information in support of its point of view, our draft decision was to accept Atkins Cardno’s recommended water and sewerage expenditures, subject to 2 arithmetical corrections confirmed by Atkins Cardno. However, this draft decision also included lower stormwater drainage capital expenditure than recommended by Atkins Cardno. This reflected our observation that Sydney Water’s actual capital expenditure on stormwater drainage assets over the 2008 determination period was significantly lower than we had allowed for in making that determination.
In its submission in response to the draft report, Sydney Water provided more evidence to justify its proposed stormwater drainage capital expenditure. After considering this evidence, we made a final decision to include the higher level of stormwater drainage capital expenditure recommended by Atkins Cardno and to confirm all other aspects of our draft decisions on capital expenditure.
We have revised the output measures introduced in the 2008 determination to reflect the nature of the capital program over the 2012 determination period. These will assist us to identify how expenditure proposals will enable Sydney Water to meet its regulatory requirements. A list of output measures for Sydney Water (along with targets) is set out in Appendix B.
11.2 Impact on Sydney Water’s financial viability and shareholders
We are satisfied our determination will not adversely affect the ability of Sydney Water to operate, maintain, renew and develop the assets required to deliver its regulated services over the 2012 determination period. Further, we are satisfied that this determination will enable Sydney Water to earn a reasonable rate of return on its assets.
171 Sydney Water correspondence 11 January 2012.

11 Implications of pricing decisions for Sydney Water’s service standards, financial viability and other issues
Review of prices for Sydney Water Corporation’s water, sewerage, stormwater drainage and other servicesIPART 183
In our assessment of Sydney Water’s financeability, we have used a dividend payout ratio of 70% rather than the fixed dividends contained in Sydney Water’s submission. We have based our 70% dividend payout ratio on NSW Treasury’s standard reference point of a dividend payout ratio of 70% of after-tax profit for Government businesses.172
11.2.1 Rate of return
Our pricing decisions mean that Sydney Water is able to achieve at least the total notional revenue requirement we allowed for in making the 2012 determination, with an over recovery of $52 million over 4 years. Thus we expect that it will earn a real post-tax rate of return on its RAB of at least the target rate of 5.6% in each year of the determination period. This calculation is based on the assumptions we used in our modelling of the financial impacts of its pricing decisions, and depends on Sydney Water achieving the efficiency targets we have set.
11.2.2 Financeability
For most determinations, we base prices on our estimate of the revenue the regulated business will require to meet its efficient costs over the determination period. This ‘building block’ approach gives the business the opportunity to recover its costs and remain financially viable in the long term while creating incentives for future efficiency. It is our policy that before we finalise our pricing decisions we apply a financeability assessment to understand how our decisions are likely to affect a business’s short-term viability. If we identify potential financeability issues, we then consider the likely causes of these issues and the options for addressing them.
In assessing Sydney Water’s financeability over the 4 years of the 2012 determination, we analysed its forecast financial performance, financial position and cash flows. Using our financial models, we forecast a range of financial ratios and assessed Sydney Water’s financial strength and ability to service and repay debt. We also modelled these ratios for the following price determination period.
We calculated the financial ratios using Sydney Water’s actual gearing ratios and forecast cash flows based on our pricing decisions. For previous determinations, we have used the interest rates we assumed in calculating the WACC to calculate forecast interest expense. However, because our objective is to provide a cross-check on the business’ financeability from the perspective of an external stakeholder (for example, lender or rating agency) we now consider that our assessment should reflect its actual interest expense. Therefore for this determination, we have used Sydney Water’s actual and projected interest rates in calculating interest expense.173
172 NSW Treasury, Financial Distribution Policy for Government Businesses, TPP 09-06, p 5. 173 The paper on the financeability tests (IPART, Financeability tests and their role in price regulation,
January 2011) did not discuss the interest rate to be used in calculating the financial ratios. We will set out the options and their relative merits, along with our preferred approach, when we update this paper for the change to the post-tax WACC.

11 Implications of pricing decisions for Sydney Water’s service standards, financial viability and other issues
184 IPART Review of prices for Sydney Water Corporation’s water, sewerage, stormwater drainage and other services
In its submissions, Sydney Water raised concerns about its long-term financial viability and emphasised the need for increased revenue to maintain this viability. However, our financial modelling indicates that the maximum prices set in the determination will mean that Sydney Water will maintain a solid financial performance and financial position over the 2012 determination period. Based on this modelling, we expect that its key financial ratios, including funds from operations interest cover, funds from operations/debt and the debt gearing ratio, remain sound. Further, it will have adequate funds to continue to meet its dividend payments and operating and capital costs. 174
Table 11.1 sets out our forecast of Sydney Water’s key financial ratios over the 2012 determination period.
Table 11.1 Sydney Water’s key financial ratios used in assessing financeabilitya
2011/12 2012/13 2013/14 2014/15 2015/16
Funds from operations interest cover 2.2 2.3 2.2 2.1 2.0
Funds from operations/total debt 7.5% 7.9% 7.3% 6.9% 6.8%
Debt gearing (regulatory value) 51% 52% 53% 53% 54%
EBIT interest cover 1.9 1.9 1.8 1.7 1.7
RCF to Capex 0.5 0.5 0.5 0.6 0.7 a Financial ratios presented are based on the assumption of a 70% dividend payout ratio and Sydney Water meeting our forecasts of efficient operating and capital costs.
Source: IPART analysis.
While we note the downward trend in some of these ratios, the reduction in funds from operations (FFO) interest cover and EBIT interest cover is driven in large part by our glide path methodology to setting prices. This means that the target revenue is above notional revenue for the first 2 years. That is, if we modelled the notional revenue, the ratios would be much flatter over the determination period. Our modelling of the longer term financial ratios indicates that this trend will flatten out. FFO interest cover should stabilise at around 2.0 from 2015/16, if customer growth remains at its current level, the WACC remains constant at 5.6% and capital expenditure stays at or near current levels.
11.2.3 Dividends
Dividend policy is a matter for Sydney Water and the NSW Government. For our modelling purposes, we applied a 70% dividend payout ratio in our financeability assessment rather than the fixed dividend assumptions contained in Sydney Water’s submission.
174 Assuming that Sydney Water meets our forecasts of water sales and efficient operating and
capital expenditure.

11 Implications of pricing decisions for Sydney Water’s service standards, financial viability and other issues
Review of prices for Sydney Water Corporation’s water, sewerage, stormwater drainage and other servicesIPART 185
Based on our analysis of our pricing decisions, shown in Table 11.2 below, we consider that Sydney Water will be able to pay a 70% dividend payout ratio and maintain its financial viability.
Table 11.2 Implication of IPART’s decisions on dividends payable by Sydney Water ($millions, nominal)a
2011/12 2012/13 2013/14 2014/15 2015/16
IPART’s draft determination
Profit after-tax 252 300 283 260 254
70% expected dividend payout ratio (IPART applied)
176 210 198 182 178
IPART’s final determination
Profit after-tax 252 295 289 277 285
70% expected dividend payout ratio (IPART applied)
176 207 202 194 200
b All dividend figures based on the assumption of a 70% dividend payout ratio. Source: Sydney Water submission to IPART 2012 pricing determination, pp 32 and 33 and IPART.
In its submission, Sydney Water included fixed dividends as stated in its 2011-12 Statement of Corporate Intent. We note that Sydney Water has indicated that its dividends will be reviewed in consultation with its shareholders following the 2012 determination.175
Our estimate of dividends depend on our forecasts of water sales and our assumption that Sydney Water will achieve the efficient cost levels set out in this report.
11.2.4 Impact on the Consolidated Fund
Under section 16 of the IPART Act, IPART is required to report on the likely impact to the Consolidated Fund if prices are not increased to the maximum levels permitted. If this is the case, then the level of tax equivalent and dividends paid to the Consolidated Fund will fall. The extent of this fall will depend on Treasury’s application of its financial distribution policy and how the change affects after-tax profit.
Our financial modelling is based on a tax rate of 30% for pre-tax profit and dividend payments at 70% of after-tax profit. A one dollar decrease in pre-tax profit would result in a loss of revenue to the Consolidated Fund of 49 cents in total, which is 70% of the decrease in after-tax profit of 70 cents.
175 Sydney Water submission to IPART 2012 pricing determination, September 2011, p 34.

11 Implications of pricing decisions for Sydney Water’s service standards, financial viability and other issues
186 IPART Review of prices for Sydney Water Corporation’s water, sewerage, stormwater drainage and other services
11.3 Implications for general inflation
Under section 15 of the IPART Act, we are required to consider the effect of our determinations on general price inflation. Currently, water and sewerage costs in Sydney, contribute 0.29% towards the consumer price index (all groups, 8 capital cities).176 Under the determination, the annual average increase of a water and sewerage bill for a customer consuming 200 kL per annum is -0.7% (in real terms). Therefore, the approximate annual impact on general price inflation is -0.002% points (above the change in the CPI).177
11.4 Implications for the environment
The Government is responsible for determining any negative environmental impacts associated with Sydney Water’s activities, and for imposing standards or requirements on Sydney Water to address these impacts. For instance, the Office of Environment and Heritage (OEH) regulates Sydney Water’s activities including the discharge from its sewage treatment and recycling plants and reticulation systems.
Sydney Water is engaged in a range of environment-related projects, including:
SewerFix – this program focuses on repairing sewer main chokes but also on minimising repeat impacts on the environment and customers.
Wet Weather Overflow Abatement Program – this program is designed to prevent repeat wet weather overflows to customer properties and sensitive environmental sites.
Active Leak Reduction – this program began in 1999 as one component of Sydney Water’s strategy to each its operating licence water conservation targets.
We are satisfied that our determination will not negatively affect Sydney Water’s ability to implement these programs.
176 Australian Bureau of Statistics, Consumer Price Index 16th Series Weighting Pattern (cat. no.
6471.0). 177 -0.002% = -0.7%x0.29%.

11 Implications of pricing decisions for Sydney Water’s service standards, financial viability and other issues
Review of prices for Sydney Water Corporation’s water, sewerage, stormwater drainage and other servicesIPART 187
Appendices


A Matters to be considered by IPART under section 15 of the IPART Act
Review of prices for Sydney Water Corporation’s water, sewerage, stormwater drainage and other servicesIPART 189
A Matters to be considered by IPART under section 15 of the IPART Act
In making determinations IPART is required, under the IPART Act, to have regard to the following matters (in addition to any other matters IPART considers relevant):
a) the cost of providing the services concerned
b) the protection of consumers from abuses of monopoly power in terms of prices, pricing policies and standard of services
c) the appropriate rate of return on public sector assets, including appropriate payment of dividends to the Government for the benefit of the people of New South Wales
d) the effect on general price inflation over the medium term
e) the need for greater efficiency in the supply of services so as to reduce costs for the benefit of consumers and taxpayers
f) the need to maintain ecologically sustainable development (within the meaning of section 6 of the Protection of the Environment Administration Act 1991) by appropriate pricing policies that take account of all the feasible options available to protect the environment
g) the impact on pricing policies of borrowing, capital and dividend requirements of the government agency concerned and, in particular, the impact of any need to renew or increase relevant assets
h) the impact on pricing policies of any arrangements that the government agency concerned has entered into for the exercise of its functions by some other person or body
i) the need to promote competition in the supply of the services concerned
j) considerations of demand management (including levels of demand) and least cost planning
k) the social impact of the determinations and recommendations
l) standards of quality, reliability and safety of the services concerned (whether those standards are specified by legislation, agreement or otherwise).
Table A.1 outlines the sections of the report that address each matter.

A Matters to be considered by IPART under section 15 of the IPART Act
190 IPART Review of prices for Sydney Water Corporation’s water, sewerage, stormwater drainage and other services
Table A.1 Consideration of section 15 matters by IPART
Section 15(1) Report Reference
a) the cost of providing the services Section 3.3 and chapters 4 to 6 generally
b) the protection of consumers from abuses of monopoly power
Section 11.1 and Chapter 10
c) the appropriate rate of return and dividends Section 11.2
d) the effect on general price inflation Section 11.3
e) the need for greater efficiency in the supply of services
Chapters 5 and 6
f) ecologically sustainable development Section 11.4
g) the impact on borrowing, capital and dividend requirements
Section 11.2
h) impact on pricing policies of any arrangements that the government agency concerned has entered into for the exercise of its functions by some other person or body
Not applicable
i) need to promote competition Chapters 9 to 11 generally
j) considerations of demand management and least cost planning
Chapter 7 and 11.4
k) the social impact Chapter 10
l) standards of quality, reliability and safety Sections 3.7 and 11.1

B Sydney Water’s output measures and capital expenditure program
Review of prices for Sydney Water Corporation’s water, sewerage, stormwater drainage and other servicesIPART 191
B Sydney Water’s output measures and capital expenditure program
Sydney Water has provided information on its activity against output measures and capital expenditure over the 2008 determination period until 2010/11 and is provided in Table B.1 and Table B.2 below.
Table B.1 Activity against output measures 2010/11
Output or activity measure Indicator of activity by
2011/12
Activity 2010/11 Cumulative progress as at
2011
Water services
1. Renewal of critical water mains 40 km 13 28
2. Renewal/reliability of distribution mains
420 km 79 291
3. Pressure control areas established 112 no. 52 131
4. Bulk water meters: new and refurbished
200 no. 39 124
5. Water Pumping Station Renewals 28 no. 1 6
6. Installation/renewal of SCADA systems
2 sites 1 3
7. Renewal of customer water meters 426,000 no. 64160 197,157
8. Additional generation capacity installed
8.5 MW 4 9
Wastewater services
9. Renew critical mains 55 km 14 45
10. Rehabilitate sewers subject to dry weather overflows
290 km 61 188
11. Major Sewage Treatment Plants (STP) renewals
North Head 0 Completed in 2009/10
12. Sewage Pumping Station (SPS) renewals
100 no. 27 74
13. Increase capacity at STP 6 no. 1 3
14. Reduce wet weather overflows 7 catchments 2 4
15. Priority Sewerage Program Schemes
5 no. 2 6
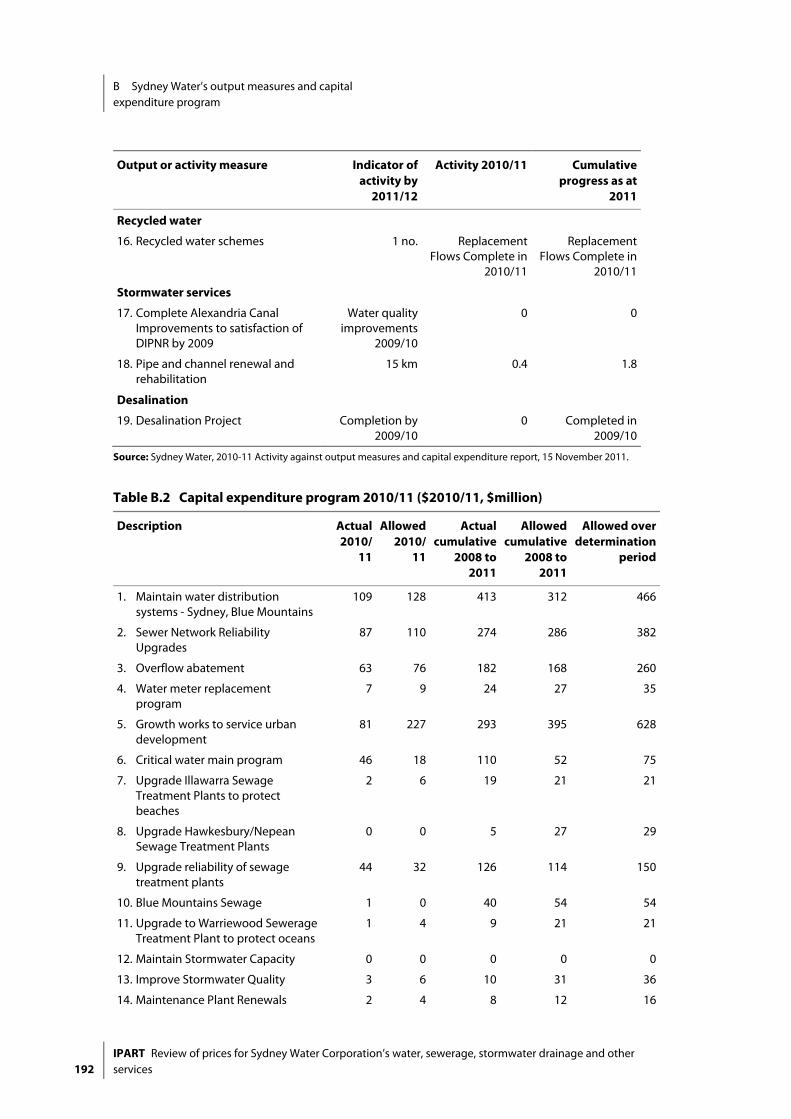
B Sydney Water’s output measures and capital expenditure program
192 IPART Review of prices for Sydney Water Corporation’s water, sewerage, stormwater drainage and other services
Output or activity measure Indicator of activity by
2011/12
Activity 2010/11 Cumulative progress as at
2011
Recycled water
16. Recycled water schemes 1 no. Replacement Flows Complete in
2010/11
Replacement Flows Complete in
2010/11
Stormwater services
17. Complete Alexandria Canal Improvements to satisfaction of DIPNR by 2009
Water quality improvements
2009/10
0 0
18. Pipe and channel renewal and rehabilitation
15 km 0.4 1.8
Desalination
19. Desalination Project Completion by 2009/10
0 Completed in 2009/10
Source: Sydney Water, 2010-11 Activity against output measures and capital expenditure report, 15 November 2011.
Table B.2 Capital expenditure program 2010/11 ($2010/11, $million)
Description Actual2010/
11
Allowed2010/
11
Actualcumulative
2008 to 2011
Allowed cumulative
2008 to 2011
Allowed over determination
period
1. Maintain water distribution systems - Sydney, Blue Mountains
109 128 413 312 466
2. Sewer Network Reliability Upgrades
87 110 274 286 382
3. Overflow abatement 63 76 182 168 260
4. Water meter replacement program
7 9 24 27 35
5. Growth works to service urban development
81 227 293 395 628
6. Critical water main program 46 18 110 52 75
7. Upgrade Illawarra Sewage Treatment Plants to protect beaches
2 6 19 21 21
8. Upgrade Hawkesbury/Nepean Sewage Treatment Plants
0 0 5 27 29
9. Upgrade reliability of sewage treatment plants
44 32 126 114 150
10. Blue Mountains Sewage 1 0 40 54 54
11. Upgrade to Warriewood Sewerage Treatment Plant to protect oceans
1 4 9 21 21
12. Maintain Stormwater Capacity 0 0 0 0 0
13. Improve Stormwater Quality 3 6 10 31 36
14. Maintenance Plant Renewals 2 4 8 12 16

B Sydney Water’s output measures and capital expenditure program
Review of prices for Sydney Water Corporation’s water, sewerage, stormwater drainage and other servicesIPART 193
Description Actual2010/
11
Allowed2010/
11
Actualcumulative
2008 to 2011
Allowed cumulative
2008 to 2011
Allowed over determination
period
15. Property Management and Acquisition
23 3 196 79 82
16. South Western Sydney Sewerage Scheme
1 0 4 11 11
17. Information Technology Projects 70 31 206 114 144
18. Brooklyn Dangar Island Sewerage Scheme
1 0 8 2 2
19. Mt Ku-ring-gai Sewerage Scheme 0 0 2 0 0
20. Mulgoa Wallacia Silverdale Sewerage Scheme
0 0 1 1 1
21. North Head STP Performance and Reliability
2 0 70 54 54
22. Recycled Water Projects 0 0 1 5 5
23. Desalination Project 4 0 1,140 1,160 1,160
24. Priority Sewerage Program - Stage 2
1 5 3 9 50
25. Western Sydney Recycled Water Initiative
6 0 179 192 192
26. Hawkesbury Heights Yellow Rock 10 0 46 29 29
27. Freemans Reach, Glossodia and Wilberforce
36 42 107 76 93
28. Appin, Wilton and Douglas Park 9 22 9 38 48
29. Agnes Banks and Londonderry 8 19 22 34 34
30. Diamond Bay/Vaucluse Sewage Transfer Scheme
0 0 0 1 19
Total 616 741 3,506 3,322 4,095
Source: Sydney Water, 2010-11 Activity against output measures and capital expenditure report, 15 November 2011.

B Sydney Water’s output measures and capital expenditure program
194 IPART Review of prices for Sydney Water Corporation’s water, sewerage, stormwater drainage and other services
Table B.3 below relates to IPART’s decision to require Sydney Water to report against output measures as discussed in section 3.7.
Table B.3 Output Measures
Output (or activity) Measure Output
Water services
Critical water mains renewals 51 km
Reticulation water mains renewals 287 km
Reservoir reliability program 13 reservoirs re-roofed
24 reservoirs re-lined
Water pumping station renewals program 24 pumping stations renewed
System reliability At least 3 projects in construction phase
Renewal of customer water meters 384,400 meters
Wastewater services
Avoid fail sewers 64 km
Dry weather flows 137 km
Wastewater treatment plant renewals HV renewals at 11 WWTPs
Major renewals completed at Cronulla, North
Head and Malabar
Wet weather overflow abatement Northern Beaches, Illawarra and Southern
catchments completed
Stormwater drainage services
Stormwater renewals 3.5 km
Including Birds Gully (770 metres)
Stormwater condition assessment 91.76 km
Source: Atkins/Cardno, Final Report – Detailed Review of Sydney Water’s Operating and Capital Expenditure, November 2011, p 67 and IPART analysis.

B Sydney Water’s output measures and capital expenditure program
Review of prices for Sydney Water Corporation’s water, sewerage, stormwater drainage and other servicesIPART 195
Table B.4 Sydney Water’s capital expenditure program ($2011/12, $million)
Description 2012/13 2013/14 2014/15 2015/16 Total
Water
Water Flowmeter Upgrade Program 5,248 5,273 - - 10,521
Critical Water Main Renewals 2013-16 60,373 64,268 65,241 67,189 257,070
Reticulation Water Main Renewals 2013-16 60,485 61,623 61,613 61,408 245,129
Reservoir Reliability Program 15,990 14,965 13,633 13,120 57,708
Water Pumping Station Renewals Program 2013-16
13,325 11,275 7,688 6,663 38,950
Water Filtration Plant Renewals 5,053 4,223 3,137 2,962 15,375
Metro IICATS - R&R Water Remote Terminal Units
6,458 6,458 6,458 - 19,373
System Reliability 2,563 8,200 23,575 38,694 73,031
North West Growth Centre 10,127 31,365 22,263 1,025 64,780
South West Growth Centre 29,482 11,688 8,918 38,950 89,038
Developer Operations Growth Water 19,147 17,917 17,917 17,917 72,898
Infill Growth 9,738 5,330 13,735 17,733 46,535
Greenfield Growth 13,882 23,575 11,275 6,150 54,882
Water Modelling System 3,155 - - - 3,155
Sewerage
Avoid Fail Sewer Rehabilitation Program 2013-16
60,129 60,129 60,129 60,129 240,516
Dry Weather Overflow Reduction 2013-16 17,041 17,041 17,041 17,041 68,163
Cronulla Odour Management 1,128 - - - 1,128
Malabar Odour Management 2,337 - - - 2,337
Wastewater Treatment Plant Renewals Program 2013-16
29,213 29,213 29,213 29,213 116,850
Wastewater Pumping Station Renewals Program 2013-16
13,633 13,633 13,633 13,633 54,530
Saltwater Ingress Reduction 974 974 974 974 3,895
Replace SP0259 Quakers Hill 20,295 - - - 20,295
Malabar WWTP Improvement Program 5,381 14,606 23,831 - 43,819
Castle WWTP Reliability 1,948 4,869 6,816 - 13,633
NSOOS and North Head Odour and Corrosion Management
14,606 19,475 14,606 - 48,688
Odour and Corrosion Control including Chemical Dosing
4,869 6,816 16,554 - 28,239
Current Unidentified Civil Assets 3,152 3,152 1,576 - 7,880
Wet Weather Overflow Abatement 2013-16 72,570 80,463 15,375 15,375 183,783
Vaucluse Diamond Bay Strategy 1,025 3,690 14,606 29,366 48,688
North West Growth Centre 17,246 21,013 41,174 42,025 121,457
South West Growth Centre 1,743 7,380 13,325 7,688 30,135

B Sydney Water’s output measures and capital expenditure program
196 IPART Review of prices for Sydney Water Corporation’s water, sewerage, stormwater drainage and other services
Description 2012/13 2013/14 2014/15 2015/16 Total
Developer Operations Growth Wastewater 28,721 26,876 26,876 26,876 109,347
Infill Growth 11,378 8,405 17,118 29,725 66,625
Greenfield Growth 27,983 34,030 24,908 5,945 92,865
Freemans Reach, Glossodia and Wilberforce Sewerage Scheme
1,538 - - - 1,538
Hawkesbury Heights Yellow Rock Sewerage Scheme
615 - - - 615
Londonderry Agnes Banks Sewerage Scheme
308 - - - 308
Appin Sewerage Scheme 16,593 10,250 - - 26,843
Future Priority Sewerage Schemes 52,678 60,938 48,377 23,780 185,774
Drainage
Stormwater drainage Renewals 8,329 9,747 5,125 3,588 26,788
Corporate
Treatment Plant Office Upgrade 11,101 9,738 7,693 - 28,531
IT - Access Replacement 488 952 3,714 13,136 18,290
Meter Investment Program 11,749 11,312 10,181 9,781 43,023

C Weighted average cost of capital
Review of prices for Sydney Water Corporation’s water, sewerage, stormwater drainage and other servicesIPART 197
C Weighted average cost of capital
Determining the allowance for a return on assets to be included in Sydney Water’s notional revenue requirements is an important step in our review. We have decided to use a post-tax real weighted average cost of capital (WACC), consistent with our new approach to incorporating company tax in our decisions.178
The WACC for a regulated business is the expected cost of its various classes of capital (debt and equity) over the determination, weighted to take into account the relative share in its capital structure. To determine this cost for Sydney Water, we used our usual approach for price setting purposes. This approach involves 2 steps:
1. Estimating the possible range for the WACC, by calculating values for each of the parameters that influence the cost of debt and the cost of equity in the regulated business.
2. Making a judgement on the appropriate point estimate for the regulated business’ WACC within this range.
The assumptions and parameters used in estimating the WACC are consistent with those used in commercial corporate valuation.
We then calculated the return on assets by multiplying the regulated asset base by this point estimate WACC value.
A post-tax real WACC more accurately estimates the tax liability for a similar well-managed, privately-owned business. Instead of accounting for company tax through the rate of return, tax is estimated as a separate cost building block.
In our draft decision, we calculated a post-tax real WACC of 5.5%, which was based on market conditions as at 9 January 2012. We have updated the market-based parameters for the final decision to reflect market conditions as at 16 April 2012 and have decided that the rate of return for the final decision is 5.6%. We came to this position after considering Sydney Water’s original proposal and subsequent submissions, the views of stakeholders, the views of finance experts and our own analysis. We considered that this rate of return is consistent with prices that reflect efficient costs and does not include monopoly rents.
178 IPART, The incorporation of company tax in pricing determinations, December 2011.

C Weighted average cost of capital
198 IPART Review of prices for Sydney Water Corporation’s water, sewerage, stormwater drainage and other services
C.1 Summary of our decision
We estimated an appropriate range for the industry WACC of between 4.0% and 5.6% with a midpoint of 4.6%. Due to current market uncertainty and historically low parameter estimates we decided an appropriate point estimate for the WACC is the upper bound of our range, 5.6%. Table C.1 below sets out the parameters used in the draft and final decisions.
Table C.1 Rate of return range and parameters
WACC parameters Draft decision Final decision
Nominal risk free rate 3.3% 3.6%
Inflation adjustment 2.6% 2.8%
Market risk premium 5.5% to 6.5% 5.5% to 6.5%
Debt margin 3.5% to 4.8% 3.3% to 4.8%
Debt to total assets 60% 60%
Gamma 0.25 0.25
Equity beta 0.6 to 0.8 0.6 to 0.8
Cost of equity 6.6% to 8.5% 6.9% to 8.8%
Cost of debt 6.8% to 8.1% 6.9% to 8.4%
WACC range (pre-tax real)a 4.7% to 6.5% 4.8% to 6.6%
WACC midpointb (pre-tax real)a 5.5% 5.5%
WACC range (post-tax real) 4.0% to 5.5% 4.0% to 5.6%
WACC midpointb (post- real tax) 4.6% 4.6%
WACC point estimate (post-tax real) 5.5% 5.6% a These estimates are not used by IPART; they are included for comparison to Sydney Water’s submission and our previous decisions. b The midpoint WACC is calculated using the midpoint of the MRP and equity beta range, and the median of the debt margin observations.
The risk free rate has been affected by market volatility and prolonged weak market conditions. The change in these factors has potentially created a disparity between the risk free rate (for which we use short-term average data) and the market risk premium (for which we use long-term average data). In the current market circumstances, there is some evidence to support the view that expectations for the market risk premium have risen as bond yields have fallen. However, it is difficult to measure these short-term variations in expectations for the market risk premium.
To guide our decision making on the point estimate for the WACC we estimated the long-term averages of the risk free rate, debt margin, inflation adjustment and the market risk premium. We found that using these long-term averages, the WACC would have a midpoint of 5.6%. This midpoint is 100 basis points higher than the midpoint of the range we estimated for the WACC.
C Weighted average cost of capital
Review of prices for Sydney Water Corporation’s water, sewerage, stormwater drainage and other servicesIPART 199
In light of this, we consider it appropriate to use the upper bound of our WACC range, 5.6%, in setting prices for Sydney Water for the next 4 years. We consider that this WACC addresses the higher level of market uncertainty at this time, and stakeholders’ concerns in relation to the way that market parameters are estimated.
Our draft decision sought feedback from stakeholders on our proposal to adopt a range for the debt margin. Our final decision maintains the proposed method of using a range to determine the debt margin, instead of a point estimate.
The rest of this appendix provides an overview of our past WACC decisions considers the issues raised by stakeholders in response to our draft decision and provides our decision for each of the WACC parameters for the final decision.
C.2 Our past WACC decisions
Table C.2 shows the final parameters we adopted in the 2012 Sydney Desalination Plant (SDP), 2010 State Water, 2009 Hunter Water and 2008 Sydney Water determinations. The final decision for Sydney Water is shown for comparison.

C Weighted average cost of capital
200 IPART Review of prices for Sydney Water Corporation’s water, sewerage, stormwater drainage and other services
Table C.2 Rate of return parameters – final decision compared to IPART’s past decisions
Final Decision
2012 SDPb
2010 State Waterb
2009 Hunter Waterb
2008 Sydney Waterb
Nominal risk free ratea
3.6% 3.9% 5.8% 4.6% 6.1%
Inflation adjustmenta 2.8% 2.6% 3.0% 2.5% 3.6%
Market risk premium 5.5% to 6.5% 5.5% to 6.5% 5.5% to 6.5% 5.5% to 6.5% 5.5% to 6.5%
Debt margina 3.3% to 4.8% 3.5% 1.8% to 3.8% 2.7% to 3.5% 3.1% to 3.7%
Debt to total assets 60% 60% 60% 60% 60%
Gamma 0.25 0 to 0.5 0.3 to 0.5 0.3 to 0.5 0.3 to 0.5
Tax rate 30% 30% 30% 30% 30%
Equity beta 0.6 to 0.8 0.6 to 0.8 0.8 to 1.0 0.8 to 1.0 0.8 to 1.0
Cost of equity 6.9% to 8.8% 7.1% to 9.1% 10.2% to 12.3%
9.0% to 11.1%
10.6% to 12.6%
Cost of debt 6.9% to 8.4% 7.4% 7.6% to 9.6% 7.3% to 8.1% 9.3% to 9.8%
WACC range (pre-tax real)
4.8% to 6.6% 5.1% to 6.9% 6.2% to 8.7% 6.0% to 7.8% 6.8% to 8.4%
WACC (pre-tax real) point estimate
6.6% 6.7% 7.4% 6.5% 7.5%
WACC range (post-tax real)
4.0% to 5.6% 4.6% to 5.3% 5.5% to 7.4% 5.3% to 6.6% 5.9% to 7.1%
WACC point estimate (post-tax real)
5.6% 5.3% 6.4% 5.7% 6.5%
a These parameters reflect market data at the time of the decision.
b These reviews did not use a post-tax real WACC estimate. The pre-tax WACC has been converted into a post-tax real WACC as a guide only.
Table C.2 shows the variation in our parameter and WACC estimates over time. The differences between the WACC decisions are due to:
changes in market conditions that affect the market-based parameters, ie, the risk free rate, the inflation adjustment and the debt margin
our change in the approach to estimating the debt margin which has resulted from changes in market conditions
new evidence on the valuation of gamma and equity beta
our change to a post-tax WACC.
We value a consistent approach to estimating the cost of capital over time to minimise regulatory risk and its associated costs. We have made changes to the gamma and the equity beta after assessing the available evidence and analysing the impacts on Sydney Water and customers.

C Weighted average cost of capital
Review of prices for Sydney Water Corporation’s water, sewerage, stormwater drainage and other servicesIPART 201
C.3 Our analysis of WACC parameters
C.3.1 Market-based parameters
We have maintained the approach of the draft decision to estimate market-based parameters – ie, the risk free rate, inflation adjustment and the debt margin – using 20-day averages of market data, and assuming a 5-year term to maturity. We have reviewed these 2 issues extensively in separate reviews and do not consider that there is compelling evidence to change our approach.
Stakeholder’s comments
Sydney Water, TCorp and Professor of Infrastructure Economics Henry Ergas support the use of a 10-year term assumption when estimating the market-based parameters. Sydney Water and TCorp also propose that long term averages should be adopted.
Sydney Water notes that the draft decision was made at a time when the risk free rate is lower than long-term averages. It submits that the draft decision’s risk free rate of 3.3% does not represent the likely future risk free rate. It notes that it is bound by the fixed interest rate on long-term debt acquired in past years, and the recent reductions in the risk free rate do not provide relief from interest payments on more expensive debt acquired previously. Sydney Water proposes a 10-year term to maturity assumption and a 10-year averaging period to address the shortfall between the actual and notional cost of debt.179
It considers that selecting a point estimate WACC at the top of the range partially addresses this impact, however there is still a difference between the actual and notional cost of debt.180
Similar to Sydney Water, TCorp supports the use of a 10-year term to maturity assumption and a 10-year averaging period for the market-based parameters. TCorp submits that the recent falls in the risk free rate “highlight the difficulties in estimating debt costs from 20-day averages and 5-year market parameters. A more robust, transparent, market-based and internally consistent alternative would calculate debt costs from 10-year averages and 10-year parameters”.181
179 Sydney Water submission, 13 April 2012, p 13. 180 Ibid, p 12. 181 TCorp, Submission for Sydney Water Final Determination, 24 January 2012, p 1.

C Weighted average cost of capital
202 IPART Review of prices for Sydney Water Corporation’s water, sewerage, stormwater drainage and other services
TCorp submits that it provides debt funding for 9 utilities in New South Wales. It considers that long debt life is important to maintain NSW’s AAA credit rating and is consistent with the longer-term economic life of regulated assets. It submits that the average term of debt at the time of issue over the last 4 years was 9.8 years, and the longest maturity date was 2039.182 It considers that a 5-year term to maturity assumption and a 20-day sampling period introduces a range of risks and assumes that TCorp refinance $24 billion worth of regulated debt every 5 years, over 20 days.183
TCorp has submitted that our approach implies a real risk free rate of 70 basis points. It considers that breakeven inflation rates are not comparable to inflation swap rates. It proposes to replace our approach of using swap market data to forecast the inflation rate with the midpoint of the Reserve Bank’s inflation target, which is 2.5%.184
Professor Ergas submits that the no arbitrage requirement implies that the apparent difference between using 5 and 10-year terms to maturity reflect unmeasured costs of refinancing. Since longer maturities take account of those unmeasured costs, they should be used in preference to instruments with shorter terms to maturity.185
He also considers that treating the regulatory cycle as the effective life of the assets is at odds with the general approach of using a private sector benchmark to set the WACC. He submits that IPART’s approach is a ‘mix and match’ approach as private sector benchmarks are used to set some aspects of the WACC (such as beta) and alternative approaches that recognise the regulated nature of the business are used for other aspects.
Assessment
We made a determination on whether a 5 or a 10-year term should be assumed in April 2011.186 Our decision placed more weight on the view that the real utility asset is a stream of cash flows which resets at the start of each regulatory period. Hence NPV neutrality is achieved by matching debt maturity with regulatory periods.
Similarly, we reviewed whether we should adopt a longer sampling period in April 2010.187 After evaluating different sampling periods up to 4 years, we decided to retain the use of a 20-day sampling period. This decision recognised that current market rates are the best indicator of future rates.
182 Ibid, p 2. 183 Ibid, p 3. 184 TCorp, Response to Sydney Water and Sydney Catchment Draft Determinations, 17 April 2012,
p 3. 185 Ergas, H., submission on IPART’s draft determination in respect of Sydney Water, 19 April
2012, p 1. 186 IPART, Developing the approach to estimating the debt margin – Final Decision, April 2011. 187 IPART, Averaging the WACC parameters for the cost of capital – Final Decision, April 2010.

C Weighted average cost of capital
Review of prices for Sydney Water Corporation’s water, sewerage, stormwater drainage and other servicesIPART 203
While we have maintained the use of the 5year term and 20-day averaging period, we also recognise that there is a disparity between current market rates and long-term averages. There may also be an inconsistency between using short-term data for the market-based parameters and using long-term data for the MRP and the equity beta.
As was the case in the draft decision, the short-term average of the risk free rate remains below the long term average (see Figure C.1). While the long term average of the risk free rate is 5.4%, the short-term average is currently 3.6%.
On the other hand, the current debt margin is significantly higher than the long-term average. A higher debt margin has the effect of increasing the WACC. Figure C.2 shows the 7-year BBB fair value curve over the last decade.188 It can be seen that there was a permanent repricing of BBB rated debt coinciding with the GFC. Yields rose significantly in 2008 and have not returned to pre-GST levels.
Figure C.1 Trends in the nominal risk-free rate
Data source: Bloomberg.
188 The 7-year BBB fair value curve is only one of the securities in our sample. It does however
provide an indication of the yield on BBB rated corporate debt over the last decade.

C Weighted average cost of capital
204 IPART Review of prices for Sydney Water Corporation’s water, sewerage, stormwater drainage and other services
Figure C.2 Trends in the debt margin
Data source: Bloomberg.
We have calculated the WACC using both a long-term to maturity assumption and a long sampling period, shown in Table C.3. The difference between a 5 and a 10-year term to maturity assumption is minimal. Using longer-term averages increases the resulting WACC range significantly. We have taken account of the disparity between long and short-term market parameters by selecting a point estimate for the WACC which is closer to the WACC calculated using long-term averages.
Table C.3 Rate of return using longer terms to maturity and sampling periods
Final decision Long term to maturity Long term to maturity and sampling period
Nominal risk free rate 3.6% 4.1% 5.4%
Inflation adjustment 2.8% 3.0% 2.5%
Debt margin 3.3% to 4.8% 2.8% to 4.6% 2.0%
Market risk premium 5.5% to 6.5% 5.5% to 6.5% 5.5% to 6.5%
Gearing 60% 60% 60%
Gamma 0.25 0.25 0.25
Tax rate 30% 30% 30%
Equity beta 0.6 to 0.8 0.6 to 0.8 0.6 to 0.8
WACC range (post-tax real)
4.0% to 5.6% 4.0% to 5.7% 5.3% to 6.0%
WACC midpoint (post-tax real)
4.6% 4.7% 5.6%
Source: IPART analysis.

C Weighted average cost of capital
Review of prices for Sydney Water Corporation’s water, sewerage, stormwater drainage and other servicesIPART 205
We remain of the view that current market rates provide the best indication of future rates as efficient market theory suggests that current market prices account for all available information relevant to future prices. But there is a case for using the upper bound of the range in this case. This is because, as shown in Table C.3, the midpoint of the WACC calculated using short-term averages of market data is significantly below the WACC based on long-term data averages. Similarly, when rates are significantly higher than long-term averages, we may determine that a point estimate below the midpoint of the range is appropriate.
Professor Ergas’ submission has highlighted that there is no consensus among finance experts on whether a 5 or a 10-year term is appropriate for regulated assets as there are theoretical arguments both for and against a term of 5 years. The approach to setting the WACC in the Australian regulatory context contains a number of ‘mix and match’ approaches, as noted by Professor Ergas. For example, regulators typically use long term averages of market data for some parameters (such as the MRP and equity beta) and short-term averages for others (such as the market-based parameters). Also, some parameters provide forward looking estimates, while others provide historical estimates.
TCorp has submitted that our approach implies a real risk free rate of 70 basis points. Our WACC calculation does not use a real risk free rate. It considers that breakeven inflation rates are not comparable to inflation swap rates. It proposes to replace our approach of using swap market data to forecast the inflation rate with the midpoint of the Reserve Bank’s inflation target, which is 2.5%.189
We discontinued using the real risk free rate in 2009 after significant problems in the data emerged.190 We now use swap market data to estimate the inflation adjustment. We cross check our inflation adjustment against economists’ forecasts. However we acknowledge that current nominal risk free rates imply very low real risk free rates using the inflation swap data and economist’ forecasts. This has been addressed by our use of the upper bound of the range of WACC values.
C.3.2 Nominal risk free rate
The risk free rate is used as a point of reference in determining both the return on equity and the cost of debt within the WACC. In both the CAPM and the cost of debt calculation, the risk free rate is the base to which a premium or margin is added to reflect the riskiness of the specific business for which the rate of return is being derived.
189 TCorp, Response to Sydney Water and Sydney Catchment Authority Draft Determinations,
17 April 2012, p 3. 190 IPART, Adjusting for expected inflation in deriving the cost of capital - Final Decision, May 2009.

C Weighted average cost of capital
206 IPART Review of prices for Sydney Water Corporation’s water, sewerage, stormwater drainage and other services
We have estimated the risk free rate from the 20-day average of the yield on nominal Commonwealth Government bonds with a 5-year term. As noted above, this approach results in decisions that best reflect prevailing market rates and predict future rates. It also ensures the regulatory environment created by our WACC decisions is as predictable and transparent as possible.
Our decision to set the point estimate for Sydney Water at the upper bound of the WACC range addresses concerns that the 5-year bond yield is at historical lows and the current difference between the 5-year and 10-year bond yields is much larger than the historical average.
C.3.3 Inflation adjustment
The inflation adjustment is used to convert nominal parameters into real parameters. We estimate forward inflation using data from the zero-coupon inflation-linked swap market. TCorp proposed the mid-point of the Reserve Bank’s targeted inflation band.
We consider that relying on swap market data has several advantages over other approaches. Our primary reason for using swap market data is that it is based on market observations and is therefore objective, repeatable and transparent. As noted above, we cross-check our results against economists’ forecasts.
C.3.4 Debt margin
The debt margin represents the cost of debt that a company has to pay above the nominal risk free rate. The debt margin is related to current market interest rates on corporate bonds, the maturity to debt, the capital structure and the credit rating. Our current approach is to calculate a debt margin that represents the margin over the risk free rate for BBB/BBB+ rated corporate debt. We determine the debt margin from a sample of securities, including the Bloomberg 7-year fair value curve and corporate bonds issued by Australian companies in AUD and USD. We then add 20 basis points for debt raising costs.
A number of stakeholders suggested using a 10-year term to maturity and a long term averaging period to set the debt margin. We have discussed the term to maturity above in Section C.3.1.

C Weighted average cost of capital
Review of prices for Sydney Water Corporation’s water, sewerage, stormwater drainage and other servicesIPART 207
Our draft decision noted that the range in bond yields in our sample of securities had widened significantly between May 2011 and January 2012. There were also a number of newly-issued bonds which increased the number of observations. For these reasons we proposed in our draft report to change the way we express the debt margin from a point estimate to a range. We considered that a range better took into account current market uncertainties than a point estimate and was more appropriate with a larger sample. We indicated a preference for the interquartile range approach. The interquartile range approach defines the upper bound using the top quartile, or top 25% of values in a set of data. Similarly, the lower bound of the range is defined by the lower quartile, or the bottom 25%. We then used the median as the midpoint of the range.
Figure C.3 shows the range of yields on all bonds in our sample of securities and the median, excluding debt raising costs. These are shown for April 2011, in January 2012 (this is when market data was sampled for our draft decision) and in April 2012 (this is when market data was sampled for our final decision). It can be seen from Figure C.3 that there remains a degree of uncertainty in the debt market. There are also a larger number of securities in the current market to serve as proxies for the debt margin. The current sample contains the Bloomberg BBB 7-year fair value curve, 13 Australian-issued bonds and 12 bonds issued by Australian companies in USD.
We have therefore decided to retain the use of the interquartile range approach described in our draft decision. The resulting debt margin range, including 20 basis points for debt raising costs, is 3.3% to 4.8%.
Figure C.3 Debt margin total range and median
May 2011 Jan 2012 April 2012
Data source: Bloomberg.
0.0%
1.0%
2.0%
3.0%
4.0%
5.0%
6.0%
7.0%
8.0%
C Weighted average cost of capital
208 IPART Review of prices for Sydney Water Corporation’s water, sewerage, stormwater drainage and other services
C.3.5 Equity beta
The equity beta is a business-specific parameter that measures the extent to which the return of a particular security varies in line with the overall return of the market. It represents the systematic or market-wide risk of a security that cannot be avoided by holding it as part of a diversified portfolio. It is important to note that the equity beta does not take into account business-specific or diversifiable risks.
In estimating the equity beta for this review, we considered the views expressed by Sydney Water and other stakeholders, and the advice of our consultants from the SDP review, Strategic Finance Group (SFG)191 and Professor Ken Davis.192 While the 2008 Sydney Water review used an equity beta of 0.8 to 1.0, we have obtained new evidence on the value of beta for water utilities from SFG, Professor Kevin Davis and our own research. This evidence supports an equity beta for the water utility industry of 0.6 to 0.8.
Our valuation for the equity beta was also used for the SDP. Sydney Water submits that it faces substantially higher risks than SDP because:
it has a diverse customer base, product and asset portfolio
its water usage charges are based on long-run marginal costs
its assets are aging
we have imposed reductions in capital and operating expenditure.193
We note that the 4 risks submitted by Sydney Water are of a diversifiable (non-systematic) nature and are therefore not relevant to a consideration of equity beta. We consider diversifiable risks to be better addressed through cash flow adjustments.
Our draft decision clearly delineated between systematic and non-systematic risk. We noted in our draft decision:
It is not consistent with our pricing methodology to consider diversifiable risks in the WACC; we consider diversifiable risks to be better addressed through cash flow adjustments.194
Sydney Water states that the draft decision notes that non-systematic risks should be excluded from a consideration of the equity beta but ‘appears to use the assumed reduction of (business-specific) demand risk as an argument to support reduction of the equity beta.195
191 SFG, Cost of capital parameters for Sydney Desalination Plant, August 2011. 192 Davis, K., Cost of capital parameters for Sydney Desalination Plant: By SFG Consulting - An initial
review for IPART, August 2011. 193 Sydney Water submission, 13 April 2012, p 12. 194 IPART, Review of prices for Sydney Water Corporation’s water, sewerage, drainage and other services –
Draft decision, March 2012, p 185. 195 Sydney Water submission, 13 April 2012, p 12.

C Weighted average cost of capital
Review of prices for Sydney Water Corporation’s water, sewerage, stormwater drainage and other servicesIPART 209
Sydney Water submits that Ofwat set a higher equity beta in its 2009 decision for UK water utilities. It contends that we have not presented any compelling evidence that Sydney Water has a lower level of systematic risk.196 We note that Ofwat’s previous determination was made in 2009 in the context of the GFC. Ofwat valued equity beta at 0.9, which it noted was at the ‘high end’ of observations but reflects the fact that the price determination is occurring at a time of market uncertainty.197 We have incorporated this market uncertainty more directly by having regard to the longer-term averages. It would be duplicative to do both. We prefer to ascribe the best estimate to each parameter, through either a point estimate or a range of values. We typically take account of market factors in choosing a WACC estimate in the range, rather than including premiums at the parameter level.
We do not consider that Sydney Water has presented a compelling argument to depart from the advice of our consultants, SFG and Professor Davis. SFG’s report empirically estimated beta for proxy water utilities in Great Britain and the United States. The empirical estimates suggested that the water utility industry beta has a mean of 0.52 to 0.55. SFG preferred to consider a downmarket beta, this is only calculated when the market’s returns are lower than the risk free rate, which has a mean of 0.61 to 0.69.198 Professor Davis’s peer review of the SFG advice concluded that the beta estimates were robust, although he recommended that we do not use the downmarket beta.199 We have discussed the principle of exclusion of diversifiable risk further in the SDP report.200
Our decision is to use a beta estimate of 0.6 to 0.8. We consider that this is the most appropriate range, given the information provided by Sydney Water and their consultants and from our consultants and our own research.
C.3.6 Market risk premium
The market risk premium (MRP) is the additional return over the risk free rate of return that an investor requires for the risk of investing in a diversified equity portfolio. Our current approach is to estimate the MRP based on the long-term historical arithmetic average market returns over the risk free rate. For this and other recent determinations, this approach values the MRP within the range of 5.5% to 6.5%.
196 Ibid, p 13. 197 Ofwat, Future water and sewerage charges 2010-15: final determinations, November 2009, p 128. 198 Strategic Finance Group, Cost of capital parameters for Sydney Desalination Plant, August 2011, p 5. 199 Davis, K., Cost of capital parameters by Sydney Desalination Plant: by SFG Consulting, An initial
review for IPART, August 2011, pp 4-5. 200 IPART, Review of water prices for Sydney Desalination Plant Pty Ltd, December 2011.

C Weighted average cost of capital
210 IPART Review of prices for Sydney Water Corporation’s water, sewerage, stormwater drainage and other services
We note that there may be an inconsistency between using short-term data for the market-based parameters and using long-term data for the MRP and the equity beta. In particular, there may be an inversely proportional relationship between the MRP and the risk free rate. In periods of high investor risk aversion, there is a flight from risky assets to safe assets. This tends to push up the price and push down the yields on safe assets. For this reason, falling risk free rates tend to be associated with rising investor risk premiums (and vice versa).
As the size of any adjustment is not clear, we have used our best estimates for each parameter, and have made a judgement when selecting the point estimate within the range. Research has shown that most Australian investment practitioners have continued to use a market risk premium of 6% since the credit crisis of 2008.201 Other regulators in Australia also commonly use 6%. The AER recently reduced its valuation of the MRP from 6.5% to 6%.
Sydney Water submits that instead of using long-term historical averages, the approach to estimating the MRP should account for changes in market conditions. It estimates that changing from long-term averages to an approach that accounts for current market conditions would result in an MRP in the range of 6.5% to 7.0%.202 This request is at odds with its view that the market-based parameters should be based on long-term averages. We have consistently adopted a long-term MRP over time. This contributes to consistent regulatory outcomes that benefit both regulated utilities and customers.
Consistent with our past decisions, we decided to use an MRP estimate of 5.5% to 6.5% to calculate the range for the WACC. This helps maintain a consistent regulatory environment. We have addressed the potential problem of combining a long-term average for the MRP and a short-term average for the risk free rate by having regard to the long term averages for both in choosing a WACC at the top end of the current range.
C.3.7 Gearing
The gearing ratio is the ratio of debt to total assets in the business’s capital structure. In determining this ratio, our current practice is to adopt a benchmark capital structure (rather than the actual financial structure of the regulated entity) to ensure that customers will not bear the costs associated with an inefficient financial structure. This is consistent with regulatory practice in Australia.
We do not consider that there is any new evidence to depart from our benchmark assumption of a 60% gearing ratio for water utilities.
201 Value Adviser Associates, IER – a conservative and consistent approach to WACC estimation by
valuers, August 2009, pp 9-11. 202 Sydney Water submission, 13 April 2012, p 14.

C Weighted average cost of capital
Review of prices for Sydney Water Corporation’s water, sewerage, stormwater drainage and other servicesIPART 211
C.3.8 Dividend imputation credits (gamma)
Gamma is the dividend imputation factor. Under the Australian dividend imputation system, investors receive a tax credit (franking credit) for the company tax paid before the dividend. This recognises the fact that companies already paid tax on profits from which the dividends are paid. Since July 2000, imputation credits in excess of personal tax liabilities have been available as a cash rebate. International investors cannot utilise imputation credits.
The value of imputation credits is represented in the CAPM by ‘gamma’ (γ). The rationale for including the value of gamma in the CAPM is that investors are receiving a lower return than if there were no tax credits attached to this investment.
We have recently completed a review of the gamma and have concluded that gamma should be valued at 0.25.203
C.3.9 Internal consistency of the WACC
TCorp noted that the draft decision WACC yielded a higher cost of debt than the cost of equity at the lower bound of values.204 We agree that for internal consistency, the return required by equity holders must be at least equal to the return required by debt holders in the same firm.
Under the final decision’s WACC point estimate of 5.6%, the cost of equity is 8.8%, which is higher than the cost of debt 8.4%.
C.4 Our decisions on a pre-tax WACC basis
This section shows our decision, which use a separate tax allowance and a post-tax real WACC, on the basis of our former pre-tax WACC approach. Our decision uses a post-tax real WACC of 5.6% and using the same parameters we estimate a pre-tax WACC of 6.6%.
Table C.4 shows our calculation of Sydney Water’s notional revenue requirement using a pre-tax WACC of 6.6% compared to our draft decision using a post-tax WACC of 5.6% and a tax allowance.
203 IPART, Review of imputation credits (gamma) – Final Decision, March 2012, p 1. 204 TCorp, Response to Sydney Water and Sydney Catchment Draft Determinations, 17 April 2012,
p 4.

C Weighted average cost of capital
212 IPART Review of prices for Sydney Water Corporation’s water, sewerage, stormwater drainage and other services
Table C.4 Tax implied in pre-tax real WACC and tax allowance approach ($m, $ 2011/12)
2011/12 2012/13 2013/14 2014/15 2015/16 Total
Notional revenue: pre-tax real WACC
2,354.5 2,390.0 2,424.6 2,449.9 9,619
Notional revenue: post-tax real WACC and separate tax allowance
2,258.3 2,294.6 2,332.4 2,358.5 9,244
Difference in notional revenue
-96.2 -95.4 -92.2 -91.4 -375.0
The new approach results in a reduction in notional revenue of $375 million, which reflects the different treatment of tax under the 2 approaches.
Table C.5 shows how each building block is affected by our new approach to tax. The $96.2 million reduction in the notional revenue requirement in 2012/13 is due to a decrease in the return on assets of $125.5 million partially offset by our $30.3 million estimate of Sydney Water’s tax allowance.
Table C.5 Rate of return under a pre-tax and post-tax WACC framework
2012/13 2012/13
Pre-tax 6.6% Post-tax 5.6% Difference
Return on assets 851 725 -125
Return on working capital 8 6 -2
Tax allowance 0 30 30
Total 859 761 98

D Calculating the tax allowance
Review of prices for Sydney Water Corporation’s water, sewerage, stormwater drainage and other servicesIPART 213
D Calculating the tax allowance
In December 2011, after consultation, we decided to calculate a more accurate and commercially based tax allowance as a discrete building block, and to use a post-tax WACC.205 The tax allowance is intended to more accurately reflect the tax liability for a comparable commercial business. Our previous approach used a pre-tax WACC with an assumed statutory tax rate. In most cases, this overstated the tax that would be paid by a comparable commercial business.
The 2012 Determinations for Sydney Water and SCA’s prices are the first time we have implemented our changed approach to tax. Sydney Water’s submission was on a real pre-tax basis as it was made before we changed our tax policy. This Appendix outlines our calculation of Sydney Water’s tax allowance. The methodology and parameters we used to calculate Sydney Water’s tax allowance (shown in Table D1 below) were reviewed by NERA consulting in April 2012. NERA found that the methodology is appropriate and was correctly applied.206
Sydney Water’s tax allowance for the 2012 Determination is presented in Table D.1. It is calculated by applying a 30% statutory corporate tax rate adjusted for gamma207 to Sydney Water’s nominal taxable income.208 We deduct Sydney Water’s operating cost allowance, tax depreciation, and interest expenses from Sydney Water’s notional revenue requirement (excluding tax) to calculate taxable income.
We have accepted Sydney Water’s forecasts of tax depreciation over the 2012 period, based on Sydney Water’s existing financial modelling (and adjusted to remove unregulated activities). This differs to the regulatory depreciation allowance that we include in Sydney Water’s building block and notional revenue.
205 IPART, The incorporation of company tax in pricing determinations – Final Decision, December 2011. 206 Letter, Expert Review of the Tribunal’s Approach to Modelling the Return to Sydney Water, NERA
Consulting, 17 April 2012. 207 Under a post-tax framework, the value of franking credits (gamma) enters the regulatory
decision only through the estimate of the tax liability. 208 Expected tax losses start from a zero base as we disregard accumulated losses prior to the
transition. Actual tax losses will not be factored into regulatory determinations.

D Calculating the tax allowance
214 IPART Review of prices for Sydney Water Corporation’s water, sewerage, stormwater drainage and other services
We calculate Sydney Water’s interest expenses using the same parameters used for the WACC (Table C.1):
a 60% notional gearing ratio (ie, Borrowings = 0.6 x regulatory asset base)
a nominal risk free rate of 3.6%
a debt margin of 4.8%.
The interest rate (cost of debt) is applied to the average of Sydney Water’s opening and closing RAB in each year. In this 2012 Determination, the amount allowed for tax is lower than the amount Sydney Water expects to pay, primarily because Sydney Water’s actual gearing and interest expense is lower than the benchmarks used for the WACC.
Table D.1 Final decision on Sydney Water’s tax allowance ($million, nominal)
2012/13 2013/14 2014/15 2015/16
Notional Revenuea 2,264 2,353 2,444 2,530
Cash and in-kind contributions 95 97 99 102
Operating costs 1,304 1,329 1,356 1,382
Tax depreciation 270 275 272 277
Interest expense 678 719 760 797
Taxable income 106 127 157 176
Accumulated tax losses 0 0 0 0
Taxable income after tax losses 106 127 157 176
Regulatory tax allowance (adj. for gamma) 30.8 36.9 45.5 51.0 a Revenue excludes tax allowance.
Note: Totals may vary due to rounding.
E Long Run Marginal Cost of Water
Review of prices for Sydney Water Corporation’s water, sewerage, stormwater drainage and other servicesIPART 215
E Long Run Marginal Cost of Water
In past reviews, IPART has set water usage charges with reference to long-run marginal cost (LRMC) calculated on an average incremental cost (AIC) basis.
Sydney Water has estimated LRMC. These calculations are discussed below. We have also calculated LRMC. Our calculations are outlined in section E.7.
Sydney Water’s estimates of LRMC range from $1.76 to $2.50/kL. Our estimates range from $1.82 to $2.54/kL. The mid points of these ranges are $2.13 and $2.18/kL respectively. The current (2011/12) $2.10/kL water usage price paid by all Sydney Water’s customers is slightly below the midpoint of the range.
Our decision is to set usage prices with regard to the midpoint of that range and maintain the usage charge at current levels (in real terms) for 2 reasons:
Firstly, if the water usage charge was set towards the lower end of the range this would have the effect of increasing fixed water service charges. This would exacerbate the impacts of the proposed structural changes to the fixed charges.
Secondly, we consider that there is a risk discount rates being applied to benefits may be too high. Given the calculation of LRMC is highly sensitive to the discount rate applied there is a probability that the future benefits are under-estimated. Hence the high end of the LRMC estimates may be over-inflated.
For this determination, we have increased the fixed water service charge for flats and units so that it transitions to the same level as houses. A reduction to the water usage charge would exacerbate the impact of an increased fixed charge on consumers.
As the current usage price of $2.10/kL lies close to the middle of the range we decided to maintain the usage charge in real terms. Given our view that a detailed review of discount rates would see a lower number used in the future we held the usage charge constant in real dollars to avoid a large decrease in the usage price in the future.

E Long Run Marginal Cost of Water
216 IPART Review of prices for Sydney Water Corporation’s water, sewerage, stormwater drainage and other services
E.1 Current and Proposed Water Usage Charge
In the 2008 Sydney Water price determination, we set the usage charge at the long-run marginal cost (LRMC) of the next increment of supply. This was taken to be the upgrade to 500 ML/d of the Kurnell desalination plant. The water usage price is now $2.10/kL ($2011/12).
Sydney Water proposed the water usage charges in Table E.1 for the 2012 Determination.209
Table E.1 Sydney Water proposed water usage charges ($2011/12)
2011/12 2012/13 2013/14 2014/15 2015/16
2.10 2.20 2.25 2.30 2.35
This was based on Sydney Water’s estimates of LRMC which ranged between $2.00 and $2.50. Sydney Water used the following inputs and assumptions in its calculations of LRMC:
an expansion of the Kurnell desalination plant to stage 2 is the next supply augmentation
capital cost of the expansion of the desalination plant is $1 billion
operating cost of the additional capacity of the plant is $80 million per annum
additional output of the expanded plant is 250 ML/day or 91.25 GL/year.
The usage price level has no impact on Sydney Water’s total revenue. Firstly, we determine the annual revenue requirement for water. We then use the usage price and demand forecast to determine the expected usage revenue. The fixed service charges are set to recover the residual.
Using both Sydney Water’s and our own calculations of a range for LRMC, and having regard to the midpoint of the ranges, our decision is to maintain the usage charge for water at $2.10/kL in real terms over the 2012 Determination. This will continue to send a strong usage signal to consumers about the costs of consumption, as per the National Water Initiative Pricing Principles.
209 Sydney Water submission to IPART’s Review of prices for Sydney Water Corporation’s water,
sewerage, stormwater and other services, September 2011, p 110.

E Long Run Marginal Cost of Water
Review of prices for Sydney Water Corporation’s water, sewerage, stormwater drainage and other servicesIPART 217
E.2 Analysis
Using the LRMC of the next increment of augmentation to calculate the usage price of water provides a price signal of the incremental costs of consumption. To determine LRMC, the generally accepted practice is to calculate the net present value (NPV) of the capital and operational costs of the augmentation project over its expected life, and divide this by the NPV of the benefits over the same period. The results of modelling are shown in section E.7.
Inputs and Assumptions
Inputs and assumptions that IPART made in its calculations of LRMC include:
system augmentation will not be needed until 2035
an expansion of Kurnell desalination plant to stage 2 is the next supply augmentation210
asset life equal to 30 years211
we used the capital costs identified in 2008 for the stage 2 augmentation and inflated these to $2011/12
we used the same operating costs for stage 2 of the desalination plant as stage 1, as advised by Sydney Desalination Plant Pty Ltd
LRMC calculations based on capacity utilisation of 75% and 100% maximum capacity – these capacity utilisation rates determine the benefits of the plant
discount rates of 6% and 7% real.
These inputs and assumptions are outlined in detail below. A description of the process of calculating LRMC is provided in section E.7.
E.2.1 Timing of next augmentation
This section looks at system yield, changes in system yield, consumption, and consumption growth projections to determine the timing of the next augmentation of supply.
210 This is the same augmentation used by Sydney Water in its calculation of the LRMC range. 211 This is a conservative assumption as the asset lives of many aspects of the plant will be longer
than 30 years.

E Long Run Marginal Cost of Water
218 IPART Review of prices for Sydney Water Corporation’s water, sewerage, stormwater drainage and other services
System yield criteria
The Sydney system yield is calculated using the following 3 criteria:
Security Yield - the maximum amount of water that can be extracted from the system without the dams approaching emptiness more than 0.001% of the time (1-year in 100,000 years).212
Reliability Yield - the maximum amount of water that can be extracted from the supply system without the imposition of restrictions for more than 3% of the time on average.213
Robustness Yield - the maximum amount of water that can be extracted from the system without the imposition of restrictions for more than once in 10 years on average.
The lesser of the security, reliability and robustness yields is the system yield.
In 2010, SCA reported that the system yield for Sydney in 2011 is 620 GL pa.214 This includes the addition to the supply system of the first stage of the desalination plant.215
Factors that have affected System Yield since 2008
The 2 major items that have impacted on the system yield as calculated in 2008 are:
updated hydrological modelling by the SCA
the changed environmental flow regime.
Updated Hydrological Modelling
The hydrological modelling for the Sydney water supply system is undertaken using the WATHNET216 model. For the 2008, Determination the system yield was calculated using hydrological data up to 2004. However, the recent drought added more variability to the WATHNET model. The latest modelling conducted in 2010 includes the 2005 to 2009217 hydrology in the model coupled with refinements to the dam depletion modelling.218
212 Sydney Catchment Authority, Greater Sydney’s Sustainable Water Supply-Yield, 2010, p 3. 213 Ibid, p 3. 214 Sydney Catchment Authority, Greater Sydney’s Sustainable Water Supply-Yield, 2010, p 3. 215 2010 Metropolitan Water Plan dictates that the desalination plant be switched on at 70% and
switched off at 80% system storage levels. 216 Water Headworks Network software package. 217 The 2008 Determination used the 2006 system yield estimate that included hydrology only up
until 2004. 218 Sydney Catchment Authority, Greater Sydney’s Sustainable Water Supply-Yield, 2010, (WATHNET
Run 12 and 16).

E Long Run Marginal Cost of Water
Review of prices for Sydney Water Corporation’s water, sewerage, stormwater drainage and other servicesIPART 219
Environmental Flow Regime
The 2010 Metropolitan Water Plan introduced 80/20 environmental flow releases from metropolitan dams. This reduces the system yield by 25 GL pa.219 The Warragamba environmental flow replacement by the Western Sydney (St Mary’s) recycling plant lifts the system yield by 15 GL pa but this does not extend the time to augmentation. This is because the 15 GL forms part of the 70 GL of total recycled water capacity already factored into the calculation.
Current and Future Demand
Water demand as estimated by Sydney Water for 2010/11 is 490 GL per year. This is significantly below the usage estimated for 2008/09 at the last determination which was 519 GL.220
There are a number of factors contributing to this:
Restrictions were replaced with water-wise rules which dampened consumption bounce back.
Industrial demand for potable water has declined with some potable use being replaced with recycled water from Camellia, Kurnell and Wollongong sewerage treatment/recycling plants.
Reduced Demand by 20 GL of recycling still to come on line
There is 20 GL of targeted 70 GL of recycled water still to come online.221 This foreshadowed 20 GL pa has been deducted from demand222 when forecasting the time of the next augmentation.
Rate of Growth of Demand
We used the NSW Department of Planning and Infrastructure’s population projections223 for the Sydney Statistical District and the Illawarra statistical district which covers almost all of Sydney Water’s network. From this data we calculated the average annual population growth rate to be 1.07% pa.
219 a) Sydney Catchment Authority, Greater Sydney’s Sustainable Water Supply-Yield, 2010,
(WATHNET Run 19) b) http://www.riversymposium.com/2007_Presentations/B3B_Abood.pdf
220 IPART, Review of prices for Sydney Water Corporation’s water, sewerage, stormwater and other services, June 2008, p 84.
221 Sydney Water submission to IPART 2012 price determination, p 185. 222 It can equally be added to supply but by convention the WATHNET model treats it as a
demand reduction. 223 http://www.planning.nsw.gov.au/LinkClick.aspx?fileticket=9qUv_Q8RwkM%3d&tabid=
124&language=en-AU.

E Long Run Marginal Cost of Water
220 IPART Review of prices for Sydney Water Corporation’s water, sewerage, stormwater drainage and other services
We then applied this annual growth rate of 1.07% to current water consumption to determine when, all other things being equal, demand will exceed supply of water. The projection contains the following assumptions.
non-residential demand will increase at the same rate as residential demand
no increase in water efficiency over the next 25 years
the average number of people per dwelling will remain the same.
Demand Supply Balance
The timing of the next augmentation will be updated in the 2014 Metropolitan Water Plan. Under the 2010 Plan, modelling shows that augmentation will not be required until at least 2025.224 For the purposes of the 2012 Sydney Water price determination we have used an augmentation date of 2035. This estimate is based on lower drinking water demand by Sydney Water consumers, which delays augmentation. This is offset however by updated hydrological modelling and the introduction of environmental flow releases from metropolitan dams, which reduces the system yield.
When system yield, planned alternative sources of supply and consumption growth rates are considered, we project that, all other things being equal, demand will exceed supply in 2035.
E.3 Augmentation of Kurnell Desalination Plant to 500 ML/d capacity.
The next increment of augmentation is assumed to be an expansion of the Kurnell desalination plant capacity from 250 ML/d to 500 ML/d. This is the same augmentation upon which the LRMC calculation for the 2008 Sydney Water Review was based and has also been used by Sydney Water in 2011 for its LRMC calculation.
In its submission to the 2012 Sydney Water Price Review, the Sydney Catchment Authority commented that there need not be a single augmentation and that a range of augmentation measures was included in the 2010 Metropolitan Water Plan.225 We maintain that using the next significant augmentation establishes the upper bound of LRMC, as these other augmentations are likely to be small scale options that are cheaper than stage 2 desalination. SCA did not elaborate on the costs of these small scale options.
The augmentation option to use for LRMC, and its timing, will need to be revisited in the next determination based on the 2014 Metropolitan Water Plan.
224 NSW Government, 2010 Metropolitan Water Plan, August 2010. 225 SCA submission to Sydney Water Corporation 2011 Price Review, October 2011, p 1.

E Long Run Marginal Cost of Water
Review of prices for Sydney Water Corporation’s water, sewerage, stormwater drainage and other servicesIPART 221
E.4 Costs – Capital Expenditure
Table E.2 identifies the capital costs for stage 1 and stage 2 of the Kurnell desalination plant.226 Stage 1 is already in place and operational. It has a capacity of 250 ML per day (92 GL/pa). Stage 2 increases capacity by another 250 ML/d (92 GL/pa). The costs identified in 2008 for the stage 2 augmentation were inflated from $2007/08 to $2011/12 using the consumer price index (CPI).
Table E.2 Estimated Capital Costs for the Kurnell Desalination Plant
$2007/08 $2011/12
Stage1 Desalination Plant (250 ML/d)
Water Distribution Infrastructure 525 585
Project Development Costs 48 53
Seawater intake system 199 222
Seawater concentration outlet system 60 67
Desalination Plant 799 890
Pre-operations Payment 9 10
Pumping Station 42 47
Land Acquisition 51 57
SDP Project Development capital cost 185 206
Total Stage 1 1918 2137
Stage 2 Desalination Plant (500ML/d)
Desalination Plant 799 890
Pumping Station 42 47
SDP Project Development capital costs 185 206
Total Stage 2 1026 1143
Source: IPART, Review of prices for Sydney Water Corporation’s water, sewerage, stormwater drainage and other services, June 2008, p 218. ABS 2011(CPI numbers).
E.5 Costs - Operating Expenditure
The operating expenditure for stage 2 of the desalination plant has been modelled as being the same as the operating expenditure for stage 1 as advised in the Sydney Desalination Plant Pty Ltd submission to IPART.227 The annual operating costs are $90.2m ($2011/12). We consider this should form the upper bound of operating costs in real terms because operating expenditure is predominately made up of energy costs and it is expected that technological advances and scale improvements will see energy costs of desalination fall into the future.
226 These are the same costs that were used in the 2008 Determination. They have been updated for
inflation. 227 Sydney Desalination Plant Pty Ltd submission to IPART 2012 Pricing Determination quoted
$88.0m ($2010/11). This was inflated to $2011/12, p 12.
E Long Run Marginal Cost of Water
222 IPART Review of prices for Sydney Water Corporation’s water, sewerage, stormwater drainage and other services
E.6 Benefits – Water Generated
The desalination plant has annual production of 92GLpa when operating at full capacity. At the 2008 determination, we determined the water usage price (LRMC) by assuming the desalination plant would operate at 75% capacity.228 75% is therefore a reasonable estimate for the average capacity utilisation for stage 2. It is reasonable to assume that by the time stage 2 was constructed, Sydney would be facing a capacity constraint and stage 1 would be operating at full capacity. In this case stage 2 would then fill the role that stage 1 currently does which is a storage balancing and drought security role and therefore the same capacity utilisation assumption is justified.
E.7 Calculating Long Run Marginal Cost
Present value of costs
In order to calculate the present value of costs we have assumed that stage 2 of the desalination plant would have a life of 30 years. The capital cost of construction of stage 2 is $1,143m ($2011/12). This was discounted from 2035 to 2011/12 using a range of discount rates shown in the tables below.
The operating costs of $90.2m pa ($2011/12) were discounted for the 30 years between 2035 to 2065 back to $2011/12 by the same set of discount rates.
Present Value of Benefits
To calculate the present value of benefits we assumed the benefits to be 1 of 2 capacity utilisation ratios namely 75% and 100%. The water volumes produced under these 2 scenarios were then discounted to a PV for the same 30-year period (2035 to 2065). The benefits for each scenario have been discounted at:
1. a rate of 0%
2. a social discount rate of 3%, based on reasoning analogous to that of the Bureau of Transport and Regional Economics229
3. standard rates for the time value of money of 4%, 5.5%, 6.0%, 6.5%, 7.0% and 10% that were used for discounting costs.
228 IPART, Sydney Water Corporation’s water, sewerage, stormwater and other services, June 2008, p 219. 229 Bureau of Transport & Regional Economics (2006) Cost of Aviation Accidents and Incidents. BTRE
Report 113, p 16.
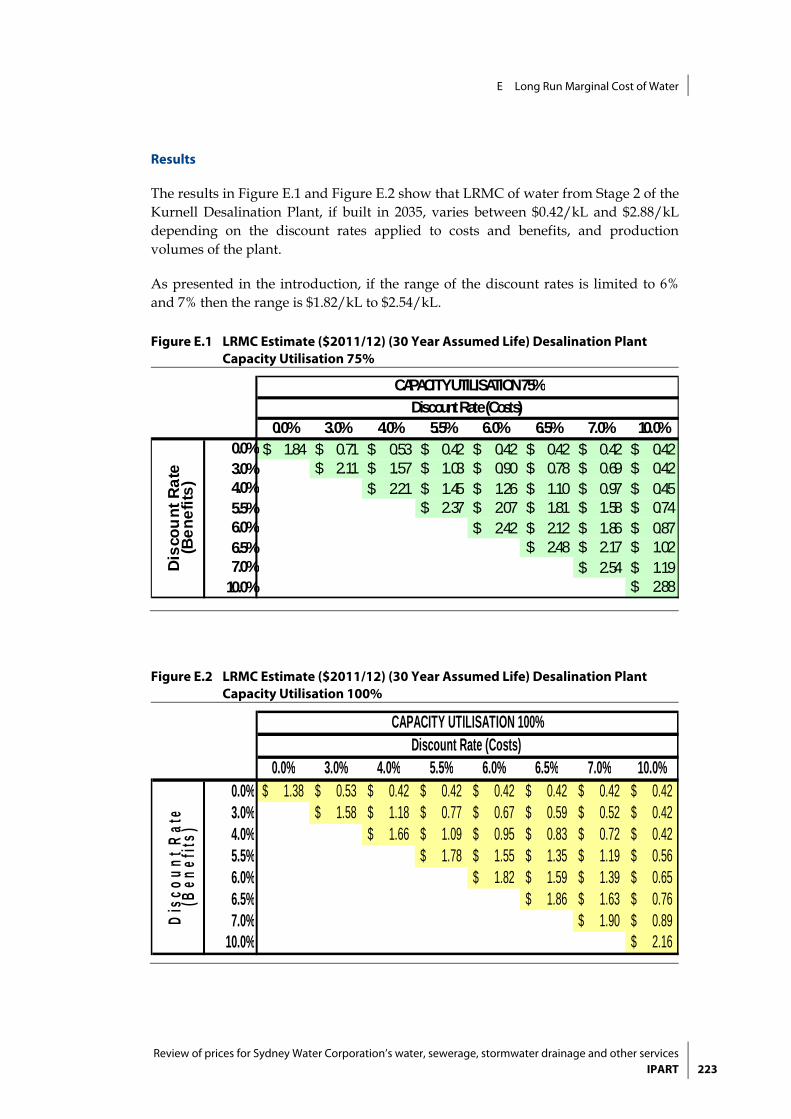
E Long Run Marginal Cost of Water
Review of prices for Sydney Water Corporation’s water, sewerage, stormwater drainage and other servicesIPART 223
Results
The results in Figure E.1 and Figure E.2 show that LRMC of water from Stage 2 of the Kurnell Desalination Plant, if built in 2035, varies between $0.42/kL and $2.88/kL depending on the discount rates applied to costs and benefits, and production volumes of the plant.
As presented in the introduction, if the range of the discount rates is limited to 6% and 7% then the range is $1.82/kL to $2.54/kL.
Figure E.1 LRMC Estimate ($2011/12) (30 Year Assumed Life) Desalination Plant Capacity Utilisation 75%
0.0% 3.0% 4.0% 5.5% 6.0% 6.5% 7.0% 10.0%0.0% 1.84$ 0.71$ 0.53$ 0.42$ 0.42$ 0.42$ 0.42$ 0.42$ 3.0% 2.11$ 1.57$ 1.03$ 0.90$ 0.78$ 0.69$ 0.42$ 4.0% 2.21$ 1.45$ 1.26$ 1.10$ 0.97$ 0.45$ 5.5% 2.37$ 2.07$ 1.81$ 1.58$ 0.74$ 6.0% 2.42$ 2.12$ 1.86$ 0.87$ 6.5% 2.48$ 2.17$ 1.02$ 7.0% 2.54$ 1.19$
10.0% 2.88$
Dis
cou
nt
Ra
te
(Be
ne
fits
)
CAPACITY UTILISATION 75%
Discount Rate (Costs)
Figure E.2 LRMC Estimate ($2011/12) (30 Year Assumed Life) Desalination Plant Capacity Utilisation 100%
0.0% 3.0% 4.0% 5.5% 6.0% 6.5% 7.0% 10.0%0.0% 1.38$ 0.53$ 0.42$ 0.42$ 0.42$ 0.42$ 0.42$ 0.42$ 3.0% 1.58$ 1.18$ 0.77$ 0.67$ 0.59$ 0.52$ 0.42$ 4.0% 1.66$ 1.09$ 0.95$ 0.83$ 0.72$ 0.42$ 5.5% 1.78$ 1.55$ 1.35$ 1.19$ 0.56$ 6.0% 1.82$ 1.59$ 1.39$ 0.65$ 6.5% 1.86$ 1.63$ 0.76$ 7.0% 1.90$ 0.89$
10.0% 2.16$
CAPACITY UTILISATION 100%Discount Rate (Costs)
Dis
cou
nt
Rat
e (B
enef
its)

E Long Run Marginal Cost of Water
224 IPART Review of prices for Sydney Water Corporation’s water, sewerage, stormwater drainage and other services
E.8 Discount Rates
In calculating a range for the long-run marginal cost of water, we examined and modelled the use of a number of different discount rates. The results of this modelling are covered in section E.7. In particular, we were interested in the appropriate rate at which to discount benefits. We will examine the appropriate approach to discounting benefits after the completion of this determination. For the purposes of determining a range for the LRMC for this determination, we have used discount rates of 6% and 7%.
Decisions:
44 IPART’s decision is to hold the water usage price constant in real terms at $2.10/kL.
45 IPART’s decision is to investigate the appropriate use of discount rates after the completion of this review in preparation for the next review.

F Water and sewerage bills and disposable income analysis for Sydney Water
Review of prices for Sydney Water Corporation’s water, sewerage, stormwater drainage and other servicesIPART 225
F Water and sewerage bills and disposable income analysis for Sydney Water
Using IPART’s survey of households in 2010, we have analysed Sydney Water’s water and sewerage bills and household disposable income.230 We have further analysed the low income households231 and households that receive concessions.232
This information has been provided to show the impact of our current decisions (2008 Determination) on customers’ annual water and sewerage bills for 2010/11. It does not include the impact of our final decisions on water and sewerage charges for the 2012 Determination against customers’ disposable income.
Sydney Water Corporation
The median water and sewerage bill amongst all Sydney Water customers in 2010/11 is $875. We can see a significant variance in the size of bills as disposable income increases. The majority of Sydney Water customers spend 2% or less of their disposable income paying these bills. Low income households’ bills were generally around $200 to $400 (see Figure F.1 to Figure F.3).
230 We have indexed the income data received in the 2010 household survey using the increase in
average weekly earnings for NSW to the financial year ending 2010/11. Source: Australian Bureau of Statistics, Average weekly Earnings Australia, 6302.0, November 2011.
231 Low income households are defined as those with an annual income of $13,000 to $34,000 in 2009/10.
232 Concessions are defined to include Pensioner Concession Cars and Veterans’ Affairs Gold Health Cards.

F Water and sewerage bills and disposable income analysis for Sydney Water
226 IPART Review of prices for Sydney Water Corporation’s water, sewerage, stormwater drainage and other services
Figure F.1 Distribution of water and sewerage bills against income – Sydney Water
0200400600800
1000120014001600
$13k to$18k
$18k to$34k
$34k to$42k
$42k to$62k
$62k to$88k
$88k to$130k
$130k to$156k
$156k+
Wat
er a
nd s
ewer
age
bills
aft
er c
once
ssio
ns ($
pa
)
Median Median all households
Data source: IPART’s household survey, 2010.
Figure F.2 Water and sewerage bills as a proportion of disposable income – Sydney Water
0%
10%
20%
30%
40%
50%
60%
0-1% 1-2% 2-3% 3-4% 4-6% 6%+
Bills as a proportion of disposable income
% o
f hou
seho
lds
Owners without concessions
Owners with concessions
Renters
Data source: IPART’s household survey, 2010.
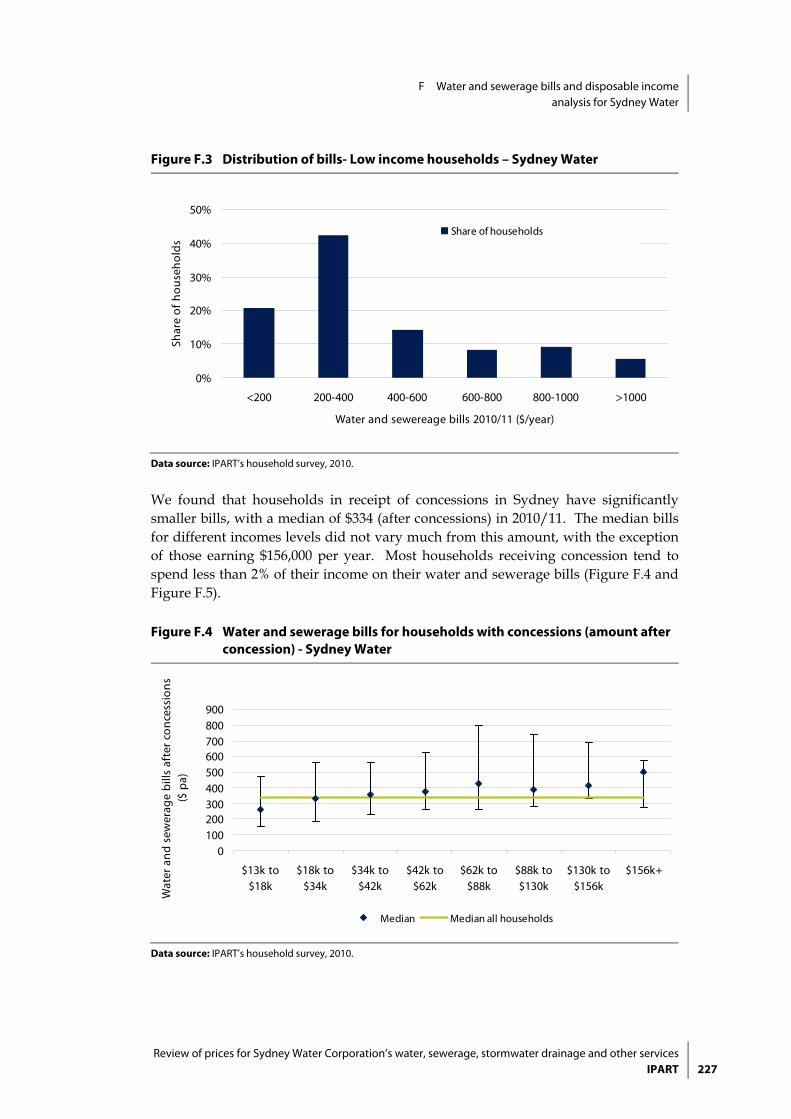
F Water and sewerage bills and disposable income analysis for Sydney Water
Review of prices for Sydney Water Corporation’s water, sewerage, stormwater drainage and other servicesIPART 227
Figure F.3 Distribution of bills- Low income households – Sydney Water
0%
10%
20%
30%
40%
50%
<200 200-400 400-600 600-800 800-1000 >1000
Water and sewereage bills 2010/11 ($/year)
Shar
e of
hou
seho
lds
Share of households
Data source: IPART’s household survey, 2010.
We found that households in receipt of concessions in Sydney have significantly smaller bills, with a median of $334 (after concessions) in 2010/11. The median bills for different incomes levels did not vary much from this amount, with the exception of those earning $156,000 per year. Most households receiving concession tend to spend less than 2% of their income on their water and sewerage bills (Figure F.4 and Figure F.5).
Figure F.4 Water and sewerage bills for households with concessions (amount after concession) - Sydney Water
0100200300400500600700800900
$13k to$18k
$18k to$34k
$34k to$42k
$42k to$62k
$62k to$88k
$88k to$130k
$130k to$156k
$156k+
Wat
er a
nd s
ewer
age
bills
aft
er c
once
ssio
ns
($ p
a)
Median Median all households
Data source: IPART’s household survey, 2010.

F Water and sewerage bills and disposable income analysis for Sydney Water
228 IPART Review of prices for Sydney Water Corporation’s water, sewerage, stormwater drainage and other services
Figure F.5 Distribution of households by spending on water and sewerage bills as a proportion of disposable income – owners and renters with concessions only - Sydney Water
0%5%
10%15%
20%25%
30%35%
40%45%
50%
0-1% 1-2% 2-3% 3-4% 4-6% 6%+
Bills as a proportion of disposable income
% o
f hou
seho
lds
Owners with concessions
Renters with concessions
Data source: IPART’s household survey, 2010.

G List of decisions
Review of prices for Sydney Water Corporation’s water, sewerage, stormwater drainage and other servicesIPART 229
G List of decisions
Decision Page
1 IPART’s decision is to adopt a 4-year determination period from 1 July 2012 to 30 June 2016. 30
2 IPART’s decision is to determine the target revenue using an adjusted glide path approach. 35
3 IPART’s decision is to introduce a demand volatility adjustment to mitigate possible revenue over/under recovery due to a material variation between the net level of actual water demand over the 2012 determination period and the forecast demand used in making the determination, and to: 38
– define material variation as more than 10% (+ or -) over the whole determination period 38
– indicate that only the impact of variation outside of this 10% variation level will be adjusted for 38
– decide how best to make the revenue adjustment in our next price review, if a material variation eventuates. 38
4 IPART’s decision is to set prices on the basis that SDP is in water security shutdown mode for the whole 2012 determination period, and pass through the annual actual extra costs Sydney Water incurs due to it being in a different operational mode in the subsequent year, using the mechanism described in Box 3.1. 40
5 IPART’s decision is to require Sydney Water to report annually on progress against the output measures described in Appendix B. 41
6 IPART’s findings and decision on Sydney Water’s notional revenue requirement and target revenue are shown in Table 4.1. 44
7 IPART’s finding is that Sydney Water’s notional revenue requirement is as shown in Table 4.3. 45
8 IPART’s decision is that Sydney Water’s target revenue is as shown in Table 4.4. 47
9 IPART’s finding on the revenue to be deducted from Sydney Water’s revenue requirement to reflect the revenue it will raise through ‘other fees and charges’ is as shown in Table 4.5. 48
10 IPART’s finding is that the efficient level of Sydney Water’s operating expenditure is as shown in Table 5.1. 52
G List of decisions
230 IPART Review of prices for Sydney Water Corporation’s water, sewerage, stormwater drainage and other services
11 IPART’s decisions on the allowances for a return on assets and depreciation, and the key inputs that gave rise to these findings are as shown in Table 6.1 and Table 6.2. 70
12 IPART’s decision is that past capital expenditure shown in Table 6.4 was prudent and efficient and should be incorporated in the opening value of Sydney Water’s RAB. 74
13 IPART’s decision is that $20.1 million of avoided costs from the Rouse Hill recycled water scheme be recovered through water and sewerage charges 75
14 IPART’s decision is that the forecast capital expenditure shown in Table 6.7 is efficient and should be included when rolling forward the RAB in this determination period. 81
15 IPART’s decision is that for the purposes of calculating the allowance for a return on assets, a post-tax real WACC of 5.6% is appropriate. 85
16 IPART’s decision is to calculate regulatory depreciation using straight-line depreciation and the asset lives Sydney Water proposed in their submission, as shown in Table 6.11. 87
17 IPART’s decision is to use Sydney Water’s proposed approach to forecast water demand for the 2012 Determination. This results in the levels of forecast demand shown in Table 7.2. 91
18 IPART’s decision is to introduce a demand volatility adjustment to mitigate possible revenue over/under recovery. 91
19 IPART’s decision is that Sydney Water can charge the maximum water charges as set out in Table 9.1. 107
20 IPART’s decision is that all residential dwellings (including houses, flats and units) will pay the standard residential water service charge. 111
21 IPART’s decision is to maintain the current approach to setting charges for unfiltered water. This means that the fixed service charge for unfiltered water will be the same as the fixed service charge for drinking water and the usage charge for unfiltered water will be $0.30 less than the usage charge for drinking water. 113
22 IPART’s decision is that Sydney Water can charge the maximum sewerage charges as set out in Table 9.11. 115
23 IPART’s decision is that Sydney Water can charge the maximum residential sewerage charges as set out in Table 9.15. 118
24 IPART’s decision is that Sydney Water can charge the maximum non-residential sewerage service charges as set out in Table 9.16. 119

G List of decisions
Review of prices for Sydney Water Corporation’s water, sewerage, stormwater drainage and other servicesIPART 231
25 IPART’s decision is to phase-in a decrease in the usage charge for sewerage from the current $1.49 per kL to $1.10 (in nominal terms) per kL by 2015/16. 120
26 IPART’s decision is to phase-in a reduction to the free allowance threshold from the current 500 kL per year to 300 kL per year by the end of the determination period. 120
27 IPART’s decision is that stormwater drainage charges will transition to area based charges, with a low impact discount for large non-residential customers who have minimal stormwater runoff, as shown in Table 9.18. 121
28 IPART’s decision is that Sydney Water is to maintain, in real terms, the Rouse Hill Stormwater Drainage Charge (formerly the River Management Charge) over the determination period. 124
29 IPART’s decision is to determine a Rouse Hill Stormwater Drainage Charge (Rouse Hill Land Charge) of $953.94 per year for new properties in the Rouse Hill Area for 5 years following the date of connection of a new property, noting that these are not stormwater drainage charges for the purposes of s65 of the Sydney Water Act 1994. 126
30 IPART’s decision is that Sydney Water can charge customers of the Rouse Hill recycled water scheme a usage charge of 80% of the potable water price and remove the service charge. 130
31 IPART’s decision is that Sydney Water is to set the prices for all other mandated recycled water schemes in accordance to IPART’s 2006 Guidelines “Pricing arrangements for recycled water and sewer mining – SWC, HWC, GSC, WSC”. 130
32 IPART’s decision is that Sydney Water is able to include $20.1 million in avoided costs for the expansion of the Rouse Hill recycled water network in the RAB and therefore in prices. 130
33 IPART’s decision is that Sydney Water can charge maximum industrial pollutant charges shown in Table 9.19. 138
34 IPART’s decision is that Sydney Water can charge maximum commercial pollutant charges as shown in Table 9.20. 139
35 IPART’s decision is that Sydney Water can charge maximum trade waste ancillary charges as shown in Table 9.21. 141
36 IPART’s decision is that Sydney Water can charge maximum industrial trade waste quarterly agreement charges as shown in Table 9.22. 143
37 IPART’s decision is that Sydney Water can charge maximum Wastesafe charges as shown in Table 9.23, with the new Wastesafe charging arrangements commencing from 1 July 2013. 145

G List of decisions
232 IPART Review of prices for Sydney Water Corporation’s water, sewerage, stormwater drainage and other services
38 IPART’s decision is that the maximum prices Sydney Water can charge for Miscellaneous Charges are as proposed in its pricing submission to IPART. 148
39 IPART’s decision is that Miscellaneous Charges will be maintained in real terms over the remainder of the determination period. 148
40 IPART’s decision is that the existing minor service extensions methodology is robust and should remain in place. 151
41 IPART’s decision is that the existing urinal closet and water closet based sewerage charges for exempt land be removed and replaced with the non-residential sewerage usage charge and discharge allowance. 152
42 IPART’s decision is to set a standard residential water charge and a standard residential sewerage service charge for all mixed development dwellings and occupancies and all dwellings and occupancies in combination strata properties. 153
43 IPART’s decision is to set the same unmetered water service charge for unmetered residential and unmetered non-residential properties. This will comprise the residential water service charge plus a deemed usage component of 180kL per annum. 154
44 IPART’s decision is to hold the water usage price constant in real terms at $2.10/kL. 224
45 IPART’s decision is to investigate the appropriate use of discount rates after the completion of this review in preparation for the next review. 224

Glossary
Review of prices for Sydney Water Corporation’s water, sewerage, stormwater drainage and other servicesIPART 233
Glossary
2005 determination Sydney Water Corporation, Hunter Water Corporation,Sydney Catchment Authority – Prices of Water Supply, Wastewater and Stormwater Services, Final Determination and Report, September 2005 (Determination Nos 5, 6 and 7, 2005).
2005 determination period The period from 1 October 2005 to 30 June 2009, as setin the 2005 Determination.
2008 determination Review of prices for Sydney Water Corporation’s water, sewerage, stormwater and other services from 1 July 2008, June 2008 (Determination No 1, 2008).
2008 determination period The period commencing 1 July 2008.
2012 determination Review of prices for Sydney Water Corporation’s water, sewerage, stormwater and other services from 1 July 2012, June 2012 (Determination No 1, 2012).
2012 determination period The period commencing 1 July 2012.
Annual revenue requirement
The notional revenue requirement in each year of thedetermination.
ASP Accelerated Sewerage Program.
BWSA Bulk Water Supply Agreement.
Catchment Sydney drinking water catchment.
COAG Council of Australian Governments.
current determination period
The period from 1 July 2008 to 30 June 2012, as set in the2008 Determination.
CPI Consumer Price Index.
DECC NSW Department of Environment and Climate Change.

Glossary
234 IPART Review of prices for Sydney Water Corporation’s water, sewerage, stormwater drainage and other services
determination Price limits (maximum prices) set by IPART for a givenperiod (determination period).
DWE NSW Department of Water and Energy.
GL Gigalitre.
IPART Independent Pricing and Regulatory Tribunal of NSW.
IPART Act Independent Pricing and Regulatory Tribunal Act 1992.
kL Kilolitre.
LRMC Long Run Marginal Cost of supply.
Minister Minister for Water.
ML Megalitre.
NPV Net Present Value.
P-nought adjustment P-nought is the price at time nought, which is for thefirst year of the determination period. A p-nought adjustment allows prices to increase more sharply in thefirst year of the determination period than subsequentyears, to reflect a step up in revenue requirement.
RAB Regulatory Asset Base.
REP Regional Environmental Plan.
RHDA Rouse Hill Development Area.
SASPoM Special Areas Strategic Plan of Management.
SCA Sydney Catchment Authority.
SDP Sydney Desalination Plant Pty Ltd.
SRMC Short Run Marginal Cost of supply.
Sydney Water Sydney Water Corporation.
upcoming determination period
the period commencing 1 July 2012.
WICA Water Industry Competition Act 2006.
WACC Weighted Average Cost of Capital.
Glossary
Review of prices for Sydney Water Corporation’s water, sewerage, stormwater drainage and other servicesIPART 235
X-factor
The rate by which prices can rise or fall over a determination period to account for efficiency gains and/or significant changes in the operating environment (such as new environmental standards or customer service standards).