Review of Maritime Transport 1977 - UNCTAD |...
67
TD/B/C.4/178/Rev.l UNITED N^TIDN^ CONFERENCE ON TR^DE ^ND D E^LO F^EN T Review of maritime transport, 1977 UNITED N^TION^
-
Upload
vuongkhuong -
Category
Documents
-
view
220 -
download
0
Transcript of Review of Maritime Transport 1977 - UNCTAD |...

TD/B/C.4/178/Rev.l
U N I T E D N ^ T I D N ^ C O N F E R E N C E O N T R ^ D E ^ N D D E ^ L O F ^ E N T
Review of maritime transport, 1977
U N I T E D N ^ T I O N ^

U N I T E D N ^ T I D N ^ C O N F E R E N C E O N T R ^ D E ^ N D D E ¥ E L O ? ^ ^ E N T
G e n e v a
Review of maritime transport, ^و??
Report by the secretariat ofU N CTAD
U N I T E D N ^ T I O N ^
N e w Y o r k , 1 9 7 9

N OTE
Symbols of United N ations documents are composed o f capital letters combined ^^ith b§ures. M ention o f such symbol indicates a reference to a United N ations document.
The designations employed and the presentation of m aterial in this Review do not imply the expression of any opinion ^¥hatsoe¥er on the part of the Sec- retariat o f the United Nations concerning the le^al status o f any country, territory, city or area, or of its authorities, or concerning the delim itation of its frontiers or boundaries.
TD/B/C.4/178/Rev.l
^N ! £٥ NATIONS ?OB£I€ATION
ه^ءءام?.£و.11.ه?.
Price: $u.s. 7.00 (or equivalent in other currenciea)

CONTENTS
Page
vivii
Paragraphs
Explanatory notes Abbreviations
Introduction
01
2121
ال
2323
2525252531
34343435٩٩
35
3-14
15-4715-2و
15-181و-21
22-25 2ة-27
28-293b-4730-3637-4344-47
48-53
54-5754-5556-57
58-74
67-7267
727374
75-9575-7879-8384-8788-95
ChapterI. Tire developm ent o t international seaborne trade
II. The developnrent of the rvorld m erchant tleetA. Changes in the world h e e t
1. Changes in the total tonna§e . . . . .2. ?rodnctivity o f shipping . . . . . .3. Trends in types o f vessel . . . . . .4. Trends in s i ^ e 5. Trends in propulsion ٠ . . ٠ . . ٠
B. O istrib^tion o f the world deet . . . . .1. O istribntion o f tonna§e by type o f vessel .2. A^e distribution o f the world m erchant deet3. O istribution o f tonnage on order . . ٠
III. Shipbuilding
IV. V^orld ship p r i c e s ........................................A. Changes in prices of new vessels . ٠ .B. Changes in prices of second-hand vessels
V. Ereight m a r k e t s A. General developments B. Changes in freight rates in 1977
1. ه آ ال cargo tram p m arhet freight rates . . 2. Cargo liner freight r a t e s ز 3 .Т а п к г freight r a t e s
c . Ereight rate indices of selected commodities exported by developing countries ٥ . Liner freight rates as a percentage of prices of selected commodities . . .
VI. ?o rt developments . ٠ . ٠
A. Ceneral notes . . . ٠
B. □ em and for port services € . Supply of port services ٥٠ Adequacy o f port services
^ . © t h e r developments 96-1B3A. Code of Conduct for Einer Conferences 96-97B. lo in t ventures involving developing countries 98C .^ u e ^ Canal . . . . . . . ; ٠ . . . ٠ . . ٠ . . . . . . ٠ . . 99-100D. Airtransport 101-102E. U N C TA D technical assistance 103

L IS T O F T A B LE S
Page
1. Development o f international seaborne trade in 1965, 1970 and 1974-76 . . . . . . . . . 32. W orld seaborne trade In 1965, 1970 and 1 9 7 1 977- . by ty^es of cargo ه ٠ 43. W orld seaborne trade in 1965, 1970, 1974, 1975 and 1976 by ty^es of car§0 and sb^res of groups of
c o u n t r i e s 44. O is trib n tio n o ^o rld to n n a^eg .r.t.an d d .^^ .t.)b y ^ ro u ^so fco u n t^ 1965,1970,1976
and 1977 65. W o r ld to n n a § e o n o rd e ra s a t3 0 ^ e ^ te n rb e r l9 7 7 76. Cargo carried ^er d.^^.t. o f world Oeet in 1967, 1970 and 1974-1976 77. £stinrated ton-nriles of oil and grain shi^nrents perd.w .t. in 1965,1970 and 1974-1976, by oil tankers of
10,000 d.^^.t. and abo^e 88. £stinrated ton-nriles o fb n lk conrniodities carried per d.w.t. in 1967, 1970 and 1974-1976 by bnlk
carriers, including conrbined carriers o f 18,000 d.^^.t. and abo^e 89. Analysis o f the world Oeet by principal types of vessel, 1970 and 1974-1977 9
10. Average si^e o f selected types of vessel in the world heet in 1965, 1970 and 1975-1977 . . . . 911. ?ropulsion analysis of the world Oeet as at 1 July, 1965, 1970 and 1975-1977 1012. £rends in propulsion of vessels on order (under construction and not conrnrenced) at 30 8eptenrber,
1975-1977 1013. ?ercentage shares of world tonnage by type o f vessel as at 1 July, 1965, 1970, 1976, 1977 . . . 1214. ^ g e distribution of world nrerchant fleet by types of vessel as at 1 July 1977 . . . . . . . . 1315. W orld tonnage on order as at 30 ^eptenrber 1975-1977 1416. □ eliv erieso fn ew buildings, 1970 and 1975-1977 1517. D istribution o f deliveries of new buildings by groups o f countries of build, 1 9 0 and 1975-1977 . 15 ث18. D istribution o f tonnage on order by groups o f countries of build, 1970 and 1975-1977 . . . . 1519. Representative new building prices, 1970 and 1973-1977 1720. £ s t^ a te d prices for new and ready liner-type vessels o f 11,000/13,000 d.w.t., 1970 and 1973-1977 1721. bankers: second-hand prices, average values, 1970 and 1973-1977 1822. Dry bulk carriers: second-hand prices, average values, 1970 and 1973-1977 1823. Liner-type vessels: second-hand prices, average values, 1970 and 1973-1977 1824. Freight rate indices, 1975-1977 . . . . . . . . . . . . . . . . . . . . . . . . 2025. ^unrnrary of liner freight rate changes and surcharges announced during the period 1974-1977 . . 2226. Indices o f freight rates of selected commodities exported by developing countries, 1975-1977 . . 2327. ^ a tio o f liner freight rates to prices o f selected commodities, 1964, 1970 and 1973-1976 . . . . .2428. Nummary o f the range o f questionnaires and answers by regions 2529. D ata on selected ports, 1976 2630. C ontainer tra® c in selected ports o f developing countries, 1976 2731. C ontainer traffic in selected ports o f developed market-economy countries, 1976 . . . . . . 2832. Development o f container traffim in the m ajor ^ s ian ports, 1974-1976 2933. Development o f container traffic in several ports o f West Africa, the €aribbean and ^outh America,
1974 and 1975 . . . . . . . ٠ . . . . ٠ . . ٠ ٠ . . . . . . .١ . . . . . 2934. ?resent and forecast traffic in several ports in developing countries 2935. E r r e n t im provem ents to inland ports and waterways . 29 . ... ٠ ... ٠ . ز ... ٠36. W orld £ank loans or credit for port developm ent granted in 1976-77 3237. Average daily num ber and net tonnage of vessels using the Suez ^ an a l in 1966, 1976 and 1977 . 3438. £rends in air freight volume and in air freight operating revenues, 1972-1976 35
؛٢

A N N E X E S
I. Classification of countries and territories ....................................................................................................... 37II. W orld seaborne trade according to geographical areas, 1965, 197©, 197 ه and 1975 . . . ٠ ٠ ٠ 39
III. M erchant heets o f the I^orld by flag o f registration, groups o f countries and types of ships, in g.r.t. and d.w.t., as at 1 July 1977 41
IV. Selected m axim um and m inim um tram p freight rates, 1974-1977 48V. Tiner freight rate changes and surcharges announced during the year 1977 ................................... 49

EXPLANATORY NOTES
References to dollars ($) are to United States dollars, unless other^^ise indicated.
References to tons are to nretric tons, unless otherwise specified.The term “ billion” signifies 1,000 million.Use of a h^^phen between ؛^ears, e.g., 1974-1975, signifies the full period
involved, including the beginning and end )?ears.Oetails and percentages in tables do not necessaril)? add up to totals, owing to
rounding.
The following symbols have been used in the tables in this Review.A full stop (.) indicates decimals.Two dots (..) signify that data are not available or ^re not separately
reported.A dash (—) signifies that the am ount is nil, or less than half the unit used.
٠٠ ٠
The classification o f countries and territories used in this Review is in- tended for statistical convenience and does not necessarily imply any Judgement regarding the stage of development of any particular country.

ABBREVIATIONS
N am es o f organizations
EEC European Economic Com m unityE ^C A ? Econom ic and Social Commission for Asia and the ?acihcIBRO International Ban^ for Reconstruction and Oevelopment (World
BanE)ICAO International Civil Aviation OrganisationlO A International Oevelopment AssociationOECO Organisation for Econom ic Co-operation and OevelopmentOREC Organisation of the Eetroleum Exporting CountriesU N C TA D U nited N ations Conference on Trade and Development
Other abbreviations
Bra^e horsepower Currency adjustment factor Cost, insurance, freight Deadweight tons Free in and out of ship Eree on board Oross national product Gross registered tons Lighter aboard ship Li^uehed natural gas Li^uehed petroleum gas O re/bulk/oil?akistan white cuttings ^ute) Roll-on, ro ll-o^Ribbed smoked sheet (rubber) Twenty-foot eوuivalent unit U ltra large crude carrier Very large crude carrier
b.h.p.CAE
d.w.t.
GN P
LASHENGLPGOBOP .W .C .
ro/roRSSTEUULCCVLCC

IN T RO D U C TIO N
1 .A s in previous years, this review has been prepared by the secretariat of U N C TA D in aceordance with item V o f the programme of wor^ of the Com mittee on Shipping. ا
2. Statistical evidence and other inform ation with regard to the development of international m aritim e transport is presented and discussed in the review with a view to relating year-to-year developments to relatively longer-term trends in world shipping, ?articu lar attention is given to factors and developments atfecting the trade and shipping of developing countries. In order to ^eep the si^e o f the tables within manageable limits, in most cases data for the most recent years only have been included. D ata for earlier years can be found in the Review o f maritime transport, 1972-1973, and the Review o fm aritim e transport, 1976,'^
> Official records ٠/ the Trade and Development Board, Fifth Session, Supplement No. 2 (TD/B/116/Rev.l), annex II.
Review ofmaritime transport, 1972-1973: report by the secretariat ofUNCTAD ء (United N^tinn^ publication, Sales No. E.75.II.D.3) and Review ofmaritime transport, 1976: report by the secretariat ٠/ UNCTAD (United Nations publication. Sales No. E.78.II.D.5).

Chapter !
THE DEVELOPM ENT OF INTERNATIONAL SEARORNE TRADE
4. W orld seaborne trade in 1965, 1970 and 1974- 1976 is shown in table 1. F arther infornration by type of cargo and groups o f countries is given in tab led and annex II. Figures for 1977 are not yet available.
5. W orld seaborne trade increased by 9 per cent in 1976in terms ofgoods loaded.According to prelim inary estimates, trade rose again in 1977 by some 3.3 per cent in terms of weight and by 4.3 per cent in term s of ton-miles.
6. As shown in table 1, both tanker and dry cargo loadings increased in 1976 by 9 per cent. The share of tanker cargo rose marginally to 53.6 per cent o f the world seaborne trade; in 1977 it should increase further since, according to prelim inary estimates, tanker cargo loadings rose by 5 per cent com pared with a 2 per cent increase for dry cargoes.
7. In 1975, crude petroleum accounted for 83 per cent o f tanker cargo as against 81.7 per cent in the previous year; prelim inary heures for 1976 and 1977 indicate marginal huctuations in these years.
8. Detailed data concerning types o f dry cargo are not available. Table 1 shows that seaborne trade in the five main bulk commodities rose in 1976 by 2 per cent, which was due mostly to the expansion o f the grain trade by about 9 million tons; these commodities accounted for 41.6 per cent o f dry cargo total as against 44.5 per
3. The growth o f seaborne trade in 1976 and 1977 was significantly induenced by an economic recovery in developed market-economy countries, which was, however, short-lived. ١ The OECD growth rate weakened m arkedly in the second quarter o f 1977 and has since remained sluggish. Real O N ? for OECD countries rose by an estimated 3.5 per cent in 1977 as com pared with an increase o f 5.2 per cent in 1976 and an average growth o f 4.3 per cent from 1964-1965 to 1974-1975. According to prelim inary information, OECD exports rose by 4.75 per. cent as against an increase o f Id .5 per cent in the previous year; imports rose by 5 per cent as against 14 per cent in 1976; oil im ports rose by 5.75 per cent as against 9.5 per cent in 1976. The estimated world production o f crude oil increased by about 3.6 per cent in 1977 to 2,94© million tons; the production o f OPEC countries rose by 1 per cent to 1,541 million to n s.؛
See “W أ ه٢ها economic outlook 1977-1978: report by tlie UNCTAD ^ecreturiut” (TD/B/665/Add.l); reprinted in Official Records ofthe Trade and Development Board, Seventeenth Session, Annexes, uجendه item also Handbook oflnternational Trade and Development Statistics, Supplement 1977 (United Nations publica- tion. Sales No. E/F.78.II.D.1).
^D£CD, OECD Economic Outlook (Paris), No. 22, Decern- berl977.
Data provided to the UNCTAD secretariat by the secretariat of ءDPEC.
Table 1
Development oflnternational seaborne trade ء In 1965,1970 and 19?d-1976(Goods loaded)
Drycargo
Total(allgoods)
0/which: main bulk,
commodities'^
Millionsoftons
Millionsoftons
Total
Percentageincrease/decrease
overprevious
year
Tankercargo
Millionsoftons
Percentageincrease/
overprevious
yearMillionsoftonsYear
1965 جو2 9 812 13 327 6 1,674 11197© 1,440 13 1,165 13 488 162,60513
ا97ه 1 832 - 7 1,471 ١ 668 7 3,304 11975 1,644 -1 0 1,428 -٩ 635 -١ 3,072-41976 . . . . . 1,797 9 1,555 و 646 غ 3,352 ء
Sources: (\) For tanker cargo, total dry cargo and total all goods: data communicated to the UNCTAD secretariat by t^e $tatistical Office ofthe United N iions.ه winف to possible subsequent revisions or other fectore, these d«ailed data may differ marginally ^om the aggregated figures reported in the United Nations, MonthlyBulletin ofStatistics. January issues.
(ii) For main bul^ commodities: Feai^ley and £gei؟ Charteria Including international cargoes loaded at ports ofthe Great I^kes and St. Lawrence system fo؟ unloading at po^^of the same
system, but excluding such traffic in main bulk commodities. Including petroleum im^3!^s into Netherlands Antilles and Trinidad and Tobago for refining and re-export.
b Iron ore, grain, coal, bauxite/alumina and phosphate. Since 1973, the categoiY “grain” includes also soya beans and sorghum.

products. “General cargoes” are mostly moved In liner vessels, Including container vessels, although some are transported by tram ps and specialised carriers; “m inor” bulh commodities are increasingly carried by bull؛ carriers, although some are carried in small shipments on liner vessels. In 1976, about 78 m illion tons of “m inor” bull؛ cargoes were carried by bulh carriers and combined carriers of 18,000 d.w.t. and over, as com pared with 151 m illion tons in 1975.
10. Table 2 gives data on world seaborne trade in term s on ton-miles. ?relim inary estimates for 1977
cent in 1975. Estimates for 1977 indicate that, while seaborne trade in dry cargo increased by 1.8 per cent, the trade in iron ore, coal and grain declined by 3.7, 1.6 and 2 per cent respectively.
9. The remaining 909 million tons — i.e. 58.5 per cent ofthe dry cargoes carried by sea in 1976— consisted of “general cargo” and “m inor” bul^ com m odities; the latter comprise a wide range o f cargoes, including sugar, salt, fertilisers, cement, gypsum, sulphur, pyrites, m ineral sands, manganese and non-ferrous ores, petro- leum coEe, scrap iron, pig iron, steel products and wood
Table 2
World seaborne rade in 1965,1976 and 1974-1977 by types of cargo{Billions ofton-miles)
Crude Oil Iron Other TotalYear ٠(■/ products ore Coal Grain^ cargo trade
849 5 537 1 449 216 27 2 640 و 4 8 0 . . . . . ا96و .1970 . . . . . . 5 597 890 1 093 481 475 2 118 10 6541974 . . . . . . 9 660 960 1 578 558 695 2 935 16 3861975 . . . . . . 8 8 8 2 845 1 471 621 734 2 810 15 3631976 . . . . . . 10229 950 1469 591 779 3 0 3 5 170531977 (estimated) . . 10 800 1 020 1 400 585 760 3 220 17 785
SoMree.-Feamley and Egcrs chartering Co. L^d., Review77ءا (Oslo), January 1978..Inoludes wheat, maize, barley, oats, rye, sorghum and soya bean ء
show that, notwithstanding a decline in ftgures for iron (62.1 per cent in 1974) and 73.7 per cent of unloadingsore, coal and grain, the world seaborne trade rose again (77 per cent in 1974); their share o f petroleum unload-and reached a peah level. ings was 79.2 per cent for crude petroleum and 79 per
11. The percentage shares o f various groups of cent for petroleum p r^ u c ts (79 per cent and 80.3 per countries in t^evo lun؛ e o f world seaborne trade, s e p a r ؛؛^؟- ^atelyby loadingsandunloadingsandtypesofcargoes,in ٠؛ ^٥٠ petroleum loadings,
actu^l^dua^tities loaded atld u؟ lo^ded by groups of ص n •?ر 1975, developing ؟ ou^trieg^a؟ counted for
١٧٢ ” ®■ loadings declined from 9 4 ق per cent in 1974 to 93.9 per م12. In 1975, the developed m ark t-C conom ycoun- cent for crude petroleum and from 6d.7 per cent in 1974
tries accounted for 32.8 per cent of the tonnage loaded to 57.7 per cent for petroleum products ; the percentage(31.4 per cent in 1974) and 76.6 per cent of the tonnage o f petroleum unloaded in developing countries onlyunloaded (78.3 per cent in 1974). These countries am ounted to 18.9 per cent o f the world total in 1975.accounted for 62.4 per cent of dry cargo loadings 161.6 million tons of petroleum products were loaded in
Ta b l e 3
World seaborne tradea in 1965,19?©, 1974,b 1975 and 1976ء by types of cargo and shares of groups of onntriesb(Millions oftons andpercentages ofworldtotal)
Totalall
Goods unloaded
Drycargo
Petroleum
ProductsCrude
TotalallDry
cargo
Petroleum
ProductsCrudeCountrygroup
andyear
676!؛530
؛055؛233
؛00.0100.0100.0 100.0 100.0
(Trade in millions oftons)
1 127 1472
1619
622 2221101 3021470 3121 373 287— 1 6 1 4 —
16742 6053 304 3 072 3 352
81? 1 165 1472 1428 1 555
240330335280
1110 1497 1 364
■1797(Percentage share ofeach category ofgoods in ،وه،م
49.744.6 45.245.6 50.1
37.1 13.243.5 11.945.2 9.645.0 9.4— 49.9 —
100.0100.0100.0100.0100.0
37.2 14.3 48.542.6 12.7 44.745.3 10.2 44.544.4 9.1 46.5
46.4
w©rld total 1965 .1970 .1974 .19751976 .
World total 1965 .19701974 .1975 .1976 .

T a b l e ?! (continued)
ال World seaborne trade>؛ In 1970,197ه,ه ل97ع and 197ءة by types olcar^o and scares olgroups 0؛00هةماأمح(and percentages o f world total مء/م«ء Millions)
Goods unloadedGoods loaded
TotalallDry
cargo
Petroleum
ProductsCrude
Total٠//Dry
cargo
Petroleum
ProductsCrudeCountrygroup
andyear
78.179.5 78.376.6
4.1
.4
2.73.4
0.71.20.60.7
18.817.118.419.3
2.8
7.37.27.37.4
7-3
8.4
(by groups ofcountries كء/م،ءمحر Percentage share)
0.10.20.20.2
76.379.177.0
6.3
1.72.11.31.3
17.6
17.719.8
4.1
3.74.3
4.44.6
a
0.20.30.20.2
79.0 79.4
79.0
1.01.12.12.1
0.91.00.8
0.10.11.30.8
20.018.017.618.9
4.12.7
6.03.1
7.4
7.4
0.10.10.10.1
0.40.30.80.8
78.979.9 79.0 79.2
0.4
١٦
0.4
1.71.9
0.3
20.718.419.318.9
6.1
7.9
32.8
6.96.1
5.0
0.60.30.30.6
61.863.163.161.1
11.1
11.211.0
21.016.0
29.4
33.960.062.162.4
7.27.3
6.46.4
1.4
0.80.9
30.730.3
10.6
7.67.3
8.28.6
23.326.9lli
8.010.012.3
8.0
12.3
0.10.1
67.863.9 60.7
42.836.233.0
23.3
ة:ة26.1
0.10.1،
0.30.40.30.3
0.70.80 70.6
0.1
Developed ]narl،et-econonry countries1963 .................................................................................. 0.11970 1.31974 1.71973 2.4
Socialist countries ofEastern Europe and Asia1963 4.61970 .................................................................................. 3.41974 2.91973 .................................................................................. 3.7
Ofwhich:in Eastern E^ope1963 4.61970 .................................................................................. 3.41974 2.71973 .................................................................................. 3.1in Asia1963 .................................................................................. —1970 .................................................................................. —1974 0.21973 0.6
Developing countries1963 93.31970 93.01974 93.41973 93.9
Ofwhich:in Atrica1963 16.01970 23.41974 16.61973 16.1inAnrerica1963 20.91970 12.21974 .................................................................................. 7.41973 7.3in Asia1963 38.41970 37.41974 71.41973 70.3in Europe1963 ..............................................................................................1970 ..............................................................................................1974 ..............................................................................................1973 —in Dceania1963 —1970 —1974 —1973 —
٠ Preliminary estimates from data in United Nations, Monthly Bulletin o f Statistics, ^ol.xxxu,No. !,January 1978.
ه $ee annex I below for the composition of these groups.
Лмгсе.Аппех П of the present Review. ه See note ء to table ١ ٠
14. Socialist countries o f £astcrn Europe and ^ s ia increased tire percentage of cargoes loaded in their ports from 5.5 per cent in 1974 to 6.1 per cent in 1975 ; cargo unloaded rose from 3.3 per cent to 4.1 per cent. The increase wa؛ higher in the loadings o f petroleum products and in dr؛ cargo unloadings.
developing countries in 1975, i.e. some 56 m illion tons less than in 197d, 75 per cent o f the decline being attributed to developing countries in America. The relative im portance o f different geographical groups of developing countries in the total loadings and unload- ings has not changed s ig n ih can tj.

Chapter II
THE DEVELOPMENT OF THE WORLD M E C H A N T FLEET
ing increase of 9 per cent in g.r.t. (10 per cent in d.w.t.) fronr mid-1975 to mid-1976. This figure includes laid- up tonnage, which, according to the Oeneral Council of British Shipping, was 19.7 !million g.r.t. or 37.1 nrillion d.w.t. Despite the decline of the rate o f growth o f the world fleet, the tonnage increase was the third largest since 1948. Tonnage changes from 1965 to 1977 and the shares o f various groups o f countries are shown in table 4.
A. Changes In the ^nrld fleet
1. Changes in the total tonnage
(a) E xisting tonnage15. In m id-1977, world sea-going tonnage
am ounted to 388.5 million g.r.t. (641.3 million d.w.t.), which re jects a rise of 5.8 per cent in g.r.t. (6.7 per cent in d.w.t.) over m id-1976, com pared with a correspond
Table 4
Distribution of world tonnage؛، (g.r.t. and d.w.t.) by groups of countries of registration in 1965,197©, 1976 and 1977(Mid-yearfigures)
Increase in tonnage (g.r.t).
Share ا/م>عاك،ءكاpercentage))
1965- 1976- lndexl977 (100=1%5) 1977 1977
Tonnage andpercentage^
Millions ofg.r.t. Millions ofd.w
1977197619701977197619701965
Flags ofregistration in groups o f countries
265 100 ^^١
06^ 17.3 45.0
494 43.3 36.0
238 62.6 81.0
306 8.9 9.2
280
730
7.6
(ioo!o)
343.t(33.8)
203.2 (31.7)
348.3
39.8(6.2)
33.3
6ا.2 0(00.0)[
337.0 (36.ا)
184.2(30.6)
3ا.2 2
37.0 (6.1)
(0.9) (1.0)
4©.8(6.8)
39.9(7.9)
9.3
3 6 3.7 6.114.3 13.9 7.آ 4.722.8 29.1 3.4 16.8— ٨١ — .ه4٨١٨١٨١ -
(0ت4) (0ق9.4 .ه4
(loao)
210.9(64.7)
70.3(21.6)
281.2(86.3)
أ6ت6)20.3
(6.2)
؛(ث)
(6.6)
1.1
11.7
(ئ:أ
(100.0)
211.0(34.3)
109.2
320.2(82.4)
(8ت6)
(7.4)
4.3(1.2)
33.4(8.6)
10.818.60.10.1
(أن
367.1( 100 .0)
207.3(36.3)
(2Т1)
306.8(83.6)
(8.3)
(7.3
(1.0)
(7.3)
9.813.0
0.1
(قئ
؛(ةئ:ة)
141.1(64.8)
40.9(18.8)
182.0(83.6)
146.8( 100 .0)
102.2
22.1(13.1)
124.3
1. World total
2. Developed market-economy countries
3. ©pen registry countries،
4. Total 2 and;
Socialist countries ofEastern Europe and Asia ١٨٨ 19.3
Ofwhich:(7.4) (8.9)
in Eastern Europe .................................. 10.3 18.6(7.0) (8.5)
i n A s i a .......................................................... ٨٨ 0.9(0.4) (0.4)
Developing countries total . . . . . . . ١٨٠ 13.2
Ofwhich:(7.4) (7.0)
in Africa ..................................................... ©.6 ٨ «in America ................................................ 4.8 6.4in A s i a .......................................................... 8.0
(أن0.7
(0.3)
in Europe . . .in Oceania ٠ .
7. Otlrer, unallocated
^ Figures in parentheses.٠ The composition of this group of countries differs from that adopted in the report
«Economic consequences of the existence or lack of a genuine link between vessel and flag pf registry: repo« by th؟ secretariat ofUNCTAD (TD/B/C.4/168 and 1 ^ ؟٥ ). However, for the sake of stati^ical consistency, the classification ofcountries in the present Review
^ ٠٧ ،?; Compiled from Lloyd's Register ofShipping: Statistical Tables (London) and supplemental data covering vessels of 1س g.r.t. and above.
nd؟ Excludng the Un[ted St^es of America reserve fleet and the United States وCanadian Great L ikes fleets, which in 19?? amounted respectively to !.?, !.?, 1.8 million g.r.t.

Change(percentage)
Bulkcarriers
All (including Otherships Tankers combined ships
(millions Change (millions Change carriers) Change (millionsTonnage on order as at ofd.w.t.) (percentage) ofd.w.t.) (percentage) ofd.w.t.) (percentage) ofd.w.t.)
30 September 1976 . . . . . 103.5 51.0 30.5 22.0
31Deeemberl976 . . . . . 90.0 38.9 29.2 21.9
31 March 1977 . . . . . . 82.3 33.5 27.3 21.6
30 June 1977 . . . . . . 72.4 28.2 23.8 20.5
30 September 1977 . . . . . 65.8 24.6 20.7 20.4
Source: Data provided by the Shipping tntonnation Seivieea 0 رم/ءك>مح'ء Register ofshipping and by Lloyd’s ot London Press Ltd.
-0 .7
-0 .4
T a b l e 5
e on order as at 30 September 1977؛(Thousands ofd.w.t.)
World!
مءراءهships
LASHships
Ro/rocargoships
containerships
Fullcontainer
ships
Otherbulk
carriers
Tankers Tankers Ore/oilAll lS0000d.w.t. under ،مءممح»اا
Country grouping ء>تيااءد andover ISOOOOdw.t. carriers
!.W orld total . . . . . 65 7552. Developed market-economy
c o u n t r i e s 372363. Dpen registry cou^ries 14 1234. Total 2 plus 3 . . . 513585. Socialist countries total . 2 890
Ofwhich:in£astern£urope . . 2 752in Asia . . . . . 138
6. Developing countries to ta l 10 644 Ofwhich:
inAfrica . . . . . 956in America . . . . 6300in A s i a . . . . . . 3 387in Oceania . . . . . 0.3
7. Dther unallocated . . . 862
9 1302 541
11671608
527
3 812
79110641958
0.3437
2424
1602
1 170
1227
56 —
10 —29 —17 —
299
204
23516
16
17 551 1 855
1272418
1690
25
117
"31
22 —
؛707
؛990800
75545
؛496
153؛447896
3 198
912345
1257462
462
1479
1232247
17231 7394
>320
612
348
31729
11419 4 525
15 944
1287
1 132 155
102 —
yource.ShippinglnformationServicesofL/ort/’sBegijtero^AippingandLloyd’sofLondonl .Developing conntries in Enrope had no tonnage on order و
further as indicated in table 6, the growth o fth e world tonnage being substantial!)? higher than the increase in the world seaborne trade.
20. Tables 7 and 8 show the trends in ^roductivit)? of tankers o f 10,000 d.w.t. and above and ofbulk carriers of18,000 d.w.t. and above in ternrs o f ton-i^iles o f cargo carried per year per deadweight ton o f th e active Oeet.
T a b l e 6
Cargo carried per d.w.t. of world Beet in 1967,1970 and 1974-1976
Cargo carriedper d.w.t.
Tons Index(1960^100)
Totalcargocarried (millions oftons)
(millionsofd.w.t.^Year
1967 . 240.9 1910 7.93 1161970 . . 326.1 2 605 7.99 1171974 . 486.9 3317 6.81 991975 . . 546.3 3 175 5.81 851976 . . 601.2 3 352 5.58 82
(b) Tonnage on order^16. During the 12-month period ending JO ^eptem-
ber 1977, world tonnage on order dropped by 37.7 mil- lion d.w.t. to 65.8 million d.w.t.
17. T he over-all decline was due m ainly to the lack o f new orders for tankers and bulk carriers, although it was partly offset by a 15 per cent decrease in deliveries. Drders for tankers of 150,000 d.w.t. and above declined by 21.5 m illion d.w.t., which represented 57 per cent of the reduction; bulk carriers (excluding combined carriers) and other tankers decreased respectively by7.4 million d.w.t. and 4.9 million d.w.t.
18. W orld tonnage on order by types o f vessels and groups o f countries as at 30 September 1977 is shown in table 5.
2. Productivity o fsh ipping19. The productivity o fth e world fleet, measured in
tons of cargo carried per d.w.t. ofto tal fleet, has declined
Sources: World fleet: Lloyd’s Register ofshipping: Statistical Tables (London), various Statistics, January /٠ ssues; total cargo carried: United Nations, Monthly Bulletin؛issues,
атء Including respectively 33.4 million d.w.t. and 49.5 million d.w.t. of laid-up tonnage 19?5 and 1976 (according to the General Gouncil ofBritish Shipping).
٠ The discussion on !he tonnage on order in this chapter is based on data provided to the UNCTAD secretariat by the Shipping Infor- mation Services of Lloyd's Register ofshipping and by Lloyd’s of London Press Ltd. The data from this source do not include ships on order with the yards in the USSR, Romania and Uhina.
7

T a b l e ?
Estimated ton-miles of oil and grain shipments per d.w.t., in 1965,1970 and 1974-1976, by oil tankers of 10,000 d.w.t. and abore
Indexactivefleet
produc-tivity
(1962=100)
ТоП‘ГпИез per active
(thousand)^
Totalactive
(millionsofd.w.t)°
Fleetfleet
(millionsofd.w.t)^
Estimatedton-miles
oil/grainshipments(thousandmillion)
Totaloil/grain
shipments(millionsoftons)
Grainshipments(millionoftons)
shipments(millionsoftons)Year
108
119
113
106
39.8(39.7)
(4إ8)
(41.3)36.3
(32.6)
(33.6)
79.6
137.6
230.3
245.6
264.5
80.0
137.8
230.5
273.0
307.0
3 172
6 038
9 523
8 904
10301
735.8
1 181.9
1491.0
1 386.2
1 562.4
13.8
7.0
5.4
1965. . ٠ 722
1970. . . 1 179
1974. . . 1484
1975. . ٠ 1 380
1976. . . 1 557
Mid-year figures وb Estimated by the UNCTAD secretariat on the b^^i 0 آ information on the laid-up
tanker tonnage issued by the Cenera] Counci■ ofBritish Shipping..Ton-miles per d.w.t. of total tanker ■leet are indicated in brackets ء
increase between mid-1976 and m id-!9?? ; their respec- tive shares were 37 per cent, 28 per cent and 16 per cent. The rate ofgrowth o f the t^n^er deet was 3.5 per cent as against !2 . اper cent in the previous 2 ا m onths; a further dechne can be expected since the worid order boo^ for ta n ^ r s dropped during the year ending September 977إ by about 52 per cent. In the same period, orders for bul^ carriers dechned by 3d per cent. In view ofthe ditdcuities experienced in !977 in fmding suitable em ploym ent for large bul^ carriers, it is doubt- ful that the rate of growth of 12.2 per cent for this type of tonnage will be m aintained.
24. The highest rates of growth were recorded for chemical carriers and liquefied gas carriers. Norway accounted for 42 per cent o f the increase o f chemical tankers. The tonnage of liqueded gas carriers rose by about 1 million g.r.t.,ofw hich 42 per cent was registered in Tiberia, 15 per cent in Algeria, and 11 per cent in the United States o f America.
Sources: Compiled on thebasis ofFeamley and Egers Chartering Co. Ltd., Review 1977 (Oslo, 1978), World Bulk ٢٢^ ^ 1976 (Oslo, ا97ث ), and information provided by the publishers to the UNCTAD seeretariat.
21. In 1976, the productivity index for tanhers increased by 8 points because o f an im provem ent in the trading conditions for tankers during the course o f the year and a consequent reduction o f slow steaming; moreover, the am ount o f laid-up tanher tonnage remained comparatively high. Un the other hand, the productivity index for bulk carriers declined by a further 6 points as a result of a modest lay-up level, slower turn-rounds, and the carriage of part cargoes.
3. Trends in types ofvessel
22. Table 9 shows the composition o f the world merchant fleet by types of vessel since 197d and indicates the growth rates o f different types.
23. O refeulk carriers, t a n ^ r s and general cargo ships accounted for 81 per cent of the total tonnage
T a b l e 8
Estimated ton-miles of bulk eommodities carried per d.w.t.و in t967, t970 and 1974-1976 by buik carriers, including combined carriersof 18,000 d.w.t. and abo^e
Drybulk ٠ //
Totalbulkcargo
including
Estimatedton-miles
ofbulkcargo,
carried,including Total
Totalactive Ton-miles
Index ٠/ active fleet
ا،ع^مء cargo ٠// oil fleet fleet per active produc-(millions (millions (millions (thousand (millions
ofd.w.t.)°(millions d.w.t. tivity
Year oftons) oftons) oftons) million) ofd.w.t.)^ هرءمحااس،،مااءم (1960 = 100)
119125
104
40.142.4
(37.8)
(33.5)
(29.7)
33.262.2
121.3
125.9
137.9
62.2121.8
132.9
145.5
29 287 133061 500 2 636
140 820 4 603
112 786 4 446
121 851 4 577
1 9 6 7 . . . . . 2581 9 7 0 . . . . . 4391 9 7 4 . . . . . 680
1975 . . . . . 674
1 9 7 6 . . . . . 730
،Estimated by t،te UNCTAD secretariat on t>te basis of information for inactive combined carriers, ore carriers and bulk carriers reported in H. p. Drewry ($hipping Consultants Ltd.,) (London), various issues.
.Ton-miles per d.w.t. of total bulk carrier fleet are indicated in parentheses ق
gersCha^eringCo. Ltd., World Bulk by the publishers to the UNCTAD ل
Sources: Compiled on the basis of Fearnley and Trades 1976 (Dslo, 1977); also information provi، secretariat.
.Including oil cargoes in combined carrier و.Mid-year figures ءآ

T able 9
Analysis of the world fleet by principal types of vessel, 1970 and 1974-1977ظ'و
(Thousands ofg.r.t.)
Percentage change )976У1977Principaltypes 1970 1974 1975 1976 1977
© i l t a n ^ r s ..........................................................
Liquefied gas carriers . . . . . . . . . .
Chemical carriers . . . . . . . . . . .
Miscellaneous tankers - - - - - - - - -
flulk/oil carriers (including ore/oil carriers) - .
©re and hulk carriers - - - - - - - - - -
General cargo (including passenger/cargo) . -
Co^ainer ships (fully cellular) . . . . . .
Lighter carriers - - - - - - - - - - - -
^ehiele carriers . . . . . . . . . . .
Tish factories and c a r r ie r s ..................................Wishing (including factory trawlers) . ٠٠٠ .
Terries and passenger vessels . . . . . . .
All other vessels، . . . . . . . . . . .
ToTAL(lOO.O) 227 490 311 320 342 162 372 000 393 678
30.6
46.1
4.3
4.7
-0.1
- 7 .9
174 123 (44.2)
4411(ل.ا)
1733(0.3)
168
089 26 (6.6)
(19.0) 088 77
(19.6) 343 7
(1.9) 793
(0.2) 633
(0.2) 162 12
(3.1)
7091
(1.8) 986 6
(1.8)
168 161 (43.2)
3 377(0.9)1274
(0.ر3ر)و
2؛3 0ر23(6.7)
714 66 (17.9)
608 73(19.8)
683 6(1.8)
796(0.2)
687(0.2)
11849
7 302
(2.0)6 209 (1.7)
130037(43.9)
2 999 (0.9)
967 (0.3)
114
23 7اأ6(6.9)
(18.1) 399 70
(20.6) 244 6
(1.8) 7960ؤ2جإ )
(0.1)
420 7
737 3 (1.7)
491 129 (41.6)
2 4 1 3 (0.8)
748 (0 .3)
122
2ا2 0ر33(7.1)
403 37(18.4)
674 68(22.1)
6291 (2.0)
666 (0 .2)
469 (0 .2)
683 10(3.4)
192 7
131 3 (1.6)
140 86 (37.9)
1330 (0.6)
431 (0.2)
8 3 1 7
3مإ3ر4(16.9)
396 72 (31.8)
1908 (0.8)
804 7 (3.4)
2991
(1.3) 799 7
(3.4)
,Figures in parentheses indicate share p^tpnnage in world total طс Ineluding livestoclt carriet؟, supph ships and tendeta, tugs, dredgers, ice-breakers,
research ships and others; and ^٢ 1974-1976, cable ships and nriscellaneous ca^o ships
Source: محرره/ء'ء Register ٠/ Shipping: Statistical Tables (Lpndon), 197© and 1974-1977 (rnid-؛rear hgrrres).
The data in this table are not contparable with the data in table 4 because they وinclude the United States Reserve Fleet and the United States and Enadian Ureat ^ k e s Beets.
4. Trends in size26. In 1977, the average size ه آ the ©Tain types of
vesseis in the world trading fieet increased farther, except for container ships, as indicated in table 10. Retween 1970 and 1977, thesizeoftanlrers and liquefied gas carriers rose by 99 and 91 per cent respectively, that o f bulk carriers by 34 pef cent, and that o f container ships by 30 per cent ; the lowest rate occurred for general cargo ships, the size o fw hich increased by 8 per cent.
27. The average size o f tankers in the world order book in September 1977 was approxiinately89,000 d.w.t. as against about 43,000 d.w.t. for tankers
25. The world container fleet increased by 0.9 mil- lion g.r.t. and there was about 2 m illion g.r.t. of container ships on order to ensure its further growth. The tonnage o f ro-ro vessels rose from 1.9 m illion g.r.t. in S n u a ry 1976 to 2.3 m illion g.r.t. a year later.? In September 1977, orders for ro-ro cargo ships stood at1.2 million g.r.t., which suggests that a further substan- tial increase of the ro-ro fleet can be expected. The lighter-carrier fleet rem ained virtually static, but a further 96,000 d.w.t. are on order.
’ Fearnley and Egers Chartering c©. Ltd., Ro-ro © ٠٠٢ Vessels e L؛tah ,ا January 977 ,(©اء©)
Table !0
Average size ©f seleeted types ©f vessel in tbe w»rld fleet in 1965,1970 and 1975-1977
19771976197519701965
14114 21 363 23 934 23 19224 340 40 090 43 379 48 30318434 23 032 23 331 23 39930 172 39 336 4 0 2 1 3 40 443
3 237 3 297 3 391 3 49411423 14 839 13091 14 8784 686 7 123 7 799 8 947
©i! tankers ( ^ .r . t . ) ............................................................................. ١٠ 372(Equivalent ط d.w.t.) . . . . . . . . . . . . . . .
©re/bulk ©arrière (including bulk/©il carriers) (g.r.t.) . . . . . 13 369(Equivalent in d .w .t . ) ...................................................................
General carg© ships (including passenger/carg©) (g.r.t.) . . . .c©ntainer ships ( g . r . t . ) ...................................................................Liquefied gas carriers ( g . r . t . ) ..........................................................
Source: Compiled on the basis ofdata pubbshed in Lloyd's Register ofShipping: اءهرء'رء،هء / Tables (London), respective issues.

Table 11
Propulsion analysis ofthe world fleet as at 1 July, 1965,1970 and 1975-1977 ه
19701965ء/7ئءا7ه977/
(0.8)
(0.2)133.9(34.0)
(0.6)140.1 (35.6)
251.1 (63.8)
(0.6)253.6(64.4)
( lo a o )
(إ0)
(0.2)129.5
(34.8)
(0.7)136.3
(36.7)
233.4(62.7)
(0.6)235.7(63.3)
372.0( 100.0 )
il(34.7)
(0.8)126.1(36.9)
213.7(62.5)
(0.6)215.9(63.1)
342.0( 100.0)
10.1(4.5)
(0.5)
(29إ6)
(1.5)
(36.1)
143.8(63.2)
(أل)145.4
(63.9)
227.4( 100.0)
(134)
(1.1)47.6
(29.7)
(2.6)
(4ل8)
(52.7)0.8
(0.5)
(53.2)
160.5(100.0)
1. SteamshipsReciprocating . ٠ . .
Reciprocating and turbine
Turbine . . . ٠ ٠ .
Turbo-electric . . . .
Subtotal . . . . . .
2. MotorshipsDiesel . . . . . . .
Diesel-electric . . . .
Subtotal , ٠ ٠ . ٠ ٠
T o t a l (Steanr- and nrotorships)
Source: Compiled 0» the hasis ofdata eoptaitted itt Lloyd’s Register ofshipping: ءهع'،ء(ر'ء،ا / Tables (London), various issues. .figures in patentheses indicate percentage oftvorld deet و
29. The diesel engine remains the most popular prim e ntover, particularl)? in the slow-speed, direct- coupled form, and propels 63.8 per cent o f th e world gross registered tonnage. Steam turhines, however, dom inate in si^es o f 80,000 g.r.t. and over; as at m id-19??, there were ?29 steamships in these si^e groups compared with 14? m otor ships. -Tahle 12 indi ءcates a marked increase in the shar^ of turbines for vessels ordered in the 75,000-99,999, class; conse- quently, the percentage of steamships of 80,000 g.r.t. and ov^r in the world tonnage should increase further.
being scrapped.؟ The average si^e of this type of vessel should therefore continue to increase. Dnly marginal changes can be expected with regard to ore/bulk carriers (including combined carriers) since the average si^e of those on order am ounted to 39,673 d.w.t. compared with 40,445 d.w.t. in the existing Oeet. C ontainer ships may show an increase in 1978 as container vessels on order were on the average some 2,300 g.r.t. larger than those in the world fleet in 1977.
5. Trends in propulsion28. Table 11 gives an analysis of the propulsion
system o f vessels in the world Oeet in recent years.
٠ Lloyd's Register ofshipping: Statistical Tables (London), 1977, pp. 39-31.
by E.A. Gibson, Shipbrokers Ltd.؛ Based on data published (London), 15 December 1977.
T a b l e 12
I propulsion of vessels on order (under construcüon and not commenced) at 30 ^eptemher, 1975-1977
Trends أ
1975/ء7ه1977
ofwhichmotor
(percentage)No. o f vessels
ofwhichmotor
(percentage)
ofwhichmotor
(penmtage)No. o f vessels
Size group (ing.r.t.)
100.0
91.126.011.6
؛450
2355043
100.0
92.3
902 100.0 2 587879 96.4 1048510 92.7 337104 56.7 89254 7.9 105
999 9 -100 ل000ن 29 99930 00ن 74 999
75 00CT 99 999 100 ООО and over
Return (London), for ا»ءءآااك/امح>ءا Merchant ,■ااك/م>/،ءم«ء Register 1ء/رم>مح’ء contained i n
1ه
Source: Compiled on the h^$i$ ( coD-e^ponding quarters.

accounted for 20 per cent. The t a n ^ r fleets o f petro- leu!n-export؛n§ developing countries rose by 60 per cent to 10.4 nrllllon d.w.t., and their share In the total tanker tonnage o f developing countrlds Increased from 39 per cent In July 1976 to 47.6 per cent a year later.
1970 مح^ءا 1974 1975 1976 ;;>؛/
0.9 0.6 0.5 0.4 0.3 0.3
0.5 0.5 0.5 0.5 0.6 0.7
Asia and Oceania - - -Afri^ ..............................Latin America and UarihheanE u r o p e ..................................Total developing countries
Source: Lloyd’s Register ofshipping: Statistical Tables (London), various issues, with adjustment for the United Siates Reserve Fleet and the United States and Canadian Oreat Lakes (leets.
2. Age distribution o fth e world merchant fleet37. The age ظ0ه س ة1ا ا ف1ك o f th e world fleet in mid-
1977 is shown in table 14. In 1977, the percentage of tonnage under 5 years declined by 1 percentage point while tonnage from 5 to 9 years increased accordingly. The shares of the remaining two age groups have not changed.
38. The age com position o f the fleet o f developed m arket-economy countries has deteriorated. Their tonnage under 5 y^ars dropped from 40 to 37 per cent, the shares of the ne^t two age groups remained unchanged, while tonnage of 15 years and over increased from 16 to 18 per cent.
39. The fleet of open registry countries has become younger; 66 per cent under 10 years as against 63 per cent in 1976 and tonnage in the age group o f 15 years and over declined from 24 to 21 per cent.
40. The age structure of fleet o f socialist countries has deteriorated as their tonnage under 10 years decreased from 49 to 46 per cent, although the age group under 5 years remained unchanged. The percentage of their fleet from 10 to 14 years increased by 1 percentage point and the proportion of vessels of 15 years and over rose from 23 to 25 per ceht.
41. Developing countries have further improved the age com position of their fleet; 39 per cent is under 5 years and 21 per cent is between 5 and 9y^ars, com pared with 35 and 19 per cent respectively in 1976. T heir tonnage o f 15 years and over dropped by 5 per- centage points to 27 per cent.
42. W ith regard to types of vessels, the world tanker fleet has become younger as the percentage o f tankers under 10 years rose by 2 points to 73 per cent, while that o f tankers of 15 years and over declined from 16 to 14 per cent. The âge structure o fth e world bulk carrier fleet continued to deteriorate: tonnage under 5 years dropped from 41 to 37 per cent and there was an increase of 3 percentage points in the age group from 10 to14 years and of 1 percentage point in the tonnage of15 years and over. It is noteworthy that, o f th e three ma)or types of vessels in the world fleet indicated in the table, general cargo ships have the worst age compo- sition.
B. Distribution of the wprld fleet
1. Distribution oftonnage by type ofvessel30. Annex lllg ivesthedistribu tionofw orld tonnage
by flag o f registration and by type ofvessel at mid-1977. The distribution by groups o f countries for different types o f vessels is shown in table 13.
31. In the year ending m id-1977, the open registry fleets, which are generally regarded as beneficially owned by developed market-economy countries, rose from 99.5 million g.r.t. to 109,2 million g.r.t.; tankers and bulk carriers accounted for 74 per cent o f the growth. Th^ national-flag fleets of developed market- economy countries rose from 207.3 m illion g.r.t. to 211 million g.r.t.; m ainly because o f th e 3.4 million g.r.t. increase in the bulk cau-ier tonnage; their tanker fleet declined by 1.2 m illion g.r.t.
32. The share o f the fleets o f developed market- economy countries (including open registry fleet) decreased by 1.2 percentage points to 82.4 per cent of the world total. The reduction applied to all types of vessels except barge carriers, and ranged from 1.8 per- centage points for container ships to 0.3 percentage point for general cargo vessels. Developed market- economy countries own 89 per cent o fth e world tanker and bulk carrier tonnage, 67 per cent of general cargo and 95 per cent o f container fleets. The share of open reg istryfleetsrosebyl percentagepointto28.1 percent, reflecting an increased use o f these flags by operators from developed m arket-econom y countries.
33. Socialist countries o f Eastern Europe and Asia marginally increased their share in the world tonnage from 8.5 per cent in 1976 to 8.6 per cent in 1977. No ma)or changes took place in the structure o f their fleet by types o f ship. The share of these countries remained relatively higher for general cargo ships and the category “other ships” .
34. The fleets of developing countries, including Augoslavia but excluding open registry fleets of the Bahamas and Bermuda, increased from 7.5 per cent to8.6 per cent in term s of g.r.t. and from 6.8 per cent to 7.9 per cent in terms o f d.w.t. Developing countries of Asia accounted for some 60 per cent o fthe total growth ; among them Kuwait, Republic of Korea and Algeria registered the highest increases. As in the previous year, developing countries were less affected by the depressed condition o fth e world freight m arket, particularly o f its tanker section, and their share in the world active fleet in mid-1977 (i.e. excluding laid-up vessels) was greater and am ounted to 9 per cent in term s of g.r.t. and 8.3 per cent in term s o f d.w.t.
35. The percentage share of developing countries in the world d.w.t. tonnage in recent years is indicated in the text table below. The data in the table include Augoslavia but exclude the Bahamas and Bermuda, and therefore are not com parable with the ligures in tables 4 and 13.
36. Developing countries increased their share o f all vessel types from 0.7 percentage points for bulk carriers to 1.8 percentage points for the category “other ships” . Tankers ^nd bulk carriers, prices for which remained particularly attractive for the buyers, accounted for respectively 44 and 22 per cent o f the growth o f the tonnage of theses countries; general cârgo ships
11

Table 13. Percentage shares of world tonnage by type of vessel as at 1 July, 1965,1970,1976,1977 (.In terms ofg.r.t) و
Other shipscarryirigvessels
Containerships
Generalcargoships^
Oreand^bulk carriers including combinedcarriersTankers
All ships oflOO g.r.t. and over
Percentage o f world total
MillionsCountrygroupingandyear
0.20.2
61.3100.0 57 2100.0 53.6
7.0
29.1
2ن9
0.30.60.7
Percentage share by vesseltype146.8 100.0 37.1 11.1 ^ ^ ^ — 31.8•217.9 100.0 39.4 20.2 30.2 0.9367.1 100.0 43.7 24.2 19.6 1.8388.3 100.0 44.7 23.2 19.3 1.9
Percentage share by groups ofcountries 5 74.6 —
90.687.2
- 6 . 71.06.48.0
1.41.3
63.146.946.0
20م20.6
17.416.9
12.014.3
1.1
7.0
61.339.2
20.324.129.1
2.13.74.4
2.13.13.6
0.60.8
23.826.433.733.0
4.34.7
4.34.6
0.30.10.60.6
4.0 4.7
7.0
13.0 18.8
28.1
7.4
8.6
7.37.4
0.32.11.01.2
7.47.0
8.6
World total 1963 . . . .1970 . . . .1976 . . . .1977 . . . .
Developed market- economy countries1965 . . . . . . . . . . . 102.2 69 7 67.)1970 ........................... ........................... 141.1 64.8 63.)1976 . . . . . . . . . . . 207.3 56.5 56.:1977 . . . . . . . . . . . 211.0 53؛.54.3
22.140.999.3
109.2
10.919.5
33.3
10.218.5
28.8
0.71.03.74.5
10.9
Open registry countries1965 .................................................1970 .................................................1976 .................................................1977 .................................................
Socialist countries of Eastern Europe and Asia1965 .................................................1970 .................................................1976 .................................................1977 . . . . . . . . . .
Ofwhich: in Eastern Europe1965 .................................................1970 .................................................1976 .................................................1977 .................................................in Asia1965 .................................................1970 .................................................1976 .................................................1977 .................................................
Developing countries (excluding open registry countries)1 9 6 . 3 .................................................1970 .................................................1976 .................................................1977 .................................................
0.71.0
0.1
0.10.30.3
■0.5
5.4■
■0.7
0.10.2
1.3
1.7
4.34.7
7.4
0.1
0.10.1
1.10.80.7
0.30.50.5
0.10.20.61.0
0.71.7
0.10.30.20.2
0.40.40.71.0
2.92.7
3.7 4.14.8
0.50.50.40.4
0.60.8
4.8 6.49.8
10.8
8.015.018.6
0.1
0.10.1
0.71.21.51.6
ofwhich: in Africa 1965 . . .1970 . . .1976 . . .1977 . . .in America 1965 . . .1970 . . .1976 . . .1977 . . . in Asia1965 . . .1970 . . .1976 . . .1977 . . .in Europe 1965 . . .1970 . . .1976 . . .1977 . . .in Oceania 1965 . . .1970 . . .1976 . . .1977 . . .
Other unallocated 1965 . . .1970 . . .1976 . . .1977 . . .
١١ Ore and bn)،؛ earr؛e^ of 6,000 g.r.t. and above, including combined ore/oil and ore/ bulk/oil carriers.
.Including passenger/cargo vessels (both liner and tramp) ء
Source: Compiled ^ m Lloyd's Register ofShipping: Statistical Tables (London), and supplemental^ ^ t a on the United States Reserve Fleet and the United States and Canadian Great Lakes fleets.
Including United States Reserve Fleet and United States and Canadian Great Lakes ءfleets.

15 years and over
14 T a b l e
1977 s of vessel as at 1 July^؛Age distribution of world merchant fleet b t
.(terms ofg.r.t »ءم،/م،ا/ ١ Percentage)
10-14years
5-9years
،نجاyearsTotal
Country groupingand type o f vessel
20.0
10.844.6
17.6
424
20.613.8
؛أئ
18.6
10.747.7
25.4 22.0
31.5
26.716.8 10.0 45.5
13.118.2 16.2
14.2 12.0 16.817.3
13.612.4201
14.012.1 17.9 14.4
23.026.5
11.320.1
ii30.8
24.8
24.324.331.3 12.7
28.6
35.2
I
47.5 37.0 17.7
37.447.236.6
41.549.5 35.3 19.9
36.216.8
24.426.640.819.7
00000000
00000000
00000000
00000000
00٠٠0000
100 39.0 20.:100 53.0 18.'100 47.7 22.:100 20.1 21.:
1. World totalAll v esse ls ...........................................Tan^rs .......................................Bulkcarriersa......................................General cargo . . . . . . . .
2. Developed market-economy conntriesA l l s l t l p s ...........................................T ankers................................................Bulkcarriersa......................................General cargo . . . . . . . .
3. Open registry countries Allsltips . . ٠ . .T ankers Bulkcarriers^ . . . .General cargo . . .
4. Total: 2 plus 3 Allsbips . . . . .T ankers Bulk carriers» ٠ . . ٠ General cargo ٠ . .
5. Socialist countries of £astetm Europe and AsiaA l l s l t i p s ................................................T ankers.....................................................Bulk carriers»...........................................Generalcargo . . . . . . . . .
6. Developing countries (excluding Cyprus, Liberia, Oman, ?anama. Sin- gapore, and SomaliaA l l s h i p s ................................................T ankers.....................................................Bulk carriers®...........................................Generalcargo ......................................
1 the basis of data supplied by the Shipping Information Services of محمم/ئ’ك Register ofshipping and Lloyd’sSource: Compiled <
.Including combined carriers ء
vessels, except full container ships; tankers and conibined carriers were the nrost affected. Orders for tankers o f 150,000 d.w.t. ^nd over dropped from4.1 million d.w.t. to 1.3 million d.w.t., which accou^ed for 60 per cent o fth e reduction in the total tonnage on order for developing countries; orders for tankers under150,000 d.w.t., declined by about 0.5 million d.w.t. to 0.3 m illion d.w.t. and combined carriers on order decreased from 1.8 million d.w.t. to 1.5 million d.w.t.
46. The tonnage ordered by developed market- economy countries and open registry countries dropped from 84.9 million d.w.t. to 51.4 m illion d.w.t. and their combined share in the world orders declined from 8^ per cent to 78.1 per cent. The tonnage on order for these groups o f countries decreased for all types of vessels except for part container ships, ro-ro ships and LASH ships. Drders for tankers of 150,000 d.w.t. and over dropped by 18.3 million d.w.t. and for bulk carriers by7.7 m illion d.w.t., accounting for 78 per cent o f the reduction in the tonnage on order by the two groups of countries.
47. Socialist countries increased their orders by 0.6 million d.w.t. to ^.9 million d.w.t. ; their share in the world tonnage on order rose from 2.2 per cent to 4.4 per cent.
43. The im provem ent o fthe age com position o fthe fleet o f developing countries was particularly marked in tankers. T heir tanker tonnage under 5 years increased from 48 to 53 per cent and in the age group from 5 to 9 years it rose by 1 percentage point ; the share of tankers from 1 ه to 14 years increased from 8 to 11 per cent, while tonnage of 15 years and over dropped from 26 to 17 per cent. The age composition o f their bulk carrier heet has deteriorated; tonnage under 10 years declined by 6 percentage points to 70 per cent and the share of bulk carriers from 10 to 14 years increased accordingly.
3. Distribution oftonnage on order44. The distribution of the world tonnage on order
in 1975-1977 by types ofvessels and groups o f countries is shown in table 15.
45. The tonnage o f ships ordered by developing countries decreased from 15.3 million d.w.t. on 30 Sep- tem ber 1976 to 10.6 million d.w.t. a year later. During this period, the world order book dropped further by37.7 million d.w.t. to 65.8 m illion d.w.t. As a result, the share o f developing countries in the total tonnage on order rose from 14.8 per cent to 16.2 per cent. The tonnage on order by developing co u ^ ries declined in the 12 m onths ending September 1977 for all types of
13

Table 15
World tonnage on order as at 30 September 1975-1977
Tankers, Tankers, Ore/oil اءه؛ء Full Pan Ro/roCountry grouping All I50,000d.w.t. under ، »،ءا مءممح«ا container container cargo LASH Other
andyear ships andover 150,000d.w.t. carriers carriers ships ships ships ships ships
Million d.w.t.
1. World total1975 165.3 87.1 27.4 7.2 25.3 2.2 — 1.1 — 15.11976 103.5 38.7 12.3 5.5 25.0 2.3 0.1 1.2 0.07 18.41977 . . . . . . . . . 6 5 . 8 17.2 7.4 3.2 17.6 1.9 0.3 1.6 0.1 16.5
Percentage share by type ofvessel
1975 100 52.7 16.6 4.3 15.3 1.3 — 0.7 — 9.11976 100 37.3 11.9 5.3 24.2 2.2 0.13 1.1 0.07 17.81977 . . . . . . . . . 1 0 0 26.2 11.2 4.9 26.7 2.8 0.5 2.4 0.2 25.1
Percentage share by country grouping2. Developed market-economy
countries1975 52.9 54.1 47.1 55.3 52.3 83.5 100.0 65.0 — 51.01976 56.0 61.5 58.0 38.1 52.7 80.3 35.3 67.6 — 49.6
3. Dpen registry countries1975 34.8 38.6 42.7 11.1 33.0 14.8 — 9.6 — 17.71976 26.0 27.0 29.1 20.2 30.2 13.6 — 1.0 — 21.21977 . . . . . . . . . 2 1 . 5 26.2 25.7 10.8 24.4 22.5 10.2 3.5 25.2 15.4
4. Total(2 + 3)1975 87.7 92.7 89.8 66.4 85.3 98.3 100.0 74.6 — 68.7
1977 . . . . . . . . . 7 8 . 1 92.5 85.5 39.3 74.0 91.1 78.5 76.5 25.2 70.6
5. Socialist countries total1975 1.1 — 3.3 1.5 0.8 — — 22.5 — 2.11976 2.2 — 4.6 8.4 1.8 0.8 16.2 23.1 100.0 2.21977 . . . . . . . . . 4.4 — 8.4 14.4 4.6 1.4 5.4 17.7 74.8 3.7
O f which: in Eastern Enrope1975 1.1 — 3.3 1.5 0.8 — — 22.5 — 1.81976 2.1 — 4.5 8.4 1.5 0.8 16.2 23.1 100.0 2.01977 . . . . . . . . . 4.2 — 8.3 14.4 4.3 1.4 5.4 17.7 74.8 3.2
in Asia1975 — — — — — — — — — 0.31976 0.1 — 0.1 — 0.3 — — — — 0.21977 . . . . . . . . . 0.2 — 0.1 — 0.3 — — — — 0.5
6. Developing conmriestota?1975 10.8 6.9 6.5 32.1 13.4 1.7 — 2.9 — 29.01976 14.8 10.6 7.2 33.3 14.2 4.2 48.5 5.5 — 25.71977 . . . . . . . . . 1 6 . 2 7.5 4.7 46.3 19.9 6.3 16.1 3.5 — 23.1
Ofwhich: in Africa1975 1.2 1.2 1.1 — 0.1 — — 1.1 — 4.31976 1.7 2.6 0.6 — 0.2 — — 2.4 — 3.31977 . . . . . . . . . 1.4 — — — 0.9 — — 0.6 — 4.8
in America1975 4.8 1.6 3.1 22.1 8.8 — — 1.6 — 12.41976 7.1 2.9 4.8 24.4 10.5 2.1 48.5 0.4 — 8.51977 . . . . . . . . . 9.6 6.6 4.3 38.5 13.9 1.7 16.1 1.8 — 6.4
in Asia1975 4.8 4.1 2.3 10.0 4.5 1.7 — 0.2 — 12.3
1977 . . . . . . . . . 5.2 0.9 0.4 7.8 5.1 4.6 — 1.1 — 11.9
in Dceania1976 — — — 0.1 — — — — —
7. Dtbernnallocated1975 0.4 0.4 0.4 — 0.5 — — — — 0.21976 1.0 0.9 1.1 — 1.1 1.1 — 2.8 — 1.31977 . . . . . . . . . 1.3 — 1.4 — 1.5 1.2 — 2.3 — 2.6
Source: Compiled on the basis of information pm^ided by Shipping Information Services ء No tonnage on order for developing conntries of Europe and Oceania in 1975 and 1977.ofLloyd's RegisterofShipping and Lloyd’s ofLondon Press Lid.
14

Chapter III
SHIPBUILDING •“
world order book 3tood at 42.2 million g.r.t. as against 62.4 million g.r.t. a year earlier; 56 per cent o f the tonnage on ordef was nnder construction com pared with 23 per cent at the end o f M arch 1974, when orders reached their peak level, ^nd 49 per cent at the end of the third quarter of 1976. Over 77 per cent o f the world order book was scheduled for delivery by the end of 197b.
49. Tables 17 and 18 show the distribution of deliveries of new buildings and tonnage on order by groups o f countries o f build in recent years.
Table 17
Distribution of deliveries of new buiidings by groups ofcountries of bui!d, 1970 und 1975-1977
(Thousands ofg.r.t.Y
1977Jan.-Sepi197619751970
18 354 (92.0)
817(4.1)664
114(0.6)
30 451 (89.8)1 501 (4.4)
(5.6)
(0.2)
(92.3)851
؛',ة(4إث
(0.3)
19 570 (93.3)
144(0.7)
1 176 (5.6)
90(0.4)
20980 34202 33 921 19949
(Thousands ofg.r.t.Y
197719761975)970
33 846 (80.2)5 297 (12.5)2 320
749(1.8)
53 449 (85.6)6081(9.8)
2 251 (2.6)645
(1.0)
83 351 (89.9)6 374 (6.9)
1936(^. ١)
1081(1.1)
67 063 (96.2)
884(1.3)
175(0.2)
69 714 92742 62 426 41212
48. During !977, the wcrld’s shipyards delivered abcut 2,53© vessels with a tcta! tcnnage ©f about 26 million g.r.t., i.e. 6.6 million g.r.t. less than in 1976. Table 16 shows the num ber and tqnnage of ships completed in recent years by types' of vessels. As indicated in the previous chapter, the world order book decreased further on account o f heavy deliveries and the continued low level of new qrders for tankers. Cancel- lations of tanker orders also contributed to the decrease.•• The annual intake of new orders for tankers and dry cargo vessels has dropped since 1975 to about 13 m illion g.r.t. com pared with the world production of 26 million g.r.t. in 1977. As at 3© Septem ber 1977, the
Developed market- economy countries
Developing countries
$ocialist countries . .
Other unallocated. .
World total
>٠ Unless otherwise stated, the discussion in this chapter is based on data covering ships of 100 g.r.t. and upwards, published in Lloyd’s Register ٠/ Shipping: Merchant Shipbuilding Return (Tondon), various issues, ?ercentage shares have been derived from figures in terms ofg.r.t. The data from this source exclude ships on order with or delivered from yards in the USSR, Romania and China.
"A n estimated 2 million d.w.t. were cancelled in 1977 as compared with 11 million d.w.t. in 1976 (?earnley and Egers Char- tering Co. Ltd., Review 1977 (Oslo), January 1978, p. 5).
Table 16
Deliveries of new buildings, 1970 and 1975-1977(Number ofships and thousands ofg.r.t./d.w.t.)
Source: Compiled on the basis of data eontained in Lloyd's Register ofShipping: Merchant ShipbuildingReturn (London), various issues.
.Figures in parentheses indicate percentage of world total ء
Table 18
Distribution of tonnage on order by groups ofcountries of build, 1970 and 1975-1977
Developed market- economy countries .
Developing countries
Socialist countries . .
Dther unallocated . .
World total
ءا7هم 1975 1976 1977
Tankers Number . . . .g.r.t...........................d.w.t. - - - - -
,ة45 689
356 19 753 39 378
271 9 737
19 698
Bulk/oil carriers Number - - - -g.r.t...........................d.w.t. . . . . . .إ1
18 1253 2 332
>ةقء564 2
Ore and bulk carriers Number - - - -g.r.t...........................d.w.t. - - - - -
199b5313b
196 4 458 7 731
272 6 468
11 124
354 7 423
Oeneral cargo ships، Number - - - 487
3513356
2 635379
3 352 قا؛ءOther ships
Numher . . . . g.r.t...........................
16771627
1 5662 327
1416 2 252
1351 764 2
Total Number - - - 2619
2©3192 441
33618536 2 375 26
Source: Compiled on the basis of data contained in Lloyd’s Register o f Shipping: Merchant ه>اااء،؛ا/ه«'،ء Return (London), as at the end of the third quarter of each year,
.Figures in parentheses indicate percentage of world total و
Source: Compiled on the basis of dam contained in Lloyd’s Register ofShipping: Merchant Shipbuilding Return (London), various quarterly issues.
. No deadtvei^ht figures are available for ء وا7م .nctudebu])،/o!i carriers؛ Figures for 1970 ءأ.Vessets of2,000 g.r.t. and over ء

expected to reach $1.2 billion as against $347 njillion in1976. Brazil has also plans to expand its shipbuilding by about 18 per cent in terms o f steel throughput by 198B. The shipbuilding industry o f the R epublic of K r e a is export-oriented: in 1976, some 90 per cent of the tonnage constructed in the country was for the account of foreign shipowners. T hat o f Brazil relies mostly on the home market, and exports are estimated at about 10 per cent. However, despite the progress made by some countries, the shipbuilding capacities of developing countries as a group remain insufficient to m eet their needs.
$2. Throughout the ye^r, discussions continued on the two inter-connected issues which were the subject of controversy during the previous year, namely, that of reducing world shipbuilding capacity, and that of harmonizing the conditions under which shipbuilding countries are competing with each other. OECD con- tinned to be the m ain forum for discussions between the two m ajor competing, developed market-econom y ship- building regions. However, no general agreement has been reached.
53. Most o f th e developed m arket-econom y coun- tries have restraihed any expansion of their shipbuilding activities, partly in recognition o f the general over- capacity, and partly on account ofthe lack of orders, but com petition between these countries appears to be frustrating agreement on any over-all plan to reduce existing capacity to ^ny significant extent.
50. Shipyards o f developed m arket-econom y coun- tries accounted for 90.9 per cent of the tonnage completed during the year ending 30 September 1977 (compared with 92.8 per cent during the preceding 12 months) ^nd 80.2 per cent o fthe world order book as at the end of September 1977 (compared with 85.6 per cent a year earlier). Shipyards o f Japan accounted for43.6 per cent o fth e tonnage delivered (compared with 50.2 per cent in the preceding 12-month period) and29.1 per cent o fth e world order book (compared with32.6 per cent in September 1976).
51. Jn September 1977, 23 developing countries were engaged in shipbuilding activities com pared with 21 countries a year earlier. In the year ending 30 Sep- tem ber 1977, the yards ofdeveloping countries delivered1.4 m illion g.r.t. (5 per cent o fthe world total) as against1.3 m illion g.r.t. (3.8 per cent o fth e world total) in the previous 12 months. The combined share of developing countries in the world order book increased from 9.8 per cent to 12.5 per cent, although in terms o ftonnage it declined by 0.8 m illion g.r.t. The Republic ofK orea and Brazil accounted for 57.8 per cent and 29.7 per cent respectively of the tonnage completed by developing countries during the year ending 30 September 1977 and for 19.8 per cent and 57.6 per cent o fth e order book of the yards of this group of countries. The Republic of Rorea has announced plans to increase its annual shipbuilding capacity from 2.77 m illion g.r.t. in 1977 to 4.25 million g.r.t. in 1981, when ship exports ^re
16

Chapter IV
WORLD SHIP PRICES
rem ained at the previous ؛(ear’s levei whiie those for the OBO, the 120,000 d.w.t. bul^ carrier and large-si^e tankers declined from 6 per cent to 20 per cent; price movements for LNG and LPG carriers followed differ- ing pâtterns. New building prices were generally some 25 percen t to ^5 per cent lower than peak level prices in1973-1974; prices for 87,000 d.w.t. and 400,000 d.w.t. tankers were more than 40 per cent lower.
A. Changes In prices of new vessels
54. As can be seen from table 19, prices for new buildings have either remained constant or decreased moderately, according to the types o f vessels. This is in m arked contrast to the price decreases which occurred in 197b. Prices for bulk carriers up to Panam ax si^^, the 87,000 d.w.t. tanker and the 5,000 d.w.t. ro/ro.
T able 19
Representative new building prices, 1970 and 1973-1977(Prices in millions ofdollars at year end)
19771976197519741973<67!)
11.015.016.0 16.0 21.0 22.032.045.0
115.040.010.0
11.015.016.0 16.023.024.034.0
105.042.010.0
18م20.022.030.032.0
62.0125.052.0 16.2
16.5 20.025.0
33.035.042.065.0
125.052.014.6
12.017.520.525.029.031.047.078.0
105.045.0
l a o
17.023.0 17.231.0
30 ООО d.w.t. bulk . . . 30 ООО d.w.t. product tanker 70 ООО d.w.t. bulk . . . 87 ООО d.w.t. tanker . . 96 ООО d.w.t. ©R© . . .
120000d.w.t.bulk ٠ ٠ . 210 ООО d.w.t. tanker . . 400 ООО d.w.t. tanker . ٠ 125 000 nr^TN© . . . . 75 000 m^T?© . . . .
5 ООО d.w.t. ro/ro . . .
and Egers Chartering Co. L t d . , .January 1978, table 16 ,(Oslo)وثم77
60.000 d.w.t. bu ih in 963/65 ا and of ^00,000-300.000 d.w.t. bu ih in !969 and iater were most affected. Increased interest was shown, however, in tankers o f 70,000-90,000 d.w.t. for trading from the
Ta b l e 29
Estimated prices for new and read lin er-t^ vessels of 11,000/13,000 d.w.t.,10?0 and 1 ?و3-1و??ة
Mid-year
Pricesfor constructing new vessels
!thousands o f ponds sterling)
Changeoverpreviousyear(percentage)
1970 . . . . . . . . 1 350 12.51973 ................................. 2 250 18.41974 ................................. 3 500 55.61975 ................................. 3 950 12.91976 ................................. 4 200 6.31977 ................................. 4 600 9.51977 (31 ©ecember) . . . 4 700 2.2ط
Source: Fairplay International Shipping Weekly (London), ^ol. 265, No. 4294, 19 January 1978.
© The data refer to a hypothetical ء ^ c lo se d shelter-deckr ofT 1,000/13,000 d.t^.t., propelled bya7,000b.h.p. diesel engine ^i^in^aspeed oflSknots. The ship is ؛or deliver؛( within the year and the ^doted price does not include interest on loans.
.Increase o^er ntid-1977 ءآ
55. The new-budding price for the hypotheticai buik carrier o f about 25,000 d.w.t. rose from £6 m idion in lu n e 1976 to £6.6 million in lu n e 1977 and £6.8 mil- lion in Decem ber 1977 or by 13.3 per cent.‘؛ The price o fth e liner-type vessel, indicated in table 20, shows an increase d f 9.5 per cent between mid-1976 and mid-1977. Prices for both types of ships showed smaller increases in the second half o fth e year.
B. Changes ؛n prices nf second-hand vessels
56. Second-hand tanker values decreased again in 1977 as a result o f continued depressed conditions in tanker shipping. As indicated in table 21, prices for second-hand tankers as at the end of 1977 dropped by between 20 per cent and 45 per cent com pared with the previous year and represented only 10 per cent to 20 per cent of their peak level in 1973; tankers o f 50,000/
This is a hypothetical 16-kuot bulk carrier powered b^ a 9,000 horse-power 4irect-couple4 4iesel engine, as reported in Fair- play International Shipping Weekly (London), vol. 265, No. 4924؟ 19 January 1978, p. 77. Th^ pdces are reported to be basic prices and do not include any escalation clauses. It is assumed that the vessels would be delivered within the year.
17

due to massive deiiveries of bulk carriers and general eargo ships, noted in chapter III above, which depressed freight rates and also second-hand values. Thus, prices for second-hand dr؛? bulk carriers and liner t؛?pe vessels as at the end o fl9 7 7 , shown in tables 22 and 23, dropped b .about 40-55 per cent as against 1976 levels ?؛
Caribbean to ports o fthe Elnited States o f America, and b؛? Am erican oil companies in m odern m otor-tankers of about 130,000 d.w.t. ; prices for these categories of ships declined to a lesser degree.
57. The decline in second-hand prices for dr؛? cargo vessels accelerated in 1977. To a large extent, this was
1977
Table 21
Tankers: second-hand r؛ces, a^era e values, 1970 and 1 9 7 1 9 7 و-7
{Prices in million ofdollars at end ofyear)
19761975197419731970Builtd.w.t.
0.81.01.22.02.4
5.0
lo!o
1977
2.9مو1
2 0 0 0 0 . . . . . 1959/602 5 0 0 0 . . . . . 1958/593 5 0 0 0 . . . . . 1958/595 0 0 0 0 . . . . . 1963/646 0 0 0 0 . . . . . 1964/658 0 0 0 0 . . . . . 1966/67
100000 . . . . . 1967/68150000 . . . . . 1974/752 0 0 0 0 0 . . . . . 1969/702 5 0 0 0 0 . . . . . 1972/7330 0 0 0 0 . . . . . 1971/72
Source: Feamley and Egers Chartering Co. Ltd., Review I977(Os\o), January 1978, table 19.
T ^ L E 2 2
Dry bulk carriers: second-hand prices, average vaines, 1970 and 1973-197?
(Prices in millions ofdollars ،،؛ end ofyear)
آ«ء/ء1975197419731970ه/ءا
18 000 . . . . . 1963 2.8 4.5 4.8 3.525 000 . . . . . 1966 4.8 6.5 7.2 6.035 000 . . . . . 1965 6.0 8.0 9.0 6.55 0 0 0 0 . . . . . . 1967 9.0 11.5 13.0 7.06 0 0 0 0 . . . . . 1972 11.0 17.0 17.0 10.5
Source: Feamley and Egers Chartering Co. Ltd., Review وا/7(اءه0ر , January 1978, table 18.
Table 23
Liner-^pe vessels: secnnd-hand prices, average vaines, 1970 and 1973-1977(Prices in millions ofdollars at end ofyear)
d.w.t. Built م/ءا 1973 1974 1975 ءا76 /ءا7
6 600 . . . , 1958 1.0 1.1 1.5 1.3 1.2 0.712 500 . . . . 1956 1.5 1.5 2 .2 1.7 1.4 0.713 500 . . . . 1ؤ59 1.7 2. 1 3.1 2. 6 2. 0 1 . 016000 . . . . 1963 3.0 3.4 4.5 4.0 3.8 2.1
.18 77(Oslo), Jannary 1978, table/؛؛vretv؟؛CharteringCo.Ltd.,J؟FeamleyandEgei؟.'S،>Hrc,
18

Chapter V
FREIGHT
single-voyage ft^tnres reaehefl 273 ^Tillion tons, or ahont 33 per eent птоге than in the san^e periofl o f 1976, while elean single-voyage fixtures rengaine© on the level o f 1976 anfl am ounted to 16 n^illion tons. The single- voyage clean marl؛et was quite active in the first quarter o f the year, owing to heavy spot chartering to the ports of the Dnitefl States o f Am erica to ©over the den^anfl for heating oil c^usefl by an unexpeeteilly eol© winter. Tbus, in February, the flxtures to N orth Am eriea reachefl 72 per eent of the total volunre of single voyage ©lean business reported in tbat m onth, as against 2© per cent in Decem ber 1976.
63. The am ount o f inbepenflent tanl؛er tonnage unber period tim e charter decline© from about 121 mil- lion d.w.t. in September 1976 to approxim ately 93 mil- lion d.w.t. a year later, or from 63 per eent down to 47 per eent o f the total fleet of independent tanl؛er owners. Charterers evidently switebed to single-voyage ©overage on the expiration o f period tim e ©barters whieh had been eoneluded at higher rates no longer prevailing on the marl؛et.
64. Taking into aecount the laid-up tonnage as well as slow steaming, the tanker surplus was estimated at about 1©8 million d.w.t. in Novem ber 1977 as compared with 6© million d.w.t. at the end of 1976. The am ount of laid-up tanker tonnage was decreasing until A pril 1977, when it reaehed, aeeording to the General Council of Rritish Shipping, 26.8 m illion d.w.t., i.e. the lowest figure sinee M ay 1975. Thereafler, the trend was reversed and in Gctober the figure stood at 37.4 milliond.w.t.; it declined again by some 6.3 m illion d.w.t. in November, mainly due to the absorption by the m arket ofV L C C and ULCC.
65. A bout 57 per eent oftheactiveeom binedcaiT ier fleet was engaged in oil trading during the period January-^eptem ber 1977, eom pared with 52 per eent in 1976, wbieh refleets the deterioration of dry eargo m arkets for this type o f tonnage.
66. A eeordingto most foreeasts for tbe tanker freight m arket, tanker surplus is likely to continue until 1983- 1985.'^During the surplus period, inereases in transpor- tation demand will be met by eliminating slow steaming, absorbing new building tonnage, reaetivating the laid-up fleet, progressively utilizing tbe Suez c^n a l, reactivating or increasing the throughput of existing pipelines and phasing in of newly built pipelines.
A. General developments
58. The eeonomie recession in developed market- eeonomy eountries and the world surplus o f tankers ^nd bulk carriers were the dom inant factors whieh influenced the m arket in 1977، The increased supply of tonnage noted in ehapter II above was not matched by a corresponding expansion o f dem and for shipping services, resulting in a generally weaker freight m arket tb a n in l9 7 6 .
59. In the dry eargo trades, the initiative was with the eharterers, who eould choose tonnage and dietate the style of ©bartering. The volume of eontraet business and period time charter reported on the m arket in the first three quarters of 1977 was eonsiderably less than in the same period of 1976, although period tim e ©barter revived from July onwards, mainly because owners wanted to fix before the m arket deteriorated further. T rip ©bartering increased again and was particularly popular with the eharterers to sueh destinations as the ?ersian Gulf, the Red Sea and China. T im e ©bartering of bulk carriers for round voyages for the carriage of grain from N orth and Soutb Am eriea with delivery and redelivery in Europe was one ofthe features ofthe period under review. Congestion and delays which a^eeted ships in m any ports of the world continued to be a firming faetor on the markets.
6©. G rain aeeounted for about 7© per eent of the reported single-voyage fixtures for the period January- Septem ber 1977 as against 6© per eent for the same period on 1976. Loadings in ports o fthe U nited States of Am erica in the G u lf o f Mexieo aeeounted for about 49 per cent o fthe single voyage grain business eom pared with 56 per cent in the first three quarters o f 1976, while . those o fth e River Elate increased from 4 to 11 per eent because of an exceptionally good harvest in Argentina. As a result o f recessional conditions in the steel industry o f developed market-eeonom y countries, the volume of iron ore and eoal flxtures declined from 29 per eent of the reported single-voyage fixtures for the period January-Septem ber 1976 to 17 per eent for the same period of 1977. Large bulk carriers and eombined carriers were the most alfected.
61. According to the General Couneil of British Shipping, as at 3© September 1977 laid-up dry cargo tonnage am ounted to 1©.5 m illion d.w.t. com pared with5.4 m illion d.w.t. a year before; com bined carriers aeeounted for 54 per eent o fth e total.
62. In the bulk liquid trades during the period January-Septem ber 1977, the volume o f reported dirty
"See, for instance, OECD, Maritime Transport, 1976 (?aris), pp. 31-32 ; Norwegian ShippingNews(Os\o), No. 17D, 16 September 1977, p. 14 ; Sea trade (Colcbester, U.K.), vol. 7, No. 4, April 1977, pp. 41anri 43.
Unless Otherwise stated, paras. 66 and 62-65 ofthe present review ؛؛are based on data contained in H. p. Drewr؛ (Shipping Consultants) Ltd., Shipping Statistics and Economics (London), varions issues.
19

ح8 ilم
û o
ق ء و
1 1 1
م 0\لم0ه5ممص• ي 0 ء0 بمم0دم ^ ا ٠٠ م ل ء - م ب م ح ر م ء م م ب م ب م م ب م ا
ص
و
о٠
Osي
م ص ^ ! م ا ا о 00 00 ؛ ON
و؛ ء آ ؛ و ق ت م ت ت ت ت ت ت
0 م0 0ق^\ت 0 0م500 00 0
' m 00 о -■١٥ ٠ 00 ■ ١ ب ٠٠ ٠٠ ٥٠ يم ٠٠ ا
ه ص ه ب ه ن ب م إ س س م ي >ا
و; م!ؤ ؤ م أ و و إ ;و
،n m ^ t f N T f f S O O c o O N '
م إلا م ص©اي م ن، ب ي ام<N( N< N< N< Nr 4 ï N< N( N
م أ م س م م م م،م إ ح ؟ ج م ا
0،اح000 0 5 0
ي ص م"ي ص، م ل م ي ن ب ء م م ب اح
0\00 — 0^\يم00 00دمءلمءبمء0
'١٥'00،بمء0005يميم0ها00ها
،٠٠
٠٠٠00
ح م و و وو ج ج ج |وج
0 0 0 0 0 0 0 0 0 0 0 0
I Iر Jlilflilllil' ؤ و
ة |ق
ijjو ى
I
20

1974-1977. Annex V and table 25 do not Include port congestion surcharges b؛? liner conferences.
B. Changes In freight rates in f9 7 7 ‘
69. 135 changes in freight r^te surcharges were announced in 1977 com pared with 116 in 1976. The num ber o f straightforward liner freight rate increases was higher in 1977 ( 160) than in the preceding two ؛?ears (130 and 149 respective!؛? in 1975 and 1976). However, 46 per cent of these were under 10 per cent as against 39 per cent in 1976 and onl11 ?؛ per cent .in 1975.
70. In 1977, there were no m ajor changes in bunl؛er prices. As a result, the num ber of changes in regard to bunker surcharges remained relativel؛? small.
71. Simple averages o f increases ^nd decreases of surcharges in percentage points during the period 1975- 1977 were as follows;
1. Dry cargo tramp m arket freight rates
cargo tram p indices, both time and trip 67?؛. D r charter, re jected depressed conditions and relative
o?؛ fth e tram p m ark etd u rin g l9 7 7 ,w ith g en era ll ؛?stabilit higher rates in the first and last quarters. On average, the tim e charter index was 19 points lower than in the
ear as a result o?؛ f a decreased interest shown b؛? previous charterers in period fixing; indices for each o fth e main
average ؛?size groups are indicated below. The m onthl less than in ؛?m arginall ؛?for the trip charter index was onl
1976. Annex IV o fth e present review gives m axim um age rates for؛?and m inim um levels for selected single vo
.1974-1977
Cargo linerfreight rates
1977
Decrease^'
1.871.63
3.77
19761975
Increase^ Decrease*) Increase^
1.371.0
2.20
— 37.20 — 23.87 —
1.10
36.2
Type o f surcharge
Bunker . . Suez Canal Others،؛ . .
68. During 1977, the liner freight index of the of Transport o f the Tederal Republic of ؛?M inistr
14 points to reach 232 points in ؛?rose b ؛?G erm an December, com pared with an increase o f 12 points in
1976. Annex V o fth e present review shows changes in Table 25 gives ،١.liner rates and surcharges during 1977
ears؛? of these freight rate changes for the ؛?a sum m ar
Source: Annex ٧ o f /<، present review and corresponding annexes in the Review ء>ااmaritime transport prepared by the UNCTAD secretariat for earlier years.
» Including new surcharges.ء Including concellations of surcha^tes..mndling; terminal pori charges; landing, storage and delivery chafes, stevedoring, etc ؛،
Discussion in (his section is based on the table 24 on 1؛20.
■، Information eoncernin§ changes of currency adjustment factor is given in ^D/B/C.4/178/Add. 1.
Time charter frei^t rate index for different tonnageا
(1976 = 100)
Total85,000
andoverس,مل-
84,999d.w.t.35.000-
49.999d.w.t.20.000-
34,999d.w.t.12.000-
I9,999d.w.t.
ChangeSubindex
Change Change ءء«هااء Change ChangeSubindex (percentage) Subindex (percentage) Subindex (percentage) Subindex (percentage) Subindex (percentage,
Yearمح«ه
quarter
+29.6
+1.0
+1.9
-25.0
-3.7
+7.7
81
105
106
108
81
«١
78
+77؛.
؛.!+
63
114
61
+59.7
-9.6
+1.9
-35.9
+1.5
-18.8
+32.1
104
106
69
56
74
+24.7
+8.9
-33.6
+11.0
+1.2
+3.6
81
101
110
110
81
+13.8
+5.1
-19.5
8 7
104
108
87
87
!9761st quarter 101
2nd quarter 92-9.0
3rd quarter 107+16.3
4rd quarter 105-1.9
19771st quarter 110
ب4.8
2nd quarter 89-19.1
3rd quarter 105+18.0
4th quarter 111+5.7
Source: Based on the time charter index numbers compiled by the General Council ofBritish Shipping.

T able 25
Summary of liner freight rate changes and surcharges announee<l during the period 1974-1977
Number affreight rate changes^
Typeoffreightratechange 1974 1975 1976 1977
© enem l increase in freight t a r i l f s ١ 42 135 ١ 44 163© eneral freight increases partly offset by incorporation
in the tariffs o f part o r all o f the pre-existings u r c h a r g e s ............................................................................ 4 2 13 11
A nnonncetnents o f new snrcharges o r o f increases inpre-existing sn rc h a rg e s ....................................................... 181 56 55 73
B n n k e r ....................................................................................... 168 28 40 44© thers (preshipt^ent, entergency, handling, landing,
storage, e t c . ) ....................................................................... 13 28 15 29
Subtota l 327 193 212 247
61 62
312281
11
120
131
324
16
35
105
©ases where pre-existing surcharges were incorporated in to tariffs through corresponding increases in tariffs
©ases where snrcharges were reduced or cancelled w ithout being incorporated in tariffs . . . . . .
B u n k e r .......................................................................................Suez © a n a l..................................................................................© thers (preshipnrent, emergency, handling, landing.
Subtotal
T d t a l
هك^،،ء .■ Compiled on the basis 0( annexes V and VI 0( the present revie«; and corresponding annexes or tahles in the Review ٠/ maritime transport prepared by the UNCTAD secretariat for eariier years.
٧ The number of freight rate and surcharge changes summarised is greater than the number of announcements shown in annex وof the present review a^d corresponding annexes in the previous review because, as in previous years, in severa! cases one announcement carried more than one change.
Summary of straightforward increases in freight tariffs announced in f97^, f976 and 1977 و
ه/ءا1977
Number Percentage ofincreases oftotal
1975
Number Percentagiر/م>ءا^كءتمء oftotal
Number Percenta, ofincreases oftotal
Size o f increase (percentage)
2ه.ه23.7 19.4 16.9
3.7
100.0
432
312722
160
0.614.8 18.120.8 17.4
10.1
ي2619
100.0149
0.8
6.123.118.5
m l
100.0
302449
130
U nder 5 - - - -5 and less than 7.5 7.5 and less than 10
10 and less than 12.5 12.5 and less than 15 15 and less than 20 20 a n d o v er . . .
Source: Annex v below and corteapondin^ annexes in the Review م«/ها'«اء>ءاء ،ا-مءءااه « pmpated by the UNCATD sectetaeiat for previous years.
Excluding announcements whieh (i) reterred to a flat increase in terms of an absolute amount per unit of ea^o (4 in 1977 as ءagainst 11 in قا7ؤ and 4 in 1975); (ii) did not specify the percentage amount ofthe incmase (13 such announcements in 1977 as against 5 in 1976 and 1 in 1975).
22

centfrom 234(1968 = 100)a tth een d o fS ep tem b erl9 7 6 to 254 a year later, as com pared with an Increase of5.7 per eent during the preceding 12-nTonth period.
D. Liner freight rates as a percentage nf prices of select© eonnnodities
74. Table 27 shows the ratio o f liner freight rates to export priees o f 12 prim ary commodities exported from developing countries to Enrope dnring the period 1964- 1976. In 1976, prices for these com m odities— exeept tea, coconut oil and sisal hem p— increased; the increases were particularly high for coffee, cocoa beans from G hana and rubber and ranged from 65 per cent to 134 per eent. A t the same time, freight rates either declined or rose moderately, except for the rate for palm kernels. As a resnlt ofthe interplay ofthe two faetors, the ratio of liner freight rates to prices for most o f the commodities indicated in the table declined; the excep- tions were palm kernels, for whieh freight rates increased by 36 per cent, and sisal hem p, the priee of whieh dropped by 27 per eent.
3. Tanker freight rates72. VLCC/ULCC freight rates experiences pressure
from spot tankers o f these sizes available in the ?ersian G u lf During the M ay to July period, aeeording toE.A. Gibson ^hipbrokers Ltd., London, sueh tonnage am ounted to some 5 to 6 million d.w.t. Poor market conditions for VLCCs and JJLCCs depressed rates for medium-size ©rude ©arrière. The sharp increase of indices for small ©rude and produet carriers and for handy-size tankers in February was eaused by the active ©bartering o f spot tonnage at high rates to the Llnited States o f Ameriea. ^ o r all sizes, freight rates were higher in the first and the last quarter o f the year owing to seasonal faetors.
c. Freight rate indices of selected commodities exported hy deveioping con^ries
73. The up-dated freight rate indiees for four selected eommodities, as well as the com bined index, is shown in table 26. The eombined index rose by 8.6 per
Iges in freight ratios
(Percentage)
!975-19761964-1976
DecreaseIncreaseIncrease
t-u .4
+34.4
—12.5-5.7 -8.8
-16.2 -54.6-25.6 -22.6-28.6 4 7 .4-28.9 -49.2
بى5م2 -56.6
Palm k e rn e ls ........................................... +198.9J n t e .......................................................... +119.5Sisal hemp ........................................... +164.8R u b b e r..................................................... +48.7T e a . ٠٠ ........................................... +47.7T i n .......................................................... +16-7€ © c o n u t© il...........................................Coffee (from B r a z i l ) .............................Co№a beans (from Brazil) . . . . .Coffee (from Colombia-Atlantic ^orts) ٠ Colfee (from Colombia-Pacific ports)Coeoa beans (from Chana) . . . . .
T able 26
Indices of freight rates of selected commodities exported by deveioping countries, 1975-1977
(E nd ofquarter: 1968 = КЮ)
Combinedindex
Commodity
TeaRubberCottonCocoaYear and quarters
247.1 219.8 239.3243.9 262.2 233.1229.5 191.4 221.5237,4 184.6 236.3
248.2 183.9 233.3246,3 179.1 231.2249,2 178.6 234.1247,3 186.4 241.1
256,5 195.3 256.1245.2 199.6 256.7257,1 262.4 254.3
244.5241.3
244.1
24ق.ا241.6
256م
269.2
19751st quarter . . . . . 243.22ndquarter . . . . . 241.73rd quarter . . . . . 234.24th quarter . . . . . 252.3
19761st quarter . . . . . 258.62nd quarter . . . . . 258.73rdquarter . . . . . 264.64th quarter . . . . . 288.6
19771st quarter . . . . . 298.62nd quarter . . . . . 295.23rdquarter . . . . . 289.5
he GovemmeWs or؛ by ١aأ١UNCTAD se٠٢٠١a ١١١٠ 0؛آ!es suppiie؛a and f r e i^ m؛mde da)؛basis o ١١١٠ Compiled on .•هك٢ءءء« /٠ s: Anm al Bulletin؟ih؛a؟b]i؛؛he following p؛ a froin؛o>^l, and ofiiade da؟s and shipping lines conc؟rade eon%rene؛
t،e^ (London), various Issues; Secretariat o fthe International Rubber Study Group, Rubber؛Stattslks, In،erna،!ona! Tea Comm -Rome), varions issues; International Cotton Advisory Commit) ,ا،مءهء ءء'اءءرممع ,London), varions issues; FAO) <],ءآمم(ك،سا/ء//»اءء
23

Table 27
Ratio of liner freight rates to prices of selected co^^!odit؛es, 1964,1970 and 197^-1976
Freight rate as a percentage ofprice ء ' ^
197319701964RouteCommodityوا7ءنجءو/وث/و76ء
1.419.117.2
1.7
4.4 28.43.06.4
i.؛7
11.01.1
18.1
14.28.0
4.8
5.4
iH10.17.0
3.9
4.3
ل ؟ ث
19.52.4
4.27.44.5
Rubber . . Singapore/Malaysia-Europe 8.0Tin . . . Singapore/Malaysia-Europe 1.2Jute . . . Rangladesh-Europe 8.7Sisal hemp EastAfrica-Europe 8.4Cocoa beans Chana-Europe 3.1Coconut oil Sri Lanka-Europe 8.8Tea . . . Sri Lanka-Europe 6.5Coffee . . Brazil-Europe 4.9?aim kernels Nigeria-Europe 9.5ColJee . , Colombia (Atlantic ports)-Europe 4.2Cocoa beans Brazil-Europe 8.6Coffee . . Colombia (Paci?mports)-£urope 4.5
Sources: Data supplied by the Royal Netherlands Shipowners’ Association.i.^. prices з^ге quoted for ru.€ ء b ^ r (London-RSS), ti^, jute (UK-pwc grade), sisal hemp, cocoa beans (Ghana-Europe), and palm kernels. For
cocoa beans (؟ ra؟il-Euro^) and coffee (Golombia-Euro^ and Brazil-Europe), unit values of exports were quoted. Prices of ؛he remaining commodities are quoted on f.o.b. terms.
^ Freight rates include Suez Canal varying surcharges, when appljcable. Whenever a conversion of freight rates to other currencies has been necessa!^ for 1976, this was based on currency parities as published in United Nations, Monthly Bulletin ofStatistics. vol. XXXI, No 8 (August 1977), and valid as at the end of 1976. Annual freight rates were calculated by taking a weighted average of various freight rates quoted during the year, weighted by their period of duration.
ء 1م 197ب prices ؟ f sisal hemp an^ t^l!؟ kernels wer؟ taken respectively from UNCTA^, Monthly Commodity Price Bulletin (November 197إل , and Special Supplement, (July 1976). In 1976, the price for sisal he؟ ip was ta k ^ from UNCTAD, Monthly Commodity Price Bulletin (December 1976). In 1976, the prices for sisal hemp and coconut oil were taken from ^ C A T D , Monthly Commodity Price Bulletin, 1960-1976, Special Supplement (revised) ($^pt€mber 1977).
24

Chapter VI
PORT DEVELOPMENTS
80. The dem and £or p©rt services has been affected in the past year by varions fact©rs, ©fwhich the following are of particular interest;
(a) The increased use of the roll-on/rotl-0^ type of ships, which lends greater flexibility to shipping sched- ules, arid in particular to the choice o f ports of call;
(b) The development o f new feeder services;The increased utfli^ation ofm (ء) edium -si^e tankers
and the stabilisation o f th e targest ffLCC sise around 500,000/550,000 d.w.t.
81. Tabies 30 and 31 sum m arise the inform ation on eo ^ a in e r traffic provided by ports replying to the U N C TA D questionnaire. Containerisation is not devel- oping at the same rate in atl regions. In developing eou^ries, eontainerisation is spreading fastest in Asia (see table 3^). D ther significant developments may be observed also in West Africa, the Caribbean and some Latin Am erican countries (see tables 33 and 34).
82. ^peeial m ention shoutd be made of develop- ments in iniand waterways and intand ports. In 1976- !977, attem pts were made to improve inland waterways and the corresponding ports and their access. Various projects have been carried out or are planned. This is an im portant development since it will allow seagoing ships to navigate further on certain inland waterways and will thus m ake for a better integration of seagoing and intand waterway transport.
83. Table 35 hsts a num ber of im provem ents being undertaken on certain im portant waterways.
c. Supply of port services
84. W hile the period 976!- 975 ا was marked by an unprecedented port development effort in developing countries, !977 was eharaeteri^ed by a eonsohdation of the port devetopment sehemes and, for certain sub- regions, a reconsideration and scaling down of the im provem ent projects. Neverthetess, a significant num ber o f new projects were announced.
A. Central notes
75. In the Review o fm a ritim e transport, 1976, the U N C TA D secretariat surveyed for the first time devel- opm ents and trends in the field o f ports.
76. The 1977 Review uses both pubhshed dâta for the year 1976 and the replies to a questionnaire sent to 194 ports all over the world. A total of 81 port authori- ties responded to this questionnaire. It is worth noting, however, that the participating ports represent a differ- ent sample from that o f the previous year, since a num ber o f ports responding in 1976 did not respond in 1977 ^nd vice versa. The ports that responded are mostly general cargo ports, although some are also equipped with instaflations for speeialixed cargoes. The sampte covers ports o f all si^es and a! atl stages of development.
77. Table 28 summarizes the replies to the U N C TA D questionnaire by region. The inform ation obtained from the questionnaire is presented in table 29.
78. Owing to the lack o f replies from certain regions, additional inform ation has been collected from rehabte sourees. In summary, ports in developed countries are continuing their efforts to modernize existing instal- lations and are devetoping new facilities mostly for containers and ro-ro, while ports in devetoping coun- tries are expanding, restructuring and modernizing their faeihties. In partieutar, they are constructing m any new specialized faeihties, for exampte, for containers and ro-ro, sugar, eereals and other bulk cargoes.
B. Demand fnr port services
79. From the figures for m aritim e traffic presented in table 1 above, it appears that, afler a drop in traffic in !975, the situation is slowly improving. A t the same time, both shipowners and shippers are making wider use of m odern shipping technologies such as rofl- on/roll-off, containers and various barge systems.
T able 28
Summary ofthe range of №$tionna؛re$ and answers regions
ا»ء-ءمم North and - Central
AmericaSouth
AmericaRegions Western Eastern Asia Africa Oceania Total
Number o f ٩uestههأnأهres despatched . . . . 3, و 25 36 35 42 ١٨ 194
Repiies received . . . 25 2 16 4 26 7 7 81Percentage o f question-
naires completed in eacli region ٠ . ٠ . 67.5 22.5 40.0 ١١١ 74.0 16.6 70.0 41.8
25

T able 29
، on selected ports, 1976
Spaceforcargostorage
Open
Specia-Conven- Specia- Specia- lized
tional Con- Barge- lized lized grain- Annual tonnagebreak Ro/ro tainer carrying bulk dry bulk carrying {thousandbulk ships ships ships liquid carriers ships Others tons)Port
Country
territory
117سو165 100
Unlimited 146 ООО
56 680 41 190 43 600 31418
417676 1 340 281 1 408 ООО
14 500 200 000 120 000
65 500 890 000
12000
184422 222 000
267 000 6 633
90 470
399018300 000 500 000
89 000 26 800
302 240 13 500 20 900 79 320
55000 332 000 211200301 646
121561 129 077 417450 100 ООО 200 ООО
46 956
27 140
؛7 49050 ООО
؛1فذ000181 18 000 175
131000 000 143
000 558
700
؛500
4500 —
1472
ООО؛
20 000
3 790 8 361
143141449
32 041 188 700
1 881 500 50 000
60 18523 400 96 82024 136
5 670251 362 588 780 460 000
13 500 17 600 15000 24 32614 600
21150048 500
419892 755 000
69 40049 574
128 050
20 272 7312 5 000
49 83^ 105 ООО 126 000 26 178 13 300 28 000
16210 65 965
140 000 495 330 114000
803 603 2 288 469
206 805 18000
100 000 143 280 53 603
187 680 12 355 11380 25 000
337 284 1 064410
94 002 53 500
316 129 68 000
118 350
— 4 27161 1 22 995
66 046 912.5
10954ا10 — 19206ا
Special reply
— 30 10
u ' n j— 42 15 2* 2 103980
42624
— 16663— 8 0 1 8— 16 663— 6921— 4 768— 429— 13455— 3 6 6 0
10 9 1 2 2
4891
1 8771 2 773
136 ' 423
4 6 5 1 9— 17230— 49 492
1 35 812— 7 697
2 1483
6 7 8 8 1 9— 40 482— 113805— 3 001
492 7 2 ١936 1 0
— ١1 2
11" ؛46 —
— 1— 1
3 1
— 1
Break bulk
1 1
— 1
- 7 5
1 37 10
2 71 4
21411
أ ؛47
— 1
1 — 53643 4216
667 243
1 — 1 6631843
18 280 .. 269 000— 5 380— 5 506
1 1 101895 078
— — — 8 702
11
— 1
i
186
8/9
63
i414
آ2
.ة
42918613621
7
8713656
10 —
1512
HobartSydneyAntwerpCotonouHalifaxMo^realVancouverAntofagastaValparaisoLimassolLarnacaBordeauxLe HavreMarseilles
PapeeteNoumeaPointe ف PitreBanjul©wendoPiraeusSanto TomasHongRongBombayCalcuttaCoebinKandiaMadrasMangaloreMormugaoParadipTuticorlnVlsakhapatnamBasrah^jorramshahrShabporeBusherAbbasNoshahrPahlavlDublinNaples©enoaTriesteAbidjanKngstonTokyoOsakaKobeYokohama
BeirutKlangPenangKuchingKajang RiverValettaPort LouisAmsterdamRotterdamAucklandWellington
Australia
BelgiumBeninCanada
Chile
Cyprus'
Prance (continental)
France (overseas) Polynesia New Caledonia Cuadeloupe
Cambia Gabon Greece Guatemala Hong Kong India
IraqIran
Manila south 16Manilanorth 22Jeddah 13
IrelandItaly
Ivory CoastJamaicaJapan
JordanLebanonMalaysia
MaltaMauritiusNetherlands
New Zealand
NigeriaPhilippines
Saudi Arabia
26

T a b le 29 (continued)
Data on selected ports, 1976
Spaceforcargostorage
OpenSemi-covered (in square metres)Covered
Annual tonnage (thousand
Others tons)
Specia- Specia- lized
lized grain- dry bulk carrying carriers ships
Specia-lizedbulkliquid
Ro/roships
Conven-tionalbreakbulkPortterritory
Country
5 ООО Not measured 5 ООО 10 000 Not measured —28 881 26 930 174 564
٠٠٠ 415 — ٠٠٠ 141٠٠٠ 483 1 ٠٠٠ 4 ٠٠٥ 186
92 119 45مممم 6م8ممم
136 722 — 224 68م
٠٠٥ 791 161 84م
177 145
46 2مم
2م2 5هم6م8 ٠٥٠
300 ООО
2ذن22م 1 835 815ة
٠٠٥ 14426
370 463 ٠٠٠ 150
215000 345 217٠٠٠ 80
200 19
500 10 15000
٠٠٠ 182290 9 746 523
375 7مم٠٥٠ 120
11300017000
49785ةا 223 46تم ١ 295 مم0ت
1502 325 035 254 100 49 ٠٠٠ 98128 155
107428127 6 406 5 573 22 182 2
552 3
؛940214
أ181721
32 753ل 11614ه 5مم9ا 5 232ا
137 3 1951
102 2 127 1
— 7
1131
10
36 — 7
22 —
2214
4
16
1010
— 35
45
323410
5330
50
BerberaMogadiscioValenciaStockholmGothenburgLatakia
Bangkok
Mina Zayed ?ort Khaled Singapore London
River Docks
Southampton Hull N e^ort Cardiff Houston Long Beach New York Seattle Honolulu Puerto Cabello 11 LaGuaira 12Koper 8Matadi 10
Somalia
SpainSweden
Syrian Arab Republic
Thailand United Arab
Emirates Abu Dhabi Sharjah
Singapore United Kingdom
United States of America
HawaiiVenezuela
VugoslaviaZaire
.Revenue tons د^ ? ؛ u^e converted from original tonnage given in “ long” tons.
5o«rce. Based on replies to the UNCTAD questionnaire. .Figure converted from original tonnage given !n«sh©ri»tons ا^ Including transit and warehousing space.
T a b l e 30
ed ports of developing countries, 1976€ontniner traffic in ؟
Grandtotal
Empty containersFullcontainers
Loaded Discharged TotalLoaded Discharged TotalPortCountryor territory
٠ 1 200 3 180 Containers٠ 7 950 17 984 Containers
11 827 18 836 78 323 Containers٠ 36 438 80 864 Containers٠ 1221 4 762 Containers
250 1 730 1980 1200034 8 ٠ 8 034 7 950
229 27258 59 487 7 009537 41 889 44426 36 438898 2643 3 541 1221
CotonouGwendoAbidjan
Matadi
South and Central America Caribbean «٢،?،،Chile Valparaiso 1318 1 282 2 600 451 395 846 3 446 TEU
A^ofagasta 65 128 193 451 395 846 1039Guatemala Santo Tomas 200 80 280 60 ٠ 60 340 Containerslamaica Kingston 6 735 12 604 19 339 6869 1 711 8 580 27919 ContainersGuadeloupe (France) Pointe ف Pitre 2 700 19 300 22 ٠٠٠ Containers
AfricaBeninGabpnIvory CoastNigeriaZaire
HongKong 428499 387 836 816335 82339 130385 212724 1 029059 TEVCalcutta 16 6 22 294 280 574 596 ..Cochin 2236 871 772 99 1365 223 142 ا ..Bombay. 2 578 1 347 3 925 157 768 925 4 8 5 0 . .
Continental Asia andislands »آس،ا« ا،ءءم/
Hong Kong India
27

Container traffic in selected ports of developing countries, 1976
T a b le 30 (continued)
Grandtotal
Empty containersFullcontainers
Loaded Discharged TotalTotalCountry or territory Port Loaded Discharged
Malaysia Kelang 19 542 23 713?enang 5 886 3 074
Singapore Singapore 119966 134455Mauritius ?ort Louis 822 2 456Thailand Bangkok 14423 17939
Pacific islandsNew Caledonia (France) Noumea ه 7 305?hilippines Manila 43 991 58 929Tahiti (Franee) Papeete 200 7 100M id d le E astSaudi Arabia Jeddah 0 75 250United Arab Emirates Sharjah 2001 1940
2 440 8 827 52 082 Containers3 976 5 232 14 192 TEU
11703 39 527 293 948 TEU— 1 563 4 841 Containers
796 4 052 3 6 4 1 4 Containers
13 ]19 Containers 133 694 TEU
14 450 Containers
Containers
Containers
143 608 5 407
13 075 11381 78 744
ء أ ةق!أ ء ة'
1466
4 409
16604
«ة
1 130
6 387
5 8 1 4 22 255
7 150
!35818
43 255 8 960
254 421 3 278
32 362
7 305 102 920
7 300
75 250 3 941
E urope
Cyprus Limassol 3 080 5 586 8 666 3 279Malta Valette ا 570 5 9 1 6 7 486 3 841©reece Piraeus 24 477 37 663 62 140 10075
T a b e e 31
Container traffic In seleeted ports of developed market-economy countries, 1976
Grandtotal
Empty containersFullcontainers
Loaded Discharged TotalDischarged TotalPortCountry
ContainersContainersContainersContainersTEUTEUTEUContainersContainersTEUTEUTEUContainersContainersContainersContainersContainersContainersContainersTEUTEUTEU
TEUTEUTEU
311308 293 291
73 767 133 937
93 827 18 225
327 910 99 971
133 105 245491 423 079 395 957 129 271 35 118 48 567
134410 24 353
816 181 4 1 4 9 6
774 274 147 440
19479 297 047 183 273 574 850 558 318 9126 6 9
299 027 15 967
5 8817 45 891
6 651
112
65 480 17222 2 1 9 5 3
237 469 81 533 73 800
7 999 17042 16 6963 020
128 830 10 954
8 924 18 182 29 672 25 239
60 374 6 253
166 275 100 497 166 958
86 138 5 492
6 460
1131 9 301 521 5 2 838
36 429 11707
166 435 59 080 50 000
4 233 4 704
2 028 55 644
7 545 7 371
4 740 1660
39 8435 907
109 77265 323
52 357
5 5204 624
15 897
29 051
i |23 800 22 390
1474
3 409 1553 2 3005 390
20 4996 651
20 531346
56 503 35 174
؛575968!
252 491 247 400
67 116 120012 7 2 7 1 5 15 333
262 430 82 749
111152 1 008 022
341 546 322 157 102 648 27 119 31 525
117714 2 1 3 3 3
687 351 30 542 29 935 45411
744 602 122 201
11168 236 673 177 020 408 575 457821745 711
212 889 10475
163 143 119 977
35 557 56 179 43 082
122 349 39 632 46 174
447 803 139 909 154659 62 191
1س0 3
047 52 12056
275 354 906 13
11441 626 14 305 27668 8سم
105918 530 84
194456 584 297 357 398
893 161 853 4
89 348 127 423
63 833 29 633 10221
140 081 43 11764 978
560219 201 637 167 49840 457 13519 24 29765 667
ء 3ةأةأ636 16 494 18 785 30 297 468 337 53
23 1 5 755 130 490 92 119 214 237 160 354 347
996 50 622 5
SydneyAntwerpHalifaxMontrealVancouverBordeauxЕе HavreMarseilles©sakaKobeVokobaj^aTokyo©ublinNaplesTrieste©enoaAmsterdamRotterdamAucklandWellington؛ValenciaBilbao©otbenburgStockholmEondonHoustonSeattleLong BeachNew YorkHonolulu(Hawai)Kopar
AustraliaBelgiumCanada
France
Japan
IrelandItaly
Netherlands
New Zealand
Spain
Sweden
United Kingdom United States o f America
Yugoslavia
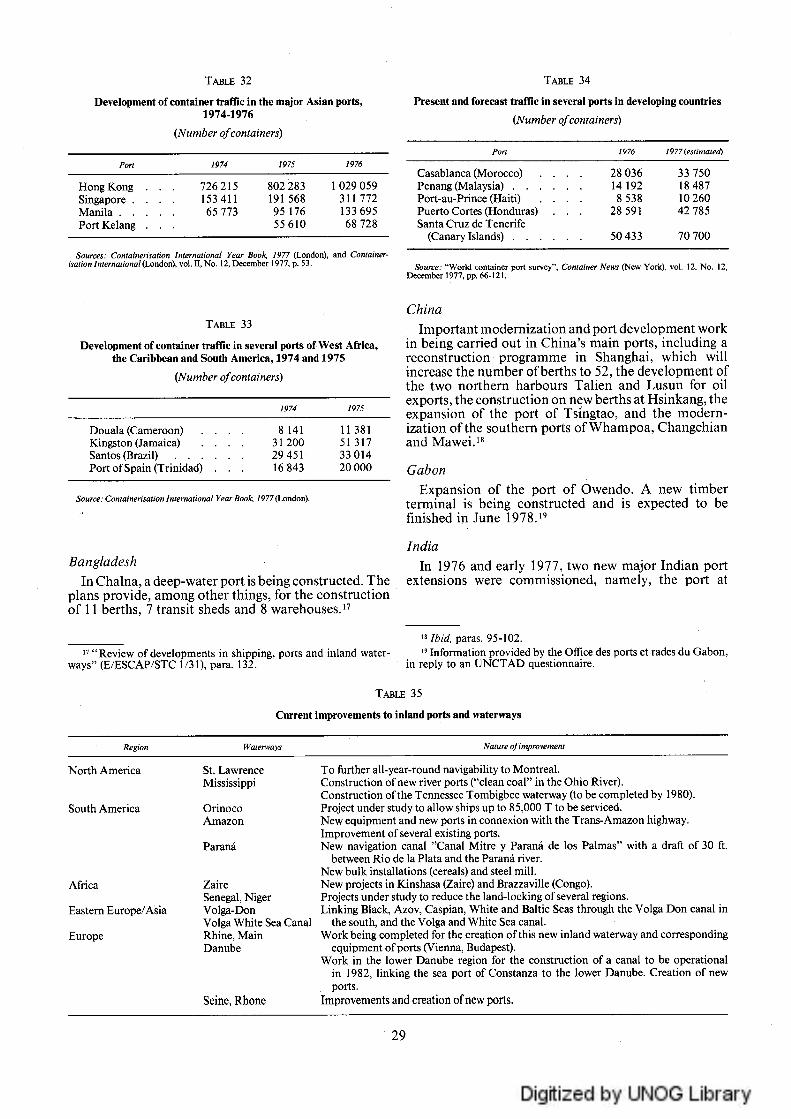
Table 34
Present and forecast traffic fn several ports in developing conntries
{Number ofcontainers)
1977 {estimated)
33 750 18 487 1 0260 42 785
Port
28 036 14 D 2
28 591
50 433 70 700
Casablanca (Morocco) Penang (Malaysia) . . . Port-au-Prince (Haiti) Puerto Cortes (Honduras) Sa^ a Cruz de Tenerife
(Canary Islands) . . .
Source: “World container port survey”, Container News ^ e w York), vol. 1 , No. ٠^١ December 1977, pp. 66-121.
nevelopjnent of conlainer tra№c in the major Asian ports, 1974-1976
(Number ofcontainers)
T able 32
Pon 1974 1975 1976
H o n g K o n g ٠ . 726215 802 283 1 029 059S ingapore. . . 153 411 191568 311772M a n ila . . . . 65 773 95 176 133 695PortK elang . . 55 610 68 728
! Container-Sources: Containerisation International Year Book, 1977 (London), isation lnternational{Lonàon), vol. II, No. 12, December 1977, p. 53.
China Im portant m odernization and port deveiopment wor^
in being carried ont in C hina’s main ports, including a reconstruction program me in Shanghai, which wib incease the num ber ofberths to 52, tbe development ٠٢ the two northern harbours Talien and Eusun for oil exports, the construction on new berths at Hsinkang, the expansion of the port o f Tsingtao, and the modern- ization o fthe southern ports of W ham poa, Cbangchian and M awei.؟؛
Gabon Expansion of the port o f ©wendo. A new tim ber
term inal is being constructed and is expected to be fmished in June 1978.ءا
Table 33
Development of container traffic in several ports of West Africa, the Carihhean and South America, f974 and f 975
(Number ofcontainers)
1974 1975
Douala (©ameroon) . . . 8 141 11381^ n g sto n (Jamaica) ٠ . . 3 1 2 0 0 51 317Santos (Brazil) . . . . . 29451 3 3 0 1 4Port ofSpain (Trinidad) ٠ . 16 843 20 ООО
Source: Containerisation International YearBook, 977ثم(London).
India In 197b and earl1977 ?؛, two new m ajor Indian port
extensions were commissioned, nam el؛?, the port atBangladesh
In Chaîna, a deep-water port is being constructed. The plans provide, among otlrer things, for the construction o f 11 berths, 7 transit sheds and 8 w arehouses.'؟
.Ibid, paras. 95-162 ؟' ,Information provided by the Office des ports et rades dn ©abon ءا
in reply to an ttN C T A D questionnaire.“ أ‘ Review o f developments in shipping, ports and Inland water-
ways” (E/ESCAP/STC 1/31), para. 132.
Table 35
Cnrrent improvements to inland ports and waterways
Nature ofimprovementWaterwaysRegion
T o further all-year-round navigability to Montreal.Construction o f new river ports (“clean coal” In the Ohio River).Construction o fthe Tennessee Tomblgbee waterway (to be completed by 1986).Project under study to allow ships up to 85,000 T to be serviced.N ew equipment and new ports in connexion with the Trans-Amazon highway.Improvement o f several existing ports.N ew navigation canal ”Canal Mitre y Parana de los Palmas” with a draff o f 30 ft.
between R io de la Plata and the Parana river.N ew bulk installations (cereals) and steel mffl.N ew projects in K inshasa (Zaire) and Brazzaville (Congo).Projects under study to reduce the land-locking o f several regions.Tinging Black, Azov, Caspian, White and Baltic Seas through the Volga Don canal in
the south, and the Volga and White Sea canal.Work being completed for the creation ofth is new inland waterway and corresponding
equipment ٠٢ports (Vienna, Budapest).Work in the lower Danube region for the construction o f a canal to be operational
in 1982, linking the sea port ofConstanza to the lower Danube. Creation o f new ports.
Improveme^s and creation of new ports.
St. Lawrence Mississippi
©rinocoAmazon
Parana
ZaireSenegal, Niger Volga-DonVolga White Sea ©anal Rhine, Main Danube
Seine, Rhone
North America
South America
Africa
Eastern Europe/Aria
Europe
29

berths at Pasir Pajang Port; this will cost $16 mil- lion.??
85. Jt is interesting to note that, as a result ofthe very large and often un-eoordinated port developm ent in the k id d ie Last during 1975-76 and the subsequent fear of serious over-eapaeity in the Persian Gulf, a flrst m ajor port projeet, namely, A bu-D habi’s $73 m illion outer harbour projeet, has been cancelled. M oreover, it is not unlikely that other schemes in the region will be abandoned or at least scaled down before the 198©s.
86. A n o th ers tr ik n g fe^ tu re in 1977 is the emphasis given by Governments and port authorities ali^e to providing new facilities able to handle containers and ro /ro traffic in an appropriate and efficient manner. $ome o f these term inals are pure container term inals; others fall in the broad category o f m ulti-purpose facilities.?؟ The following list is not exhaustive but illustrates the considerable effort made by the appro- priate authorities to meet the container and ro/ro challenge.
BrazilExpected to be com pleted in 1979, the port of $antos
will provide the hrst container term inal in Rrazil. A nother container port is planned at $epetiba (20 Icilometres from Rio de Sneiro).?’
GreeceA new container term inal will be eonstrueted at
Piraeus at a cost o f $60 million. The total area will eventually eneompass 700,000 m? and provide 1,500 metres o f quay (in length).?٠
Ivory CoastC ontainer term inals are being constructed at Vridi
and at Loeodjo (Abidjan),?؛
NigeriaThe third A papa w harf extension (Tin Can Island
Development) at Lagos eaters for six additional berths, four of whieh will constitute the 1,000-metre-long container term inal while the remaining two will be convertible berths. This extension (ineluding ro/ro facilities) is expeeted to be partly term inated by mid- 1978.??
PanamaConstruction of a container and ro /ro term inal in
France Field (Coffin), providing for three berths at a total investment cost of approxim ately $31 million.??
Visakhapatnam , eonstrueted at a cost of approxim ately $30 million and designed for the export of iron ore, and the Haldia deep-draught coal berth, which will undoubtedly enhance India’s eoal exporting poten- t al.?o؛
IraqConstruction of three new berths at Llmm ^ a s r at an
estimated eost o f $30 m illion, for com pletion late 1978.?•
Ivory CoastConstruction of a sugar-handling berth at Abidjan,
representing an investment of approxim ately $45 mil- lion.??
JordanA eontraet worth $54 m illion was granted by the
Jordan M inistry o f Transport for the construction in Aqaba o f four general eargo berths, two roll-on/roll-olf berths and a coastal wharf. Com pletion expeeted in 1980.??
M alaysiaK a n ta n port is at present being constructed. Jt will
include one m ulti-purpose berth, three general cargo berths, one m ineral ore berth, a twin dolphin berth for palm oil tankers, and various types of storage facilities. The new port is expeeted to be term inated in 1978.?٠
M auritiusConstruction o f a bulk sugar term inal at Port Louis
with a storage capacity of 350,000 tons, representing an investment of approxim ately $45 million.?؟
PeruAs part o f the regional developm ent plan of N orth
West Peru, a port master-plan of the Rayovar port eomplex h^s been commissioned by the Peruvian Governm ent. The m aster plan ©overs faeilities for ©rude oil, petroleum produets, petrochemieals, ores, phos- phates, fertilizers, salt, sulphurie acid and générai eargo.?،
SingaporeThe Port of Singapore A uthority has announced the
eonstruetion o f three eoastai and three deep-water
” Journal po u r le transport in ternational (Basel), 37th year, No. 49, 3 Decem ber 1976, p. 5877.
ee para؛؛ 8 rج a p l8 fo ل 4 rthe facilities already m entioned for Abidjan, K a n ta n , etc.
Portos ء N avios (Brazil), August 1976, P orts a n d H arbours (Tokyo), vol. 22, No. 2, Feb. 1977, p. 22 ; Sea trade (Colchester, U nited Kingdom), vol. 7, No. 11, N ovem ber 1977, p. 29.
Inform ation provided by the Biraeus port authority in reply to an U N C TA D questionnaire.
Inform ation provided by the ? o rt autonom e d ’Abidjan in reply to an U N C TA D questionnaire.
C ontainerisation In ternational Year Book, 1977 (London), p. 141.
” Inform ation provided by the A utoridad Portuaria Naeionai. (R evista ءا، la A u toridad P ortuaria Nacional, Fdicidn Conm em orativa del Segundo A ^versario , 1974-1976).
؛١١ Indian S h ipp ing (Bombay), vol. X X IX , No. 7, 1977, and P orts مح«ا، H arbours (Tokyo), vol. 22, No. 12, De^em her 1977.
“ M iddle East survey; port construction and dredging projects” . In tern ational D redging a n d P ort C onstruction (London), Dctober 1977, pp. 39-75.
“ Inform ation provided the Port autonom e d ’Abidjan in reply toan EINCTAD questionnaire.
” Indian sh ip p in g (Bombay), vol. X X IX , No. 7, 1977, and P orts a n d H arbours (Tokyo), vol. 22, No. 12, Deeem ber 1977.
" Inform ation provided by the K uantan Port Authority.The D ؛؛ o ck an d H arbou r A u thority (London), vol. 58, No. 679,
lu n e 1977.Ports a n d H arbours (Tok^o), vol. 22, Nos. 6 and 7, June/July,
1977, p. 52.
30

Figures for the hrst ^ u r m onths ofeach year since 1971 show the following progression:
Average ofwaitingdays
per ship
4.04.8
14,339.522.0
Year1971197219731974197519761977
Since reports tend to ^ome from the regions that suffer from the worst congestion, they ^re not representative of wortd-wide port conditions; rather, they show how conditions on the severely affected regions have devel- oped. Glearty, conditions were stilt serious in !977, hut there was some im provem ent in com parison with 1976 figures.
90. In fact, the num ber of reports inctuded in the above survey has steadily increased fi'om 25 per m onth in 1971 to 42 per m onth in !977. This increase in itself may distort the results but it seems to stem mainly from an increasing num ber o f affected ports. C n d itio n s in ports previousty included in the survey have improved, notably in th^ Persian G utf; other ports that were not congested before are now appearing in the reports, especiatly ports o fth e ^ e d Sea and South America. So while congestion is less severe in individuat ports, it seems to be becoming more widespread.
91. Fvidenee of an im provem ent in ! 977 is given bym onthly basisthe same indicator catculated on
throughout the year, as following:Days16.414.6
JanuaryDays
29.0 July£ehruary 25.6 AugustM arch 1?.9 $eptem berA pril ٠ . . 14.3 ©etoberM ay , . . 1?.0 Novem berJune . . 13.8 ©eeember
These figures indicate that the over-all situation in congested ports has improved during !977, although there has not yet been a return to the situation prevailing in 1974 before the onset o f th e recent crisis.
92. Reports fi-om individual ports in the above survey were interm ittent. Dver the whole year, the average num ber of reports per m onth was 49, yet the total num ber o f ports covered during the year was 9 t. These reports came predom inantly from Africa and Asia west of ffurma, with a sprinkling from ^outh America. ¥ e t the widespread levy o f congestion surcharges by liner conferences suggests that there were more congested ports than were included in the survey. During !977, the attention o fthe FINGTAD secretariat was dr^w n؟؛ to the levy of congestion surcharges in 79 ports. O f these 79 ports, 2 ة — mainly in Furope, the M editerranean and ^outh A m erica— were not covered in the waiting tim e survey. There were 40 ports in the survey for which there was clearly no evidence of surcharges. This should not be t^ken as an indication
Saudi ArabiaThe first stage o fth e Jeddah container term inal was
opened in Novem ber 1977. ؛ه
ThailandThe port authority of Thailand has started an expan-
sion project at Bangkok costing $22.5 milfion and providing berths for handling containers and ro /ro .”
Trinidad and TobagoA 330-metre-long container berth Is under construe-
tion at Fort of $pain. It will offer a total open storage space of approxim ately 93,000 m؛ and two container freight stations and will be equipped with two gantry cranes.”
United Arab EmiratesThe commissioning o fthe $harjah container term inal
in late 1976 was the start of th^ first transhipm ent container term inal in the Persian Gulf. The K hor Fakkan port is expected to be commissioned as a m ajor container term inal in July !97ة م آل
$7. A part from the development schemes men- tioned ^bove, a num ber o f im portant port projects will also be financed by the ^ o r ld B^nk and other inter- national lending institutions. Table 36 gives a full listing o f th e port development loans which were granted by IB ^D and IDA during 1976-1977. These projects cover the construction ofbulk facilities, general cargo facilities and container and roll-on/roll-off terminals. The loans for the 1976-1977 period am ount to a total of $24$.9 milfion for Ifi projects, which compares with $ 1 7 ,5 ه m illion for $ projects during 1975-1976. This increase o f 13fi per cent in the total value o fth e loans indicates the m uch larger scale o fthe port developments to whieh the W orld Bank is contributing.
D . Adequacy of port services
88. Port services are adequate if they are available as ^nd when required by the port users and at reasonable costs. It is not possible to establish general criteria to measure the ^dequaey of port services, but there is o^e clear indicator o f inadequacy and that is port congestion when ships and cargo are delayed excessively.
89. One indicator ofthe extent of port congestion for general cargo ships used in the 1976 Review is the average waiting time before berthing, as reported from a num ber of ports interm ittently subject to congestion.”
e^in the؟By circular from individual conferences or from referen ” Basel;))/اءء«آ«-ه'،،م«ع international press (Journal pour le transport
Journal d e m arine m archan de ،?، de /،، navigation aérien ne (Baris;)(.and Sea trade (Colchester, U nited K ingdom
” Advertisem ent by the Jeddah contaih^r term inal, محاره/ء’ء L ist (London), 30 September 19??.
” F airp lay In tern ational S h ipp ing W eek ly (London), vol. 264, No. 4918, 24 N ovem ber 19??, p. 55, and “ Review of developm ents in shipping, ports and inland waterways” (£ /£ 8 C A ?/$ T C l/3 1 ).
” Ports an d H arbours (To^yo), vol. 22, No. 5, M ay 19??, p. 39. ” ? ٠٢، ^٨٠٢ P akkan , P reigh tw ay ،٠ the م«ا / published by the
$hatjah ?ort Authority.” $ee R eview ص/م،،سم«>،،'،ء transport, /9 /6 , op. cit., paras. 10? ء،
seq.
31

World Bank loans or credit for port development granted in f 976-7?
T able 36
Description ofproject
Amount o f TotalprojectType and loan/credit cost
date (millions ofdollars)Country
(ofwhich
third Window loan)
32
80 80 Construction o f a new deep-water port near the town o f Jijel to servemainly the new Jijel steel complex
Maturities: 1981-1994 Jnterest rate: 8.2 per cent
10 16.1 Port ofRangoon rehabilitation deepening the access channelM atmities: 1987-2026 Service charge: 3/4 per cent
2.3 Reconstruction (earthqnake)Maturities: 1980-1998 Jnterest rate: 8.85 per cent
29.9 Building o f new port at Puerto Castilla and expansion o f new facilities at SanTorenzo
Maturities:JBRD: 1983-2001 $5 m
1 982-1997$ 7m IDA: 1987-2027
Interest rates:IBRD: 4.5 per cent $5 m
8.5 per cent $7 m Service charges: IDA: 3 /4 per cent
79.3 Improvement o f Port o f Tanjnng Priok, containers and general cargo handling
Maturities: 1981-1996 Interestrate:8.5pereent
3.6 23.5 Expansion o f port o f Port Louis and improvement o f operating conditionsSupplement to the $ 10 m illion loan granted in 1974
Maturities: 1983-2001 Interest rate: 4.7 per cent
67 112 Development ofport ofBusa'n: container berth, access road, dredgingMaturities: 1981-1994 Interest rate: 8.5 per cent
6 23.9 Expansion ٠٢ port o f Da^ar. Improvement o f existing conditions andoperations ofindustrial fishing fleet
Maturities: 1983-2001 Interest rate: 4.2 percent
15 Expansion and building of new facilities, building o f a new dockyard and120 floating dock, road and rail access to the port
10 Maturities:IBRD: 1981-1996 IDA: 1986-2026
Interest rate: IBRD: 8.9 per dent Service charge: IDA: 3 /4 per cent
6 27.9 Development o f port o f Hoddeidah and rehabilitation o fth e lighterage portofM ocha
Maturities: 1987-2027 Service charge: 3/4 per cent
IBRDMay 1977
IDADecember 1976
IBRD July 1976
IBRD April 1977
IDAApril 1977
Algeria
Burma
Guatemala
Honduras
November 1976
IBRDNovember 1976
IBRDApril 1977
IBRD April 1977
United Republic IBRD ofCam eroon September 1976
IDASeptember 1976
Indonesia
Maurhlus
Repubhc o f Korea
^ AMay 1977
Yemen
5،)ur^;Compiled by the UNCTAD secretariat on the basis o^the World Ъгп}/: Annual Report 977ئ(Washington, D.C.).
not all ^ort users tna؛? liave benefited; eyen tbose who have benefited may have done so at great cost, ؛n particular by employing vessel types and handfing techniques wljich would not norm ally have been con- sidered appropriate. Examples of the measures which ship operators or shippers have been led to t a k include : the em ploym ent o f ro-ro vessels ; 100 per cent pafietiza- tion; streamlined docum entation; restricted sailing schedules. A lthough contributing to reduced port congestion, such measures may lead to supplem entary costs.
94. The changes which have been made or accepted by sbip operators and shippers show recognition o fth e fact that efficient transportation requires co-ordination of all the different elements involved. Elntil recently, is
that the surcharge list is incomplete, since these ports were found in fact to be the least congested of those surveyed. Based on the surcharge inform ation, the waiting-time survey apparently ignores at least 35 per cent of congested ports. This suggests there might well have been at least 14fi general cargo ports subject to interm ittent congestion in 19??.
93. A notable feature o fthe survey reports is that, in m any ports, waiting tim e is no longer quoted as a single figure but as a range. This stems from the measures taken in severely congested ports to lim it the congestion. Yarious berthing priorities have been accorded and, in particular, vessels which can use port facilities with the greatest efficiency have taken precedence. A lthough the statistical evidence is that port services have improved.
32

eased port congestion have been physical port expansion and strengthened management. U N C TA D has been as^ed for assistance at a num ber o f ports and has sent port congestion tasl؛ forees to five countries in 1977. Although a num ber o f short-term measures to ease congestion have been identifled in every case, it has been a consistent finding that the remedy for congestion lies in better managem ent and improved supervision of operations.
has been eustomary to assume, at least for general eargo trades, that ports m ust be adapted to whatever shippers and ship operators demand. The recent very high costs incurred in congested ports have made it elear that it may sometimes be necessary for ships and shipping services to be adapted to ports.
95. A lthough emergency measures have been tal،en with sueeess in some ports, the m ajor steps whieh have
33

Chapter VII
OTHER DEVELOPMENTS
97. A t the eighth session o f the ConrnTittee on Shipping in April 1977, developing countries re-empha- sized their support for the Convention . -Among devel ٠؛oped m arket-econom y eonntries, in Decem ber 1977 the Commission o f th e European Com munities submitted to the Council o fthe EEC for consideration a docum ent entitled “ Proposal for a Council Regulation concerning accession to the f)nited Nations Convention on a Code of Conduct for Liner Conferences” , whieh recommends that m emher States o fthe EEC should heeome contract- ing parties to the Convention, subject to certain con- ditions.
A. Code of Conduct for Liner Conferences
96. Article 49, paragraph 1, o fth e Convention on a Code of Conduct for Liner Conferences provides that the Convention “shall enter into force six m onths after the date on whieh not less than ^4 States, the eomhined tonnage ofw hich am ounts to at least 25 per cent of world tonnage, have become Contracting Parties to it...” . As at 14 Eebruary 1978, 25 countries accounting for 5.7 per cent of the relevant world tonnage were contracting parties. ^ ٠
B. Joint ventures involving developing countries
98. In 1977, several new Joint ventures involving developing countries were reported: between Nigerian
* ' See ءصم'،ه / R ecords ٠/ the Trade a n d D evelopm ent مء،اا-مح , Seventeenth Session, Supplem en t No. 3 (TD/B/648), para. 33.
٠٠ tn this connexion, see “ Signatures and ratifications of, or accessions to, the Gonvention on a Gode o f Gonduct for Einer Gonferenees : note by the U N G TA D secretariat” (TD/B/G .4/INF.20). ? o r the text o f the Gonvention, see U nited N ation s Conference ٠/ P lenipoten tiaries ٠« a C ode o fC o n d u c tfo r L iner Conferences, vol. II, F inal Act (including the C onvention a n d resolutions) a n d tonnage requirem ents (United Nations publication. Sales No. E.75.II.D.12).
Table 37
Average dally number and net tonnage ofyessels using the Suez Canal in 1966,1976 and 1977
AverageJan.-July1977
Number tonnage
Average 1976
NumberravageNumberTypes o f vessels
14© 67©
153 094 (25.6)
597212
0.90.43 320
147 066
255 701 2.521 085 0.9
7 069 0.3280 896 3.5
1.90.7
Subtotal . . . . . . 27.2 564 751 7.2 ^1 3 4 3 3 7.4 212 377(Percentage tanfers) . . . (46.7) (75.2) (15.6) (41.5) (13.7) (35.6)
G eneral cargo a n d containersLoaded, northbound . . . — — 9.4 68918 11.0 9 1 8 4 9Loaded, southbound . . . — — 14.1 87 679 16.0 114991Ballast, northbound . . . — — 4.0 15 8^2 5.4 23 30^Ballast, southbound . . . — — 0.4 2 605 0.3 1599
231 741
(38.8)
123 528 29 566
32.7
(60.8)
П.0
175 024
(34.0)
92 477 33 474
(60.7)
7.7172 882 13 737
13.7(25.5)
125 951 (24.5)
186619 10.9(24.8) (23.7)
1.0(53.3
T ankers Loaded, northbound Loaded, southbound Ballast, northbound Ballast, southbound
Subtotal . . . . . .(?ercentage general cargo and containers) . . . . . .
O thersLoaded .................................B a lla s t ......................................
Subtotal . . . (Percentage others)
751 370 46.0 514408 53.8Tg^al
اسء١ءء .■ Compiled on the basis o^in^tmation pnhlished in Suez Canat Authority. MoruhtyReport (Ismailia, E ^ t ) , nations i؛ .For 1966, separate information was not given by the source for general cargo and container vessels و
34

cargo and container ships by 32 per cent. Traffic details are given in table 37.
100. W ork continued on widening and deepening the Canal to pernrit the passage o f vessels drawing up to 53 feet, and is expected to be conrpleted in 1980. As announced, the project wdl cost about $1,200 n؛ilhon and will enable Fgypt to increase canal revenues from about $450 million in 1976 to about $1,000 million in 1980.
D. Air transport
101. Trends in air freight transport (in terms of ton-kilometres) for 1972-1976 are shown in table 38.
102. In 1976, the am ount o f eargo carried by air by the scheduled services of airhnes of ICAG m ember States, excluding the USSR, increased from 6.6 to 7.1 million freight tons or by 7.6 per cent in comparison with 1975, while the average distance rose from 2,613 kilometres to 2,700 kilometres.^؛
٠؛ ICAO, Digest ofStatisticsNo. 218-B, Airline Traffic— Volume 2, 1972-1976, Series T. No. 36 (M ontreal, 1977), p. B.3.
and Indian interests, resulting in the establishment in Nigeria o f Fqu^torial carriers Ltd.; between Seatrain Lines Inc. and Trinidad and Tobago, resulting in the formation o fth e Shipping Corporation of Trinidad and Tobago. The Saudi Arabian Triad G roup, Liniines and Valm et o f F inland established s^udi International Ship- ping Co.; Indonesian ^nd Swedish interest formed FT Indonesian Tankers; M oroccan, British and Belgian interests formed Atlas Soci6t6 m arocaine de navigation S. A. A lthough the U N C TA D secretariat has requested the respective developing countries to provide infor- m ation on th^se Joint ventures, ^t the time of writing no further details h^d been received. It is intended, how- ever, to report on these developments in the next Review o fm aritim e transport.
c . Suez Canal
99. The num ber and tonnage of ships transiting the Suez Canal increased d q rin g l9 7 7 .In the first six m onths o fth e year, the daily traffic in terms of net tonnage was 16 per cent higher than in 1976, although still some 21 per cent below the pre-closure level. The traffic decreased marginally for tankers but rose for general
38 Table
«1976^-197 ,Trends !n n!r freight volume and in air freight operating revenuesهم) ، ء (محءأممك/«محء operations ه/م/>،آ«ءء oflCAO member ء
Freight volume Freight operating revenues
Year
Percentage Ton- changeover
kilometres calendar {million) year
Totalfreight
operating(millionsofdollars)
Percentage changeover
Per ton- previous kilometre calendar (UScents) year
1973 . . . 15 705 2 890 18.41974 . . . ا7ا68 9.3 3 654 21.3 15.81975 . . . 17416 1.4 4 196 24.1 13.2
ا9?6 ... 18414 5.8 4 640 25.2 4.6
мг^.ТСАО, Digest ofStatistics No. 222, FinancialData, 1976, Series ?-N?،^أ and ة ٠. 30 (Montreal, 1977), pp. ١ .International and domestic seliednled services, excluding China and domestic services ofthe USSR ء
third U N CTA D training course on the economics and m anagement o f shipping was held in Singapore. N ine citizens of developing countries studied overseas on fellowships for a total period of 23 m an/m onths. Following the recom m endations made by the Com mit- tee on Shipping and the G roup of Fxperts on Port Congestion, a num ber o f task force missions have been carried out, including missions to Benin, Cyprus, M orocco and the ¥ em en Arab Republic. The total cost of U N C TA D technical assistance for the year is esti- mated at around $2.3 milhon.
E. UNCTAD technical assistance
lb3. U N C TA D continued to assist developing countries by providing field experts to assist Govern- ments, port authorities and shipping companies, by holding training courses, and by offering fellowships. In 1977, U N C TA D had a total of 38 experts engaged in field work for a total of 300 m an/m onths. Three semi- nars were held during the year: in Fondon, on ocean chartering; in Abidjan, on port operations; and in M anila, Jointly with FSCAP, on port planning. The
35

ANNEX I
Classification of countries an<l territories
ANNEXES
Code / — Socialist countries ofAsia China Socialist ^e^n b lic o f V iet N am »
Dem ocratic People’s R epublic o fK o rea
territories in Africa ا«مح، countries 8 —ء^?،ء/مم>،وا Code8.1 Northern Africa
Algeria MoroccoEgyptLibyan A rab Jam ahiriya 8.2 Western Africa
Tunisia
Angola FiberiaBenin M auritaniaCape Verde NigeriaCongo St. HelenaFquatorlal Guinea Sao Tom e and PrincipeGabon SenegalG am hia Sierra FeoneG hana TogoGuinea U nited R epublic o f CameroonGuinea-Bissau W estern SaharaIvory Coast 8.3 Eastern Africa
Zaire
Burundi ( ا ) ReunionCom oros SeychellesDjlhoutl SomaliaF thlopia SudanKenya Uganda (L)Madagascar U nited R epublic o f TanzaniaM auritiusM ozam bique
Zam bia (L)
Code و — Developing countries and territories in America9.1 Caribbean and North AmericaAntigua G uadeloupeBahamas HaitiBarbados Jam aicaBermuda M artiniqueBritish Virgin Islands M ontserratGaym an Islands St. Kitts-Nevls-AngulllaCu^a St. FuclaD om inica St. Pierre and M iquelonDom inican Republic St. VincentGreenland Turks and Caicos IslandsGrenada9.2 Central America
U nited States v irg in Islands
Belize H ondurasCosta R ica Mexico£1 Salvador NicaraguaG uatem ala Panam a
د.و South America: northern seabordGuyana SurinamFrench G uiana Trinidad and TogaboN etherlands Antilles Venezuela
Notes
/ )،?N٠
and does ؛?This classification Is intended for statlstioal purposes onl judgem?؛ ent regarding the stage o f developm ent on an ؛?an ؛?no t im pl
or territo.?؛ r ؛?countr
'2 Note
Trade statistics are based on data recorded at the ports ofloading and unloading. T rade originating in o r destined for neighbouring countries
in jvhich the ports are situated; for this ؛?Is attribnfed to the countr reason, la n d -lo c ^ d countries do not appear In these tabulations. Dn the o ther hand, statistical tabulations on m ercham s fleets include data for lan d -lo ck d countries which possess fleets; these countries are marlced “(L)” in the following classification.
3 Note”countries ؛?in certain tables, where appropriate, six “ open registr
ngapore and Somalia) are$؛ ,prus, Liheria, D m an, ?an am a)€؛?,recorded as a separate group
Classification of countries and territories
م/محءمم — ' ء ^ ء market-economy countries in America U nited States o f Am erica
Code 2
٢ ٨ ٨ ٠
Canada
Code 3New Zealand
Code 4 — م/محءمم ء ^ ء market-economy countries in Europe
Japan
Australia
M onacoN etherlandsNorw a؛?PortugalSpainSwedenSwitzerland ( ا )Turke؛?U nited Kingdom o f C reat Britain
and N orthern Jreland Yugoslavia
A u stria (E)Belgium D enm ark Faeroe Islands Finland France
Federal R epublic o f ؛?,C erm an G ibraltar Greece Iceland ireland
Ital>؛
مم،ا -، م،/محءما market-economy countries in ء ء ^ Code 5 — ءSouthA frlca
ء »^ ح/ا'ءء countries ofEastern ءمم ء Code 6 — ا،ا
» Statistical data for the form er Dem pcratic R epublic o f Y ict-N am and the form er R epublic o f South V iet-N am for 1975 and earlier ؛?ears are included under Socialist R epublic o f Viet Nam .
PolandR om aniaU nion o f Soviet Socialist
Republics
A lbaniaBulgariaCzechoslovakia (L)G erm an Dem ocratic Republic H ungar؛? (L)
37

MalaysiaMaldivesPakistanPhilippinesR epublic o fK o reaSingaporeSri EankaThailand
BhutanBruneiBurntaDetnoeratic KantpuclteaEast T im orHong KongIndiaIndonesia
in Europe ء'،ءء Code 11 — Developing م،«»مM alta
Code 12 — Developing countries and territories in OceaniaNew Hebrides Papua New G uinea SamoaSolomon Islands Tonga Tuvalu W ake Bland
A m erican Samoa Gbristm as Island (British) FijiErencb Polynesia G ilbert Islands G uam N auruN ew Galedonia
South America: western 9.4ءء،ها،محمهاGltile Ecuador
Golom bia Peru
9.5 South America: eastern seaboardArgentina Paraguai، (L)Brazil Uruguay
Falkland Islands [Malvinas]
territories in Asia ا«مح، Developing countries — ٠/ Code
LebanonG m anG atarSaudi Arabia Syrian A rab R epublic U nited Arab Emirates Yemen
10.1 Western Asia Bahrain CyprusD em ocratic Yemen Iran Iraq Israel Iordan Kuwait10.2 Southern and Eastern Asia
M acaoBangladesh

to geographical areas, 1965,1970,1974 and 1975 ة
{Millions o f tons)
ANNEX [[
World؟
Total٠//
goods
Goods unloadedGoods I
Drycargo
PetroleumPetroleum
Crude Products
Totalall
goodsCrude Products cargo
طء،ءممandyear
232.0 65.3 155.2 294.0314.0 73.4 103.6 170.0 347.0351.6 188.5 106.0 191.1 485.6348.2 210.8 89.0 179.5 479.3
198.7435.9597.^549.4
34.4
41.4
768.5 1 17^.8 1 397.9
247.9 ١
12.417.625.026.8
43.0 64.867.0
14.422.0
22.0
31.133.8
39.8
115.0235.1
302.1
24.724.0
6.26.2
11.310.6
22.629.241.944.0
11.917.629.0
11.824.418.018.7
16.3179
32.0
14.030.430.^
2.0
4.84.0
1.52.6 1.1
1.93.0
0.30.44.02.4
17M
225.9
18.718.8
10.9
324.0 89.2 355.3608.2 100.2 464.4711.3 108.5 578.1625.9 110.8 511.2
4.7
12.615.0
2.410.820.419.4
4.4
0.25.4
10.99.95.45.7
41.967.170.1
26.593.6
168.6173.4
233.5 340.0431.4396.4
19.120.7
26.1
79.1 106.9١ ١«?119.8
7.6
16.2 20.3
117.2 255.4158.3148.4
308.0
340.8
??»41.665.0
25.292.3
166.0170.4
182.4 ?47 1 321.2 291.1
!ة؛:20.5
22.134.8 45.444.8
32.8 46.0
46.8
7.6
2.02.1
29.2
31.87 4 ?
3.4
7.16.0
0.80.3
1.21.32.4
50.881.7
0.3
0.2
3.63.43.1
18.022.930.230.8
0.10.20.2
3.4
39
0.10.7
1.4
0.20.2
0.316.323.6
0.40.2
40.042.2
4.08.0
221.4120.2
Developed market-economy countriesNorth America
1965 ..........................................................1970 ..........................................................1974 ..........................................................1975 .............................................................
Japan1965 ..........................................................1970 ..........................................................1974 ..........................................................1975 ..........................................................
Australia and New Zealand1965 ..........................................................1970 ..........................................................1974 . . . . . . . . . . . . .1975 ..........................................................
Enrope1965 ..........................................................1970 ..........................................................1974 ..........................................................1975 ..........................................................
South Africa1965 ..........................................................1970 ..........................................................1974 ..........................................................1975 ..........................................................
Socialist countries ofEastern Europe and AsiaSocialist countries ofEastern Europe
(excluding the USSR)1965 ..........................................................1970 ..........................................................1974 ..........................................................1975 ..........................................................
USSR1965 ..........................................................1970 ..........................................................1974 ..........................................................1975 ..........................................................
Socialist countries of Asia1965 .1970 ..........................................................1974 ..........................................................1975 ..........................................................
Developing countries and territoriesNorthern Africa
1965 .......................................................... ١٠٦٨
1974 975<

ANNEX [[ (مء،«ء>ا«محء)
1975 areas, 1965,1970,1974 and اca!ء ؛ traded according to g€0graاا(Millions oftons)
World؛
Totalalt
ءمحممء،محءاهءمحس/««ءمحهمء س/
٠٢٢cargo
Petroleum
Crude Products
TotalallDry
cargo
Petroleum
Crude ProductsArea^
andyear
132020
16762 5303 254 3 055
14.8 17.416.9
6.0
10.5
7.711.2
13.0
4.1
1о!б12.1
I7.6
13.119.8
13.717.7 34.339.7
61.9101.2102.0
0.40.70.60.8
1.72.9
832 1 127 1471 1395
4.64.03.4
3.0
3.04.56.4
3.4
3.0ة:أ3.0ئ:ئ0.8
1.41.0
17.0
19.318.6
0.20.30.30.3
0.91.62.42.4
222302312286
423
ة
6
7
536340
18.
10.9
30.0
23.354.7
56.1123.0192.9173.3
11.5 17.317.6 16.0
20.6
32.7
19.920.7
250.2 278.9219.0179.4
32.7
34.4
35.355.594.7
105.5
674.2 1 068.8
960.7
93.3148.0204.5 195.4
41.161.563.667.7
11.016.1 16.514.8
20.4
25.8 23.3
11.917.314.2
27.736.0
30.4
25.929.8
l â
34.454.3 93.6
103.7
6.012.014.3
65.5
114.4107.4
0.1 —0.1
0.31.0
0.51.21.11.2
0.21.4
25.29.4
2.63.72.11.5
99.2
87.6 64.4
0.8
0.81.10.50.9
43.3 66.253.6 50.9
13.123.7 23.6
— 5.6 5.6 —0.2 9.5 9.7 0.
10.8 10.8 1.0.1 8.3 8.4 ١•
240 812 1674 622330 1 165 2 605 1 101335 1471 3 304 1470280 1428 3 072 1374
Western Africa1965 ................................................................... 14.71970 ................................................................... 60.51974 ................................................................... 127.71975 ................................................................... 104.0
Eastern Africa1965 ................................................................... —1970 .................................................... —1974 ................................................................... —1975 ................................................................... —
€ari№ean and North A!^erica1965 ................................................................... —1970 ................................................................... —1974 ................................................................... 7.01975 . . . . . . . . . . . . . . . —
©entrai A،nerica1965 ................................................................... 1.01970 ................................................................... —1974 ................................................................... 0.51975 ................................................................... 5.0
South America: northern seaboard1965 ................................................................... 123.31970 ................................................................... 131.11974 ................................................................... 93.41975 ................................................................... 84.6
South America: western seaboard1965 ............................................................... 6.01970 ................................................................... 4.61974 ................................................................... 8.91975 ................................................................... 8.4
South America: eastern seaboard1965 ......................................................................... —1970 ................................................................... 0.11974 .............................................................. 0.61975 ................................................................... 0.9
Western Asia1965 ................................................................... 348.71970 ................................................................... 601.91974 ................................................................... 1 003.21975 ................................................................... 895.5
Southern and Eastern Asia (n.e.s.)1965 ................................................................... 14.61970 ................................................................... 35.01974 ................................................................... 66.51975 ................................................................... 66.1
Developing countries in Europe1965 .................................................................................1970 .................................................................................1974 ......................................................................... —1975 ......................................................................... —
Oceania n.e.s.1965 ......................................................................... —1970 ......................................................................... —1974 ......................................................................... —1975 ......................................................................... —
W o r l d t o t a l ،1965 ........................................................................ 6221970 ................................................................... 1 1111974 ................................................................... 1 4971975 ................................................................... 1 364
St. Lawrence tra^e (in dry cargo) amounted to 37 million tons in 1965, 42 million tons in 36 , ا97م million tons in!974,and 39 million tons in 1975.
.See annex 1 ofthe present review for the composition of these groups ءأ.Figures rounded to the nearest million ء
Source: Data communicated to the UNCTAD secretariat by the Statistical Office ofthe United Nations Secretariat.
reat Lakes and ^t. Lawrence^ ؟Including international cargoes loaded at ports of th ءsystem for unloading at ports of the system and including i»troleum imports into Netherlands Antilles and Trinidad and Tobago for refining and re-export. Great Lakes and

ANNEX III
Merchant fleets ofthe world by flag of registration®, groups of countries and types of shlps,^ In g.r.t. and d.w.t., as at 1 July 1977
(d.w .t.figures are shown in parentheses except in cases where such data are « ٠؛هه/،ةه/رء
OthersContainer
shipsBulk
carriers^٠//
tankersTotal
33 826 283
140 802
2ا8و73
306 573
833 437
056 49
363 238
343 865
871 544
405
776 667
9 4 9 1 8
316 38
133026 1
815 659 3
428 562
797 43
229 147 2
982 179
322 144
942 872
46 1 4 0 7
7 543 242
92 508
8 800
58 821
424 0 4 8
3 895
253 332
708 2 1 6
20 738
6 530
171241
1 261 599
182 537
6 260
2 994
33 610
66916
7 5 4 4 3 4 1 5
265 870
32 639
351 443
105 270
1 148 723
8 054
451 962
1 351 686
2 653 283
576
8 523 438
69 350
20 111
1 134619
4 519912
1 658 270
123 223
1 585218
368 664
243 178
946 581
963010
97 860 659 (169 489 113)
590 745 (965 827)
11845 (18 224)
675 009 (1 182 580)
128 742 (268 756)
637 836 (1 052 812)
173 819 548 (334 781 702)
284 272 (466 625)
2916 4 3 (514 162)
205 494 (283 713)
5 126 628)
1 166 590 401285(2 068 514) (680 155)7 512 825 1 630 673
(14 504450) (2 860910)3 534 126 2 151818
(6 799 298) (3 724 178)
(14 13ث)9 725 491 10579616
(18040675) (18410094)
142 943 (226 822)
3 987 407 (6 853 445)
13 477 764 (22 483 685)
601 478 (973 190)
9 6 1 2 9 4 8(1 6 6 1 2 3 8 9 )
73 204 (117063)
40 463 (64 324)
(455 940 ١)
2 2 2 4 8 1 9 (444 860 3)
2 434 (3 756)
3 972 (5 382)
4 684 889 (8 679317)
17 116 763 (32 485 230)
2 285 647 (4 207 833)
32 442 (51 003)
1 4400 791 (28 103 105)
45 367 (73 767)
4 2 1 7 3 6 2(7 8 1 4 7 8 2 )
3 7 1 3 2 4 2 (7 265 150)
W o r l d t o t a l ؛؛ 147 493 388 (641 315 662)
D e v e l o p e d m a r k e t -e c o n o m y
COUNTRIES
A ustralia 1 374 197(1910403)
A u s t r i a 53284(76377)
Belgium . . . . . . . . . . 1 595489(2 437 681)
C a n a d a 1 030 377(853 050)
Denmark 5 331 165(8 567 313)
Eaeroe Is la n d s 57 110(32 993)
? I n l a n d 2262095(3 414 997)
F r a n c e 11613 859(20 051 782)
Germany, Federal Republic of . . 9 592 314(15 584 267)
G ibraltar 549 0 ا(15 730)
G r e e c e 29 5f7059(49 322789)
I c e l a n d 166 702(144 421)
I r e l a n d 211872(281031)
I t a l y 11111182(17 732 545)
J a p a n 40 035 853(65 869 598)
Netherlands 5290360(8 055 125)
New Z e a la n d 199 462(210 587)
N o rw a y 27 801 471(49 192 943)
P o rtu g a l 1 281 439(1 906 937)
South A f r i c a 476 324(544 599)
S p a in 7 186081(11 711 543)
S w e d e n 7 4^9 394(12616984)
41

ANNEX III (continued)
Merchant fleets ofthe world by flag ofregistration^ grongs of conntries and tyges of ships,؛’ In g.r.t. and d.w.t., as at 1 July 1977
(d.w.t. figures are shown ١« parentheses except in cases where such data are «٠؛ available)
Others
18 131749
Containerships
Genera,cargo°
Bulkcarriers^
٠١/tankersTotal
S w itz e r la n d .................................................... 252 746 — 125 121 121 25© — 6 375(382 ©71) (199 6^3)
T u r k e y ................................................. 1 288 282 366 610 333 055 468 771 — 119 846(1 821 282) (607 456) (547 912)
U nited K in g d o m ................................. 31 646 351 14 834 078 8 259 967 4 228 484 ! 470 518 2 853 304(51 722 148) (2 8 0 4 3 0 3 5 ) (1 4 2 6 3 9 3 3 )
U nited States o f A m erica . . . . 11 907 030 5 740 782 270 171 2 153 763 1 712 399 2 029 915(17 167 593) (10 661 132) 489 043)
Y n g o s la v ia .................................................. ^ 2 8 4 5 2 6 233 774 816088 1 166639 2 0 2 2 6 4 7 7 9 9(3 445 194) (393 834) (1 377 139)
>578 03834 663 987(99 187 138)
93 734 648 (177 408 116)
211 006 573 (345 071 983)
Su b t o t a l ; deve lo p ed m arket- eco n o m y co u n tries
95 037
1 717 578
1 564
1299 792
186 609
178
5081
299 281
136 938
162 076
2 1 7 5 1 1 1
3951 127
4 573
7 208 396
2 041 303
123942
210 9 8 0 (330 690)
(42 732 312)
4 289 344 (7 096 677)
1^9 7 586 (2 162 461)
9 054 (13 184)
301 699 (481000)
50 772 231 (105012 525)
6 523 949 (12 470 302)
3 103 824 (5911 644)
24 992 (39 076)
O pen r eg istr y gg u n tr ies
C y p r u s ................................................. 2 787 908(4 0 1 5 4 2 8 )
L i b e r i a ................................................. 79 982 968(155951 179)
O m an ................................................. 6 137(9 339)
P a n a m a ................................................. 19 458 419(31 593 234)
S i n g a p u r e ............................................ 6 791 398(11 351 841)
S o m a l i a ................................................. 158 166(229451)
SuBTO TA E;openregistry 109 184996 60 726 695 2 9 0 4 9 715 15 5044 5 2 603 376 3 300 758co u n tr ie s (203 150472) (123 914 547) (52 335 324)
55 870 (74 457)
54 631 1239
964 156 (1 294 978)
290 2 3 9 (460 814)
2 3 3 ^7 0 (336 341)
322 499-
118 148
148 689 (224 794) -
589 ?١٨ (382 164)
4 100- -
1 486 838 (1 950 208)
275 441 (488 654)
743 803-
??او4?
6 3 0 1 6 (87 760) - -
6 3 0 1 6- -
3 4 4 7 5 1 7 (4 892 102)
572 131 (1 028 817)
1 203 981 (1 927 522)
1 254 204-
417291
1218 171 (1 7 2 7 609) (437 750)
464 376 (714 308)
369 407-
137 461
21 438 291 (23 041 993)
4 385 489 (6 740 060)
1 229 165 (1 906 253)
7 515477 108 780 8 199 380
102 662108 78010 369 137471 7 4 ؛2؛417 806)
5 770 227 (9 162 095)
؛548؛901)
So cia list c o u n t r ies o f E a ster n E u r o p e a n o A sia
Socialist countries o fE aste rn Europe
A lbania . . ٠ ٠ . ٠ ٠ . . .
Bulgaria . . . . . . . . . .
Czechoslovakia . . . . . . .
G erm an O em ocratic R epublic . .
Hungary . . . . . . . . . .
Poland . . . . . . . . . .
R om ania . . . . . . . . .
U nion o f Soviet Socialist R epublics
Su b to ta l . . . . . . . .3؛ 3)
42

ANNEX ا!ل (continued)
s,b in g.r.t. and d.w.t., as at 1 July 1977Merchant fleets ofthe ١(d.w.t.figures ٠٢،? shown in parentheses except in cases where such data are not available)
OthersContainer
ships^ ٠٠Bulk
carriers^٠//
tankersTotal
174518
38 790
13 754
227 062
f08 780 9 329 724
— 246 63•
— 2580
— 9f2
— ا714
4172 —
883 53 —
796 —
043 2 —
967 —
655 46 —
397 ١ —
— 2f9
— 12 644
— 3f68
— 4 965
— 4 375
— 56763
746 576؛327 940(ا 243 84ا)
9964ا2(ا 673 425)
21734 (252 33)
906 33(5562f)
746 576؛437 763(f 243 841)
1 052 052 (• 762 298)
4ا831ة 12806900 2(647 661 6)
123 034
17؛
؛252
227 048
3 070
21 142
22 131
641
136 041
436
103 073
9 320
36 332
33 561
32913
75456
63 094 (93 612)
10 764 (15 290)
623 203 (1 204 199)
1875 (2 750)
139(59)
126 887 (207 547)
2051 (2 980)74471
(141 158)
32 494 (49 500)
2 704 ؛؛؛?..ظ(642 4)1324
(319 2)
105 582 (186 773)
Socialist countries o f AsiaC h i n a 4 245 446
(6 256 880)
D em ocratic People’s R epublic o f 89 482K o r e a (101117)
Socialist R epublic o fV ie t N am . . 128 525(175 712)
Subtotal 4 4 6 3 4 5 3(6 533 709)
S u b to ta l : Socialist countries ٠٢ 33 286 001Eastern E urope and A sia (39 827 610)
Developing countries ofAfiicaA l g e r i a 1 055 962
(1 6 5 1 3 1 5 )
A n g o l a 22 043(26 627)
R e n i n 912(255)
C ape Verde Islands . . . . . . 3 966(5 187)
C o m o ro s 765(1051)
Congo 4 172(483)
E g y p t 407 818(533 387)
Equatorial C uinea ٠ . ٠ . ٠ ٠ 3 0 7 0
E t h i o p i a . . . . . . . . . . 23 989(30 985)
G abon 9 8 6 4 5(171 025)
G a m b i a 1 608(• 328)
G hana 182 696(208211)
G u i n e a 12 597(16 787)
G uinea B i s s a u 219
Ivory C o a s t . . . . . . . . . 115717(147 682)
Kenya 15 192(19 883)
Libyan A rab Jam ahiriya . . . . 673 969(029 195 ١)
M adagascar ...................................... 3 9 8 5 0(51609)
M a u r i t a n i a ...................................... 1113(645)
M a u r i t i u s ............................................ 3 7 2 8 8(46 055)
M o r o c c o ................................................. 270295(415 545)
43

1977 groups of countries and types of ships,، in g.r.t. and d.w.t., as at 1 July ؛،Merchant fleets nf the world by flag of registration(available ،٠» where such data are ءءءهء parentheses except in »١ shown ،?؛،٢ d.w.t.figures)
A NNEX 111 (continued)
OthersContainer
ships؟وءئcarriers^٠ «
tankersTolat
13 150
15 983
587 ٦?
1 120
134
5 575
8 609
13 834
14102
176 088
5 879
29 958
5 042
42 255
46 552
5 5 1 0
25 078
26 765
95 951
55 1 3
20 157 (32 173)
366(412)
143 469 (272 443)
3 876 (5 246)
(2 700)
26 827 (46 824)
47 577 (85 950)
(261)
2 7 6 1 8 (24 150)
335 540 (523 446)
28 044 (26 312)
59 140 (49 676)ill43 375
(56 893)
134
100 128 (147 449)
5 5 1 0 (9 115)
78 180 (116257)
35 613 (42 446)
109 785 (157 603)
551 3 (9 110)
600 382357 323 1 509 126 516 757 1 764 1807(190575) (3 2 9 9 4 5 ؛697 551) (2
M ozam bique . . . . . . . .
N igeria . . . . . . . . . .
$enegal . . . . . . . . . .
Seychelles . . . . . . . . .
Sierra Leone . . . . . . . .
Sudan . . . . . . . . . . .
Togo . . . . . . . . . . .
T unisia - - - - - - - - - -
U ganda . . ٠ ٠ . ٠ . ٠ ٠ .
U nited ^ e^u b lic o f U am eroon . .
Uffited R epublie o f T anzania . . ٠
^a ire . ٠ ٠ ... ٠ ٠ ٠ ٠ ٠
G a m b i a
Su b t o t a l : developing eountries Afriea
DLVLtOLtNO O O U N T^S AND TLRRITORmS OF A m LR^OA
149
129 682
11544
4 157
113 787
157 832
13 326
31471
5 605
399
733 431
26 350
291
620
33 074
1 142 641
82 706
246 401
236 851
251 344 (401 449)
53 792 (82 886)
594 200 (972 468)
827 431 (1 513 835)
(36015)
66 971 (114673)
(832 863)
14631 (22 366)
1 008 861 (1 836015)
1 202 047 (2 112 391)
4 099 (6 970)
61 128 (102 734)
4 784 (6 830)
399(525)
149(182)
1 677 169 (2 262 170)
106317 (147 321)
4 448 (514)
620(800)
1 7 5 1 5 1 5 (3 040 194)
3 329 951 (5 335 672)
123 787 (176418)
405 971 (589 588)
247 240 (297 123)
Anguilla
A ntigua
A rgentina
Baham as
BarhadDs
Belize
Berm uda
Brazil
U aym anfslands
Uhile
C olom bia
44

1977 in g.r.t. and d.w.t., as at 1 July ,،؛Merchant fleets ofthe wort<t by flag of registration gronps ofcountries and types ofsblpsه/ء) (d.w.t.figures are shown in parentheses except in cases where such data ٥٢?، «٠،هه/،ء
ANNEX !!! (continued)
OthersContainer
shipsBulk
carriers^Oil
tankersTotal
1327
151873
385
9 790
171
6 400
379
8 290
785
171958
4 526
4 551
133 986
105
543
12 142
124
11567
114242
720
436
5 484
4 2 1 4 1 8
7 4 1 0
73 485
1816
537
11475
6 358
99 240
6 290
133 589
1248
24 825
15 566
194 096
387
7 498
6241
3 3 1 4
1 782
47 607
248 238
3 337
29 845 (49 933)
32 105 (50 760)
147 548 (261 871)
9 070 (13921)
64 382 (97 072)
674 (1 609)
113969 (189 226)
(1 745)
1364 (2 303)
336 312 (539 062)
5 237 (7 972)
1813 (2 514)
79 789 (121 128)
387(444)
208(354)
1736 (2 ООО)
499(850)
133618 (232 864)
267 846 (392 759)
6811 (7 370)
667 518 (839 416)
8 469 (11 894)
197 244 (277 131)
1987 (3 303)
6 93? (4 383)
(340)
(16 076)
16274 (15 180)
104 903 (116317)
7 075 (5 864)
673 964 (890 370)
(أ 86أ)قةمح >ة2 1 9 3 0
(619 23)
419 555 (421 687)
أ90)
928(911)
428 8 (209 11)
77^7 (086 9)
192 17 (1 0947)
405 2 (700 3)
792 192 (239 309)
396 639 (397 780)
057 4 (335 5)
؛035 962؛824005؛1107029 026(811 1497
722 867 3 (071 512 6)
744 836 10 (992 15929)
C osta R ica . . . . . . . . .
C uba - - - - -
D om inican R epublic - - - - -
Ecuador . . . . . . . . . .
E l Salvador . . . . . . . . .
Falk land Islands . . . . . . .
G renada . . ٠ . ٠ ٠ . . . .
G uatem ala . . . . . . . . .
G uyana . . . . . . . . . .
H onduras - - - - - - - - -
Jam aica . . . . . . . . . .
M exico . . . . . . . . . .
M ontserrat . . . . . . . . .
N icaragua . . . . . . . . .
?araguay . . . . . . . . . .
Reru . . . . . . . . . . .
St. K itts-Nevis . . . . . . . .
St. Lucia ٠ ٠ ٠ ٠ ٠ . . . . .
St. V incent . ٠ . ٠ ٠ . ٠ ٠ .
Surinam . . . . . . . . . .
T r i^ d a d and Tobago . . . . .
T urks and Caicos Islands . . . .
U ruguay ٠ ٠ ٠ ٠ ٠ ٠ ٠ ٠ ٠ ٠
V enezuela . . . . . . . . .
V irgin Islands (British) . . . . .
Su b t o t a l : developing countries and territories o f A m erica
45

1977 in g.r.t. and d.w.t., as at 1 July ,؛?s of sblps؛^؛Merchant Beets ofthe world by Bag of registration® groups of eonntrles and t(d.w.t.figures ٠٢?، shown ؛>،م٠٢؛«?،م?،؛ء?،ءم?،ءعء؛ inء?،ءمء ءس٢?،اع،،ء!هءهمح ٠٢?، «٠، هم/امإلم/رء
ANNEX III (continued)
OthersContainer
ءйrء٠قتي>اء>ءء « / ء
carriers^/رم
tankers/ا،،مآ
3 553
20 944
616
9 990
2 560
3 135
22 752
160 951
186 466
75 683
5 182
200
5 020
77 358
1844
18470
12 140
121 586
324 996
46 365
10026
55 200
ا 884
1943
146 126
51 2 5 4
998
2.55 3
117830
741 833 1
831 2 9 7
671 347
852 104
496
033 673
989 221
322 178
645 106
4 1 9 2 8 6
064 542
689 627
132 113
6 1 2 0 0
752 55 (026 93)
860 12 (822 18)
728 300 (760 482)
21903(32919)
961 187 (317 9 4 0)
(406 648)
ا) (س4 1 4 7 2
(623 63)
(519 7)
26 032 387865(43 705) (657 515)
1 146718 2 340 766(2 044 571) (4051 040)
101 138 44 272(153 273) (65 858)
616555 (1 154 026)
978 6 6 4 (1 853 095) -
368 206423(642) (314263)
775 078 1 (546 071 2)
1
(iSS Ü )294918
(797 526)
626 053 1 (053 965 1)
859216 (131 578 1)
2 1 3 5 5 (432 36)
D e v e l o p in g c o u n t r ie s a n d
TER^TORIES 0 ? A sia
B a h r a i n ................................................. 6 409
B a n g la d e s h . . . . . . . . . 2 4 4 3 1 4(347019)
Brunei ................................................. 899(896)
Burm a ................................................. 6 7 5 0 2(76 859)
D em ccratlc K am puchea . . . . 3 558(3 779)
Dem ocratic Y em en . . . . . . 6 3 9 0
Hong K o n g . . . . . . . . . 609 6 7 9(896 350)
I n d i a ....................................................... 5 482 176(8 746 101)
I n d o n e s i a ............................................ ١ 163 173(1 462 858)
I r a n ....................................................... 1 002 061(1 666093)
I r a q ....................................................... ١ 135 245(2 022 176)
I s r a e l ....................................................... 404 651(541 231)
Jordan ................................................. .ح .ء:؛696 م. ش(3 130995)
Lebanon . ٠ ...................................... 227 009(307879)
M a la y s ia ................................................. 563 666(815 391)
M a ld iv e s . 110681(137470)
P a k i s t a n ................................................. 475 600(634 581)
Q a t a r ....................................................... 84 710(149 361)
P h i l ip p in e s ............................................ 1146 529
أ ة ئ إ:م . 'ة . . . . .
Saudi A rabia . . . . . . . . 1 0 1 8 7 1 3(1 739 408)
Sri Lanka ............................................ 92 581(126 998)
46

ANNEX III (concluded)
1977 Merchant fleets ofthe world hy flag of registration^ groups of countries and types of ships,، In g.r.t. and d.w.t., as at 1 July
(available ،؛،٢?، «٠ d.w .t.figures are shown in parentheses except in cases where such data)
OthersContainer
shipsBulk
carriers^٠//
tankersTotal
1636
13 065
176
238 893
19 101
9 1 0 4 8
2 3 2 9 1 0
19043
103 672
64 353
1260
143 927 (249 278)
77 899 (146 162)
20 679 (31003)
260 664 (401 951)
152 100 (249 164)
1436 (1 850)
؛352
؛977
3 957 089 (6 682 549)
20 574 (31 360)
6 545 795 (12 074 364)
23 267 (37 975)
18 109
64 702
574 683
19 564 (31 953)
534 777 (870 756)
1530 (1 598)
340 096 (609 186)
18 607 039 (29 041 367)
100 420 (141 587)
100 420 (141 587)
23 267 (37 975)
20 574 48 977 (31 360)
7 602
10 879 (10488)
254(400)
— 5 858 - 4 767
48 353 (62 014) -
19 564 25 610 (31 953) ب
3 179
12 189 (15085) -
— 11674-
515
1333(868)
— 1333
16217(15613)
1276 (1 198)
7 135
1 746 (1 955) -
— 1058
14 180 (17 117) "
— 11363■
2 8 1 7
104 897 (123 140)
1 558713 (2 331 960)
Syrian A rab R epublic - - -
T hailand . . . . . . . . . .
U nited A rab Enrirates - - - - -
Y em en . . . . . . . . . .
Su b t o t a l : developing countries and territories o f Asia
D ev elo pin g co u n t r ies o f E urore
M alta . . . . . . . . . . .
Su b t o t a l : developing countries o fE urope
D lv llo rin g c o u n t r ies a n o
TLRRITORIES OF ©CEANIA
Fiji . . . . . . . . . . .
N auru . . . . . . . . . .
New H ebrides . . . . . . . .
C ilbert I s l a n d s ......................................T u v a l u .................................................
Papua N ew G uinea . . . . . .
Solom on Islands - - - - - - -
Su b t o t a l : develo p in g co u n trie s an d te rrito rie s o f © cean ia
O ther (unallocated) . . . . .
s of America ؛ة the Great Lakes fleets ofthe United أ؛ supplementary data rSources: Lloyd’s Register ofShipping: Statistical Tables. 1977 (^ndon), ؛ the United $tates Reserve Fleet.
nd do not imply the expression of any opinion by the $ecretariat ofthe United؟ The designations employed and the presentation of matei^al in this table refer to flags of registration ءNati^nsconcerningthelegalst^usofanycountryortei^
^$hipsof!()©g.r.t.andover,excludingtheGreat^k€sfleets .Ore and bulk carriers of 6,000 g.r.t. and over, including ore/bulk/oil carriers ءد Including passenger/cargo.؛Excluding estimates of ء
United States Great Lakes Fleet
Canadian Great Lakes Fleet . . .
United $ tat^ Reserve Fleet (vessels o f ا,سمم g.r.t.andover) . . . .
Oil Bulk GeneralTotal tankers carriers cargo Others
ا692 651 25 717 1570358 20113 76 4632 842 387) (38 837) (2 746 208)
وا 792 571 6او7 1490 609 134 472 983112 549 855) (104 171) (2 206 228)1700 ООО 210000 _ 1490 ООО _2 125 000) (330 ООО)
47

Selected maximum aud minimum tramp freight rates, 1974-1977
(UnitedStates ه//ممح^بم unless otherwise specified)
ANNEX IV
1977197619751974
LowHighCommodityandroutes High Low High Low High Low
Heavy grainGulf of Mexico (United States of America)-India 60.00 45.75 28.25b 24.00b 26.50b 26.25b
. 32.00 26.50 ا6.00 ١ 3.00 2ا .25b 20.75ط . . . River Riate-Antwerp/Hanthurg rangeR 45.00، 32.50، ا9.50ء !7.20، 24.00، ا6.50ء iverP ia te -Iapan
N . ٠ . . . . 30.00 20.00 20.50 !ا.65 !6.60، .اا35ء orthPacific-Repuhlicof^rea
Coal. 25.50 ا0م50 9.00 5.65 8.00ه 5.50،ل . . . . . . . . Hampton Roads-Iapan
Sugar. ]3.90 ١ا ٠١ 5 !0.65 7.50 ا 3.65 9.90 . . . (Mauritius-United Kingdom (sterling
. 30.00 29.00 ا 6.50، ١ 6.00، 26.50، 22.00، . . . Phiiippines-United States of America
. ]0.50 4.ا0 4.00 3.00 5.00 3.ا0 . . . . . Brazii-GontinentalEurope؛ . .. 6.25 4.45 3.ا0 2.30 4.45 2.40 . . . . Monrovia-Gontinenta! Europe؛ .
Phosphate9.50 9.50 7.50 16.00 6.00! 20.75 . . . . . . . . Aqaba-West Goast India
FertilizersGuif of Mexico (United StatesofAmerica)-India؟ 65.25 48.00 42.50 25.00 23.00 23.00
ا5.00ا7.003.25[
6.25
]ا.055.90!
3.352.95
8.25
.اة00
]5.002E50!4.50
7.45
!1.9021.00
4.252.95
24.25
About 50,000 tons. ا،vol. 257, No. 4820, 8 January (,ا0<^ل0ال) .^Fairplay International Shipping Weekly
[,8.ог1976:،،(،/., vo!;2b],No.48?4, 20January]977,p;1976؛,p. П 5.бО,000-80,000 tons؛
.Di-ammonium phosphate ؟
Source: Lloyd's ءء'اء (London), 6 January 1975, 5 J؛؛nuary 1976 and 4 January •977, and, ؛or 7?9 ا , Fairplay International ءتيااء ,Weekly. (London, vot 265, No. 4924 ءا>ا]9 January 978إ , p. 89.
,Approximate levels ءb About 14,000 tons.،20,000-25,000 tons.

إ |
م■1
op بوم ء
|§إ
<
ج ؤ
و2م
0
ق٠
Цнل
ظ
ةСЛ
|ء
|ة5•О
fsи
ةص
ب٠
سهه
CS с؛3
О
оحب
ئق
ء٠٠ ■٥٠
Î Iق و
ء »د ال
2 2 N
ؤ ؤ ج
٠ \00 о
ق
! .
؛أ1§
٠م٠— CQ
IIوءI Iء و
ق
ظ
ه■آل
ة
٠
*ةئ2 تأ
IIم ء
لق
!!ءقا
؟ق قج ||ئ
ои
ءهنء٥٥■ج00م
оZ٢٠
I
م .ئ؟• ن
al
وصC}؟
و عك
Iصء: >-+ ٠٠' ٠٥ ،ء
ج أa ق i
مك о ٧ ه ء
||ق٥
ة
Iه ل
I؛asص
هض
49

0 00
ة001
ئ ؛ و
٠ •ة
؟ء
I I
؟"و
ء dقء ص
٠
ءمء
IIق و
P, ص
قؤ
о٠<N
ï 'و ة آل
أ م م ه ص ا1اقءi l l
.ء|ق
ق ا §
ج م ث ' ة
ق1
0ع
<
ت 1ةي - أ | ؤ
إل■&I٠ ة٠
؛إل1ق
ه
٩О
РЗه
IءجО
Iق
٤
оо<N
ء و
шة!قءقا
I
ج ا
|ة|ق
^٥
|ةi l^ ٤
ؤ
I-بم
II
II•SءةIءء ل م
،У
ققجقÜHوه ة ه يهب
%
هص
§ال
Û
م
!غ1 8
م.ء
_ةЙ و.
Iوтзه
ق
о
I .ة
го ،م
iо
هXI
ЛةOnم ي
قق
إجمة15.ء
IIIة*ةIÎI:
и ج ق
^i . s I ؟أ c؟i ء3ج
l u
гаءгаهитз1ق8اء>о u و
مго آل ي م ي
г!ة!
ء ؛إ
и ة و»■ё н ته .قة
ои
I
§и
٣يم
о
Sص
قم>-+
ئهجله
ه ظ >هخ гаم
ده.ء
1،1
<
ل
и
ئ ء
١١C J^ء آلf «
II،ة ،ق
I
ءم
1|جأء
هم
§ع
I%٤!
.S ئ
50

ؤ إ
إق•|||أ ؛ محه
دص
هه
ؤه
i l lه ÔS ء و
ة ا قق 1 و 1 1
1ق«
ا ءCQ ÇQ
قد ههPQ
Во
| i
-Оءn
ةه
٠ й
هО
ةئح٠٠
о ٧٦؛ي
С •Ç•ه ٠٠ هه ٠
م
соЛة
N>ه
11!وء هءء ا
ه
иÛ|ة | |
0
٠٠م
IIةи
ءاق |I I
! ه ته я ؛٤5^٧
ОХي
ق ء
ي ٢٢
إلةه و
ه و .و ءهи
Ü
а و •ة د
٧٦ ١٥ ٢٢ ٢٢
إ
م٠СЗ
ه
ده
S ث|ئ
IÛ
■ة S ء .ء'ئ ج
C ’aو © ح م
ة
I I§ و
آ ر >< N ٣٦
٢٢ ٢٢
إ
ة1 ة ة
й и
i f
ة؛م ؟
1قج 0ьتح
ئ 0 .ج و 1غ دآلS ٠؟ ا و
ا وءه
о م—' ٠١ ٣٦ ٢٢ ٢٢
Лه
أ
ق مطة
I § ٢٨ ج؟ ة
ج وJ g
هء٢٠ه
٠
pH
ة
٢٠ m
P
I
ء |دم ق
ء ■'ئ
■ёЯه ح ب مم -0 ي
i l l

Iةجخ٩о(N
ة
I
)ه ئ
II0- ' ؛٠
٥٠ أ ت О إل П،
IIs i s
I I
X ]S S
٥о
I
I
00ه
|م
ق
ئ و;٥٠
زإ
IIill
ة - ة
دة٥
о
о
II
إألjl
P i sه ه >ه ^ و
؟أألمقأأ؟إ
ة
د هCQءه
СЛ م
ة ء
l i lق أ .ؤ
م د ء
ه
!.3 ة
11ب ٢٠
|ئ
bи
111IIIق و و
оةи
٥٥
هصو
هи
؟ل
ءи
iهо
иج
لئ
وءئ ج ن
оء
Ü
د روÜо
هо
ه
هSIه
ة
« لهءء
غ ظه00
ا1؛
ص03
،ج
ج
م2
ص40
ءف40ب
03ÿ éو ء
1.1cdئ ٠٦
٥٥ة ن ى غ ح ن ؛؛ م
s i!؟ -إلرؤ’ة ’
pH ء
.ة ء
زة ءهءة هة ع .ة
ة
ج ٥هه
I Iو ة | ؛
s i ' l lة وق W
II
M
أ | g ة.
о٤ ٤٥.ئه
<
>ة٥٤٤٤ ٥>٥ة
52

iiïi!
ة
Iءمءد
ظ
د
Hوء
1د ٠С
قمحة
Оص
PQ||
ج
Р
ق
О
|ا|
م
٢٠!
]أ
ة
ؤ“1I
а ه 0 ء0
م0а٠
N>هة
ةО
٢٠ ٢٠ وء ٢٠<
ءو هم وСа••ء
оن
طأ
I٢٠
ت
٢٠٢٦ه٠٠٠
Ü
и
G
Ооо
о
٠٢٠هةة
ه ء
ه٠
ءоиق
'TDء٢٠
ه
تة ه|ج
ء.ء
H
ءة ة2о н"
٤!S .|
O'•сله'
0
iهة
иهءإل
مإ٧
أل
ه
I ىدؤ
ا أpH о
СЛ0
٤٠ о٧ ٧
رح ٠ ٠ ٠١ о م—'
о٧
٧ ةء |
.ءة,تأ
ء إ
« ٧
III|ةج
1|ة
مألئ
ة
W!ة
и
دء .إل
ق
o U
|1
ء
٢٠ء"0
ق٠٥О
حء
ء٠٠
I I0§ن
•ء ص؛٠ ص
ة ء
هء
ته 0g I
|ةع0
ت
«
Î٢٠CQ
٠ ٠ م
-٩٩

ج
ء ه
II؛■هTJ -
»“ ؛وق |
4040
،&و
محم0
ئ ق
I
и
!ظ
؛؛ة &
1ة
1ت 1|
ه٢٠О
و
| |
|أ §|1أة ة ه
ق Р ؛
ل3ءقمح^ ٣؛
ه٠
٠،هقءم
لهIإه
له طء ٤
а٠
- يم 0©
|ءئ
إ
ؤإيم
ء ء ب ص د د
ق
ه
ه
٢٠
lyما “
ق !T3 ثمة-ب ه
ق ة
ج
l l l l g
محم IIIع: ؛ه ىI ٧;
حم
"0.ة
! ٤
оهية
•§<■دؤ
ةن
ه
ءةI qء > ئ وء
Й ة به .و
ои
ؤ
4 0О
*o
оه
ج ء ؤه
ه ى
ؤج I ؛ق آل
فоء
и
Iق
|ء |م
о به ؛؛
ته <со 0 ي 0
|ة|إ|0 0
54

جо&
مو٠
ص
■ة
ق؛ته
|1| |
о ؛ Г 00"؟ ص هء
0 0٠٢٨
|مح0 3
^٥ rs ج
جم
ء و
Г
ة ق
Q .ي
ق ا٠١ ,ج م4 ؤ
!ة م0
»
٧ةةإل ةIIأ
٤ ٤я ئ
هо
هоي ة | ة ٥يه0ثج ٥
ГЧ
ه|أ| ٥ ة ر ٥!ق|ة
ج
Iؤ ؤإل
S ةق وy w
| |
هОراص
ق
и
ع دو٦тз؟
Jiu § щ همه
!ق
bиهслظ
о ئ ن ء
ءه
и
ث
bиق ء ه
مء
|آل | |
ل أ |ةو م و
0ه٠ ٠
оءи
Cdهذه
ج
pH
ه
ق و
ء |
i l
أه6جا بОcd
ةS
о ق
هUh
|ة |٢٢١ ٢٨
٥ق
موء
|ج ج
|ة
bZ
I
فШ
'٧
ف
ك أ
■I ^1ظ
- م
S S
S §ه ن
|ق|ق
ن ق
؛ _و
00 ٠١ о —
bи
فج
ق ،!إ
55

٠
س Iص مم
«Iوء
م 04 ٢٠ о د
I K i
؛أ؛ا'قةةمم
1 1 1га ٠؛= ء
Q S
II
ت ة
ق1توتج ؛ا ت ق ا
ا ؛ ! !
га ىءم ,CQ
غ
€
§ةa l
!؛؛ل م
Qffi؛
IH
٠٤
•оg
ة1
aоق ٤ة
ةم
م٠ء ١
ج ■■يه يمI I٤ ٤§I«
I
0ءW
و
ÎI؟ق
ء ج
Ü
إ تP
وحه م
ا-،ئ.
حX؛
S
H
•оء
٤٨СЛ ة نؤ
جء
Ü تإ.
ة
جد
i i l èه و
ؤدم يب م
د
bиbиؤ
ق
أ |
م
ضجوI
٠ ٥
> ؛ءد
«أ
‘I ة
ة
гаه"0
ه
!СЛ
||ي

ظ
قо وج ج•ت ©٠II٠• ٠؛
|أс о
ТЗ ء،.С о
ر Мق!ة ه
ه ء
О С
I' ج
«
!|ق
ق |وة 1ق ؛
!أ
ء م
ق
§؛إ!!»ة
00ج
о оء ه
О О ОIو II IوI
Йم
— — ٢٢
Iج
جند
Цнص
ق سم حؤ
و و
соنمأ
مأل
bم
م
ة ك |نق “ق ق
ؤ
قج ل■ةم.ح
•0сد
أ
ئоئ
иج ر٥■٥٠
ق о о S Iء
со
ة
ة ؤ
<
#قтз ن
>رجم.ء■ج
٠م0 ٥
ءقق
فО
и
Iة
s:ء
؛<
i. сл ة
иج ل
Iظ
ء
ق٠ ٥
ء
ةи٠ص ٠ ٥о
بو و
II
ج و .ؤ .ة
ص
ق:آل!■!أ
ن§ج ر
gهئ
•0٢ ٠
тзс
Iыо
s ج
и
iصه
и٥ ٥
■٥٥
îоم
?و

أ - ةآلء
ت-بم
!قه
ضد
ه
' с Оج ص
ءي
1أثم €ث ص ه
ق |و
-؟ة| ؤة ٠
ى م إم &و ج٤٤ О
cdص ٠
ق؛ق ةتءممةه1
1|أ |
1ء | ؛
ة
СЗمن
H I<xt I
cdم
|ةةءه•gه٠ ٠
a sص-о يم .
هо
|أ|ة' ة ! أ
ق
ه
,ي ء
ه٠Ï I '
а а٠ ٠
I
Î
دؤ ذتي دوص ص ص
I I I٥ ٥ ٥
Iة
Iإل.ه
صءدو ٠оهال ال
٥0 0
ه
وه
ة
•هо
о به
§( قء ء ٠٥ د
•ق ة بمه
!إ
§и
ه د
أ ة ح جص04
هО
о٠ ٠ ٠ئطcd
مء
I;I S
§ق و له
.ءم
H
! ٤
ف
оهО٠ ٥
jصم
ء
H
لهE
У.
и
2 جه ل
•ء دءف
С
يOV
ءة ' ء ه '
^ ^٠ ٠١ ٠١ ٠١
Iه
Оиçd
ةIIة ة
т зء
.أه له< ة — ه ،
ج د
؛؛=■« أ
СЛ
оهи
H
G
له
|إ
ق §أةة
^٦٠§ة
ةg
جи
ةcd
ء cd cd ا
و §أ о ،٢١ ء٧٥
وق ب

ء
ء
ق
||إ|ةة؟ه تءо •C _ ق" ،٨ ص
هоخق٠٠
ق
رحIТЗ٠٢٠ق ء
ب0'
د
هо
ج
ءةهةо
١٠٠ ٧٦
٢٠ ه
٢٠
.٢٠ Йء0.
قأ |at
٤ .؟9Оة
IIЫР5
§قئ1 "
ةهة
٤ ٤ص ه
ON 0Oо00٠
еаه
٠
IIة§وIIIH-» ب
ن
I
Û
ة
ق
ء§ة
ظP
S جر
Pن
غ ءي؛3
قن
هه
له بمنا
I I
га ء га ه له ه ٢٠ аبم،بم ،بم
ةТЗ
Iأ
م0.
Iلهو
S يق
أ §دن
11
صئط
ëهئОо٠ ٥
جТЗ
I٠٢٠*га
С
ج
ا ئ٢٠
I٢٠
ئЧ-М
بله و
له S ة ق٣ ق ءقиه lu §
،Уس га١٦ص يم
ءد
0
S ه
1 ة :
؟ك؛٧
Û
إؤج و ج :
0
آلء؟Лق
ة
ق
ئ
8.
له
ء
٠
٢٠ ص
l aا ت ه ل .ث
ه00 0400
هء.٧
II
и
8 ق I
га
هم
.ئ ءق ق
га ص
إ!ة*W) ■ءعق قق
ي ج [ت
٧»
آ §د8ه
га ٢٠ ٢٠ aه ه
1 ،قج 8 و
قة1م آل «U ل
ÎI •I٢٠
0 0 0. 0 04
59

g o
йةه
٠
I!
ءاقق1ق
о ة.م
ق ؛5م
F -
و ة
§ ةغ أ
ق
م
я!Iه
ة<
•ء٥
ق م ص
bPU PUIهه IIجت
bم
и
II.3ق
II• a s
i l| |؛ج نحb О
1ق
؟سا ٢٠
ئ1|ده
٠؛ء
ه
ق
٢٠ةи
م٢٠ه
0'!ئ
О§ئ
и

لخمول كية رات عل ا م ثثو ال لس ا ؛اد سكي سر دات تر ا م سر ال ت ض اس ا لكنبا نما بم تي اكرز.ع رددر ا بالم .ا تها .ا شعر، لكتبة ض ا م1 ا ر ك .مما
• جيف ادتي م.ررك■ م المع ■نم اس اآلم ت الى اكب أد
أ؛ءئ هةبم؛ق11مو اأ رو'1ءء،لءآل،8ء ء ءءبجءسهق'ة1ال،أ بملقاءآ ر ءء اأ؛«ال ءها أص همح؛ء1ه№ءبمسرهأ
ON$ PUBLICATIONS؛HOW т о OBTX!N 0N !T £O NAT
be ob ta in ed from boo]<®tores and d istr ibu tor® ؛'n a؛ U n ited Nation® p u b lica tion s e to: U n ited N a tio n s, S a le s١٧اri th rou gh ou t th e wortd. C on su lt your boob store or
.S ec tio n , N ew Y ork or G en ev a
NATIONS UNIESCOMMENT SE PBOCUBEB LES PUBLICATIONS ]
L es p u b ü cation s d es Nation® U n ie s so n t en ven te dan s le s iib ra iries e t le s a gen ces d é p o sita ires du m on d e entier . In orm؛ €?,-vous auprès de votre libraire ou ad ressez-vou s à : N a tio n s U n ie s , S ec tio n d es ven tes , N ew ^or^ ou G enève.
К А К П О Л У Ч И Т Ь И В ^ А Н П П О Р Т А Н П З А Ц И И О Ь Л » К Л П Н £ П Н Ь ؛ ^ H A l L n n
И здания Организации О бъединенных Наций N O ^ H O купить в К Н И ^ Н Ь ! Х м ага- зинах и аген тствах во всех районах мира. Наводите справки об изданиях в ваш ем книжном магаз1гне ияи нншите по адресу : Организация Объ€диненнь!х Наций, Секция по продаже изданнй, Н ьт-Н ор к или Ж енева.
CO^IO CONSEGUIB PUBLICACIONES DE LAS NACIONES UNIDAS
L as p u b b cac ion es d e la s N a c io n es U n id a s estâ n en ven ta en lib rerias y ca sa s d i s t i - buidor^s en tod as p artes d e l m u ndo. C on su lte a su librero ٠ d ir il^ se a: N a c io n es U n id a s, S eccid n d e V en tas , N u ev a York о G inebra.
U nited N ations pnhlication^ a lesN o .£ . ? 7 Price: $u.s. 7.00ه.!!.و
(or eqnlvalent in o ther ^nrrencies)Printed in Switzerland G E .79-V -52540(9631) (Jetober 1979— 3 0 م و