
Review of literature on EU ETS Performance - Öko-Institut · Geschäftsstelle Freiburg / Freiburg...
81
www.oeko.de Review of literature on EU ETS Performance A literature review and gap analysis of policy evaluations Öko-Institut Working Paper 2/2015 Sean Healy Katja Schumacher Anamaria Stroia Stephan Slingerland
Transcript of Review of literature on EU ETS Performance - Öko-Institut · Geschäftsstelle Freiburg / Freiburg...

ww
w.o
eko
.de
Review of literature on EU ETS Performance
A literature review and gap analysis of policy evaluations
Öko-Institut Working Paper 2/2015
Sean Healy
Katja Schumacher
Anamaria Stroia
Stephan Slingerland

2
Öko-Institut e.V. / Oeko-Institut e.V.
Geschäftsstelle Freiburg / Freiburg Head Office
Postfach / P.O. Box 17 71
79017 Freiburg. Deutschland / Germany
Tel.: +49 761 45295-0
Fax: +49 761 45295-288
Büro Darmstadt / Darmstadt Office
Rheinstraße 95
64295 Darmstadt. Deutschland / Germany
Tel.: +49 6151 8191-0
Fax: +49 6151 8191-133
Büro Berlin / Berlin Office
Schicklerstraße 5-7
10179 Berlin. Deutschland / Germany
Tel.: +49 30 405085-0
Fax: +49 30 405085-388
www.oeko.de

3
Review of literature on EU ETS Performance
A literature review and gap analysis of policy evaluations
Sean Healy (Öko-Institut)
Katja Schumacher (Öko-Institut)
Anamaria Stroia (REC)
Stephan Slingerland (Triple E)
Working Paper 2/2015 Öko-Institut e.V.
January 2015
Download: www.oeko.de/oekodoc/2455/2015-001-en.pdf
Disclaimer:
The contents of this report are based on research conducted in the Framework Contract EEA/ACC/13/003 conducted on behalf of the European Environment Agency (EEA). The views expressed in this paper are strictly those of the authors and do not necessarily represent the opinion of the EEA.
This work is licensed under Creative Commons Attribution-Share Alike 4.0. Oeko-
Institut e.V. 2015
Oeko-Institut’s Working Paper Series is a collection of research articles written within the scope of
the institute’s research activities. The articles present and discuss innovative approaches and
positions of current sustainability research. The series is open to work from researchers of other
institutions. The Working Papers are produced in a scrupulous scientific process without external
peer reviews.
4
Executive Summary
The EU ETS has been subject to increasing levels of scrutiny as the policy instrument has been
considered to have underperformed in recent times, also as a consequence of external shocks (i.e.
economic recession). Although the European Council Conclusions reaffirmed in October 2014 that
the EU ETS will remain the main instrument for GHG abatement, reform will be necessary to
ensure that the EU ETS functions correctly in the future and delivers a GHG reduction of 43%
below 2005 levels as outlined in the 2030 Framework. As the scheme enters a critical phase in its
development, the Öko-Institut, Triple E & REC have been commissioned by the EEA to 1) perform
a review of evaluations on the EU ETS and 2) to identify gaps that could be addressed in future
research.
Literature Review
The first part of the study focused on reviewing the existing literature, which evaluates the
performance of the EU ETS. The literature has been reviewed in accordance with five evaluation
criteria (effectiveness, efficiency, coherence, EU added value and relevance) all of which were
associated with specific questions to ensure that the review remained focused in responding to the
most important issues. The study answered each of these questions following an extensive search
of the literature, which reviewed over 250 evaluations from a range of different sources (i.e.
internet search engine results, academic papers, governmental publications) adopting a systematic
approach in order to limit bias. The main findings from the literature review are summarised in the
following for each of the review questions:
To what extent has the EU ETS driven GHG abatement in the short and long term?
GHG abatement
There is a general consensus within the literature reviewed that the EU ETS has driven GHG
abatement. However, the difficulties of establishing a business as usual (BAU) baseline to estimate
abatement (defined as the difference between verified emissions and business as usual) lead to
outcomes with greater levels of uncertainty.
To what extent has the EU ETS promoted low-carbon investments and supported the
competitiveness of European firms in the short and longer term?
Investments
There is a consensus within the literature reviewed that the EU ETS is unable to deliver both low
cost GHG reductions and promote low-carbon technology as the objectives conflict with one
another. Uncertain and currently low EUA prices have failed to promote low-carbon technologies
and complementary policies may be necessary to improve the dynamic efficiency of the EU ETS.
Carbon leakage and competitiveness

5
The consensus from the literature reviewed is that no leakage has occurred yet, which shows a
difference between ex-ante expectations and ex-post empirical analysis. No detrimental impact on
competitiveness has been observed. This may be due to economic shocks and carbon leakage
provisions. There is a high level of uncertainty on the potential extent of (future) investment
leakage.
How efficient is the implementation of the EU ETS in both the short and longer term?
Price signal
If the price signal is determined by market fundamentals this implies that the carbon price reflects
marginal abatement costs and therefore the market functions efficiently. Studies show ambiguous
results, however most support the hypothesis that price is driven by market fundamentals.
Transaction costs
The literature reviewed suggests that transaction costs are higher in a cap and trade scheme than
in a carbon tax. Transaction costs were reasonably low for the larger emitters, however transaction
costs were comparably high for smaller emitters.
To what extent has the allocation method of distributing allowances affected the efficient
functioning of the EU ETS?
Cost pass through
There is a general consensus in the literature reviewed that in the energy sector there has been a
substantial pass through of carbon costs and windfall profits. There is evidence emerging that the
energy intensive sector has also benefited from free allocation in Phase I and II of the EU ETS.
Windfall profits
Evidence in the literature reviewed shows that In Phase I and II of the EU ETS windfall profits were
high especially for electricity producers, transferring billions of euros from consumers to
shareholders.
How well does the EU ETS complement other EU climate and energy policies?
Coherence
There is a general consensus within the literature reviewed that the impact of other policies such
as the Renewable Energy (RES) and Energy Efficiency (EE) Directives have mitigated the price
signal of the EU ETS. However, it is important to acknowledge that the explicit objective for the EU
ETS to incentivise low-carbon investment was set after the RES and EE Directives were adopted.
To what extent has the implementation of the EU ETS by Member States been improved by
the adoption of more harmonised approaches?
Harmonisation and market oversight
6
Harmonised approaches have generally improved the implementation of the EU ETS by removing
the previous distortions caused by Member States interpreting rules differently.
Would alternative policy instruments at EU or national levels have been more cost effective
than the EU ETS?
Alternative policies
The main focus of the evaluations reviewed is on the added value of EU intervention with
scenarios developed to assess the impact of alternative policies such as carbon taxes and
emission performance standards or simply no policies at all. The majority of the studies evaluated
show that emission reductions are achieved at lower cost by emissions trading than by alternative
policies.
How well do the objectives of the EU ETS correspond to the needs within the EU?
Relevance of the EU ETS objectives
The objectives of the EU ETS do correspond to needs within the EU, however there is currently a
debate within the literature reviewed about whether complementary instruments are necessary to
support the EU ETS in order to fulfil the needs of the EU.
Gap Analysis
The second part of the study focused on identifying gaps in the literature evaluating the EU ETS. In
order to determine which aspects of the review questions require further research in the literature,
a matrix table was developed, which enabled the review team to categorise evaluations according
to 1) the sectoral and geographical scope 2) the content of the evaluation and 3) the methodology
applied. Evaluations were often applicable to more than one broad category and evaluation criteria
sub-field, therefore the review team were instructed to categorise evaluations to broad categories
and evaluation criteria only if the outcome of the primary research was directly applicable.
Following the categorisation of the evaluations, gaps in the literature were identified based upon
the following set of criteria:
The conclusions of policy evaluations for a broad category and evaluation criteria sub-field
were inconclusive referring to the literature review in the previous section;
The range of policy evaluation methods applied for a particular broad category and
evaluation sub-field may not be sufficiently varied or data availability was poor;
The number of policy evaluations for a broad category and evaluation criteria sub-field was
below a relative threshold (i.e. below the average);
The outcome of the gap analysis is presented in the table below which illustrates the availability of
evaluations on the performance of the EU ETS from the literature reviewed in this study.

7
Note: Evaluations are categorised under multiple categories and therefore do not add up
to the totals for each broad category under the sectoral and geographical scope.
Source: Own calculation
Broad Categories
Sectoral Scope All
Pow
er
Industr
y
Oth
er
All
Pow
er
Industr
y
Oth
er
All
Pow
er
Industr
y
Oth
er
All
Pow
er
Industr
y
Oth
er
All
Pow
er
Industr
y
Oth
er
All
Pow
er
Industr
y
Oth
er
Geographical Scope
EU 2 0 0 0 18 6 1 2 25 3 1 1 86 32 18 6 34 20 39 1 21 16 27 2
Non-EU 0 0 0 0 0 0 0 0 0 0 0 0 2 0 0 0 1 0 0 0 1 0 0 0
Evaluation Criteria
Relevance
Objectives vs needs 2 0 0 0 0 0 0 0 0 0 0 0 0 0 0 0 1 0 0 0 1 0 0 0
Other 0 0 0 0 0 0 0 0 0 0 0 0 1 0 0 0 0 0 0 0 0 0 0 0
Effectiveness
GHG abatement 0 0 0 0 4 0 0 1 4 0 0 1 13 2 0 1 18 5 1 0 6 1 0 1
Investment / innovation 0 0 0 0 2 2 0 0 4 2 1 0 6 4 2 0 9 9 8 0 12 13 10 0
Competitiveness 0 0 0 0 1 0 0 0 2 1 1 0 4 3 3 1 8 7 23 1 7 5 15 1
Carbon leakage 0 0 0 0 1 0 0 0 3 1 1 0 8 1 4 0 10 2 23 0 6 1 16 0
Other 0 0 0 0 0 0 0 0 0 0 0 0 0 0 0 0 0 0 0 0 0 0 0 0
Efficiency
Flexible mechanisms 0 0 0 0 4 1 1 1 5 0 0 0 19 2 3 2 7 0 0 0 3 0 0 0
Transaction / admin costs 0 0 0 0 1 0 0 0 2 0 0 0 11 0 1 0 1 0 0 0 2 0 0 0
Cap setting 0 0 0 0 2 0 0 0 4 0 0 0 11 1 2 0 6 1 1 0 1 1 2 0
Allocation of allowances 0 0 0 0 3 0 0 0 8 1 0 0 33 10 8 0 15 5 4 0 5 3 3 0
MRV 0 0 0 0 0 0 0 0 4 0 0 0 4 0 2 0 1 0 0 0 1 0 0 0
Price signal 0 0 0 0 4 3 1 1 4 0 0 0 30 11 1 1 3 3 0 0 2 3 0 0
Cost-pass through 0 0 0 0 0 0 0 0 0 0 0 0 3 15 7 2 1 1 3 1 0 0 1 1
Windfall profits 0 0 0 0 1 0 0 0 1 0 0 0 2 10 3 1 2 0 1 0 1 0 0 0
Structual reform 0 0 0 0 1 0 0 1 4 1 0 1 18 1 0 2 6 0 0 1 2 0 0 2
Other 0 0 0 0 0 0 0 0 1 0 0 0 2 0 1 0 0 0 0 0 0 0 0 0
EU Added Value
Alternative policies 0 0 0 0 5 1 0 1 8 2 1 1 3 0 0 1 2 0 0 0 5 2 1 1
Harmonisation 0 0 0 0 0 0 0 0 9 0 0 0 6 0 0 0 1 0 0 0 0 0 0 0
Market oversight 0 0 0 0 0 0 0 0 3 0 0 0 2 0 0 0 0 0 0 0 0 0 0 0
Other 0 0 0 0 1 0 0 0 9 0 0 0 4 0 0 0 0 0 0 0 1 0 0 0
Coherence
Internal coherence 0 0 0 0 3 0 0 0 1 0 0 0 1 0 0 0 0 0 0 0 0 0 0 0
External coherence 0 0 0 0 17 6 1 2 6 1 0 1 6 3 1 2 3 0 0 0 3 2 0 1
Other 0 0 0 0 0 0 0 0 0 0 0 0 0 0 0 0 0 0 0 0 0 0 0 0
Methodology
Theory based evaluation 1 0 0 0 3 1 1 1 4 0 0 0 7 4 1 1 2 0 0 0 2 0 0 0
Econometric /statistical analysis 0 0 0 0 2 0 0 0 3 1 1 0 33 20 8 0 10 6 12 0 6 3 4 0
Top down modelling 0 0 0 0 1 1 1 2 3 0 0 1 1 1 1 2 4 1 4 0 3 1 4 1
Bottom up modelling 0 0 0 0 7 0 0 0 5 2 0 0 8 10 2 0 3 7 12 0 2 6 10 0
Multi criteria analysis 0 0 0 0 1 0 0 0 1 0 0 0 3 0 0 0 1 0 0 0 1 0 0 0
Surveys 0 0 0 0 0 0 0 0 2 0 0 0 8 0 3 1 5 0 2 0 6 0 2 0
Data analysis 0 0 0 0 4 3 0 0 7 0 0 0 27 6 3 2 12 5 12 0 4 4 9 0
Interviews 0 0 0 0 0 0 0 0 2 0 0 0 2 3 4 0 1 3 7 0 2 3 6 0
Event study 1 0 0 0 0 0 0 0 0 0 0 0 0 0 0 0 1 0 0 0 1 0 0 0
Case Studies 0 0 0 0 0 0 0 0 0 1 1 0 3 1 2 0 0 2 1 0 0 3 2 0
Legal analysis 0 0 0 0 0 0 0 0 0 0 0 0 0 0 0 0 0 0 1 0 0 0 1 0
Other 0 0 0 0 2 1 0 0 2 0 0 0 1 0 2 1 2 0 1 1 1 0 0 1
Short term Long term Objectives Interaction Governance Functioning

8
The outcome of the gap analysis identified 14 evaluation gaps (see table below), which were
categorised according to one of the following types:
Methodological gap: refers to limitations in the methodology currently deployed in the
literature to assess the performance of the EU ETS;
Data gap: refers to the limitation of data that prevents more quantitative approaches to
assess the performance of the EU ETS from being implemented and;
Coverage gap: refers to aspects of the EU ETS which are insufficiently covered in the
literature reviewed.
Source: Own calculation
The study has identified important methodological gaps that exist in the construction of credible
baselines from which to assess the impact of the EU ETS on GHG abatement, competitiveness
etc. It therefore should be a priority to encourage greater collaboration amongst researchers to
ensure that these counterfactual baselines become more standardised and widely agreed upon in
the future to enhance the comparability between evaluations. Data gaps identified in the literature
will also need to be addressed if important questions concerning the performance of the EU ETS,
especially with regards to investment leakage, are to be definitively answered in the future.
Coverage gaps in the literature mainly relate to the emergence of new topics as the EU ETS enters
a period of reform. It is evident that further clarity will be required to ascertain whether additional
complementary policies (i.e. emission performance standards) are necessary to improve the
dynamic efficiency of the scheme and create a strong and stable price signal to promote the low-
carbon technologies necessary to deliver the most ambitious emission reductions targeted in 2050.
The proposal by the European Commission to introduce greater flexibility in managing the supply
of allowances in the EU ETS, should help to alleviate previous problems experienced with
economic shocks and overlapping policies. However, this will need to be validated by future
research. The extension of carbon leakage provisions beyond 2020 (as announced in the
European Council Conclusions in October, 2014) will be another important area of research.
Evaluation Gap Type of Gap
(1) Standardised counterfactual baselines need to be developed to evaluate EU ETS performance Methodological
(2) Incomplete time-series data - research needs to be updated with more complete data Data
(3) Lack of available data on investments Data
(4) Limited evaluations on the past and future scope changes to the EU ETS Coverage
(5) Sensitivity analysis of econometric results on cost pass through necessary Methodological
(6) Dynamic efficiency of the EU ETS - is the price signal strong enough? Coverage
(7) Lack of data availablity on transaction costs Data
(8) Extent to which renewables development is accounted for in the 2030 EU ETS cap Coverage
(9) Future impact of the Market Stability Reserve on the functioning of the EU ETS Coverage
(10) Standardised, credible and transparently calculated marginal abatement costs curves Methodological
(11) Limited evaluations on market oversight Coverage
(12) Future allocation of free allowances - defining 'appropriate measures' Coverage
(13) Limited evaluations on alternative policies to EU ETS Coverage
(14) Limited evaluations assessing the relevance of the objectives to the needs of the EU Coverage

9
Table of Contents
Executive Summary 4
List of Figures 11
List of Tables 12
1. Introduction 13
2. Objectives of the EU ETS 16
3. Literature Review 18
3.1. Methodological approach 18
3.1.1. Question setting 18
3.1.2. Literature search, screening and data extraction 19
3.2. Main findings 20
3.2.1. Effectiveness 21
3.2.2. Efficiency 28
3.2.3. Coherence 35
3.2.4. EU added value 38
3.2.5. Relevance 40
3.3. Summary 42
4. Gap analysis 43
4.1. Methodological approach 43
4.2. Main findings 43
4.2.1. Effectiveness 45
4.2.2. Efficiency 45
4.2.3. Coherence 46
4.2.4. EU added value 47
4.2.5. Relevance 47
4.3. Summary 48
4.3.1. Methodological gaps 49
4.3.2. Data gaps 49
4.3.3. Coverage gaps 50
5. Conclusion 51
6. References 52
6.1. References (Literature Review) 52
6.2. References (Gap Analysis) 57

10
7. Annex 75
7.1. Review Protocol 75
7.1.1. Overview 75
7.1.2. Literature search 75
7.1.3. Screening criteria 76
7.1.4. Data extraction 77

11
List of Figures
Figure 1 Overview of the evolution of the key design elements of the EU ETS 13
Figure 2 Intervention logic model and key evaluation criteria 14
Figure 3 Relevance of the objectives to the main components of the architecture
of the EU ETS and the evaluation criteria 17
Figure 4 Stages of the review protocol 19
Figure 5 Evaluations reviewed after screening process by methodology 20
Figure 6 Relevance of the EU ETS in the future policy mix 42
Figure 7 Stages of the review protocol 75
Figure 8 Screenshots of data entry worksheet for literature review & gap
analysis 80
Figure 9 Guidance for categorising evaluations in the gap matrix table 81
12
List of Tables
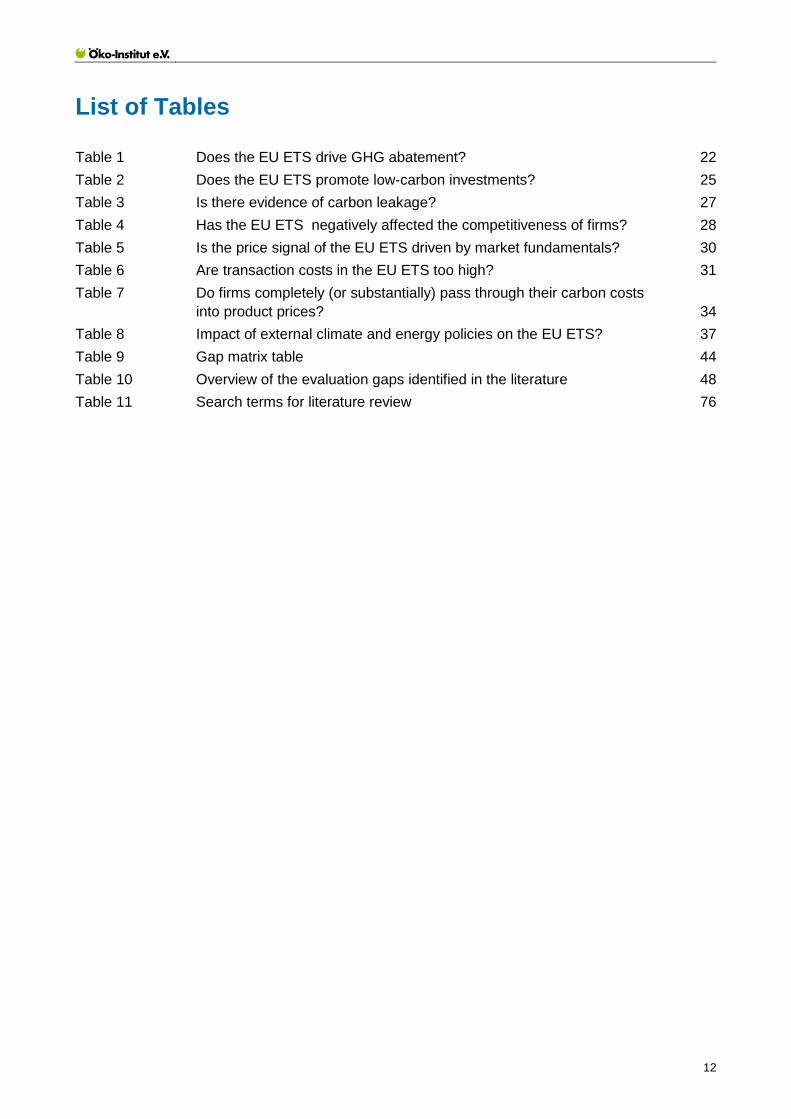
Table 1 Does the EU ETS drive GHG abatement? 22
Table 2 Does the EU ETS promote low-carbon investments? 25
Table 3 Is there evidence of carbon leakage? 27
Table 4 Has the EU ETS negatively affected the competitiveness of firms? 28
Table 5 Is the price signal of the EU ETS driven by market fundamentals? 30
Table 6 Are transaction costs in the EU ETS too high? 31
Table 7 Do firms completely (or substantially) pass through their carbon costs
into product prices? 34
Table 8 Impact of external climate and energy policies on the EU ETS? 37
Table 9 Gap matrix table 44
Table 10 Overview of the evaluation gaps identified in the literature 48
Table 11 Search terms for literature review 76
13
1. Introduction
The 2030 Framework was recently approved by the European Council in October 2014, which sets
a domestic greenhouse gas (GHG) reduction target of 40% compared to 1990 levels and also sets
a target of at least 27% for renewable energy and energy savings by 2030. The conclusions of the
European Council reaffirmed the EU ETS as the main instrument to achieve the domestic GHG
reduction target. The conclusions also emphasise that reform is necessary to ensure that the EU
ETS functions correctly to deliver the expected 43% reduction below 2005 levels contribution from
the EU ETS sector.
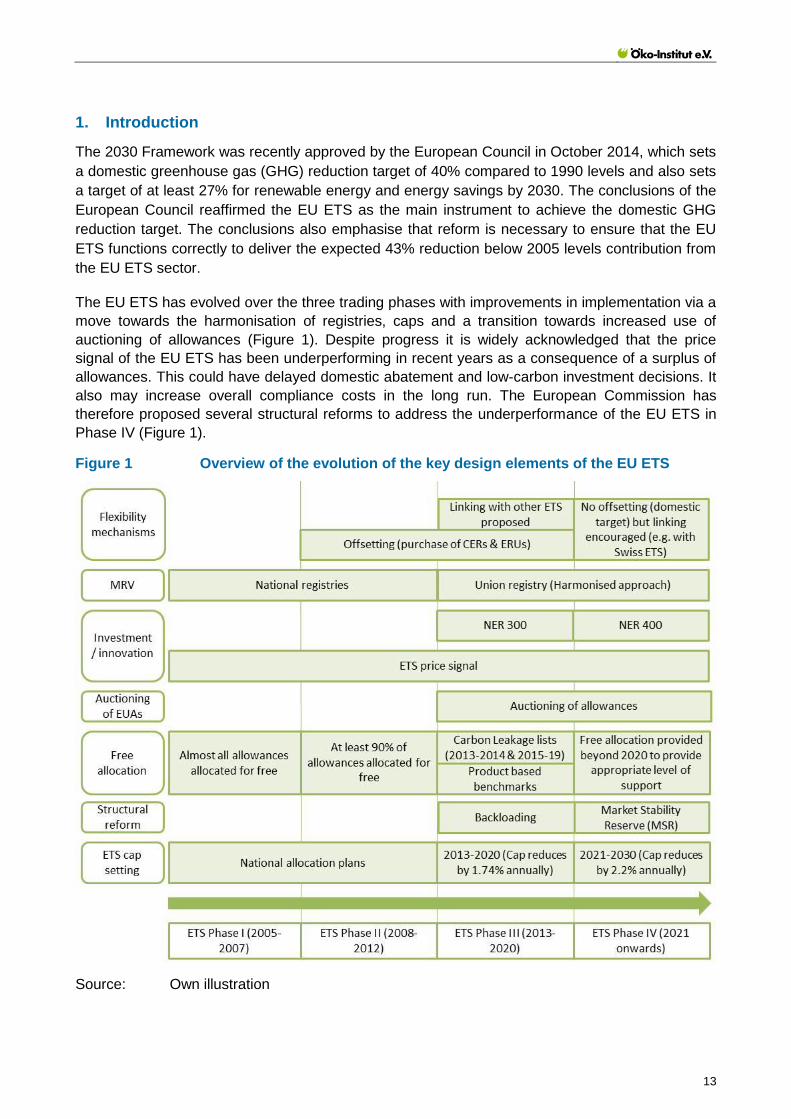
The EU ETS has evolved over the three trading phases with improvements in implementation via a
move towards the harmonisation of registries, caps and a transition towards increased use of
auctioning of allowances (Figure 1). Despite progress it is widely acknowledged that the price
signal of the EU ETS has been underperforming in recent years as a consequence of a surplus of
allowances. This could have delayed domestic abatement and low-carbon investment decisions. It
also may increase overall compliance costs in the long run. The European Commission has
therefore proposed several structural reforms to address the underperformance of the EU ETS in
Phase IV (Figure 1).
Figure 1 Overview of the evolution of the key design elements of the EU ETS
Source: Own illustration
14
As the scheme enters a critical phase in its development, the Öko-Institut, Triple E & REC have
been commissioned by the EEA to perform a review of evaluations on the EU ETS and to identify
gaps that could be addressed in future research.
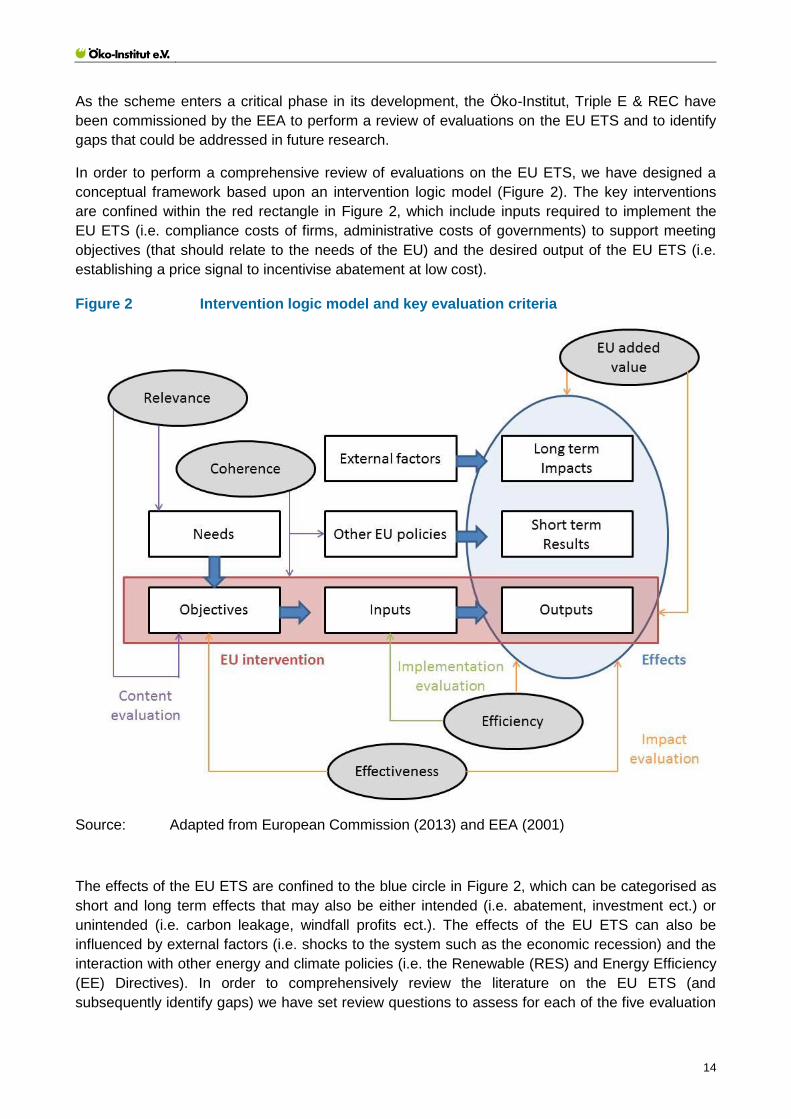
In order to perform a comprehensive review of evaluations on the EU ETS, we have designed a
conceptual framework based upon an intervention logic model (Figure 2). The key interventions
are confined within the red rectangle in Figure 2, which include inputs required to implement the
EU ETS (i.e. compliance costs of firms, administrative costs of governments) to support meeting
objectives (that should relate to the needs of the EU) and the desired output of the EU ETS (i.e.
establishing a price signal to incentivise abatement at low cost).
Figure 2 Intervention logic model and key evaluation criteria
Source: Adapted from European Commission (2013) and EEA (2001)
The effects of the EU ETS are confined to the blue circle in Figure 2, which can be categorised as
short and long term effects that may also be either intended (i.e. abatement, investment ect.) or
unintended (i.e. carbon leakage, windfall profits ect.). The effects of the EU ETS can also be
influenced by external factors (i.e. shocks to the system such as the economic recession) and the
interaction with other energy and climate policies (i.e. the Renewable (RES) and Energy Efficiency
(EE) Directives). In order to comprehensively review the literature on the EU ETS (and
subsequently identify gaps) we have set review questions to assess for each of the five evaluation

15
criteria1 recently proposed by the European Commission (2013) for use in evaluations (illustrated
by the grey circles in Figure 2)
In advance of the review of the literature on EU ETS evaluations, the next section provides an
overview of formally declared policy objectives for the EU ETS, focusing on how they have evolved
over time and how they relate to both the key design elements of the EU ETS and the evaluation
criteria that have been adopted for this report. The methodology and main findings of the literature
review will then be provided in Section 3 and will be subsequently followed by the gap analysis of
evaluations on the EU ETS in Section 4 identifying gaps that warrant further research. Concluding
remarks to the report will be provided in Section 5.
1 A description of the five evaluation criteria is provided in Section 3.2

16
2. Objectives of the EU ETS
The starting point for the review of the literature is to fully understand the objectives of the policy
intervention. The objectives of the EU ETS as outlined in the ETS Directive include:
‘to promote reductions of greenhouse gas emissions in a cost-effective and economically
efficient manner’ (EC, 2009);
‘reductions of greenhouse gas emissions to be increased so as to contribute to the levels of
reductions that are considered scientifically necessary to avoid dangerous climate change’
(EC, 2009);
‘assessing and implementing a stricter Community reduction commitment exceeding 20 %,
to be applied upon the approval by the Community of an international agreement on climate
change leading to greenhouse gas emission reductions exceeding those required in Article
9, as reflected in the 30 % commitment endorsed by the European Council of March 2007’
(EC, 2009).
It is important to acknowledge that the objectives of the EU ETS have changed over time from
using flexibility mechanisms in order to cost effectively fulfil their Kyoto Protocol obligations in 2000
to the recent declaration at the Seventh Environment Action Programme (EAP) in 2013 for the EU
ETS to incentivise low-carbon investments and to promote a global carbon market (see below):
‘to enhance the cost effectiveness of the EU’s implementation strategy [of the Kyoto
Protocol] including the preparation for the use of the Kyoto Protocol’s flexible mechanisms’
(European Commission, 2000);
‘to incentivise low-carbon investment’ (EU, 2013);
‘promoting the further development and implementation of emissions trading schemes
around the world and facilitating the linking of such systems’ (EU 2013).
The relationships between the policy objectives from the ETS Directive (represented by the green
circles) and additional policy objectives (represented by the purple circles) are illustrated in a
stylised manner in Figure 3.
The objective of the EU ETS to ‘reduce emissions in line with scientific recommendations’ relates
mainly to the relevance evaluation criteria as the objective responds directly to the scientific need
to lower levels of GHG emissions. While the objective to set stricter targets in light of an
international agreement is more related to the added value of the EU to influence UNFCCC
negotiations and set ambitions that are coherent with the actions of other international actors. The
objective of the EU ETS to ‘promote reductions of GHG emissions in a cost effective and
economically efficient manner’ is more wide ranging and relates to the effectiveness (i.e. evaluating
abatement), efficiency (i.e. evaluating implementation) and coherence (i.e. evaluating policy
interaction) evaluation criteria.
The additional (formal and informal) objectives overlap, in particular, with the objective to reduce
emissions cost effectively and economically efficiently and may therefore complement or potentially
conflict with one another. For example, the additional objective to facilitate linking between
emission trading schemes may improve efficiency in the long run by lowering compliance costs for
firms in the EU ETS (due to lower abatement options available in other international schemes).
However, alternatively the additional objective to incentivise low-carbon investment may conflict
with the objective of achieving GHG reductions at the lowest cost.

17
Figure 3 Relevance of the objectives to the main components of the architecture of
the EU ETS and the evaluation criteria
Source: Own illustration
The achievement of all of the objectives illustrated above depends upon how the main components
of the architecture of the EU ETS (i.e. cap setting, MRV, flexibility mechanisms, free allocation,
auctioning etc.) have been designed and implemented. For example, the introduction of
backloading and the proposal for a Market Stability Reserve both aim to increase the scarcity of
allowances in the system in order to further incentivise low-carbon investment by creating a more
stable and gradually increasing carbon price. The relationship between the different components of
the EU ETS architecture and the achievement of the objectives will be explored further in the
literature review (Section 3).
18
3. Literature Review
The methodological approach of the literature review is briefly summarised in Section 3.1 and is
subsequently followed by a discussion of the main findings in Section 3.2 and a brief summary in
Section 3.3.
3.1. Methodological approach
Based upon the intervention logic model and evaluation criteria introduced in the introduction, a
methodology was developed to review the literature in a systematic manner to ensure that all of the
important aspects of EU ETS were captured by the literature search with data collected to provide
input to the subsequent gap analysis. The literature review will be briefly explained in the following
sub-sections with further information provided in Section 7.
3.1.1. Question setting
A list of questions were developed in order to guide the review of the literature, which were
grouped in order to operationalise the criteria suggested by the European Commission for policy
evaluation (European Commission, 2013). The list took into account the objectives associated with
the EU ETS that were discussed in Section 2. The main findings of the literature review in Section
3.2 were structured in accordance with a response to the following review questions:
1) Effectiveness
To what extent has the EU ETS driven GHG abatement in the short and longer term?
To what extent has the EU ETS promoted low-carbon investments and supported the
competitiveness of European firms in the short and longer term?
2) Efficiency
How efficient is the implementation of the EU ETS in both the short and longer term?
To what extent has the allocation method of distributing allowances affected the efficient
functioning of the EU ETS?
3) Coherence
How well does the EU ETS complement other EU climate and energy policies?
4) EU added value
To what extent has the implementation of the EU ETS by Member States been improved by
the adoption of more harmonised approaches?
Would alternative policy instruments at EU or national levels have been more cost effective
than the EU ETS?
5) Relevance
How well do the objectives correspond to the needs within the EU?

19
3.1.2. Literature search, screening and data extraction
The review protocol provided guidance to the review team on how to search, screen and extract
information from the literature on the performance of the EU ETS (Figure 4). A range of sources
were considered in the literature search in order to limit any bias that may have occurred from an
over reliance on one particular source of information. Furthermore the extensive use of search
terms ensured that evaluations on all aspects of the EU ETS performance were collected. The
search of the literature included the following sources of information:
1000 internet search engine results: the top 50 results for each of the 20 search terms (i.e.
EU ETS + abatement, EU ETS + investment ect.) entered were evaluated by the review for
their relevance to the review questions set;
Over 250 academic papers: the 20 search terms were entered into the Science Direct
search facility and all relevant papers to address the review questions were downloaded for
further evaluation by the review team;
Over 500 links from government (or government affiliated) websites: the multiple languages
of the review team were utilised to uncover relevant publications from Member State and
international governments that were relevant to the review questions set;
Supplementary publications were also added by the review team based upon their
expertise and searching recent literature reviews and specific website for additional
publications to add to the evidence base.
Figure 4 Stages of the review protocol
Source: Own illustration
20
Following the literature search, the resulting papers were screened based upon their quality (i.e.
evaluations that were evidence driven with transparent and robust methodologies) and their
relevance to respond to one of the five review questions set. As a result of the screening process
the number of retained papers decreased to several hundred, which were then evaluated in more
detail with data collected and entered into a data entry worksheet (Figure 8) and used in the
subsequent gap analysis. Following a more detailed assessment of the papers retained, research
themes were identified (i.e. GHG abatement, investment ect.) and the outcomes of evaluations
related to each research theme were collated in various assessment tables to provide a snapshot
of options from the literature reviewed.
3.2. Main findings
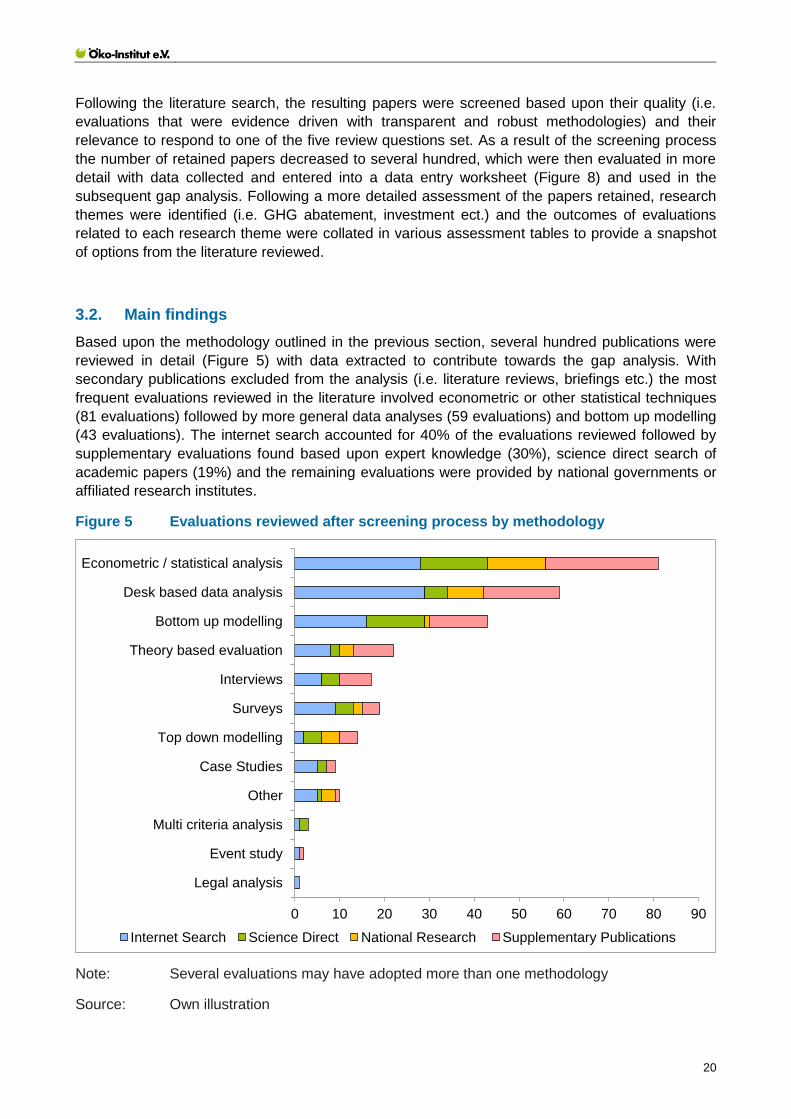
Based upon the methodology outlined in the previous section, several hundred publications were
reviewed in detail (Figure 5) with data extracted to contribute towards the gap analysis. With
secondary publications excluded from the analysis (i.e. literature reviews, briefings etc.) the most
frequent evaluations reviewed in the literature involved econometric or other statistical techniques
(81 evaluations) followed by more general data analyses (59 evaluations) and bottom up modelling
(43 evaluations). The internet search accounted for 40% of the evaluations reviewed followed by
supplementary evaluations found based upon expert knowledge (30%), science direct search of
academic papers (19%) and the remaining evaluations were provided by national governments or
affiliated research institutes.
Figure 5 Evaluations reviewed after screening process by methodology
Note: Several evaluations may have adopted more than one methodology
Source: Own illustration
0 10 20 30 40 50 60 70 80 90
Legal analysis
Event study
Multi criteria analysis
Other
Case Studies
Top down modelling
Surveys
Interviews
Theory based evaluation
Bottom up modelling
Desk based data analysis
Econometric / statistical analysis
Internet Search Science Direct National Research Supplementary Publications
21
The lower number of evaluations from national governments or affiliated research institutes may be
explained by several publications already being identified through alternative searches. However a
general conclusion from the review team (after comprehensively searching on government
websites utilising a range of languages) is that the availability of evaluations on the EU ETS from
Member States could be improved upon.
Following the detailed review of the retained papers from the screening process, evaluation
outcomes were collated for a number of research themes. The main findings from the systematic
review of the literature will be presented in the following sections and structured in accordance with
the five review questions outlined in the previous section, which relate to the criteria adopted by the
European Commission in their policy evaluations.
3.2.1. Effectiveness
Effectiveness refers to the extent to which the intervention caused the observed effects and
whether or not these effects correspond to the objectives of the intervention (European
Commission, 2013). For the EU ETS the intended impacts of the policy intervention, such as cost
effective GHG reductions (objective set in the ETS Directive) and encouraging investments in low-
carbon technology (objective set in the 7th EAP), will need to be evaluated against any unintended
effects of the policy that may have developed over time. This section of the literature review
responds to the following set of questions:
To what extent has the EU ETS driven GHG abatement in the short and long term?
GHG abatement
There is a general consensus within the literature reviewed that the EU ETS has driven GHG
abatement (Table 1). However, the difficulties of establishing a business as usual (BAU) baseline
to estimate abatement (defined as the difference between verified emissions and business as
usual) lead to outcomes with greater levels of uncertainty.
Estimation of GHG abatement depends upon a comparison between observed emission levels and
emission levels calculated based upon a BAU baseline without the EU ETS. Ellerman & Buchner
(2006) estimate abatement in Phase I based on historic emissions data (derived from National
Allocation Plans (NAPs)) and indicators of economic activity, energy and carbon intensity trends. In
comparison to their BAU baseline. Ellerman & Buchner (2006) suggest that the level of GHG
abatement that is attributable to the EU ETS ranges from between 2.5% and 5% in both 2005 and
2006. In a subsequent ex-post analysis, Anderson & Di Maria (2010) suggest that there was an
incentive for Member States in Phase I to attempt to influence allocation by reporting inflated
historical emissions. Indeed they show that if the ex-ante BAU emissions from NAPs were deemed
to be correct, the EU-25 would have experienced a net GHG abatement of 12.7% compared to the
baseline. However, given that Anderson & Di Maria (2010) only estimate a net GHG abatement of
2.8% compared to their own BAU baseline (estimated using an econometric model and data
primarily from Eurostat) – they conclude that the ex-ante projections of Phase I BAU emissions
were of questionable quality.
Ellerman et al. (2014) argue that despite the difficulty in setting the cap under uncertainty, which
was made even more difficult by time constraints and poor data quality, the over allocation of
allowances in Phase I was still reasonably small (equivalent to only 1.3% of the total EU ETS

22
emissions between 2005 and 20072). They emphasise that the abatement that occurred as a result
of the strong price signal in the first twenty months of Phase I could not be ‘taken back’ following
the collapse of the EUA price towards the end of the trading period when it was likely that
emissions returned to BAU levels due to the weak price signal.3
Despite criticisms in the literature about the causality assumed by the above findings (i.e. any
deviation below projected emissions is due to abatement driven only by the EU ETS), there is
evidence of abatement opportunities being created in Phase I by the existence of a carbon price.
For example, Delarue et al. (2008) empirically assess the occurrence of fuel switching in the power
sector during Phase I of the EU ETS. They observed that the share of gas declined by 7.7%
between 2005 and 2006 and imply that the switch from coal to gas was larger in 2005 due to the
higher price of CO2 influencing decision making. Following empirical observations, Delarue et al.
(2008) use a bottom up model to simulate fuel switching with and without observed CO2 prices and
find that GHG emissions in the EU power sector would have been approximately 88 and 59 Mt
higher in 2005 and 2006 respectively. Furthermore, McGuinness & Ellerman (2008) provide an
econometric analysis of fuel switching in the UK power sector and calculate that the resulting
abatement was between 13 and 21 Mt in 2005 and between 14 and 21 Mt in 2006. A number of
studies also present evidence of abatement based upon surveys and interviews Sandoff & Schaad
(2009), however they do not allow for quantification.
Table 1 Does the EU ETS drive GHG abatement?
Note: The numbers refer to methodologies found in the literature that respond to the
question in the title above (evaluations may adopt more than one methodology)
Source: Own illustration
2 Over allocation was measured by the surplus of allowances issued to verified emissions.
3 The EUA spot price dropped from €29.20/tCO2 on Monday the 24
th of April 2006 to €13.35/tCO2 at the end of that
week following the first publication of verified emissions data (which was lower than the market anticipated) and the EUA spot price continued to decline to €0.08/tCO2 by the end of 2007 as banking from Phase I to Phase II was not allowed and the market was long in allowances (Venmans, 2012).
Positive Negative Uncertain Positive Negative Uncertain
Total 4 2 0 16 4 2
Theory based evaluation 0 0 0 0 0 0
Econometric /statistical analysis 0 0 0 4 2 0
Top down modelling 1 0 0 0 0 0
Bottom up modelling 2 0 0 3 0 1
Multi criteria analysis 0 0 0 1 0 0
Surveys 0 0 0 0 0 0
Data analysis 1 2 0 7 2 1
Interviews 0 0 0 0 0 0
Event studies 0 0 0 0 0 0
Case Studies 0 0 0 0 0 0
Other 0 0 0 1 0 0
Ex-ante Ex-post

23
According to the EEA (2013b), EU ETS emissions increased slightly between 2005 and 2007
reflecting the over allocation of allowances that occurred in the first trading period. However in the
second trading period emissions in the EU ETS decreased significantly from 5% below 2005 levels
in 2008 to 16% below 2005 levels in 2012.4 The impact of the economic recession on emissions
increased the difficulty of evaluating the impact of the EU ETS on GHG abatement as previous
BAU projections from Phase I are no longer suitable for Phase II (Egenhofer et al. 2011b).
Gloaguen & Alberola (2013) therefore constructed a new BAU baseline from which to estimate
GHG abatement in the EU ETS according to different explanatory factors between 2005 and 2011.
To overcome the recent volatility, they prolong trends observed over one or two decades prior to
2005 and 2011 to construct their BAU baseline.5 Based upon an econometric analysis, Gloaguen &
Alberola (2013) suggest that the total EU ETS reduction of 1,100 Mt CO2 between 2005 and 2011
could be allocated mainly to the collective impact of the RES and EE Directives (between 600 to
700 Mt CO2 reduction), the economic recession (300 Mt CO2 reduction) and price substitution
effects induced by coal and gas prices (200 Mt CO2 reduction). Although the impact of the carbon
price was not directly modelled in the analysis, Gloaguen & Alberola (2013) conclude that the
impact of the economic recession combined with the increased deployment of RES were likely to
have supressed the carbon price and therefore its impact on GHG abatement.
The impact of other EU policies (i.e. RES & EE Directives) and reduced activity due to the
economic recession resulted in the accumulation of a large surplus of allowances, which were
further exacerbated by the increased use of international offsets in Phase II (which allowed
participants to retain EUAs by surrendering purchased offsets instead – thus adding to the
surplus). Hu et al. (2014) calculate a cumulative surplus of allowances of 1,776 Mt in Phase II, of
which 41.5% resulted from the over supply of allowances and 58.5% from the use of offset credits.
The impact of such a surplus is that it may delay domestic activities and risk locking the EU into
carbon intensive infrastructure making the long term EU ETS cap too expensive to achieve
Taschini et al. (2014). Given the current political decisions around the 2030 Framework and the
ongoing discussion of reforming the EU ETS, Hu et al. (2014) perform an ex-ante estimation of
domestic (or internal) abatement resulting from the EU ETS up to 2030 compared to a baseline
scenario without the EU ETS (based upon a GDP growth rate and an extrapolation of historic
trends of emission intensity improvements). They claim that the introduction of approved policy
interventions (i.e. backloading, 2.2% linear reduction factor and market stability reserve) and the
inclusion of aviation will be insufficient to return scarcity to the market before 2021 and that EU
internal abatement cannot be guaranteed until 2023. They argue for the early removal of the 900
Mt of backloaded allowances by 2020 and broadening the scope of the EU ETS to further
encourage domestic abatement in Phase III and beyond.
To what extent has the EU ETS promoted low-carbon investments and supported the
competitiveness of European firms in the short and longer term?
Investments
There is a consensus within the literature reviewed that the EU ETS is unable to deliver both low
cost GHG reductions and promote low-carbon technology (Table 2) as the objectives conflict with
one another. Uncertain and currently low EUA prices have failed to promote low-carbon
4 The EU ETS cap for 2012 was 6% below 2005 levels ( EEA 2013b)
5 The BAU baseline assumed GDP growth of 1.6% per year, limited development of renewables, less marked increase
in energy efficiency, a constant carbon price of €1/t and an energy ratio constant at 2005 levels.

24
technologies and complementary policies may be necessary to improve the dynamic efficiency of
the EU ETS.
The promotion of low-carbon technology is necessary in order to decrease the costs associated
with long-term high levels of abatement (i.e. in line with the 2050 target of 80 to 95 % reduction
below 2005 levels), which relates to the long term or dynamic efficiency of the EU ETS to reduce
emissions at the lowest overall costs Taschini et al. (2014). Intermediate technologies, such as
combined cycle gas turbines or coal efficiency, reduce the cost of emission reductions in the
medium term. However, investment in these technologies fail to decrease the cost of high levels of
abatement due to the fact that ultimately these technologies will need to again be replaced in order
to attain more ambitious emission reductions before 2050 and beyond. Given the volatility
experienced with EUA prices during Phase I and II of the EU ETS and the sustained low EUA
prices observed in Phase III a debate has emerged within the literature about the extent to which
the EU ETS can promote low-carbon investments.
Indeed, Blanco & Rodrigues (2008) demonstrate the importance of complementary policies to the
EU ETS to support the development of low-carbon technologies. Blanco & Rodrigues (2008)
emphasise that all six of the Member States in the EU with more than 250 MW of wind power
installed in 2006 had adopted feed in tariffs (or equivalent regulation) that was equivalent to a
carbon price between €25 /t CO2 (i.e. UK) and €159 /t CO2 (i.e. Italy).6 The divergence in the
equivalent carbon price for these complementary policies reflects the certainty of revenue
necessary to support such capital intensive investments. Whereas Germany, Spain, France,
Portugal and the UK provide payments that are either fixed or within a narrow band for a
guaranteed period of time, the Italian policy is more uncertain with the implementation of a CO2
certificate market making revenues less predictable. Given that the EU ETS only provides a low
incentive for investment in low-carbon technology, Capros et al. (2008) suggest that a RES target
is necessary to accompany the EU ETS and support investment and innovation.
Hoffmann (2007) conducted interviews with German electricity producers that accounted for 80 %
of the sector’s emissions in the country to evaluate the impact of the EU ETS on investment
decisions. Hoffmann (2007) concludes that the EU ETS may have incentivised small scale
investments with quick pay backs however, as a consequence of regulatory uncertainty, the
influence of the EU ETS in large scale investments were found to be limited in Phase I. Löfgren et
al. (2013) provide further evidence to support the previous findings based upon an econometric
analysis using firm level data between 2002 and 2008. They find that the effect of the EU ETS on
the investment decisions on Swedish firms is limited in Phase I and suggest that the generous over
allocation of allowances may partly explain the outcome. Chappin & Dijkema (2009) adopt a
bottom up model to simulate the influence of the EU ETS on the investment decisions of power
companies in the Netherlands. They find that, compared to a ‘no intervention’ baseline, the impact
of the EU ETS on the power generation mix and CO2 emissions is relatively small and late (based
carbon prices ranging from €10/ t to €50/ t). The use of coal is ‘unavoidable’ driven by expectations
of low coal costs and increased electricity demand in the future (Chappin & Dijkema 2009).
6 Countries within this range of equivalent carbon prices for RES support include Germany (€40.64 /tCO2), Spain
(€33.30 /tCO2), France (€31.30 /tCO2) and Portugal (€24.47 /tCO2)

25
Table 2 Does the EU ETS promote low-carbon investments?
Note: The numbers refer to methodologies found in the literature that respond to the
question in the title above (evaluations may adopt more than one methodology)
Source: Own illustration
The literature also includes studies that examine the positive impacts of the EU ETS on innovation,
which with high rates of diffusion, could reduce carbon leakage. Martin et al. (2011) completed
semi-structured interviews with approximately 800 European manufacturing firms (450 of which
were regulated by the EU ETS) and concluded that the EU ETS had a positive effect on process
innovation (i.e. operational innovations) but not on product innovation (i.e. technological
advancement). However, future emission reductions from technological change may still be
encouraged by the EU ETS with Calel & Dechezlepretre (2013) estimating that the scheme may be
responsible for up to 30% of the increase in low-carbon patenting of regulated companies since
2005. Indeed, based upon a review of corporate investor communications between 2004-2009 for
the five most carbon-constrained European Utilities Hervé-Mignucci (2011) find that stricter NAPs
in Phase II and expectations of further constraints in Phase III triggered the cancellation of highly
carbon-emitting plants. However, the research was limited by the quality of the investment data
available and Hervé-Mignucci (2011) calls for greater transparency in future reporting.
Carbon leakage and competitiveness
The consensus from the literature reviewed is that no leakage has occurred yet, which shows a
difference between ex-ante expectations and ex-post empirical analysis (Table 3). No detrimental
impact on competitiveness has been observed (Table 4). This may be due to economic shocks and
carbon leakage provisions. There is a high level of uncertainty on the potential extent of (future)
investment leakage.
In order to alleviate the concerns of participating firms in the EU ETS, allowances were initially
grandfathered in Phase I and II to offset any potential competitiveness effects of unilaterally pricing
carbon. It was strongly argued by industrial stakeholders that the EU ETS would have a negative
Positive Negative Uncertain Positive Negative Uncertain
Total 0 2 1 5 14 6
Theory based evaluation 0 0 0 0 1 0
Econometric /statistical analysis 0 0 0 2 2 1
Top down modelling 0 0 0 0 0 0
Bottom up modelling 0 1 1 0 1 0
Multi criteria analysis 0 0 0 0 1 0
Surveys 0 0 0 1 4 1
Data analysis 0 1 0 0 1 3
Interviews 0 0 0 2 1 1
Event studies 0 0 0 0 0 0
Case Studies 0 0 0 0 3 0
Other 0 0 0 0 0 0
Ex-ante Ex-post

26
impact on their competitiveness and undermine the environmental integrity of the scheme by
forcing production activities to relocate outside of the EU resulting in the ‘leakage’ of emissions.
Free allocation continued in Phase III for sectors and sub-sectors deemed to be at risk of carbon
leakage based upon carbon cost and trade intensity metrics. The first carbon leakage list7
determined for 2013-2014 was widely criticised for allowing too many firms to be eligible for free
allocations based upon their trade intensity regardless of the carbon intensity of their production
(Clò, 2010; Droege & Cooper, 2010; de Bruyn et al. 2013; Martin et al. 2014). Indeed, Clò (2010)
argues that if only an integrated approach8 was followed (i.e. not exempting sectors based only on
exceeding a threshold for one of the two metrics), instead of 140 exempted sectors out of 257
being entitled to receive free allowances just six sectors would have been exempted. Okereke &
McDaniels (2012) suggest that the vulnerability of firms in the steel sector may have been
exaggerated for political and economic reasons.
According to Reinaud (2008) there are several channels of sector led-carbon leakage initiated by
uneven carbon constraints which include:
Short term competitiveness channel: ‘Where carbon constrained industrial products lose
international market shares to the benefit of unconstrained competitors’.
Investment channel: ‘Where differences in returns on capital associated with unilateral
mitigation action provide incentives for firms to relocate capital to countries with less
stringent climate policies’.
Fossil fuel price channel: ‘Where reduction in global energy prices due to reduced energy
demand in climate constrained countries triggers higher energy demand and CO2 emissions
elsewhere, all things being equal’.
Carbon leakage rates have been estimated within the literature for several sectors that are
expected to be at significant risk of carbon leakage (i.e. iron and steel, cement and aluminium) via
ex-ante modelling approaches (i.e. top down and bottom up models). Depending upon the
modelling approach, the studies within the literature tend to focus on particular channels of carbon
leakage. Carbon leakage rates range considerably in the literature reviewed from 2% to in excess
of 100% for sectors covered by the EU ETS and primarily focus on the short run competitiveness
and investment channels of leakage. The lower rates of leakage within this range tend to assume a
relatively low-carbon price and preventative measures such as free allocation or border tax
adjustments (Kuik & Hofkes 2010; Demailly & Quirion 2008) while the more extreme carbon
leakage rates assume a relatively high carbon price and no preventative measures (Ponssard &
Walker, 2008; Vivid Economics, 2014). The underlying assumptions of the modelling approach (i.e.
energy and trade elasticities) are also of importance in determining the rate of carbon leakage. It is
evident that comparison between studies is problematic due to the lack of transparency in
modelling approaches and this currently prevents the literature from providing a more definitive
answer on the question of carbon leakage.
Interestingly, the results of ex-ante modelling are not validated in the most recent empirical ex-post
studies. For example, Dechezleprêtre et al. (2014) examine the impact of the EU ETS on the
geographical distribution of carbon emissions with multinational companies between 2007 and
2009. Based upon a regression analysis of 435 companies they find no evidence that the EU ETS
7 The first carbon leakage list was adopted by the European Commission in 2009.
8 A sector was deemed to be at risk of carbon leakage if it exceeded a 30% threshold for either trade intensity or
carbon cost metrics. In addition, a sector was also eligible for free allowances if its trade intensity metric exceeded 10% and its carbon cost metric by 5% (i.e. referred to by Clò (2008) as an integrated approach)

27
has resulted in a relocation of emissions from Europe towards the rest of the world. Impacts on the
EU ETS on competitiveness are also often examined in the ex-post literature to determine the
extent of carbon leakage.
Table 3 Is there evidence of carbon leakage?
Note: The numbers refer to methodologies found in the literature that respond to the
question in the title above (evaluations may adopt more than one methodology)
Source: Own illustration
Chan et al. (2013) use a panel of 5873 firms in 10 European countries between 2001 and 2009 to
econometrically assess the impact of the EU ETS on three variables 1) unit material costs 2)
employment and 3) revenue. No negative impacts are found for all three variables in the cement
and iron and steel sectors and concluded that competitiveness concerns are unsubstantiated.
Abrell et al. (2011) assess the impact of the EU ETS on the value added, the profit margin and
employment of participating firms over Phase I and the start of Phase II for a sample of European
firms using performance data from the AMADEUS database. They find no statistically significant
impact on a company’s value added and profit margins as a result of firms participating in the EU
ETS. Furthermore, Anger & Oberndorfer (2008) find no influence of the allocation factor on either
revenues or employment after conducting an ex-post regression analysis for 419 German firms in
the EU ETS. Focusing on the aluminium sector, both Reinaud (2008) and Sartor (2012) conduct
an ex-post econometric analysis of the impact of the EU ETS on aluminium imports and both find
no evidence, yet, to support claims of competitiveness losses and carbon leakage.
Evidence of carbon leakage associated with the investment channel of carbon leakage has been
considered by Martin et al. (2012) whom conducted a larger study consisting of 761 interviews with
managers in six European countries. In response to carbon pricing, the managers were asked
whether or not the company intended to either downsize operations or relocate abroad until 2020.
Furthermore, for managers representing firms in the EU ETS the interview was structured to
determine the importance of the continuation of free allowances post 2012 in their decision making.
Based upon the interview responses the authors compiled ‘downsizing risk scores’ that captured
Positive Negative Uncertain Positive Negative Uncertain
Total 11 3 4 0 14 1
Theory based evaluation 0 0 0 0 0 0
Econometric /statistical analysis 0 1 0 0 7 0
Top down modelling 5 0 0 0 1 0
Bottom up modelling 5 0 2 0 1 0
Multi criteria analysis 0 0 0 0 0 1
Surveys 0 1 0 0 2 0
Data analysis 1 0 1 0 2 0
Interviews 0 1 1 0 1 0
Event studies 0 0 0 0 0 0
Case Studies 0 0 0 0 0 0
Other 0 0 0 0 0 0
Ex-ante Ex-post

28
the subjective risk of downsizing with and without free allocation. The outcome of the study was
that the downsizing risk was generally low, with the majority of firms reporting no impact on where
to locate business activity based upon future carbon pricing. However, the downsizing risk score
was higher for firms participating in the EU ETS compared to non-ETS firms. Furthermore, the
authors identified that a high level of variation existed amongst the firms in the EU ETS with
regards to the downsizing risk associated with carbon pricing and the effectiveness of free
allocation as a preventative measure.
Table 4 Has the EU ETS negatively affected the competitiveness of firms?
Note: The numbers refer to methodologies found in the literature that respond to the
question in the title above (evaluations may adopt more than one methodology)
Source: Own illustration
The empirical findings above suggest that the impact of the EU ETS on competitiveness may be
limited over Phase I and II, which may in part be due to the allocation of free allowances to industry
and the relatively low EUA prices experienced towards the end of Phase II. However, the limited
data available and the difficulty in disaggregating the impact of the EU ETS from other drivers of
competitiveness necessitates future research. In addition, the reform of the EU ETS in Phase III
and beyond may impact upon future competitiveness depending on how ‘appropriate measures’ to
support industry are defined within the 2030 Framework negotiations. It is also important to
acknowledge that the impact of the EU ETS on investments is currently constrained by limited data
availability hindering efforts to provide further clarity on the extent of carbon leakage from the
investment channel.
3.2.2. Efficiency
Efficiency refers to an assessment of whether the costs associated with the input to an intervention
were justified given the effects which have been achieved (European Commission, 2013).
Generally, the assessment of efficiency needs to be distinguished from an assessment of cost-
effectiveness of an intervention. Efficiency refers to a state where the goal (i.e. emissions
Positive Negative Uncertain Positive Negative Uncertain
Total 1 4 4 1 20 7
Theory based evaluation 0 0 0 0 0 0
Econometric /statistical analysis 0 1 0 0 9 2
Top down modelling 0 1 0 0 0 0
Bottom up modelling 0 0 2 0 1 0
Multi criteria analysis 0 0 0 0 1 0
Surveys 0 1 0 0 2 1
Data analysis 0 0 1 1 3 3
Interviews 0 1 1 0 2 1
Event studies 0 0 0 0 1 0
Case Studies 0 0 0 0 1 0
Other 1 0 0 0 0 0
Ex-ante Ex-post

29
reductions) is achieved at a level so that the marginal abatement costs are equal to the social
costs of carbon (thus comparing the cost of action to the cost of inaction). Cost-effectiveness refers
to achieving a given target at the lowest possible costs (as in the case of the EU ETS by equalising
marginal abatement costs across industries and countries through a common carbon price to
achieve the EU ETS cap). In the context of efficiency evaluation of the EU ETS the terms cost
efficiency and cost effectiveness are most often used interchangeably and refer to achieving the
EU ETS cap at least cost. This section of the literature review responds to the following questions:
How efficient is the implementation of the EU ETS in both the short and longer term?
Price signal
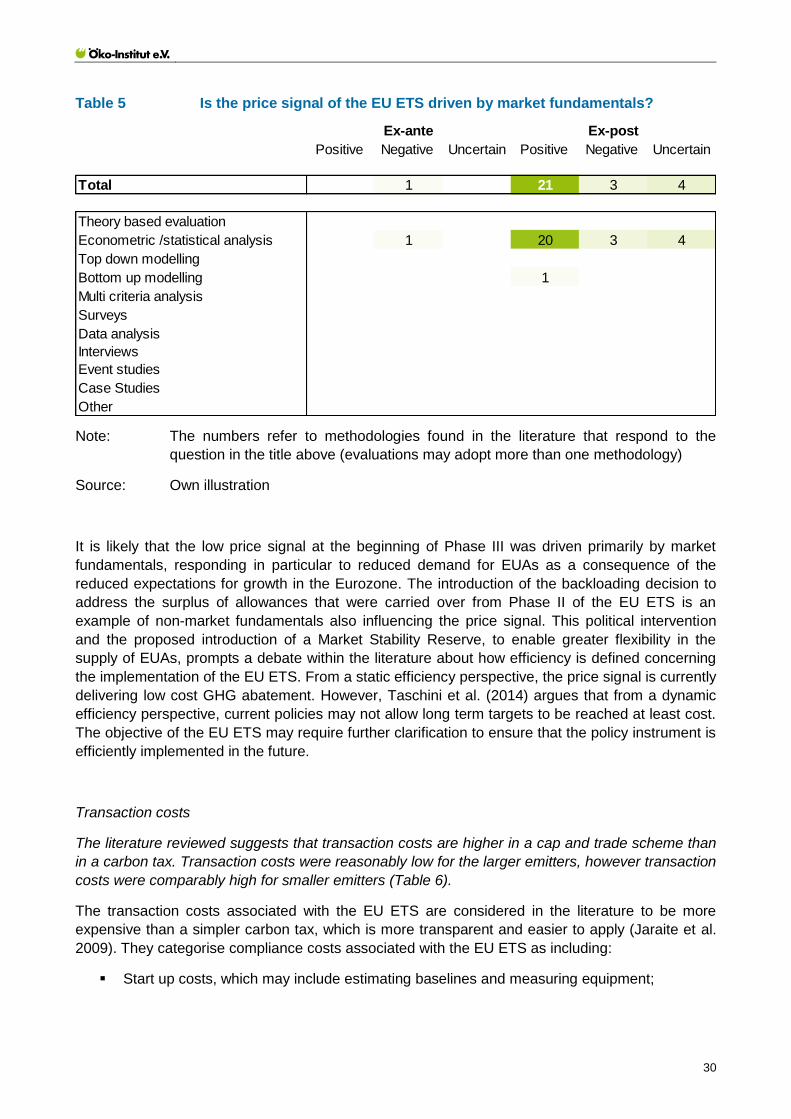
If the price signal is determined by market fundamentals this implies that the carbon price reflects
marginal abatement costs and therefore the market functions efficiently (Table 5). Studies show
ambiguous results, however most support the hypothesis that price is driven by market
fundamentals.
The EU ETS operates through the establishment of an intended price signal through the supply
and demand of emission permits in the EU ETS, which provides an incentive for GHG abatement.
In order for the EU ETS to function efficiently, the price signal needs to reflect marginal abatement
costs and therefore must be determined by market fundamentals (e.g. prices of other inputs,
economic development etc.). Ex-post econometric evidence from the literature indicates that EUA
prices are driven, at least to a certain extent, by market fundamentals. For example, fuel prices are
widely considered the most important drivers of EUA prices, as fuel switching from coal to natural
gas provides a short-term opportunity to reduce CO2 emissions for power generators (Bunn &
Fezzi, 2007; Mansanet-Bataller & Chevallier, 2010; Alberola, 2008; Keppler & Mansanet-Bataller,
2010). The effect of weather events and temperature on electricity prices has also been identified
as additional variables that impact upon the EUA price (Alberola, 2008; Rickels, 2010; Schumacher
et al., 2012).
However, the extent to which market fundamentals drive the EUA price has been questioned in the
literature. For example, Koch et al. (2014) finds that 90 % of the variations of EUA price changes
observed between January 2008 and October 2013 (where the EUA price declined from €30 to €5)
remain unexplained by abatement related fundamentals. Even after accounting for the impact of
the unexpected change in economic conditions, and to a lesser extent, the increased deployment
of wind and solar energy, Koch et al. (2014) suggests that non-market fundamental factors (e.g.
policy decisions or announcements, speculation etc.) also contributes to the observed trend.
Indeed, an ex-ante modelling analysis by Blyth & Bunn (2011) identifies policy (i.e. uncertainty in
level of cap & technological support), market (i.e. uncertainty in demand for electricity & fuel prices)
and technology (i.e. uncertainty in cost and quantity of abatement) risks to price formation in the
EU ETS. They argue that immature markets are especially at risk to policy uncertainties that may
initially weaken the price signal. For example, the collapse of the EUA price towards the end of
Phase I, due to the inability of market participants to carry over allowances into Phase II,
demonstrated how institutional and market events can also drive allowance price changes
(Alberola, 2008).
30
Table 5 Is the price signal of the EU ETS driven by market fundamentals?
Note: The numbers refer to methodologies found in the literature that respond to the
question in the title above (evaluations may adopt more than one methodology)
Source: Own illustration
It is likely that the low price signal at the beginning of Phase III was driven primarily by market
fundamentals, responding in particular to reduced demand for EUAs as a consequence of the
reduced expectations for growth in the Eurozone. The introduction of the backloading decision to
address the surplus of allowances that were carried over from Phase II of the EU ETS is an
example of non-market fundamentals also influencing the price signal. This political intervention
and the proposed introduction of a Market Stability Reserve, to enable greater flexibility in the
supply of EUAs, prompts a debate within the literature about how efficiency is defined concerning
the implementation of the EU ETS. From a static efficiency perspective, the price signal is currently
delivering low cost GHG abatement. However, Taschini et al. (2014) argues that from a dynamic
efficiency perspective, current policies may not allow long term targets to be reached at least cost.
The objective of the EU ETS may require further clarification to ensure that the policy instrument is
efficiently implemented in the future.
Transaction costs
The literature reviewed suggests that transaction costs are higher in a cap and trade scheme than
in a carbon tax. Transaction costs were reasonably low for the larger emitters, however transaction
costs were comparably high for smaller emitters (Table 6).
The transaction costs associated with the EU ETS are considered in the literature to be more
expensive than a simpler carbon tax, which is more transparent and easier to apply (Jaraite et al.
2009). They categorise compliance costs associated with the EU ETS as including:
Start up costs, which may include estimating baselines and measuring equipment;
Positive Negative Uncertain Positive Negative Uncertain
Total 0 1 0 21 3 4
Theory based evaluation 0 0 0 0 0 0
Econometric /statistical analysis 0 1 0 20 3 4
Top down modelling 0 0 0 0 0 0
Bottom up modelling 0 0 0 1 0 0
Multi criteria analysis 0 0 0 0 0 0
Surveys 0 0 0 0 0 0
Data analysis 0 0 0 0 0 0
Interviews 0 0 0 0 0 0
Event studies 0 0 0 0 0 0
Case Studies 0 0 0 0 0 0
Other 0 0 0 0 0 0
Ex-ante Ex-post

31
Monitoring, reporting and verification (MRV) costs, which may include compiling annual
emissions reports and hiring an accredited emissions verifier;
Trading costs, which may include accessing the carbon exchange or paying brokerage
fees.
Based upon a survey of 27 Irish firms, Jaraite et al. (2009) find that the transaction costs per tonne
of CO2 emitted were much higher for the smaller operators in Phase I of the EU ETS. In
comparison to the average cost per tonne of CO2 emitted for all firms for set up and MRV activities
of €0.08, small firms experienced relatively higher transaction costs of €2.02. Based upon survey
data from German companies in the EU ETS, Heindl (2012) estimates that overall annual
transaction costs in Germany amount to €8.7 million with MRV costs responsible for 69 % of the
total cost. At a more disaggregated level of analysis, Heindl (2012) also finds that transaction costs
per tonne of CO2 are relatively higher for smaller firms compared to larger firms. Sandoff & Schaad
(2009) support the findings of Jaraite et al. (2009) by surveying 114 Swedish companies and
reveal that a mean time investment of 27 man hours per month were required for EU ETS
compliance. The amount of time required varied based upon the size of the firm, ranging from 17 to
42 hours for small and large firms respectively. Over 40% of the respondents claimed that the
transaction burden on firms with low emissions were too high. However, Sandoff & Schaad (2009)
conclude that time investment is fairly moderate.
Table 6 Are transaction costs in the EU ETS too high?
Note: The numbers refer to methodologies found in the literature that respond to the
question in the title above (evaluations may adopt more than one methodology)
Source: Own illustration
To what extent has the allocation method of distributing allowances affected the efficient
functioning of the EU ETS?
Whereas the immediate cost efficiency of the EU ETS is independent of the allocation form of
emissions rights, indirect economic impacts in terms of, for example, distributional effects are
directly linked to the allocation design. In Phase I and II allowances were primarily allocated to
Positive Negative Uncertain Positive Negative Uncertain
Total 0 0 0 4 7 0
Theory based evaluation 0 0 0 1 1 0
Econometric /statistical analysis 0 0 0 2 0 0
Top down modelling 0 0 0 0 0 0
Bottom up modelling 0 0 0 0 0 0
Multi criteria analysis 0 0 0 0 1 0
Surveys 0 0 0 1 3 0
Data analysis 0 0 0 0 1 0
Interviews 0 0 0 0 0 0
Event studies 0 0 0 0 0 0
Case Studies 0 0 0 0 1 0
Other 0 0 0 0 0 0
Ex-ante Ex-post

32
participating installations based upon their historic emissions (i.e. grandfathering). The allocation
rules were initially decided at the Member State level, which resulted in competitive distortions as a
consequence of NAPs being designed differently (Matthes et al., 2005). In addition, these NAPs
were subject to manipulation in Phase I with over the allocation of allowances for many sectors.
Although more stringent NAPs were set in Phase II, they were agreed prior to the economic
recession and a surplus of over 1.8 billion allowances were carried over at the start of Phase III
(EEA, 2013a). The opportunity costs associated with these freely allocated allowances were, and
to a certain extent still are, passed through to burden consumers with power plants operators
benefiting from increased revenues and windfall profits.
As a result of these regressive impacts, allowances will only be allocated for free in Phase III
based on product specific benchmarks, which reflect the average GHG performance of the most
efficient 10% of producers thereby also encouraging innovation. According to the EEA (2014) the
introduction of benchmarking has already impacted upon certain sectors with refineries only being
freely allocated 80% of their verified emissions in 2013 – indicating that the over allocation
experienced in Phases I and II may be better addressed in Phase III. The design of the
benchmarks will be subject to further negotiation with many stakeholders from industry advocating
the introduction of dynamic allocation (Borkent et al., 2014) as the current benchmarks are
multiplied by historic production levels to calculate free allowances rather than current levels of
production potentially impacting upon industrial competitiveness. An increasing share of all of the
allowances in Phase III (approximately 50%) will be auctioned (EEA, 2014) with revenues from
auctioning benefiting governments or consumers instead - reducing the pass through of costs and
windfall profits experienced in Phase I and II.
Cost pass through
There is a general consensus in the literature reviewed that in the energy sector there has been a
substantial pass through of carbon costs and windfall profits. There is evidence emerging that the
energy intensive sector has also benefited from free allocation in Phase I and II of the EU ETS
(Table 7)
The cost pass through rate can be generally described as the change in output price in response to
a change in input costs and serves in the literature as a proxy measure of both windfall profits and
competitiveness. If costs are not passed through, then firms need to bear the additional costs and
their profits will fall. If costs are passed through and result in higher product prices, this may affect
production and competitiveness as follows: 1) domestic demand may be lost as consumers may
decide to buy alternative and less expensive domestic substitutes or imported products (only the
latter effect is associated with carbon leakage); 2) Export shares may be lost to countries that are
not subject to comparable policies (Graichen et al. 2008). Whether these effects are likely and
costs are passed through, and to which extent, depends mainly upon three factors outlined by
Varma et al. (2012):
Market structure refers to the number of firms in the market and the level of state
intervention either by regulation or direct ownership. The structure of the market determines
the level of competition between firms and influences the ability of firms to pass on
additional CO2 costs without losing market share.
Supply and demand elasticities refer to the degree to which supply or demand of a product
responds to a change in price. If the demand elasticity of a product is zero (i.e. rigid

33
demand) then additional CO2 costs can be passed through with no risk of a firm losing
market share.
Exposure to international trade also influences the ability of a firm to pass through
additional CO2 costs. For example, if the exposure of a firm to international trade is low
then higher product prices due to passing through additional costs do not impact on the
competitiveness of the firm.
In theory, under perfect competition industries can pass through 100% of their costs (compare Sijm
et al., 2008). Extending the theoretical discussion further to estimate cost pass through for
unilateral cost increases, de Bruyn et al. (2010) argue in the context of the EU ETS that even if
initially the additional carbon cost is fully passed through, the impact of imports from other
countries will ultimately lower the total price increase in sectors that are exposed to international
competition. This argument is based upon the ‘Law of One Price’ principle, which assumes that
markets are perfectly integrated with identical commodities having the same price internationally.
However, as indicated by Armington (1969) perfectly integrated markets rarely occur as products
produced in different countries are often imperfect substitutes due to product differentiation and
transportation costs.
In the real world of less than perfect competition, less than perfectly integrated markets and
uncertainty over supply and demand elasticities an empirical analysis of the input and output prices
of products is necessary in order to translate theory of cost pass through into reality. Sijm et al.
(2008) assess the impact of the EU ETS on electricity prices based upon an ex-post regression
analysis. They estimate the cost pass through rates on forward markets during peak and off peak
periods in 2005 and 2006 for five countries (France, Germany, the Netherlands, Sweden and the
UK). They find that 17 out of 22 estimates range between 38 to 83%, 4 estimates are slightly
above 100% and one anomaly is estimated at 182%. Solier (2011) completed an updated
assessment using an econometric model to assess cost pass through rates for ten countries
between June 2005 and April 2011. They find that while the impact of the CO2 was relatively strong
in Phase I, the economic crisis at the onset of Phase II resulted in higher market instability that
disrupted efforts to estimate carbon cost pass through rates.
Based upon empirical data from the first two phases of the EU ETS attempts have been made in
the literature (Alexeeva-Talebi 2010; Oberndorfer et al. 2010) to estimate the extent to which costs
have been passed through into industrial product prices. Oberndorfer et al. (2010) shows that with
the exception of ceramic goods, the remainder of the products assessed are able to pass through
only parts of their costs into output prices. Ceramic goods show a pass through rate of larger than
100% which is a result of certain market characteristics and can be interpreted as a complete pass
through of policy induced carbon costs. Alexeeva-Talebi (2010) agrees that producers of cement,
lime & plaster are capable of passing through the majority of additional costs and also identifies a
wide range of cost pass through rates that exist across the different sectors (i.e. 0% to 75%). Both
studies calculate different cost pass through rates for hollow glass, which reflects the use of
different data, different lengths of their time series and/or different specification of their estimated
equations (i.e. which input costs the authors consider in their estimation on the one hand side and
which commodity prices (retail, consumer) are to be explained).

34
Table 7 Do firms completely (or substantially) pass through their carbon costs
into product prices?
Note: The numbers refer to methodologies found in the literature that respond to the
question in the title above (evaluations may adopt more than one methodology)
Source: Own illustration
Further evidence of the variability of the cost pass through rate is provided more recently by Vivid
Economics (2014) based upon an ex-ante analysis using bottom up models.9 In particular, they
find that the aluminium sector is associated with low levels of cost pass through (absorb more than
80% of the cost increase) due to the fact that the commodity is 1) traded on a global market 2) has
a very low weight to value ratio and 3) there is sufficient global capacity. In contrast, Vivid
Economics (2014) identify the malt sector as being able to fully pass through their carbon costs as
a consequence of the absence of non-EU competition. The majority of the other sectors
considered in the study were estimated to have cost pass through rates above 75%, however it is
stressed within the study that high pass through rates do not necessarily prevent firms
experiencing cost shocks that impact upon their competitiveness. In addition, simplified
assumptions within the modelling (i.e. all firms treated the same regardless of geographical
location) means that in reality cost pass through rates may be lower for firms located on the coast
or nearer to non-EU borders.
Windfall profits
Evidence in the literature reviewed shows that In Phase I and II of the EU ETS windfall profits were
high especially for electricity producers, transferring billions of euros from consumers to
shareholders.
9 ‘The Industrial Market Models calculate cost pass-through rates as a function of the various
parameters that describe the competitive structure of the market; that is, it is an output, rather than an input, to the model’ (Vivid Economics, 2014).
Positive Negative Uncertain Positive Negative Uncertain
Total 7 0 3 13 4 9
Theory based evaluation 1 0 1 1 0 2
Econometric /statistical analysis 2 0 1 9 3 5
Top down modelling 0 0 0 0 0 0
Bottom up modelling 3 0 1 2 0 2
Multi criteria analysis 0 0 0 0 0 0
Surveys 0 0 0 0 0 0
Data analysis 0 0 0 0 0 0
Interviews 1 0 0 1 1 0
Event studies 0 0 0 0 0 0
Case Studies 0 0 0 0 0 0
Other 0 0 0 0 0 0
Ex-ante Ex-post

35
Sijm et al. (2008) estimates the extent of windfall profits in the power sector by modelling scenarios
for 20 Member States that assume different market structures, carbon prices and demand
elasticities. Sijm et al. (2008) estimates that EU-20 power windfall profits ranging from €24 to €28
billion based upon two scenarios that assume either oligopolistic or perfect competition, a carbon
price of €20 and demand elasticity of 0.2. Keppler & Cruciani (2010) conduct a similar ex-ante
analysis to estimate windfall profits in the power sector of €19 billion a year during Phase I of the
EU ETS based upon the modelling assumption of full opportunity pass through and a mean carbon
price of 12 €. Given that the Sijm et al (2008) study assumes a carbon price above the mean price
of Phase I, Venmans (2012) concludes that windfall profits for the power sector in Phase I of the
EU ETS are likely to have ranged between €19 and €25 billion per year. Windfall profits were not,
however, exclusive to the power sector. de Bruyn et al. (2010) estimates that energy intensive
industries may have received €14 billion between 2005 and 2008 based upon the outcome of an
econometrical analysis of cost pass through rates for refinery and iron and steel products.
Point Carbon (2008) estimates windfall profits that ranged from €23 to €63 billion during Phase II of
the EU ETS (2008-2012) based on an EUA price of €21 to €32 and a range of different cost pass
through assumptions using a bottom up model. It is argued that the ability of a country to obtain
windfall profits in Phase II of the EU ETS depended on:
The level of cost pass through of CO2 costs to wholesale power prices;
The emissions intensity of a country’s power mix to enable a country with emission
intensive plants such as coal to set the electricity price for the majority of the time and;
The allocation of a high percentage of free allowances to the power sector from each
country’s National Allocation Plan (NAP).
The highest level of windfall profits in the power sector was expected to occur in both Germany
(between €14 and €34 billion) and the UK (between €6 and €15 billion). Interestingly, windfall
profits are lower in the UK than Germany due to the fact that gas plants set the marginal price
more often in the UK and also because of the relatively low level of free allocation to power
installations in the country’s NAP (Point Carbon, 2008). In contrast, the ex-ante modelling
demonstrated that countries with a power mix dominated by low-emitting technologies were
expected to experience lower levels of profit such as Spain (between €1 and €4 billion).
Despite the establishment of auctioning as the primary method for distributing allowances, Keppler,
& Cruciani (2010) estimate that power companies will still receive windfall profits of €10 billion per
year in Phase III based upon the modelling assumption of full auctioning and a carbon price of €20.
Windfall profits will continue to arise due to the fact that low-carbon producers of electricity
continue to obtain profits when high carbon producers are the price setting technology. The
impacts of windfall profits are expected to diminish if the share of allowances that are auctioned
continues to increase over time . However, the ongoing carbon leakage debate will continue the
risk of potential windfall profits in the future depending upon the share of free allowances that
remain available in Phase III of the EU ETS and beyond.
3.2.3. Coherence
Coherence refers to the extent to which a policy intervention compliments and supports other
policy interventions which may have similar objectives. In the case of the EU ETS, the way in
which the policy instrument interacts with other EU policies needs to be evaluated in order to
36
determine the success of the policy intervention. This section of the literature review responds to
the following question:
How well does the EU ETS complement other EU climate and energy policies?
Coherence
There is a general consensus within the literature reviewed that the impact of other policies such
as the Renewable Energy (RES) and Energy Efficiency (EE) Directives have mitigated the price
signal of the EU ETS (Table 8). However, it is important to acknowledge that the explicit objective
for the EU ETS to incentivise low-carbon investment was set after the RES and EE Directives were
adopted.
In theory, the policy mix of instruments adopted should result in a series of complementary
interactions between the 20/20/20 targets to facilitate compliance at both the EU and Member
State level. For example, the development of RES results in gross avoided GHG emissions and
reduces primary energy production, which helps meeting not only the GHG target but also the EE
target. At the same time, EE gains in a number of sectors such as buildings or transport represent
key contributions towards achieving national non-ETS targets. They may also affect the demand
for electricity generated within the EU ETS and reduce the quantity of renewable energy needed to
meet the RES targets. In turn, the GHG target might induce investment into EE or RES projects, in
particular if the ETS allowance price increases. Moreover, the GHG target might stimulate
behavioural changes (e.g. lower space heating temperature) through either the EU ETS price
signal or through the non-ETS target and its accompanying policies and measures. However, in
practice, determining the optimal mix of policy instruments to support the achievement of the
20/20/20 targets is more problematic and results in both complementary and countervailing
interactions.
From a complementarity perspective, the interactions of the policy instruments may help to
improve policy design and implementation, correct for market failures and meet additional policy
objectives. For example, in the case of the EU ETS, low EUA prices have failed to provide the
price signal necessary to drive systematic innovation in RES (Rey et al., 2013) and are deemed
too low to support anticipated levels of investment in abatement technologies. The RES Directive
has, to a certain extent, offset the impact of the low EUA prices in the ETS by obligating Member
States to increase their share of RES via the introduction of RES-E support schemes at the
national level. Indeed the introduction of feed-in tariffs in particular has helped to support the
innovation of less mature technologies (Rey et al., 2013; Egenhofer et al., 2011a; del Río, 2009).
Furthermore, the implementation of EE measures as a consequence of the EE Directive and the
Effort Sharing Decision (ESD) have also promoted the uptake of abatement options in Member
States that are below the EUA price set by the ETS thus overcoming common barriers (i.e. high
capital costs).
From a countervailing perspective, some policies have also been adversely affected by the overlap
with other policy instruments. For example, although the EU ETS cap was set in a way that
expected GHG reduction effects induced by the binding RES targets until 2020, the overlap
inevitably introduced an element of uncertainty as the success of RES policies cannot be predicted
with certainty (Rey et al., 2013). As such, the overachievement of the RES target (beyond what
was envisaged when setting the EU ETS cap) does not contribute to additional GHG reductions
but simply suppresses the EUA price in the EU ETS as the amount of GHG reductions required to
fulfil the ETS cap is lowered by the increasing deployment of RES. Weigt et al. (2013) estimated

37
the actual reduction for EUAs between 2006 to 2010 as a consequence of RES deployment in the
German electricity sector. They estimated using a bottom up model that CO2 emissions would
have been 10% to 18% higher in a scenario without RES policy, depending upon the year and
whether or not the CO2 price was present. Weigt et al. (2013) further speculates that an 18%
reduction in demand for allowances in Germany corresponds to a system wide reduction in
demand of 2.7%, which could have a considerable impact on EUA prices - theoretically suggesting
an increase higher than 50% compared to observed EUA prices under the assumption of a 5%
system wide abatement target and a linear marginal abatement cost curve.
Table 8 Impact of external climate and energy policies on the EU ETS?
Note: The numbers refer to methodologies found in the literature that respond to the
question in the title above (evaluations may adopt more than one methodology)
Source: Own illustration
Fagiani et al. (2014) simulate ex-ante the impact of carbon reduction and renewable energy policy
on investor’s choices by using a bottom up investment model to show how energy policy influences
the evolution of the electricity sector up until 2050. They find that a ‘pure’ emissions market10
achieves its carbon emission reduction target at a discounted cost to society of €5.15/ MWh over
the simulation period. However, the scenario results in high allowance prices towards the final
years of the simulation as reduction aims are missed due to temporarily low EUA prices in the early
phase of the simulation and imperfect forecasting resulting in insufficient investment in low-carbon
technologies for complying with the strict 2050 emissions target. Alternatively, Fagiani et al. (2014)
show that the RES deployment target is effectively achieved in a scenario with only a green
certificate market. However the total social cost (€8.68/ MWh) is higher than under a pure market
scenario. Interestingly, they find that a combination of carbon and green certificate markets results
in a more stable and lower carbon price in the emissions trading scheme. However, Koch et al.
(2014) provide empirical evidence of this interaction effect by conducting an econometric analysis
10
Defined as a scenario without a renewable energy policy instrument.
Positive Negative Uncertain Positive Negative Uncertain
Total 2 2 0 1 3 1
Theory based evaluation 0 0 0 0 0 0
Econometric /statistical analysis 0 0 0 0 1 0
Top down modelling 0 0 0 0 0 0
Bottom up modelling 2 2 0 0 1 0
Multi criteria analysis 0 0 0 0 0 0
Surveys 0 0 0 0 0 0
Data analysis 0 0 0 0 1 1
Interviews 0 0 0 0 0 0
Event studies 0 0 0 0 0 0
Case Studies 0 0 0 0 0 0
Briefings 0 0 0 0 0 0
Other 0 0 0 1 0 0
Ex-ante Ex-post

38
of EUA price variation between January 2008 to October 2013. They find that previous simulation
based analyses may have potentially exaggerated what is essentially a moderate impact.
The interaction between the EU ETS and the ESD has also been evaluated within the literature
with several authors (Betz & Sato, 2006; Clò, 2008) suggesting that the design and implementation
of the EU ETS may have actually increased the overall cost of the EU to meet the GHG target for
2020. For example, Clò (2008) argues that the over allocation experienced in Phase I of the EU
ETS in several Member States shifted the reduction burden from the ETS to non-ETS sectors.
Given that marginal abatement costs are widely considered to be higher (Böhringer et al., 2005;
Peterson, 2006) in the sectors not covered by the EU ETS (i.e. buildings, transport etc.), such a
shift in the GHG reduction burden may have resulted in overall abatement costs increasing.
Böhringer et al. (2006) suggest that such inefficiencies resulted from the successful lobbying by
emission intensive industries and that the expansion of the EU ETS would enable the negative
interactions between the ETS and non-ETS sectors to be minimised over time.
Indeed, the inclusion of road transport into the EU ETS has been proposed by the European
Commission,(2012) as one of the options considered for structural reform. The introduction of such
a reform may help to improve the efficiency by which the GHG target is achieved by minimising the
negative interactions between the EU ETS and ESD as discussed above. However the political
viability of including road transport in the EU ETS has been questioned by Pollitt (2014) who
examined different scenarios using a top-down model to ascertain the impact on the average EU
ETS price (2020-2030) and on the reduction in road transport emissions in 2030 compared to a
reference scenario (based upon PRIMES 2009 modelling). Pollitt (2014) estimates that, if the road
transport system would be included in the EU ETS, the average carbon price between 2020 and
2030 would need to be €217 /tCO2 to deliver emission reductions from the road transport sector
(i.e. 60g/km for cars in 2030) that are in line with the long term goal of the EU. Given the high
carbon price, it is argued that an alternative scenario whereby fuel standards are applied on new
vehicles would achieve the same ambitious emission reduction in the road transport sector at a
lower cost to consumers and industry.
3.2.4. EU added value
EU added value refers to the additional value resulting from the EU intervention compared to what
could be achieved by Member States at national or regional levels (European Commission, 2013).
Given the nature of emissions trading, it is to be expected that the additional value of an EU
intervention is primarily to lower compliance costs by facilitating the trade of low cost abatement
potential across all of the Member States. However, additional benefits may also include improved
levels of governance through enhanced central co-ordination and legal certainty that only the EU
can provide to Member States, especially with regards to the EU ETS compliance cycle. However,
the effectiveness of the scheme still depends upon the consistent and uniform implementation at
the Member State level. There is also a need to evaluate the added value of the EU ETS
compared with alternative policies (i.e. carbon tax, emission performance standards) in order to
determine whether the same objectives could be achieved by the EU in a more cost effective
manner. This section of the literature review responds to the following questions:
To what extent has the implementation of the EU ETS by Member States been improved by
the adoption of more harmonised approaches?

39
Harmonisation and market oversight
Harmonised approaches have generally improved the implementation of the EU ETS by removing
the previous distortions caused by Member States interpreting rules differently,
Verschuuren (2012) provides a report on the legal implementation of the EU ETS at the Member
State level and finds that, in comparison to command and control type instruments, the monitoring
and enforcement efforts associated with an emissions trading market is far more complex. As a
consequence of the harmonisation of the rules for verifiers by Regulation 600/2012/EU the
regulatory framework for compliance has improved considerably since the start of the scheme in
2005. However, he emphasises that the entire compliance cycle is not yet fully harmonised with
Member States retaining control of inspection, sanctioning and checking the compliance of the
MRV process. According to Dechezleprêtre (2012) the level of compliance by installation has
improved from 91% in Phase I to 97% in Phase II, although rates vary considerably across
Member States and this may reflect the different levels of enforcement. Verschuuren (2012)
suggests that further harmonisation of the compliance cycle may help to lower rates of non-
compliance.
The move towards harmonisation in the EU ETS also extends to the allocation rules for free
allowances based upon new benchmarking rules that reward installations with better emissions
performance. Lecourt et al. (2013) advocate that the harmonisation of the allocation rules will
reduce the differences in allocation levels across countries with similar carbon intensities of
production – thus reducing competitive distortions that were previously observed in Phase I and II
(Matthes et al., 2005). Furthermore, it is envisaged that the centralisation of allocation rules will
help to prevent the over allocation of allowances experienced in Phase I and II through the NAPs
of Member States.
The resilience of the EU ETS has also improved through greater levels of harmonisation in
response to the VAT fraud, money-laundering and other criminal activities that were uncovered in
2009. The security concerns were swiftly addressed by linking the EU ETS to the EU’s financial
regulatory instruments (i.e. Market Abuse Directive and Anti-Money Laundering Directive),
tightening rules on transactions and by harmonising all of the national registries into a single Union
registry (Verschuuren, 2012; Sartor, 2011). Further evaluation of these reforms will be necessary
over Phase III to assess the continued resilience of the EU ETS.
Would alternative policy instruments at EU or national levels have been more cost effective
than the EU ETS?
Alternative policies
The main focus of the evaluations reviewed is on the added value of EU intervention with
scenarios developed to assess the impact of alternative policies such as carbon taxes and
emission performance standards or simply no policies at all. The majority of the studies evaluated
show that emission reductions are achieved at lower cost by emissions trading than by alternative
policies.
The quantitative literature on cost-efficiency of existing or planned emissions trading systems
compared to other policy instruments is limited. The approaches found can be classified into three
groups: bottom-up approaches that use sector- or firm-specific information, partial-equilibrium
models that combine information from different sectors but often lose part of the detailed
information that can be found in bottom-up approaches and general equilibrium models that focus

40
on the interaction between sectors instead of using detailed sector- or firm-specific information.
Most of those cost-efficiency analyses are ex-ante cost efficiency estimates.
Studies estimating cost-efficiency ex-ante based on modelling exercises include Capros & Mantzos
(2000) and the European Commission (2008). In both studies the partial equilibrium model
PRIMES is used to estimate costs in a case with emissions trading in contrast to a reference
scenario. Capros & Mantzos, (2000) find that under the full trading scenario, the cost of achieving
the Kyoto targets for 2008-2012 reduces by almost 75% compared to the no trading scenario. A
similar exercise is presented in the European Commission (2008) impact assessment on the
20/20/20 package. Here cost estimates concentrate on the split between the targets for the ETS
and the non-ETS sectors as well as the use of offsets. In addition to PRIMES the models POLES
and GAINS as well as the general equilibrium models GEM E3 and PACE are used. The impact
assessment outlines that it would be more cost effective to deliver the majority (60%) of the
reduction effort for the GHG target under the sectors covered by the EU ETS.
In an ex-post study on the cost-efficiency of the EU ETS in comparison to alternative policy
instruments of the command-and-control-type (Öko-Institut et al. 2014)11), three Tier approaches to
assessing cost-efficiency are developed differing by breadth and depths of the desired analysis
and data availability. While the suggested Tier 1 approach is based on simple publicly available
quantity and price data for the EU ETS, the Tier 2 approach relies on more complex marginal
abatement cost curves potentially resulting from bottom-up analysis or partial modeling analysis.
The more complex Tier 3 approach requires the use of a model with an adequate representation of
the EU ETS sectors and countries. Case study applications of these Tier approaches show lower
abatement costs to achieve a given reduction target in all three Tiers. The study highlights that the
most important aspects driving the results of an ex-post assessment of the EU ETS include:
determining the avoided emissions due to the ETS compared to a system without ETS
(counterfactual scenario)
designing the alternative policy scenario without the possibility to trade
the availability and quality of suitable abatement cost curves
the choice of the assessment perspective with its trade-off between data requirements and
accuracy
The results, therefore, need to be seen in light of the assumptions, data availability and level of
detail for these aspects. They differ substantially by Tier approach and therefore show potentially
wide ranges in terms of avoided emissions and cost savings compared to an alternative policy
scenario.
3.2.5. Relevance
Relevance refers to the extent to which the objectives correspond to the needs within the EU
(European Commission, 2013). In the context of the EU ETS, the relevance evaluation criteria
applies primarily to the need of the EU to reduce GHG emissions - both in line with scientific
recommendations and in a cost effective and efficient manner. When reviewing evaluations that
consider the extent to which the objectives for the EU ETS correspond to the needs within the EU,
11
Study titled “Ex-post analysis of cost efficiency in the second trading period of the EU ETS State of the art Methodologies, applications and lessons learned” conducted for the German Federal Environment Agency, to be published in early 2015.

41
it is important to acknowledge how circumstances may have changed and that the needs may now
be different from when the policy intervention was originally designed. For example, the additional
objective of promoting low-carbon technology emerged as the dynamic efficiency of the EU ETS
(i.e. ensuring that compliance costs are lowered to meet ambitious GHG reductions in the long
term by investing in low-carbon technology now) was increasingly questioned in the literature. This
section of the literature review responds to the following question:
How well do the objectives of the EU ETS correspond to the needs within the EU?
Relevance of the EU ETS objectives
The objectives of the EU ETS do correspond to needs within the EU, however there is currently a
debate within the literature reviewed about whether complementary instruments are necessary to
support the EU ETS in order to fulfil the needs of the EU.
The objectives of the EU ETS were outlined in Section 2 and were frequently referred to in the
literature when evaluating a particular component of the EU ETS architecture. Whether this be
evaluating the stringency of the cap in relation to the GHG reductions recommended by the
International Panel on Climate Change (IPCC) or assessing carbon leakage provisions to ensure
that the competitiveness of participating firms was not adversely affected by the policy intervention
– thus reducing emissions in a cost effective and efficient manner. However, the delivery of all of
the objectives set for the EU ETS has been frequently discussed within the literature (especially
regarding the role of policy instrument in promoting low-carbon technologies) leading to questions
being asked about the future role of the EU ETS. Matthes (2010) provided further clarity on this
particular question in a theroetical analysis of the need for a climate policy mix. The red circle in
Figure 6 shows the abatement measures that will most likely be influenced by pricing policies such
as the EU ETS. According to Matthes (2010) the advantages of the EU ETS include:
1) Provides greater security that a GHG reduction target will be meet;
2) Generates a price signal for a range of abatement options close to market;
3) Increases the globalisation of climate policy through the possibility of linking emission
trading schemes and other flexible mechanisms.
Given that only incremental innovations have been observed in the EU ETS, Matthes (2010)
argues that complementary policies (i.e. incentive programs, regulations) are necessary in order to
realise the higher cost abatement potential in Figure 6 represented by the green circle. Indeed,
Aghion et al. (2009) suggest that R&D investments need to be increased in combination with a
higher and more stable carbon price. On the otherside of the abatement cost curve, the blue circle
in Figure 6 indicates abatement potential at negative cost that is currently unable to be realised
due to market barriers. Matthes (2010) again indicates that complementary policies (i.e. incentive
programs, regulations) will be necessary in addition to the EU ETS. It is important to also
acknowledge that any extension in the scope of the EU ETS in the future may make some of these
complementary policies obselete (Matthes, 2010). The relevance of the EU ETS in the future
climate policy mix was reaffirmed in the European Council Conclusions of October 2014, however
it is evident that complementary policies may be necessary in order to support the policy
instrument in delivering on all of its objectives.

42
Figure 6 Relevance of the EU ETS in the future policy mix
Source: Matthes (2010)
3.3. Summary
Throughout the literature review it was evident that the objectives of the EU ETS have responded
to the changing needs of the EU over time. The environmental stringency of the cap has been
progressively strengthened throughout the phases of the EU ETS. The stricter enforcement of
NAPs by the European Commission in Phase II and the transition to a harmonized EU wide cap
that declines in line with an annual linear reduction factor from Phase III onwards demonstrates
how the design of the EU ETS has improved to fulfil the need of the EU to achieve ambitious
emission reductions. As discussed in Section 3.2.1 the reform of the ETS from 2021 onwards is
likely to increase ambition further to ensure that the policy instrument contributes to the EU 2050
target of a 80 to 95% reduction in GHG emissions below 1990 levels.
The EU ETS is widely acknowledged within the literature to have achieved abatement in a cost
effective manner due to the creation of a price signal that reflects the supply and demand for
allowances within the market (Section 3.2.2). However given the allowance surplus that has
accumulated throughout Phase II, partly as a consequence of the economic recession, policy
makers intervened via the backloading decision and by proposing future reforms such as the
Market Stability Reserve to increase the flexibility of allowance supply to ensure that the dynamic
efficiency of the EU ETS is improved to prevent the lock in of carbon intensive technologies. The
importance of the EU ETS in delivering low cost abatement is demonstrated within various
counterfactural simulations in the literature (Section 3.2.4). By improving the interaction between
the EU ETS and complementary policies such as the RES Directive (Section 3.2.3) it is likely that
the EU ETS will be able to contribute to the encouragement of the low-carbon technologies that the
EU needs to transition to a decarbonised economy.

43
4. Gap analysis
Building upon the literature review in the previous section, the gap analysis takes a step back and
provides a wider perspective on the availability of evaluations of the performance of the EU ETS.
The methodological approach of the gap analysis is briefly summarised in Section 4.1 and is
subsequently followed by a discussion of the main findings in Section 4.2 and a brief summary in
Section 4.3.
4.1. Methodological approach
Within the review protocol an evaluation is defined as published primary research that applied a
transparent and robust methodology in order to assess the performance of the EU ETS. Secondary
research based upon a review of primary research is discounted from the gap analysis and
therefore policy briefings, position statements, literature reviews, guidance and descriptive
documents that were identified during the literature search were excluded. Furthermore research
prior to 2005 was also excluded from the gap analysis. The literature included within the gap matrix
table is intended to provide first insights into the availability of primary research on EU ETS
performance (Table 9), however it is likely that information from research papers may not have
been fully captured based upon the search terms applied in the literature search (which followed a
strict methodology to limit selection bias).
In order to determine which aspects of the review questions require further research in the
literature, a matrix table was developed, which enabled the review team to categorise the primary
research according to 1) the sectoral and geographical scope 2) the content of the evaluation and
3) the methodology applied. The review protocol (Section 7.1) provides guidance on how to
categorise the evaluations – especially for attributing the applicable broad categories (i.e.
objectives, interaction, governance, functioning, short or long term impact) and evaluation criteria
sub-fields to classify the content of each evaluation. Evaluations were often applicable to more
than one broad category and evaluation criteria sub-field, therefore the review team were
instructed in the review protocol to categorise evaluations to broad categories and evaluation
criteria questions only if the outcome of the primary research was directly applicable. To ensure
consistency, guidance was provided within the review protocol (Section 7.1).
Following the categorisation of the evaluations, gaps in the literature were identified based upon
the following set of criteria:
The conclusions of policy evaluations for a broad category and evaluation criteria sub-field
were inconclusive referring to the literature review in the previous section;
The range of policy evaluation methods applied for a particular broad category and
evaluation sub-field may not be sufficiently varied or data availability was poor;
The number of policy evaluations for a broad category and evaluation criteria sub-field was
below a relative threshold (i.e. below the average);
4.2. Main findings
The outcome of the gap analysis is presented in Table 9 which illustrates the availability of
evaluations on the performance of the EU ETS from the literature reviewed in this study. The
findings from Table 9 will be discussed in the following sub-sections.

44
Table 9 Gap matrix table
Note: Evaluations are categorised under multiple categories and therefore do not add up
to the totals for each broad category under the sectoral and geographical scope.
Source: Own calculation
Broad Categories
Sectoral Scope All
Pow
er
Industr
y
Oth
er
All
Pow
er
Industr
y
Oth
er
All
Pow
er
Industr
y
Oth
er
All
Pow
er
Industr
y
Oth
er
All
Pow
er
Industr
y
Oth
er
All
Pow
er
Industr
y
Oth
er
Geographical Scope
EU 2 0 0 0 18 6 1 2 25 3 1 1 86 32 18 6 34 20 39 1 21 16 27 2
Non-EU 0 0 0 0 0 0 0 0 0 0 0 0 2 0 0 0 1 0 0 0 1 0 0 0
Evaluation Criteria
Relevance
Objectives vs needs 2 0 0 0 0 0 0 0 0 0 0 0 0 0 0 0 1 0 0 0 1 0 0 0
Other 0 0 0 0 0 0 0 0 0 0 0 0 1 0 0 0 0 0 0 0 0 0 0 0
Effectiveness
GHG abatement 0 0 0 0 4 0 0 1 4 0 0 1 13 2 0 1 18 5 1 0 6 1 0 1
Investment / innovation 0 0 0 0 2 2 0 0 4 2 1 0 6 4 2 0 9 9 8 0 12 13 10 0
Competitiveness 0 0 0 0 1 0 0 0 2 1 1 0 4 3 3 1 8 7 23 1 7 5 15 1
Carbon leakage 0 0 0 0 1 0 0 0 3 1 1 0 8 1 4 0 10 2 23 0 6 1 16 0
Other 0 0 0 0 0 0 0 0 0 0 0 0 0 0 0 0 0 0 0 0 0 0 0 0
Efficiency
Flexible mechanisms 0 0 0 0 4 1 1 1 5 0 0 0 19 2 3 2 7 0 0 0 3 0 0 0
Transaction / admin costs 0 0 0 0 1 0 0 0 2 0 0 0 11 0 1 0 1 0 0 0 2 0 0 0
Cap setting 0 0 0 0 2 0 0 0 4 0 0 0 11 1 2 0 6 1 1 0 1 1 2 0
Allocation of allowances 0 0 0 0 3 0 0 0 8 1 0 0 33 10 8 0 15 5 4 0 5 3 3 0
MRV 0 0 0 0 0 0 0 0 4 0 0 0 4 0 2 0 1 0 0 0 1 0 0 0
Price signal 0 0 0 0 4 3 1 1 4 0 0 0 30 11 1 1 3 3 0 0 2 3 0 0
Cost-pass through 0 0 0 0 0 0 0 0 0 0 0 0 3 15 7 2 1 1 3 1 0 0 1 1
Windfall profits 0 0 0 0 1 0 0 0 1 0 0 0 2 10 3 1 2 0 1 0 1 0 0 0
Structual reform 0 0 0 0 1 0 0 1 4 1 0 1 18 1 0 2 6 0 0 1 2 0 0 2
Other 0 0 0 0 0 0 0 0 1 0 0 0 2 0 1 0 0 0 0 0 0 0 0 0
EU Added Value
Alternative policies 0 0 0 0 5 1 0 1 8 2 1 1 3 0 0 1 2 0 0 0 5 2 1 1
Harmonisation 0 0 0 0 0 0 0 0 9 0 0 0 6 0 0 0 1 0 0 0 0 0 0 0
Market oversight 0 0 0 0 0 0 0 0 3 0 0 0 2 0 0 0 0 0 0 0 0 0 0 0
Other 0 0 0 0 1 0 0 0 9 0 0 0 4 0 0 0 0 0 0 0 1 0 0 0
Coherence
Internal coherence 0 0 0 0 3 0 0 0 1 0 0 0 1 0 0 0 0 0 0 0 0 0 0 0
External coherence 0 0 0 0 17 6 1 2 6 1 0 1 6 3 1 2 3 0 0 0 3 2 0 1
Other 0 0 0 0 0 0 0 0 0 0 0 0 0 0 0 0 0 0 0 0 0 0 0 0
Methodology
Theory based evaluation 1 0 0 0 3 1 1 1 4 0 0 0 7 4 1 1 2 0 0 0 2 0 0 0
Econometric /statistical analysis 0 0 0 0 2 0 0 0 3 1 1 0 33 20 8 0 10 6 12 0 6 3 4 0
Top down modelling 0 0 0 0 1 1 1 2 3 0 0 1 1 1 1 2 4 1 4 0 3 1 4 1
Bottom up modelling 0 0 0 0 7 0 0 0 5 2 0 0 8 10 2 0 3 7 12 0 2 6 10 0
Multi criteria analysis 0 0 0 0 1 0 0 0 1 0 0 0 3 0 0 0 1 0 0 0 1 0 0 0
Surveys 0 0 0 0 0 0 0 0 2 0 0 0 8 0 3 1 5 0 2 0 6 0 2 0
Data analysis 0 0 0 0 4 3 0 0 7 0 0 0 27 6 3 2 12 5 12 0 4 4 9 0
Interviews 0 0 0 0 0 0 0 0 2 0 0 0 2 3 4 0 1 3 7 0 2 3 6 0
Event study 1 0 0 0 0 0 0 0 0 0 0 0 0 0 0 0 1 0 0 0 1 0 0 0
Case Studies 0 0 0 0 0 0 0 0 0 1 1 0 3 1 2 0 0 2 1 0 0 3 2 0
Legal analysis 0 0 0 0 0 0 0 0 0 0 0 0 0 0 0 0 0 0 1 0 0 0 1 0
Other 0 0 0 0 2 1 0 0 2 0 0 0 1 0 2 1 2 0 1 1 1 0 0 1
Short term Long term Objectives Interaction Governance Functioning

45
4.2.1. Effectiveness
Under the evaluation criteria effectiveness and the broad category of short term impacts,
evaluations on GHG abatement were most prominent for all sectors of the economy (18
evaluations). While there was a consensus within the literature that abatement has been induced
by the EU ETS, it was widely acknowledged that the construction of a counterfactual baseline was
very uncertain – especially after the economic recession (Section 3.2.1). Evaluations on carbon
leakage (23 evaluations) and competitiveness (23 evaluations) were most frequent in the industrial
sector (Table 9). Although limited ex-post evidence of carbon leakage or competitiveness losses
were found in the literature review (Section 3.2.1) it was generally accepted that the circumstances
of Phase I and II would not necessarily be repeated in Phase III and beyond and therefore these
concerns needed to be continuously evaluated assessed. The number of evaluations focusing on
other sectors such as aviation and the potential inclusion of sectors currently outside the scope of
the EU ETS (i.e. road transport) were more limited within the literature reviewed.
Under the evaluation criteria effectiveness and broad category of long term impacts, the evaluation
criteria sub-field entitled investment and innovation (12 evaluations) accounted for the highest
number of evaluations covering all sectors of the economy (Table 9). The research in this thematic
area relates primarily to whether or not the EU ETS is successfully achieving the objective set to
promote low-carbon technologies. The majority view from the literature reviewed was that while the
EU ETS may have influence on small scale investment decisions (associated with short payback
periods) and operational decisions – the influence of the policy instrument on the larger, longer
term investment decisions (as outlined as an objective for the EU ETS in the 7th Environmental
Action Plan) were limited as a consequence of the volatile and uncertain price signal.
The following gaps in the literature under effectiveness have been identified:
1. Counterfactual baselines without the EU ETS were associated with high levels of
uncertainty and work is currently limited on baselines beyond Phase I. Future research
needs to focus on the development of credible counterfactual baselines from which to
assess the abatement driven by the EU ETS;
2. The review of the literature found several econometric analyses that aimed to quantify the
impact of different drivers of emission reductions and competitiveness effects and this
research needs to be replicated and improved upon as longer time series data becomes
available;
3. Evaluations on carbon leakage via the investment channel (i.e. declines in inward
investment) were limited and primarily based upon qualitative research techniques (i.e.
surveys and interviews). Access to firm level data on investments would enable a more
robust assessment of the vulnerability of industry to the risk of carbon leakage.
4. Based upon the literature reviewed, evaluations that focused on the effectiveness of
sectors in past (i.e. aviation) and potentially future (i.e. road transport) scope changes to
the EU ETS were more limited and warrants further analysis to better understand the
impact on the overall effectiveness.
4.2.2. Efficiency
Under the evaluation criteria efficiency and broad category entitled functioning of the market,
evaluations focusing on the allocation of allowances (33 evaluations covering all sectors of the
economy) were frequently assessed in the literature. The allocation of allowances have wide

46
implications for many design elements of the EU ETS – most notably for protectionist measures for
sectors that are deemed to be at risk of carbon leakage. However intervening against this
unintended impact had the further unintended effect of windfall profits in both the energy and
industrial sectors as firms passed on the opportunity cost of allowances into consumer prices
(Section 3.2.2). It is therefore possible to observe in Table 9 that evaluations that focus on
allowance allocation are also often associated with short (15 evaluations covering all sectors of the
economy) and long (5 evaluations covering all sectors of the economy) term impacts. Evaluations
on the price signal of the EU ETS (30 evaluations covering all sectors of the economy) were
prevalent in the literature. The majority of studies found that the EUA price is driven by market
fundamentals and can therefore be considered as functioning efficiently. Evaluations on
transaction costs (11 evaluations covering all sectors of the economy) were less frequent in the
literature. However, evidence suggests that smaller firms are proportionately more affected by
transaction costs than larger firms participating in the EU ETS. The following gaps in the literature
under efficiency have been identified:
5. All in all it can be concluded that a correlation analysis aiming at singling out the effect of
CO2 pricing on product prices provides a major challenge. More robust insights might be
gained by conducting more estimations based on similar assumptions and assessing the
robustness of the results with the help of sensitivity analyses.
6. The dynamic efficiency of the EU ETS has emerged as an issue within the literature that
warrants further investigation to determine whether or not the price signal of the EU ETS is
strong and stable enough to promote the low-carbon technologies needed to lower the
compliance costs of achieving ambitious GHG reduction targets in the long run.
7. Evaluations on transaction costs are mainly confined to qualitative evidence primarily at a
national level with limited comparability between studies. More coordinated research at the
national level is necessary to build up the evidence base and help to confirm the correct
threshold for inclusion in the scheme.
4.2.3. Coherence
Under the evaluation criteria coherence and broad category of interaction, a growing body of
research has emerged in the literature on the external coherence (17 evaluations covering all
sectors of the economy) of the EU ETS with the RES and EE targets. The literature reviewed
focused particularly on the interaction between the EU ETS and the RES Directive concluding that
the interaction results in no additional emission reductions but reduces the price of EUAs (Section
3.2.3). The interaction between the EU ETS and the ESD was also evaluated within the literature
where it was acknowledged by several authors that the over allocation of allowances in Phase I
and II of the EU ETS increased the GHG reduction burden onto sectors covered by the ESD (i.e.
buildings, transport) which has potentially increased the overall compliance cost of meeting the EU
target for GHG reductions as marginal abatement costs in non-ETS sectors are widely accepted as
being more expensive.
The following gaps in the literature have been identified :
8. Evaluations have concluded that the only way in which emission reductions from the RES
Directive could be considered additional would be if the expected emissions were taken into
account to further reduce the EU ETS cap. The extent to which the expected emission
reductions from the 2030 target for renewable energy is coherent with the setting of the EU
ETS cap requires further research.

47
9. The number of ex-ante and ex-post evaluations of the overlap of policy instruments is
increasing in the literature to evaluate levels of overall coherence, however further research
should also assess the potential impact of adding greater flexibility to the supply of
allowances in the EU ETS via the introduction of the Market Stability Reserve as currently
proposed by the European Commission.
10. Marginal abatement costs provide valuable data, from which to determine the most cost
efficient split between sectors to reduce GHG emissions (and improve the coherence
between the EU ETS and ESD). There is a need for greater collaboration between
researchers to ensure that marginal abatement costs are accurate, transparently calculated
and credible.
4.2.4. EU added value
Under the evaluation criteria EU added value and the broad category of governance, the literature
reviewed is more limited. The main focus of the evaluations is on the added value of EU
intervention regarding the implementation and enforcement of the EU ETS across all participating
countries. There is evidence to suggest in Table 9 that the harmonisation of MRV and allocation
rules has improved (9 evaluations under all sectors of the economy). However the functioning of
the ETS compliance practice varies considerably across the different Member States as a result of
different enforcement strategies, institutional settings and in funding. In light of a series of recent
crimes related to the EU ETS several evaluations have qualitatively assessed the extent to which
improvements in market oversight would prevent similar events taking place in the future. The EU
added value is also assessed within the literature through the development of scenarios assessing
the impact of alternative policies (8 evaluations under all sectors of the economy) such as carbon
taxes and emission performance standards or simply no policies at all (Section 3.2.4). The
majority of the studies evaluated show that emission reductions are achieved at lower cost by
emissions trading than by alternative policies.
The following gaps in the literature have been identified :
11. Given the relatively low number of evaluations (relative to the average) under the
evaluation sub-field entitled ‘market oversight’ further efforts should be made to assess the
effectiveness of recent changes to market regulation to ascertain how resilient the EU ETS
is to future criminal attacks.
12. The extension of free allocation provisions beyond 2020, which were announced by the
European Council in October 2014, specified the need for ‘appropriate measures’ to
protect the competitiveness of industry. Therefore further research into the design of
harmonised benchmarking in Phase IV of the EU ETS is necessary.
13. Given the relatively low number of evaluations (relative to the average) under the
evaluation sub-field entitled ‘alternative policies’ further efforts should be made to assess
the alternative or possible complementary measures policies by developing credible and
transparent counterfactual baselines.
4.2.5. Relevance
Under the evaluation criteria relevance and the broad category of objectives, the literature
reviewed is very limited. However the relevance of the EU ETS in relation to the climate policy mix

48
and market responses was evaluated within the literature. Furthermore, the majority of the
research referred to the objectives of the EU ETS (and the needs of the EU) as a justification for
examining key issues regarding the policy instrument.
The following gaps in the literature have been identified:
14. No evaluations within the literature reviewed that specifically assess the relevance of the
EU ETS to the needs of the EU and therefore this could be an area for future research to
provide further insights.
4.3. Summary
The outcome of the gap analysis is presented in Table 10, which shows the 14 evaluation gaps
identified (which correspond to the numbered bullet points in the previous section) and are
categorised according to the type of gap that include:
Methodological gap: refers to limitations in the methodology currently deployed in the
literature to assess the performance of the EU ETS;
Data gap: refers to the limitation of data that prevents more quantitative approaches to
assess the performance of the EU ETS from being implemented and;
Coverage gap: refers to aspects of the EU ETS which are insufficiently covered in the
literature reviewed.
Each of these different types of gap will be explained further in the following summary of the
current gaps identified in the literature reviewed.
Table 10 Overview of the evaluation gaps identified in the literature
Source: Own calculation
Evaluation Gap Type of Gap
(1) Standardised counterfactual baselines need to be developed to evaluate EU ETS performance Methodological
(2) Incomplete time-series data - research needs to be updated with more complete data Data
(3) Lack of available data on investments Data
(4) Limited evaluations on the past and future scope changes to the EU ETS Coverage
(5) Sensitivity analysis of econometric results on cost pass through necessary Methodological
(6) Dynamic efficiency of the EU ETS - is the price signal strong enough? Coverage
(7) Lack of data availablity on transaction costs Data
(8) Extent to which renewables development is accounted for in the 2030 EU ETS cap Coverage
(9) Future impact of the Market Stability Reserve on the functioning of the EU ETS Coverage
(10) Standardised, credible and transparently calculated marginal abatement costs curves Methodological
(11) Limited evaluations on market oversight Coverage
(12) Future allocation of free allowances - defining 'appropriate measures' Coverage
(13) Limited evaluations on alternative policies to EU ETS Coverage
(14) Limited evaluations assessing the relevance of the objectives to the needs of the EU Coverage

49
4.3.1. Methodological gaps
The development of counterfactual baselines in order to assess the performance of the EU ETS,
should be a priority for future research. For example, evaluations on the GHG abatement induced
by the EU ETS (Section 3.2.1) were limited by how the counterfactual baseline (i.e. emissions
development without the EU ETS) was constructed. The availability of emissions data at the
necessary level of disaggregation also hindered efforts to assess the impact of the EU ETS on
GHG abatement – especially with Phase I evaluations. The economic shock at the start of Phase II
further increased the difficulty of developing a credible counterfactual baseline, with projections of
GHG emissions in Phase II, often based upon common drivers (i.e. GDP growth, energy intensity
development), invalidated by the size of the economic recession. As a consequence, econometric
techniques have been increasingly deployed in the literature to identify the drivers of GHG
abatement in Phase II – which will provide important insights for future counterfactual baseline
development. Further collaboration between researchers, public authorities and consultants is
required in order to have standardised baselines that are widely accepted from which future
evaluations on the effectiveness of the EU ETS can be completed.
The lack of agreement between ex-ante modelling and empirical ex-post assessments in the
literature regarding carbon leakage suggests that the modelling assumptions used in ex-ante
studies, such as the carbon price and estimates of cost pass through, may not accurately reflect
the reality observed so far in Phase I and II of the EU ETS. This is to a certain extent inevitable as
modelling assumptions were made with expectations that did not materialise as a consequence of
unanticipated events. Although the disparity between ex-ante modelling and empirical ex-post
assessments may also have been due to the implementation of carbon leakage provisions (i.e.
allocation of free allowances) that may have prevented the more pessimistic ex-ante modelling
results from taking place. Given the reforms to the EU ETS in Phase III, it will be important for
future research to accurately consider the impacts of measures, such as allocating free allowances
via benchmarking, by updating modelling assumptions to take into account recent developments.
In order to improve the comparability of ex-ante modelling results in the future it may be helpful for
certain standard assumptions to be commonly adopted by researchers.
4.3.2. Data gaps
The lack of investment data limits the ability of researchers to currently answer questions regarding
issues such as carbon leakage via the ‘investment channel’ and therefore the methodologies
applied are also limited to more qualitative approaches. For example, currently survey data is
primarily relied upon to ascertain the influence of the EU ETS on investment decisions. Although
survey data provides interesting insights the outcome of the research may not necessarily be
widely applicable to all firms participating in the EU ETS. Confidentiality concerns will always
hinder the accessibility of investment data. However improvements need to be made, even at a
more aggregated level, in order to ascertain the impact of the EU ETS on the investment decisions.
Improving data availability via more comprehensive company reporting may eventually allow for
more quantitative techniques to be applied in the future.
Given that Phase I of the EU ETS only started in 2005, the empirical evidence base for evaluating
the performance of the EU ETS has been relatively limited compared to other more mature
markets. However, now that data is available for two complete phases of the EU ETS it should be
a priority for researchers to replicate previous methodologies from the literature with updated time
series data in order to see if the original findings remain valid. For example, econometric studies
that evaluated the ability of firms to pass through carbon costs into prices or assess their level of

50
competitiveness would benefit from longer time series data to improve the significance of previous
results.
4.3.3. Coverage gaps
The European Council Conclusions in October 2014 reaffirmed that the EU ETS is the main
European instrument to achieve the EU’s 40% GHG reduction target, however the text emphasised
that reform is necessary to ensure that the ETS functions correctly. Based upon the review of the
literature, the number of robust evaluations on the impact of the Market Stability Reserve remains
relatively low. However, this is to be expected given the fact that the proposal for the policy
intervention is very recent and further research on its impacts on the EUA price and allowance
surplus is expected. The concerns of industry regarding carbon leakage were alleviated slightly
with the announcement in the European Council Conclusions that the provision of free allowances
to protect sectors deemed at risk of carbon leakage will continue after 2020. The debate now turns
to what constitutes ‘appropriate’ levels of support. Within the literature, evaluations focusing on
benchmarking and alternatives to free allocation (i.e. dynamic allocation) were relatively low in
number. This is another area to be further addressed in future research.
In addition to coverage gaps as a consequence of new policy decisions regarding the EU ETS, it
was evident from the gap analysis that certain sub-fields associated with ‘older’ issues received
relatively less attention. These included evaluations focusing on market oversight, on the internal
coherence of the EU ETS and on other sectors such as aviation and sectors that may be included
in the EU ETS in future scope extensions (i.e. road transport). These gaps may reflect a lack of
activity in the literature. However, this result may also be due to the limitations of the literature
review search. Although over a 1000 publications were considered for the literature review, it is
likely that certain publications may have failed to be detected and therefore this research should be
continually updated over time to build upon the literature collected in this project. A systematic
approach was undertaken to search for publications to include in the review without bias. However,
it is likely that the selection of search terms and the categorisation of evaluations in the gap
analysis may be subject to a certain degree of bias – therefore the approach is transparently
documented in order to reduce any selection bias in future work.

51
5. Conclusion
The EU ETS is associated with multiple objectives, which have developed over time, and
correspond to the needs of the EU to reduce GHG emissions. The literature on the performance of
the EU ETS has been reviewed in accordance with five evaluation criteria (effectiveness,
efficiency, coherence, EU added value and relevance) all of which were associated with specific
review questions. The study responded to each of these questions based upon the findings of the
literature review, which provided stronger evidence for certain aspects of the EU ETS performance
(i.e. over allocation of allowances) compared to less reliable evidence for other aspects (i.e.
investment leakage caused by the EU ETS). This report then attempted to quantify such insights
further by constructing a gap matrix table, which was the product of a detailed review of over 250
publications (which were screened from an initial search of over 1000 publications from a range of
sources). By extracting data from these publications, the gap matrix table was populated with
information to enable gaps in the literature to be identified for further research. In total, fourteen
gaps were identified that were categorised into methodological, data and coverage gaps.
The results of this study can contribute to learning from previous experiences with the EU ETS in
view of seizing the EU ETS’ potential to make an important contribution to achieve the 2030 GHG
reduction target confirmed recently by the European Council. The evaluation of the performance of
the EU ETS needs to be improved upon, in particular in order to identify and better address areas
where the functioning of the EU ETS could be improved.
Firstly, the study has identified important methodological gaps that exist in the construction of
credible baselines from which to assess the impact of the EU ETS on GHG abatement,
competitiveness etc. It therefore should be a priority to encourage greater collaboration amongst
researchers to ensure that these counterfactual baselines become more standardised and widely
agreed upon in the future to enhance the comparability between evaluations.
Secondly, data gaps identified in the literature will need to be addressed if important questions
concerning the performance of the EU ETS, especially with regards to investment leakage, are to
be definitively answered in the future.
Thirdly, coverage gaps in the literature mainly relate to the emergence of new topics as the EU
ETS enters a period of reform. It is evident that further clarity will be required to ascertain whether
additional complementary policies (i.e. emission performance standards) are necessary to improve
the dynamic efficiency of the scheme and create a strong and stable price signal to promote the
low-carbon technologies necessary to deliver the most ambitious emission reductions targeted in
2050. The proposal by the European Commission to introduce greater flexibility in managing the
supply of allowances in the EU ETS, should help to alleviate previous problems experienced with
economic shocks and overlapping policies. However, this will need to be validated by future
research. The extension of carbon leakage provisions beyond 2020 (as announced in the
European Council Conclusions in October, 2014) and benchmarking provisions for free allocation
in Phase IV will be another important area of research.

52
6. References
6.1. References (Literature Review)
Abrell, Jan; Ndoye Faye, Anta; Zachmann, Georg (2011): Assessing the Impact of the EU ETS
Using Firm Level Data. Bruegel/University of Strasbourg/University of Konstanz,, checked on
10/29/2014.
Aghion, Philippe; Veugelers, Reinhilde; Seere, Clement (2009): Cold start for the green innovation
machine, checked on 11/17/2014.
Alberola, Emilie (2008): Price drivers and structural breaks in European carbon prices 2005–2007.
Alexeeva-Talebi, Victoria (2010): Cost Pass-Through in Strategic Oligopoly: Sectoral Evidence for
the EU ETS. ZEW, checked on 10/30/2014.
Anderson, Barry; Di Maria, Corrado (2010): Abatement and Allocation in the Pilot Phase of the EU
ETS, checked on 12/6/2014.
Anger, Niels; Oberndorfer, Ulrich (2008): Firm performance and employment in the EU emissions
trading scheme: An empirical assessment for Germany. In Energy Policy 36 (1), pp. 12–22. DOI:
10.1016/j.enpol.2007.09.007.
Armington, Paul (1969): A Theory of Demand for Products Distinguished by Place of Production.
International Monetary Fund Staff Papers, XVI (1969), 159-78
Betz, Regina; Sato, Misato (2006): Emissions trading: lessons learnt from the 1st phase of the EU
ETS and prospects for the 2nd phase. In Climate Policy (6), pp. 351–359, checked on 10/29/2014.
Blanco, María Isabel; Rodrigues, Gloria (2008): Can the future EU ETS support wind energy
investments? In Energy Policy 36, pp. 1509–1520, checked on 10/30/2014.
Blyth, William; Bunn, Derek (2011): Coevolution of policy, market and technical price risks in the
EU ETS. In Energy Policy 39 (8), pp. 4578–4593. DOI: 10.1016/j.enpol.2011.04.061.
Böhringer, Christoph; Hoffmann, Tim; Lange, Andreas; Löschel, Andreas; Moslener, Ulf (2005):
Assessing Emission Allocation in Europe: An Interactive Simulation Approach, checked on
12/18/2014.
Böhringer, Christoph; Hoffmann, Tim; Manrique-de-Lara-Peñate, Casiano (2006): The efficiency
costs of separating carbon markets under the EU emissions trading scheme: A quantitative
assessment for Germany. In Energy Economics 28 (1), pp. 44–61. DOI:
10.1016/j.eneco.2005.09.001.
Borkent, Bram; Gilbert, Alyssa; Klaassen, Erik; Neelis, Maarten; Blok, Kornelis (2014): Dynamic
allocation for the EU Emissions Trading System. Ecofys, checked on 10/31/2014.
Bruyn de, Sander; Nelissen, Dagmar; Koopman, Marnix (2013): Carbon leakage and the future of
the EU ETS market. Impact of recent developments in carbon prices and design of EU ETS on the
list of sectors deemed to be exposed to carbon leakage. Delft, C. E., checked on 10/27/2014.
Bunn, Derek; Fezzi, Carlo (2007): Interaction of European Carbon Trading and Energy Prices,
checked on 11/17/2014.
Calel, Raphael; Dechezlepretre, Antoine (2013): Environmental Policy and Directed Technological
Change: Evidence from the European carbon market, checked on 10/30/2014.
Capros, P.; Mantzos, L.; Papandreou, V.; Tasios, N. (2008): Model‐based Analysis of the 2008 EU
Policy Package on Climate Change and Renewables, checked on 12/17/2014.

53
Capros, Pantelis; Mantzos, Leonidas (2000): Kyoto and technology at the European Union: costs
of emission reduction under flexibility mechanisms and technology progress, checked on
12/18/2014.
Chan, Hei Sing; Li, Shanjun; Zhang, Fan (2013): Firm competitiveness and the European Union
emissions trading scheme. In Energy Policy 63, pp. 1056–1064. DOI: 10.1016/j.enpol.2013.09.032.
Chappin, E.J.L.; Dijkema, G.P.J. (2009): On the impact of CO2 emission-trading on power
generation emissions. In Technological Forecasting and Social Change 76 (3), pp. 358–370. DOI:
10.1016/j.techfore.2008.08.004.
Clò, Stefano (2008): Assessing the EU ETS effectiveness in reaching the Kyoto target: An Analysis
of the Cap Stringency. Rotterdam Institute of Law and Economics (RILE), checked on 10/29/2014.
Clò, Stefano (2010): Grandfathering, auctioning and Carbon Leakage: Assessing the
inconsistencies of the new ETS Directive. In Energy Policy 38 (5), pp. 2420–2430. DOI:
10.1016/j.enpol.2009.12.035.
Damien Demailly, Philippe Quirion (2006): CO2 abatement, competitiveness and leakage in the
European cement industry under the EU ETS: Grandfathering vs. output-based allocation. In
Climate Policy 6 (1), pp. 93–113, checked on 10/30/2014.
de Bruyn, Sander; Markowska, Agnieszka; Jong, Femke de; Bles, Mart (2010): Does the energy
intensive industry obtain windfall profits through the EU ETS? Delft, C. E., checked on 10/30/2014.
Dechezleprêtre, Antoine (2012): Report on the empirical assessment of monitoring and
enforcement of EU ETS regulation. Entracte, checked on 10/31/2014.
Dechezleprêtre, Antoine; Gennaioli, Caterina; Martin, Ralf; Muûls, Mirabelle (2014): Searching for
carbon leaks in multinational companies. Grantham Research Institute, checked on 11/2/2014.
del Río, P. (2009): Interactions between climate and energy policies: the case of Spain. In Climate
Policy 9, pp. 119–138.
Delarue, Erik; Voorspools, Kris; D’haeseleer, William (2008): Fuel switching in EU ETS: review and
prospective, checked on 10/30/2014.
Demailly, Damien; Quirion, Philippe (2008): Changing the Allocation Rules in the EU ETS: Impact
on Competitiveness and Economic Efficiency, checked on 11/16/2014.
EC (2009): Directive 2009/29/EC of the European Parliament and of the Council of 23 April 2009
amending Directive 2003/87/EC so as to improve and extend the greenhouse gas emission
allowance trading scheme of the Community, checked on 12/17/2014.
EEA (2001): Reporting on environmental measures: Are we being effective?, checked on
12/20/2014.
EEA (2013a): Trends and projections in Europe 2013 — Tracking progress towards Europe's
climate and energy targets until 2020, checked on 10/30/2014.
EEA (2013b): Trends and projections in Europe 2013 — Tracking progress towards Europe's
climate and energy targets until 2020, checked on 12/6/2014.
EEA (2014): Trends and projections in Europe 2014 — Tracking progress towards Europe's
climate and energy targets for 2020, checked on 12/17/2014.
Egenhofer, C.; Alessi, M.; Georgiev, A.; Fujiwara, J. (2011a): The EU Emissions Trading System
and Climate Policy towards 2050: Real incentives to reduce emissions and drive innovation?
(CEPS Special Reports).
54
Egenhofer, Christian; Alessi, Monica; Georgiev, Anton; Fujiwara, Noriko (2011b): The EU
Emissions Trading System and Climate Policy towards 2050. Real incentives to reduce emissions
and drive innovation? Centre for European Policy Studies (CEPS), checked on 10/29/2014.
Ellerman, Denny; Buchner, Barbara (2006): Over-allocation or abatement? A preliminary analysis
of the EU ETS based on the 2005 emissions data, checked on 11/16/2014.
EU (2013): Decision No 1386/2013/EU of the European Parliament and of the Council of 20
November 2013 on a General Union Environment Action Programme to 2020 Living well, within the
limits of our planetText with EEA relevance, checked on 12/17/2014.
European Commission (2000): Communication from the Commission to the Council and the
European Parliament on EU policies and measures to reduce greenhouse gas emissions: Towards
a European Climate Change Programme (ECCP), checked on 12/17/2014.
European Commission (2008): Impact Assessment: Document accompanying the Package of
Implementation measures for the EU's objectives on climate change and renewable energy for
2020, checked on 12/18/2014.
European Commission (2012): Report from the Commission to the European Parliament and the
Council: The state of the European Carbon Market in 2012, checked on 12/18/2014.
European Commission (2013): Public consultation on Commission Guidelines for Evaluation,
checked on 12/17/2014.
Fagiani, Riccardo; Richstein, Jörn C.; Hakvoort, Rudi; Vries, Laurens de (2014): The dynamic
impact of carbon reduction and renewable support policies on the electricity sector. In Utilities
Policy 28, pp. 28–41. DOI: 10.1016/j.jup.2013.11.004.
Gloaguen, Olivier; Alberola, Emilie (2013): Assessing the factors behing CO2 emissions changes
over the phases 1 annd 2 of the EU ETS: an econometric analysis. CDC Climat Research,
checked on 11/28/2014.
Graichen, Verena; Schumacher, Katja; Matthes, Felix (2008): Impacts of the EU Emissions Trading
Scheme on the industrial competitiveness in Germany. In Climate Change, checked on
10/30/2014.
Heindl, Peter (2012): Transaction Costs and Tradable Permits: Empirical Evidence from the EU
Emissions Trading Scheme. ZEW, checked on 10/29/2014.
Hervé-Mignucci, Morgan (2011): Operating and financial investments by European utilities over
2004-2009: what role for European mitigation policies?, checked on 11/16/2014.
Hoffmann, Volker H. (2007): EU ETS and Investment Decisions. In European Management Journal
25 (6), pp. 464–474. DOI: 10.1016/j.emj.2007.07.008.
Hu, Jing; Crijns-Graus, Wina; Lam, Long; Gilbert, Alyssa (2014): Ex-ante evaluation of EU ETS
during 2013–2030: EU-internal abatement. In Energy Policy. DOI: 10.1016/j.enpol.2014.11.023.
Jaraite, Jurate; Convery, Frank J.; Di Maria, Corrado (2009): Transaction costs of firms in the EU
ETS. Irish Economic Association, checked on 10/31/2014.
Keppler, Jan Horst; Cruciani, Michel (2010): Rents in the European power sector due to carbon
trading. In Energy Policy 38 (8), pp. 4280–4290. DOI: 10.1016/j.enpol.2010.03.057.
Keppler, Jan Horst; Mansanet-Bataller, Maria (2010): Causalities between CO2, electricity, and
other energy variables during phase I and phase II of the EU ETS. In Energy Policy 38 (7),
pp. 3329–3341. DOI: 10.1016/j.enpol.2010.02.004.
55
Koch, Nicolas; Fuss, Sabine; Grosjean, Godefroy; Edenhofer, Ottmar (2014): Causes of the EU
ETS price drop: Recession, CDM, renewable policies or a bit of everything?—New evidence. In
Energy Policy 73, pp. 676–685. DOI: 10.1016/j.enpol.2014.06.024.
Kuik, Onno; Hofkes, Marjan (2010): Border adjustment for European emissions trading:
Competitiveness and carbon leakage. In Energy Policy 38 (4), pp. 1741–1748. DOI:
10.1016/j.enpol.2009.11.048.
Lecourt, S.; Palliere, C.; Sartor, O. (2013): Free allocations in EU ETS Phase 3: The impact of
emissionsperformance benchmarking for carbon-intensive industry. CDC Climat, checked on
11/14/2014.
Löfgren, Åsa; Wråke, Markus; Hagberg, Tomas; Roth, Susanna (2013): The Effect of EU-ETS on
Swedish Industry’s Investment in Carbon Mitigating Technologies, checked on 10/30/2014.
Mansanet-Bataller, Maria; Chevallier, Julien (2010): The EUA-sCER Spread: Compliance
Strategies and Arbitrage in the European Carbon Market, checked on 11/16/2014.
Martin, Ralf; Muuls, Mirabelle; Wagner, Ulrich (2011): Climate Change, Investment and Carbon
Markets and Prices – Evidence from Manager Interviews, checked on 11/17/2014.
Martin, Ralf; Muuls, Mirabelle; Wagner, Ulrich; de Preux, Laure B. (2012): Industry compensation
under relocation risk: a firm-level analysis of the EU Emissions Trading Scheme, checked on
11/17/2014.
Martin, Ralf; Muûls, Mirabelle; de Preux, Laure B.; Wagner, Ulrich J. (2014): On the empirical
content of carbon leakage criteria in the EU Emissions Trading Scheme. In Ecological Economics
105, pp. 78–88. DOI: 10.1016/j.ecolecon.2014.05.010.
Matthes, Felix (2010): Developing an ambitious climate policy mix, checked on 12/18/2014.
Matthes, Felix; Graichen, Verena; Repenning, Julia (2005): Structural aspects of allocation. WWF,
checked on 10/29/2014.
McGuinness, Meghan; Ellerman, Denny (2008): CO2 Abatement Evidence from the EU ETS Trial
Period. MIT, checked on 11/28/2014.
Oberndorfer; Ulrich; Alexeeva-Talebi, Victoria; Löschel, Andreas (2010): Understanding the
competitiveness implications of future phases of EU ETS on the industrial sectors. ZEW, checked
on 10/30/2014.
Okereke, Chukwumerije; McDaniels, Devin (2012): To what extent are EU steel companies
susceptible to competitive loss due to climate policy? In Energy Policy 46, pp. 203–215. DOI:
10.1016/j.enpol.2012.03.052.
Öko-Institut et al. (2014): Ex-post analysis of cost efficiency in the second trading period of the EU
ETS State of the art Methodologies, applications and lessons learned.
Peterson, Sonja (2006): Efficient Abatement in Separated Carbon Markets: A theoretical and
quantitative analysis of the EU Emissions Trading Scheme, checked on 12/18/2014.
Point Carbon (2008): EU ETS Phase II – The potential and scale of windfall profits in the power
sector. Point Carbon, checked on 10/30/2014.
Pollitt, Hector (2014): The Impact of Including the Road Transport Sector in the EU ETS.
Cambridge Econometrics, checked on 12/18/2014.
Ponssard, Jean-Pierre; Walker, Neil (2008): EU Emissions Trading and the cement sector: a
spatial competition analysis, checked on 11/17/2014.
56
Reinaud, Julia (2008): Issues behind Competitiveness and Carbon Leakage - Focus on Heavy
Industry, checked on 11/17/2014.
Rey, Luis; Markandya, Anil; Gonzáles-Egiuno, Mikel; Drummond, Paul (2013): Assessing
interaction between instruments and the ‘optimality’ of the current instrument mix. WP1 Deliverable
1.3. Edited by Basque Centre for Climate Change (BC3), University College London. Bilbao,
London. Available online at http://cecilia2050.eu/publications/171, checked on 8/29/2014.
Rickels, Wilfried (2010): Explaining European Emission Allowance Price Dynamics: Evidence from
Phase II, checked on 11/17/2014.
Sandoff, Anders; Schaad, Gabriela (2009): Does EU ETS lead to emission reductions through
trade? The case of the Swedish emissions trading sector participants. In Energy Policy 37 (10),
pp. 3967–3977. DOI: 10.1016/j.enpol.2009.04.043.
Sartor; Oliver (2012): Carbon Leakage in the Primary Aluminium Sector: What evidence after 6 ½
years of the EU ETS? CDC Climat Research, checked on 10/27/2014.
Sartor, Oliver (2011): Closing the door to fraud in the EU ETS. CDC Climat, checked on
10/31/2014.
Schumacher, Katja; Cludius, Johanna; Matthes, Felix (2012): Price Determinants of the European
Carbon Market and Interactions with Energy Markets. UBA, checked on 11/16/2014.
Sijm, J.; Hers, S.; Lise, W.; Wetzelaer, B. (2008): The impact of the EU ETS on electricity prices.
ECN, checked on 11/2/2014.
Solier, Boris; Jouvet, Pierre-Andre (2011): An overview of CO2 cost pass through to electricity
prices in Europe. CDC Climat, checked on 10/30/2014.
Taschini, Luca; Kollenberg, Sascha; Duffy, Chris (2014): System responsiveness and the
European Union Emission Trading System. Grantham Research Institute, checked on 10/29/2014.
Varma, Adarsh; Milnes, Rob; Miller, Karen; Williams, Evan; Bruyn, Sander de; Brinke, Linda
(2012): BIS cumulative impacts of energy and climate change policies on carbon leakage.
Department for Business, Innovation and Skills, checked on 11/30/2014.
Venmans, Frank (2012): A literature-based multi-criteria evaluation of the EU ETS. In Renewable
and Sustainable Energy Reviews 16 (8), pp. 5493–5510. DOI: 10.1016/j.rser.2012.05.036.
Verschuuren, Jonathan (2012): Report on the legal implementation of the EU ETS at Member
State level. Entracte, checked on 10/30/2014.
Vivid Economics, Ecofys (2014): Carbon Leakage Prospects Under Phase III EU ETS. Vivid
Economics, Ecofys, checked on 10/29/2014.
Weigt, Hannes; Ellerman, Denny; Delarue, Erik (2013): CO2 abatement from renewables in the
German electricity sector: Does a CO2 price help? In Energy Economics 40, pp. S149–S158. DOI:
10.1016/j.eneco.2013.09.013.
57
6.2. References (Gap Analysis)
Aatola, Piia (2013): Putting a Price on Carbon Econometric Essays on the European Union Emis-
sions Trading Scheme and its Impacts, checked on 11/16/2014.
Abrell, Jan; Ndoye Faye, Anta; Zachmann, Georg (2011): Assessing the Impact of the EU ETS
Using Firm Level Data. Bruegel/University of Strasbourg/University of Konstanz,, checked on
10/29/2014.
Acworth, William (2014): Can the Market Stability Reserve Stabilise the EU ETS: Commentators
Hedge Their Bets. Deutsches Institut für Wirtschaftsforschung, checked on 10/29/2014.
Aghion, Philippe (2009): No Green Growth without Innovation, checked on 11/28/2014.
Aghion, Philippe; Veugelers, Reinhilde; Serre, Clément (2009): Cold start for the green innovation
machine, checked on 11/17/2014.
Åhman, Markus (2007): EU Emissions Trading Scheme: contentious issues, checked on
11/16/2014.
Alberola, Emilie (2008): Price drivers and structural breaks in European carbon prices 2005–2007.
Alexeeva-Talebi, Victoria (2010): Cost Pass-Through in Strategic Oligopoly: Sectoral Evidence for
the EU ETS. ZEW, checked on 10/30/2014.
Alexeeva-Talebi, Victoria (2011): Cost pass-through of the EU emissions allowances: Examining
the European petroleum markets. In Energy Economics 33, pp. S75–S83. DOI:
10.1016/j.eneco.2011.07.029.
Anderson, Barry; Convery, Frank J.; Di Maria, Corrado (2011): Technological change and the EU
ETS: the case of Ireland. IEFE, checked on 11/16/2014.
Anderson, Barry; Di Maria, Corrado (2010): Abatement and Allocation in the Pilot Phase of the EU
ETS, checked on 12/6/2014.
Anger, Niels; Böhringer, Christoph; Oberndorfer, Ulrich (2008): Public Interest vs. Interest Groups:
Allowance Allocation in the EU Emissions Trading Scheme, checked on 11/16/2014.
Anger, Niels; Oberndorfer, Ulrich (2008): Firm performance and employment in the EU emissions
trading scheme: An empirical assessment for Germany. In Energy Policy 36 (1), pp. 12–22. DOI:
10.1016/j.enpol.2007.09.007.
Anja, Esch (2013): Using EU ETS Auctioning Revenues for Climate Action. Germanwatch,
checked on 10/29/2014.
Anna Widerberg, Markus Wråke (2009): The Impact of the EU Emissions Trading System on CO2
Intensity in Electricity Generation, checked on 11/16/2014.
Antón, Álvaro; Estrada, Iñaki (2009): La coordinación del régimen de comercio de derechos de
emisión y los impuestos autonómicos sobre emisiones atmosféricas: ¿un supuesto de ayuda de
estado ilegal no compatible? Instituto de Derecho y Ética Ambiental Universidad CEU Cardenal
Herrera, checked on 1/9/2015.

58
APX (2005): Evaluating the Performance of the EU ETS. APX, checked on 10/29/2014.
Arvanitakis, Andreas (2014): EU ETS: Is the Market Stability Reserve the right tool for remedying
oversupply?, checked on 11/14/2014.
Bailey, Ian; Gouldson, Andy; Newell, Peter (2010): Ecological modernisation and the governance
of carbon: a critical analysis. Centre for Climate Change Economics and Policy, checked on
10/31/2014.
Bajracharya, Pankaj; Cui, Ryna; Jennings, Whitney; Nichols, Stafford (2010): An Analysis of Trad-
ing Motivations in Phase II of the European Union Emissions Trading Scheme, checked on
10/31/2014.
Baojun, Tang; Cheng, Shen (2012): The Efficiency Analysis of the European CO2 Futures Market.
In Journal of Beijing Institute of Technology (Social Science Edition) 14 (1), checked on 1/9/2015.
Barker, Terry; Junankar, Sudhir; Pollitt, Hector; Summerton, Philip (2007): Carbon leakage from
unilateral Environmental Tax Reforms in Europe, 1995–2005.
Bataller, Maria Mansanet; Tornero, Ángel Pardo; Valor i Micó, Enric (2006): CO2 Prices, Energy
and Weather, checked on 11/17/2014.
Behn, Daniel (2009): Methods for Allocating Allowances under the EU Emissions Trading Scheme:
Assessing Their Interaction with EU State Aid Rules. University of Dundee, checked on
10/29/2014.
Bell, Mark (2008): Improving the EU emissions trading scheme. Centre Forum, checked on
10/31/2014.
Bellassen, Par Valentin; Stephan, Nicolas; Leguet, Benoît (2012): Y aura t-il un prix de marché
pour les CER et ERU dans deux ans ?, checked on 1/7/2015.
Benjamin, Brun (2012): L’intégration du Mécanisme pour un Développement Propre dans le Sys-
tème Communautaire d’Echange de Quotas d’Emission entre prome, checked on 1/7/2015.
Benz, Eva; Trück, Stefan (2006): CO2 Emission Allowances Trading in Europe – Specifying a New
Class of Assets, checked on 11/17/2014.
Berghmans, Nicolas; Alberola, Emilie (2013): The power sector in phase 2 of the EU ETS: fewer
CO2 emissions but just as much coal. CDC Climat, checked on 11/16/2014.
Berghmans, Nicolas; Sartor, Oliver; Stephan, Nicolas (2013): Reforming the EU ETS: give it some
work! CDC Climat, checked on 10/31/2014.
Bernard, Alain; Vielle, Marc (2009): Assessment of European Union transition scenarios with a
special focus on the issue of carbon leakage. In Energy Economics 31, pp. S274–S284. DOI:
10.1016/j.eneco.2009.08.013.
Betz, Regina; Sato, Misato (2006): Emissions trading: lessons learnt from the 1st phase of the EU
ETS and prospects for the 2nd phase. In Climate Policy (6), pp. 351–359, checked on 10/29/2014.
Blanco, María Isabel; Rodrigues, Gloria (2008): Can the future EU ETS support wind energy in-
vestments? In Energy Policy 36, pp. 1509–1520, checked on 10/30/2014.

59
Bleischwitza, Raimund; Fuhrmann, Katrin; Huchler, Elias (2007): The Sustainability Impact of the
EU Emissions Trading System on the European Industry, checked on 11/16/2014.
Blyth, William; Bunn, Derek (2011): Coevolution of policy, market and technical price risks in the
EU ETS. In Energy Policy 39 (8), pp. 4578–4593. DOI: 10.1016/j.enpol.2011.04.061.
BMUB (2014): Vorschlag der KOM zur Einführung einer Marktstabilitätsreserve – Auswirkungen
der DEU-Position auf die Überschussentwicklung –, checked on 11/16/2014.
Boasson, Elin Lerum; Wettestad, Jørgen (2010): Understanding the Differing Governance of EU
Emissions Trading and Renewables: Feedback Mechanisms and Policy Entrepreneurs. The
Fridtjof Nansen Institute, checked on 10/31/2014.
Böhringer, Christoph; Einar Rosendahl, Knut (2009): Strategic partitioning of emission allowances
under the EU Emission Trading Scheme Resource and Energy Economics, checked on
11/13/2014.
Böhringer, Christoph; Hoffmann, Tim; Manrique-de-Lara-Peñate, Casiano (2006a): The efficiency
costs of separating carbon markets under the EU emissions trading scheme: A quantitative as-
sessment for Germany. In Energy Economics 28 (1), pp. 44–61. DOI:
10.1016/j.eneco.2005.09.001.
Böhringer, Christoph; Koschel, Henrike; Moslener, Ulf (2006b): Efficiency Losses from Overlapping
Economic Instruments in European Carbon Emissions Regulation, checked on 11/16/2014.
Bonacina, M.; Cozialpi, S. (2009): Carbon allowances as inputs or financial assets: lesson learned
from the Pilot Phase of the EU-ETS, checked on 11/16/2014.
Bonenti, Francesca; Oggioni, Giorgia; Allevi, Elisabetta; Marangoni, Giacomo (2011): Evaluating
the impacts of the EU ETS on prices, investments and profits of the italian electricity market. Fon-
fazione Eni Enrico Mattei, checked on 10/30/2014.
Borghesi, Simone (2010): The European Emission Trading Scheme and Renewable Energy Poli-
cies: Credible Targets for Incredible Results. Fonfazione Eni Enrico Mattei, checked on
11/16/2014.
Borghesi, Simone (2012): Brown Sunsets and Green Dawns in the Industrial Sector:
Environmental Innovations, Firm Behaviour and the European Emission Trading, checked on
11/16/2014.
Borkent, Bram; Gilbert, Alyssa; Klaassen, Erik; Neelis, Maarten; Blok, Kornelis (2014): Dynamic
allocation for the EU Emissions Trading System. Ecofys, checked on 10/31/2014.
Braathen, Nils Axel (2011): Interactions between Emission Trading Systems and Other
Overlapping Policy Instruments. OECD, checked on 11/2/2014.
Braun, Nathan; Fritzgerald, Timothy; Pearcy, Jason (2014): Tradable Emissions Permits with Off-
sets, checked on 10/31/2014.
Brown, Lucas Merrill; Hanafi, Alex; Petsonk, Annie (2012): The EU Emissions Trading System Re-
sults and Lessons Learned. Environmental Defence Fund, checked on 11/1/2014.

60
Brunke, Jean-Christian; Blesl, Markus (2014): Energy conservation measures for the German ce-
ment industry and their ability to compensate for rising energy-related production costs. In Journal
of Cleaner Production 82, pp. 94–111. DOI: 10.1016/j.jclepro.2014.06.074.
Brunner, Steffen (2008): Emissions Trading Systems: an overview. Potsdam Institute for Climate
Impact Research, checked on 10/27/2014.
Bruyn de, Sander; Markowska, Agnieszka; Jong, Femke de; Bles, Mart (2010): Does the energy
intensive industry obtain windfall profits through the EU ETS? Delft, C. E., checked on 10/30/2014.
Bruyn de, Sander; Nelissen, Dagmar; Koopman, Marnix (2013): Carbon leakage and the future of
the EU ETS market. Impact of recent developments in carbon prices and design of EU ETS on the
list of sectors deemed to be exposed to carbon leakage. Delft, C. E., checked on 10/27/2014.
Bruyn de, Sander; Nelissen, Dagmar; Korteland, Marisa; Davidson, Marc; Faber, Jasper (2008):
Impacts on Competitiveness from EU ETS: An analysis of the Dutch industry. Delft, C. E., checked
on 10/30/2014.
Bundesumweltministerium (BMU): Veräußerung von Emissionsberechtigungen in Deutschland -
Jahresbericht 2009, checked on 11/16/2014.
Bunn, Derek; Fezzi, Carlo (2007): Interaction of European Carbon Trading and Energy Prices,
checked on 11/17/2014.
Bushnell, James B.; Chong, Howard; Mansur, Erin T. (2011): Profiting from Regulation: An Event
Study of the European Carbon Market, checked on 11/16/2014.
Calel, Raphael; Dechezlepretre, Antoine (2013): Environmental Policy and Directed Technological
Change: Evidence from the European carbon market, checked on 10/30/2014.
Cames, Martin; Matthes, Felix; Healy, Sean (2011): Functioning of the ETS and the Flexible Mech-
anisms. ENVI, checked on 11/14/2014.
Castagneto-Gissey, Giorgio (2014): How competitive are EU electricity markets? An assessment of
ETS Phase II. In Energy Policy 73, pp. 278–297. DOI: 10.1016/j.enpol.2014.06.015.
CEPS (2005): Business consequences of the EU Emissions Trading Scheme, checked on
11/2/2014.
CEPS (2012): Reviewing the EU ETS Review? Report of the CEPS Task Force on Does the ETS
market produce the right price signal? CEPS, checked on 10/29/2014.
CEPS (2013): Assessment of cumulative cost impact for the steel and the aluminium industry,
checked on 11/17/2014.
Chan, Hei Sing; Li, Shanjun; Zhang, Fan (2013): Firm competitiveness and the European Union
emissions trading scheme. In Energy Policy 63, pp. 1056–1064. DOI: 10.1016/j.enpol.2013.09.032.
Chappin, E.J.L.; Dijkema, G.P.J. (2009): On the impact of CO2 emission-trading on power genera-
tion emissions. In Technological Forecasting and Social Change 76 (3), pp. 358–370. DOI:
10.1016/j.techfore.2008.08.004.

61
Chevallier, Julien (2009): Carbon futures and macroeconomic risk factors: A view from the EU
ETS. In Energy Economics 31 (4), pp. 614–625. DOI: 10.1016/j.eneco.2009.02.008.
Chevallier, Julien (2010): The European carbon market (2005-2007): banking, pricing and risk-
hedging strategies, checked on 10/31/2014.
Chevallier, Julien; Le Pen, Yannick; Sévi, Benoît (2011): Options introduction and volatility in the
EU ETS. In Resource and Energy Economics 33 (4), pp. 855–880. DOI:
10.1016/j.reseneeco.2011.07.002.
Clarkson, Peter; Li, Yue; Pinnuck, Matthew; Richardson, Gordon (2014): The Valuation Relevance
of Greenhouse Gas Emissions under the European Union Carbon Emissions Trading Scheme.
European Accounting Review, checked on 10/29/2014.
Clò, Stefano (2008): Assessing the EU ETS effectiveness in reaching the Kyoto target: An Analysis
of the Cap Stringency. Rotterdam Institute of Law and Economics (RILE), checked on 10/29/2014.
Clò, Stefano (2010): Grandfathering, auctioning and Carbon Leakage: Assessing the inconsisten-
cies of the new ETS Directive. In Energy Policy 38 (5), pp. 2420–2430. DOI:
10.1016/j.enpol.2009.12.035.
Clò, Stefano; Battles, Susan; Zoppoli, Pietro (2013): Policy options to improve the effectiveness of
the EU emissions trading system: A multi-criteria analysis. In Energy Policy 57, pp. 477–490. DOI:
10.1016/j.enpol.2013.02.015.
Corporate Europe Observatory: EU ETS myth busting: Why it can’t be reformed and shouldn’t be
replicated. Corporate Europe Observatory, checked on 10/30/2014.
Cosmann, Nicole; Keith, Iain; Klunich, Kim; Mehlhoff, Eric; López-Acalá, Mario (2006): Sense and
Flexibility: Striking a Balance between Sovereignty and Harmonisation in the Implementation of the
EU ETS. Notre Europe,, checked on 10/31/2014.
Creti, Anna; Jouvet, Pierre-André, Mignon, Valérie (2011): Carbon Price Drivers: Phase I versus
Phase II Equilibrium?, checked on 11/17/2014.
Crossland, Jarrod; Li, Bin; Roca, Eduardo (2013): Is the European Union Emissions Trading
Scheme (EU ETS) informationally efficient? Evidence from momentum-based trading strategies. In
Applied Energy 109, pp. 10–23. DOI: 10.1016/j.apenergy.2013.03.079.
Cummins, Mark (2012): EU ETS Market Interactions: A Multiple Hypothesis Testing Approach,
checked on 11/2/2014.
Curtin, Joseph; Capozza, Ivana (2012): Towards Consistent and Effective Carbon Pricing in Ger-
many?, checked on 11/17/2014.
Dagmar, Nelissen (2012): Costs and Benefits of Stopping the Clock. How Airlines Profit from
Changes in the EU ETS. Delft, C. E., checked on 11/2/2014.
Damien Demailly, Philippe Quirion (2006): CO2 abatement, competitiveness and leakage in the
European cement industry under the EU ETS: Grandfathering vs. output-based allocation. In Cli-
mate Policy 6 (1), pp. 93–113, checked on 10/30/2014.
62
Daskalakis, George (2013): On the efficiency of the European carbon market: New evidence from
Phase II. In Energy Policy 54, pp. 369–375. DOI: 10.1016/j.enpol.2012.11.055.
DECC (2014a): UK Vision for Phase IV of the EU ETS. DECC, checked on 10/29/2014.
DECC (2014b): UK’s position on the European Commission’s proposal to reform the EU ETS by
introducing a Market Stability Reserve, checked on 11/16/2014.
Dechezleprêtre, Antoine (2012): Report on the empirical assessment of monitoring and enforce-
ment of EU ETS regulation. Entracte, checked on 10/31/2014.
Dechezleprêtre, Antoine; Gennaioli, Caterina; Martin, Ralf; Muûls, Mirabelle (2014): Searching for
carbon leaks in multinational companies. Grantham Research Institute, checked on 11/2/2014.
Declercq, Bruno; Delarue; Erik; D’haeseleer; William (2010): Impact Of The Economic Recession
On The European Power Sector’s CO2 Emissions, checked on 11/17/2014.
Demailly, Damien; Quirion, Philippe (2008): Changing the Allocation Rules in the EU ETS: Impact
on Competitiveness and Economic Efficiency, checked on 11/16/2014.
Denny Ellerman, Claudio Marcantonini and Aleksandar Zaklan (2014): The EU ETS: Eight Years
and Counting, checked on 11/17/2014.
Desai, Zuheir; Alberola, Emilie; Berghmans, Nicolas (2014): Introducing short term flexibility in the
EU ETS to assure its long term credibility: A multi-criteria analysis of policy options. CDC Climat,
checked on 11/14/2014.
Deutsche Emissionshandelsstelle (DEHSt) im Umweltbundesamt (2013): Reforming the EU ETS
with regard to the EU´s medium- and long-term climate targets, checked on 11/17/2014.
Diaz-Rainey, Ivan; Finegan, Andrea; Ibikunle, Gbenga; Tulloch, Daniel J. (2012): Institutional In-
vestment in the EU ETS. Tyndall Centre, checked on 10/29/2014.
Drew, Andrés J. (2010): New rules, new politics, same actors – explaining policy change in the EU
ETS, checked on 10/31/2014.
Drew, Andrés Jonathan (2009): Government Failure and the EU ETS: What prospects for phase 3,
checked on 10/29/2014.
Dröge, Susanne (2013): Carbon pricing and its future role for energy-intensive industries, checked
on 11/17/2014.
Dröge, Susanne; Cooper, Simone (2010): Tackling leakage in a world of unequal carbon prices.
Climate Strategies, checked on 10/27/2014.
Ecorys (2013): Carbon Leakage Evidence Project. Ecorys, checked on 10/27/2014.
EEA (2014): Why did greenhouse gas emissions decrease in the EU between 1990 and 2012?,
checked on 11/17/2014.
Egenhofer, Christian (2007): The Making of the EU Emissions Trading Scheme. In European Man-
agement Journal 25 (6), pp. 453–463. DOI: 10.1016/j.emj.2007.07.004.

63
Egenhofer, Christian; Alessi, Monica; Georgiev, Anton; Fujiwara, Noriko (2011): The EU Emissions
Trading System and Climate Policy towards 2050. Real incentives to reduce emissions and drive
innovation? Centre for European Policy Studies (CEPS), checked on 10/29/2014.
Ellerman, Denny; Buchner, Barbara (2006): Over-allocation or abatement? A preliminary analysis
of the EU ETS based on the 2005 emissions data, checked on 11/16/2014.
Ellerman, Denny; Joskow, Paul (2008): The European Union’s Emissions Trading System in per-
spective. Pew Center, checked on 11/16/2014.
Ellerman, Denny; Trotignon, Raphael (2012): Cross Border Trading and Borrowing in the EU ETS,
checked on 11/16/2014.
Elsworth, Rob; Worthington, Bryony; Morris, Damien (2012): Help or Hindrance? Offsetting in the
EU ETS. Sandbag, checked on 11/14/2014.
Euro-Case (2014): Euro-CASE policy paper ETS reform. Euro-Case, checked on 10/30/2014.
F. Convery, D. Ellerman, C. De Perthuis (2008): The European Carbon Market in Action: Lessons
from the First Trading Period (Interim Report), checked on 11/16/2014.
Fabra, Natalia; Reguant, Mar (2013): Pass-Through of Emissions Costs in Electricity Markets,
checked on 11/2/2014.
Fagiani, Riccardo; Richstein, Jörn C.; Hakvoort, Rudi; Vries, Laurens de (2014): The dynamic im-
pact of carbon reduction and renewable support policies on the electricity sector. In Utilities Policy
28, pp. 28–41. DOI: 10.1016/j.jup.2013.11.004.
Fankhauser, Samuel; Hepburn, Cameron; Park, Jisung (2011): Combining multiple climate policy
instruments: how not to do it, checked on 11/17/2014.
Faure, Corinne; Hildebrandt, Arne; Rogge, Karoline; Schleich, Joachim (2005): Reputational
impact of businesses' compliance strategies under the EU emissions trading scheme, checked on
10/29/2014.
Feilhauer, Stephan; Ellerman, Denny (2008): A Top-down and Bottom-up look at Emissions
Abatement in Germany in response to the EU ETS, checked on 11/16/2014.
Fell, Harrison (2008): EU-ETS and Nordic Electricity: A CVAR Approach, checked on 10/30/2014.
Fell, Harrison; Hintermann, Beat; Vollebergh, Herman (2013): Carbon content of electricity futures
in Phase II of the EU ETS, checked on 10/30/2014.
Fortum (2013): Emission Allowance Supply Management in the EU ETS. Fortum, checked on
10/31/2014.
Foucherot, Claudine; Bellassen, Valentin (2014): Agriculture et changement climatique: Protocole
de Kyoto et marché carbone européen. Centre d’etudes et de prospective, checked on 1/9/2015.
Frasch, Frieder (2007): Transaction Costs of the EU Emissions Trading Scheme in German Com-
panies. In Sustainable Energy 7 (3), checked on 10/31/2014.

64
Frédéric Branger, Philippe Quirion, Julien Chevallier (2013): Carbon leakage and competitiveness
of cement and steel industries under the EU ETS: much ado about nothing, checked on
11/17/2014.
Frontier Economics (2006a): CO2 trading and its influence on electricity markets, checked on
11/17/2014.
Frontier Economics (2006b): Economic consideration of extending the EU ETS to include aviation.
Frontier Economics, checked on 10/29/2014.
Gasbarro, Federica; Rizzi, Francesco; Frey, Marco (2013): The mutual influence of Environmental
Management Systems and the EU ETS: Findings for the Italian pulp and paper industry. In Euro-
pean Management Journal 31 (1), pp. 16–26. DOI: 10.1016/j.emj.2012.10.003.
Gawel, Erik; Strunz, Sebastian; Lehmann, Paul (2014): A public choice view on the climate and
energy policy mix in the EU — How do the emissions trading scheme and support for renewable
energies interact? In Energy Policy 64, pp. 175–182. DOI: 10.1016/j.enpol.2013.09.008.
Gawlikowska-Fyk, Aleksandra (2013): Attempts to Reform the EU Emissions Trading System.
PISM, checked on 11/16/2014.
Gloaguen, Olivier; Alberola, Emilie (2013): Assessing the factors behing CO2 emissions changes
over the phases 1 annd 2 of the EU ETS: an econometric analysis. CDC Climat Research,
checked on 11/28/2014.
González-Eguino, Mikel (2009): Market Instruments and CO2 Mitigation: A General Equilibrium
Analysis for Spain, checked on 11/16/2014.
González-Eguino, Mikel; Galarrage, Ibon; Ansuategi, Alberto (2010): Carbon leakage and the
future of Old Industrial Regions after Copenhagen, checked on 11/16/2014.
Graichen, Verena; Schumacher, Katja; Matthes, Felix (2008): Impacts of the EU Emissions Trading
Scheme on the industrial competitiveness in Germany. In Climate Change, checked on
10/30/2014.
Grosjean, Godefroy; Acworth, William; Flachsland, Christian; Marschinski, Robert (2014): After
Monetary Policy, Climate Policy: Is Delegation the Key to EU ETS Reform? Mercator Research
Institute, checked on 10/29/2014.
Grubb, Michael (2009): Climate Policy and Industrial Competitiveness: Ten Insights from Europe
on the EU Emissions Trading System, checked on 11/16/2014.
Grubb, Michael (2012): Strengthening the EU ETS: Creating a stable platform for EU energy sector
investment, checked on 10/30/2014.
Grubb, Michael; Laing, Tim; Sato, Misato; Comberti, Claudia (2012): Analyses of the effectiveness
of trading in EU-ETS. Climate Strategies, checked on 10/29/2014.
Grubb, Michael; Neuhoff, Karsten (2006): Allocation and competitiveness in the EU emissions trad-
ing scheme: policy overview. In Climate Policy (6), pp. 7–30, checked on 10/30/2014.

65
Gulbrandsen, Lars H.; Stenqvist, Christian (2013): The limited effect of EU emissions trading on
corporate climate strategies: Comparison of a Swedish and a Norwegian pulp and paper company.
In Energy Policy 56, pp. 516–525. DOI: 10.1016/j.enpol.2013.01.014.
Heindl, Peter (2012): Transaction Costs and Tradable Permits: Empirical Evidence from the EU
Emissions Trading Scheme. ZEW, checked on 10/29/2014.
Hepburn, Cameron; Grubb, Michael; Neuhoff, Karsten; Matthes, Felix; Tse, Maximilien (2006):
Auctioning of EU ETS Phase II Allowances: how and why?, checked on 10/31/2014.
Hermann, Hauke; Graichen, Verena; Matthes, Felix (2010): Free allocation of emission allowances
and CDM/JI credits within the EU ETS Analysis of selected industries and companies in Germany,
checked on 11/17/2014.
Hermann, Hauke; Matthes, Felix (2012): Strengthening the European Union Emissions Trading
Scheme by Raising Climate Ambition. Facts, Measures and Implications, checked on 11/17/2014.
Hervé-Mignucci, Morgan (2011): Operating and financial investments by European utilities over
2004-2009: what role for European mitigation policies?, checked on 11/16/2014.
Hintermann, Beat (2009): Allowance Price Drivers in the First Phase of the EU ETS. CCPC,
checked on 11/17/2014.
Hourcade, Jean; Demailly, Damien; Neuhoff, Karsten; Sato, Misato (2007): Differentiation and Dy-
namics of EU ETS Industrial Competitiveness Impacts. Climate Strategies, checked on
10/30/2014.
Hu, Jing; Crijns-Graus, Wina; Lam, Long; Gilbert, Alyssa (2014): Ex-ante evaluation of EU ETS
during 2013–2030: EU-internal abatement. In Energy Policy. DOI: 10.1016/j.enpol.2014.11.023.
Hui, Zhou; Ji-chuan; Sheng (2014): Has EU-ETS Caused Carbon Leakage in the EU Carbon-
Intensive Industries 24 (1), checked on 1/9/2015.
Huizhen; Chen (2013): Target Setting_Lessons from the EU ETS and Their Apocalypse for China.
In Journal of Jiangsu University(Social Science Edition) 15 (4), checked on 1/9/2015.
Huth, Martin (2010): Variations of Corporate Behavior in an Emerging Emissions Market: The Case
of the EU ETS, checked on 10/31/2014.
Ibikunle, Gbenga; Gregoriou, Andros; Hoepner, Andreas G. F.; Rhodes, Mark (2012a): Liquidity
and Market efficiency: European Evidence from the World’s Largest Carbon Exchange, checked
on 10/31/2014.
Ibikunle, Gbenga; Gregoriou, Andros; Pandit, Naresh R. (2012b): Price Discovery and Trading
after Hours: New Evidence from the World’s Largest Carbon Exchange, checked on 11/17/2014.
IDDRI (2014): Getting out of the perfect storm: towards coherence between electricity market poli-
cies and EU climate and energy goals, checked on 11/2/2014.
Ikkatai, Seiji; Hori, Katsuhiko; Kurita, Ikuma (2011): The impact of the European Union Emissions
Trading Scheme on the Polish Economy: Interviews with Four Companies in Poland, checked on
11/17/2014.

66
Ikkatai, Seiji; Ishikawa, Daiske; Sasaki, Kengo (2008): Effect of the European Union Emission
Trading Scheme (EU ETS) on companies:, checked on 11/17/2014.
Inkinen, Ville (2013): Application of Sustainability Criteria in the EU ETS, checked on 11/16/2014.
Institutional Investors Group on Climate Change (2010): Shifting Private Captial to Low Carbon
Investment. Institutional Investors Group on Climate Change, checked on 10/30/2014.
Jaraite, Jurate; Convery, Frank J.; Di Maria, Corrado (2009): Transaction costs of firms in the EU
ETS. Irish Economic Association, checked on 10/31/2014.
Jaraitė, Jūrate; Kažukauskas, Andrius (2012:): Firm Trading Behaviour and Transaction Costs in
the European Union’s Emission Trading System: An Empirical Assessment. Centre for Environ-
mental and Resource Economics, checked on 10/31/2014.
Jaraitė, Jūratė; Di Maria, Corrado (2012): Efficiency, productivity and environmental policy: A case
study of power generation in the EU. In Energy Economics 34 (5), pp. 1557–1568. DOI:
10.1016/j.eneco.2011.11.017.
Jochen Diekmann, DIW Berlin (2012): EU Emissions Trading: The Need for Cap Adjustment in
Response to External Shocks and Unexpected Developments?, checked on 11/16/2014.
Jong, Thijs; Couwenberg, Oscar; Woerdman, Edwin (2014): Does EU emissions trading bite? An
event study. In Energy Policy 69, pp. 510–519. DOI: 10.1016/j.enpol.2014.03.007.
Jouvet, Pierre-André; Solier, Boris (2013): An overview of CO2 cost pass-through to electricity
prices in Europe. In Energy Policy 61, pp. 1370–1376, checked on 11/13/2014.
Kenber, Mark; Haugen, Oliver; Cobb, Madeleine (2009): The Effects of EU Climate Legislation on
Business Competitiveness. The Climate Group, checked on 10/30/2014.
Keppler, Jan Horst; Cruciani, Michel (2010): Rents in the European power sector due to carbon
trading. In Energy Policy 38 (8), pp. 4280–4290. DOI: 10.1016/j.enpol.2010.03.057.
Keppler, Jan Horst; Mansanet-Bataller, Maria (2010): Causalities between CO2, electricity, and
other energy variables during phase I and phase II of the EU ETS. In Energy Policy 38 (7), pp.
3329–3341. DOI: 10.1016/j.enpol.2010.02.004.
Kettner, Claudia; Kletzan-Slamanig, Daniela; Köppl, Angela (2011): The EU Emission Trading
Scheme Allocation Patterns and Trading Flows, checked on 11/17/2014.
Kettner, Claudia; Köppl, Angela; SCHLEICHER, STEFAN P.; THENIUS, GREGOR (2008): Strin-
gency and distribution in the EU Emissions Trading Scheme: first evidence. In Climate Policy 8 (1),
pp. 41–61. DOI: 10.3763/cpol.2007.0394.
Kierkegaard, Daniel; Klinton, Andreas; Moberg, Jesper (2009): Carbon emission costs in capital
budgeting - the effect of the EU ETS on Swedish companies, checked on 11/17/2014.
Knopf et al (2014): The European Emissions Trading System (EU ETS): Ex-Post Analysis, the
Market Stability Reserve and Options for a Comprehensive Reform, checked on 11/16/2014.
Koch, Nicolas (2011): Co-movements between carbon, energy and financial markets, checked on
11/17/2014.

67
Koch, Nicolas; Bassen, Alexander (2013): Valuing the carbon exposure of European utilities. The
role of fuel mix, permit allocation and replacement investments. In Energy Economics 36, pp. 431–
443. DOI: 10.1016/j.eneco.2012.09.019.
Koch, Nicolas; Fuss, Sabine; Grosjean, Godefroy; Edenhofer, Ottmar (2014): Causes of the EU
ETS price drop: Recession, CDM, renewable policies or a bit of everything?—New evidence. In
Energy Policy 73, pp. 676–685. DOI: 10.1016/j.enpol.2014.06.024.
Kuik, Onno; Hofkes, Marjan (2010): Border adjustment for European emissions trading: Competi-
tiveness and carbon leakage. In Energy Policy 38 (4), pp. 1741–1748. DOI:
10.1016/j.enpol.2009.11.048.
LaBelle, Michael (2012): Constructing post-carbon institutions: Assessing EU carbon reduction
efforts through an institutional risk governance approach. In Energy Policy 40, pp. 390–403. DOI:
10.1016/j.enpol.2011.10.024.
Laing, Tim; Sato, Misato; Grubb, Michael; Comberti, Claudia (2013): Assessing the effectiveness
of the EU Emissions Trading System. Grantham Research Institute, checked on 10/29/2014.
Lars Zetterberg (2014): Benchmarking in the European Union Emissions Trading System: Abate-
ment incentives.
Laurikka, Harri; Koljonen, Tiina (2006): Emissions trading and investment decisions in the power
sector—a case study in Finland. In Energy Policy 34 (9), pp. 1063–1074. DOI:
10.1016/j.enpol.2004.09.004.
Le Cercle de l’Industrie (2009): Eléments de réflexion sur la définition d’un système d’enchères
pour le marché européen du carbone, checked on 1/7/2015.
Lecourt, S.; Palliere, C.; Sartor, O. (2013): Free allocations in EU ETS Phase 3: The impact of
emissionsperformance benchmarking for carbon-intensive industry. CDC Climat, checked on
11/14/2014.
Levy, Camille (2005): Impact of Emission Trading on Power Prices A Case Study from the Europe-
an Emission Trading Scheme, checked on 11/17/2014.
Lise, W.; Sijm, J.; Hobbs, B. F. (2010): The impact of the EU ETS on electricity prices: simulation
results with the COMPETES model, checked on 11/17/2014.
Löfgren, Åsa; Wråke, Markus; Hagberg, Tomas; Roth, Susanna (2013): The Effect of EU-ETS on
Swedish Industry’s Investment in Carbon Mitigating Technologies, checked on 10/30/2014.
Manders, Tom; Veenendaal, Paul (2008): Border tax adjustments and the EU-ETS. Netherlands
Environmental Assessment Agency, checked on 10/27/2014.
Mansanet-Bataller, Maria; Chevallier, Julien (2010): The EUA-sCER Spread: Compliance Strate-
gies and Arbitrage in the European Carbon Market, checked on 11/16/2014.
Marcu, Andrei; Egenhofer, Christian; Roth, Susanna; Stoefs, Wijnand (2013): Carbon Leakage: An
overview. CEPS, checked on 10/27/2014.

68
Martin, Ralf; Muuls, Mirabelle; Wagner, Ulrich (2011): Climate Change, Investment and Carbon
Markets and Prices – Evidence from Manager Interviews, checked on 11/17/2014.
Martin, Ralf; Muuls, Mirabelle; Wagner, Ulrich (July 10th, 2012): An Evidence Review of the EU
Emissions Trading System, Focussing on Effectiveness of the System in Driving Industrial Abate-
ment. DECC, checked on 10/29/2014.
Martin, Ralf; Muuls, Mirabelle; Wagner, Ulrich; de Preux, Laure B. (2012): Industry compensation
under relocation risk: a firm-level analysis of the EU Emissions Trading Scheme, checked on
11/17/2014.
Martin, Ralf; Muûls, Mirabelle; de Preux, Laure B.; Wagner, Ulrich J. (2014a): On the empirical
content of carbon leakage criteria in the EU Emissions Trading Scheme. In Ecological Economics
105, pp. 78–88. DOI: 10.1016/j.ecolecon.2014.05.010.
Martin, Ralf; Muûls, Mirabelle; Wagner, Ulrich J. (2014b): Trading Behavior in the EU Emissions
Trading Scheme, checked on 10/31/2014.
Matthes, Felix; Graichen, Verena; Repenning, Julia (2005): Structural aspects of allocation. WWF,
checked on 10/29/2014.
Mazzanti, Massimiliano; Costantini, Valeria (2010): ON THE GREEN SIDE OF TRADE COMPETI-
TIVENESS?, checked on 11/16/2014.
McGuinness, Meghan; Ellerman, Denny (2008): CO2 Abatement Evidence from the EU ETS Trial
Period. MIT, checked on 11/28/2014.
McKinsey & Company, Ecofys (2005): Review of the EU Emissions Trading Scheme. Survey
Highlights. McKinsey & Company, Ecofys, checked on 10/31/2014.
McKinsey & Company, Ecofys (2006): EU ETS Review: Report on International Competitiveness.
McKinsey & Company, Ecofys, checked on 10/30/2014.
Meleo, Linda (2014): On the determinants of industrial competitiveness: The European Union
emission trading scheme and the Italian paper industry. In Energy Policy 74, pp. 535–546. DOI:
10.1016/j.enpol.2014.06.030.
Meunier, Guy; Ponssard, Jean-Pierre; Quirion, Philippe (2014): Carbon leakage and capacity-
based allocations: Is the EU right? In Journal of Environmental Economics and Management 68
(2), pp. 262–279. DOI: 10.1016/j.jeem.2014.07.002.
Mirzha de Manuel, A. (2011): Market Efficiency in the EU Emissions Trading Scheme. An outlook
for the third trading period, checked on 10/30/2014.
Monjon, Stéphanie; Quirion, Philippe (2010): How to design a border adjustment for the European
Union Emissions Trading System? In Energy Policy 38 (9), pp. 5199–5207. DOI:
10.1016/j.enpol.2010.05.005.
Monjon, Stéphanie; Quirion, Philippe (2011): Addressing leakage in the EU ETS: Border
adjustment or output-based allocation? In Ecological Economics 70 (11), pp. 1957–1971. DOI:
10.1016/j.ecolecon.2011.04.020.
69
Montagnoli, Alberto; de Vries, Frans P. (2010): Carbon trading thickness and market efficiency. In
Energy Economics 32 (6), pp. 1331–1336. DOI: 10.1016/j.eneco.2010.04.001.
Moore, Simon (2013): If the Cap Fits. Reform of European Climate Policy and the EU Emissions
Trading System. Policy Exchange, checked on 10/29/2014.
Morris, Damien (2013): Drifting Towards Disaster. The ETS adrift in Europe’s climate efforts.
Sandbag, checked on 10/29/2014.
Morris, Damien (2014): Slaying the dragon. Sandbag, checked on 10/30/2014.
Myllyvirta, Lauri (2010): Preventing Carbon Leakage With Consumption-Based Policies?, checked
on 11/16/2014.
Neuhoff, Karsten (2008): How to price carbon for climate policy, checked on 11/28/2014.
Neuhoff, Karsten; Acworth, William; Ancygier, Andrzej (2014): Carbon Control and Competitive-
ness Post 2020: The Steel Report. Climate Strategies, checked on 10/30/2014.
Neuhoff, Karsten et al (2014): Carbon Control and Competitiveness Post 2020: The Cement Re-
port. Climate Strategies, checked on 10/29/2014.
Nilsson, Måns; Strambo, Claudia; Månsson, André (2014): A qualitative look at the coherence be-
tween EU energy security and climate change policies, checked on 11/2/2014.
Oberndorfer; Ulrich; Alexeeva-Talebi, Victoria; Löschel, Andreas (2010): Understanding the com-
petitiveness implications of future phases of EU ETS on the industrial sectors. ZEW, checked on
10/30/2014.
Oberndorfer, Ulrich; Rennings, Klaus; Sahin, Bedia (2006): The Impacts of the European
Emissions Trading Scheme on Competitiveness and Employment in Europe - a Literature Review.
ZEW, checked on 10/29/2014.
Oggioni, Giorgia; Smeers, Yves (2012): Evaluating the application of different pricing regimes and
low carbon investments in the European electricity market. In Energy Economics 34 (5), pp. 1356–
1369. DOI: 10.1016/j.eneco.2012.06.012.
Okereke, Chukwumerije; McDaniels, Devin (2012): To what extent are EU steel companies sus-
ceptible to competitive loss due to climate policy? In Energy Policy 46, pp. 203–215. DOI:
10.1016/j.enpol.2012.03.052.
Okullo, Samuel J. (2012): Report on market concentration and transferable quotas. Entracte,
checked on 10/31/2014.
Parker, Larry (2010): Climate Change and the EU Emissions Trading Scheme (ETS): Looking to
2020. Congressional Research Service, checked on 10/30/2014.
Pearson, Anna; Worthington, Bryony (2009): ETS S.O.S. Why the flagship 'EU Emissions Trading
Policy' needs rescuing, checked on 10/30/2014.
Perthuis, Christian de; Trotignon, Raphael (2013): Governance of CO2 markets: Lessons from the
EU ETS. CDC Climat, checked on 10/30/2014.

70
Petrick, Sebastian; Wagner, Ulrich (2014): The Impact of Carbon Trading on Industry: Evidence
from German Manufacturing Firms, checked on 11/17/2014.
Point Carbon (2008): EU ETS Phase II – The potential and scale of windfall profits in the power
sector. Point Carbon, checked on 10/30/2014.
Ponssard, Jean-Pierre; Walker, Neil (2008): EU Emissions Trading and the cement sector: a
spatial competition analysis, checked on 11/17/2014.
Pontoglio, Serena (2008): The role of environmental policies in the eco-innovation process: evi-
dences from the European Union Emission Trading Scheme, checked on 11/17/2014.
Qiao-ping, Nie; Fang, Xiang (2014): Study of EU ETS from the Perspective of Market Efficiency_
based on Granger Causality Test of EUA and CER. In Journal of Tianjin University of Commerce
34 (2), checked on 1/9/2015.
Rathmann, M. (2007): Do support systems for RES-E reduce EU-ETS-driven electricity prices? In
Energy Policy 35 (1), pp. 342–349. DOI: 10.1016/j.enpol.2005.11.029.
Reinaud, Julia (2008): Issues behind Competitiveness and Carbon Leakage - Focus on Heavy
Industry, checked on 11/17/2014.
Reinaud, Julia (2009): Trade, Competitiveness and Carbon Leakage: Challenges and
Opportunities, checked on 11/17/2014.
Rey, Luis (2013): Assessing interaction between instruments and the ‘optimality’ of the current in-
strument mix, checked on 11/2/2014.
Richstein, Jörn C.; Chappin, Emile J.L; Vries, Laurens de (2014): The Stability Reserve in EU Car-
bon Emission Trading: Does it Deliver What it Promises?, checked on 11/14/2014.
Rickels, Wilfried (2010): Explaining European Emission Allowance Price Dynamics: Evidence from
Phase II, checked on 11/17/2014.
Ritz; Robert A. (2009): Carbon leakage under incomplete environmental regu-lation: an industry-
level approach, checked on 11/17/2014.
Robinson, Hugo; O'Brien, Neil (2007): Europe’s dirty secret: Why the EU Emissions Trading
Scheme isn’t working. Open Europe, checked on 10/31/2014.
Rogge, Karoline; Hoffmann, Volker (2009): The Impact of the EU ETS on the sectoral innovation
systems for power generation technologies - Finds for Germany. Fraunhofer ISI, checked on
10/29/2014.
Rogge, Karoline; Hoffmann, Volker; Scheider, Malte (2010): The Innovation Impact of the EU
Emission Trading System: Findings of Company Case Studies in the German Power Sector,
checked on 11/17/2014.
Sander de Bruyn; Markowska, Agnieszka; Nelissen, Dagmar (2010): Will the energy-intensive in-
dustry profit from EU ETS under Phase 3?, checked on 11/17/2014.

71
Sandoff, Anders; Schaad, Gabriela (2009): Does EU ETS lead to emission reductions through
trade? The case of the Swedish emissions trading sector participants. In Energy Policy 37 (10), pp.
3967–3977. DOI: 10.1016/j.enpol.2009.04.043.
Santamaría, Alberto; Linares, Pedro; Pintos, Pablo (2014): The effects of carbon prices and anti-
leakage policies on selected industrial sectors in Spain – Cement, steel and oil refining. In Energy
Policy 65, pp. 708–717. DOI: 10.1016/j.enpol.2013.10.031.
Sartor; Oliver (2012): Carbon Leakage in the Primary Aluminium Sector: What evidence after 6 ½
years of the EU ETS? CDC Climat Research, checked on 10/27/2014.
Sartor, Oliver (2011): Closing the door to fraud in the EU ETS. CDC Climat, checked on
10/31/2014.
Sartor, Oliver (2012): The EU ETS carbon price: To intervene, or not to intervene? CDC Climat,
checked on 11/17/2014.
Sato, Misato; Grubb, Michael; Cust, Jim (2007): Differentiation and dynamics of competitiveness
impacts from the EU ETS, checked on 10/30/2014.
Schleich, Joachim; Cremer, Clemens (2007): Using benchmarking for the primary allocation of EU
allowances – An application to the German power sector, checked on 11/14/2014.
Schleich, Joachim; Rogge, Karoline; Betz, Regina (2008): Incentives for energy efficiency in the
EU Emissions Trading Scheme. Fraunhofer ISI, checked on 10/30/2014.
Schmidt, Tobias S.; Schneider, Malte; Rogge, Karoline S.; Schuetz, Martin J.A.; Hoffmann, Volker
H. (2012): The effects of climate policy on the rate and direction of innovation: A survey of the EU
ETS and the electricity sector. In Environmental Innovation and Societal Transitions 2, pp. 23–48.
DOI: 10.1016/j.eist.2011.12.002.
Schoenberg, Martin (2014): The threat of wasted capital - why ETS reform needs to come into ef-
fect in 2017. Think Thank, checked on 10/29/2014.
Schopp, Anne; Neuhoff, Karsten (2013): The Role of Hedging in Carbon Markets, checked on
11/17/2014.
Schulten, Marius (2012): European Emissions Trading and Carbon Leakage Assessing the Need
for Improvement in the ETS Directive, checked on 11/16/2014.
Schumacher, Katja; Cludius, Johanna; Matthes, Felix (2012): Price Determinants of the European
Carbon Market and Interactions with Energy Markets. UBA, checked on 11/16/2014.
Seifert, Jan; Uhrig-Homburg, Marliese; Wagner, Michael (2008): Dynamic behavior of CO2 spot
prices. In Journal of Environmental Economics and Management 56 (2), pp. 180–194. DOI:
10.1016/j.jeem.2008.03.003.
Seixas, Júlia; Simões, Sofia; Fortes, Patrícia; Cleto, João; Barroso, José Eduardo; Alves, Bernardo
et al. (2008): Avaliação do Impacto da Proposta Energia‐Clima da Comissão Europeia para Portu-
gal. Agência Portuguesa para o Ambiente, checked on 1/9/2015.

72
Shapiro; Robert (2007): Addressing the Risks of Climate Change: The Environmental
Effectiveness and Economic Efficiency of Emissions Caps and Tradable Permits, Compared to
Carbon Taxes, checked on 11/17/2014.
Sijm, J.; Bakker, S.J.A; Chen, Y.; Harmsen, H.W, Lise, W (2005): CO2 price dynamics: The impli-
cations of EU emissions trading for the price of electricity. ECN, checked on 11/17/2014.
Sijm, J. P. M.; Lise, W.; Hers, J.S (2008): The implications of free allocation versus auctioning of
EU ETS allowances for the power sector in the Netherlands, checked on 11/17/2014.
Sijm, J.P.M; Berk, M.M; den Elzen, M.G.J; van den Wijingaart, R.A. (2007): Options for post-2012
EU burden sharing and EU ETS allocation, checked on 11/16/2014.
Sijm, J.P.M; Boonekamp, P.G.M; Summerton, P.; Pollitt, H.; Billington, S. (2013): Investing EU
ETS auction revenues into energy savings, checked on 10/30/2014.
Sijm, J.P.M. (2008): The impact of the EU ETS on electricity prices. ECN, checked on 11/2/2014.
Sijm, Jos; Neuhoff, Karsten; Chen, Yihsu (2006): CO2 Cost Pass Through and Windfall Profits in
the Power Sector, checked on 10/30/2014.
Sijm, J.P.M et al (2013): Splitting the EU ETS: strengthening the scheme by differentiating its sec-
toral carbon prices, checked on 10/29/2014.
Sorrell, Steve; Harrison, David; Radov, Daniel; Klevnas, Per; Foss, Andrew (2009): White certifi-
cate schemes: Economic analysis and interactions with the EU ETS. In Energy Policy 37 (1), pp.
29–42. DOI: 10.1016/j.enpol.2008.08.009.
Stavins, Robert; Hahn, Robert (2010): The Effect of Allowance Allocations on Cap-and-Trade Sys-
tem Performance, checked on 11/17/2014.
Stone, Matt (2008): Bad Politics. Do renewable obligation targets undermine the European Union's
Emissions Trading Scheme. University of Dundee, checked on 10/29/2014.
Straw, Will; Platt, Reg; Aldridge, Jimmy; Cowdrey, Esther (2013): Up in Smoke. IPPR, checked on
10/30/2014.
Tang, Bao-jun; Shen, Cheng; Gao, Chao (2013): The efficiency analysis of the European CO2 fu-
tures market. In Applied Energy 112, pp. 1544–1547. DOI: 10.1016/j.apenergy.2013.02.017.
Taschini; Luca (2013): Options for structural measures to improve the European Union Emissions
Trading System: response to a European Commission consultation. Grantham Research Institute,
checked on 10/29/2014.
Taschini, Luca; Kollenberg, Sascha; Duffy, Chris (2014): System responsiveness and the
European Union Emission Trading System. Grantham Research Institute, checked on 10/29/2014.
Thema, Johannes; Suerkemper, Felix; Grave, Katharina; Amelung, Adrian (2013): The impact of
electricity demand reduction policies on the EU-ETS: Modelling electricity and carbon prices and
the effect on industrial competitiveness. In Energy Policy 60, pp. 656–666. DOI:
10.1016/j.enpol.2013.04.028.

73
Toivonen, Kaarina (2006): Informational efficiency of the European Union emission allowance mar-
ket, checked on 11/16/2014.
Trotignon, Raphael (2011): Combining cap-and-trade with offsets: Lessons from CER use in the
EU ETS in 2008 and 2009. CDC Climat, checked on 11/17/2014.
Trotignon, Raphael; Delbosc, Anais (2008): Allowance trading patterns during the eu ets trial
period: what does the CITL reveal?, checked on 11/16/2014.
Trotignon, Raphael; Gonand, Frédéric; Perthuis, Christian de (2014): EU ETS reform in the Cli-
mate-Energy Package 2030: First lessons from the ZEPHYR model. CDC Climat, checked on
11/14/2014.
Varma, Adarsh; Milnes, Rob; Miller, Karen; Williams, Evan; Bruyn, Sander de; Brinke, Linda
(2012): BIS cumulative impacts of energy and climate change policies on carbon leakage.
Department for Business, Innovation and Skills, checked on 11/30/2014.
Veith, Stefan; Werner, Jörg R.; Zimmermann, Jochen (2009): Capital market response to emission
rights returns: Evidence from the European power sector. In Energy Economics 31 (4), pp. 605–
613. DOI: 10.1016/j.eneco.2009.01.004.
Venmans, Frank (2012): A literature-based multi-criteria evaluation of the EU ETS. In Renewable
and Sustainable Energy Reviews 16 (8), pp. 5493–5510. DOI: 10.1016/j.rser.2012.05.036.
Verdonk, Martijn; Brink, Corjan; Vollebergh, Herman; Roelfsema, Mark (2013): Evaluation of policy
options to reform the EU Emissions Trading System. Effects on carbon price, emissions and the
economy. PBL, checked on 10/31/2014.
Verdonk, Martijn; Vollebergh, Herman (2012): Evaluation of the European Commission’s proposal
to set aside emission allowances. Effects on the EU carbon price and Dutch ETS companies,
checked on 11/16/2014.
Vicente Medina Martínez (2012): Is the EUA a new asset class. Final version Quantitative Finance,
checked on 11/17/2014.
Vivid Economics, Ecofys (2014): Carbon Leakage Prospects Under Phase III EU ETS. Vivid Eco-
nomics, Ecofys, checked on 10/29/2014.
Vondrušková, Barbora; Němcová, Ingeborg; Horák, Jiří (2010): Interaction of EU ETS allowances
and energy prices: Evidence from the Czech Republic, checked on 10/31/2014.
Walker, Neil (2006): CONCRETE EVIDENCE? An Empirical Approach to Quantify the Impact of
EU Emissions Trading on Cement Industry Competitiveness., checked on 11/17/2014.
Weber, Thomas A.; Neuhoff, Karsten (2010): Carbon markets and technological innovation. In
Journal of Environmental Economics and Management 60 (2), pp. 115–132. DOI:
10.1016/j.jeem.2010.04.004.
Weigt, Hannes; Ellerman, Denny; Delarue, Erik (2013): CO2 abatement from renewables in the
German electricity sector: Does a CO2 price help? In Energy Economics 40, pp. S149–S158. DOI:
10.1016/j.eneco.2013.09.013.

74
Weiquan, Liu; Jing, Zhao (2011): Empirical Research on Spillover Effect and Dynamic Correlation
between EU ETS Future Market. In Lanzhou Academic Journal, checked on 1/9/2015.
Wenjuan, Feng; Linjun, Li; Wenjiang, Li; Yekui, Yu; Guoyu, Qiu (2014): Dependency Structure
Between European Union Carbon Assets and Energy Assets. In Ecological Economy, checked on
1/9/2015.
Weishaar, Stefan (2007): The EU ETS: current problems and possible ways to move forward.
Maastricht University, checked on 10/29/2014.
Wettestad, Jørgen (2009): European Climate Policy: Toward Centralized Governance? In Review
of Policy Research, 26 (3), pp. 311–328, checked on 10/31/2014.
Wråke, Markus (2009): Emissions Trading: The Ugly Duckling in European Climate Policy?,
checked on 11/16/2014.
Xiaohui, Hai; Baochen, Yang (2014): The Dynamic Relationship Between the European Union’s
Emission Trading Scheme and Energy Market. In Resources Science 36 (7), checked on 1/8/2015.
Yu, Haishan (2013): The EU ETS and firm profits: an ex-post analysis for Swedish energy firms,
checked on 11/17/2014.
Yuejun, Zhang; Yiming, Wei (2010): Interpreting the Complex Impact of Fossil Fuel Markets on the
EU ETS Futures Markets: An Empirical Evidence. In Management Review 22 (06), checked on
1/9/2015.
Zachmann, Georg; Hirschhausen, Christian von (2007): First Evidence of Asymmetric Cost Pass-
through of EU Emissions Allowances: Examining Wholesale Electricity Prices in Germany. DIW,
checked on 11/17/2014.
Zetterberg, Lars; Engström, Daniel Stenson; Roth, Susanna (2014): EU ETS reform – Assessing
the Market Stability Reserve. FORES, IVL, checked on 10/31/2014.

75
7. Annex
7.1. Review Protocol
7.1.1. Overview
A lead reviewer will be assigned to oversee the process of searching for literature references within
a small team of experts, which will be formed before the establishment of a review protocol to allow
all members of the team to contribute to its’ development. All review team members will actively
contribute to the design of a review protocol, which will provide the reference point on how each
member of the team will conduct the search for literature references. The review protocol will
include the elements illustrated in Figure 7, which will be outlined in more detail in the following
sub-sections.
Figure 7 Stages of the review protocol
Source: Own illustration
7.1.2. Literature search
The approach for searching the literature is clearly outlined in the bullet points below so that it can
be easily replicated by all members of the review team. The search of the literature will focus on
the following sources as a priority:

76
Firstly searching a list of government websites for international countries with active GHG
emission trading schemes to review policy evaluations with relevance to the EU ETS;
Secondly searching a list of government websites for countries participating in the EU ETS
to review policy evaluations;
Thirdly to complement the information provided by Member States, databases will also be
searched (i.e. Science Direct), internet searches conducted and browsing the websites of
specific research institutes with emissions trading expertise using the following twenty
search terms (Table 11);
The literature search via the internet and science direct will be limited to publications from 2005
onwards that specifically refer to the trading periods of the EU ETS.
Table 11 Search terms for literature review
Source: Own illustration
7.1.3. Screening criteria
The logic underpinning the inclusion or exclusion of a particular study will be outlined in this section
of the review protocol. The evaluations will be based upon relevance and quality criteria that are
outlined below:
Relevance criteria
Analyses the extent to which the EU ETS meets the objectives of the policy intervention
Analyses the coherence of the EU ETS
Relevance EU ETS + relevance
EU ETS + objectives
Effectiveness EU ETS + effectiveness
EU ETS + GHG abatement
EU ETS + competitiveness
EU ETS + carbon leakage
EU ETS + cost pass through
EU ETS + low carbon technology
EU ETS + investments
Efficiency EU ETS + efficiency
EU ETS + governance
EU ETS + functioning
EU ETS + behaviour
EU ETS + transaction costs
EU ETS + benchmarking
EU ETS + MRV
EU ETS + MSR
EU ETS + flexible mechanisms
EU added value EU ETS + alternative measures
Coherence EU ETS + interaction

77
Analyses the interaction between the EU ETS and other EU policies
Analyses the impact of reforms to the EU ETS
Analyses the implementation of the EU ETS (i.e. transaction costs, price signal)
Analyses the governance of the EU ETS
Analyses the allocation of allowances in the EU ETS
Analyses the counterfactual situation (i.e. impacts with no EU ETS)
Analyses cost effectiveness of the EU ETS compared to alternative policy instruments
Analyses the impact of the EU ETS on GHG abatement
Analyses the impact of the EU ETS on competitiveness and carbon leakage
Analyses the extent to which the EU ETS has promoted low-carbon investments
Analyses the influence of EU ETS towards a transition to more sustainable systems
Relevant to elements of the EU ETS (if GHG emission trading scheme outside EU)
Quality criteria
Published primary research that is data / evidence driven
Transparent and robust methodology
Reflects different evaluations types
Academic papers
Discussion papers
Not opinion piece
7.1.4. Data extraction
Each member of the team will firstly input key information (i.e. title, author, date etc.) from the
studies reviewed into a data entry worksheet (Figure 8). Each reviewer will be required to
categorise each study according to which broad category, evaluation criteria and methodology are
most applicable. The following provides guidance on how to categorise the studies retained
following the screening process.
Broad category and evaluation criteria
When the methodology of an evaluation directly addresses a sub-field in the evaluation criteria it is
necessary to link to the relevant broad category. It is possible for one methodology to address
several of the evaluation sub-fields and alternatively it is possible for an evaluation to adopt several
methodologies. The link between broad category and evaluation criteria is illustrated in Figure 9
and is outlined in the following:

78
Objectives (relates to sub-fields under relevance)
Objectives vs needs: Evaluations directly assessing whether the objectives of the EU ETS
corresponds to the needs of the EU
Other: Evaluations directly assessing the relevance of the EU ETS in general
Interaction (relates to sub-fields under coherence)
Internal coherence: Evaluations directly assessing the coherence of the different design
elements of the EU ETS
External coherence: Evaluations directly assessing the coherence of the EU ETS with external
policies (i.e. Effort Sharing Directive, Renewable and Energy Efficiency Directives)
Other: Evaluations directly assessing other aspects of coherence
Governance (relates to sub-fields under EU added value)
Alternative policies: Evaluations directly assessing the impact of alternative policies to achieve
the objectives of the EU ETS (i.e. carbon taxes, emission standards)
Harmonisation: Evaluations directly assessing the impact of harmonising different design
elements of the EU ETS (i.e. registry, allocation rules etc.)
Market oversight: Evaluations directly assessing market oversight provisions under the EU
ETS.
Other: Evaluations directly assessing other aspects of EU added value
Functioning of the market (relates to sub-fields under efficiency)
Flexible Mechanisms: Evaluations directly assessing the use of flexible mechanisms to comply
with the EU ETS
Transaction / Admin costs: Evaluations directly assessing the transaction and administrative
costs associated with the EU ETS
Cap Setting: Evaluations directly assessing the impact of the cap on the efficiency of the EU
ETS
Allocation of allowances: Evaluations directly assessing the impact of the allocation method on
the functioning of the EU ETS (may relate to carbon leakage, cost pass through, windfall profits
etc.)
MRV: Evaluations directly assessing MRV provisions within the EU ETS
Price Signal: Evaluations directly assessing whether or not the price signal is driven by market
fundamentals or assesses future EUA prices

79
Cost Pass Through: Evaluations directly assessing whether carbon costs are passed through
to product prices
Windfall profits: Evaluations directly quantifying the profits that results from carbon cost pass
through
Structural reform: Evaluations directly assessing the impact of reform on the functioning of the
market
Other: Evaluations directly assessing other aspects of efficiency
Short term impacts (relates to sub-fields under effectiveness)
GHG abatement: Evaluations directly assessing whether GHG abatement has taken place as a
consequence of the EU ETS
Investment / Innovation: Evaluations directly assessing whether investment and innovation has
been promoted by the EU ETS
Competitiveness: Evaluations directly assessing whether competitiveness has been impacted
by the EU ETS
Carbon Leakage: Evaluations directly assessing whether carbon leakage has occurred from
the different channels of leakage
Other: Evaluations directly assessing other aspects of effectiveness
Long term impacts (relates to sub-fields under effectiveness)
GHG abatement: Evaluations directly assessing whether GHG abatement will take place as a
consequence of the EU ETS
Investment / Innovation: Evaluations directly assessing whether investment and innovation will
be promoted by the EU ETS
Competitiveness: Evaluations directly assessing whether competitiveness will be impacted by
the EU ETS
Carbon Leakage: Evaluations directly assessing whether carbon leakage will occur from the
different channels of leakage
Other: Evaluations directly assessing other aspects of effectiveness
Methodology:
The categorisation of methodologies are relatively self explanatory, however it is important to
categorise briefings as research papers without a transparent and robust methodology that only
present the arguments of the author. Data analysis refers to more simple calculations using large
data sets to respond to an evaluation question.
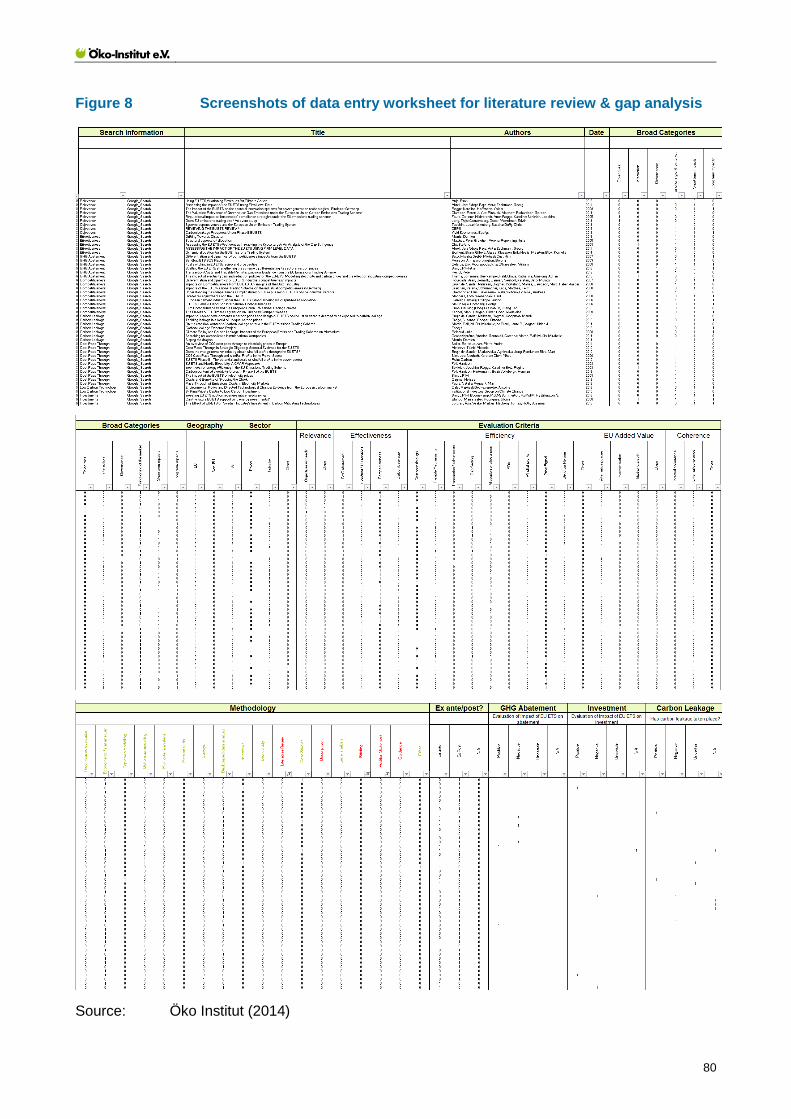
80
Figure 8 Screenshots of data entry worksheet for literature review & gap analysis
Source: Öko Institut (2014)

81
Figure 9 Guidance for categorising evaluations in the gap matrix table
Source: Own illustration
Broad Categories
Sectoral Scope All
Pow
er
Industr
y
Oth
er
All
Pow
er
Industr
y
Oth
er
All
Pow
er
Industr
y
Oth
er
All
Pow
er
Industr
y
Oth
er
All
Pow
er
Industr
y
Oth
er
All
Pow
er
Industr
y
Oth
er
Geographical Scope
EU
Non-EU
Evaluation Criteria
Relevance
Objectives vs needs
Other
Effectiveness
GHG abatement
Investment / innovation
Competitiveness
Carbon leakage
Other
Efficiency
Offsetting
Transaction / admin costs
Cap setting
Allocation of allowances
MRV
Price signal
Structual reform
Cost-pass through
Windfall profits
Other
EU Added Value
Alternative policies
Harmonisation
Market oversight
Other
Coherence
Internal coherence
External coherence
Other
Methodology
Theory based evaluation
Econometric /statistical analysis
Top down modelling
Bottom up modelling
Multi criteria analysis
Meta analysis
Surveys
Data analysis
Interviews
Event study
Case Studies
Other
Objectives Interaction GovernanceFunctioning
of market
Short term
impacts
Long term
impacts
Categorise evaluations according to sectoral and geographical scope
Categorise evaluations according to methodology applied
Relevance
Interactions
Short term
impacts
Long term
impacts
Functioning of
market
Governance