Review of Condensed-Phase Reaction Kinetics · Review of Condensed-Phase Reaction Kinetics ......
27
Review of Condensed-Phase Reaction Kinetics Drs. Stephen Niksa and Gui-su Liu Niksa Energy Associates, Belmont, CA Prof. Robert Hurt Div. Of Engineering, Brown University
Transcript of Review of Condensed-Phase Reaction Kinetics · Review of Condensed-Phase Reaction Kinetics ......

Review of Condensed-Phase Reaction Kinetics
Drs. Stephen Niksa and Gui-su LiuNiksa Energy Associates, Belmont, CA
Prof. Robert HurtDiv. Of Engineering, Brown University

There are Four Distinct Stages of Coal There are Four Distinct Stages of Coal Conversion ChemistryConversion Chemistry
Devolatilization- Source of all gaseous fuels and soot.- Determines char yield, size, structure, and initial reactivity.
Volatiles Conversion- Conversion of tars into soot- Major heat source.- Partial combustion of primary volatiles.- Major source of CO, H2, CO2, and H2O.- Shifting/reforming chemistry throughout.
Char/Soot Oxidation- Major heat source.- Determines residual char yield for gasification.- Some flyash production.
Char/Soot Gasification- Determines overall conversion.- Flyash production, via char particle fragmentation + ash agglomeration.

Forget “Understanding” and Focus On Accuracy in Applications
Fuel Science SHOULD specify all the rate parameters used in process simulations (CFD, AspenPlus, HySys, etc.)Simulation practitioners should NOThave to comb literature or resort to default values.

All Rate Parameters Should Be Assigned From Readily Available Fuel Property Input
No connections to testing.
Operating Conditions
Detailed Mechanism
FuelProperties
ParameterEstimation
DVol: AD, ED,V∞
ChOx: AC, EC, nCChGs: {AG,i, EG,i, nG,i}
Predicted Rates and Products
ProcessSimulator

• FLASHCHAIN® was recently validated against a database of 332 independent tests involving 99 coals and broad ranges of heatingrates, temperatures, and pressures to 16.7 MPa.• Predicts the complete distribution of all volatile products plus tar and char properties.• Proximate and ultimate analyses are the only sample-specific fuel properties.• Already used to predict the devolatilization behavior of over 2000 coals.• Versions available for any coal, biomass, pet coke, black liquor, and petroleum asphaltenes.
FLASHCHAIN® for Devolatilization

Accurate Predictions for Any Coal Type
65 70 75 80 85 90 95 1000
10
20
30
40
50
60
70
AVCO Bomb, 1.3 MPa
Wei
ght L
oss,
daf
wt.
%
Carbon Content, daf wt. %
Depicts the distinctive yields of individual samples of even the same coal rank.Based on only the proximate and ultimate analyses.

One Framework Covers All P.F.
Only coal exhibits a continuous rank dependence.Petroleum derivatives & biomass determine (H/C)MAX.Black liquor & biomass determine (O/C)MAX.
0.0 0.2 0.4 0.6 0.8 1.00.0
0.2
0.4
0.6
0.8
1.0
1.2
1.4
1.6
1.8
Pet Coke
Coal
BlackLiquor
Biomass
Petroleum Asphaltenes
H/C
O/C

Automatically Assign All Devolatilization Rate Parameters
500 750 1000 1250 1500 1750 20000
20
40
60
80
1,00010,000
100,000 K/s
1,000,000
Wei
ght L
oss,
daf
wt.
%
Temperature, K
0.6 0.8 1.0 1.2 1.40
1
2
3
4
1,000
10,000
100,000 C/s
1,000,000
LOG
10<K
>
1000/T
Even the SFOR can match the FC predictions for devolatilization during heatup.Assigned activation energies are constant over a broad range of heating rate.Assigned frequency factors expressed as a function of heating rate, along with ultimate yields.Rate laws can be specified for any product predicted by FC, including volatile-N.

The Carbon Burnout Kinetics Model/Extended Version (CBK/E) for Char Oxidation
CBK/E includes single-film char combustion, intraparticle reaction/diffusion, thermal annealing, and ash inhibition. Three-step intrinsic kinetics resolves the problems in the reaction order for conventional char oxidation kinetics.
1. C + O2 → 2C(O)2. C(O) + O2 → CO2 + C(O)3. C(O) → CO

No Systematic Discrepancies for Shock Tube or EFT Databases
0.0
0.2
0.4
0.6
0.8
1.0
1.2
1.4
1.6
1.8
2.0
0.0 0.2 0.4 0.6 0.8 1.0 1.2 1.4 1.6 1.8 2.0
Measured Rate, g/cm2-s
Pre
dict
ed R
ate,
g/c
m2 -s
Parity plot for burning rate predictions for the shock tube database based on the best-fit assignment to A30 for each coal.
0
20
40
60
80
100
0 20 40 60 80 100
Measured Burnout, daf wt.%
Pred
icte
d Bu
rnou
t, da
f wt.%
Parity plot of burnout predictions for the EFR database based on the best-fit parameter assignment for each coal.
CBK/E was validated against a database of 235 independent tests that characterized 11 coals, 2 coal chars, and a graphite, heating rates approaching 106 °C/s, furnace temperatures to 1527 °C, pressures to 2.0 MPa, and O2 levels to 100 %.

A One-Point Calibration is Needed for Every Fuel Sample
Adjust one frequency factor, A70, to fit the measurements for each coal.Use default values/correlations for all other modeling parameters.Correlate A70 with rank to estimate default rate parameters.

The Rank Dependence of Char Burnout is Similar At Elevated Pressure
Same reactivity for subbituminous coals through low volatility coals.Low rank chars have diffusion-limited burning rates.Enhanced plasticity of low-rank coals at elevated pressure may lower the reactivity.
5
6
7
8
9
10
11
65 70 75 80 85 90 95
Carbon Content of Coal, daf wt%
log 1
0(A
30)
1 atm
High Pressure

Fundamental Difference Between Combustion and Gasification:
Chemistry in the gas phase determines the levels of the char gasification agents (CO2, H2O, CO, H2).
In a p. c. flame, all O2 enters the furnace through burners & OFA ports, so mixing limited extents of conversion determine the local O2 concentration.
In a gasifier, injected O2 only partly determines the conversion levels of volatiles/soot/char, whereas the levels of CO, H2, CO2, and H2O are variable. Gas mixtures are not stable at 1600°C, so gas phase chemistry is important throughout the entire gasifier.

Use CBK/G to Predict Gasification Rates
Combustion2C+O2 → C(O)+COC+C(O)+O2 → C(O)+CO2C(O) → CO
GasificationC+CO2 ↔ C(O)+COC(O) → COC+H2O ↔ C(O)+H2C+2H2 → CH4 (slow)
CBK/G was validated against a database of 452 independent tests that characterized 26 coals, heating rates approaching 105 °C/s, furnace temperatures to 1500 °C, pressures to 3.0 MPa, and broad ranges of CO2, H2O, CO, and H2 levels.
Separate surface oxide pools for the combustion and gasification reactions.Separate surface oxide pools for CO2 and H2O gasification.Currently neglecting CC(O) chemistry and CO chemisorption as marginal.

No Systematic Discrepancies in Predicted Extents of Conversion or Gasification Rates
0
20
40
60
80
100
0 20 40 60 80 100Measured Char Conversion, daf wt.%
Pred
icte
d C
har C
onve
rsio
n, d
af w
t.%
1.E-06
1.E-05
1.E-04
1.E-03
1.E-02
1.E-01
1.E+00
1.E-06 1.E-05 1.E-04 1.E-03 1.E-02 1.E-01 1.E+00Measured Rate, 1/s
Pre
dict
ed R
ate,
1/s

CBK/G Performs Well Over A Broad Domain of Operating Conditions
0
20
40
60
80
100
120
0 50 100 150 200 250 300 350 400Time, s
Cha
r Con
vers
ion,
daf
wt.%
Gottelborn
Polish
Predicted (curves) and measured (data points) char conversion histories for ( and solid line) Polish and ( and dashed line) Gottelborn chars at 1500°C and 0.1 MPa pure CO2 in a WMR (Moors, 1998).
0.0E+00
5.0E-04
1.0E-03
1.5E-03
2.0E-03
2.5E-03
3.0E-03
3.5E-03
4.0E-03
0.0 0.5 1.0 1.5 2.0 2.5 3.0 3.5PT, MPa
Rat
e, s
-1 H2O
CO2
Predicted (curves) and measured (data points) rates of Xiao Long Tan lignite char gasification at ( and solid line) 850°C in 80 % H2O, 10 % H2, and 10 % CO, and at ( and dashed line) 900°C in 90 % CO2 and 10 CO % (Sha et al., 1990).

CBK/G Performs Well Over A Broad Domain of Operating Conditions
0.E+00
2.E-04
4.E-04
6.E-04
8.E-04
1.E-03
0 10 20 30 40 50 60 70 80 90Char Conversion, daf wt.%
Rat
e, s
-1
1096oC
1040
983
928868
Predicted (curves) and measured (data points) reaction rate profiles for Jincheng anthracite under 0.1 MPa steam at ( and solid line) 1096, ( and dashed line) 1040, ( and dotted line) 983, ( and dotted-dashed line) 928, and ( and double dotted-dashed line) 868°C (Ma et al., 1992).
0.0E+00
5.0E-04
1.0E-03
1.5E-03
2.0E-03
2.5E-03
0 0.5 1 1.5 2 2.5 3PT, MPa
Rat
e, s
-1
Yallourn
Baiduri
Hongei
Taiheyo
Initial CO2 gasification rates of ( and solid line) Hongei, ( and dashed line) Baiduri, ( and dotted line) Yallourn, and ( and dotted-dashed line) Taiheyo at 850°C in a PTGA (Nozaki et al., 1992).

Plausible Correlations for the Reactivity, BUT Wide Dispersion
4
5
6
7
8
9
10
60 65 70 75 80 85 90 95 100Carbon Content, daf wt.%
log 1
0(A
70)
Rank dependence of corrected values for A70. Solid circles denote the best fit values for each coal. The solid line represents the correlation between A70 and a coal’s carbon content.
0
0.1
0.2
0.3
0.4
0.5
0.6
60 65 70 75 80 85 90 95 100Carbon Content, daf wt.%
Initi
al R
ate,
s-1
Rank dependence of the initial burning rate of a 90-µm coal in an 1200°C EFR, at 2.0 MPa and 1400°C and with 10 % CO2, 30 % H2O, 10 % CO and 10 % H2, based on the correlation in Eq. 64.

Simple LSimple L--H/NthH/Nth--Order Rate Laws Order Rate Laws Reproduce the Rates from CBK/GReproduce the Rates from CBK/G
SCOCO
nSCOCOCO
CO PKPRTEA
RCO
,
,
1)/exp( 2
222
2 +
−⋅⋅=ϑ
SHH
nSOHOHOH
OH PK
PRTEAR
OH
,
,
22
2
222
2 1
)/exp(
+
−⋅⋅=ϑ
2
2222 ,)/exp( HnSHHHH PRTEAR −⋅⋅=ϑ
55
44
33
2210 XaXaXaXaXaawhere +++++=ϑ

Must Also Apply a RateMust Also Apply a Rate--Reduction Reduction PolynomialPolynomial
conversionofExtentX =where1.0 + 1.679X - 2.4287X + 1.7825X- = RR 23
CO2
CO
0
2
0.0
0.2
0.4
0.6
0.8
1.0
1.2
0 0.2 0.4 0.6 0.8 1Carbon Conversion
RC
O2/R
CO
20

Use CBK/G to Extrapolate to Actual Use CBK/G to Extrapolate to Actual GasifierGasifier ConditionsConditions
XCHAR
RGAS
Lab-Scale Gasification
Data for Calibration
CBK/GPredict RGAS, XCHAR for any
operating conditions
Complexgas mixture
compositionsCouple to
equilibrium gas mixturecompositions
Estimate gas product
compositions
Accurately estimate char and
soot conversions
Simpler gasification
rate laws for CFD

ExtrapolationsExtrapolations Based on CBK/GBased on CBK/G
0
20
40
60
80
100
0 10 20 30 40 50 60Residence Time, s
Coa
l Con
vers
ion,
daf
wt.%
0.51.02.0
P, MPa
0
0.2
0.4
0.6
0.8
1
1.2
1.4
0 10 20 30 40 50 60Residence Time, s
d p/d
p0
Faster gasification for higher pressures.Inhibition by CO & H2 stronger than the impact of doubling the CO2and H2O levels.
0
20
40
60
80
100
0 10 20 30 40 50 60Residence Time, s
Coa
l Con
vers
ion,
daf
wt.%
10% CO2, 30% H2O, 10% CO, 10% H210% CO2, 30% H2O20% CO2, 60% H2O
0
0.2
0.4
0.6
0.8
1
1.2
1.4
0 10 20 30 40 50 60Residence Time, s
d p/d
p0

The FQ Impacts are Evident in a 1D The FQ Impacts are Evident in a 1D GasifierGasifierSimulation With Detailed ChemistrySimulation With Detailed Chemistry
First-stage calculation based on full kinetics to determine Xchar and Xsoot.Steam injection into a reducing second stage.Equilibrium gas compositions shift throughout the second stage.Steam gasification with strong CO inhibition.Soot persists.
0 5 10 15 20 25 30 35Time, s
0
10
20
30
40
50
60
70
80
Maj
or P
rodu
cts,
daf
wt.%
CO
H2O
CO2
H2
Soot
0
20
40
60
80
100
120
140
160
180
0 0.02 0.04 0.06 0.08 0.1
Maj
or P
rodu
cts,
daf
wt.%
hv bituminous
O2
Char

The FQ Impacts are Evident in a 1D The FQ Impacts are Evident in a 1D GasifierGasifierSimulation With Detailed ChemistrySimulation With Detailed Chemistry
Similar trends with subbituminous coal.Comparable product gas quality.Soot persists.
0 5 10 15 20 25 30 35Time, s
0
10
20
30
40
50
60
70
80
Maj
or P
rodu
cts,
daf
wt.%
CO
H2O
CO2
H2
Soot
0
20
40
60
80
100
120
140
160
180
0 0.02 0.04 0.06 0.08 0.1
Maj
or P
rodu
cts,
daf
wt.%
subbituminous
O2
Char
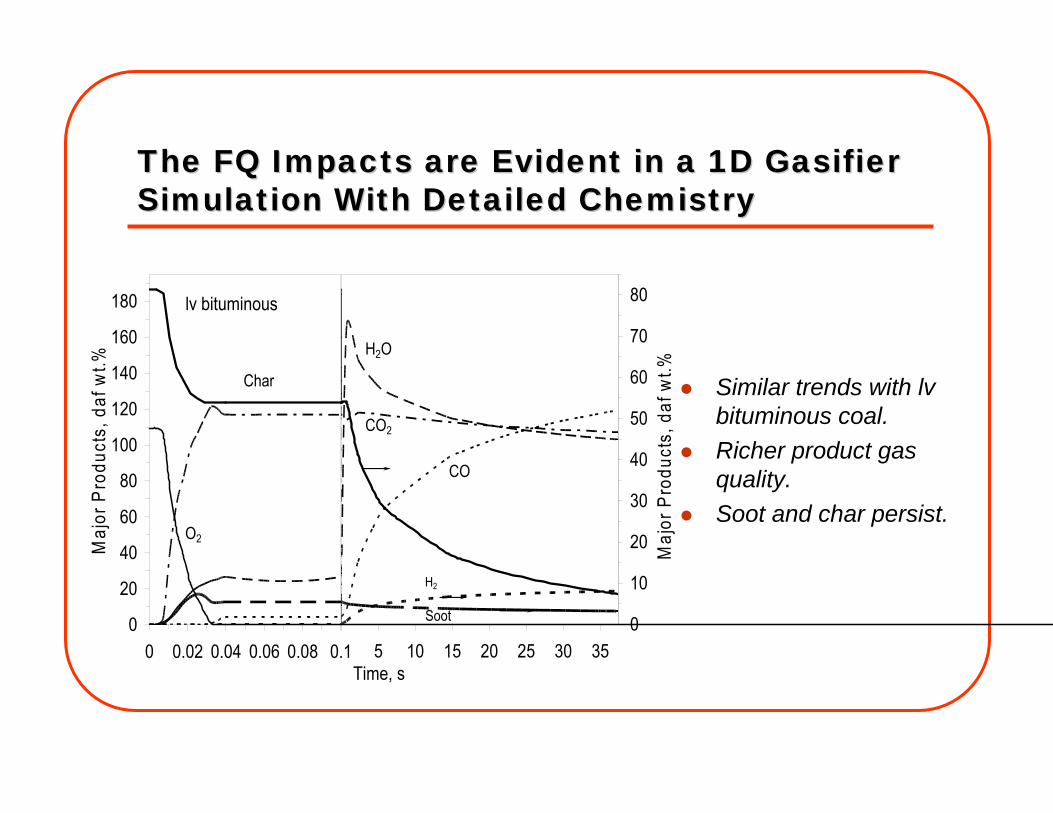
The FQ Impacts are Evident in a 1D The FQ Impacts are Evident in a 1D GasifierGasifierSimulation With Detailed ChemistrySimulation With Detailed Chemistry
Similar trends with lvbituminous coal.Richer product gas quality.Soot and char persist.
0 5 10 15 20 25 30 35Time, s
0
10
20
30
40
50
60
70
80
Maj
or P
rodu
cts,
daf
wt.%
CO
H2O
CO2
H2
Soot0
20
40
60
80
100
120
140
160
180
0 0.02 0.04 0.06 0.08 0.1
Maj
or P
rodu
cts,
daf
wt.%
lv bituminous
O2
Char

Where’s the Soot ?!
Most of the Volatile-C incorporated into soot. Soot competes for available O2, scavenges radicals. Omitted in every reported gasifier simulator.No equilibrium until the soot is consumed.Kinetics determine the gas composition in, perhaps, the first half of a gasifier.Without the correct gas composition, predicted gasification rates will be incorrect.Must work with multiple gasification agents (CO, CO2, H2O, H2, CH4).
Coal Soot Yield, daf wt. %
% of Wt. Loss
Pit. #8 22.9 - 29.1 43 – 57 Ill. #6 21.0 40 PRB 9.1 19

Critical NeedsTests with >20 coals under standard conditions are needed to develop improved correlations between coal properties and the initial char gasification reactivity. Monitor loadings of alkali and alkaline earth cations. Divert lab testing away from cases with a single gasification agent to characterize (i) inhibition by CO and H2 and (ii) the complex mixtures that arise in gasifiers.Monitor gasification rates for coal-derived soot. Characterize the coupling among secondary volatiles pyrolysis, gas phase chemistry, and the conversion of char and soot throughout gasification at realistic suspension loadings.