Review of Australian groundwater discharge studies of terrestrial … · 2011-01-17 · Review of...
59
December 2009 Review of Australian Groundwater Discharge Studies of Terrestrial Systems Anthony O’Grady, Jenny Carter and Kate Holland April 2010
Transcript of Review of Australian groundwater discharge studies of terrestrial … · 2011-01-17 · Review of...

December 2009
Review of Australian Groundwater Discharge Studies of
Terrestrial Systems
Anthony O’Grady, Jenny Carter and Kate Holland
April 2010

Water for a Healthy Country Flagship Report series ISSN: 1835-095X
Australia is founding its future on science and innovation. Its national science agency, CSIRO, is a powerhouse of ideas, technologies and skills.
CSIRO initiated the National Research Flagships to address Australia’s major research challenges and opportunities. They apply large scale, long term, multidisciplinary science and aim for widespread adoption of solutions. The Flagship Collaboration Fund supports the best and brightest researchers to address these complex challenges through partnerships between CSIRO, universities, research agencies and industry.
The Water for a Healthy Country Flagship aims to achieve a tenfold increase in the economic, social and environmental benefits from water by 2025. The work contained in this report is collaboration between CSIRO and the National Water Commission
For more information about Water for a Healthy Country Flagship or the National Research Flagship Initiative visit www.csiro.au/org/HealthyCountry.html
Citation: O’Grady A, Carter J and Holland K (2010) Review of Australian groundwater discharge studies of terrestrial systems. CSIRO: Water for a Healthy Country National Research Flagship. 60 pp.
Copyright and Disclaimer
© 2010 CSIRO To the extent permitted by law, all rights are reserved and no part of this publication covered by copyright may be reproduced or copied in any form or by any means except with the written permission of CSIRO.
Important Disclaimer:
CSIRO advises that the information contained in this publication comprises general statements based on scientific research. The reader is advised and needs to be aware that such information may be incomplete or unable to be used in any specific situation. No reliance or actions must therefore be made on that information without seeking prior expert professional, scientific and technical advice. To the extent permitted by law, CSIRO (including its employees and consultants) excludes all liability to any person for any consequences, including but not limited to all losses, damages, costs, expenses and any other compensation, arising directly or indirectly from using this publication (in part or in whole) and any information or material contained in it.
Cover Photograph:
Limestone tufa dam on the Douglas River in the Daly River region of the Northern Territory
Photograph: Anthony O’Grady

Review of Australian groundwater discharge studies of terrestrial systems Page iii
CONTENTS Acknowledgments ........................................................................................................ v
Executive Summary..................................................................................................... vi
1. Introduction ......................................................................................................... 1 1.1. Scope........................................................................................................................ 2 1.2. Water Resource Planning and the Precautionary Principle ..................................... 2 1.3. The National Water Initiative..................................................................................... 3 1.4. Terrestrial Groundwater Discharge........................................................................... 4
1.4.1. Groundwater discharge through vegetation...........................................................4
2. Review of approaches for quantifying groundwater discharge...................... 9 2.1. Soil water discharge.................................................................................................. 9 2.2. Watertable fluctuations ........................................................................................... 10 2.3. Water Balance ........................................................................................................ 12 2.4. Identifying Water Sources....................................................................................... 15 2.5. Remote sensing approaches to estimating groundwater discharge....................... 19
3. Groundwater Discharge Studies...................................................................... 21 3.1. Discharge through soils .......................................................................................... 21 3.2. Floodplain vegetation of the lower Murray River .................................................... 23 3.3. Gnangara groundwater mound............................................................................... 25
3.3.1. Vegetative interactions with groundwater on the Gnangara Mound ....................25 3.3.2. Groundwater discharge on the Gnangara Mound................................................27
3.4. Western Australian Wheatbelt ................................................................................ 27 3.5. Jarrah Forest........................................................................................................... 29 3.6. Plantations in the “Green Triangle”......................................................................... 30 3.7. Groundwater use in the Shepparton/Riverina region ............................................. 32
4. Discussion ......................................................................................................... 34 4.1. Impact of water table depth and groundwater salinity on groundwater discharge . 36 4.2. Can we predict groundwater discharge using ecological optimality? ..................... 39
5. Conclusions....................................................................................................... 42
References .................................................................................................................. 43

Review of Australian groundwater discharge studies of terrestrial systems Page iv
LIST OF FIGURES Figure 1. Global comparisons of precipitation, evaporation and runoff. Rainfall, evaporation and runoff values are based on outputs from the CSIRO MK3.0 model for the period 1970-1999 (Lim and Roderick 2009). ............................................................................................... 1 Figure 2. The relationship between annual evapotranspiration and rainfall for forested and grassed catchments (Zhang et al. 2001). .............................................................................. 14 Figure 3. Hypothetical example of mixing between two waters of a given isotopic composition (ie, A, B) to a third water (C). The line represents a ‘mixing line between A and B (from Thorburn et al. 1993). ............................................................................................... 17 Figure 4. The distribution of groundwater discharge studies around Australia..................... 35 Figure 5 Distribution of ecophysiological studies that have identified groundwater as a contributor to evapotranspiration. .......................................................................................... 36 Figure 6. The influence of depth to water table on groundwater uptake for discharge studies around Australia..................................................................................................................... 37 Figure 7. Impact of groundwater salinity (as measured by electrical conductivity) on groundwater discharge rates for discharge studies around Australia.................................... 38 Figure 8. A linear 3-dimensional representation of the relationship between depth to water table, groundwater salinity and groundwater uptake based on data from around Australia. . 39 Figure 9: Relationship between community leaf area index and a climate wetness index (rainfall (P)/pan evaporation (E0)). Redrawn from Ellis and Hatton (2008). ........................... 40 Figure 10: a) Relationship between Climate wetness index (P/E0) and leaf area index for ecosystems with access to groundwater in relation to that observed by Ellis and Hatton (2008) for ecosystems without access to groundwater; and b) Relationship between climate wetness index with groundwater discharge included ((P+g)/E0) and leaf area index in relation to studies review by Ellis and Hatton (2008).......................................................................... 41
LIST OF TABLES Table 1. Summary of groundwater uptake rates from plants in saline areas in Australia (from Thorburn 1996). Note: electrical conductivity is used as a surrogate for groundwater salinity.9 Table 2. Values of soil hydraulic parameters (A, n) used to estimate the maximum soil-limited steady-state groundwater discharge (qlim) from a water table at 1 m depth from Holland (2002a). .................................................................................................................... 10 Table 3. Estimates of the impact of revegetation on local aquifer groundwater depth at discharge sites (i.e. groundwater less than 2 m depth or saline) in south west Western Australia (from George et al. 1999). ...................................................................................... 11 Table 4. A summary of studies that have used stable isotope measurements to identify groundwater uptake and the species identified within those studies as accessing groundwater........................................................................................................................... 18 Table 5. Estimates of diffuse discharge through bare soils (from Holland 2002a). .............. 22 Table 6. Summary of plant water use studies of blackbox (Eucalyptus largiflorens) and red gum (E. camaldulensis ) on the Chowilla floodplain (summarised by Holland 2002). ........... 24 Table 7. Summary of groundwater discharge studies on the Gnangara mound in south west Western Australia. ................................................................................................................. 27 Table 8. Groundwater discharge estimates from tree belts in the Wheatbelt of Western Australia................................................................................................................................. 29 Table 9. Summary of the groundwater discharge estimates from Eucalyptus globulus and Pinus radiata stands in the green triangle from Benyon and Doody (2004) and Benyon et al. (2006). ................................................................................................................................... 32 Table 10. Summary of groundwater discharge estimates from studies conducted in the Riverina region of NSW and Victoria. .................................................................................... 33

Review of Australian groundwater discharge studies of terrestrial systems Page v
ACKNOWLEDGMENTS This report is a product of the “A Consistent Approach to Groundwater Recharge Determination in Data-Poor Areas” project which has been funded by the National Water Commission. Unpublished data contained within this report has been generously provided by Don White. We also thank Tanya Doody, Richard Silberstein, Russel Crosbie, Fred Leaney and Ian Jolly for assistance and access to unpublished reports and other papers. Thanks to Tim McVicar for his thoughts on the application of the SEBAL algorithm. Derek Eamus and Richard Silberstein have both provided useful and constructive reviews of this report

Review of Australian groundwater discharge studies of terrestrial systems Page vi
EXECUTIVE SUMMARY Water resource management authorities are increasingly required to prepare management plans for the regions under their jurisdiction. An essential component of this process is a detailed understanding of the water balance. Water resource planning must incorporate groundwater resources and therefore requires an understanding of the spatial and temporal patterns of groundwater discharge and recharge. However, resources available to aid such planning tend to be limited and priority often given to sites where the water resources are threatened, approaching allocation, or are of environmental significance. Thus, a nationally consistent framework is required for assessing groundwater recharge and discharge in data poor areas. Recognising this, the National Water Commission has asked CSIRO and Geoscience Australia to develop this framework. An important step in achieving this framework is to collate and review existing studies and to explore this data for generalisations that can be applied to data poor areas.
This focus of this review is on the collation of existing estimates of groundwater discharge from around Australia with a particular emphasis on discharge through vegetation. Companion reports review existing groundwater recharge estimates. As well as providing a comprehensive data base of field based measurement, these reviews also identify parameters associated with climate, soils, regolith, near-surface geology, landforms and vegetation that collectively determine recharge and discharge rates. The availability of mapping of these parameters or possible surrogates is addressed in a third report associated with this project. Together, these form the deliverables for Phase 1 of this project.
A number of approaches have been used to estimate groundwater discharge including water balance techniques, water table fluctuations and hydrograph separation and direct measurements of groundwater discharge using heat pulse sap flow techniques in combination with the stable isotopes of hydrogen and oxygen. An overview of these approaches is presented as part of this review. Estimates of groundwater discharge are rare for the Australian mainland. Most of the discharge data presented in this review has been sourced from detailed investigations of plot scale water balance, making it difficult to make generalisations about regional scale discharge processes. In addition to this, these detailed plot scale studies are typically conducted for relatively short time frames of 1-2 years, thus it is difficult to glean insights into the temporal variability of groundwater discharge. Furthermore, in many instances it is difficult to assess the accuracy of these water balance studies, partly because the inherent difficulty of conducting these studies makes replication difficult, but also because in many cases some components of the water balance, (for example canopy interception), have been estimated from generalised principles. Thus we have not attempted to address the inherent uncertainty associated with these discharge studies.
Of the data collated, the vast majority of discharge studies reported in this review were associated with studies focussed on understanding the role of trees in remediating degraded, and in particular saline, agricultural landscapes in southern Australia. As a result, most of the studies reported in this review are from regions where the water tables are shallow (< 5m). There was a surprising lack of estimates of groundwater discharge from natural ecosystems. However, there is significant evidence from ecophysiological studies that many ecosystems around Australia access deeper groundwater resources. These studies showed groundwater use occurring across a wide geographical range, encompassing diverse climates and many different types of ecosystem from tropical riparian forests to arid zone open woodlands. Despite the apparent widespread use of groundwater in Australian ecosystems, there are a limited number of studies that have quantified groundwater discharge. This is true even for high value groundwater resources such as the Gnangara Mound near Perth in Western Australia, where we could find only two studies quantifying groundwater discharge (~ 65 mm yr-1). The only other quantification of groundwater use from a natural system was from riparian forests of the lower Murray River in South Australia

Review of Australian groundwater discharge studies of terrestrial systems Page vii
(varied between 40 and 500 mm yr-1). We could find no estimates of groundwater discharge in Tasmania or the ACT. In the Northern Territory, there was only one estimate of groundwater discharge and this was for riparian forests in the Daly River region. The limited number of estimates of groundwater use by vegetation in this review highlights the need for more quantitative studies as well as a better process-based understanding of the factors influencing groundwater discharge.
Estimates of groundwater discharge around the country varied from 2 to more than 700 mm yr-1 and were highly variable. In individual studies, groundwater use has been associated with factors such as depth to water table, groundwater salinity, soil type and individual species root morphology and physiology. However, the data collated in this review was poorly correlated with any of these parameters. Generalised relationships were few, although above salinities of approximately 10 dSm-1, (i.e. approximately 6400 mg l-1 total dissolved solids), groundwater discharge rates were always low. In general, depth to water table and groundwater salinity were poor predictors of groundwater discharge. The most promising relationship for estimating groundwater discharge was based on the relationship between leaf area index and a simple climate wetness index (rainfall / pan evaporation; P/Eo). In systems where groundwater discharge was occurring, leaf area index was higher than has been previously predicted for a given climate wetness index (Ellis and Hatton 2008). However, when groundwater discharge was factored into the climate wetness index (i.e. rainfall + groundwater discharge/pan evaporation; P+g/E0), there was considerable convergence between this review and the Ellis and Hatton (2008) review. The “ecological optimality” approach offers considerable potential for estimating groundwater discharge as it effectively integrates many of the processes that limit groundwater discharge. Furthermore, there has been considerable advancement in the development of spatial mapping technologies, raising the potential for regional predictions of groundwater discharge from spatially explicit estimates of rainfall, evaporation and remotely sensed leaf area index data.

Review of Australian groundwater discharge studies of terrestrial systems Page 1
1. INTRODUCTION Australia is one of the driest continents on earth, thus water is a precious resource. Of the rainfall that falls across Australia, approximately 89% evaporates or is transpired back to the atmosphere, about 9% runs into streams, rivers and storage and the remaining 2% drains below the root zone into groundwater and from there into rivers (Figure 1, ANON 2008).
Figure 1. Global comparisons of precipitation, evaporation and runoff. Rainfall, evaporation and runoff values are based on outputs from the CSIRO MK3.0 model for the period 1970-1999 (Lim and Roderick 2009).
Although recharge to groundwater is typically only a minor component of the water balance, groundwater represents the words largest fresh water resource. As such groundwater resources are an asset of national and international significance. In Australia, a large proportion of the agricultural industry, rural towns and some cities (eg Perth) are dependent to some extent on groundwater resources (Eamus et al. 2006b). Furthermore, Hatton and Evans (1998) highlighted the importance of groundwater to maintaining ecosystem function and services. Since their report, there has been increased focus within Australia on defining the groundwater requirements of ecosystems (Zencich et al. 2002; O'Grady et al. 2006a; O'Grady et al. 2006c). However, understanding the groundwater requirements of ecosystems and incorporating these into water plans is significantly hampered by a lack of detailed measurements and knowledge. Furthermore, expansion of traditional forestry activities and the development of new forest industries, (for example, forests developed for carbon sequestration), potentially intercept significant quantities of water and impact the water balance. This is particularly true where plantations and new forests are established in areas where groundwater is shallow and of high quality (Benyon et al. 2006). With demand for water increasing and climate regimes changing there is an urgent need to better understand the surface and groundwater resources nationwide and develop adaptive management practices that are receptive to the input of new knowledge.

Review of Australian groundwater discharge studies of terrestrial systems Page 2
1.1. Scope A primary requirement of water managers is an accurate water balance. This requires knowledge of the spatial and temporal distribution of recharge and discharge processes within the area of interest. However, detailed information on the various components of the water balance is lacking for most areas in Australia. Despite this, water resources managers are faced with a requirement to develop plans for sustainable management of water. Faced with this lack of detailed information, management authorities are often forced to use crude approximations of important process which results in a large amount of uncertainty and inconsistencies between regions.
The aim of this National Water Commission funded project is to:
“Provide a consistent methodology that can be applied by water managers to determine recharge and discharge rates in areas that have not been subject to detailed investigations”
In order to address this issue, it has been necessary to undertake a comprehensive review of the recharge and discharge studies currently available. This report is one of three review documents being compiled as part of this process. The companion reports are;
Crosbie, R., Jolly, I., Leaney, F., Petheram and C., Wohling, D. (2009). Review of Australian Groundwater Recharge Studies. Water for a Healthy Country National Research Flagship.
Pain, C., Wilford, J. and Halas (2009). A Review of Mapping Approaches to Recharge and Discharge Estimation. Water for a Healthy Country National Research Flagship.
In this report we review the current state of knowledge relating to groundwater discharge, and more specifically discharge of groundwater through terrestrial vegetation. We explore the existing knowledge for generalisations that can be used to aid water resource planning in data poor areas. Surface water and groundwater interactions are being explored more fully in a project funded by the National Water Commission “A national perspective on the magnitude of river-groundwater interaction and associated impacts on water resources.
1.2. Water Resource Planning and the Precautionary Principle Application of predetermined generalisations to data poor areas requires careful consideration. It is important to recognise that the level of knowledge applied to water planning decisions should be appropriate to the level of risk associated with those decisions. Where there are large uncertainties about the water resources available or about the environmental needs for water, it is appropriate that allocations based on these generalisations be conservative. As demand on the water resource increases or where there are significant environmental, social or economic assets at stake, detailed investigations are required to reduce uncertainties and thus reduce the risk of making unsustainable water allocations. Thus, in the context of the National Water Initiative (outlined below) the intent is not necessarily to pre-determine if a volume of water is significant but instead to determine whether it is significant in the context of each unique hydrological balance (Polglase and Benyon 2008). The precautionary principle states that:
“Where there are threats of serious or irreversible environmental damage, lack of full scientific certainty should not be used as a reason for postponing measures to prevent environmental degradation”1
Typically the principles of the level of investigation matching the level of risk from decisions have been used well in groundwater assessments in Australia. Where the resource is small, use is low and there are no major environmental assets at risk, a rudimentary assessment that might incorporate some generalised knowledge may be appropriate. However, where the groundwater resource is large, or there are significant demands on it and/or there are important environmental assets that are reliant on the groundwater resource, more detailed groundwater assessments incorporating an analysis of the vulnerability of the environmental asset to changed water availability regimes is required. 1http://www.unep.org/Documents.multilingual/Default.asp?DocumentID=78&ArticleID=1163

Review of Australian groundwater discharge studies of terrestrial systems Page 3
1.3. The National Water Initiative In Australia water is generally vested in the state and territory governments which allocates water within a framework of entitlements and responsibilities (Zhang et al. 2007b). The National Water Initiative (2004, NWI) recognises that water is part of the nations “natural capital” and so management of these resources is a national issue. As such, the NWI seeks to better integrate surface and groundwater management across jurisdictions and provide a framework for consistent decision making with regard to allocation of water resources that will increase water security to all stakeholders. The NWI recognises that the environment is a legitimate stakeholder in this allocation framework. Specifically, the NWI was designed to address the need for a nationally integrated decision making framework and seeks to achieve this by achieving the following outcomes:
Enhance the security and commercial certainty of water access entitlements by clearly specifying the statutory nature of those entitlements
Provide a statutory basis for environmental and other public benefit outcomes Be characterised by planning processes in which there is adequate opportunity for
productive, environmental and other public benefits considerations to be identified and taken into account in an open and transparent way
Provide for adaptive management of surface and groundwater systems to meet productive environmental and other public benefit outcomes
Implement firm pathways and processes for returning previously over-allocated surface water or groundwater systems to environmentally sustainable levels of extraction
Clearly assign the risks arising from future changes to the consumptive pool Water access entitlements to be compatible across jurisdictions to improve
investment certainty, be competitively neutral and to minimise the transaction costs on water trades
Reflect regional differences in the variability of water supply and the state of knowledge underpinning regional allocation decisions
Recognise indigenous needs in relation to water access and management Identify and acknowledge surface and groundwater systems of high conservation
value and manage these systems to protect and enhance those values Protect the integrity of water access entitlements from unregulated growth in
interceptions through land use change
Traditionally the concept of a “sustainable yield” of an aquifer was based predominantly on the concept of average annual recharge or some derivative of this water balance component. However the concept of a “sustainable yield” has evolved considerably over the last decade. Achieving a sustainable yield requires the determination of the water requirements of each user, including the environment, and securing the groundwater recharge or discharge that is essential to balance these requirements.
Defining environmental groundwater requirements, or that proportion of the groundwater resource that is required for the maintenance of normal ecosystem services and functions, represents a significant challenge and needs to recognise that these requirements depend on more than just volume. Generally, the environmental groundwater requirements of a system require an understanding of:
The Flow regime, i.e. the rate and volume of groundwater discharge to streams or other surface water bodies
Level, i.e. the depth below the surface at which the water table occurs Pressure, i.e. the potentiometric head of semi-confined or confined aquifer and its
expression in groundwater discharge area Quality, i.e. the chemical composition of groundwater expressed in terms of, for
example, pH, salinity, nutrients, and contaminants

Review of Australian groundwater discharge studies of terrestrial systems Page 4
Furthermore management of these groundwater resources requires that we can:
identify groundwater dependent ecosystems (GDEs) in the field and the timing of this dependence; this may include individual species or assemblages of species or habitats that are reliant on groundwater
identify what the individual groundwater regime may be (i.e. the particular combination of Flow, Depth, Pressure and Quality)
identify the vulnerability of the system to a changed water regime and identify the measures of ecosystem function that will need to be monitored to ensure
that management of groundwater is effective (Eamus et al. 2006a).
Identifying all of these factors can be a complex exercise and one that will vary among regions and ecosystems. However, Eamus et al. (2006) provide a detailed functional approach for addressing these questions.
1.4. Terrestrial Groundwater Discharge Terrestrial discharge of groundwater occurs mainly through; capillary rise and direct evaporation from the soil (Jolly et al. 1993), via transpiration through vegetation (Thorburn et al. 1995; White et al. 2002; O'Grady et al. 2006c) or as discharge into rivers and streams (Cook et al. 2003). This review does not consider the latter; we have mainly focused on discharge via transpiration through vegetation, and have also commented on diffuse discharge through soils.
Where water tables are shallow, diffuse discharge of groundwater can be a significant component of the water balance (Thorburn et al. 1993; Holland 2002b). Diffuse discharge from water tables can result in high soil water contents and concentration of salts resulting in high soil and groundwater salinity (Jolly et al. 1993; Thorburn et al. 1993). Thus in many arid systems, the vegetation associated with natural groundwater discharge areas tends to be halophytic to some extent, i.e. has the capacity to tolerate high salinities. Water tables have also risen in response to anthropogenic factors such as changes in vegetation cover, irrigation or alteration of natural flow regimes of rivers. This has often resulted in rising salinity and waterlogging and can have serious consequences for environmental health (for example, declining floodplain vegetation health along the Murray river, George et al. 2005) or may result in considerable loss of agricultural productivity (George 1990; Heuperman 1999; Hatton et al. 2003).
1.4.1. Groundwater discharge through vegetation
Groundwater discharge through vegetation has been observed in many natural and managed systems around the country, from varying groundwater depths and qualities (see for example: Drake and Franks 2003; Lamontagne et al. 2005; Benyon et al. 2006; O'Grady et al. 2006b; O'Grady et al. 2006c). The discharge of groundwater through vegetation depends principally on;
the rooting distribution and the ability of a species to access a water table, the depth of the water table, the water quality of the groundwater resource and, how these variables vary spatially and temporally.
The role of rooting depth
Global reviews of plant rooting distributions have shown that the majority of root biomass occurs in the top 50 cm of the soil profile (Cannadell et al. 1996; Jackson et al. 1996). However, it is well established that plants have the capacity to explore soil profiles to much greater depths. For example, while Cannadell et al. (1996) found that the average rooting depth for plants from arid environments or from those that experience a long dry season was 5.2 m, they also cited studies that observed Bosica albitrunca roots at depths up to 65 m

Review of Australian groundwater discharge studies of terrestrial systems Page 5
during deep drilling in the Kalahari desert. Furthermore Dell et al. (1983) observed Eucalyptus marginata roots at depths of 40 m in the south-west of Western Australia. It is often assumed that soil type restricts root growth and that roots will only penetrate to large depths in sandy soils. However, there are many examples of roots penetrating compact clay soils, rocky soils or through hard pans. Roots may follow cracks, fissures or channels to access water at depth (eg Carbon et al. 1980; Dell et al. 1983; Nambiar and Sands 1992; Poot and Lambers 2008).
Even for deep rooted species, the majority of roots are close to the soil surface. Jackson et al. (1996) reviewed 250 root distribution studies and of these only 9 measured roots below 2 m depth. Five of these 9 studies had 93% to 100% of the root biomass in the top 1 m of soil. This might indicate that water uptake by deeper roots is not likely to contribute significantly to the water balance. However, Stone and Kalisz (1991) concluded from their review that deep roots play a more important role in water uptake than that inferred by root density alone. For example, O'Grady et al. (2006b) found that Corymbia clarksoniana appeared to be accessing groundwater at depths of 12 m and Howe et al. (2007) report evidence of groundwater uptake by Corymbia opaca in the Ti Tree Basin in central Australia at groundwater depths of up to 20 m. Deep roots may be much more effective in absorption of water than shallow roots (Reicosky et al. 1972), and have been found to have higher hydraulic conductivity due to a greater number of conducting vessels per unit area (Pate et al. 1995). Thorburn and Ehleringer (1995) found that some trees gain most water from deep sources even when water is available at the surface, and cautioned that water uptake patterns do not necessarily match the root distribution and soil water content profile. Nepstad et al. (1994) have criticised the assumption underlying most climate and hydrological models used for the Amazon region that assume water uptake is mainly restricted to the upper soil horizons. They found that 75% of water extracted in the Amazonian forest was from below 2m depth, and using measures of canopy greenness concluded that a third of the Brazilian forests were dependent on deep water resources.
Much of Australia has low, seasonal or highly variable rainfall (McMahon et al. 1992; Cai et al. 2005), and this has probably contributed to the deep rooted nature of many Australian species. In their review, Cannadell et al. (1996) found that E. marginata was the fourth deepest rooting species (40 m) in the world, and that the average maximum rooting depth was approximately 12.6 m for sclerophyllous trees and 3.5 m for sclerophyllous shrubs. Together these observations suggest that it is highly likely that groundwater is an important source of water for maintaining vegetation health in Australia. Confirmation of these observations in Australia remains limited although studies of the natural abundances of the isotopes of hydrogen and oxygen in the soils and plants has found that groundwater may represent a significant proportion of plant communities annual water requirements, especially towards the end of extended dry seasons (Thorburn and Ehleringer 1995; Dawson 1996; Zencich et al. 2002; O'Grady et al. 2006b; Costelloe et al. 2008).
Depth to groundwater
Regardless of the potential for a deep rooting habit in dry environments such as Australia, and the higher hydraulic efficiency of deep roots, depth to groundwater plays an important role in determining the rate of groundwater discharge through vegetation. Farrington et al. (1989) examined the water balance of Banksia woodlands in Western Australia at a range of depths to water table varying between 4 and 12 m. In that study they found no evidence of groundwater use by either overstorey or understory species. However, in a companion paper Farrington et al. (1990) observed that where the water table was shallow, groundwater discharge represented a significant fraction of total evapotranspiration. In contrast to the studies of Farrington et al. (1989), Dodd and Bell (1993a) and Zencich (2003) examined the water relations of Banksia attenuata and Banksia menzeisii at sites with groundwater depths of 6-7 m and observed that despite the highly seasonal environment, predawn water potentials (a measure of the plant water status, where high values equate to low water stress) and water use by these canopy species remained high throughout summer. These observations suggest that groundwater was indeed an important source of water in these communities. The disparity between these studies in the Banksia woodlands of Western

Review of Australian groundwater discharge studies of terrestrial systems Page 6
Australia highlights the importance of understanding and capturing the spatial and temporal dynamics of groundwater discharge. Zencich (2003) examined in detail the use of different sources of water using hydrogen deuterium ratios in twigs of Banksia attenuata and found that the groundwater usage during the dry season was partially a function of depth. In general, where depths to groundwater were less than 10 m, Banksia species in the Gnangara mound of Western Australia appeared to have some access to groundwater (studies cited in Groom 2004). In addition to these studies, Howe et al. (2007) examined water use in Corymbia opaca trees across a gradient of depth to water table in central Australia and found that water use was slightly lower at sites with deeper groundwater than at sites with shallow water tables. Groundwater depth was also shown to be important in studies of growth and productivity of important commercial species such as Pinus radiata, Eucalyptus globulus, E. grandis and Corymbia maculata plantations in south east Australia (Benyon et al. 2006). In the Benyon et al. (2006) review, there was no apparent tree groundwater use at six sites where depth was below 7.5 m, whereas significant groundwater use occurred at 11 out of 14 sites where groundwater was shallower than 6 m. These results suggest that there is potential to develop threshold guidelines for predicting where vegetation may access groundwater resources.
Individual species have developed different strategies for maximising productivity within a given resource pool, and there tends to be considerable partitioning of water resources within ecosystems (Jackson et al. 1999), i.e. not all plant species within an ecosystem will access groundwater. Indeed, Dawson (1996) observed that structurally complex stands (in terms of tree size), were likely to have a larger impact on regional hydrology than even-aged, structurally simple stands, as the former tends to explore more of the soil profile. Colquhoun (1986) devised a classification of Mediterranean species based on their water use characteristics. He observed that some species are shallow-rooted, have greatly reduced transpiration in summer and develop low leaf water potentials, i.e. they experience significant water stress. Another group also had severely reduced transpiration during summer, but did not develop low leaf water potential. These species, such as Adenanthos cygnorum, therefore avoid water stress by accessing a deep water supply during drought, but do not have the capacity to use this water at appreciable rates. Still other species, such as Jacksonia floribunda, obviously had access to deep water sources as transpiration was maintained during summer drought, but was at reduced rates relative to evapotranspiration and leaf water deficits were still experienced. Colquhoun (1986) suggested this response indicated either; a) an imbalance between supply of and demand for water, b) hydraulic conductivity in the soil or plant was insufficient to meet evaporative demand or c) a direct stomatal response to high vapour pressure deficits was experienced during summer. Based on the work of Grieve (1956), Doley (1967) Carbon et al. (1981) and (Colquhoun 1984), Eucalyptus marginata and E. calophylla were grouped in a class that maintains high rates of transpiration during drought with little variation in water potential, indicating that these species potentially have access to deep soil water or groundwater and have high hydraulic efficiency in transporting water to leaves to meet evaporative demand. The Colquhoun (1986) classification highlights the potential complexity of natural ecosystems and the difficulty of predicting evapotranspiration and groundwater use in these systems. To address these complex issues Burgess (2006) expanded on these earlier observations and developed a simple “threshold-delay” model based that describes species sapflow responses to rainfall pulses to help develop screening strategies for revegetation programs. Using this approach they observed that plant species in the Corrigen Water Reserve in Western Australia could be broadly categorised into one of four ‘eco-hydrological types”: (1) no response to rainfall, typically deep-rooted eucalyptus reliant on water resources other than rainfall; (2) delayed response, species that exhibit a delayed response to rainfall possibly due to use of stored water or changes in the hydraulic pathway; (3) species that exhibit a small but rapid responses to rainfall (transpiration doubled) and (4) species that exhibit large and rapid responses to rainfall, in one case transpiration of the Proteaceaous shrub Isopogon gardeneri, increased five fold. Thus, many Australian species may possess a deep rooted habit and thus have the potential to access groundwater, but the rate at which this water is used and their vulnerability to changes in the water availability regime will depend on physiological and hydraulic traits.

Review of Australian groundwater discharge studies of terrestrial systems Page 7
Discharge of saline groundwater
Water quality, particularly salinity will also have significant impacts on the rates of groundwater discharge (Table 1). Note that in Table 1salinity is indicated by electrical conductivity, which is commonly used as a surrogate for soil and groundwater salinity in the literature and therefore presented in this review. Salinity reduces the ability of plants to take up water (Munns 2002) to such an extent that the impacts of salinity on growth and productivity are similar to those in plants experiencing water stress. Discharge of saline groundwater has been shown to result in reduced leaf water potentials (Mensforth et al. 1994; Holland et al. 2008), reduced water use (Sun and Dickinson 1995; Akeroyd et al. 1998; Raper 1998) and reduced growth and leaf area (Bacon et al. 1993; Munns 2002). Despite these impacts, revegetation is often recommended as a measure for mitigating salinisation of landscapes. Sun and Dickinson (1995) examined growth and water use of Casuarina cunninghamiana and E. camaldulensis planted on a saline site in north Queensland. They observed that trees grown on low and moderately saline sites had higher growth rates and water use than trees grown on highly saline sites. Similarly, Doody et al. (2009) found that E. camaldulensis/E. largiflorens forests on the Bookpurnong floodplain that were close to the river Murray and had access to fresh water used five times more groundwater and maintained higher canopy vigour than open mixed woodlands at sites further away from the river. Furthermore, they noted a significant improvement in the health and predawn leaf water potential of E. largiflorens trees with groundwater freshening.
Transpiration of saline groundwater may result in a reversal of hydraulic gradients under the trees and an increase in soil salinity. Heuperman (1999) noted that although a mixed Eucalyptus plantation established over a shallow water table near Kyabram in Victoria resulted in a significant reduction in water table of between 2 and 4 m, this resulted in a reversal of the hydraulic gradient under the plantation, the creation of a “subsurface discharge area” and an increase in soil salinity over the 10 year observation period. Thus transpiration of saline groundwater may in some cases exacerbate a decline in forest condition. However, despite these issues, revegetation of saline landscapes can contribute to salinity mitigation through increasing rainfall interception and reducing recharge. Furthermore, in some arid regions vegetation communities may exhibit dependence on saline groundwater resources. For example, in the Chowilla floodplain region there is a complex interaction between groundwater and health of the E. camaldulensis/E. largiflorens dominated forests. These forests rely to some extent on saline groundwater to maintain function during the frequent and long dry spells. However, forest health and vigour depends on large episodic rainfall events or flooding that leach accumulated salts from the soil profile and/or provides a fresh water source that the vegetation is able to exploit opportunistically (Bacon et al. 1993; Akeroyd et al. 1998).
Spatial and temporal dynamics of groundwater discharge
Groundwater discharge varies considerably spatially and temporally. Using measurements of stable isotope ratios of plant, soil and groundwater, Drake and Franks (2003) found that there were seasonal differences in the partitioning of water sources between five riparian rainforest species in the Atherton Tablelands. During the wet season all five species used water from the upper 1 m of the soil profile, but by late in the dry season there was considerable partitioning of water resources among species, with two species Doryphora aromatica and Canstanopora alphandii primarily using groundwater. Similar results were observed by Lamontagne et al. (2005) in riparian forests of the Daly River in the Northern Territory. A large component of the dry season baseflow in the Daly River is derived from groundwater and Lamontagne et al. (2005) found that species occurring close to the river, such as Melaleuca argentea and Barringtonia acutangula, were highly dependent on river water or shallow groundwater, while species at higher positions on the river levees opportunistically accessed groundwater depending on the time of year. Similarly, O'Grady et al. (2006c) observed that Corymbia bella, which occurs principally at the top of levee banks, used progressively deeper water sources as the dry season progressed. In Banksia woodlands on the Gnangara groundwater mound in Western Australia, Zencich et al. (2002) observed that groundwater use of Banksia attenuata and B. ilicifolia varied both according to

Review of Australian groundwater discharge studies of terrestrial systems Page 8
topography (i.e. depth to groundwater) and season, with groundwater become increasingly important as the dry season progressed. From these studies it is apparent that the location and timing of groundwater availability is at least as crucial to ecosystem health as the volume.
To the best of our knowledge there have only been two previous reviews of groundwater discharge in Australia. Benyon et al. (2006) reviewed the impacts of tree plantations on groundwater resources, focusing mostly on the green triangle region of South Australia and Victoria, and the Riverina region of NSW and Victoria. The studies encompassed by the Benyon et al. (2006) review are discussed in more detail below (Section 3.6). Thorburn (1996) has reviewed the role of revegetation in controlling saline water tables and presents groundwater discharge values sourced from a number of published and unpublished studies. Many of the original sources in the Thorburn review were difficult to obtain and thus could not be evaluated in detail; however, we present these here for completeness (). The discharge rates in vary considerably, ranging between 10 mm yr-1(Atriplex nummularia) to 440 mm yr-1 (Casuarina glauca, E. camaldulensis). Interestingly, while the highest discharge rates were recorded for tree species, so were some of the lowest rates. It is often assumed that plants will discharge saline water at rates higher than discharge from soils however, Thorburn (1996) found that the maximum rates of discharge from revegetation trials were similar to the rates of discharge from soils with water tables between 1 and 2 m depth. He also noted that there was a general trend for a decrease in groundwater uptake with increasing salinity but that this relationship was highly variable, suggesting that forming generalisations of groundwater discharge based on salinity alone would be difficult. In addition, there was little variation in groundwater uptakes rates with depth to water table. Thorburn (1996) concluded that this was because plants are able to overcome the increasing resistance to water flow with soil depth by directly accessing the water table.

Review of Australian groundwater discharge studies of terrestrial systems Page 9
Table 1. Summary of groundwater uptake rates from plants in saline areas in Australia (from Thorburn 1996). Note: electrical conductivity is used as a surrogate for groundwater salinity.
Species Location Groundwater uptake
(mm yr-1)
Electrical conductivity
of groundwater
(dS m-1)
Depth to groundwater
(m)
Reference*
Atriplex nummularia
Wakool, NSW
10 30 1.5-2.3 Slavich et al. (1996)
Casuarina glauca
Warrill Veiw, QLD
70 5 3 Fraser et al. (1995, 1996)
Casuarina glauca
Kingaroy, QLD
440 11 1.5 Fraser et al. (1995, 1996)
Eucalyptus camaldulensis
Chowilla, SA 440 7 2.7 Thorburn et al.(1994, 1995)
Eucalyptus camaldulensis
Warrill Veiw, QLD
35 5 3 Fraser et al. (1995, 1996)
Eucalyptus camaldulensis
Dalby, QLD 200 6 3 Fraser et al. (1995, 1996)
Eucalyptus grandis
Kyabrum, Vic
430 5 3-5 Hueperman (1995)
Eucalyptus largiflorens
Chowilla, SA 55-110 6-30 3-4 Thorburn et al.(1994, 1995)
Eucalyptus-mixed species
East Belka, WA
100 10 2 George (1990,1991)
Melaleuca halmaturorum
Upper SE SA
250 60 0-1.5 Mensforth and Walker (1996)
*references for each study are given in Thorburn (1996)
2. REVIEW OF APPROACHES FOR QUANTIFYING GROUNDWATER DISCHARGE
2.1. Soil Water Discharge The steady-state liquid water flux in the upward direction in a homogeneous soil is a function of the soil hydraulic properties, the depth to the water table and the change in matric potential within the soil profile;
1
dz
dSKSq (1)
where q is the liquid water flux, K is the hydraulic conductivity of the soil, S is the matric suction and z is the depth of the water table below the soil surface.
Integration of equation 1 gives the following relationship between z and S
dS
SK
qz
s
0
)(1
1 (2)
The solution of which requires knowledge of the form of the K(S) relationship (Jolly et al. 1993). The most common form of the K(S) relationship is given by Gardner (1958)

Review of Australian groundwater discharge studies of terrestrial systems Page 10
bS
aSk
n )( (3)
Where a, n and b are constants.
The maximum soil-limited steady-state flux for a given water table depth (z) is found by solving equation 2 with an upper boundary condition that S → ∞ at the soil surface. Thus for values of n > 1, the solution is (Warrick 1988; Thorburn et al. 1992b)
nn
n azAq 1lim (4)
Where β= qb/a+1 and An is a constant dependent on n (values given by Warrick 1988). When S is large equation 4 can be approximated by Thorburn et al. (1992b):
1lim
adAq n (5)
Thus groundwater discharge declines exponentially with increasing water table depth.
Table 2 shows the range of values determined for this relationship and the maximum soil-limited groundwater discharge from a water table at 1 m depth.
Table 2. Values of soil hydraulic parameters (A, n) used to estimate the maximum soil-limited steady-state groundwater discharge (qlim) from a water table at 1 m depth from Holland (2002a).
Soil An a
(mn+1 day-1) n (-)
qlim (mm day-1)
reference
Heavy alluvial clay 8.67E-04 1.57 0.87 Wind (1955) Pachappa fine sandy loam 5.66E-03 3.00 5.67 Gardner and Fireman
(1958) Chino clay 2.71E-03 2.00 2.71 Yolo light clay 9.87E-04 2.00 0.99 Sanata ana sand 2.59E-02 4.00 25.87 Willis (1960) Diablo loam 1.73E-03 2.00 1.73 Yandera loam 8.66E-03 3.00 8.66 Talsma (1963) Banna sand 1.69E-02 1.50 16.92 Camarooka clay loam 1.38E-03 2.00 1.38 Jondaryan loam 9.87E-04 2.00 0.99 S-W GAB alluvium 3.48E-05 1.40 0.35 Thorburn et al.(1992) Aeolian sand 6.28E-07 6.75 0.00063 Stolte et al. (1994) Fluviatile silt loam 3.93E-06 3.04 0.0039 Aeolian silt loam 5.05E-03 1.42 5.05 Marine Sandy loam 6.39E-05 2.29 0.064 Shonai sand 1.45E-07 9.23 0.00015 Mehta et al. (1994)
2.2. Watertable Fluctuations The link between watertable fluctuations and use by vegetation became clear after large scale clearing of deep rooted perennial from agricultural landscapes across southern Australia resulted in rising watertables and salinisation of the landscape. Revegetation of both groundwater recharge and discharge areas has been heavily promoted as an integral element of managing these problems as trees tend to have higher transpiration rates than pastures, intercept more radiation and rainfall, are aerodynamically rougher and thus well coupled to the atmosphere. They also tend to have deep root systems that allow them to exploit larger soil volumes (George et al. 1999). Reports of declines in water table heights associated with revegetation are widespread (Bari and Schofield 1992; Heuperman 1999; Morris and Collopy 1999; White et al. 2002; Crosbie et al. 2008); however this response is not universal (Greenwood et al. 1995). Furthermore, it can sometimes be difficult to

Review of Australian groundwater discharge studies of terrestrial systems Page 11
determine whether the declines in watertables are the result of reduced recharge to the watertable or a result of higher discharge rates associated with vegetation. In many cases, the decline in watertable depth is localised, suggesting that the reduction is related to increased discharge. George et al. (1999) reviewed revegetation trials from more than 80 sites in the south-west of Western Australia and found that the impacts of revegetation on watertables were quite variable. They assessed the groundwater response to planting trees in recharge and discharge areas by comparing the groundwater trend pre- and post-revegetation (at least three years after planting). They used data from control bores to exclude the effects of climate in their analysis. They found a significant relationship between the watertable response and the area of the catchment planted; in general, for every 10% increase in the area planted to trees there was a decline of 0.4 m in watertable depth in discharge areas and 0.5 m in recharge areas. However they observed that at most sites, less than 30% of the catchment was revegetated and that this had only small and localised effects on watertables (George et al. 1999). At discharge sites, the largest impact on local watertables was at sites where groundwater salinities were relatively low (total dissolved solids < 5000 mg l-1), with the maximum decline observed of approximately 2.5 m. A summary of the impacts of trees on groundwater depth at discharge sites observed by George et al. (1999) is given in Table 3. Although not measured explicitly, these effects are likely due to groundwater uptake by trees given that the aquifers at these sites were classified as local (and so less likely to be influenced by regional processes) and the water table depths were less than 2 m.
Table 3. Estimates of the impact of revegetation on local aquifer groundwater depth at discharge sites (i.e. groundwater less than 2 m depth or saline) in south west Western Australia (from George et al. 1999).
Rainfall
(mm yr-1) Pan Evaporation
(mm yr-1) Electrical
conductivity of groundwater
(dS m-1)
Rate of groundwater decline
(mm yr-1)
700 1450 0.31 360 700 1450 0.45 70 700 1500 0.66 330 700 1500 0.91 420 750 1400 0.98 30 700 1450 3.10 330 700 1500 3.47 300 700 1500 3.94 270 700 1450 5.19 470 700 1500 5.95 130 330 2600 6.25 200 750 1400 6.98 200 600 1550 7.19 250 750 1400 7.31 40 750 1400 7.59 57
Diurnal fluctuations of watertable heights have also been used to estimate daily groundwater uptake by vegetation (Davis and Peck 1986; Farrington et al. 1990; Nachabe et al. 2005). The diurnal cycle in watertable elevation represents integration between inflow of groundwater through lateral flow and outflow through evaporation. During the day, the water table declines as the rate of evapotranspiration increases and exceeds the inflow rate. Between sunset and sunrise when evaporation rates are negligible and inflow continues, groundwater elevation increases. The quantity of water withdrawn by evaporation can be
Review of Australian groundwater discharge studies of terrestrial systems Page 12
estimated by calculating the hourly rate of water table rise between midnight and sunrise and converting the net change of water withdrawn using the storage coefficient of the unconfined aquifer at the site (Farrington et al. 1990). The technique is attractive because groundwater levels can be readily measured continuously over a long time span and provides an integrated value across a site under study. The method relies on the critical assumption that lateral flow of groundwater below the vegetation remains constant throughout the day. Farrington et al. (1990) found that there was a strong relationship between these diurnal fluctuations in water table height and evapotranspiration from “dampland” vegetation measured directly using evaporation chambers. Evapotranspiration as measured directly varied between 1 and 5 mm day-1 and was linearly related to estimates of groundwater discharge derived from diurnal water table fluctuations of between 1 and 4 mm day-1
(E=0.68*(chamber E)+0.81, R2=0.9; Farrington et al.1990). However, changes in watertable heights are not always closely correlated with transpiration of groundwater (Davis and Peck 1986) and a major limitation with this approach is estimating the specific yield in the aquifer (Nachabe et al. 2005). Where the rates of groundwater discharge are low relative to the aquifer transmissivity, lateral inflows of water may partially or completely offset groundwater lost from the aquifer by transpiration. Furthermore, where the absolute rates of discharge are low, daily fluctuations in water table height may be too small to be accurately determined (Thorburn et al. 1993).
Salama et al. (1994) used hydrograph separation techniques to examine groundwater uptake by plantation E. camaldulensis in Western Australia. They inferred groundwater discharge by examining hydrographs of bores positioned inside and outside of a ten year old plantation. The approach they adopted assumes that in a steady state environment the groundwater level is a function of the amount of groundwater added to or removed from the aquifer and the characteristics and geometry of the aquifer (Salama et al. 1994) so that;
GW = hSyA + Qt
Where GW is the change in groundwater storage, h is the change in groundwater height, Sy
is the specific yield, A is the surface area, Q is net groundwater flow and t is the time interval.
Salama et al. (1994) stated that the difference between wells inside and outside of the plantation could be used to estimate groundwater uptake by trees if:
The wells inside and outside of the plantation were in the same aquifer There was no lateral flow into the aquifer beneath the plantation The outflow from the plantation to the outside well was minimal or could be estimated The outside well was not in the direct line of outflow from the plantation Barometric pressure had the same effect on all wells and The difference in the recession in the wells outside and inside the plantation was
caused by evapotranspiration and groundwater outflow could be separated.
Using this approach, Salama et al. (1994) found good agreement between water estimated from the hydrograph recession (~0.9-1.3 mm day-1) and water use estimated using heat pulse techniques (0.96 mm day-1). Despite these promising results, this was the only example of such an approach we could find in the literature.
2.3. Water Balance A detailed understanding of the water balance is fundamental to predicting the response of a given hydrological regime to disturbance, management intervention or climate change. Water balance studies tend to adopt a mass balance approach to determining the parameter of interest. In these studies, the volume of water entering the system must equal the volume of water leaving the system. Conceptually, the water balance of a site can be represented as:

Review of Australian groundwater discharge studies of terrestrial systems Page 13
P= ET + R + D + S
Where, P is precipitation, ET is evapotranspiration (the sum of transpiration through the vegetation, evaporation from soil and litter and interception losses i.e. rainfall that wets the plant surfaces and evaporates directly back to the atmosphere), R is runoff, D is deep drainage and S is the change in soil water content between two measurement times (all units are usually expressed as depth equivalents, mm). Over long time frames S usually equates to zero, such that the long term mean annual stream flow leaving a catchment is equal to the difference between rainfall and evapotranspiration (Zhang et al. 2001). However, at shorter time scales the amount of water stored in the soil profile does vary. As a result, on an annual basis there may be considerable variability in runoff that may not be related to variation in either rainfall or evapotranspiration (Benyon et al. 2007).
Precipitation and evapotranspiration are the largest components of the water balance. Generally rainfall exceeds evapotranspiration, but when groundwater is accessible evapotranspiration can exceed rainfall (Benyon et al. 2006). Given that these terms dominate the water balance, it is critical that rainfall and evapotranspiration are accurately estimated as small errors in either of these two terms could results in large errors in the residual terms. Accurate determination of evapotranspiration is problematic. At large spatial and temporal scales, mean annual evapotranspiration from catchments is determined largely by precipitation and potential evapotranspiration (Zhang et al. 2004). Potential evapotranspiration is itself determined primarily by the amount of incoming energy. The amount of energy reaching the earth’s surface is influenced by; distance from the sun, the angle of the Earths surface to the sun and the amount of radiation reflected by clouds and dust (Benyon et al. 2007). Of the radiation that does reach the earth’s surface, the amount that will be absorbed will depend on the albedo of the receiving surface. Highly reflective surfaces such as snow have high albedos (~1) and reflect most of the incoming radiation. In contrast, forests with high canopy cover tend to have low albedo and absorb a considerable proportion of the incoming radiation. This incoming radiation is dissipated as either latent heat loss associated with evapotranspiration or as sensible heat. The partitioning between latent heat loss and sensible heat loss is determined by the water content of the soil and the resistances to water movement in the soil-plant-atmosphere continuum (Benyon et al. 2007).
At the catchment scale and over long time scales, runoff is approximately equal to the difference between precipitation and evapotranspiration. Recognising this, Zhang et al. (2001) analysed runoff data from over 250 catchments from 28 countries around the globe. The resultant “Zhang curves”, presented in Figure 2, have provided a robust framework for analysing the impact of reforestation on runoff, and the difference between rainfall and evapotranspiration expected under different vegetation types and for different rainfall scenarios (Zhang et al. 2001; Zhang et al. 2007a). There is however considerable uncertainty associated with applying these “top down” generalisations at local scales. High resolution prediction of evapotranspiration is complex and needs to consider other factors that are reviewed in detail by Benyon et al. (2007) and Zhang et al. (2007a).
These factors include:
rainfall seasonality, position in the landscape, silvicultural management and species selection, proportion of the catchment planted, forest age and soil water availability

Review of Australian groundwater discharge studies of terrestrial systems Page 14
Figure 2. The relationship between annual evapotranspiration and rainfall for forested and grassed catchments (Zhang et al. 2001).
The “Zhang curves” have provided a useful empirical framework for estimating the hydrological impacts of impacts of changes in forest cover in catchments. However, they do not provide an in-depth understanding of the processes that are driving changes in the hydrological balance and thus have a limited predictive capacity. In contrast, detailed plot scale water balance studies potentially provide quantitative information on evapotranspiration and the biophysical processes controlling the water balance of a site, albeit at a small spatial scale. The importance of these approaches is that they tend to provide high resolution insights (at least temporally) into how the various components of the water balance and in particular evapotranspiration vary with factors such as climate, leaf area index (LAI), soil, forest type and forest management (Benyon et al. 2007). This detailed process based information has been critical in developing a mechanistic understanding and predictive capacity of how land use change will impact on the water balance. Despite their utility, there are still relatively few studies within Australia where the individual components of the water balance have been measured in sufficient detail to provide an accurate assessment of site water balance. This is largely because these studies are typically intensive and tend to have low levels of replication. Despite these problems much of the quantitative information on groundwater discharge presented in this report has been derived from plot scale water balance studies. A critical component of these studies is estimating evapotranspiration. There are many reviews of techniques for estimating evapotranspiration (see for example, Wullschleger 1998), here we summarise two techniques that have commonly been used in Australia.
The most widely used approach for estimating evapotranspiration is the Penman-Monteith equation;
s
a
apan
g
g
DgcGRE
1
)(
Review of Australian groundwater discharge studies of terrestrial systems Page 15
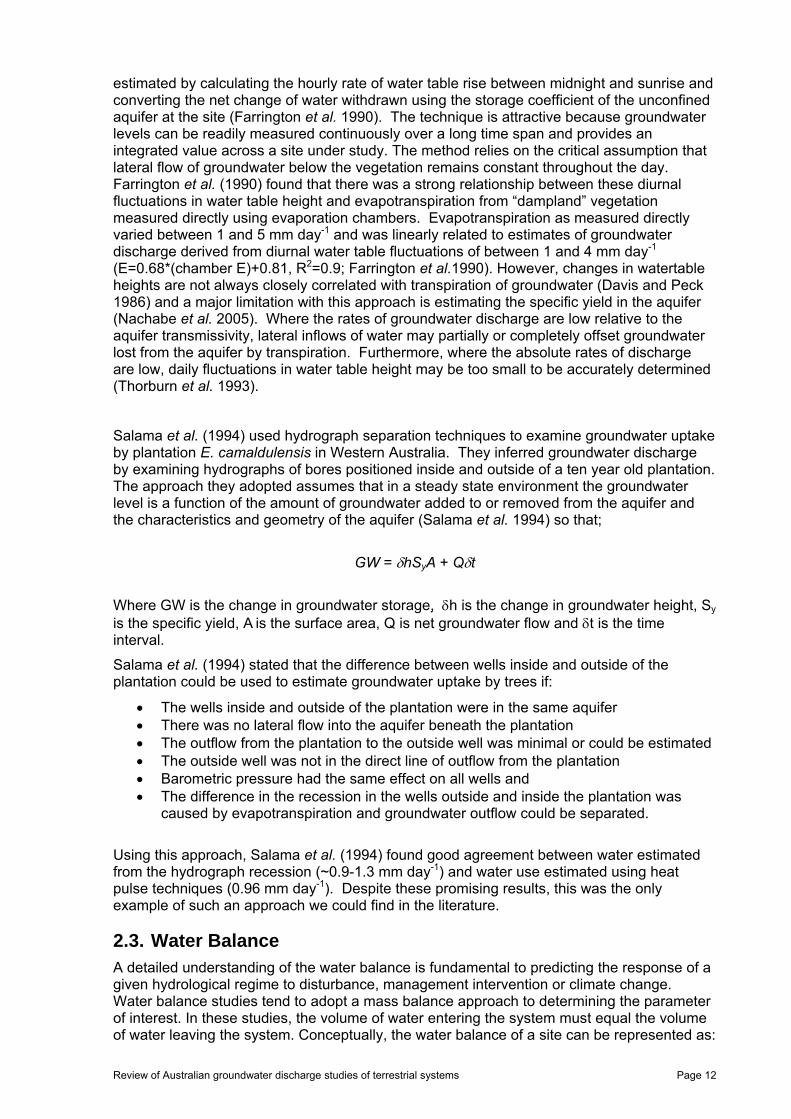
Where is the latent heat of vaporisation, ∆ represents the slope of the saturation vapour pressure temperature relationship, Rn is net radiation, G is the soil heat flux, D is the vapour pressure deficit of the air, is the mean density of air at a constant pressure, cp is the specific heat of air, is the psychometric constant (Monteith and Unsworth 2008). The Penman-Monteith model is a “big leaf” model that represents the evaporating surface as a single layer. Two parameters incorporate the role of vegetation in evapotranspiration, the aerodynamic conductance (ga, a measure of the resistance of diffusion through the boundary surrounding leaves) and the surface conductance (gs, a measure of the stomata resistance to vapour diffusion).
Aerodynamic conductance (ga) is defined as the rate of transfer of heat and water vapour from the evaporating surface into the air above the canopy;
1
2lnln
1
oh
h
om
ma z
dz
z
dz
Ukg
Where k is von Karman’s constant, (0.4) U is wind speed (m s-1), zm is the height of wind measurement (m), zom is roughness length governing momentum transfer, zh is the height of humidity measurement (m), zoh is the roughness length governing the transfer of heat and vapour, (m) and d is the zero plane displacement height (m) (Monteith and Unsworth 2008). The bulk surface conductance (gs) describes the vapour flow through stomata, total leaf area and the soil surface at a rate driven by the gradient in vapour pressure.
There are several approaches for directly estimating evapotranspiration in water balance studies, and these include energy balance and micrometeorological methods such as the Bowen ratio, eddy covariance or scintillometry. Heat pulse sapflow systems may be used to measure the transpiration of individual woody plants within an ecosystem, and have been used extensively within Australia (see for example, Benyon and Doody 2004; O'Grady et al. 2006b; Crosbie et al. 2008; McJannet 2008). The most common variant of the sapflow technology used within Australia uses heat as a tracer in the sap stream to estimate sap velocity. This approach requires a detailed understanding of the distribution of sap velocity within and between trees and requires a carefully planned, representative sampling of the stand to allow estimates of water use of individual trees to be scaled to stand transpiration (Hatton et al. 1990; Hatton et al. 2005). Sapflow techniques offer considerable flexibility in sampling and are a robust well tested approach to estimating transpiration. In order to estimate stand evapotranspiration, these methods need to be used in combination with other measurements such as understorey or soil evaporation chambers (Hutley et al. 2000; Mitchell et al. 2009), soil lysimeters and estimates of throughfall, interception and stem flow (Benyon 2002; Benyon and Doody 2004; Doody et al. 2009). Unlike energy balance or micrometeorological approaches, this approach has the advantage of partitioning evapotranspiration into its component parts of transpiration, soil evaporation and interception. Furthermore, when used in conjunction with measurements of stable isotope ratios (2H and 18O) in the plant, soil and groundwater and the matric potential of soils and plants, sapflow measurements can be used to estimate the spatial and temporal contribution of groundwater to total evapotranspiration (Cook and O'Grady 2006).
2.4. Identifying Water Sources Vegetation communities potentially have access to a range of water sources including groundwater, soil water, stream water or recent rainfall, and in many cases may use water from a variety of these sources simultaneously (Dawson and Ehleringer 1991; Dawson and Pate 1996; Zencich et al. 2002). Additionally, the volume of water sourced from these various pools may vary considerably in space and time. A detailed understanding of the water balance therefore requires not only accurate estimates of evapotranspiration, but also a detailed understanding of the spatial and temporal pattern of the use of different water sources. Over the last 20 years there has been a considerable increase in the number of studies using the stable isotopes of oxygen (16O and 18O) and hydrogen (1H and 2H or
Review of Australian groundwater discharge studies of terrestrial systems Page 16
deuterium) to help identify the various sources of water used in transpiration (see for example, Dawson and Ehleringer 1991; Thorburn et al. 1993; Dawson and Pate 1996; Zencich et al. 2002; O’Grady et al. 2006). Isotopic discrimination of water sources depends on the various pools of water having distinct isotopic signatures. These variations occur because of isotopic fractionation, caused principally by transport processes and phase transitions through the atmosphere, lithosphere and biosphere (Walker et al. 2001). The most important physical process governing the concentration of these isotopes in the various pools of water is evaporation (Burgess et al. 2000a). Evaporation enriches remaining water with heavier isotopic forms creating enrichment profiles within the soil. The stable isotopes of hydrogen and oxygen are not fractionated during the process of water uptake by plants (Thorburn et al. 1993), thus the isotopic composition of xylem water in plants reflects the isotopic composition of the sources of water accessed by the plants. In practice however, distinct differences in isotopic signatures between the various pools of water are often the exception rather than the rule. Typically isotopic profiles in soils tend to be gradational making interpretation of isotopic data problematic and the use of average soil isotopic values misleading. Furthermore, there is increasing evidence that root systems transport water both upwards and downwards in soil profiles (Burgess et al. 2000a) and this process helps to explain why isotope profiles in soils and plants don’t conform to simple patterns (Adams and Grierson 2001). Thus while measuring isotopic ratios in plant, soil and groundwater has been successfully used in isolation to assess plant sources of water, these techniques are more informative when used in conjunction with other measurements, such as soil matric potential profiles (Thorburn et al. 1993; Walker et al. 2001; Cook and O'Grady 2006).
The use of stable isotopes has the particular advantage of being easily used in natural systems or in remote locations. Although they may require frequent visits to the field to collect samples, they do not require the maintenance of sensitive equipment and in most cases involve little site disturbance (O'Grady et al. 2002). This has resulted in widespread application in ecophysiological studies aimed at assessing the importance of groundwater to ecosystem function, summarised in Table 4. Although these studies have not necessarily quantified amounts of groundwater discharge, they provide some important insights. Firstly, Table 4 demonstrates that groundwater use has been identified in most states and territories of Australia. Only one state, Tasmania, is not represented and this most probably reflects the absence of groundwater discharge studies rather than a lack of ecosystems using groundwater. Despite this, there have been relatively few studies quantifying the contribution of groundwater to ecosystems in Australia. The apparent prevalence of groundwater use in Australian ecosystems but scarcity of quantitative studies highlights the necessity of such studies being undertaken in the future. Secondly, it is often assumed that groundwater is a particularly important resource in arid regions and less important in wetter regions. However, from the studies summarised in Table 4, it is apparent that even in high rainfall regions groundwater may be an important source of water at certain times of the year. Drake and Franks (2003) and Lamontagne et al. (2005) both identified riparian ecosystems dependent on groundwater in high rainfall regions in northern Australia. Furthermore, O'Grady et al. (2006b) identified that Corymbia clarksoniana trees were accessing groundwater at depths of up to 10 m in remnant woodlands of the Pioneer Valley near Mackay in north Queensland. Riparian ecosystems feature prominently among those accessing groundwater resources (Mensforth et al. 1994; Thorburn et al. 1994; Drake and Franks 2003; Lamontagne et al. 2005; Pritchard et al. 2007; Costelloe et al. 2008). Woodlands are also well represented in Table 4 (Dawson and Pate 1996; Zencich et al. 2002; O'Grady et al. 2006b; Howe et al. 2007), highlighting the diversity of ecosystems containing species that access groundwater resources. Although these studies do not necessarily indicate that these ecosystems are groundwater dependent, it becomes apparent that groundwater use appears to be a widespread, but poorly quantified phenomenon in natural ecosystems.
Many studies have combined the use of stable isotopes with sapflow techniques to gain further insights into groundwater discharge (see for example Thorburn 1993; Cramer et al. 1999; O'Grady et al. 2006c). While the combination of these two techniques can provide significant advantages in quantifying the contribution of groundwater discharge to evapotranspiration, as discussed above, discriminating the water sources and identifying the

Review of Australian groundwater discharge studies of terrestrial systems Page 17
groundwater component can be difficult. Thorburn et al. (1993) used a linear mixing model to quantify the volume of water derived from groundwater. This approach assumes that there is a linear distance between to end members representing groundwater (a) and soil water (b), and in this model xylem water would have an isotopic signature somewhere intermediate of these two source (c). The volume of groundwater can then be determined as a function of the proportional distance along the line (Figure 3). The limitation with approaches such as this is the number of water sources that can be distinguished (only 3 when both the stable isotope ratios of hydrogen and oxygen are used). Furthermore, these approaches require distinct isotopic ‘end members’ for the different water sources. To overcome these limitations Cook and O'Grady (2006) developed a model that aimed to quantify water uptake from different depths in the soil profile. In the model, water extracted from different depths depends on the soil-to-leaf water potential difference, a rooting distribution function and a lumped hydraulic conductance parameter. The hydraulic conductance parameter is estimated from paired measurements of leaf water potential and transpiration (sapflow). Isotopic ratios in the soil and xylem are then used to constrain the root distribution function. Using this approach Cook and O'Grady (2006) were able to demonstrate varying degrees of groundwater use among species in remnant woodlands of the Pioneer Valley in North Queensland. Corymbia clarksoniana sourced up to 100% of its water requirements from groundwater, while species such as Lophostemon suaveolens and Eucalyptus platyphylla sourced approximately 15% of their water requirements from groundwater. This modelling approach allows a more quantitative assessment of the various water sources, can deal with gradational soil water isotope profiles, incorporates additional data on plant water potentials and is based on simple plant physiological process (Cook and O'Grady 2006).
Figure 3. Hypothetical example of mixing between two waters of a given isotopic composition (ie, A, B) to a third water (C). The line represents a ‘mixing line between A and B (from Thorburn et al. 1993).
C
A
B
18O (‰)
2H(‰)

Review of Australian groundwater discharge studies of terrestrial systems Page 18
Table 4. A summary of studies that have used stable isotope measurements to identify groundwater uptake and the species identified within those studies as accessing groundwater.
Study Rainfall
(mm yr-1)
Pan Evaporation
(mm yr-1)
Region Ecosystem Species
Mensforth et al. (1994)
260 2000 Chowilla SA Riparian E. camaldulensis
Thorburn et al. (1994)
260 2000 Chowilla SA Riparian E. camaldulensis
Dawson and Pate (1996)
873 South West WA Woodland B. prionotes
871 South West WA plantation E. globulus
871 South West WA Plantation E. camaldulensis
871 South West WA Woodland B. grandis
Cramer et al. (1999)
647 1640 Darling Downes, QLD
Plantation E. camaldulensis
Plantation C. glauca
Burgess et al. (2000a)
~390 Woodland B. prionotes
Zencich et al. (2002)
870 1843 Gnagara mound Woodland B. prionotes
Woodland B. ilicifolia
Drake and Franks (2003)
1680 Atherton tablelands, QLD
Dry rainforest
Doryphora aromatica
Dry rainforest
Castonospora alphandii
Lamontagne et al. (2005)
1073 2044 Daly River, NT Riparian forest
Melaleuca argentea
Riparian forest
Barringtonia acutangulata
O'Grady et al. (2006b)
1585 Pioneer Valley, QLD
Woodland Corymbia calrksoniana
Howe et al. (2007) ~300 3000 Ti Tree, NT Open woodland
Corymbia opaca
floodplain E. victrix
Pritchard et al. (2007)
312 3500 Pilbara WA Riparian E. victrix
Riparian M. glomerata
Costelloe et al. (2008)
168 3500 Lake Eyre Basin, SA
Riparian E. coolabah

Review of Australian groundwater discharge studies of terrestrial systems Page 19
2.5. Remote Sensing Approaches to Estimating Groundwater Discharge
Many of the methods described above can lead to high quality point estimates of groundwater discharge, and depending on how the various techniques are combined may also allow for detailed temporal resolution of groundwater discharge and a deeper understanding of the physical and biophysical processes controlling groundwater discharge. However, the spatial resolution of these techniques tends to be poor and there is increasing focus on the potential for water resources managers to estimate groundwater discharge via remote sensing techniques. The science of remote sensing has developed rapidly and remotely sensed products are available at a range of spatial and temporal scales. Application of these techniques to the estimation of groundwater discharge typically relies on spatially mapping estimates of evapotranspiration. Two approaches to estimating evapotranspiration are generally employed and these are reviewed in detail by Glenn et al. (2007). The first of these is empirical in nature and combines estimates of evapotranspiration derived from ground based plot measurements such as eddy co-variance flux towers or climate stations with temporal variation in vegetation indices derived from remotely sensed products. While the relationship between remotely sensed vegetation indices and landcover attributes such as leaf area index can be variable (Hill et al. 2006), there is still considerable potential for applying these indices within empirical scaling frameworks. Guerschman et al. (2009) used monthly values of the Enhanced Vegetation Index (EVI) and the Global Vegetation Moisture Index (GVMI) derived from the MODIS nadir bidirectional reflectance distribution function to scale Priestley-Taylor potential evapotranspiration data derived from climate surfaces. This approach was tested against observed estimates of evapotranspiration derived from 7 eddy covariance flux towers across Australia. Guerschman et al. (2009) observed good correlations between derived estimates of actual evapotranspiration and flux tower based estimates of evapotranspiration and used this approach to map estimates of actual evapotranspiration across Australia. Interestingly they also mapped the difference between mean precipitation and mean evapotranspiration, highlighting spatially areas where evapotranspiration exceeded rainfall, an approach that may help to identify the spatial extent and volume of groundwater discharge.
Physically based approaches use remotely sensed data to determine the components of the surface energy balance. Evaporation requires energy to convert liquid water to the vapour phase. The surface energy balance describes the partitioning of incoming energy into its various components and can be simplified as:
HGRE n
Where is latent heat of evaporation of water; Rn is net radiation (solar radiation minus outgoing shortwave and long wave radiation); G is the soil heat flux and H is the sensible heat flux to the atmosphere. Over vegetated surfaces E is often larger than G, or H and can be calculated as the residual if Rn, G and H are known. The principle is based on the requirement for the conservation of energy. This energy balance approach is used by ground based flux towers and thus provides a useful framework for comparing with remotely sensed derived surface energy balances (Glenn et al. 2007). Methods for the determination of the surface energy balance from remotely sensed data were first developed in the 1970s and have been extensively reviewed. Furthermore, Whitley and Eamus (2009) have recently reviewed in detail remote sensing approaches for estimating Penman-Monteith evapotranspiration at large spatial and temporal scales. As such we will not attempt to review this literature again here (but see for example: Diak et al. 2004; Glenn et al. 2007; Whitley and Eamus 2009).

Review of Australian groundwater discharge studies of terrestrial systems Page 20
One commercial algorithm receiving increasing attention for mapping groundwater discharge in Australia is SEBAL (Bastiaanssen et al. 1998a; Bastiaanssen et al. 1998b). The SEBAL algorithm is an empirical estimate of evapotranspiration based on field derived estimates of short wave atmospheric transmittance, surface temperature and vegetation height (Bastiaanssen et al. 1998a). SEBAL uses surface temperature (To), hemispherical surface reflectance, (ro) and Normalised Difference Vegetation Index (NDVI) and their interrelationships to infer surface fluxes for a variety of land surface types. A detailed description of the algorithm is given in Bastiaanssen et al. (1998a). The “innovative” component of the SEBAL algorithm is that it circumvents estimating true parameters of the aerodynamic surface temperature(Areo) and air temperature at the reference height (a) required in the calculation of sensible heat (H) by “self calibrating” them from areas of interest within the image. Thus “cool” pixels representing water surfaces are located within the image and SEBAL uses the apparent surface temperature of these pixels as the value at which to anchor sensible heat, H=O and ET = Rn. Similarly, “hot” pixels representing dry bare soil are located within the image. These pixels are assumed to have H=Rn-G and their apparent surface temperature anchors the value at which ET=0. The fractional values for H and ET contributing to Rn-G can then be calculated for each pixel from solar radiation by partitioning the surface into soil and vegetation (using NDVI) then assigning albedo values to each fraction and by estimating net longwave radiation from land surface temperature (Glenn et al. 2007; Kalma et al. 2008). Despite this simplification, calculation of H still requires input of resistances to heat diffusion from the canopy to atmosphere associated with molecular diffusion and momentum processes.
The SEBAL algorithm was developed for use with high resolution imagery and has primarily been tested in flat irrigated agricultural landscapes, making the approach of selecting “hot” and “cold” pixels within an image feasible. The typical high resolution imagery used is Landsat TM/ETM+ data, each image scene only covers 185 km by 185 km in spatial extent, with ETM+ data having 30 m and 60 m spatial resolution in the reflective and thermal bands, respectively. However, the need to select “hot” and “cold” pixels within an image also potentially limits its applicability. At larger spatial scales, such as for the entire Murray-Darling Basin (~ 138.25°E to 152.75°E and ~-24.5°S to ~-37.75°S or ~1400 km E-W and ~1475 km N-S) high-frequency, large-area imagery such as MODIS and/or AVHRR is needed which has a 1 km spatial resolution in the thermal bands. Over such a large area surface temperatures within the MODIS and/or AVHRR image are the result of more than just differences in evaporation rates alone (they will also be influenced by geographic position). Similarly, in environments where there is considerable local relative relief, such as in many forested areas within Australia, aspect (e.g., north vs south facing slopes) heavily influences the net radiation, and the elevation-driven environmental lapse rates also influence air temperature (McVicar et al. 2007) which is coupled to the surface temperature, potentially limiting the utility of the SEBAL algorithm in areas of high local relative relief (T. McVicar pers. comm.). When using thermal imagery to define ETa, the issues of geographic dependence and influences on relative relief of high-frequency, large-area imagery have been resolved by the development of the Normalised Difference Temperature Index (NDTI; (McVicar and Jupp 1999; McVicar and Jupp 2002)). However, the NDTI approach requires at least ~20 meteorological stations in imagery to constrain the spatial interpolation of the resistance energy-balance model output. This spatial interpolation is performed in a “calculate-then-interpolate” strategy using remotely-sensed based covariates. As such, the NDTI approach maybe less suitable than the SEBAL algorithm when using high resolution imagery such as Landsat TM/ETM+ data (depending on the number of meteorological stations within each 185 km by 185 km image). The strengths and weaknesses of various remotely sensed thermal-based methods to spatially estimate ETa are reviewed by Kalma et al. (2008). Furthermore, while the SEBAL algorithm is being heavily promoted in Australia there has yet been extensive evaluation of SEBAL under Australian conditions.

Review of Australian groundwater discharge studies of terrestrial systems Page 21
There is considerable opportunity for the application of these types of remote sensing approaches to the estimation of groundwater discharge, however there remain several limitations. Estimates of groundwater discharge are usually based on the difference between rainfall and actual evaporation (Guerschman et al. 2009) and are therefore highly sensitive to small errors in either rainfall or estimates of evapotranspiration. Estimates of evaporation derived from remotely sensed images represent an instantaneous estimate of evaporation and therefore must be scaled to daily, monthly or annual time steps and doing so potentially introducing errors (Glenn et al. 2007). Similarly, estimates of evaporation vary considerably depending on the formulation used. Donohue et al. (2009b) generated five different potential evaporation datasets for Australia spanning the years 1981-2006 using the Penman, Priestley-Taylor, Morton Point, Morton areal and Thornwaite formulations. They found considerable differences between the estimates, finding that models that included a full physical formulation (eg Penman) best captured spatial, annual and seasonal trends in evaporation.
3. GROUNDWATER DISCHARGE STUDIES
3.1. Discharge Through Soils Numerous techniques have been applied to quantify diffuse discharge through regional discharge zones, typically salt lakes or playas. Estimates of groundwater discharge rates vary from 1 to 180 mm yr-1 depending on the technique used, groundwater depth, aquifer and soil hydraulic properties. Generally, groundwater discharge from soils is modelled using analytical models with empirical approximations that describe water and solute movement under steady state conditions. However, groundwater discharge has been measured directly by water balance in the field (Wind 1955) and in laboratory columns (Gardner and Fireman 1958). It has also been inferred from chloride mass balance and soil physical properties, when irrigation and rainfall inputs were minimal and the soil profile was considered to be under steady state conditions (Talsma 1963).
Jacobson and Jankowski (1989) calculated groundwater discharge fluxes from the overall water balance in the Lake Amadeus Basin in central Australia. By assuming that groundwater inflows (2000 m3 day-1) were discharged evenly over the total playa surface (15km2) they determined that groundwater discharge by evaporation was 49 mm yr-1, in addition to local average annual rainfall of 275 mm yr-1. This water balance approach gives a very approximate, broad scale estimate of diffuse discharge; however, it does not advance our understanding of processes controlling discharge at the patch scale. Using laboratory soil columns, Zimmermann et al. (1967) showed that in a saturated sand undergoing evaporation, 2H enrichment of the soil water decreases exponentially with depth. Furthermore, Allison and Barnes (1983) showed that the isotopic profiles of moderately wet soils could be divided into two zones. In the upper zone, water movement is by vapour diffusion and in the lower zone liquid transport is significant. The maximum isotopic delta value is located at the transition between the liquid and vapour phases.
Barnes and Allison (1983) used isotope profiles to give an integrated measure of evaporation from groundwater discharge from Lake Frome, a normally dry salt lake in central Australia. Their initial estimate of long term average evaporation, based on a single 1 m deep 2H profile was 63 mm yr-1. In contrast, in a later study Allison and Barnes (1985) used a combination of isotope profiles and chloride profiles from five sites on lake Frome and estimated that evaporation rates ranged between 50 and 240 mm yr-1 depending on the site, method of determination, depth to water table and salt crust thickness
Using groundwater contours and a relationship between groundwater depth and evaporation rate Allison and Barnes (1985) calculated a mean evaporative flux over Lake Frome of between 170-180 mm yr-1. This is much lower than would be expected for almost saturated sediments; where the groundwater is less than 0.5m below the surface potential evapotranspiration rates are in the order of 3200 mm yr-1. They attributed this to a reduction

Review of Australian groundwater discharge studies of terrestrial systems Page 22
in the vapour pressure deficit due to sodium chloride saturation in the surface soil water and high albedo of the white salt crust. However, unless the thickness of the salt mulch is about an order of magnitude more than the thickness of the vapour transport zone in soils, discharge from salt flats should not be reduced to an extent which accounts for the difference in discharge between salt flats and soils (Thorburn et al. 1992b). The evaporation rate calculated for Lake Frome was similar to nearby Lake Torrens based on a hydrological balance (50 mm yr-1, Schmid 1985).
Chloride profiles can be used in a similar manner to stable isotope profiles to estimate integrated groundwater discharge rates. Soil chloride profiles are formed by the balance between downward diffusive flux of salt and the upward flux of soil water which results in a systematic and predictable distribution of soil solutes (Ullman 1985). Chloride and chloride/bromide ratio profiles were used to estimate evaporation from the Lake Eyre surface based on a single core drilled to 0.65 m depth (Ullman 1985). Using only the chloride profiles the average evaporation rate over approximately 20 years was between 9 and 20 mm yr-1.A further estimate of the evaporation was derived from the surface 0.06m of the core using the bromide chloride ratio profile. Using this approach, Ullman (1985) estimated that discharge was ~27 mm yr-1, highlighting the need to take a long-term estimate using isotopic and or chloride profiles. Ullman (1985) noted that these estimates were significantly lower than the 63 mm yr-1 reported by Allison and Barnes (1983) and the estimate of Allison and Barnes (1985) of between 50 and 240 mm yr-1 at Lake Frome. Again, Ullman (1983) attributed these differences to the mulching effect associated with the salt crust and higher albedo.
Table 5. Estimates of diffuse discharge through bare soils (from Holland 2002a).
Site Groundwater depth (m)
Discharge rate
(mm yr-1)
Measurement technique
Reference
Chowilla 4.0-4.5 9-11 2H profiles Jolly et al.(1993)
Lake Amadeus 49 Water Balance Jacobson and
Jankowski (1989)
Lake Eyre 2-3 9-20 Cl-/Br- profiles Ullman (1985)
South west Great Artesian Basin
<0.5 2.5-4.5 Cl- and 2H profiles Thorburn et al.(1992)
Lake Frome <0.5 63 2H profiles Allison and Barnes (1983)
170-180 2H profiles Allison and Barnes (1985)
5-30 Cl-/Br- profiles Ullman (1985)
Lake Torrens 50 Water balance Schmid (1985)

Review of Australian groundwater discharge studies of terrestrial systems Page 23
3.2. Floodplain Vegetation of the Lower Murray River The Chowilla floodplain forms part of the lower Murray River in South Australia. Typically the region is characterised by low rainfall, 260 mm yr-1, and high potential evaporation rates, > 2000mm yr-1. Rainfall tends to be uniformly distributed throughout the year, although total annual rainfall is highly variable. Forests cover approximately 48% of the floodplain with Eucalyptus camaldulensis dominating closer to the river (Thorburn et al. 1993) in less saline and more frequently flooded parts of the floodplain and E. largiflorens dominating at higher positions on the floodplains (Jolly and Walker 1996). The wetlands are an important Ramsar listed site. Construction of locks and weirs along the Murray River has altered the natural hydrological regimes and reduced the frequency and durations of medium and small flood events. The frequency of large flood has been reduced by a factor of about three. These flood events are important as they leach salts from the soil profile (Akeroyd et al. 1998). Furthermore, the installation of locks and weirs along the river has altered the natural flow regimes. As a result, normally ephemeral anabranch creeks have remained permanently flooded, resulting in increased groundwater pressures and raising the saline water table (Slavich et al. 1999, Overton et al. 2006). The higher water tables have resulted in increased discharge of the saline groundwater via evapotranspiration (Jolly et al. 1993). As a result, native vegetation communities on the Chowilla floodplain have been in decline for some time primarily because of salinisation of the floodplain soils (Jolly et al. 1993; Jolly and Walker 1996; Overton et al. 2006). Soils of the area, as described by Thorburn et al. (1993), consist of a medium textured sodic swelling clay (Coonambidgal clay) 1-2 m thick overlaying a deep sand (Monoman Formation) that can be up to 30 m thick and contains a saline groundwater that varies in depth of 2-4 m below the surface.
Mensforth et al. (1994) reported low leaf water potentials (-0.8 to -2.0 MPa) in trees on the same floodplain. A component of the low leaf water potential would have been related to the higher osmotic potential of the saline groundwater below these trees. They also demonstrated that pre-dawn leaf water potential was slightly (but significantly) lower in summer than in winter. Rainfall is predominately winter distributed in this region and trees were able to utilise recent rainfall to supplement their water use requirements (Thorburn et al. 1993).
Despite the negative impacts of rising groundwater on vegetation health in the Chowilla floodplain, both Eucalyptus camaldulensis and E. largiflorens rely to some extent on groundwater (
Table 6; Bacon et al. 1993; Thorburn et al. 1993; Mensforth et al. 1994), probably due to the low annual rainfall and high evaporation rates in the region. Thorburn et al. (1993) reported that although transpiration rates were low relative to evaporation (in the order of 0.3 mm day-
1), trees predominantly sourced their water requirements from groundwater. In that study, groundwater represented 40-100% of the water used for transpiration. Jolly and Walker (1996) found that the sources of water used by E. largiflorens varied considerably in both space and time. During periods of inundation, trees predominantly accessed recently recharged soil water, but reverted to using groundwater as soil water was depleted.
Groundwater dependence of vegetation on the Chowilla floodplain is a complicated process. Transpiration of saline water results in lowered leaf water potentials and concentration of salts within the rooting zone and further reductions in growth, leaf area and transpiration. Large flood events alleviate this situation by leaching salts from the soil profile resulting in higher transpiration rates and increased productivity (Akeroyd et al. 1998; Slavich et al. 1999). In between flooding events, E. camaldulensis and E. largiflorens rely on groundwater for maintenance water requirements. It is thought that large-scale transformations to the regional hydrology have altered the natural cycle of flooding and the associated leaching of salts from the soil profile resulting in eventual decline in tree health and increased tree mortality. Thus it has been proposed that lowering water tables would provide significant benefits to the vegetation of the floodplains (Overton et al. 2006). To explicitly test this hypothesis, the “Bookpurnong Experiment” was established on the Bookpurnong floodplain in the South Australian riverland to examine the response of vegetation health to lowered

Review of Australian groundwater discharge studies of terrestrial systems Page 24
water tables (Holland et al. 2008). In these studies, it was observed that trees lining the Murray River where groundwater was less saline used five times more groundwater and maintained higher canopy vigour than those further inland. Furthermore, it was observed that river Cooba trees, approximately 80 m from the river, increased transpiration rates in response to a lowering of the saline groundwater by approximately 0.65 m. In contrast, transpiration rates in the E. largiflorens trees at this site remained unchanged as did water use of trees at a site 170 m from the river that was underlain by highly saline groundwater (Doody et al. 2009).
Table 6. Summary of plant water use studies of blackbox (Eucalyptus largiflorens) and red gum (E. camaldulensis ) on the Chowilla floodplain (summarised by Holland 2002).
Groundwater Flooding
frequencyDistance to water
Groundwater uptake
Depth (m)
Salinity (dS m-1)
(%) (m) (%) (mm d-1)
E. largiflorens (Thorburn et al.1993)
BH 4.2 25 >1 in 13 ~200 44-100 0.13-0.3 BM 3.2 24 1 in 9.5-13 ~300 100 0.2 BT 4.2 33 1 in 9.5-13 ~25 51-100 0.1-0.2
(Akeroyd et al.1998) Site 1 1.7-3.5 55 1 in 13 ~300 0.03-0.2 Site 3 1.5-3.25 43 1 in 9.5-13 ~300 0.1-0.2 Site 4 0.8-2.2 46 1 in 9.5 ~300 0.15-0.35 Site 5 0.2-2.3 33 1 in 9.5 ~150 0.075-
0.25 Site 6 0.5-2.6 35 1 in 9.5-13 ~150 0.03-0.08
BH 1.6-2.6 13 >1 in 13 ~150 0.1-0.35 (Slavich et al.1999)
Site 1 4.0 55 1 in 20 ~300 0.1-0.4 (Streeter 1993)
BT 3.0 30 1 in 9.5-13 ~300 0-100 0.2-0.4 BU 3.0 60 1 in 9.5-13 ~300 0-10 0.05-0.1
E. camaldulensis (Thorburn et al.1993)
RM 3.0 8-10 1 in 7 40 58-100 1.0-2.0 (Mensforth et al. 1994)
A 2.3-2.5 28-30 1 in 3 20 30-100 B 2.8-2.9 36-39 1 in 3 30 51-100 C 2.7-2.9 33-50 1 in 3 40 M 3.0 8-10 1 in 3 40
Thorburn and Walker 1994 St=RC <2 8-10 1 in 1 5 0-<100 Ch=RE 2.5-3.0 8-10 1 in 7 5 40-63
ln 3.0 8-10 1 in 7 40 58-100 1.0-2.0 Bookpurnong Floodplain Doody et al. 2009* BO7 3.8 0.9-0.25** 20 208 BO8 3.6 53-0.85 ~90 46 BO9 3.8 58-1.0 ~130 32 * Note discharge numbers from Doody et al. (2009) are from a water balance of 241 days ** large declines in salinity in response to operation of the living Murray Salt interception scheme

Review of Australian groundwater discharge studies of terrestrial systems Page 25
3.3. Gnangara Groundwater Mound The Swan Coastal plain in south-west Western Australia has a highly seasonal Mediterranean climate. Summers are hot, dry and evaporative demand is high, however winters are wet and cool and evaporative demand is low. Despite the wet winters, on an annual basis, evaporation commonly exceeds rainfall. Underlying the Swan coastal plain are two important groundwater reserves that provide an important natural and economic resource (Dodd and Bell 1993a, Groom et al. 2001a). The Gnangara groundwater mound in the northern section of the plain covers an area of approximately 2200 km2 from the Swan River in the south to Moore River and Gingin Brook in the north. The soils in the mound are typically coarse sands, made up of the Bassenden and Spearwood dune systems. The sands have low water holding capacity, high saturated conductivity and low nutrient status. Winter dominated rainfall in conjunction with coarse textured soils result in groundwater being directly recharged by rainfall. This groundwater resource has become an important source of water for urban and agricultural uses (Groom et al.2000). However, levels in the aquifer have been declining since the mid 70’s due to a combination of below average rainfall, increased groundwater abstraction to meet domestic consumption by urban and agricultural users and expansion of Pinus pinaster plantations, which are assumed to have reduced net recharge to the groundwater system (Groom et al. 2000). As a result of declining groundwater levels, there has been considerable focus on understanding processes controlling the water balance of the mound. Much of this focus has been on the interactions of vegetation with groundwater on the Gnangara mound (Colquhoun et al. 1984; Farrington et al. 1989; Dodd and Bell 1993b; Burgess et al. 2000b; Groom et al. 2000a; Groom et al. 2000b, Zencich et al. 2002; Groom 2003; Veneklaas and Poot 2003; Canham et al. 2009). Fewer studies have actually quantified groundwater discharge (Farrington et al. 1989; Dodd and Bell 1993b).
Farrington et al. (1989) measured the total evaporation from a Banksia woodland with ventilated chambers and found no correlation of evapotranspiration with depth to groundwater between 4 and 12 m, indicating interactions with groundwater were not significant to site water balance. Similarly, Sharma et al. (1991) estimated recharge and evapotranspiration of a Banksia woodland from soil moisture changes and a zero flux plane method, and concluded that ET was a maximum of 87% of annual rainfall. However, this does not preclude groundwater use at certain times of the year. A number of other studies have demonstrated a strong dependence of the vegetation on the Gnangara mound on groundwater; the interaction between groundwater depth, rooting depth and plant water relations are thought to be a critical factor shaping the species distribution within these woodlands (Groom 2004).
3.3.1. Vegetative interactions with groundwater on the Gnangara Mound
Several studies have shown that differences in physiology between species or landscape positions reflect the degree of dependence on groundwater (eg Grieve 1956; Colquhoun 1986). Dodd and Bell (1993a) indentified that Banksia attenuata and B. menziesii, canopy species on the Swan Coastal Plain, were probably accessing groundwater. In support of this, they demonstrated that pre-dawn and midday xylem water potential remained high throughout the year despite estimated annual water use in these Banksia trees exceeding annual rainfall and the annual changes in soil water storage (over a 5 m profile). In addition, Dodd and Bell (1993b) also demonstrated that understory species in these communities showed a diversity of leaf water relations and water use. Species such as Stirlingia latifolia and Adenanthos cygnorum maintained high pre-dawn xylem water potentials throughout the year. Other species such as Eramaea pauciflora and Jacksonia floribunda exhibited high pre-dawn and midday xylem water potential early in summer and but had extremely low xylem water potentials by the end of summer. In general, they found that the late summer pre-dawn leaf water potential in 27 shrub species was inversely proportional to the depth of the rooting system. Groom (2003) demonstrated similar results for myrtaceaeous understorey shrub species. He studied shrub species associated with winter damplands and the adjacent uplands and found that there was a range of responses in leaf water relations. Species within the dampland were probably accessing shallow groundwater, indicated by high year-
Review of Australian groundwater discharge studies of terrestrial systems Page 26
round predawn leaf water potentials and stomatal conductance. However, upslope species such as Hypoclymma angustifolium and Eremeae pauciflora had significant reductions in pre-dawn xylem water potential and morning stomatal conductance in response to summer drought (Groom 2003), suggesting that they did not have access to groundwater.
Burgess et al. (2000a) clearly demonstrated seasonal patterns in the sources of water used by Banksia prionotes by measuring sapflow in lateral roots and the taproot. They showed that Banksia prionotes became increasingly reliant on deeper water sources during summer as shallow soils dried, reflected in a larger contribution to total tree water use by the main taproot. With the onset of winter rains, lateral roots became more important in water supply. Zencich et al. (2002) used a combination of isotopic measurements and heat pulse techniques to study the seasonal patterns of water use and sources of water in Banksia ilicifolia and B. attenuata. They found that both species were to some extent phreatopyhtic, but that groundwater usage varied between the species, season and positions in the landscape. Bansksia ilicifolia trees in damplands were highly dependent on groundwater during the summer with almost 100% of their water use requirements sourced from groundwater. With the onset of autumn rains there was a rapid switch in sources of water to predominant use of precipitation. In contrast, B. attenuata trees were less reliant on groundwater and more reliant on stored soil water although there was an increase in groundwater use during the summer. The amount of groundwater used was a function of position in the landscape. Banksia attenuata trees on dune crests did not show evidence of groundwater use even late in summer; however, trees on lower slopes and upper slopes were able to access some groundwater. Differences in the dependence on groundwater were again reflected in the seasonal leaf water relations of the two species. Dampland- associated B. ilicifolia maintained high leaf water potentials (>-0.5 MPa) in both summer and winter. By comparison, leaf water potential and water use of B. ilicifolia trees on the lower slopes was lower in all seasons than the same species growing in damplands, where water use was not only higher but less seasonally variable.
The physiological studies cited above demonstrate that vegetation communities on the Gnangara mound exhibit strong groundwater dependence during the hot dry summers. Groom et al. (2000a,b), Groom et al. (2001) and Groom (2003) have detailed the responses of these Banksia communities to changes in groundwater levels that resulted from groundwater abstraction or drought. Groom et al. (2000a) surveyed community structure and composition surrounding a production bore prior to the bore becoming operational. Two years after abstraction commenced and in combination with below average rainfall, groundwater levels were more than two metres below the pre-abstraction levels. They recorded death in up to 80% of the canopy individuals and over 60% of understorey individuals within 200 m of the bore, noting that B. ilicifolia were particularly sensitive to the impacts of groundwater abstraction. In contrast, there were no changes in community structure and composition over the same time period at a long-term monitoring site not affected by groundwater abstraction (Groom et al. 2000a). Groom et al. (2000b) also studied the impacts of groundwater abstraction on myrtaceous species in long-term monitoring transects at two sites, established to assess the impacts of encroaching pine plantations and increased groundwater abstraction. They found that over 20 years, groundwater levels in bores near the monitoring transects were lowered by up to two metres and that at least at one site, myrtaceaceous shrub abundance had declined in response to lowered groundwater levels. For overstorey species in the same transects, trends were more obvious. Groom et al. (2001) observed that canopy condition in B. attenuatta and B. menziesii declined over time and that B. attenuata shifted its distribution, encroaching downslope towards shallower water tables. The loss of crown condition with falling groundwater level was largest in damplands, and B. littoralis populations declined and were replaced by the more drought tolerant B. prionotes (Groom et al. 2001).
Froend and Drake (2006) suggested that observed differences in xylem cavitation vulnerability between Banksia species could used to predict the critical thresholds of response to groundwater depletion. However, Canham et al. (2009) found that cavitation threshold was a plastic trait in some Banksia species, and the degree of plasticity also reflected how dependent species were on groundwater. They found that where water was

Review of Australian groundwater discharge studies of terrestrial systems Page 27
not limiting, all species were similar in their vulnerability to xylem embolism. This vulnerability did not change with landscape position for B. ilicifolia, an obligate phreatophyte. But B. attenuata and B. menziesii, both facultative phreatophytes, were more resistant to xylem embolism at drier sites than at shallow groundwater sites. This demonstrates that hydraulic traits could be used as an indicator to assess the extent of groundwater use by vegetation, but that these traits may vary spatially or seasonally.
3.3.2. Groundwater discharge on the Gnangara Mound
Despite the number of studies on the interactions between vegetation and groundwater on the Gnangara Mound, only two have actually quantified groundwater discharge (Table 7). Farrington et al. (1990) measured the annual evapotranspiration from dampland vegetation with ventilated chambers, and calculated that 67 mm of the water balance was from groundwater uptake. Dodd and Bell (1993a) calculated transpiration of a Banksia overstorey with the Penman-Monteith equation and estimated that annual ET was 64 mm higher than rainfall.
It has been assumed that the Pinus pinaster plantations on the Gnangara mound are also using groundwater but there are no published estimates of groundwater discharge to confirm this. (Butcher and Havel 1976) compared pine plantations on sites with deep and shallow groundwater, and found growth was relatively independent of stocking density at the shallow groundwater site. They concluded that this was because the plantations used groundwater, which lead to greater growth and less dependence on stocking density. It is estimated that expansion of Pinus pinaster plantations is responsible for approximately 30% of the reduction in groundwater level on the mound (Xu 2008), having lower recharge compared to the native Banksia woodland (Farrington and Bartle 1991). It is not known if the reduction in net recharge is partially due to direct uptake of groundwater by the pine plantations, but the CSIRO has recently completed a water balance and isotopic study to assess this, which is shortly due for release (Silberstein pers. comm.). There is evidence that pines on the Gnangara mound are using groundwater, as transpiration rates during summer were higher for shallow groundwater sites (less than 10 m) than for deep groundwater sites (Walker 2006). However, regardless of groundwater depth the annual water use was low in comparison to other vegetation types (including native Banksia woodland at similar locations), which was attributed to a strong stomatal response to vapour pressure deficit (Walker 2006).
Table 7. Summary of groundwater discharge studies on the Gnangara mound in south west Western Australia.
Community Rainfall
(mm yr-1) Pan Evaporation(mm yr-1)
LAI Groundwater depth (m)
Measured ET (mm yr-1)
Groundwaterdischarge (mm yr-1)
Farrington et al. (1990)
Melaleuca dampland
772 1843 2-3 814 67
Dodd and Bell (1993a)
Banksia woodland
635 1843 0.67* 6-7 635 64
*overstorey LAI only
3.4. Western Australian Wheatbelt
Secondary salinity is of major concern for the Western Australian wheatbelt and considerable research has been focussed on this problem for some time (Peck and Hatton 2003). The

Review of Australian groundwater discharge studies of terrestrial systems Page 28
pre-clearing hydrology of the Western Australian wheatbelt region was characterised by highly variable rainfall, long dry summers, low hydraulic gradients, intermittent surface flows and high regolith salts loads (Hatton et al. 2002). Large scale land clearing of the deep rooted perennial vegetation and replacement with annual cropping systems has fundamentally changed the hydrology of the region and resulted in rising water tables and the development of large areas of secondary salinity (Hatton et al. 2002). Reintroducing deep rooted perennial vegetation into the landscape has been promoted extensively as an effective technique for managing water logging and secondary salinity (Marshall et al. 1997), as a result there have been numerous studies of the tree water use and groundwater discharge within the region (see examples in Table 8).
As stated earlier, George et al. (1999) reviewed the impacts of revegetation with deep rooted perennials on groundwater levels from more than 80 sites in the wheatbelt of Western Australia. They found evidence of groundwater uptake by vegetation at discharge sites (i.e. sites with shallow water tables), especially where the groundwater salinity was low. Although net recharge appeared to be reduced by revegetation (as evident in the falling water tables), George et al. (1999) did not distinguish between the impacts of revegetation on gross recharge and discharge.
Revegetation has commonly been in the form of widely spaced belts of various Eucalyptus species, often of mallee form, spaced between alleys of annual crop or pasture. Growing in this configuration, the trees have rapid and extensive root growth, with significant depletion of soil moisture up to 35 m away from the belts and vertically down to 10 m within 7 years (Robinson et al. 2002; Sudmeyer and Goodreid 2007). By measuring changes in soil water contents and gradients in water potential Eastham et al. (1994) found that there was upward water movement from groundwater at 8 m depth beneath belts of various Eucalyptus species, but that this was only equivalent to between 10 mm and 30 mm yr-1, or less than 5% of evapotranspiration. Others have found higher discharge rates from eucalypts planted over shallow water tables at similar sites. For example, at a nearby site, Wildy et al. (2004) calculated that an oil mallee belt derived 120 mm yr-1 from groundwater at 5 m depth, or 30% of evapotranspiration (430 mm yr-1). Wildy et al. (2004) calculated the water balance over the ground area occupied by the tree belt plus 15 m into the adjacent pasture (the lateral extent of tree roots). At a nearby site, Carter and White (unpublished data) calculated a water balance over just the area occupied by an oil mallee belt and found that groundwater uptake was 515 mm yr-1, which was again equivalent to 30% of evapotranspiration. Similarly, at a higher rainfall and lower evaporation site, White et al. (2002) estimated that belts of Eucalyptus saligna, E. camaldulensis, E. leucoxylon and E. platypus obtained 150 mm, or 25% of evapotranspiration, from groundwater (calculated only over the tree belt area).
Even higher proportions of evapotranspiration were derived from groundwater by belts of tagasaste (Chamaecytisus proliferus) at a site in the northern wheatbelt of WA. Lefroy et al. (2001) quantified groundwater uptake with a water balance study combined with stable isotope measurements in plant, soil and groundwater. They estimated that up to 70% of evapotranspiration was sourced from groundwater at 10 m depth. The water balance was calculated over an area occupied by the tagasaste and the adjacent pasture, but recalculating to obtain numbers for the tagasaste only (as the pasture was not using groundwater), this equated to 610 mm yr-1 being drawn from groundwater.
Salt tolerant species have been planted above or near saline seeps. George (1990) estimated from hydrograph separation that blocks of 4-year-old Eucalypts planted upslope from a saline groundwater seep used 172 mm of groundwater yr-1 (ranging in salinity from 5 to 15 dS m-1). Marshall et al. (1997) found that the water use of E. camaldulensis clones above saline groundwater (data not shown for groundwater salinity), was always significantly higher than rainfall. It varied between clones, and was greater with decreasing salinity, but average groundwater use for the plantation was 64 mm yr-1. Greenwood and Beresford (1980) measured high evapotranspiration rates from saltbush (Atriplex) with ventilated chambers. Their measurements were only for a short time, but they suggested from a coarse extrapolation of results that the saltbush would use approximately 250 mm yr-1 of the shallow (1 m depth), highly saline (30 dS m-1) groundwater.

Review of Australian groundwater discharge studies of terrestrial systems Page 29
There is uncertainty around the sustainability of groundwater use in the wheatbelt where groundwater levels are artificially elevated and often saline. Firstly, revegetation and the resultant reduced recharge and/or increased discharge results in lowering of water tables, which could cause vegetation to lose root contact with groundwater. Secondly, uptake from saline groundwater may result in the concentration of salts in the root zone which may decrease water uptake and threaten the survival of vegetation (Heuperman 1999).
Groundwater discharge from vegetation in the Western Australian wheatbelt is also limited by the proportion of land that is revegetated. Typically, only small proportions of paddocks are planted to deep rooted species, mostly less than 30% (George et al. 1999), as traditional agriculture with shallow rooted annuals remains most profitable for farms. Therefore, although rates of groundwater uptake by deep rooted vegetation may be high over the planted area, when integrated over the entire landscape this may be insignificant. However, with increasing interest in growing trees for bio-fuel production and carbon trading (Bartle et al. 2007), as well as alternative tree crops such as sandalwood, more land may be planted to woody perennials. Therefore, knowledge of the impact of trees on groundwater, particularly high value fresh groundwater, may become more important.
Table 8. Groundwater discharge estimates from tree belts in the Wheatbelt of Western Australia.
Community Rainfall
(mm yr-1) Pan
Evaporation (mm yr-1)
LAI Groundwater depth (m)
ET (mm yr-1)
Groundwater discharge (mm yr-1)
White et al. (2002)-water balance
Mixed Eucalypt 445 1350 2.45 5 595 150 Marshall et al.(1997)-water balance
E. camaldulensis 432 2032 1 1148 64 George (1990)-hydrograph separation Mixed Eucalyptus
330 2600 1 172
Carter and White (unpublished)-water balance E. kochii 380 1690 2.7 5 1539 515 Eastham et al. (1994)-soil water content measurements Mixed Eucalyptus
350 2300 8 300-600
10-30
Lefroy et al. (2001)-water balance and isotopes Chamaecytisus proliferus
370 10 975 610
Wildy et al. (2004)-water balance E. kochii 320 2000 4.2 5 435 118 E. camaldulensis 350 2302 3.7 443 59
3.5. Jarrah Forest In Western Australia, there has also been interest in the water balance of the jarrah (Euclalyptus marginata) forest surrounding Perth, as these forests cover much of the dam

Review of Australian groundwater discharge studies of terrestrial systems Page 30
catchment areas for urban water supply. Significant areas of forest were cleared for mining and subsequently revegetated, so much of the interest has focused on comparing the water balance of the native forest with the revegetation. In addition, fire management and forest thinning have been proposed as methods of increasing water catchment, prompting more attention on the processes affecting forest water use.
Eucalyptus marginata maintains high rates of transpiration throughout the year, and throughout the day in summer, with little variation in leaf water potential, indicating that this species accesses deep soil water or groundwater (Grieve 1956; Doley 1967; Colquhoun et al. 1984). Measurements of transpiration and leaf water status by Doley (1967) indicated that soil moisture was not limiting, despite very low water content in the 45 cm of soil above a 1 m thick lateritic hardpan, suggesting that the roots were able to penetrate the laterite to deeper water. Carbon et al. (1981) found that leaf water potential and transpiration were higher in jarrah with a water table at average depth of 15 m, compared to 10 sites without a water table. In an earlier study, Carbon et al. (1980) found jarrah roots throughout the soil profile down to a water table at 15 m depth, and apart from a higher concentration in the top 1 m of soil, the root length density was relatively constant with depth. Dell et al. (1983) have observed E. marginata roots at depths of up to 40 m in south west of Western Australia. Silberstein et al. (2001) found that despite decreased soil moisture from 0 – 25 m depth, and reduced leaf area (both by one third in comparison to spring values), jarrah maintained high transpiration rates during summer, at 78% of equilibrium evapotranspiration (i.e. that from a saturated surface). This reflects use of deep soil moisture and possibly groundwater; they did not measure groundwater uptake, but they did found roots at the water table in a piezometer at 35 m depth.
In contrast to these other studies, Farrington et al. (1996) suggested that groundwater uptake by jarrah might be limited by water table depth. They estimated groundwater uptake by comparing the ratios of hydrogen and deuterium in twigs, rain water, soil water and groundwater. Their results indicated that trees were using groundwater at a site where the water table was 6 m below the surface, but not at sites with groundwater at 14 m and 30 m.
To our knowledge, the only quantification of annual groundwater uptake from jarrah forest is from Sharma (1984). They measured the water balance of an E. marginata and E. callophylla forest at various sites with groundwater between 6 m and 20 m depth, and found the average net groundwater uptake over three years was only 10 mm, or 1% of annual rainfall. During the dry period between October and March the maximum groundwater uptake was 30 mm.
3.6. Plantations in the “Green Triangle” The economy of south east South Australia is largely dependent on primary production and related industries including forestry and forest products. In 2008, there was approximately 330 000 hectares of plantation forestry within the green triangle (Gavran and Parsons 2009). Although pine plantations have been grown in the region for over 100 years there has been rapid expansion of the hardwood forestry industry over the last decade. Hardwood forestry is dominated by E. globulus plantations and in 2008 these comprised approximately half of the total area of plantations in the green triangle. This rapid expansion of plantations within the region has raised concerns for the region’s water security and there has been considerable effort focused on understanding the impacts of these plantations of the regions water balance, as in south east South Australia most of the water resources for town water use, irrigation and industry are drawn from groundwater (Benyon and Doody 2004).
The soils of the region are generally light textured and permeable and overlay a highly permeable karst limestone. Ninety five percent of the available groundwater resource occurs in highly transmissive, unconfined or semi-confined aquifers which are commonly less than 20 m below ground level. There are few permanent streams or surface water bodies and most of the rainfall not returned to the atmosphere via evapotranspiration recharges the aquifers (Benyon et al. 2006). Depth to water tables varies as both a function of topography and season. The region where most of the blue gum plantations have been established is characterised by an extensive dune swale system with large areas of low lying flats interspersed by dunes 10-20 m above the surrounding plains running in a NW to SE

Review of Australian groundwater discharge studies of terrestrial systems Page 31
direction. Water tables vary seasonally and respond to the highly seasonal environment with respect to rainfall and evaporation. Rainfall tends to be winter dominated and is highest and evaporation lowest in the period from late autumn to early spring (Benyon and Doody 2004); although on an annual basis evaporation exceeds rainfall, from May to August rainfall tends to exceed evaporation so that recharge tends to be winter dominated (Benyon et al. 2006).
There has been extensive research into the impacts of plantations on water resources in the green triangle over the last decade. As part of this research effort, groundwater discharge by plantations in the green triangle region has been extensively studied. The outcomes of these investigations are described in detail by (Benyon 2002; Benyon and Doody 2004; Benyon et al. 2006). Early studies of water use in plantation forests in the green triangle were conducted by (Teskey and Sheriff 1996). They examined water use in Pinus radiata plantations near Mount Gambier and found that rates of water use varied between 1.4 and 6.8 mm day-1. They also observed that two thirds of annual stand transpiration of 346 mm was derived from below 1 m depth. Teskey and Sheriff (1996) note that although groundwater depth at this study site was 8-10 m, predawn leaf water potentials varied between -0.6 and -1.0 MPa and given enough time, these water potentials are low enough to lift water from considerable depth implying that groundwater may be an important source of water in these plantations. However, subsequent research by Benyon et al. in the region found that this was probably unlikely given the depth to the water table.
Benyon and Doody (2004) examined water use by E. globulus plantations over a three year period in sixteen plots in the green triangle with varying depths to groundwater of less than 2 m to approximately 20 m. They observed that at sites where depth to the water table was less than 6 m plantations obtained a significant proportion of their water from groundwater, varying from 107 mm yr-1 to 636 mm yr-1 (average of 435 mm yr-1) and representing 13-63% of total water use. Furthermore, plantations with access to groundwater had significantly higher current annual increments (CAI, 43 m3 ha-1 yr-1) than those without access to groundwater (CAI, 23 m3 ha-1 yr-1). However, Benyon and Doody (2004) note that high CAI was not necessarily a good indicator of access to groundwater as at least one site in their study had a high CAI but did not appear to have access to groundwater. Similarly, although plantations with access to groundwater had a higher average leaf area index (LAI), there was considerable overlap in LAI between plantations with and without apparent access to groundwater. Plantations with access to groundwater had a higher transpiration rate per unit leaf area than those without access to groundwater (Benyon et al. 2006). Sites where groundwater use was high were characterised by closed canopies, were located in light textured soils with no impediments to root growth and were overlying a water table of low salinity in a highly transmissive aquifer (Benyon and Doody 2004). A summary of groundwater discharge studies for the green triangle region is shown in Table 9.

Review of Australian groundwater discharge studies of terrestrial systems Page 32
Table 9. Summary of the groundwater discharge estimates from Eucalyptus globulus and Pinus radiata stands in the green triangle from Benyon and Doody (2004) and Benyon et al. (2006).
Species Rainfall
(mm yr-1)
Potential ET
(mm yr-1)
LAI Observed ET
(mm yr-1)
Water Table depth
(m)
Groundwater Discharge
(mm yr-1)
Benyon and Doody (2004)-water balance
E. globulus 666 1250 3.7 1059 1.7 413
E. globulus 740 970 3.5 847 1.7 107
E. globulus 713 1230 4.1 1158 1.9 440
E. globulus 567 1180 3.1 1193 3.0 636
E. globulus 713 980 3.7 904 3.2 226
E. globulus 713 980 3.5 713 10.3 2
Benyon et al. (2006)-water balance
P. radiata 362 1340 1074 3.9 671
P. radiata 747 1230 1343 6.0 561
3.7. Groundwater Use in the Shepparton/Riverina Region There has been a long history of irrigated agriculture within the Riverina region straddling the NSW and Victorian border. As a result, water tables have risen from about 30 m below the surface prior to clearing and irrigation, to in many cases 2-3 m from the surface (Heuperman 1999; Polglase et al. 2002). Plantations have been extensively established in the region as a measure for controlling water tables and include Eucalyptus camaldulensis, E. grandis, Casuarina cunninghamiana and Corymbia maculata.
Morris and Collopy (1999) examined groundwater uptake and associated salt accumulation under E. camaldulensis and C. cunninghamiana plantations in the Shepparton region of northern Victoria. They found that although C. cunninghamiana had a lower sapflux than E. camaldulensis it had a larger sapwood area. As a result, annual stand water use for the two species was similar (339 and 359 mm yr-1 for E. camaldulensis and C. cunninghamiana respectively). Using daily water table depth observations they parameterised a water balance model to estimate the volume of stand water use derived from groundwater, estimated to be 170-220 mm yr-1, or more than half of the annual water use. Similarly Heuperman (1999) estimated that approximately 50% of tree water use was sourced from the groundwater (i.e. 430 mm yr-1), although stand water use was estimated to be more than twice that observed by Morris and Collopy (1999). Morris and Collopy (1999) also observed that electrical conductivity (indicating salinity) of the soil solution rose by over 5 dS m-1 during the 32 months of the study. These observations were consistent with those reported by Heuperman (1999) who observed significant salinisation and a reversal of hydraulic gradients under E. grandis plantations in nearby Kyabram. Heuperman (1999) attributed this salinisation to the low permeability of the soils in the root zone.
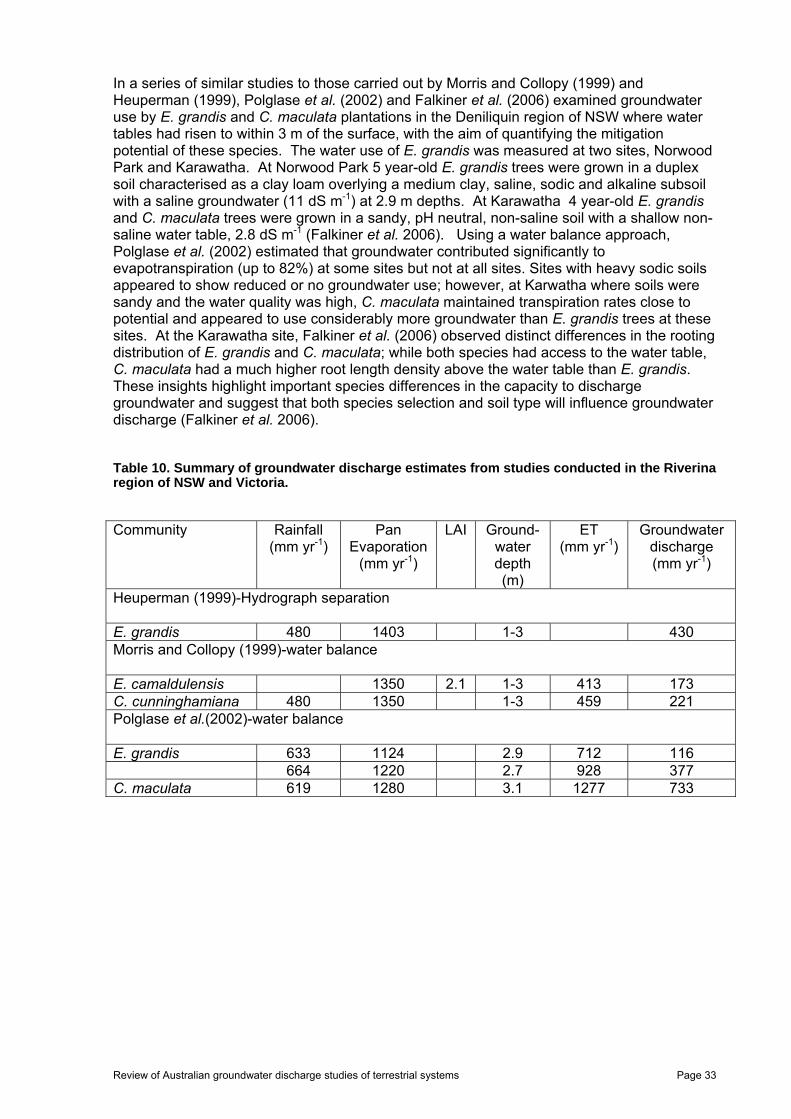
Review of Australian groundwater discharge studies of terrestrial systems Page 33
In a series of similar studies to those carried out by Morris and Collopy (1999) and Heuperman (1999), Polglase et al. (2002) and Falkiner et al. (2006) examined groundwater use by E. grandis and C. maculata plantations in the Deniliquin region of NSW where water tables had risen to within 3 m of the surface, with the aim of quantifying the mitigation potential of these species. The water use of E. grandis was measured at two sites, Norwood Park and Karawatha. At Norwood Park 5 year-old E. grandis trees were grown in a duplex soil characterised as a clay loam overlying a medium clay, saline, sodic and alkaline subsoil with a saline groundwater (11 dS m-1) at 2.9 m depths. At Karawatha 4 year-old E. grandis and C. maculata trees were grown in a sandy, pH neutral, non-saline soil with a shallow non-saline water table, 2.8 dS m-1 (Falkiner et al. 2006). Using a water balance approach, Polglase et al. (2002) estimated that groundwater contributed significantly to evapotranspiration (up to 82%) at some sites but not at all sites. Sites with heavy sodic soils appeared to show reduced or no groundwater use; however, at Karwatha where soils were sandy and the water quality was high, C. maculata maintained transpiration rates close to potential and appeared to use considerably more groundwater than E. grandis trees at these sites. At the Karawatha site, Falkiner et al. (2006) observed distinct differences in the rooting distribution of E. grandis and C. maculata; while both species had access to the water table, C. maculata had a much higher root length density above the water table than E. grandis. These insights highlight important species differences in the capacity to discharge groundwater and suggest that both species selection and soil type will influence groundwater discharge (Falkiner et al. 2006).
Table 10. Summary of groundwater discharge estimates from studies conducted in the Riverina region of NSW and Victoria.
Community Rainfall (mm yr-1)
Pan Evaporation
(mm yr-1)
LAI Ground-water depth (m)
ET (mm yr-1)
Groundwater discharge (mm yr-1)
Heuperman (1999)-Hydrograph separation
E. grandis 480 1403 1-3 430 Morris and Collopy (1999)-water balance
E. camaldulensis 1350 2.1 1-3 413 173 C. cunninghamiana 480 1350 1-3 459 221 Polglase et al.(2002)-water balance E. grandis 633 1124 2.9 712 116 664 1220 2.7 928 377 C. maculata 619 1280 3.1 1277 733

Review of Australian groundwater discharge studies of terrestrial systems Page 34
4. DISCUSSION The National Water Initiative (2004) explicitly recognises groundwater resources as being part of the nation’s natural capital and has an agenda to:
Restore sustainable water balance to over-allocated systems Assess impacts on surface water and groundwater resources Increase security of water access entitlements Trade water to achieve most profitable use and environmental outcomes Address land use change.
Thus, water resources managers have a legislative requirement to include groundwater resources within their water plans. Despite this, there is very little quantitative information available to water resources planners upon which to make decisions on the rates of groundwater recharge and discharge. In this review, we have collated water balance studies from around Australia that have quantified a contribution from groundwater to total evapotranspiration. The data that has been compiled in this review has been sourced from the scientific literature and national and state agency reports. To the best of our knowledge there have only been two previous reviews of this type in Australia. Thorburn (1996) reviewed data on the rates of groundwater uptake from plants in saline areas and Benyon et al. (2006) reviewed the groundwater use of commercially important plantations species with a particular focus on plantations in the green triangle region of south east South Australia. This review builds on these previous reviews and reports findings from hydrological and ecophysiological investigations from around the country.
One of the most important findings of this review is that estimates of groundwater discharge are rare for the Australian mainland. Most of the discharge data presented in this review has been sourced from detailed investigations of the plot scale water balance, making it difficult to make generalisations about regional scale discharge processes. In addition to this, these detailed plot scale studies are typically conducted for relatively short time frames of 1-2 years, again making it difficult to glean insights into the temporal variability of groundwater discharge. In many studies, not all the terms in the water balance have been quantified. For example in many studies evaporative losses associated with interception are estimated using common “rules of thumb”, e.g. 5-10% of rainfall, thus it is difficult to place levels of uncertainty on the estimates of groundwater discharge.
The vast majority of discharge studies reported in this review were focussed on understanding the role of trees in remediating degraded, and in particular saline, agricultural landscapes. As a result, most of the studies reported in this review are from regions where the water tables are shallow (< 5m). Despite this limitation estimates of groundwater discharge are reported for most states in Australia (Figure 4). We could find no estimates of groundwater discharge in Tasmania or the ACT. In the Northern Territory, there was only one estimate of groundwater discharge and this was for riparian forests in the Daly River region. At best this estimate is a back of the envelop estimate of groundwater discharge from a riparian forest (O'Grady et al. 2002). The vast majority of quantitative discharge studies are concentrated in southern Australia. There are few estimates of groundwater discharge from perennial agriculture, despite considerable research into the effects of perennial pastures on the water balance (see for example, Dunin 2002; Ward and Micin 2006).

Review of Australian groundwater discharge studies of terrestrial systems Page 35
Figure 4. The distribution of groundwater discharge studies around Australia.
There have been very few quantitative studies of groundwater discharge in native ecosystems within Australia and these have been restricted to the Gnangara mound in Western Australia and the Chowilla floodplain in South Australia. This is despite considerable evidence from ecophysiological studies from around the country that groundwater may be an important component of evapotranspiration in native ecosystems (Figure 5). The Gnangara mound in Western Australia has been the focus of intense ecological and ecophysiological research over the last 20 years (see for example, Farrington et al. 1989; Dodd and Bell 1993b; Groom et al. 2001; Zencich et al. 2002; Froend and Drake 2006; Canham et al. 2009). Despite the high value of this resource for urban water supply, there have been only two studies that have quantified groundwater discharge through the native vegetation (Farrington et al. 1990; Dodd and Bell 1993a). Interestingly, the estimates of groundwater discharge in both studies were very similar despite being from distinctly different elevations in the landscape, 67 and 64 mm yr-1 respectively. Similarly, despite anecdotal evidence of the expanding Pinus pinaster plantations using significant quantities of groundwater, this has not been quantified until recently (~ 200 mm yr-1, Silberstein pers. comm.) The studies of the E. camaldulensis/E largiflorens forests of the lower Murray River (especially the Chowilla floodplain) in South Australia are probably the most comprehensive studies of vegetation and groundwater interactions in the country and integrate research spanning almost 20 years (Thorburn et al. 1992a to Doody et al. 2009).

Review of Australian groundwater discharge studies of terrestrial systems Page 36
Figure 5 Distribution of ecophysiological studies that have identified groundwater as a contributor to evapotranspiration.
Rates of groundwater discharge are highly variable across Australia. The processes governing the soil limited groundwater discharge are reasonably well understood and a summary of this knowledge has been presented in this review (Sections 2.1 and 3.1). Groundwater discharge at steady state through soils is known to vary exponentially with soil depth and as function of soil texture but can be as high as 500 mm yr-1 at sites with shallow water tables (<2 m, Thorburn 1996). The processes controlling groundwater discharge through vegetation are less well understood. Based on studies reported in this review, groundwater discharge varies from 2 mm yr-1 (E. globulus plantations, Benyon and Doody 2004) to more than 700 mm yr-1 (Corymbia maculata trees in Polglase et al. 2002). This range of discharge estimates is larger than that previously reported by Thorburn (1996) who cited studies where groundwater discharge varied between 10 and 440 mm yr-1 and highlighted that despite popular misconceptions, rates of groundwater discharge from vegetation were similar to that reported for soils. This observation, however, fails to recognise trees have the capacity to tap into and use significant quantities of groundwater at depth, and in this review we cite evidence for high rates of groundwater discharge. In one case groundwater contributed up to 100% of ET, i.e. in E. camaldulensis forests on the Chowilla floodplain in South Australia (although total ET was low, Thorburn et al. 1993). Furthermore, at one site in the study of Polglase et al. (2002) evapotranspiration of C. maculata at 1277 mm matched potential evaporation (1280 mm), and of this, 57% of was sourced from groundwater (733 mm). In this study, the groundwater was shallow (~3 m depth) and the salinity was low (2.8 dS m-1). Furthermore, soils were light textured and there were no impediments to root growth within the soil profile (Falkiner et al. 2006). This combination of soil properties, water quality and depth are an ideal situation for high rates of groundwater discharge
4.1. Impact of Water Table Depth and Groundwater Salinity on Groundwater Discharge
The relationship between water table depth and groundwater uptake is shown in Figure 6. Where water table depths are less than 5 m, rates of groundwater discharge vary between 2 and 733 mm yr-1. From Figure 6 it is apparent that there is no general relationship between

Review of Australian groundwater discharge studies of terrestrial systems Page 37
depth to water table and groundwater discharge. There is some indication that, other than for two studies, groundwater uptake is very low when water table depths are deeper than 5 m. This observation appears to be consistent with the findings of Thorburn (1996) and the Benyon et al. (2006) study of plantation water use in the Green Triangle, who both found similar depth thresholds for groundwater uptake. Together these observations are also consistent with the Cannadell et al. (1996) global review of rooting distribution. In that review, the average rooting depth for species from arid environments was 5.2 m. Despite these observations, the data presented in this report highlights some important exceptions to this generalisation. In particular, Pinus radiata with a depth to water table of 6 m, had groundwater discharge 561 mm yr-1 (Benyon et al. 2006) and Chamaecytisus proliferus used 610 mm yr-1 of groundwater at 10 m depth (calculated from data in Lefroy et al.2001). In addition, global reviews of rooting distributions (Cannadell et al. 1996; Jackson et al. 1996) suggest that roots have the capacity to explore soil profiles to much greater depths. Within Australia, for example, Dell et al. (1983) observed E. marginata roots at depths of up to 40 m and Howe et al. (2007) found evidence of Corymbia opaca trees in central Australia using groundwater at sites where water tables were in excess of 20 m deep. Neutron moisture meter studies in south west Western Australia indicate that E. globulus plantations extract soil water to depths of more than 10 m (Don White, pers. comm.). Thus, the apparent 5 m threshold observed in Figure 6 more likely reflects a lack of quantitative groundwater discharge studies at sites with deep water tables than a threshold type response to groundwater uptake as implied by Thorburn (1996) or Benyon et al. (2006).
0
100
200
300
400
500
600
700
800
0 2 4 6 8 10 12 14
Depth to water table (m)
Gro
un
dw
ate
r dis
cha
rge
(m
m y
r-1)
Figure 6. The influence of depth to water table on groundwater uptake for discharge studies around Australia.
For groundwater discharge sites where water tables were less than 5 m deep, there was considerable variability in groundwater uptake rates. Again this observation is consistent with that of Thorburn (1996). This result is highlighted by results reported in Polglase et al. (2002) where rates of groundwater discharge varied from 0 to more than 700 mm yr-1 within

Review of Australian groundwater discharge studies of terrestrial systems Page 38
the same region and at sites with similar depth to water table. This considerable variability is driven by factors such as soil texture, salinity and species selection. For example, a comparative study of the root distributions of C. maculata and E. grandis showed significant differences between species in root density at the water table (Falkiner et al. 2006). Corymbia maculata roots proliferated above the water table to a much larger extent than did E. grandis roots and this was reflected in the groundwater uptake rates (733 and 377 mm respectively). Similarly, at two sites with similar depths to water table but different soil texture and salinity, E. grandis discharge varied between 116 mm at a clay loam site (11.5 dS m-1) to 377 mm at a sandy site (2.8 dS m-1).
Groundwater salinity for the discharge studies reviewed in this report varied considerably across Australia ranging from very high quality groundwater of less than 1 dS m-1 to being highly saline (> 60 dS m-1). Across all sites there was a clear trend for a reduction in groundwater discharge at high groundwater salinities (Figure 7). This result was not unexpected, as salinity can negatively impact the growth and productivity of many plants species (Munns 2002). However, below salinities of ~ 11 dS m-1, rates of groundwater discharge were highly variable. For example, at groundwater salinities of approximately 11 dS m-1 groundwater discharge varied from 116 mm (E. grandis, with depth to groundwater 2.8 m (Polglase et al. 2002) to more than 502 mm (E. camaldulensis, with depth to groundwater 3 m, Thorburn et al. 1993).
0
100
200
300
400
500
600
700
800
0 10 20 30 40 50 60 70
Goundwater salinity (dS m-1)
Gro
un
dw
ate
r d
isch
arg
e (
mm
yr-1
)
Figure 7. Impact of groundwater salinity (as measured by electrical conductivity) on groundwater discharge rates for discharge studies around Australia.
A detailed analysis of the interactions between depth to water salinity and groundwater discharge in this study is difficult as only a few studies have reported all three variables. However, a conceptualisation of the relationship based on the data collated during this review and is shown in Figure 8, and highlights that for any given water table depth, groundwater discharge declines as groundwater salinity increases. However, as mentioned

Review of Australian groundwater discharge studies of terrestrial systems Page 39
above there is considerable scatter in this relationship that reflects characteristics such as species selection, soil properties, depth to water table and differences in regional climate.
0
200
400
600
800
02
46
810
1214
1020
3040
50
Dis
hcar
ge (
mm
yr-1
)
Depth (m)
Salinity (dS m -1)
0 200 400
Figure 8. A linear 3-dimensional representation of the relationship between depth to water table, groundwater salinity and groundwater uptake based on data from around Australia.
4.2. Can We Predict Groundwater Discharge Using Ecological Optimality?
As already discussed, rates of groundwater discharge vary considerably across Australia as a function of species selection, climate (as a driver of evaporation), soil type, depth to water table and groundwater salinity. Therefore, making generalisations based on readily available, or easily obtained data, about the rate of groundwater discharge is difficult. Ecological optimality, as first described by Eagleson (1978), proposes that the vegetation responds to the interactions of site and climatic conditions to optimise productivity while at the same time minimising water stress. Eagleson’s optimality approach predicts three outcomes (cited in Hatton 1997);
Over short time scales (one to a few generations) the vegetation canopy density will equilibrate with the climate and soil to the value at which equilibrium soil moisture will be maximised (minimising water stress),
Over longer time scales (many generations) species will be selected whose potential transpiration efficiency results in the maximum equilibrium soil moisture, and
Over much longer time scales (evolutionary), vegetation will alter soil physical properties towards equilibrium values which maximises canopy density (and productivity).

Review of Australian groundwater discharge studies of terrestrial systems Page 40
The Australian landscape is predominantly water limited (Donohue et al.2009), defined by Budyko (1974) when potential evaporation exceeds rainfall over most of the country. Generally, in water limited environments, vegetation responds to factors that alter the availability of water, for example rainfall. A common response to variation in water supply is adjustment of leaf area index (Grier and Running 1977; Carter and White 2009). Leaf area index is commonly defined as the one-sided projected leaf area per unit ground area and is a fundamental variable in many physiological and hydrological models. Recently, Ellis and Hatton (2008) reviewed leaf area index data from natural vegetation communities around Australia and found a strong relationship between community leaf area index (LAI) and a simple climate wetness index (CWI) of long-term average rainfall (P) divided by pan evaporation (E0; Figure 9), similar to that proposed by Budyko (1974).
0
0.5
1
1.5
2
2.5
3
3.5
4
0 0.2 0.4 0.6 0.8 1 1.2
P/Eo
LA
I
Figure 9: Relationship between community leaf area index and a climate wetness index (rainfall (P)/pan evaporation (E0)). Redrawn from Ellis and Hatton (2008).
Adopting this framework we predict that ecosystems with access to groundwater could potentially support a higher leaf area index at a given climate wetness index. High leaf area index relative to surrounding areas has often been used to help identify groundwater dependent ecosystems (Eamus et al. 2006a). In this review, we have compiled leaf area index for sites where groundwater discharge has been quantified using a water balance approach. Leaf area index at sites where groundwater contributes to water availability tends to be higher than observed by Ellis and Hatton (2008) (Figure 10a). However, when the CWI is recalculated to include the volume of groundwater discharged (P+g/E0) there is considerable convergence between the two relationships (Figure 10b). This is a striking result, and could be used as an index for calculating the groundwater discharge based on simple climate and vegetation characteristics. Leaf area index is a difficult parameter to measure in the field and accurate estimates of LAI are usually derived from destructive harvesting combined with knowledge of the structure and phenology of the community. However, a number of non-destructive methods exist. For example O'Grady et al. (2000), estimated leaf area index in the open forest of the Northern Territory using a simple visual technique. Furthermore, there are a number a readily-used techniques for the estimation of

Review of Australian groundwater discharge studies of terrestrial systems Page 41
leaf area index based on the transmission of light through the canopy, which have been used extensively in the determination of forest leaf area index (see Macfarlane et al. 2007a and Macfarlane et al. 2007b for a recent overview). In addition, the potential to predict leaf area index from remotely sensed indices such as NDVI (McVicar 1996; Coops 1997; Hill et al. 2006; Donohue et al. 2009a) will allow rapid assessment of leaf area index at large spatial and temporal scales. This would not only aid the identification of the spatial extent of groundwater discharge but, when used in conjunction with the simple index developed in this review based on ecological optimality, potentially provides water resources managers with tools to estimate quantities of groundwater discharge in areas where limited data exists for other methods of quantification.
Figure 10: a) Relationship between Climate wetness index (P/E0) and leaf area index for ecosystems with access to groundwater in relation to that observed by Ellis and Hatton (2008) for ecosystems without access to groundwater; and b) Relationship between climate wetness index with groundwater discharge included ((P+g)/E0) and leaf area index in relation to studies review by Ellis and Hatton (2008).
0
1
2
3
4
5
6
0 0.2 0.4 0.6 0.8 1 1.2
Climate Wettness Index
LAI
Ellis and Hatton 2008
This review
a.
0
1
2
3
4
5
6
0 0.2 0.4 0.6 0.8 1 1.2
Climate Wettness Index
LAI
Ellis and Hatton 2008
This review (P+g)/Eo
b.

Review of Australian groundwater discharge studies of terrestrial systems Page 42
5. CONCLUSIONS
1. There has been a significant number of qualitative studies indicating that groundwater uptake by vegetation is common in Australia, occurring across a wide range of climates, geographies, ecosystem types and depths to groundwater.
2. Despite the apparent prevalence of groundwater use by vegetation, there are a
limited number of comprehensive studies that have accurately estimated groundwater discharge in Australia. Most studies have occurred in southern Australia, particularly in association with revegetation of saline agricultural landscapes. There are very few studies in Northern Australia or of natural ecosystems.
3. Methods of estimating groundwater discharge are labour intensive and time
consuming, and include water balance approaches, analysis of hydrographs or measurements of plant water use and the stable isotope ratios of plant, soil and groundwater.
4. Most studies have been on a small (plot-based) scale and over limited time frames,
making wider extrapolation difficult.
5. The estimates of groundwater discharge in the literature were highly variable (from 2 to 700 mm yr-1).
6. Individual studies have demonstrated that groundwater uptake from vegetation is
affected by many factors such as climate, groundwater depth, groundwater salinity, rooting depth and plant physiology. However, discharge across different studies is poorly predicted by these factors.
7. This review has identified that an ecological optimality approach has potential for
predicting groundwater discharge, based on a relationship between leaf area index (LAI) and a climate wetness index (CWI; rainfall divided by pan evaporation). We found that when the CWI was modified to include groundwater discharge, the relationship with LAI was similar to that previously published by Ellis and Hatton (2008).

Review of Australian groundwater discharge studies of terrestrial systems Page 43
REFERENCES
Adams, M.A. and P.F. Grierson 2001. Stable isotopes at natural abundance in terrestrial plant ecology and ecophysiology: an update. Plant Biology. 3:299-310.
Akeroyd, M.D., S.D. Tyerman, G.R. Walker and I.D. Jolly 1998. Impact of flooding on the water use of semiarid riparian eucalypts. Journal of hydrology. 206:104-117.
Allison, G.B. and C.J. Barnes 1983. Estimation of evaporation from non-vegetated surfaces using natural deuterium. Nature. 301:143-145.
Allison, G.B. and C.J. Barnes 1985. Estimation of evaporation from the normally 'dry' Lake Frome in South Australia. Journal of Hydrogeology. 78:229-242.
ANON 2008. Communicating climate change. Water resources in a changing climate: southern Australia. Land and Water Australia, Canberra.
Bacon, P.E., C. Stone, D.L. Binns, D.J. Leslie and D.W. Edwards 1993. Relationships between water availability and Eucalyptus camaldulensis growth in a riparian forest. Journal of Hydrology. 150:541-561.
Bari, M.A. and N.J. Schofield 1992. Lowering of shallow, saline water table by extensive eucalypt reforestation. Journal of Hydrology. 133:273-291.
Bartle, J., G. Olsen and D. Cooper 2007. Scale of biomass production from new woody crops for salinity control in dryland agriculture in Australia. International Journal of Global Energy Issues. 27:115-137.
Bastiaanssen, W.G.M., M. Menenti, R.A. Feddes and A.A.M. Holtslag 1998a. A remote sensing surface energy balance algorithm for land (SEBAL). 1. Formulation. Journal of Hydrology. 212-213:198-212.
Bastiaanssen, W.G.M., H. Pelgrum, J. Wang, Y. Ma, J.F. Moreno, G.J. Roerink and T. van der Wal 1998b. A remote sensing surface energy balance algorithm for land (SEBAL): Part 2: Validation. Journal of Hydrology. 212-213:213-229.
Benyon, R.G. 2002. Water use by tree plantations in the green triangle: A review of current knowledge. CSIRO Forestry and Forest Products, Hamilton, p. 32.
Benyon, R.G. and T.M. Doody 2004. Water use by tree plantations in south east Australia. CSIRO, p. 25.
Benyon, R.G., J. England, J. Eastham, P. Polglase and D. White 2007. Tree water use in forestry compared to other dryland agricultural crops in the Victorian context. Ensis, p. 58.
Benyon, R.G., S. Theiveyanathan and T.M. Doody 2006. Impacts of tree plantations on groundwater in south Eastern Australia. Australian Journal of Botany. 54:181-192.
Budyko, M. 1974. Climate and Life. Academic, New York. Burgess, S.S.O. 2006. Measuring transpiration responses to summer precipitation in a
Mediterranean climate: a simple screening tool for identifying plant water-use strategies. Physiologia Plantarum. 127:404-412.
Burgess, S.S.O., J.S. Pate, M.A. Adams and T.E. Dawson 2000a. Seasonal water acquisition and redistribution in the Australian woody phreatophyte, Banksia prionotes. Annals of Botany. 85:215-224.
Butcher, T. and J. Havel 1976. Influence of moisture relationships on thinning practice. New Zealand Journal of Forestry Science. 6:158-170.
Cai, W., G. Shi and Y. Li 2005. Multidecadal fluctuations of winter rainfall over southwest Western Australia simulated in the CSIRO Mark 3 coupled model. Geophysical Research Letters. 32: doi:10.1029/2005GL022712.
Canham, C.A., R.H. Froend and W.D. Stock 2009. Water stress vulnerability of four Banksia species in contrasting ecohydrological habitats on the Gnangara Mound, Western Australia. Plant, Cell & Environment. 32:64-72.
Cannadell, J., R.B. Jackson, J.R. Ehleringer, H.A. Mooney, O.E. Sala and E.D. Schulze 1996. Maximum rooting depth of vegetation types at the global scale. Oecologia. 108:583-595.

Review of Australian groundwater discharge studies of terrestrial systems Page 44
Carbon, B.A., G.A. Bartle and A.M. Murray 1981. Patterns of water-stress and transpiration in jarrah (Eucalyptus marginata Don ex Sm) forests. Australian Forest Research. 11:191-200.
Carbon, B.A., G.A. Bartle, A.M. Murray and D.K. MacPherson 1980. The distribution of root length, and the limits to flow of soil water to roots in a dry sclerophyll forest. Forest Science. 26:656-664.
Carter, J.L. and D.A. White 2009. Plasticity in the Huber values contributes to homeostasis in leaf water relations of a mallee Eucalypt with variation to groundwater depth. Tree Physiology. 29:1047-1418.
Colquhoun, I.J. 1984. Comparative studies in selected species of Eucalyptus used in rehabilitation of the northern jarrah forest, Western Australia. I. Patterns of xylem pressure potential and diffusive resistance of leaves. Australian Journal of Botany. 32:367-373.
Colquhoun, I.J. 1986. Eco-physiological studies of two shrub species growing in the Swan Coastal Plain, Perth, W.A. University of Western Australia, Perth.
Colquhoun, I.J., R.W. Ridger, D.T. Bell, W.A. Loneragan and J. Kuo 1984. Comparative studies in selected species of Eucalyptus used in the rehabilitation of the northern jarrah forest, Western Australia. 1 Patterns of xylem pressure potential and diffusive resistance of leaves. Australian Journal of Botany. 32:367-73.
Cook, P.G., G. Favreau, J.C. Dighton and S. Tickell 2003. Determining natural groundwater influx to a tropical river using radon, chlorofluorcarbons and ionic environmental tracers. Journal of Hydrology. 277 74-88.
Cook, P.G. and A.P. O'Grady 2006. Determining soil and groundwater use of vegetation from heat pulse, water potential and stable isotope data. Oecologia. 148:97-107.
Coops, N., A. Delahaye and E. Pook 1997. Estimation of Eucalypt forest leaf area index on the south coast of New South Wales using Landsat MSS Data. Australian Journal of Botany. 1997:757-769.
Costelloe, J.F., E. Payne, I.E. Woodrow, E.C. Irvine, A.W. Western and F.W. Leaney 2008. Water sources accessed by arid zone riparian trees in highly saline environments, Australia. Oecologia. 156:43-52.
Cramer, V.A., P.J. Thorburn and G.W. Fraser 1999. Transpiration and groundwater uptake from farm forest plots of Casuarina glauca and Eucalyptus camaldulensis in saline area of south-east Queensland, Australia. Agricultural Water Management. 39:187-204.
Crosbie, R.S., B. Wilson, J.D. Hughes, McCulloch C. and King, W.M. 2008. A comparison of the water use if tree belts and pasture in recharge and discharge zones in a saline catchment in the central west of NSW, Australia. Agricultural Water Management. 95:211-223.
Davis, G.B. and A.J. Peck 1986. Estimating evapotranspiration by analysis of bore hydrographs. IAHS Publication. 156:313-312.
Dawson, T.E. 1996. Determining water use by trees and forests from isotopic, energy balance and transpiration analyses: the role of tree size and hydraulic lift. Tree Physiology. 16:263-272.
Dawson, T.E. and J.R. Ehleringer 1991. Streamside trees that do not use stream water. Nature. 350:335-337.
Dawson, T.E. and J.S. Pate 1996. Seasonal water uptake and movement in root systems of Australian phreatophytic plants of dimorphic root morphology: a stable isotope investigation. Oecologia. 107:12-20.
Dell, B., J. Bartle and W. Tacey 1983. Root occupation and root Channels of Jarrah forest subsoils. Australian Journal of Botany. 31:615-627.
Diak, G., J. Mecikalski, M. Anderson, J. Norman, W. Kustas, R. Torn and R. DeWolfe 2004. Estimating land surface energy budgets from space-review and current efforts at the university of Madison-Wisconsin and USDA-ARS. Bulletin of the American Metrological Society. 85:65-78.
Dodd, J. and D.T. Bell 1993a. Water relations of canopy species in a Banksia woodland, Swan Coastal Plain, Western Australia. Australian Journal of Ecology. 18:281-293.
Review of Australian groundwater discharge studies of terrestrial systems Page 45
Dodd, J. and D.T. Bell 1993b. Water relations of understorey shrubs in a Banksia woodland, Swan Coastal Plain, Western Australia. Australian Journal of Ecology. 18:295-305.
Doley, D. 1967. Water relations of Eucalyptus marginata Sm. under natural conditions. Journal of Ecology. 55:597-614.
Donohue, R.J., T.M. McVicar and M.L. Roderick 2009a. Climate-related trends in Australian vegetation cover as inferred from satellite observations. Global Change Biology. 15:1025-1039.
Donohue, R.J., T.R. McVicar and M.L. Roderick 2009b. Generating Australian potential evaporation data suitable for assessing the dynamics in evaporative demand within a changing climate. CSIRO Water for a Healthy Country, Canberra, p. 50.
Doody, T.M., K.L. Holland, R.G. Benyon and I.D. Jolly 2009. Effect of groundwater freshening on riparian vegetation water balance. Hydrological Processes
Drake, P.L. and P.J. Franks 2003. Water resource partitioning, stem hydraulic properties, and plant water use strategies in a seasonally dry riparian tropical rainforest. Oecologia. 137:321-329.
Dunin, F.X. 2002. Integrating agroforestry and perennial pastures to mitigate water logging and secondary salinity. Agricultural Water Management. 53:259-270.
Eagleson, P.S. 1978. Climate, soil and vegetation: 1. Introduction to water balance dynamics. Water Resources Research. 14:705-712.
Eamus, D., R. Froend, R. Loomes, G. Hose and B. Murray 2006a. A functional methodology for determining the groundwater regime needed to maintain the health of groundwater-dependent vegetation. Australian Journal of Botany. 54:97-114.
Eamus, D., T. Hatton, P.G. Cook and C. Colvin 2006b. Ecohydrology: Vegetation function, water and resource management. CSIRO Press, Melbourne. 350 p.
Eastham, J., P.R. Scott and R. Steckis 1994. Components of the Water-Balance for Tree Species under Evaluation for Agroforestry to Control Salinity in the Wheat- Belt of Western-Australia. Agroforestry Systems. 26:157-169.
Ellis, T.W. and T.J. Hatton 2008. Relating leaf area index of natural eucalypt vegetation to climate variables in southern Australia. Agricultural Water Management. 95:743-747.
Falkiner, R., E. Nambiar, P. Polglase, S. Theiveyanathan and L. Stewart 2006. Root distribution of Eucalyptus grandis and Corymbia maculata in degraded saline soils of south-eastern Australia. Agroforestry Systems. 67:279-291.
Farrington, P. and G. Bartle 1991. Recharge beneath a Banksia woodland and a Pinus pinaster plantation on coastal deep sands in south Western Australia. Forest Ecology and Management. 40:101-118.
Farrington, P., E.A.N. Greenwood, G.A. Bartle, J.D. Beresford and G.D. Watson 1989. Evaporation from Banksia woodland on a groundwater mound. Journal of Hydrology. 105:173-186.
Farrington, P., J.V. Turner and V. Gailitis 1996. Tracing water uptake by jarrah (Eucalyptus marginata) trees using natural abundances of deuterium. Trees. 11:9-15.
Farrington, P., G.D. Watson, G.A. Bartle and E.A.N. Greenwood 1990. Evaporation from dampland vegetation on a groundwater mound. Journal of Hydrology. 115:65-75.
Froend, R.H. and P.L. Drake 2006. Defining phreatophyte response to reduced water availability: preliminary investigations on the use of xylem cavitation vulnerability in Banksia woodland species. Australian Journal of Botany. 54:173-179.
Gardner, W.R. 1958. Some steady state solutions of the unsaturated moisture flow equation with application to evaporation from a water table. Soil Science. 85:228-232.
Gardner, W.R. and M. Fireman 1958. Laboratory studies of evaporation from soil columns in the presence of a water table. Soil Science. 85:244-249.
Gavran, M. and M. Parsons 2009. Australia’s plantations 2009 inventory update. In National Foresty Inventory Ed. B.o.R. Sciences, Canberra.
George, A.K., K.F. Walker and M.M. Lewis 2005. Population status of eucalypt trees on the River Murray floodplain, South Australia. River Research and Applications. 21:271-282.
George, R.J. 1990. Reclaiming sandplain seeps by intercepting perched groundwater with eucalypts. Land Degradation and Rehabilitation 2:13-25.

Review of Australian groundwater discharge studies of terrestrial systems Page 46
George, R.J., R.A. Nulsen, R. Ferdowsian and G.P. Raper 1999. Interactions between trees and groundwaters in recharge and discharge areas - A survey of Western Australia sites. Agricultural Water Management. 39:91-113.
Glenn, E.P., A.R. Huete, P.L. Nagler, K.K. Hirschboeck and P. Brown 2007. Integrating remote sensing and ground methods to estimate evapotranspiration. Critical Reviews in Plant Sciences. 26:139-168.
Greenwood, E.A.N. and J.D. Beresford 1980. Evaporation from vegetation in landscapes developing secondary salinity using the ventilated-chamber technique. 2. Evaporation from Atriplex plantations over a shallow saline water table Journal of Hydrology. 45:313-319.
Greenwood, E.A.N., E.F. Biddiscombe, A.L. Rogers, J.D. Beresford and G.D. Watson 1995. Growth of species in a tree plantation and its influence on salinity and groundwater in the 400 mm rainfall region of south-western Australia. Agricultural Water Management. 28:231-243.
Grier, C.C. and S.W. Running 1977. Leaf area of mature northwestern coniferous forests - relation to site water-balance. Ecology. 58:893-899.
Grieve, B.J. 1956. Studies of the water relations of plants. I. Transpiration of Western Australian (Swan Plain) sclerophylls. Journal of the Royal Society of Western Australia. 40:15-30.
Groom, P.K. 2003. Groundwater dependency and water relations of our Myrtaceae shrub species during a prolonged summer drought. Journal of the Royal Society of Western Australia. 86:31-40.
Groom, P.K. 2004. Rooting depth and plant water relations explain species distribution patterns within a sandplain landscape. Functional Plant Biology. 31:423-428.
Groom, P.K., R.H. Froend, E.M. Mattiske and R.P. Gurner 2001. Long-term changes in vigour and distribution of Banksia and Melaleuca overstorey species on the swan coastal plain. Journal of the Royal Society of Western Australia. 84:63-69.
Groom, P.K., R.H. Froend, E.M. Mattiske and B. Koch 2000a. Myrtaceous shrub species respond to long-term decreasing groundwater levels on the Gnangara Groundwater Mound, northern Swan Coastal Plain. Journal of the Royal Society of Western Australia. 83:75-82.
Groom, P.K., R.H. Froend and M. Mattiske 2000b. Impact of groundwater abstraction on ta Banksia woodland, Swan Coastal Plain, Western Australia. Ecological Management and Restoration. 2:117-124.
Guerschman, J.P., A.I.J.M. Van Dijk, G. Matterersdorf, J. Beringer, L.B. Hutkey, R. Leuning, R.C. Pipunic and B.S. Sherman 2009. Scaling of potential evaporation with MODIS data reproduces flux observations and catchment water balance observations across Australia. Journal of Hydrology. 369:107-119.
Hatton, T.J., G.A. Bartle, R.P. Silberstein, R.B. Salama, G. Hodgson, P.R. Ward, P. Lambert and D.R. Williamson 2002. Predicting and controlling water logging and groundwater flow in sloping duplex soils in western Australia. Agricultural Water Management. 53:57-81.
Hatton, T.J., E.A. Catchpole and R.A. Vertessy 1990. Integration of sap velocity to estimate plant water use. Tree Physiology. 6:201-209.
Hatton, T.J. and R. Evans 1998. Dependence of ecosystems on groundwater and its significance to Australia. Land and water research and development corporation, CSIRO Australia, p. 77.
Hatton, T.J., S.J. Moore and P.H. Reece 2005. Estimating stand transpiration in a Eucalyptus populnea woodland with the heat pulse method: measurement errors and sampling strategies. Tree Physiology. 15:219-227.
Hatton, T.J., J. Ruprecht and R.J. George 2003. Preclearing hydrology of the Western Australia wheatbelt: target for the future? Plant and Soil. 257:341-356.
Hatton, T.J., Salvucci, G.D., Wu, H.I. 1997. Eaglesons optimality theory of an ecohydrological equilibrium: quo vadis? Functional Ecology. 11:665-674.
Heuperman, A. 1999. Hydraulic gradient reversal by trees in shallow water table areas and repercussions for the sustainability of tree-growing systems. Agricultural Water Management. 39:153-167.

Review of Australian groundwater discharge studies of terrestrial systems Page 47
Hill, M.J., U. Senarath, A. Lee, M. Zeppel, J.M. Nightingale, R.J. Williams and T.M. McVicar 2006. Assessment of the MODIS LAI product fro Australian Ecosystems. Remote Sensing of the Environment. 101:495-518.
Holland, K. 2002a. Blackbox (Eucalyptus largiflorens) tree health and groundwater discharge on the lower River Murray floodplain, South Australia: Linking spatial and temporal scales. In School of Chemistry, Physics and Earth Sciences. Flinders University of South Australia, Adelaide, Australia. p. 246
Holland, K.L., I.D. Jolly, K.L. McKewan, T.M. Doody, M. White, V. Berens and N. Souter 2008. The 'Bookpurnong Experiment':, will groundwater management and flooding improve the health of floodplain vegetation? In 2nd International Salinity Forum, Adelaide, Australia.
Howe, P., A.P. O'Grady, Cook P.G., A. Knapton, A. Duguid and T. Fass 2007. A framework for assessing the environmental water requirements of groundwater dependent ecosystems, Report 2 Field Studies Ed. P. Howe. Land and Water Australia, Adelaide, p. 114.
Hutley, L.B., A.P. O'Grady and D. Eamus 2000. Evapotranspiration from Eucalypt open-forest savanna of Northern Australia. Functional Ecology. 14:183-194.
Jackson, P.C., F.C. Meinzer, M. Bustamante, G. Goldstein, A. Franco, P.W. Rundel, L. Caldas, E. Igler and F. Causin 1999. Partitioning of soil water among trees in a Brazillian cerrado ecosystem. Tree Physiology. 19:717-714.
Jackson, R.B., J. Canadell, J.R. Ehleringer, H.A. Mooney, O.E. Sala and E.D. Schulze 1996. A global analysis of root distributions for terrestrial biomes. Oecologia. 108:389-411.
Jacobson, G. and J. Jankowski 1989. Groundwater discharge processes at a central Australian Playa. Journal of Hydrology. 105:275-295.
Jolly, I.D. and G.R. Walker 1996. Is the field water use of Eucalyptus largiflorens F. Muell. affected by short-term flooding. Australian Journal of Ecology. 21:173-183.
Jolly, I.D., G.R. Walker and P.J. Thorburn 1993. Salt accumulation in semi-arid floodplain soils with implications for forest health. Journal of Hydrology. 150:589-614.
Kalma, J.D., T.R. McVicar and M.F. McCabe 2008. Estimating Land surface evaporation: A review of methods using remotley sensed surface temperature data. Surveys in Geophysics. 29:421-469.
Lamontagne, S., P.G. Cook, A. O'Grady and D. Eamus 2005. Groundwater use by vegetation in a tropical savanna riparian zone (Daly River, Australia). Journal of Hydrology. 310:280-293.
Lefroy, E.C., R.J. Stirzaker and J.S. Pate 2001. The influence of tagasaste (Chamaecytisus proliferus Link.) trees on the water balance of an alley cropping system on deep sand in south-western Australia. Australian Journal Agriculture Research. 52:235-246.
Macfarlane, C., A. Grigg and C. Evangelista 2007a. Estimating forest leaf area using cover and full frame fisheye photography: Thinking inside the circle. Agricultural and Forest Meteorology. 146:1-12.
Macfarlane, C., M. Hoffman, D. Eamus, N. Kerp, S. Higginson, R. McMurtrie and M. Adams 2007b. Estimation of leaf area index in eucalypt forest using digital photography. Agricultural and Forest Meteorology. 143:176-188.
Marshall, J.K., A.L. Morgon, K. Akilan, R.C.C. Farrell and D.T. Bell 1997. Water uptake by two river red gum (Eucalyptus camaldulensis) clones in a discharge site plantation on the Western Australian wheatbelt. Journal of Hydrology. 200:136-148.
McJannet, D. 2008. Water table and transpiration dynamics in a seasonally inundated Melaleuca quinquenervia forest, north Queensland, Australia. Hydrological Processes. 22:3079-3090.
McMahon, T.A., B.L. Finlayson, A.T. Haines and R. Srikanthan 1992. Global Runoff - Continental Comparisons of Annual Flows and Peak Discharges. Catena Verlag, Cremlingen-Destedt, West Germany. 166 p.
McVicar, T.R., D.L.B. Jupp, P.H.Reece and N.A. Williams 1996. Relating Landsat TM vegetation indices to insitu leaf area index measurements. CSIRO Technical Memorandum. 96/14:80.

Review of Australian groundwater discharge studies of terrestrial systems Page 48
McVicar, T.R. and D.L.B. Jupp 1999. Estimating one-time-of-day meteorological data from standard daily data as inputs to thermal remote sensing based energy balance models. Agricultural and Forest Meteorology. 96:219-238.
McVicar, T.R. and D.L.B. Jupp 2002. Using covariates to spatially interpolate moisture availability in the Murray-Darling Basin: a novel use of remotely sensed data. Remote Sensing of Environment. 79:199-212.
McVicar, T.R., T.G. Van Niel, L.T. Li, M.F. Hutchinson, X.M. Mu and Z.H. Liu 2007. Spatially Distributing Monthly Reference Evapotranspiration and Pan Evaporation Considering Topographic Influences. Journal of Hydrology. 338:196-220.
Mehta, B.K., S. Shiozawa and M. Nakano 1994. Hydraulic properties of a sandy soil at low water contents. Soil Science. 157:208-214.
Mensforth, L.J., P.J. Thorburn, S.D. Tyerman and G.R. Walker 1994. Sources of water used by riparian Eucalyptus camaldulensis overlying highly saline groundwater. Oecologia. 100:21-28.
Mitchell, P.J., E. Veneklaas, H. Lambers and S.S.O. Burgess 2009. Partitioning of evapotranspiration in a semi-arid eucalypt woodland in south western Australia. Agricultural and Forest Meteorology. 149:25-37.
Monteith, J.L. and M.H. Unsworth 2008. Principles of Environmental Physics. Academic Press, London.
Morris, J.D. and J.J. Collopy 1999. Water use and salt accumulation by Eucalyptus camaldulensis and Casuarina cunninghamiana on a site with shallow saline groundwater. Agricultural Water Management. 39:205-227.
Munns, R. 2002. Comparative physiology of salt and water stress. Plant Cell and Environment. 25:239-250.
Nachabe, M., N. Shah, M. Ross and J. Vomacka 2005. Evapotranspiration of two vegetation covers in a shallow water table environment. Soil Science Society of America Journal. 69:492-499.
Nambiar, E.K.S. and R. Sands 1992. Effects of compaction and simulated root channels in the subsoil on root development, water-uptake and growth of radiata pine. Tree Physiology. 10:297-306.
Nepstad, D.C., C.R. de Carvalho, E.A. Davidson, P.H. Jipp, P.A. Lefebvre, G.H. Negreiros, E.D. da Silva, T.A. Stone, S.E. Trumbore and S. Vieira 1994. The role of deep roots in the hydrological and carbon cycles of Amazonian forests and pastures. Nature. 372:666-669.
O'Grady, A.P., X. Chen, D. Eamus and L.B. Hutley 2000. Composition, leaf area index and standing biomass of eucalypt open-forests near Darwin in the Northern Territory, Australia. Australian Journal of Botany. 48:629-638.
O'Grady, A.P., P.G. Cook, P. Howe and G. Werren 2006a. Groundwater use by dominant tree species in tropical remnant vegetation communities. Australian Journal of Botany. 54:155-171.
O'Grady, A.P., D. Eamus, P.G. Cook and S. Lamontagne 2006b. Groundwater use by riparian vegetation in the wet-dry tropics of northern Australia. Australian Journal of Botany. 54:145-154.
O'Grady, A.P., D. Eamus, P.G. Cook, S. Lamontagne, G. Kelley and L.B. Hutley 2002. Tree water use and sources of transpired water in riparian vegetation along the Daly Rivers, Northern Territory Ed. W. Department of the Environment, Heritage and the Arts. Northern Territory University p. 160.
Overton, I.C., I.D. Jolly, P.G. Slavich, M.M. Lewis and G.R. Walker 2006. Modelling vegetation health from the interaction of saline groundwater and flooding on the Chowilla floodplain, South Australia. Australian Journal of Botany. 54:207-220.
Pate, J.S., W.D. Jeschke and M.J. Aylward 1995. Hydraulic architecture and xylem structure of the dimporphic root systems of south-west Australian species of proteaceae. Journal of Experimental Botany. 46:907-915.
Peck, A.J. and T. Hatton 2003. Salinity and the discharge of salts from catchments in Australia. Journal of Hydrology. 272:191-202.
Polglase, P. and R.G. Benyon 2008. The impacts of Plantations on water security: Review and scientific assessment of regional issues and research needs.

Review of Australian groundwater discharge studies of terrestrial systems Page 49
Polglase, P.J., S. Theiveyanathan, R.G. Benyon and R.A. Falkiner 2002. Irrigation management and groundwater uptake in young tree plantations growing over high watertables. Rural Industries Research and Development Corporation.
Poot, P. and H. Lambers 2008. Shallow-soil endemics: adaptive advantages and constraints of a specialized root-system morphology. New Phytologist. 178:371-381.
Pritchard, J., J. Carter, L. Stewart, D. White and P. Howe 2007. Pirraburdoo Creek Groundwater Dependent Ecosystems study. Resource and Environmental Management Pty Ltd and Ensis, Kent Town, South Australia.
Raper, G.P. 1998. Agrofrestry water use in Mediterranean regions of Australia. In Water and Salinity issues in agroforestry NO2, p. 71.
Reicosky, D., R. Millington, A. Klute and D. Peters 1972. Patterns of water uptake and root distribution of soybeans (Glycine max.) in the presence of a water table. Agronomy Journal. 64:292-297.
Robinson, N., R.J. Harper, K.R.J. Smettem, R. Archibald, A.T. Stilwell and Y. Oliver 2002. Recharge reduction on degraded agricultural soils with agroforestry systems. In Proceedings of the 17th World Congress of Soil Science, Bangkok, Thailand.
Salama, R.B., G.A. Bartle and P. Farrington 1994. Water use of plantation Eucalyptus camaldulensis estimated by groundwater hydrograph separation techniques and heat pulse method. Journal of Hydrology. 156:163-180.
Schmid, R.M. 1985. Lake Torrens, South Australia: sedimentation and Hydrology. In School of Earth Sciences. Flinders University of South Australia.
Sharma, M.L., M. Bari and J. Byrne 1991. Dynamics of seasonal recharge beneath a semiarid vegetation on the Gnangara Mound, Western Australia. Hydrological Processes. 5:383-398.
Silberstein, R.P., A. Held, T.J. HAtton, N.R. Viney and M. Sivapalin 2001. Energy balance of a natural Jarrah (Eucalyptus marginata) forest: Measurements during spring and summer. Agricultural and Forest Meteorology. 109:79-104.
Stolte, J., J.L. Freijer, W. Bouten, C. Dirksen, J.M. Halbertsma, J.C. van Dam, J.A. van den Berg, G.J. Veerman and J.H.M. Wösten 1994. Comparison of six methods to determine unsaturated soil hydraulic conductivity. Soil Science Society of America Journal. 58:1596-1603.
Stone, E.L. and P.J. Kalisz 1991. On the maximum extent of tree roots. Forest Ecology and Management. 46:59-102.
Sudmeyer, R.A. and A. Goodreid 2007. Short-rotation woody crops: A prospective method for phytoremediation of agricultural land at risk of salinisation in southern Australia? Ecological Engineering. 29:350-361.
Sun, D. and G.R. Dickinson 1995. Salinity effects on tree growth, root distribution and transpiration of Casuarina cunninghamiana and Eucalyptus camaldulensis planted on a saline site in tropical north Australia. Forest Ecology and Management. 77:127-138.
Talsma, T. 1963. The control of saline groundwater. Mededelingen van de Landbouwhogeschool te Wageningen Nederland. 63:1-68.
Teskey, R.O. and D.W. Sheriff 1996. Water use by Pinus radiata trees in a plantation. Tree Physiology. 16:273-279.
Thorburn, P. 1996. Can shallow water tables be controlled by the revegetation of saline lands? Australian Journal of Soil and Water Conservation. 9:45-50.
Thorburn, P., G. Walker and T. Hatton 1992a. Are River Red Gums taking water from soil, groundwater or streams. In Catchments of Green, Adelaide, Australia.
Thorburn, P.J. 1993. Groundwater uptake by Eucalyptus forests on the Chowilla floodplain, South Australia. In School of Earth Sciences. The Flinders University of South Australia, Adelaide.
Thorburn, P.J. and J.R. Ehleringer 1995. Root water uptake of field-growing plants indicated by measurements of natural abundance deuterium. Plant and Soil. 177:225-233.
Thorburn, P.J., T.J. Hatton and G.R. Walker 1993. Combining measurements of transpiration and stable isotopes of water to determine groundwater discharge from forests. Journal of Hydrology. 150:563-587.

Review of Australian groundwater discharge studies of terrestrial systems Page 50
Thorburn, P.J., L.J. Mensforth and G.R. Walker 1994. Reliance of creek-side River Red Gums on creek water. Australian Journal of Marine and Freshwater Research. 45:1439-1443.
Thorburn, P.J., G.R. Walker and I.D. Jolly 1995. Uptake of saline groundwater by plants: An analytical model for semi-arid and arid areas. Plant and Soil. 175:1-11.
Thorburn, P.J., G.R. Walker and P.H. Woods 1992b. Comparison of diffuse discharge from shallow-water tables in soils and salt flats. Journal of Hydrology. 136:253-274.
Ullman, W.J. 1985. Evaporation rate from a salt pan: estimates from chemical profiles in near-surface groundwaters. Journal of hydrology. 79:365-373.
Veneklaas, E.J. and P. Poot 2003. Seasonal patterns in water use and leaf turnover of different plant functional types in a species-rich woodland, south-western Australia. Plant and Soil. 257:295-304.
Walker, G., J.-P. Brunel, J. Dighton, K. Holland, F. Leaney, K.L. McEwan, L. Mensforth, P. Thorburn and C. Walker 2001. The use of stable isotopes of water for determining sources of water for plant transpiration. CSIRO Land and Water, p. 40.
Walker, S. 2006. The influence of depth to groundwater on the transpiration of plantation maritime pine (Pinus pinaster Ait.) on the Gnangara Mound, Western Australia. In School of Plant Biology. University of Western Australia, Perth.
Ward, P.R. and S.F. Micin 2006. The capacity of dryland lucern for groundwater uptake. Australian Journal Agricultural Research. 57:483-487.
Warrick, A.W. 1988. Additional solutions for steady state evaporation from a shallow water table. Soil Science. 146:63-66.
White, D.A., F.X. Dunin, N.C. Turner, B.H. Ward and J.H. Galbraith 2002. Water use by contour-planted belts of trees comprised of four Eucalyptus species. Agricultural Water Management. 53:133-152.
Whitley, R. and D. Eamus 2009. How much water does a woodland or plantation use?: a review of some measurement methods. In Knowledge for Managing Australia's Landscapes. Land and Water Australia, p. 17.
Wildy, D.T., J.S. Pate and J.R. Bartle 2004. Budgets of water use by Eucalyptus kochii tree belts in the semi-arid wheatbelt of Western Australia. Plant and Soil. 262:129-149.
Willis, W.O. 1960. Evaporation from layered soils in the presence of a water table. Soil Science Society of America Proceedings. 24:239-242.
Wind, G.P. 1955. A field experiment concerning capillary rise of moisture in a heavy clay soil. Netherlands Journal of Agricultural Science. 3:60-69.
Wullschleger, S.D., Meinzer, F.C., Vertessy, R.A. 1998. A review of whole-plant water use studies in trees. Tree Physiology. 18:499-512.
Xu, C. 2008. Effects of Rainfall, Pines and Abstraction on Gnangara Mound Water Level Decline. Water Corporation, Perth, Australia.
Zencich, S.J. 2003 Variability in water use by phreatophytic Banksia woodland vegetation of the Swan coastal plain, Western Australia Edith Cowan University, Perth, Australia.
Zencich, S.J., R.H. Froend, J.V. Turner and V. Gailitis 2002. Influence of groundwater depth on the seasonal sources of water accessed by Banksia tree species on a shallow, sandy coastal aquifer. Oecologia. 131:8-19.
Zhang, L., W.R. Dawes and G.R. Walker 2001. Response of mean annual evapotranspiration to vegetation changes at catchment scale. Water Resources Research 37:701-708.
Zhang, L., K. Hickel, W.R. Dawes, F.H.S. Cheiw, A.W. Western and P.R. Briggs 2004. A rational function approach for estimating mean annual evapotranspiration. Water Resources Research. 40
Zhang, L., R. Vertessy, G. Walker, M. Gilfedder and P. Hairsine 2007a. Afforestation in a catchment context: understanding the impacts on water yield and salinity. Industry report 1/07. eWater CRC, Melbourne, Australia.
Zhang, L., R. Vertessy, R. Walker, G. Gilfedder and P. Hairsine 2007b. Afforestation in a catchment context: understanding the impacts on water yield and salinity Ed. e. CRC. CSIRO Land and Water, Adelaide, p. 60.
Zimmermann, U., D. Ehhalt and K.O. Munnich 1967. Soil water movement and evapotranspiration: Changes in the isotopic composition of the water. In Isotopes in

Review of Australian groundwater discharge studies of terrestrial systems Page 51
Hydrology: Proceedings of the intenational symposium on Isotopes in Hydrology. International atomic Energy Agency, Veinna, Austria, pp. 567-85.

Review of Australian groundwater discharge studies of terrestrial systems Page 52