Review for May 2012 Schroder International … for May 2012 Schroder International Selection Fund...
14
For Professional Investors or Advisors Only Review for May 2012 Schroder International Selection Fund Asian Total Return Fund Fund Manager’s Comments May was a volatile and poor month for Asian markets on a combination of European woes and deteriorating Chinese economic numbers. The fund held up relatively well in early May with stock selection proving defensive, but capitulation nearing month-end provided few places to hide. We think policymakers in Europe and China are repeating the same mistakes and failing to understand longer term implications of current policy responses. MAY PERFORMANCE May was a volatile and poor month for Asia’s stockmarkets. A combination of European woes and deteriorating economic numbers from China in particular led to a reappraisal of the earnings outlook for many stocks in the region. The continuing series of corporate scandals in China and poor political and policy announcements in India and Indonesia also did little to help investor confidence in the region. All markets were sold down quite heavily with Philippines and Malaysia proving the best places to hide. Sector wise commodity and cyclical sectors were hit hardest whilst the dash for income, regardless of its sustainability, led to continued significant outperformance from telecom and utility names. The fund started the month relatively well with our stock selection proving defensive, however as capitulation set in towards the end of the month there were few places to hide and the fund bore the brunt of the falls, with some of our favoured industrial and property names being hit hard. Overall the fund fell 6.9% over the month (C Class shares in US$) compared with the fund’s reference index (the MSCI AC Asia Pacific x Japan index) which fell 10.3%. This was disappointing given the fund was only 50% net long and we had hoped our stock selection was reasonably defensive. On a more positive note year to date the fund is still up 6.0% versus the regional index which is now up 1.4% and a cash rate of 0.2%. STRATEGY REVIEW - EUROPE, CHINA AND THE LAW OF UNINTENDED CONSEQUENCES May and early June have clearly been volatile and busy times for markets and policy makers. Whilst not wanting to dwell excessively on Europe and China we feel we should provide an update on our latest thoughts on both areas given the fairly significant moves that have occurred over the last couple of months, and the impact our views on Europe and China are having on the fund’s overall strategy 1 . As the title above hints we think in both countries policymakers are clutching at straws, repeating the same mistakes and failing to fully understand the longer-term implications of current policy responses. 1 Next month will be our mid-year review and our plan is to write a piece on the broader Asian markets (some of which we are actually positive on) rather than the usual diatribe against European and Chinese policymakers – promises, promises…………
Transcript of Review for May 2012 Schroder International … for May 2012 Schroder International Selection Fund...

For Professional Investors or Advisors Only
Review for May 2012
Schroder International Selection Fund Asian Total Return Fund
Fund Manager’s Comments May was a volatile and poor month for Asian markets on a combination of European woes and deteriorating Chinese economic numbers. The fund held up relatively well in early May with stock selection proving defensive, but capitulation nearing month-end provided few places to hide. We think policymakers in Europe and China are repeating the same mistakes and failing to understand longer term implications of current policy responses.
MAY PERFORMANCE
May was a volatile and poor month for Asia’s stockmarkets. A combination of European woes and deteriorating economic numbers from China in particular led to a reappraisal of the earnings outlook for many stocks in the region. The continuing series of corporate scandals in China and poor political and policy announcements in India and Indonesia also did little to help investor confidence in the region.
All markets were sold down quite heavily with Philippines and Malaysia proving the best places to hide. Sector wise commodity and cyclical sectors were hit hardest whilst the dash for income, regardless of its sustainability, led to continued significant outperformance from telecom and utility names.
The fund started the month relatively well with our stock selection proving defensive, however as capitulation set in towards the end of the month there were few places to hide and the fund bore the brunt of the falls, with some of our favoured industrial and property names being hit hard. Overall the fund fell 6.9% over the month (C Class shares in US$) compared with the fund’s reference index (the MSCI AC Asia Pacific x Japan index) which fell 10.3%. This was disappointing given the fund was only 50% net long and we had hoped our stock selection was reasonably defensive. On a more positive note year to date the fund is still up 6.0% versus the regional index which is now up 1.4% and a cash rate of 0.2%.
STRATEGY REVIEW - EUROPE, CHINA AND THE LAW OF UNINTENDED CONSEQUENCES
May and early June have clearly been volatile and busy times for markets and policy makers. Whilst not wanting to dwell excessively on Europe and China we feel we should provide an update on our latest thoughts on both areas given the fairly significant moves that have occurred over the last couple of months, and the impact our views on Europe and China are having on the fund’s overall strategy
1.
As the title above hints we think in both countries policymakers are clutching at straws, repeating the same mistakes and failing to fully understand the longer-term implications of current policy responses.
1 Next month will be our mid-year review and our plan is to write a piece on the broader Asian markets (some of which we are actually positive on) rather than the usual diatribe against European and Chinese policymakers – promises, promises…………
We presume the US$100bn bailout of Spanish banks will most likely be funded by the EFSF, but we question the viability of this approach – the possibility is that this will eventually land in the lap of the German Bundesbank. None of the policies discussed to date address the real issues facing the Eurozone. A federal Europe may address immediate liquidity issues but not solvency issues which derive from structural problems. So what is our strategy given all this? We don’t have a strong view on the likelihood or timing of a Greek exit – if it does happen we expect a massive liquidity program to try to prevent contagion.
EUROPE
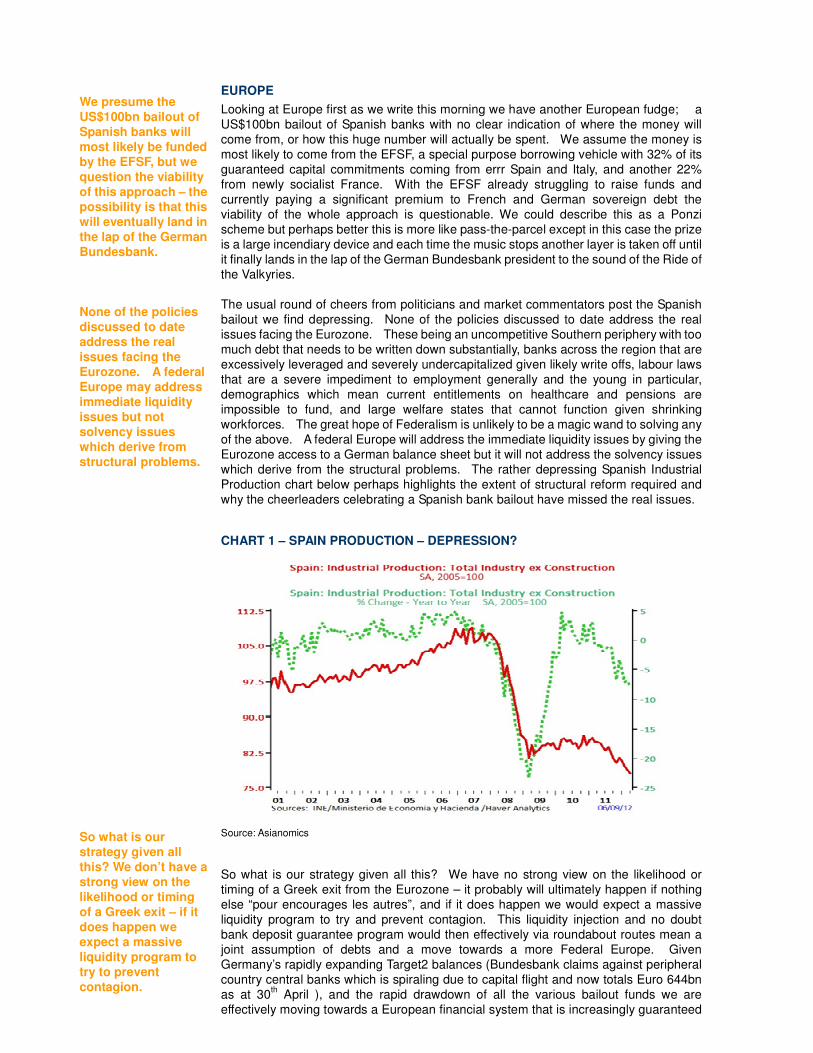
Looking at Europe first as we write this morning we have another European fudge; a US$100bn bailout of Spanish banks with no clear indication of where the money will come from, or how this huge number will actually be spent. We assume the money is most likely to come from the EFSF, a special purpose borrowing vehicle with 32% of its guaranteed capital commitments coming from errr Spain and Italy, and another 22% from newly socialist France. With the EFSF already struggling to raise funds and currently paying a significant premium to French and German sovereign debt the viability of the whole approach is questionable. We could describe this as a Ponzi scheme but perhaps better this is more like pass-the-parcel except in this case the prize is a large incendiary device and each time the music stops another layer is taken off until it finally lands in the lap of the German Bundesbank president to the sound of the Ride of the Valkyries. The usual round of cheers from politicians and market commentators post the Spanish bailout we find depressing. None of the policies discussed to date address the real issues facing the Eurozone. These being an uncompetitive Southern periphery with too much debt that needs to be written down substantially, banks across the region that are excessively leveraged and severely undercapitalized given likely write offs, labour laws that are a severe impediment to employment generally and the young in particular, demographics which mean current entitlements on healthcare and pensions are impossible to fund, and large welfare states that cannot function given shrinking workforces. The great hope of Federalism is unlikely to be a magic wand to solving any of the above. A federal Europe will address the immediate liquidity issues by giving the Eurozone access to a German balance sheet but it will not address the solvency issues which derive from the structural problems. The rather depressing Spanish Industrial Production chart below perhaps highlights the extent of structural reform required and why the cheerleaders celebrating a Spanish bank bailout have missed the real issues.
CHART 1 – SPAIN PRODUCTION – DEPRESSION?
Source: Asianomics
So what is our strategy given all this? We have no strong view on the likelihood or timing of a Greek exit from the Eurozone – it probably will ultimately happen if nothing else “pour encourages les autres”, and if it does happen we would expect a massive liquidity program to try and prevent contagion. This liquidity injection and no doubt bank deposit guarantee program would then effectively via roundabout routes mean a joint assumption of debts and a move towards a more Federal Europe. Given Germany’s rapidly expanding Target2 balances (Bundesbank claims against peripheral country central banks which is spiraling due to capital flight and now totals Euro 644bn as at 30
th April ), and the rapid drawdown of all the various bailout funds we are
effectively moving towards a European financial system that is increasingly guaranteed

Any Euro policy induced bounces will be used to add protection, ideally via puts. Whilst a move towards a federal Europe is likely, the chances of serious derailments along the way are high and we want protection against this if pricing is reasonable. The Chinese economy appears to be losing momentum quickly. Stockbrokers are calling for investors to buy China for forthcoming major stimulus measures - we take the opposite view. Why so? Firstly, significant policy initiatives are unlikely due to an impending major transition in political leadership. Secondly, we expect Chinese stimulus to disappoint in the face of a slowing global economy, and the rolling over in Chinese inflation and global commodity prices.
by Germany whether they like it or not. The old adage that “when you owe the bank US$1000 it’s your problem, but when you owe the bank US$1trill it’s their problem” clearly applies here. It is also the case of the law of unintended consequences that Angela Merkel’s desperate efforts to stave off German backed Eurobonds via austerity and Ponzi schemes has made them now inevitable unless of course Germany is happy to let the whole Euro edifice fall apart (which we think unlikely). In essence then we expect more of the same in Europe over the coming months (possibly years) as we lurch towards a Federal Europe. Economies in Southern Europe, unless they leave the Euro, are likely to be moribund and suffer 1930s depression-like conditions for some considerable period and this will leave the whole zone struggling for growth. The refusals to write off debts, let markets clear, undertake structural reforms and let deleveraging run its course if continued will result in a Japanese style lost decade. For the fund we will use any Euro policy induced
bounces as an opportunity to add protection, ideally via puts. Whilst we think a
move towards a federal Europe is likely, the chances of serious derailments along
the way are high and we want protection against this if pricing is reasonable.
CHINA – Why stimulus talk won’t boost stockmarkets The Chinese economy now appears to be losing momentum quite quickly. The latest numbers show that May’s power generation grew by only 2.7% YoY, the second lowest reading since 2002 (and vs. a 10- year median reading of 13%). Retail sales and inflation are both moderating fast with only fixed asset investment (shock horror given complete lack of rebalancing) holding up at 20% plus YoY growth. With the economy slowing sharply the China “experts” working for many stockbrokers have sharpened their pencils and written the usual notes exhorting the gullible to buy China for forthcoming major stimulus measures. We take the opposite view – any bounce in China’s stockmarkets (and on commodity and cyclical names) on stimulus driven talk should be sold into. Why is this? 1. Politics. We have a major transition to new leadership at the end of this year.
With most of the politburo and key decision making committees in China about to undergo very major change it is unlikely we are going to see significant policy initiatives when no-one knows who will be in charge of what in 12 months’ time. As the Bo Xilai scandal hints there is much going on behind the scenes in China that no-one is able to predict, least of all those highly paid sell side “experts” who completely missed the most significant political event in China for the last 10 years. Premier Wen is likely to make supportive and soothing remarks about a China stimulus and supporting global growth, but like politicians in Europe these remarks are unlikely to be followed through by significant action.
2. The global economy is slowing and Chinese inflation and global commodity prices
are rolling over. Given we expect any Chinese stimulus measures to disappoint both in their size and efficacy we don’t see them having a major impact on global growth. Contrary to claims from some on the sell side, there is no evidence that Chinese stockmarkets do well in a slow inflation environment or that the market benefits from falling commodity prices. Indeed as Chart 2 highlights, China markets only really do well in a high inflation, high commodity price environment in both a relative and absolute context

Real interest rates are now rising and likely to drag on the economy as effective capital costs rise.
CHART 2: Historically MSCI China performs best in rising commodity markets both on a relative and absolute basis
Source: Factset, Morgan Stanley Research
This is another good example of the law of unintended consequences. China’s economy doesn’t like slowing inflation as China runs its economy with very significant negative real interest rates (nominal interest rates less inflation) as the Government penalizes savers to fund China’s investment bubble. With inflation falling real interest rates are now rising (see Chart 3) and this is likely to drag on the economy as effective capital costs rise. CHART 3: China’s real savings deposit rate – cost of capital finally rising?
Source: Asianomics, Haver
Thirdly, Chinese banks are struggling with liquidity shortages and rising bad debts; they’re therefore not in a position or are not willing to lend to provide support for stimulus measures. Demand for loans is expected to be low against a backdrop of years of malinvestment and overcapacity within a deflationary economy. The 2008-10 credit-fueled investment bubble was widely considered a mistake - we do not see the ingredients or appetite for a repeat of the same.
3. Banks in China are struggling with liquidity shortages and rising bad debts and are
thus either not in a position to lend or are not willing to lend to support stimulus measures. The more we look at Chinese banks the more nervous we get. As most readers will know we have been negative on Chinese banks for a considerable period of time. However recent work we have done on wealth management products, credit guarantee companies and trust companies in China suggest to us the risks of major systemic financial problems are rising and the situation is materially worse than we originally thought. We plan to discuss this more in our mid-year update next month but be warned it is unlikely to be a pretty tale.
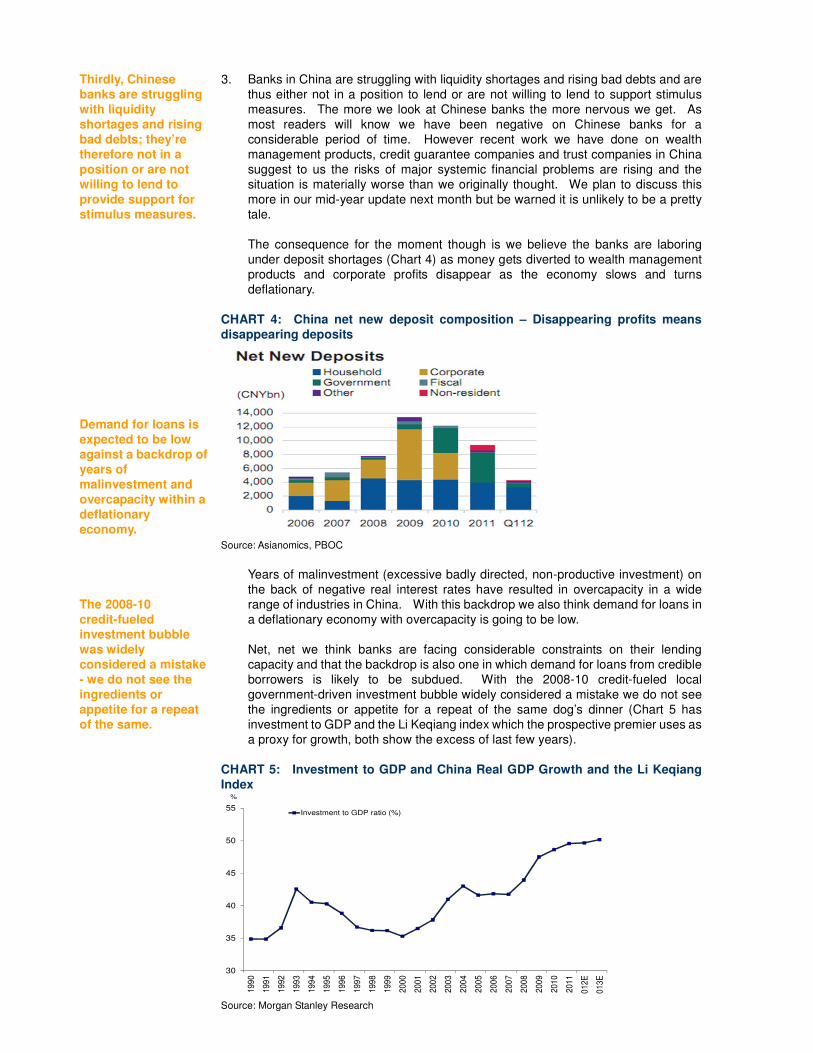
The consequence for the moment though is we believe the banks are laboring under deposit shortages (Chart 4) as money gets diverted to wealth management products and corporate profits disappear as the economy slows and turns deflationary.
CHART 4: China net new deposit composition – Disappearing profits means disappearing deposits Source: Asianomics, PBOC
Years of malinvestment (excessive badly directed, non-productive investment) on the back of negative real interest rates have resulted in overcapacity in a wide range of industries in China. With this backdrop we also think demand for loans in a deflationary economy with overcapacity is going to be low. Net, net we think banks are facing considerable constraints on their lending capacity and that the backdrop is also one in which demand for loans from credible borrowers is likely to be subdued. With the 2008-10 credit-fueled local government-driven investment bubble widely considered a mistake we do not see the ingredients or appetite for a repeat of the same dog’s dinner (Chart 5 has investment to GDP and the Li Keqiang index which the prospective premier uses as a proxy for growth, both show the excess of last few years).
CHART 5: Investment to GDP and China Real GDP Growth and the Li Keqiang Index
30
35
40
45
50
55
199
0
199
1
199
2
199
3
199
4
199
5
199
6
199
7
199
8
199
9
200
0
200
1
200
2
200
3
200
4
200
5
200
6
200
7
200
8
200
9
201
0
201
1
2012
E
2013
E
Investment to GDP ratio (%)
%
Source: Morgan Stanley Research
We believe the key to any Chinese stimulus is in reality the property market – property and related activities easily surpass 20% of China’s GDP. With affordability issues and the property market bubble prone, we think the government will loath to reflate this bubble.
Source: DSG Asia
4. Lastly, why we believe stimulus talk is a chance to sell not buy, is that the key to any
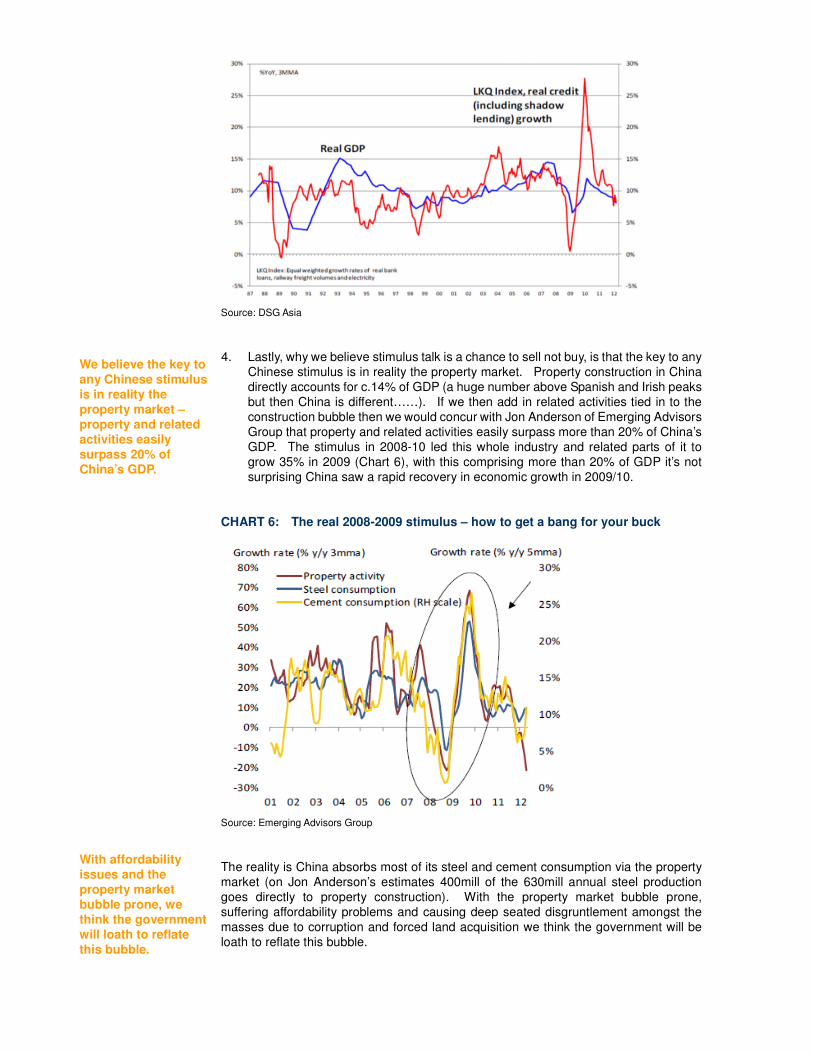
Chinese stimulus is in reality the property market. Property construction in China directly accounts for c.14% of GDP (a huge number above Spanish and Irish peaks but then China is different……). If we then add in related activities tied in to the construction bubble then we would concur with Jon Anderson of Emerging Advisors Group that property and related activities easily surpass more than 20% of China’s GDP. The stimulus in 2008-10 led this whole industry and related parts of it to grow 35% in 2009 (Chart 6), with this comprising more than 20% of GDP it’s not surprising China saw a rapid recovery in economic growth in 2009/10.
CHART 6: The real 2008-2009 stimulus – how to get a bang for your buck
Source: Emerging Advisors Group
The reality is China absorbs most of its steel and cement consumption via the property market (on Jon Anderson’s estimates 400mill of the 630mill annual steel production goes directly to property construction). With the property market bubble prone, suffering affordability problems and causing deep seated disgruntlement amongst the masses due to corruption and forced land acquisition we think the government will be loath to reflate this bubble.

Is China property then a major buddle waiting to burst? Many cities clearly face excesses and significant malinvestment, although broad affordability is not scary and income levels are rising quickly.
It is also the case that the sector is currently suffering significant oversupply resulting from the past stimulus. In the first quarter residential property transactions were down 15% YoY, meanwhile new starts are down 5-10% whilst completions from the last stimulus round are rising 33% (see Chart 7). Chart 7: Property Still Weak as Completions Surge
-100%
-50%
0%
50%
100%
150%
200%
250%
20
00
20
00
20
01
20
01
20
02
20
02
20
03
20
03
20
04
20
04
20
05
20
05
20
06
20
06
20
07
20
07
20
08
20
08
20
09
20
09
20
10
20
10
20
11
20
11
20
12
Building Sold: Residential YoY %
Source: Morgan Stanley Research
China: Completed Buildings: Residential BldgChina: Completed Buildings: Residential BldgChina: Completed Buildings: Residential BldgChina: Completed Buildings: Residential Bldg% Change - Year to Year YTD, Mil.Sq.Meters
China: Newly Started Construction: Residential BldgChina: Newly Started Construction: Residential BldgChina: Newly Started Construction: Residential BldgChina: Newly Started Construction: Residential Bldg% Change - Year to Year YTD, Mil.Sq.Meters
1111111110101010090909090808080807070707
80808080
60606060
40404040
20202020
0000
-20-20-20-20
80808080
60606060
40404040
20202020
0000
-20-20-20-20
Source: Asianomics, China Index Academy, Haver Analytics
Is China property then a major bubble waiting to burst as Hugh Hendry and Jim Chanos would have us believe? Cherry picking ghost cities and white elephant projects from Google earth would certainly suggest so. However we think this is dangerous. Clearly many cities face excesses, there is significant malinvestment, widespread speculation and some projects will fail leaving banks with a large bill. However on the other side broad affordability in China is not that scary and income levels are still rising quickly. Much of the current housing stock is also extremely poor and we do believe there is genuine strong underlying demand for affordable well located projects.

We do think there are issues in China’s property sector; however we don’t envisage a complete collapse although we expect limited scope for a major stimulus. Overall on China, we therefore don’t expect to see a significant stimulus or one that will prove effective due to concerns discussed above. From recent company visits and conferences in the region, the picture is one of slowing though not collapsing demand, one that is slowing more rapidly in North Asian than ASEAN.
Net, net then we think there are problems in the property sector and we will see a significant slowdown as the market adjusts. We don’t believe we will see a complete collapse but equally well the scope for a major stimulus in this area is limited (the delta is negative here) and if the Government really was to try to reflate the property bubble they would be playing with fire. Perhaps the chart on cement (Chart 8) we have used before best illustrates our view on China property and related industries. As can be seen the China property bubble of last few years causes the cement consumption line to go straight up in a dramatic trajectory. After this kind of bubble there are typically 2 paths: the Korea and Taiwanese one of a gradual inverted “U” shaped fall or there is the Spanish or Irish one of a straight arrow down. In the case of China we expect the former (the inverted “U”) as reasonable affordability, rising urbanization and structural demand from upgraders leads to a slowdown rather than collapse in property activity. Chart 8: China cement demand we expect it to follow a Korean U rather than Spanish Flu
Source: JP Morgan
So bringing this all together, what does it mean for our China strategy and the fund? We don’t see a significant stimulus taking place or proving effective in China due to politics, an increasingly stressed financial system, and an oversupplied property market. Politicians and market commentators will talk incessantly about it but any market bounces in cyclical sectors should be viewed as selling opportunities not buying chances. This would particularly be the case for steel, chemicals, cement, construction equipment, copper, iron ore, coking coal and thermal coal all of which face waning demand at a time of structural oversupply. ACTION ON FUND – RECENT COMPANY VISITS The last few weeks have been a busy time for your fund managers and the Asian research team. With several conferences in the region and year end reporting and Q1 reporting for companies completed we have been out visiting a wide range of businesses across Asia. In general the picture is one of slowing but not necessarily collapsing demand – with North Asia generally seeing a more rapid slowdown than the ASEAN countries. What is interesting is watching how different companies adapt to the changing environment. Given the weakness in China shares we had hoped our visits here would throw up some interesting ideas, however in general our China visits have left us more cautious than ever and we have not added to the fund’s China related names. Why can we find nothing to buy in China despite the weakness? Our visits confirm the following patterns in many Chinese corporates:

In spite of weakness in Chinese shares, we’re returned from these visits more cautious than ever and have not added to our China related names.
1. National service obligations e.g. banks where we have just had asymmetric rates
cuts and potential forced lending to SOEs, and then oil companies where overseas M&A and oil price regulation that means shareholder interests are compromised.
2. High gearing and poor working capital management amongst domestic China shares which suggest underlying financials are much weaker than expected and management teams are struggling to adapt to a slower growth environment (perhaps not surprising given many China companies have never really seen an economic cycle).
Charts 9 and 10 from Goldman Sachs we think highlight the extent of the indebtedness (Chart 9) and the deteriorating balance sheets in industrial and property companies (Chart 10). Both are worrying and suggest to us the profit cycle in China could be vicious as the economy slows. CHART 9 : China corporate debt has jumped to 134% of GDP in 2011 from 98% in 2008. This is storing up problems as the economy slows.
4.3% 6.4% 8.9% 11.6% 12.4% 11.9% 11.1% 12.3% 11.9%15.6% 18.7% 18.8%9.2%
10.0%13.6%
15.5% 15.1% 17.2% 15.9%19.4% 16.8%
17.5%16.7% 14.9%
13.1%11.9%
10.8%9.6% 10.6%
12.9%11.0%
9.0%10.0%
9.2% 7.8%6.7%
0.0%
7.3%
8.9%10.4%
11.5%12.8%
14.0%14.4% 15.1%
22.5% 22.7%20.3%
101%
95%
98%
103% 94% 87%85% 78%
75%
87% 85%
84%
7%7%
8%
8%
9% 7%7% 7% 9%
7%
9% 10%
135% 138%
149%
161%156%
154% 151% 151% 151%
180%
192%194%
0%
20%
40%
60%
80%
100%
120%
140%
160%
180%
200%
2000 2001 2002 2003 2004 2005 2006 2007 2008 2009 2010 2011
Informal lending
Loans made by HK banks*
Micro lendings*
Trust loans not captured byPBoC data*
Pawnshop loans*
Bank acceptance
Entrust loans***
Trust loans captured by PBoCdata
ABS
Medium-term notes
Short-term note
Corporate bonds
Corporate loans (excl. LGPloans)
Convertibles
LGP loans
NPLs carved out for bankrestructuring
Government bonds
Consumer loans
Total loans and debt as % ofGDP
(as % of GDP)(as % of GDP)
Consumer leverage
Government leverage
Quasi-govn't leverage
Corporate leverage
Source: Goldman Sachs
Chart 10: Listed industrial and property companies in China are seeing rapidly deteriorating cash cycles and greater Balance Sheet stress as the economy slows.
Listed industrial companies
2009 2010 1Q11 1H11 2011 1Q12 2011 yoy% 1Q12 yoy%
No. of companies surveyed 430 430 429 430 429 429
A/R days 75.1 69.3 81.6 77.2 74.1 92.9 4.8 11.3
A/P days 142.7 140.5 151.2 145.3 141.1 165.0 0.6 13.8
Inventory days 90.9 96.8 110.7 104.1 104.7 132.0 7.9 21.3
Cash cycle (days) 23.3 25.6 41.1 36.0 37.7 59.9 12.1 18.8
Listed property companies
2009 2010 1Q11 1H11 2011 1Q12 2011 yoy% 1Q12 yoy%
No. of companies surveyed 120.0 121.0 121.0 121.0 121.0 121.0
A/R days 55.8 66.3 101.7 88.3 64.4 104.8 (1.8) 3.1
A/P days 359.2 383.0 579.4 496.5 459.5 706.5 76.5 127.1
Inventory days 1,281.4 1,465.3 2,495.6 2,242.3 1,765.4 2,963.3 300.1 467.8
Cash cycle (days) 978.0 1,148.6 2,017.9 1,834.1 1,370.4 2,361.7 221.7 343.8
Source: Goldman Sachs
We continue to be concerned with national service obligations, high gearing, poor working capital management, irrational competition and “diworsification” in China. Coupled with what we’re seeing at the company level, we are finding nothing to buy in China in spite of weakness. ASEAN companies on the other hand continue to enjoy resilient demand and stable margins; in Hong Kong we are finding the best opportunities with professional and experienced management teams at the helm. We have made few changes to the portfolio following these recent visits, only taking profit in the Philippines and Malaysia and adding to favoured HK industrials and property stocks. Our tactical model is currently cautious; another 5-10% downside will push valuation and sentiment indicators into the “buy” zone. Long term country models are positive on all Asian markets. We will use sell-offs
3. Irrational competition in China and lack of creative destruction. In many Chinese industries state owned enterprises, with effectively free and unrestricted access to capital, mean you have gluts of overcapacity and no industry consolidation. This is leading to irrational competition and severe margin pressure. Solar panels and wind turbines are the most spectacular examples of this, but steel, cement, heavy equipment, autos, department stores, malls, hotels etc etc all suffer from the same capacity and competition problems. With no creative destruction you end up with flawed industries where all operators make suboptimal returns – this can be particularly painful in a downturn. As Anhui Conch’s recent 50% profit warning showed when things slow margins can collapse, and frighteningly enough Anhui Conch is the lowest cost cement producer in China so we hate to think what is happening to balance sheets and margins of weaker players.
4. Diworsificiation – a great word which I’ve stolen from independent strategist David Scott which he coined in the 1995/96 to describe ASEAN companies which during the investment bubble then used cheap funds to buy businesses overseas to (unsuccessfully) try and offset falling profitability at home. Several Chinese companies we have seen in recent weeks have discussed with us their strategy to move overseas to offset slowing margins at home, including one fast food company suffering -20% same store sales growth in China due to excessive competition who have decided to expand to UK and USA ideally via M&A. We are also seeing this in the auto, resource and construction equipment sectors.
In general then we are finding little to buy in China and the more we look at the individual company level the more cautious we become. In contrast ASEAN and HK company meetings have been more promising. Many of our ASEAN companies continue to enjoy relatively resilient demand and stable margins in what are mostly competitive but rational industries. However it is in HK we are finding the best opportunities. With the market out of favour due to poor sentiment surrounding China we are finding good value in pockets of the market particularly in some of the industrial and property names where we have professional and experienced management teams who have successfully steered their business through the turmoil of the last 15 years. We have also been pleased to see most of the IPOs in Asia being pulled over the last couple of months. Many of these proposed listings like Formula 1, Graff Diamonds, Manchester United had little to do with Asia and we were becoming increasingly concerned that Asian markets were becoming dumping grounds for IPOs claiming a China angle. We have no doubt an improvement in market sentiment may cause the silly merry go-round to start again, and we think deals such as these highlight very clearly why investors should never confuse stockmarket returns in Asia with economic growth. Overall at the company level after all our recent visits we have made few changes. We are still comfortable with the names we hold in the fund and have come up with few new ideas. The only material action we have taken over the last month was to sell some of our holdings in Philippines and Malaysia which had done well and we used the proceeds to add to favoured HK industrials and property stocks and HSBC. We also used the weakness in gold prices and mining stocks as an opportunity to add to our two gold plays in Australia. ACTION ON FUND – HEDGING STRATEGY Our short term tactical model is currently cautious due to financial stress and economic indicators both of which suggest market downside. Having said this, our valuation indicator as at end May was nearing stress levels and another 5-10% is likely to push both our valuation and sentiment indicators into the “buy” zone which would cause a reappraisal of strategy. The long-term country models within the fund are all positive, suggesting on a 12-18 month view markets in Asia are oversold and offering upside. We would not disagree with this view. However due to the Europe and China worries highlighted earlier we believe the current can-kicking is potentially nearing an end and that the risk of further market sell-offs is high. We would however use sell-offs from here as a chance to raise
as a chance to raise net longs.
net longs, particularly if we started to see greater moves towards rebalancing and liberalization in China where, unlike Europe, we view the current problems as more cyclical rather than deep seated and structural.
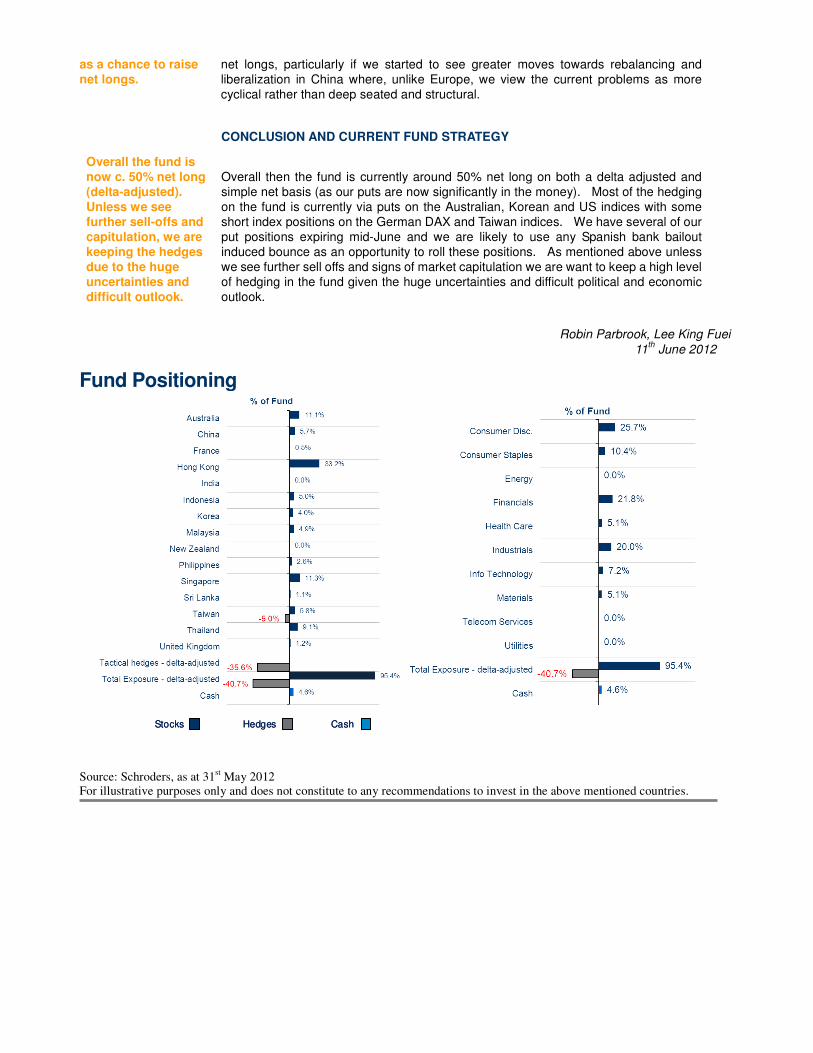
Overall the fund is now c. 50% net long (delta-adjusted). Unless we see further sell-offs and capitulation, we are keeping the hedges due to the huge uncertainties and difficult outlook.
CONCLUSION AND CURRENT FUND STRATEGY
Overall then the fund is currently around 50% net long on both a delta adjusted and simple net basis (as our puts are now significantly in the money). Most of the hedging on the fund is currently via puts on the Australian, Korean and US indices with some short index positions on the German DAX and Taiwan indices. We have several of our put positions expiring mid-June and we are likely to use any Spanish bank bailout induced bounce as an opportunity to roll these positions. As mentioned above unless we see further sell offs and signs of market capitulation we are want to keep a high level of hedging in the fund given the huge uncertainties and difficult political and economic outlook.
Robin Parbrook, Lee King Fuei
11th June 2012
Fund Positioning
Source: Schroders, as at 31st May 2012
For illustrative purposes only and does not constitute to any recommendations to invest in the above mentioned countries.
Stocks Hedges CashStocks Hedges Cash

Top 10 Holdings
Fund (%)
Jardine Strategic Holdings 5.2%
Jardine Matheson Holdings 5.0%
Swire Pacific ‘A’ & ‘B’ 3.9%
Jardine Cycle & Carriage 3.5%
Hyundai Motor 3.0%
Taiwan Semiconductor Manufacturing 2.7%
Siam Makro 2.6%
Kasikornbank 2.6%
Sembcorp Marine 2.4%
Keppel Corp 2.4%
Total 33.3%
Source: Schroders, as at 31st May 2012
For illustrative purposes only and does not constitute to any recommendations to invest in the above mentioned securities.
Fund Performance Performance of Schroder International Selection Fund Asian Total Return (‘C’ Class Accumulation Units) Since Inception (16 November 2007) to 31
st May 2012
Annualised
Since inception
C Class Shares (USD) -6.9 -4.4 6.0 -3.9 18.3 11.2
MSCI AC Asia Pacific ex
Japan-10.4 -12.7 1.3 -17.8 9.9 -3.8
USD 3 month LIBOR 0.0 0.1 0.2 0.4 0.4 1.1
% Returns in USD
3 Years
AnnualisedMay 12 3 months
Year to
date1 Year
Source: Bloomberg, Schroders, as at 31st May 2012 For illustrative purposes only and should not be construed as a forecast, prediction or projection of the future or likely performance of the fund.
40
60
80
100
120
140
160
180
Nov-07
Dec-07
Jan-
08
Mar
-08
Apr-0
8
May
-08
Jun-
08
Jul-0
8
Sep-0
8
Oct-0
8
Nov-08
Dec-08
Jan-
09
Mar
-09
Apr-0
9
May
-09
Jun-
09
Jul-0
9
Sep-0
9
Oct-0
9
Nov-09
Dec-09
Jan-
10
Mar
-10
Apr-1
0
May
-10
Jun-
10
Jul-1
0
Aug-1
0
Oct-1
0
Nov-10
Dec-10
Jan-
11
Feb-1
1
Mar
-11
May
-11
Jun-
11
Jul-1
1
Aug-1
1
Sep-1
1
Oct-1
1
Dec-11
Jan-
12
Feb-1
2
Mar
-12
May
-12
Ind
exed
Retu
rns (
US
D)
Schroder ISF Asian Total Return Fund MSCI AC Asia Pacific ex Japan Net Index (Rebased)3 Month USD LIBOR Eurekahedge Asia Pacific Absolute Return Fund Index

Periods to 31st May 2012 1 Year3 Years
Annualised
Ann. Since
Inception
Annualised
Standard
Deviation
Sharpe Ratio
(RFR = USD 3
M\th LIBOR)
Schroder International Selection
Fund Asian Total Return (C Class)-3.9% 18.3% 11.2% 22.1% 0.4
Lipper Equity Asia Pacific ex Japan
Universe-18.1% 8.1% -4.4% 28.4% -0.2
Quartile ranking (Fund ranking) Q1(8/683) Q1(9/522) Q1 (1/447) Q1 (12/450) Q1 (1/450)
Eurekahedge Asia Pacific Absolute
Return Universe-11.6% 7.1% -3.0% 20.3% -
Eurekahedge Asia ex Japan Hedge
Fund Universe-11.5% 4.7% 0.1% 12.8% -
Fund & Benchmark Analysis
Fund Statistics
Fund
Monthly Avg Return (%) 1.04%
Sharpe Ratio 0.42
Sortino Ratio 0.36
Maximum Drawdown -46.37%
Best Month 17.02%
Beta 0.71
Correlation 0.94
% positive months 61%
Fund & Benchmark Analysis
FundMSCI AC Asia
Pacific x J
Down mkt days
Avg Returns (%) -0.71 -1.32
% Positive Return Days 17% 0%
Up mkt days
Avg Returns (%) 0.73 1.20
% Positive Return Days 87% 100%
Maximum daily drawdown -7.09 -8.98
Source: Schroders, Bloomberg, fund data based on Schroder International Selection Fund Asian Total Return ‘C’ Class Share,
since fund inception up 31st May 2012
Fund Details
Investment Objective
Reference Benchmark
Fund Base Currency
Fund Size
Inception Date
No. of Holdings
Fund Managers
To provide capital growth primarily through investment in equity and equity related securities
of Asia Pacific ex Japan companies. The Fund also aims to offer a degree of capital
preservation through the tactical use of financial derivative instruments.
MSCI AC Asia Pacific ex Japan Net IndexUSD
USD 1,547 mn
16 November 2007
61
Robin Parbrook, Lee King Fuei
Source: Schroders, as at 31st May 2012

Fee Schedule
Share Classes A Acc A1 Acc B Acc C Acc A Dis C Dis
Currency GBP GBP
Management Fee 1.50% 1.50% 1.50% 1.00% 1.50% 1.00%
TER** 2.07% 2.49% 2.68% 1.14% 2.07% 1.14%
Minimum account size€1,000 or
$1,000
€1,000 or
$1,000
€1,000 or
$1,000
€500,000 or
$500,000£1,000 £500,000
Minimum additional subscription€1,000 or
$1,000€1,000 or
$1,000€1,000 or $1,000
€250,000 or $250,000
£1,000 £250,000
Dealing frequency
ISIN (USD) LU0326948709 LU0326949269 LU0326949004 LU0326949186 LU0378801590 LU0378802051
Bloomberg Code (USD) SCHABRA LX SCHARA1 LX SCHASRB LX SCHASRC LX SISFAAD LX SISFAAC LX
ISIN (EUR Hedged) LU0372739705 LU0372740893 LU0372741198 LU0372741511
Bloomberg Code (EUR Hedged) SATRAAE LX SATA1AE LX SATRBAE LX SATRCAE LX
Daily
USD, EUR Hedged
*The Fund’s performance fee has been removed and the corresponding reference benchmark has been amended to the MSCI AC Asia Pacific ex Japan Net index with effect 1
st July 2009. Management fee on the C share class has been raised to 1.0% with effect 1
st April 2011. **TERs quoted are audited figures for
calendar year 2009.
Definitions
Sharpe Ratio
A return/risk measure. Return (numerator) is defined as the
incremental average return of an investment over the risk free
rate. Risk (denominator) is defined as the standard deviation of
the investment returns. The risk free rate used is US 3 Month
LIBOR.
Beta
Beta is the slope of the regression line. Beta measures the risk of a
particular investment relative to the index. It describes the sensitivity
of the investment to broad market movements.
Sortino Ratio
A return/risk measure. Return (numerator) is defined as the
incremental compound average period return over a Minimum
Acceptable Return (MAR). Risk (denominator) is defined as the
Downside Deviation below a Minimum Acceptable Return (MAR).
The MAR used is US 3 Month LIBOR.
Correlation
Measures the extent of linear association of two variables in this
document, between the performance of the Fund and the index.
The measure is always comprised between -1 and +1. A
measure of +1 reflects a perfect positive relation, a measure of
-1, a perfect negative relation and a measure of 0, no relation at
all.
Drawdown
Drawdown is any losing period during an investment record. It is
defined as the percent retrenchment from an equity peak to an
equity valley. A drawdown is in effect from the time a valuation
retrenchment begins until a new valuation high is reached. (i.e. in
terms of time, a drawdown encompasses both the period from
equity peak to equity valley (Length) and the time from the equity
valley to a new equity high
(Recovery).
Important Informat ion: The in format ion in th is document is based on management forecasts and ref lects preva i l ing condi t ions and our v iews as of th is date, a l l of which are accord ing ly subject to change. In prepar ing th is document , we have rel ied upon and assumed, w ithout independent ver if icat ion, the accuracy and completeness of a l l in format ion avai lab le from publ ic sources or which was provided to us by or on behalf o f the potent ia l investor or which was otherwise reviewed by us. Al l opinions or est imates conta ined in these documents are ent i re ly judgement of Schroder Investment Management (Singapore) L imited as of the date of th is document and are subject to change without not ice. Investment invo lves r isks. Past performance is not necessar i ly a gu ide to future performance. You should remember that the va lue of investments can go down as wel l as up and is not guaranteed. Exchange rate changes may cause the va lue of the overseas investments to r ise or fa l l . The information contained in th is document is provided for in format ion purpose on ly and does not const itute any so lic i ta t ion and offer ing of investment products. Potent ia l investors should be aware that such investments invo lve market r isk and should be regarded as long- term investments. Der ivat ives carry a h igh degree of r isk and should only be considered by sophist icated investors. Schroder Investment Management (Singapore) Limited 65 Chulia Street #46-00 OCBC Centre Singapore 049513 Tel:::: +65 6535 3411 Fax:::: +65 6535 3486