Review Biomedical Optical Imaging
13
Review of biomedical optical imaging—a powerful, non-invasive, non-ionizing technology for improving in vivo diagnosis This article has been downloaded from IOPscience. Please scroll down to see the full text article. 2009 Meas. Sci. Technol. 20 104020 (http://iopscience.iop.org/0957-0233/20/10/104020) Download details: IP Address: 148.214.113.144 The article was downloaded on 17/11/2010 at 15:50 Please note that terms and conditions apply. View the table of contents for this issue, or go to the journal homepage for more Home Search Collections Journals About Contact us My IOPscience
-
Upload
edgar-aguilar-carrillo -
Category
Documents
-
view
227 -
download
2
Transcript of Review Biomedical Optical Imaging
Review of biomedical optical imaging—a powerful, non-invasive, non-ionizing technology for
improving in vivo diagnosis
This article has been downloaded from IOPscience. Please scroll down to see the full text article.
2009 Meas. Sci. Technol. 20 104020
(http://iopscience.iop.org/0957-0233/20/10/104020)
Download details:
IP Address: 148.214.113.144
The article was downloaded on 17/11/2010 at 15:50
Please note that terms and conditions apply.
View the table of contents for this issue, or go to the journal homepage for more
Home Search Collections Journals About Contact us My IOPscience
IOP PUBLISHING MEASUREMENT SCIENCE AND TECHNOLOGY
Meas. Sci. Technol. 20 (2009) 104020 (12pp) doi:10.1088/0957-0233/20/10/104020
Review of biomedical optical imaging—apowerful, non-invasive, non-ionizingtechnology for improving in vivo diagnosisCostas Balas
Department of Electronic and Computer Engineering, Technical University of Crete Chania, Crete,Greece
E-mail: [email protected]
Received 30 January 2009, in final form 12 July 2009Published 4 September 2009Online at stacks.iop.org/MST/20/104020
AbstractThis paper reviews the recent developments in the field of biomedical optical imaging,emphasizing technologies that have been moved from ‘bench top to bedside’. Important newdevelopments in this field allow for unprecedented visualization of the tissue microstructureand enable quantitative mapping of disease-specific endogenous and exogenous substances.With these advances, optical imaging technologies are becoming powerful clinical tools fornon-invasive and objective diagnosis, guided treatment and monitoring therapies. Recentdevelopments in visible and infrared diffuse spectroscopy and imaging, spectral imaging,optical coherence tomography, confocal imaging, molecular imaging and dynamic spectralimaging are presented together with their derivative medical devices. Their perspectives andchallenges are discussed.
Keywords: biomedical optical imaging, spectroscopy, optical tomography, spectral imaging,optical coherence tomography, confocal imaging, endoscopy, microendoscopy, dynamicspectral imaging, cervix, neoplasia, cancer
1. Introduction
Biomedical optical imaging is a rapidly emerging field, withwidespread applications ranging from clinical diagnosis tomolecular biology. There is currently an ongoing revolutionin this field, which is led by the interdisciplinary cooperationof physicists, biologists, engineers, physicians, etc. Bothacademia and industry have allocated significant resources foradvancing this field.
Biomedical optical imaging techniques are expected tohave a substantial impact on the prevention and treatment ofcancer and of other lethal diseases [1]. This is because they (a)can probe both functional and structural changes with a highspatial resolution possessing in parallel nano or even femto-molar sensitivity [2]; (b) are non-invasive and non-ionizing;(c) are portable and of low equipment cost; (d) provideresults almost in real time; (e) can be adapted to microscopesand endoscopes to provide information in both microscopicand macroscopic scales, thus expanding their applicability to
almost all biomedical fields; and (f) can provide quantitativeinformation for objective diagnosis and follow-up.
The principal limitation of optical imaging is thepenetration depth, due to the strong scattering of opticalradiation in tissues. However, several recent advantagesin near-infrared (NIR) optical instrumentation and inmathematical modeling of light propagation in tissues havepushed this limit to a few centimeters. In the near-infraredpart of the spectrum, soft tissues exhibit an ‘optical window’due to the fact that their scattering, absorption and fluorescencecharacteristics are much lower than in the visible band.
NIR optical spectroscopy and imaging exploits this featurefor increasing the probing depth. This is further facilitatedby the recently developed biocompatible fluorescence tracersemitting at the near-infrared part of the spectrum. This hasenabled the detection of changes at the molecular level, indeep tissues. Optical molecular imaging is a new imagingmodality, where developments of disease-specific tracersare combined with advanced optical methods, targeting thedetection of abnormalities at their molecular stage. Optical
0957-0233/09/104020+12$30.00 1 © 2009 IOP Publishing Ltd Printed in the UK
Meas. Sci. Technol. 20 (2009) 104020 C Balas
coherence tomography and confocal imaging combined withcontrast agents enable the imaging of sub-surface tissueslices, providing histology images in vivo. Spectroscopyseeks spectral signatures of tissues under various conditionsand spectral imaging provides spectral mapping and narrow-band imaging. Finally, dynamic spectral imaging measuresdynamic optical signals in selected spectral bands and atmillions of tissue points and maps the uptake kinetics ofbiomarkers. From these data, functional and structuralpathologic alterations are detected, in vivo, which are usedfor the early detection and grading of neoplasia. The purposeof this paper is to outline the recent developments in thebiomedical optical imaging field, emphasizing novel opticalimaging technologies that have been moved from ‘bench topto bedside’.
2. Visible and infrared diffuse spectroscopy andimaging
Spectroscopy has been extensively investigated as a toolfor identifying various pathological conditions on the basisof their spectral signatures. Spectroscopy exploits thelight–tissue interaction phenomena in order to provideinformation for the biochemical and micro-structural changesoccurring in neoplastic growth. Different spectroscopy typesand modalities exist, depending on the optical propertythat it is intended to be measured, namely, absorption,spontaneous emission (fluorescence, phosphorescence),scattering (Rayleigh elastic, Raman inelastic) spectroscopy,etc. As the light travels into the tissue, photons experienceabsorption, which may result in fluorescence emissionand multiple scattering due to the local variation of theindex of refraction. The detected diffuse light oftencontains information for all these events cumulatively. Formaximizing the signal-to-noise ratio for the property underinvestigation and for disentangling the spectral information,specific excitation–emission configurations are used, often incombination with spectral deconvolution algorithms.
Among the important advantages of diffuse spectroscopyis that inexpensive, commercial spectrometers are requiredfor collecting the spectra. Typically, fiber-optic probes areemployed for both tissue illumination and collection of theremitted diffuse light. The collected light passes through alight dispersing element (grating), which spatially splits thelight wavelengths onto the surface of an optical sensor array,interfaced with a computer for recording and processing thespectrum. An additional advantage of spectrometers usingfiber-optic probes is that they can be used with endoscopes,thus enabling spectral data collection from internal organs, invivo. Tissue illumination can be provided by either a broadband (e.g. white light) or a narrow band light source. Inthe first case, the measured spectra provide information forthe absorption and scattering characteristics of the tissue. Inthe second case, the measured spectra probe the fluorescencecharacteristics of the tissue. Particularly, in steady-statefluorescence spectroscopy, a narrow-band light source is usedfor fluorescence excitation, such as lasers, LEDs or filteredlight sources, emitting typically in the blue–ultraviolet band.
A sensitive optical sensor is used for collecting the emissionspectra, typically in the visible part of the spectrum.
As it has been stated earlier, the diagnostic potential ofabsorption/scattering spectroscopy is based on the assumptionthat the absorption and scattering characteristics of the tissuechange during the neoplastic growth. Dysplastic changesinclude increased nuclear size of epithelial cells, increasedDNA content and hyperchromasia with coarse and irregularchromatin clumping, which increase scattering [3]. Dysplasticchanges also affect the stroma beneath the epithelium. It isbelieved that the volume fraction of collagen fibers decreasesas dysplasia develops [4], leading to decreased scatteringin the stroma. Moreover, dysplasia changes the vascularpattern through the associated angiogenic activity, increasingthe hemoglobin concentration. This results in an increase oflight absorption from the stroma.
Over the last 20 years, a variety of clinical studieshave been conducted investigating the diagnostic potentialof absorption/scattering spectroscopy in numerous organs,including bladder, colon, esophagus, oral cavity, skin, cervixand lung [5–9]. Absorption/scattering measurements havebeen used for determining the total amount of blood [5],hemoglobin concentration and oxygen saturation, as well asthe effective scatterer size using diffusion theory [6]. Thederived parameters have been used in clinical studies fordiscriminating dysplastic from non-dysplastic tissues withvarious degrees of success.
Fluorescence spectroscopy has also been extensivelyinvestigated over the past few decades. It targets the detectionof intrinsic or endogenous fluorophores, the concentration ofwhich changes during neoplastic growth. The endogenousfluorophores that are assumed to play a role in transformationsthat occur with carcinogenesis are the amino acids tryptophanand tyrosine [10], the structural proteins collagen andelastin [11], the coenzymes reduced nicotinamide adeninedinucleotide (NADH) [10] and flavin adenine dinucleotide(FAD) and porphyrins [12].
Visible fluorescence spectroscopy has been exploredextensively as a potential diagnostic tool in a wide range oforgan sites such as colon, cervix, bronchus, lung, bladder,brain, esophagus, atherosclerotic plaque, head and neckcancer, skin, breast and stomach tissues [13–15]. The commonevidence is that the fluorescence signal of malignant tumorsis less intense than that of the normal tissue. However, thereported sensitivities and specificities in identifying variouscancerous and precancerous conditions, based on processedfluorescence spectral data, vary significantly in the ranges 40–100% and 65–100%, respectively [16].
Both fluorescence and diffuse reflectance spectra arebroad, due to the complex nature of biological tissues.Scattering cross sections are quite high in tissues, which mayresult in a distortion of the fluorescence signal. Moreover,absorption of fluorescence photons may result in artificial dipsand peaks in the fluorescence spectra. Furthermore, both theintensity and the line shape of fluorescence are affected by theillumination and collection geometry [17]. The widely varyingperformances of the presented spectroscopic techniques couldbe attributed to these problems.
2
Meas. Sci. Technol. 20 (2009) 104020 C Balas
Attempting to improve the diagnostic information,absorption and fluorescence spectroscopies have beencombined and spectral data from both are modeled andprocessed, using suitable algorithms. Several studieshave focused on evaluating the hypothesis that thesimultaneous use of diffuse reflectance and fluorescencespectroscopy (multimodal spectroscopy) could potentiallyprovide complementary information, thus increasing thediagnostic accuracy. It has been reported that informationfrom reflectance spectra can be used to disentangle effectsof scattering and absorption from fluorescence spectra [18].Trimodal configurations, by adding scattering spectroscopy,have also been reported [19]. While the performance isimproved by a multimodal approach, the complexity and thecost of the instrument increase in parallel.
As an alternative or complementary to the above-mentioned approach, empirical and physical models havebeen employed for the analysis and classification of spectraldata. In the first case, data dimensionality is reducedeither qualitatively or statistically by using techniques suchas principal component analysis (PCA) or multivariate linearregression (MVLR). The derived features comprise the input ofclassifiers, typically including binary, Bayes, neural networksor support vector machines (SVM), for discriminating normalfrom pathological tissues [20, 21]. Physical models, based ondiffusion theory, are also used for disentangling informationcontained in spectra. Another approach is the simulation ofphoton propagation in tissues using Mode Carlo modeling.
Optical spectroscopy is in principle limited in its abilityto resolve in-depth information. The absorption and scatteringcharacteristics of tissue components, such as water, fat,oxyhemoglobin (HbO2) deoxyhemoglobin (Hb) and melanin,determinine the penetration depth of light in tissues. In theultraviolet–visible part of the spectrum (<700 nm), light canpenetrate tissues of a few hundred microns to a millimeter indepth [16]. However, in the NIR spectral region (700–900 nm),tissues are significantly less absorbing. This enables thelight to propagate several centimeters in depth. For thisreason, this NIR spectral region is often called an ‘opticalwindow’ [22] as the photons are able to penetrate the tissuefar enough to illuminate and detect pathological alterationsin deeper structures. For wavelengths longer than 900 nm,the absorption coefficient of water increases significantly,which sets the upper limit of the ‘optical window’ spectralrange. However, light scattering in this band plays an equallyimportant role in probing these alterations. Scattering isstrong in the visible part of the spectrum, decreasing forlonger wavelengths, where Mie scattering starts to dominate.However, scattering is strong even for wavelengths longer thanthe upper limit of the optical window. Strong scattering setssignificant limits on our ability to spatially resolve the lightinformation that arrives at the probe from deeper layers.
NIR spectroscopy (NIRS) capitalizes on the ‘opticalwindow’ for obtaining functional and structural informationfrom deeper tissue structures. Since the first in vivo useof NIRS by Frans Jobsis, in 1977, several experimentalapproaches have been developed, which are briefly outlinedbelow [23]. In NIRS continuous wave (NIRS-CW) systems,
tissues are illuminated with light of constant amplitude andamplitude decays are measured at the exit points. In theNIRS frequency domain (NIRS-FD) approach, amplitude-modulated light sources are used and amplitude decays andphase shifts of the remitted light are recorded. Finally, inthe NIRS time resolved (NIRS-TR) approach, ultra-short lightpulses are delivered into the tissue and the time distributionof diffusive photons is recorded [23]. In most cases, selectedspectral bands are used, which are determined by the spectralcharacteristics of the target tissue feature, taking into accountthe optical properties of the surrounding tissues. Reductionof the detection spectral bands facilitates the configurationof NIRS to obtain imaging information, either by usingmultisensor/multisource arrangements or by spatial scanningof single point detectors. This imaging modality is known asdiffuse optical imaging (DOI) [24]. The major challenge is todiscriminate between scattering and absorption coefficients,for increasing both the penetration depth and the spatialresolution. This challenge motivates the technological andtheoretical developments in the field. NIRS-FD and NIRS-TD, being the most recent, advanced and effective approaches,can spatially resolve information from deeper structures, thusenabling their imaging. They exploit the fact that the travelingtime of photons into the tissue increases with the number ofscattering events that they are experiencing. The less scatteredphotons have shorter ‘time of flight’ into the tissue and areseparately detected either as the ones arriving earlier at thesensor (NIRS-TD) or as the ones with the minimum phaseshifts in relation to the incoming modulated photons (NIRS-FD) [22].
The time response of NIRS and DOI is fast, makingthem suitable for monitoring dynamic effects, such asthe functional characteristics of the human brain. Theconcentrations of oxyhemoglobin and deoxyhemoglobin aremeasured dynamically in the brain, through their NIRabsorption characteristics. This has added new dimensionsin brain research and particularly in cerebral oxygenationinvestigations. It has been discovered that they canmonitor hemodynamic signals related to cerebral activation,making functional neuroimaging with DOI a very promisingdevelopment [25]. The basic limitations of functional NIRSare the low spatial resolution (0.5 cm) and the penetrationdepth, which is about 2 cm from the scalp [23]. NIRS and DOIhave also been applied to study muscle oxidative metabolism[26, 27].
In a number of applications, NIRS has been configuredto provide cross-sectional or 3D images of living tissues [25].This configuration is known as diffuse optical tomography(DOT). The DOT technique has been tested in rat and humanbrain studies and its feasibility in extracting informationabout blood flow, oxygenation and oxygen metabolism wasdemonstrated [28–30]. DOT has also been used for breastcancer detection. Here, the diagnostic potential of DOTis based on the hypothesis that tumor growth is associatedwith angiogenesis and consequently with an increased bloodcontent [31]. Clinical trials [32–38] have demonstrated thatit can provide functional information related to breast tumorpatho-physiology.
3
Meas. Sci. Technol. 20 (2009) 104020 C Balas
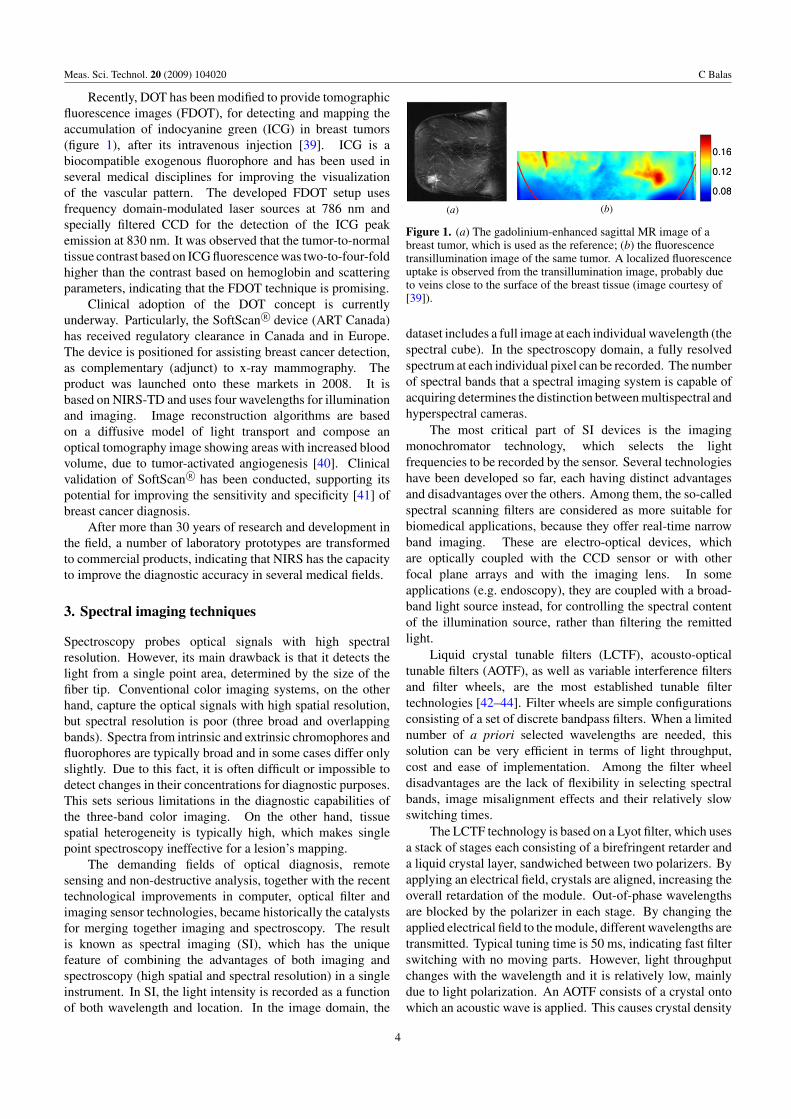
Recently, DOT has been modified to provide tomographicfluorescence images (FDOT), for detecting and mapping theaccumulation of indocyanine green (ICG) in breast tumors(figure 1), after its intravenous injection [39]. ICG is abiocompatible exogenous fluorophore and has been used inseveral medical disciplines for improving the visualizationof the vascular pattern. The developed FDOT setup usesfrequency domain-modulated laser sources at 786 nm andspecially filtered CCD for the detection of the ICG peakemission at 830 nm. It was observed that the tumor-to-normaltissue contrast based on ICG fluorescence was two-to-four-foldhigher than the contrast based on hemoglobin and scatteringparameters, indicating that the FDOT technique is promising.
Clinical adoption of the DOT concept is currentlyunderway. Particularly, the SoftScan R© device (ART Canada)has received regulatory clearance in Canada and in Europe.The device is positioned for assisting breast cancer detection,as complementary (adjunct) to x-ray mammography. Theproduct was launched onto these markets in 2008. It isbased on NIRS-TD and uses four wavelengths for illuminationand imaging. Image reconstruction algorithms are basedon a diffusive model of light transport and compose anoptical tomography image showing areas with increased bloodvolume, due to tumor-activated angiogenesis [40]. Clinicalvalidation of SoftScan R© has been conducted, supporting itspotential for improving the sensitivity and specificity [41] ofbreast cancer diagnosis.
After more than 30 years of research and development inthe field, a number of laboratory prototypes are transformedto commercial products, indicating that NIRS has the capacityto improve the diagnostic accuracy in several medical fields.
3. Spectral imaging techniques
Spectroscopy probes optical signals with high spectralresolution. However, its main drawback is that it detects thelight from a single point area, determined by the size of thefiber tip. Conventional color imaging systems, on the otherhand, capture the optical signals with high spatial resolution,but spectral resolution is poor (three broad and overlappingbands). Spectra from intrinsic and extrinsic chromophores andfluorophores are typically broad and in some cases differ onlyslightly. Due to this fact, it is often difficult or impossible todetect changes in their concentrations for diagnostic purposes.This sets serious limitations in the diagnostic capabilities ofthe three-band color imaging. On the other hand, tissuespatial heterogeneity is typically high, which makes singlepoint spectroscopy ineffective for a lesion’s mapping.
The demanding fields of optical diagnosis, remotesensing and non-destructive analysis, together with the recenttechnological improvements in computer, optical filter andimaging sensor technologies, became historically the catalystsfor merging together imaging and spectroscopy. The resultis known as spectral imaging (SI), which has the uniquefeature of combining the advantages of both imaging andspectroscopy (high spatial and spectral resolution) in a singleinstrument. In SI, the light intensity is recorded as a functionof both wavelength and location. In the image domain, the
(a) (b)
Figure 1. (a) The gadolinium-enhanced sagittal MR image of abreast tumor, which is used as the reference; (b) the fluorescencetransillumination image of the same tumor. A localized fluorescenceuptake is observed from the transillumination image, probably dueto veins close to the surface of the breast tissue (image courtesy of[39]).
dataset includes a full image at each individual wavelength (thespectral cube). In the spectroscopy domain, a fully resolvedspectrum at each individual pixel can be recorded. The numberof spectral bands that a spectral imaging system is capable ofacquiring determines the distinction between multispectral andhyperspectral cameras.
The most critical part of SI devices is the imagingmonochromator technology, which selects the lightfrequencies to be recorded by the sensor. Several technologieshave been developed so far, each having distinct advantagesand disadvantages over the others. Among them, the so-calledspectral scanning filters are considered as more suitable forbiomedical applications, because they offer real-time narrowband imaging. These are electro-optical devices, whichare optically coupled with the CCD sensor or with otherfocal plane arrays and with the imaging lens. In someapplications (e.g. endoscopy), they are coupled with a broad-band light source instead, for controlling the spectral contentof the illumination source, rather than filtering the remittedlight.
Liquid crystal tunable filters (LCTF), acousto-opticaltunable filters (AOTF), as well as variable interference filtersand filter wheels, are the most established tunable filtertechnologies [42–44]. Filter wheels are simple configurationsconsisting of a set of discrete bandpass filters. When a limitednumber of a priori selected wavelengths are needed, thissolution can be very efficient in terms of light throughput,cost and ease of implementation. Among the filter wheeldisadvantages are the lack of flexibility in selecting spectralbands, image misalignment effects and their relatively slowswitching times.
The LCTF technology is based on a Lyot filter, which usesa stack of stages each consisting of a birefringent retarder anda liquid crystal layer, sandwiched between two polarizers. Byapplying an electrical field, crystals are aligned, increasing theoverall retardation of the module. Out-of-phase wavelengthsare blocked by the polarizer in each stage. By changing theapplied electrical field to the module, different wavelengths aretransmitted. Typical tuning time is 50 ms, indicating fast filterswitching with no moving parts. However, light throughputchanges with the wavelength and it is relatively low, mainlydue to light polarization. An AOTF consists of a crystal ontowhich an acoustic wave is applied. This causes crystal density
4

Meas. Sci. Technol. 20 (2009) 104020 C Balas
(a)
(b)
550 nm 700 nm 940 nm
Figure 2. Selected spectral images from a dysplastic nevus (a) and from a melanoma (b). In contrast to what happens in melanoma, nevusmelanin becomes transparent in the NIR band.
changes and hence the local index of refraction changes. Ittherefore acts as a transmission diffraction grating, behavingas a tunable filter. By changing the acoustic frequency, variouswavelengths can be selected. AOTFs offer microsecond leveltuning times and high spectral resolution. Basic limitationsare the image spatial shifts and blurring.
Tunable filters are switched electronically and synchro-nized with image capturing, for collecting an image stack,consisting of a great number of narrow-band images. Thespectral cube images should be aligned with each other, forobtaining a meaningful spectrum per image pixel. Depend-ing on the spatial resolution of the imaging sensor, millionsof spectra can be obtained in less than 1 min. Hyperspectralimagers are used as research platforms, mainly for identify-ing the spectral bands that provide the maximum diagnosticinformation.
As an example, SI can be used for discriminating amongbenign/dysplastic nevus and melanomas [45]. It is well knownthat both melanin type and concentration vary under theseconditions. It is also known that the absorption coefficient ofmelanin is significantly reduced as the wavelength increasesfrom the visible to the NIR part of the spectrum. Figure 2illustrates the selected spectral images (550, 700, 940 nm)obtained ex vivo from a dysplastic nevus (a) and from askin melanoma lesion (b). It is clearly seen that dysplasticnevus becomes transparent in the NIR spectral region, whilemelanoma does not, possibly due to the increased number ofmelanocytes and hence to the increased melanin concentration.This finding could comprise the basis for the developmentof a novel screening method for melanoma detection andprevention.
It should be noted here that SI can provide imaginginformation for surface or for the near-to-surface underlyingstructures. Surface and sub-surface information is oftenmixed in spectral images, with proportions varying withthe wavelength. Compared with DOI and DOT, SI ismuch less efficient in imaging deep structures. However, itcombines much higher spatial and spectral resolution. Thesecharacteristics make SI suitable for spectral imaging andmapping of epithelial tissues.
The interpretation of hyperspectral data is often a complexprocess involving pattern recognition, computer vision, imageprocessing, statistical analysis, artificial intelligence and manyothers [46]. The advantage of acquiring spectral informationfrom a series of images at different wavelengths is that itenables the formation of ‘thematic maps’. These thematicmaps indicate possible diagnostic information and are theoutcome of a classification task implementing several of theabove disciplines. Ideally, the system should be able todecide about the patient’s condition without the need forvisual co-validation. However, given the current technologicallimitations one must design methods so as to aid a medicalspecialist to arrive at a diagnosis, instead of providing adiagnostic decision.
Several developments in the field have recently maturedto become commercial products. For example, the LIFE R©
device (Xilix Technologies Corporation, Richmond, BC,Canada) is currently marketed for assisting cancer detectionin bronchoscopy [47]. LIFE captures and processes twofluorescence images: one in the green band (480–520 nm) andone in the red (630 nm and longer). A laser emitting at 442 nmis used for light excitation and three filtered imaging sensorscollect two spectral images and one color image [47]. OlympusCorp. has launched the ‘EVIS LUCERA SPECTRUM R©’—amultimodal, multispectral imager for endoscopic applications,which is based on a continuously rotating filter wheel infront of a xenon light source [48]. This system enhances thevisualization of features of diagnostic importance, such as theatypical vascular pattern. Spectra Science, San Diego, CA, haslaunched the LUMA R© device, which combines fluorescenceand reflectance imaging for assisting in vivo diagnosis ofcervical neoplasia. This device is positioned as an adjunctto colposcopy and its clinical evaluation has demonstrated thatit detects 22% more high grade cases than colposcopy [49] butat much lower specificity. A variety of spectral imaging-basedresearch platforms are also entering a commercial phase inassisting the diagnosis of various pathological conditions suchas skin and retinal abnormalities.
5

Meas. Sci. Technol. 20 (2009) 104020 C Balas
(b)(a)
Figure 3. (a) Typical OCT setup: (LS) low coherence broad-band light source, (BS) beam splitting element, (M) movable reference mirror,(SMP) sample, (PHD) photon detector. Id is the light intensity detected by the sensor, and Es and Er are the electromagnetic waves from thesample and the reference arm respectively; (b) optical coherence tomography scan of the retina showing a cystoid macula edema (imagecourtesy of Carl Zeiss Meditec, Inc.).
4. Optical coherence tomography and confocalimaging
4.1. Optical coherence tomography
Optical coherence tomography (OCT) was devised in 1990[50]. It images the sub-surface tissue structure with a sub-micrometer scale axial and lateral resolution. For comparison,x-ray, MRI and ultrasound imaging offer millimeter or sub-millimeter resolution. Depths of 1–2 mm can be imagedin turbid tissues; greater depths are possible in transparenttissues such as the eye. OCT is based on low-coherenceinterferometry. The optical setup typically consists of aninterferometer (Michelson type), a broad-band, low-coherencelight source, light splinting optics, fiber optics and an opticalsensor. A typical OCT setup is illustrated in figure 3.
As illustrated in figure 3(a), the light entering the cavityof the interferometer is split into two beams, one leading toa reference mirror and the second focused into the tissue.The reference rays are reflected by the mirror and interfereconstructively with the rays reflected by the sample, providedthat both beams have traveled nearly the same optical pathlength. By moving the reference mirror, the optical pathlength of the reference beam changes, interference occursat different depths and reflection sites at the correspondingdepths can be sampled. Figure 3(b) illustrates an opticalcoherence tomography scan of the retina showing a cystoidmacula edema.
The lateral and the axial resolutions of the OCT aredecoupled from one another. Various implementations havebeen developed so far, such as time domain [51], frequencydomain [52–54], single point, Doppler and parallel OCT.Doppler OCT (DOCT) is being established as a useful tool forvisualizing the tissue microstructure and microvasculature atresolutions close to the cellular level, with velocity sensitivitiesapproaching a few micrometers per second [55]. Parallel OCTcomprises the latest and most promising development in thefield. It provides 100 000 axial lines and 50 frames s−1, thusopening up OCT to a wide range of medical applications (e.g.endoscopy, ophthalmology) [56, 57]. The first commercialinstrument for ophthalmologic diagnosis has been introducedby Carl Zeiss Meditec AG. Additionally, it has been clinicallydemonstrated that the cross-sectional images of OCT can
detect in vivo disruption of the basement membrane. Thisoccurs when neoplastic growth becomes cancer. Although thisis a remarkable achievement, the detection of functional andstructural changes at a precancerous stage remains a challengefor OCT.
4.2. Confocal imaging
The principle of confocal imaging was invented by MarvinMinsky in 1957. The decisive design feature of a confocalimaging system, compared with a conventional microscope,is the confocal aperture (usually called pinhole) arranged ina plane conjugate to the intermediate image plane and to theimage plane of the microscope. A typical configuration of aconfocal imaging system is illustrated in figure 4. Owing tothis arrangement, the detector can only detect light that haspassed through the pinhole. A laser beam is focused to adiffraction-limited spot, which illuminates only a point of theobject at a time. The laser beam is scanned across the surface ofthe sample, which has been stained with a fluorescent dye.
The fluorescence light from planes above and below thefocal plane is out of focus and it is rejected by the pinhole.Therefore, it does not contribute to forming the image. Theoptics can be focused at different depths, thus enabling 3Dimaging of high resolution.
The degree of spreading (blurring) of the point objectis a measure for the quality of an imaging system, and itis expressed by the point spread function (PSF). When theobject is divided into discrete point objects of varying intensity,the image is computed as a sum of the PSF of each point.Assuming a Gaussian approximation of the PSF, the full widthat half maximum (FWHM) of the distribution can be used asa resolution index. Quantitatively, the FWHM is a lateral oraxial distance corresponding to a 50% drop in intensity.
As the pinhole diameter is constricted toward an‘infinitively small’ size, the depth discrimination improves or,in other words, the optical slice thickness decreases. Thelateral resolution increases as well. The image quality isfurther improved by the suspension of the stray light by thepinhole, which enhances the contrast of the image. It shouldbe noted however that by reducing the pinhole diameter, thelight throughput of the system decreases. To maintain thesignal-to-noise ratio at an acceptable level, the power of
6
Meas. Sci. Technol. 20 (2009) 104020 C Balas
(a) (b)
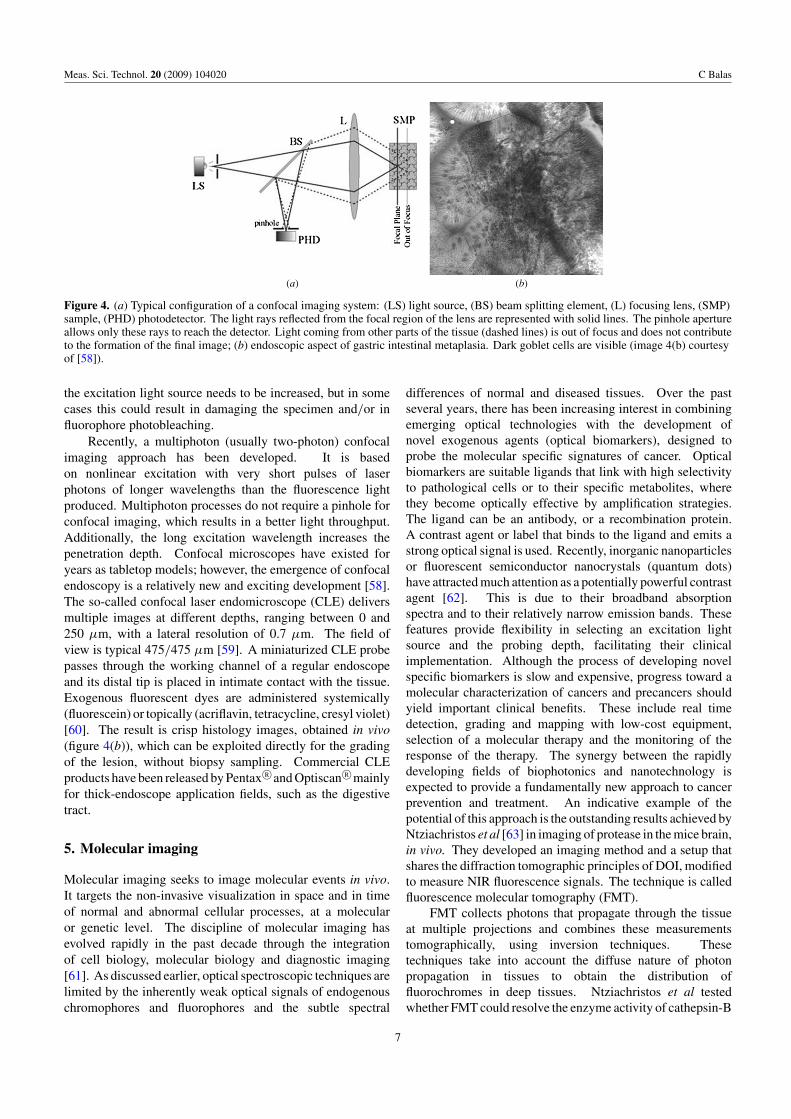
Figure 4. (a) Typical configuration of a confocal imaging system: (LS) light source, (BS) beam splitting element, (L) focusing lens, (SMP)sample, (PHD) photodetector. The light rays reflected from the focal region of the lens are represented with solid lines. The pinhole apertureallows only these rays to reach the detector. Light coming from other parts of the tissue (dashed lines) is out of focus and does not contributeto the formation of the final image; (b) endoscopic aspect of gastric intestinal metaplasia. Dark goblet cells are visible (image 4(b) courtesyof [58]).
the excitation light source needs to be increased, but in somecases this could result in damaging the specimen and/or influorophore photobleaching.
Recently, a multiphoton (usually two-photon) confocalimaging approach has been developed. It is basedon nonlinear excitation with very short pulses of laserphotons of longer wavelengths than the fluorescence lightproduced. Multiphoton processes do not require a pinhole forconfocal imaging, which results in a better light throughput.Additionally, the long excitation wavelength increases thepenetration depth. Confocal microscopes have existed foryears as tabletop models; however, the emergence of confocalendoscopy is a relatively new and exciting development [58].The so-called confocal laser endomicroscope (CLE) deliversmultiple images at different depths, ranging between 0 and250 μm, with a lateral resolution of 0.7 μm. The field ofview is typical 475/475 μm [59]. A miniaturized CLE probepasses through the working channel of a regular endoscopeand its distal tip is placed in intimate contact with the tissue.Exogenous fluorescent dyes are administered systemically(fluorescein) or topically (acriflavin, tetracycline, cresyl violet)[60]. The result is crisp histology images, obtained in vivo(figure 4(b)), which can be exploited directly for the gradingof the lesion, without biopsy sampling. Commercial CLEproducts have been released by Pentax R©and Optiscan R©mainlyfor thick-endoscope application fields, such as the digestivetract.
5. Molecular imaging
Molecular imaging seeks to image molecular events in vivo.It targets the non-invasive visualization in space and in timeof normal and abnormal cellular processes, at a molecularor genetic level. The discipline of molecular imaging hasevolved rapidly in the past decade through the integrationof cell biology, molecular biology and diagnostic imaging[61]. As discussed earlier, optical spectroscopic techniques arelimited by the inherently weak optical signals of endogenouschromophores and fluorophores and the subtle spectral
differences of normal and diseased tissues. Over the pastseveral years, there has been increasing interest in combiningemerging optical technologies with the development ofnovel exogenous agents (optical biomarkers), designed toprobe the molecular specific signatures of cancer. Opticalbiomarkers are suitable ligands that link with high selectivityto pathological cells or to their specific metabolites, wherethey become optically effective by amplification strategies.The ligand can be an antibody, or a recombination protein.A contrast agent or label that binds to the ligand and emits astrong optical signal is used. Recently, inorganic nanoparticlesor fluorescent semiconductor nanocrystals (quantum dots)have attracted much attention as a potentially powerful contrastagent [62]. This is due to their broadband absorptionspectra and to their relatively narrow emission bands. Thesefeatures provide flexibility in selecting an excitation lightsource and the probing depth, facilitating their clinicalimplementation. Although the process of developing novelspecific biomarkers is slow and expensive, progress toward amolecular characterization of cancers and precancers shouldyield important clinical benefits. These include real timedetection, grading and mapping with low-cost equipment,selection of a molecular therapy and the monitoring of theresponse of the therapy. The synergy between the rapidlydeveloping fields of biophotonics and nanotechnology isexpected to provide a fundamentally new approach to cancerprevention and treatment. An indicative example of thepotential of this approach is the outstanding results achieved byNtziachristos et al [63] in imaging of protease in the mice brain,in vivo. They developed an imaging method and a setup thatshares the diffraction tomographic principles of DOI, modifiedto measure NIR fluorescence signals. The technique is calledfluorescence molecular tomography (FMT).
FMT collects photons that propagate through the tissueat multiple projections and combines these measurementstomographically, using inversion techniques. Thesetechniques take into account the diffuse nature of photonpropagation in tissues to obtain the distribution offluorochromes in deep tissues. Ntziachristos et al testedwhether FMT could resolve the enzyme activity of cathepsin-B
7
Meas. Sci. Technol. 20 (2009) 104020 C Balas
(a) (b)
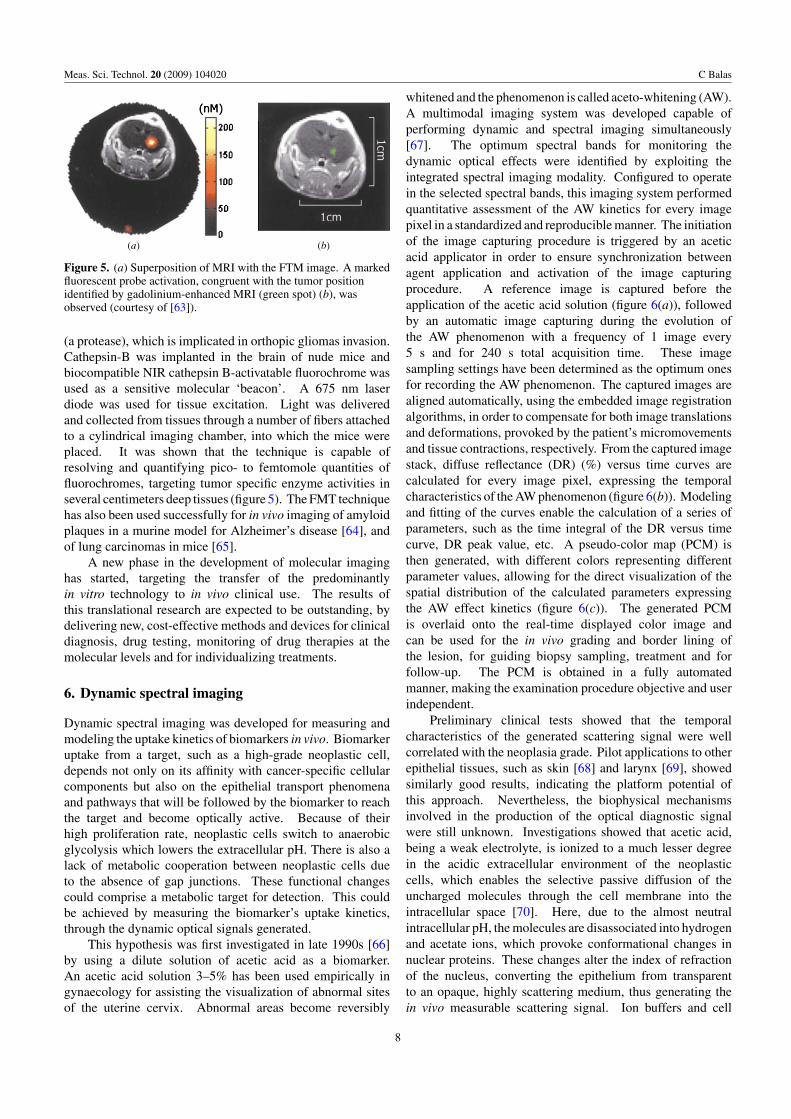
Figure 5. (a) Superposition of MRI with the FTM image. A markedfluorescent probe activation, congruent with the tumor positionidentified by gadolinium-enhanced MRI (green spot) (b), wasobserved (courtesy of [63]).
(a protease), which is implicated in orthopic gliomas invasion.Cathepsin-B was implanted in the brain of nude mice andbiocompatible NIR cathepsin B-activatable fluorochrome wasused as a sensitive molecular ‘beacon’. A 675 nm laserdiode was used for tissue excitation. Light was deliveredand collected from tissues through a number of fibers attachedto a cylindrical imaging chamber, into which the mice wereplaced. It was shown that the technique is capable ofresolving and quantifying pico- to femtomole quantities offluorochromes, targeting tumor specific enzyme activities inseveral centimeters deep tissues (figure 5). The FMT techniquehas also been used successfully for in vivo imaging of amyloidplaques in a murine model for Alzheimer’s disease [64], andof lung carcinomas in mice [65].
A new phase in the development of molecular imaginghas started, targeting the transfer of the predominantlyin vitro technology to in vivo clinical use. The results ofthis translational research are expected to be outstanding, bydelivering new, cost-effective methods and devices for clinicaldiagnosis, drug testing, monitoring of drug therapies at themolecular levels and for individualizing treatments.
6. Dynamic spectral imaging
Dynamic spectral imaging was developed for measuring andmodeling the uptake kinetics of biomarkers in vivo. Biomarkeruptake from a target, such as a high-grade neoplastic cell,depends not only on its affinity with cancer-specific cellularcomponents but also on the epithelial transport phenomenaand pathways that will be followed by the biomarker to reachthe target and become optically active. Because of theirhigh proliferation rate, neoplastic cells switch to anaerobicglycolysis which lowers the extracellular pH. There is also alack of metabolic cooperation between neoplastic cells dueto the absence of gap junctions. These functional changescould comprise a metabolic target for detection. This couldbe achieved by measuring the biomarker’s uptake kinetics,through the dynamic optical signals generated.
This hypothesis was first investigated in late 1990s [66]by using a dilute solution of acetic acid as a biomarker.An acetic acid solution 3–5% has been used empirically ingynaecology for assisting the visualization of abnormal sitesof the uterine cervix. Abnormal areas become reversibly
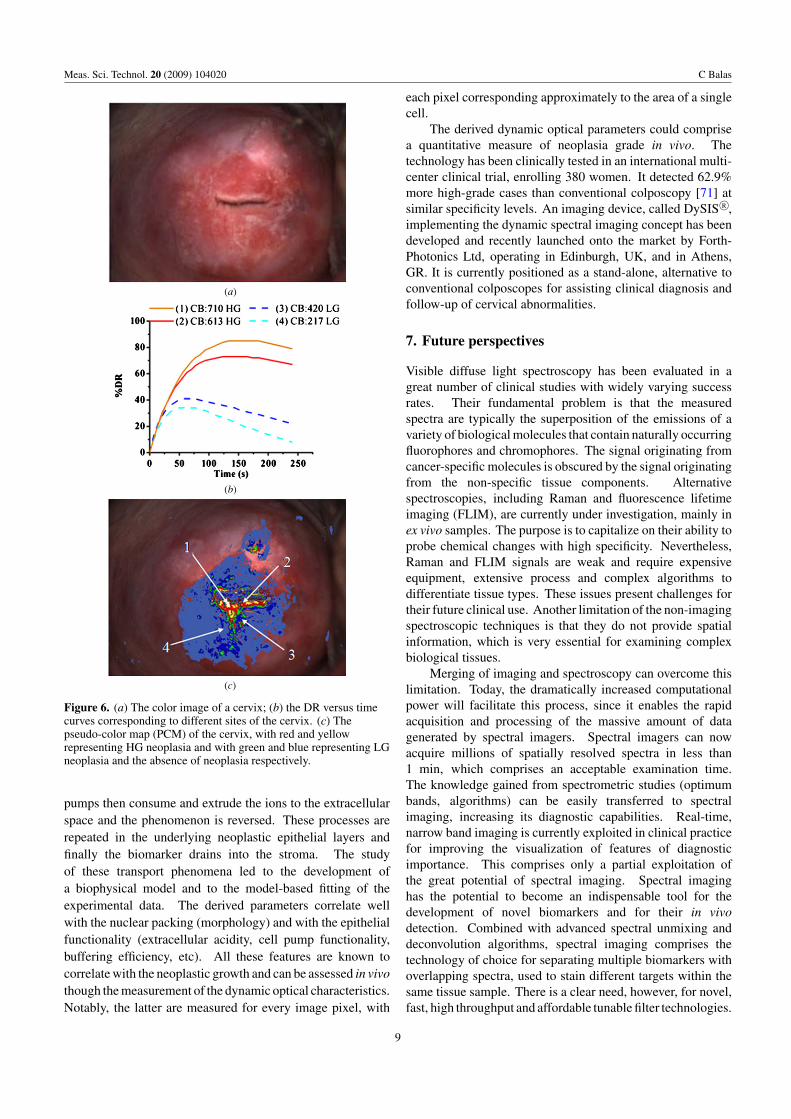
whitened and the phenomenon is called aceto-whitening (AW).A multimodal imaging system was developed capable ofperforming dynamic and spectral imaging simultaneously[67]. The optimum spectral bands for monitoring thedynamic optical effects were identified by exploiting theintegrated spectral imaging modality. Configured to operatein the selected spectral bands, this imaging system performedquantitative assessment of the AW kinetics for every imagepixel in a standardized and reproducible manner. The initiationof the image capturing procedure is triggered by an aceticacid applicator in order to ensure synchronization betweenagent application and activation of the image capturingprocedure. A reference image is captured before theapplication of the acetic acid solution (figure 6(a)), followedby an automatic image capturing during the evolution ofthe AW phenomenon with a frequency of 1 image every5 s and for 240 s total acquisition time. These imagesampling settings have been determined as the optimum onesfor recording the AW phenomenon. The captured images arealigned automatically, using the embedded image registrationalgorithms, in order to compensate for both image translationsand deformations, provoked by the patient’s micromovementsand tissue contractions, respectively. From the captured imagestack, diffuse reflectance (DR) (%) versus time curves arecalculated for every image pixel, expressing the temporalcharacteristics of the AW phenomenon (figure 6(b)). Modelingand fitting of the curves enable the calculation of a series ofparameters, such as the time integral of the DR versus timecurve, DR peak value, etc. A pseudo-color map (PCM) isthen generated, with different colors representing differentparameter values, allowing for the direct visualization of thespatial distribution of the calculated parameters expressingthe AW effect kinetics (figure 6(c)). The generated PCMis overlaid onto the real-time displayed color image andcan be used for the in vivo grading and border lining ofthe lesion, for guiding biopsy sampling, treatment and forfollow-up. The PCM is obtained in a fully automatedmanner, making the examination procedure objective and userindependent.
Preliminary clinical tests showed that the temporalcharacteristics of the generated scattering signal were wellcorrelated with the neoplasia grade. Pilot applications to otherepithelial tissues, such as skin [68] and larynx [69], showedsimilarly good results, indicating the platform potential ofthis approach. Nevertheless, the biophysical mechanismsinvolved in the production of the optical diagnostic signalwere still unknown. Investigations showed that acetic acid,being a weak electrolyte, is ionized to a much lesser degreein the acidic extracellular environment of the neoplasticcells, which enables the selective passive diffusion of theuncharged molecules through the cell membrane into theintracellular space [70]. Here, due to the almost neutralintracellular pH, the molecules are disassociated into hydrogenand acetate ions, which provoke conformational changes innuclear proteins. These changes alter the index of refractionof the nucleus, converting the epithelium from transparentto an opaque, highly scattering medium, thus generating thein vivo measurable scattering signal. Ion buffers and cell
8
Meas. Sci. Technol. 20 (2009) 104020 C Balas
(a)
(b)
(c)
Figure 6. (a) The color image of a cervix; (b) the DR versus timecurves corresponding to different sites of the cervix. (c) Thepseudo-color map (PCM) of the cervix, with red and yellowrepresenting HG neoplasia and with green and blue representing LGneoplasia and the absence of neoplasia respectively.
pumps then consume and extrude the ions to the extracellularspace and the phenomenon is reversed. These processes arerepeated in the underlying neoplastic epithelial layers andfinally the biomarker drains into the stroma. The studyof these transport phenomena led to the development ofa biophysical model and to the model-based fitting of theexperimental data. The derived parameters correlate wellwith the nuclear packing (morphology) and with the epithelialfunctionality (extracellular acidity, cell pump functionality,buffering efficiency, etc). All these features are known tocorrelate with the neoplastic growth and can be assessed in vivothough the measurement of the dynamic optical characteristics.Notably, the latter are measured for every image pixel, with
each pixel corresponding approximately to the area of a singlecell.
The derived dynamic optical parameters could comprisea quantitative measure of neoplasia grade in vivo. Thetechnology has been clinically tested in an international multi-center clinical trial, enrolling 380 women. It detected 62.9%more high-grade cases than conventional colposcopy [71] atsimilar specificity levels. An imaging device, called DySIS R©,implementing the dynamic spectral imaging concept has beendeveloped and recently launched onto the market by Forth-Photonics Ltd, operating in Edinburgh, UK, and in Athens,GR. It is currently positioned as a stand-alone, alternative toconventional colposcopes for assisting clinical diagnosis andfollow-up of cervical abnormalities.
7. Future perspectives
Visible diffuse light spectroscopy has been evaluated in agreat number of clinical studies with widely varying successrates. Their fundamental problem is that the measuredspectra are typically the superposition of the emissions of avariety of biological molecules that contain naturally occurringfluorophores and chromophores. The signal originating fromcancer-specific molecules is obscured by the signal originatingfrom the non-specific tissue components. Alternativespectroscopies, including Raman and fluorescence lifetimeimaging (FLIM), are currently under investigation, mainly inex vivo samples. The purpose is to capitalize on their ability toprobe chemical changes with high specificity. Nevertheless,Raman and FLIM signals are weak and require expensiveequipment, extensive process and complex algorithms todifferentiate tissue types. These issues present challenges fortheir future clinical use. Another limitation of the non-imagingspectroscopic techniques is that they do not provide spatialinformation, which is very essential for examining complexbiological tissues.
Merging of imaging and spectroscopy can overcome thislimitation. Today, the dramatically increased computationalpower will facilitate this process, since it enables the rapidacquisition and processing of the massive amount of datagenerated by spectral imagers. Spectral imagers can nowacquire millions of spatially resolved spectra in less than1 min, which comprises an acceptable examination time.The knowledge gained from spectrometric studies (optimumbands, algorithms) can be easily transferred to spectralimaging, increasing its diagnostic capabilities. Real-time,narrow band imaging is currently exploited in clinical practicefor improving the visualization of features of diagnosticimportance. This comprises only a partial exploitation ofthe great potential of spectral imaging. Spectral imaginghas the potential to become an indispensable tool for thedevelopment of novel biomarkers and for their in vivodetection. Combined with advanced spectral unmixing anddeconvolution algorithms, spectral imaging comprises thetechnology of choice for separating multiple biomarkers withoverlapping spectra, used to stain different targets within thesame tissue sample. There is a clear need, however, for novel,fast, high throughput and affordable tunable filter technologies.
9

Meas. Sci. Technol. 20 (2009) 104020 C Balas
Cross-sectional in vivo 3D imaging is one of the mostimpressive achievements in biomedical optics. By providinghistological information in vivo, OCT and confocal imagingwill enhance the diagnostic capabilities for early detection andminimize or even eliminate the need for invasive biopsies.However, there are several issues related to their clinicalimplementation that need to be addressed: (a) they providemicroscopic information, requiring special training of theclinicians to ‘read’ histology images or the presence ofa pathologist for the interpretation and assessment of theacquired live histology images; (b) they do not providequantitative information and therefore visual assessment willbe subjective; (c) due to the small size of their probes, only avery small area (mm scale) can be examined at a time, selectedsubjectively by the user.
NIRS imaging implementations are expected to contributeremarkably to molecular imaging developments in discoveringdisease-specific tracers and vice versa. Translational researchis currently underway, aiming at transferring laboratory setupsand experimental results to the clinical practice. This willcontribute substantially to conversion of current empiricalapproaches to a modern medical practice, centered on theprinciples of molecular biology.
In vivo dynamic spectral imaging combines several of theprinciples of the biomedical imaging modalities discussed inthis report. It is a clinically proven approach and it is currentlyreplacing conventional diagnostic devices. Capitalizing onits ability to provide accurate and quantitative diagnosticinformation, it holds the promise to minimize the need forinvasive biopsies. This may enable the ‘see and treat concept’,where neoplasias will be detected and treated even at the sameconsultation, thus improving the cost/effectiveness ratio ofcancer prevention programs.
References
[1] Weissleder R and Ntziachristos V 2003 Shedding light ontolive molecular targets Nat. Med. 9 123–8
[2] Dzik-Jurasz A S K 2003 Molecular imaging in vivo: anintroduction Br. J. Radiol. 76 98–109
[3] Drezek R, Guillaud M, Collier T, Boiko I, Malpica A,MacAulay C, Follen M and Richards-Kortum R 2003 Lightscattering from cervical cells throughout neoplasticprogression: influence of nuclear morphology, DNAcontent, and chromatin texture J. Biomed. Opt. 8 7–16
[4] Heppner K L, Matrisian L M, Jensen R A and Rodgers W H1996 Expression of most matrix metalloproteinase familymembers in breast cancer represents a tumor-induced hostresponse Am. J. Pathol. 149 273–82
[5] Koenig F, Larne R, Enquist H, McGovern F J,Schomacker K T, Kollias N and Deutsch T F 1998Spectroscopic measurement of diffuse reflectance forenhanced detection of bladder carcinoma Urology 51 342–5
[6] Zonios G, Perelman L T, Backman V, Manoharan R,Fitzmaurice M J, Van Dam J and Feld M S 1999 Diffusereflectance spectroscopy of human adenomatous colonpolyps in vivo Appl. Opt. 38 6628–37
[7] Georgakoudi I et al 2001 Fluorescence, reflectance, andlight-scattering spectroscopy for evaluating dysplasia inpatients with Barrett’s esophagus Gastroenterology120 1620–9
[8] Garcia-Uribe A, Kehtarnavaz N, Marquez G, Prieto V,Duvic M and Wang L V 2004 Skin cancer detection by
spectroscopic oblique-incidence reflectometry:classification and physiological origins Appl. Opt.43 2643–50
[9] Bard M P, Amelink A, Skurichina M, den Bakker M,Burgers S A, van Meerbeeck J P, Duin R P, Aerts J G,Hoogsteden H C and Sterenborg H J 2005 Improving thespecificity of fluorescence bronchoscopy for the analysis ofneoplastic lesions of the bronchial tree by combination withoptical spectroscopy: preliminary communication LungCancer 47 41–7
[10] Pradhan A, Pal P, Durocher G, Villeneuve L, Balassy A,Babai F, Gaboury L and Blanchard L 1995 Steady state andtime resolved fluorescence properties of metastatic andnon-metastatic malignant cells from different speciesJ. Photochem. Photobiol. B 3 101–12
[11] Romer T J, Fitzmaurice M, Cothren R M, Richards-Kortum R,Sivak M V Jr and Kramer J R 1995 Laser-inducedfluorescence microscopy of normal colon and dysplasia incolonic adenomas: implications for spectroscopic diagnosisAm. J. Gastroenterol. 90 81–7
[12] Ghadially F N, Neish W J P and Dawkins H C 1963Mechanisms involved in the production of red fluorescenceof human and experimental tumors J. Pathol. Bacteriol.85 77–92
[13] Andersson-Engels S, Johansson J, Stenram U, Svanberg Kand Svanberg S 1990 Malignant tumor and atheroscleroticplaque diagnosis using laser induced fluorescence IEEE J.Quantum Electron. 26 2207–17
[14] Andersson-Engels S and Wilson B C 1992 In vivo fluorescencein clinical oncology: fundamentals and practical issuesJ. Cell. Pharmacol. 3 66–79
[15] Bigio I J and Mourant J R 1996 Ultraviolet and visiblespectroscopies for tissue diagnostics: fluorescencespectroscopy and elastic-scattering spectroscopy Phys.Med. Biol 42 803–14
[16] Ramanujam N 2000 Fluorescence spectroscopy in vivoEncyclopedia of Analytical Chemistry ed R A Meyers(New York: Wiley) pp 20–56
[17] Keijzer M, Richards-Kortum R, Jacques S L and Feld M S1989 Fluorescence spectroscopy of turbid media:autofluorescence of the human aorta Appl. Opt.28 4286–92
[18] Muller M G, Georgakoudi I, Zhang Q, Wu J and Feld M S2001 Intrinsic fluorescence spectroscopy in turbid media:disentangling effects of scattering and absorption Appl. Opt.40 4633–46
[19] Georgakoudi I, Sheets E E, Muller M G, Backman V,Crum C P, Badizadegan K, Dasari R R and Feld M S 2002Trimodal spectroscopy for the detection andcharacterization of cervical precancers in vivo Am. J.Obstet. Gynecol. 186 374–82
[20] Ramanujam N, Mitchell M F, Mahadevan-Jansen A,Thomsen S, Staerkel G, Malpica A, Wright T, Atkinson Aand Richards-Kortum R 1996 Cervical pre-cancerdetection using a multivariate statistical algorithm basedon laser induced fluorescence spectra at multipleexcitation wavelengths Photochem. Photobiol.64 720–35
[21] Tumer K, Ramanujam N, Ghosh J and Richards-Kortum R1998 Ensembles of radial basis function networks forspectroscopic detection of cervical precancer IEEE Trans.Biomed. Eng. 45 953–61
[22] Tuchin V 2007 Tissue Optics: Light Scattering Methods andInstruments for Medical Diagnosis 2nd edn (Bellingham,WA: SPIE Press)
[23] Torricelli A, Contini D, Pifferi A, Spinelli L and Cubeddu R2008 Functional brain imaging by multi-wavelengthtime-resolved near infrared spectroscopy Optoelectron. Rev.16 131–5
10
Meas. Sci. Technol. 20 (2009) 104020 C Balas
[24] Gibson A P, Hebden J C and Arridge S R 2005 Recentadvances in diffuse optical imaging Phys. Med. Biol.50 1–43
[25] Selb J, Joseph D K and Boas D A 2006 Time-gated opticalsystem for depth-resolved functional brain imagingJ. Biomed. Opt. 11 044008
[26] Wolf M et al 2007 Progress of near infrared spectroscopy andimaging instrumentation for brain and muscle clinicalapplications J. Biomed. Opt. 12 062104
[27] Hamaoka T, McCully K K, Quaresima V, Yamamoto Kand Chance B J 2007 Near-infrared spectroscopy/imagingfor monitoring muscle oxygenation and oxidativemetabolism in healthy and diseased humans J. Biomed Opt.12 062105
[28] Culver J P, Siegel A M, Stott J J and Boas D A 2003Volumetric diffuse optical tomography of brain activityOpt. Lett. 28 2061–3
[29] Siegel A M, Culver J P, Mandeville J B and Boas D A 2003Temporal comparison of functional brain imaging withdiffuse optical tomography and fMRI during rat forepawstimulation Phys. Med. Biol. 48 1391–403
[30] Hueber D M, Franceschini M A, Ma H Y, Zhang Q,Ballesteros J R, Fantini S, Wallace D, Ntziachristos Vand Chance B 2001 Non-invasive and quantitativenear-infrared haemoglobin spectrometry in the piglet brainduring hypoxic stress, using a frequency-domainmultidistance instrument Phys. Med. Biol. 46 41–62
[31] Pogue B et al 2004 Characterization of hemoglobin, water, andNIR scattering in breast tissue: analysis of intersubjectvariability and menstrual cycle changes J. Biomed. Opt.9 541–52
[32] Corlu A, Choe R, Durduran T, Rosen M A, Schweiger M,Arridge S R, Schnall M D and Yodh A G 2007Three-dimensional in vivo fluorescence diffuse opticaltomography of breast cancer in humans Opt. Exp.15 6696–715
[33] Ntziachristos V, Yodh A G, Schnall M and Chance B 2000Concurrent MRI and diffuse optical tomography of breastafter indocyanine green enhancement Proc. Natl Acad. Sci.USA 97 2767–72
[34] Choe R, Corlu A, Lee K, Durduran T, Konecky S Dand Grosicka-Koptyra M 2005 Diffuse optical tomographyof breast cancer during neoadjuvant chemotherapy: a casestudy with comparison to MRI Med. Phys. 32 1128–39
[35] Dehghani H, Pogue B W, Jiang S D, Brooksby B andPaulsen K D 2003 Three-dimensional optical tomography:resolution in small-object imaging Appl. Opt.42 3117–28
[36] Gu X J, Zhang Q Z, Bartlett M, Schutz L, Fajardo L Land Jiang H B 2004 Differentiation of cysts from solidtumors in the breast with diffuse optical tomography Acad.Radiol. 11 53–60
[37] Li A et al 2003 Tomographic optical breast imagingguided by three-dimensional mammography Appl. Opt.42 5181–90
[38] Pifferi A, Taroni P, Torricelli A, Messina F, Cubeddu Rand Danesini G 2003 Four wavelength time-resolved opticalmammography in the 680–980-nm range Opt. Lett.28 1138–40
[39] Corlu A, Choe R, Durduran T, Rosen M A, Schweiger M,Arridge S R, Schnall M D and Yodh A G 2007Three-dimensional in vivo fluorescence diffuse opticaltomography of breast cancer in humans Opt. Exp.15 6696
[40] Srinivasan S et al 2005 Near-infrared characterization ofbreast tumors in vivo using spectrally-constrainedreconstruction Technol. Cancer Res. Treat. 4 513–26
[41] Intes X et al 2005 Time-domain optical mammographySoftScan: initial results Acad. Radiol. 12 934–47
[42] Papadakis A, Stathopoulos E, Delides G, Berberides K,Nikiforidis G and Balas C 2003 A novel spectralmicroscope system: application in quantitative pathologyIEEE Trans. Biomed. Eng. 50 207–17
[43] Farkas D L and Becker D 2001 Applications of spectralimaging: detection and analysis of human melanoma and itsprecursors Pigment Cell Res. 14 2–8
[44] Bearman G and Levenson R 2003 Biological imaging andspectroscopy Biomedical Photonics Handbook ed V T Dinh(Boca Raton, FL: CRC Press)
[45] Balas C, Themelis G, Papadakis A, Vasgiouraki E, Argyros A,Koumandakis E, Tosca A and Helidonis E 2001 A novelhyper-spectral imaging system: application on in-vivodetection and grading of cervical precancers and pigmentedlesions Proc. Computer Vision Beyond the Visible Spectrum(CVBVS’ 01 workshop, Hawaii, USA)
[46] Du H, Chang C I, Ren H, Chang C C, Jensen J O andAmico F M D 2004 New hyperspectral discriminationmeasure for spectral characterization Opt. Eng.43 1777–86
[47] Palcic B et al 1991 Detection and localization of early lungcancer by imaging techniques Chest 99 742–3
[48] Gono K 2008 Multifunctional endoscopic imaging system forsupport of early cancer diagnosis IEEE J. Sel. Top.Quantum Electron. 14 62–9
[49] Optical Detection Group, Alvarez R D and Wright T C Jr 2007Increased detection of high-grade cervical intraepithelialneoplasia utilizing an optical detection system as an adjunctto colposcopy Gynecol. Oncol. 106 23–8
[50] Fercher A F 1990 Ophthalmic interferometry Proc. Int. Conf.on Optics in Life Sciences (Garmisch-Partenkirchen,Germany) ed G von Bally and S Khanna pp 221–8
[51] Fercher A F, Drexler W, Hitzenberger C K and Lasser T 2003Optical coherence tomography—principles and applicationsRep. Prog. Phys. 66 239–303
[52] Cense B and Nassif N A 2004 Ultrahigh-resolution high-speedretinal imaging using spectral-domain optical coherencetomography Opt. Express 12 2435–47
[53] Wojtkowski M, Bajraszewski T, Targowski P and Kowalczyk2003 A Real time in vivo imaging by high-speed spectraloptical coherence tomography Opt. Lett. 28 1745–7
[54] Leitgeb R, Hitzenberger C K and Fercher A F 2003Performance of Fourier domain versus time domain opticalcoherence tomography Opt. Express 11 889–94
[55] Yang V X D, Gordon M L, Qi B, Pekar J, Lo S, Seng-Yue E,Mok A, Wilson B C and Vitkin I A 2003 High speed highvelocity dynamic range Doppler optical coherencetomography: Part I. System design, signal processing andperformance Opt. Express 11 794–809
[56] Adler D C, Chen Y, Huber R, Schmitt J, Connolly Jand Fujimoto J G 2007 Three-dimensional endomicroscopyusing optical coherence tomography Nat. Photonics1 709–16
[57] Akiba M, Chan K P and Tanno N 2003 Full-field opticalcoherence tomography by two-dimensional heterodynedetection with a pair of CCD cameras Opt. Lett.28 816–8
[58] Gheorghe C, Iacob R, Becheanu G and Dumbrava M 2008Confocal endomicroscopy for in vivo microscopic analysisof upper gastrointestinal tract premalignant and malignantlesions J. Gastrointest. Liver Dis. 17 95–100
[59] Hoffman A, Goetz M, Vieth M, Galle P R, Neurath M Fand Kiesslich R 2006 Confocal laser endomicroscopy:technical status and current indications Endoscopy38 1275–83
[60] Kim J 2000 The use of vital dyes in corneal disease Curr.Opin. Ophthalmol. 11 241–7
[61] Sokolov K et al 2003 Optical systems for in vivo molecularimaging of cancer Technol. Cancer Res. Treat. 2 491–504
11
Meas. Sci. Technol. 20 (2009) 104020 C Balas
[62] Pomper M G 2001 Molecular imaging: an overview Acad.Radiol. 8 1141–53
[63] Ntziachristos V, Tung C H, Bremer C and Weissleder R 2002Fluorescence mediated tomographic imaging systems Nat.Med. 8 757–60
[64] Hyde D, DeKleine R, MacLaurin S A, Miller E, Brooks D H,Krucker T and Ntziachristos V 2009 Hybrid FMT-CTmethod for in vivo imaging of amyloid-E plaques in amurine model for Alzheimer’s disease Neuroimage44 1304–11
[65] Niedre M J, de Kleine R H, Aikawa E, Kirsch D G,Weissleder R and Ntziachristos V 2008 Early photontomography allows fluorescence detection of lungcarcinomas and disease progression in mice in vivo Proc.Natl Acad. Sci. USA 105 19126–31
[66] Balas C, Dimoka A, Orfanoudaki E and Koumandakis E 1998In vivo assessment of acetic acid–cervical tissue interactionusing quantitative imaging of back-scattered light: itspotential use for the in vivo cervical cancer detectiongrading and mapping Proc. SPIE—Opt. Biopsies Microsc.Tech. 3568 31–7
[67] Balas C 2001 A novel optical imaging method for the earlydetection, quantitative grading, and mapping of cancerousand precancerous lesions of cervix IEEE Trans. Biomed.Eng. 48 96–104
[68] Stefanaki M, Tosca A D, Themelis G C, Vazgiouraki E M,Dokianakis D N, Panayiotidis J G, Spandidos D Aand Balas C 2001 In vivo detection of human papillomavirus-induced lesions of anogenital area after application ofacetic acid: a novel and accurate approach to a trivialmethod J. Photochem. Photobiol. B 65 115–21
[69] Balas C, Themelis G C, Prokopakis E P, Orfanudaki I,Koumantakis E and Helidonis E S 1999 In vivo detectionand staging of epithelial dysplasias and malignanciesbased on the quantitative assessment of acetic acid–tissueinteraction kinetics J. Photochem. Photobiol.B 53 153–7
[70] Balas C, Papoutsoglou G and Potirakis A 2008 In vivomolecular imaging of cervical neoplasia using acetic acid asbiomarker IEEE J. Sel. Top. Quantum Electron. 14 29–42
[71] Soutter W P et al 2009 Dynamic spectral imaging—improvingcolposcopy Clin. Cancer Res. 15 1814
12