Review Article Correlations between Different - Instituto Bernabeu
11
Hindawi Publishing Corporation Advances in Urology Volume 2012, Article ID 420893, 11 pages doi:10.1155/2012/420893 Review Article Correlations between Different Heavy Metals in Diverse Body Fluids: Studies of Human Semen Quality Lidia M´ ınguez-Alarc ´ on, 1 Jaime Mendiola, 1 Manuela Roca, 1 Jos´ e J. L ´ opez-Esp´ ın, 2 Jos´ e J. Guill´ en, 1 Jos´ e M. Moreno, 3 Stella Moreno-Grau, 3 Mar´ ıa J. Mart´ ınez-Garc´ ıa, 3 Nuria Vergara-Ju´ arez, 3 Bel´ en Elvira-Rendueles, 3 Antonio Garc´ ıa-S´ anchez, 3 Jorge Ten, 4 Rafael Bernabeu, 4, 5 and Alberto M. Torres-Cantero 1, 6 1 Public Health and Epidemiology Research Group, Division of Preventive Medicine and Public Health, School of Medicine, University of Murcia, Espinardo 30100, Murcia, Spain 2 Center of Operations Research, Miguel Hern´ andez University, 03202 Elche, Spain 3 Department of Environmental and Chemical Engineering, Technical University of Cartagena, Cartagena 30202, Spain 4 Department of Reproductive Biology and Medicine, Instituto Bernabeu, Alicante 03016, Spain 5 Reproductive Medicine Chair, Miguel Hern´ andez University-Instituto Bernabeu, Alicante 03016, Spain 6 Centro de Investigaci´ on Biom´ edica en Red de Epidemiolog´ ıa y Salud P´ ublica (CIBERESP), Barcelona 08036, Spain Correspondence should be addressed to Lidia M´ ınguez-Alarc ´ on, [email protected] Received 21 August 2011; Accepted 9 October 2011 Academic Editor: Edward Kim Copyright © 2012 Lidia M´ ınguez-Alarc ´ on et al. This is an open access article distributed under the Creative Commons Attribution License, which permits unrestricted use, distribution, and reproduction in any medium, provided the original work is properly cited. It has been hypothesized that exposure to heavy metals may impair male reproduction. To measure the effect produced by low doses of heavy metals on semen parameters, it is necessary to clarify in which body fluids those measurements must be performed. Sixty-one men attending infertility clinics participated in our study. Concentrations of lead, cadmium, and mercury were measured in whole blood, blood plasma, and seminal plasma using spectroanalytical and electrochemical methods. Semen analyses were performed according to World Health Organization criteria. For statistical analysis, Spearman’s rank correlations, mean comparison tests, and discriminant analysis were calculated. Significant correlations between the measured concentrations of the three heavy metals in the same biological fluids were observed. However, no similar relationship was seen when comparing the concentrations in different body fluids of the same metal. According to our results and previous publications, seminal plasma might be the best body fluid for assessing impairment of human semen parameters. 1. Introduction Over time there has been a significant decline of human fer- tility [1]. Like other European countries, Spain is since 1981 well below the 2.1 children needed to maintain replacement level [2]. Birth rate, have declined mainly due to changes in lifestyle and social mores and increased contraception [3]. These demographic transformations, as much as they are socially valued and desirable, have important clinical consequences. The fertility decline has resulted in a major delay in the average age of conception. The first pregnancy is postponed to ages at which women fecundity is decreased [4]. That may be one important reason why the medical reproductive units have taken on such a relevant role in developed countries. Between 2002 and 2004, more than 6% of Danish children were born through assisted reproduction techniques [1]. Consequently, social and medical considera- tions about infertility have become an important concern in recent years. In parallel, it has been hypothesized that there is a worldwide decline in male semen quality [5–8], but it is clearly not uniform [9]. The decline in semen quality has been linked to environmental and work-related toxic expo- sures [10, 11]. For example, heavy metals may compromise male reproduction, as demonstrated by epidemiological and animal studies [12–22].
Transcript of Review Article Correlations between Different - Instituto Bernabeu

Hindawi Publishing CorporationAdvances in UrologyVolume 2012, Article ID 420893, 11 pagesdoi:10.1155/2012/420893
Review Article
Correlations between Different Heavy Metals in Diverse BodyFluids: Studies of Human Semen Quality
Lidia Mınguez-Alarcon,1 Jaime Mendiola,1 Manuela Roca,1 Jose J. Lopez-Espın,2
Jose J. Guillen,1 Jose M. Moreno,3 Stella Moreno-Grau,3 Marıa J. Martınez-Garcıa,3
Nuria Vergara-Juarez,3 Belen Elvira-Rendueles,3 Antonio Garcıa-Sanchez,3 Jorge Ten,4
Rafael Bernabeu,4, 5 and Alberto M. Torres-Cantero1, 6
1 Public Health and Epidemiology Research Group, Division of Preventive Medicine and Public Health, School of Medicine,University of Murcia, Espinardo 30100, Murcia, Spain
2 Center of Operations Research, Miguel Hernandez University, 03202 Elche, Spain3 Department of Environmental and Chemical Engineering, Technical University of Cartagena, Cartagena 30202, Spain4 Department of Reproductive Biology and Medicine, Instituto Bernabeu, Alicante 03016, Spain5 Reproductive Medicine Chair, Miguel Hernandez University-Instituto Bernabeu, Alicante 03016, Spain6 Centro de Investigacion Biomedica en Red de Epidemiologıa y Salud Publica (CIBERESP), Barcelona 08036, Spain
Correspondence should be addressed to Lidia Mınguez-Alarcon, [email protected]
Received 21 August 2011; Accepted 9 October 2011
Academic Editor: Edward Kim
Copyright © 2012 Lidia Mınguez-Alarcon et al. This is an open access article distributed under the Creative Commons AttributionLicense, which permits unrestricted use, distribution, and reproduction in any medium, provided the original work is properlycited.
It has been hypothesized that exposure to heavy metals may impair male reproduction. To measure the effect produced bylow doses of heavy metals on semen parameters, it is necessary to clarify in which body fluids those measurements must beperformed. Sixty-one men attending infertility clinics participated in our study. Concentrations of lead, cadmium, and mercurywere measured in whole blood, blood plasma, and seminal plasma using spectroanalytical and electrochemical methods. Semenanalyses were performed according to World Health Organization criteria. For statistical analysis, Spearman’s rank correlations,mean comparison tests, and discriminant analysis were calculated. Significant correlations between the measured concentrationsof the three heavy metals in the same biological fluids were observed. However, no similar relationship was seen when comparingthe concentrations in different body fluids of the same metal. According to our results and previous publications, seminal plasmamight be the best body fluid for assessing impairment of human semen parameters.
1. Introduction
Over time there has been a significant decline of human fer-tility [1]. Like other European countries, Spain is since 1981well below the 2.1 children needed to maintain replacementlevel [2]. Birth rate, have declined mainly due to changes inlifestyle and social mores and increased contraception [3].
These demographic transformations, as much as theyare socially valued and desirable, have important clinicalconsequences. The fertility decline has resulted in a majordelay in the average age of conception. The first pregnancyis postponed to ages at which women fecundity is decreased[4]. That may be one important reason why the medical
reproductive units have taken on such a relevant role indeveloped countries. Between 2002 and 2004, more than 6%of Danish children were born through assisted reproductiontechniques [1]. Consequently, social and medical considera-tions about infertility have become an important concern inrecent years.
In parallel, it has been hypothesized that there is aworldwide decline in male semen quality [5–8], but it isclearly not uniform [9]. The decline in semen quality hasbeen linked to environmental and work-related toxic expo-sures [10, 11]. For example, heavy metals may compromisemale reproduction, as demonstrated by epidemiological andanimal studies [12–22].

2 Advances in Urology
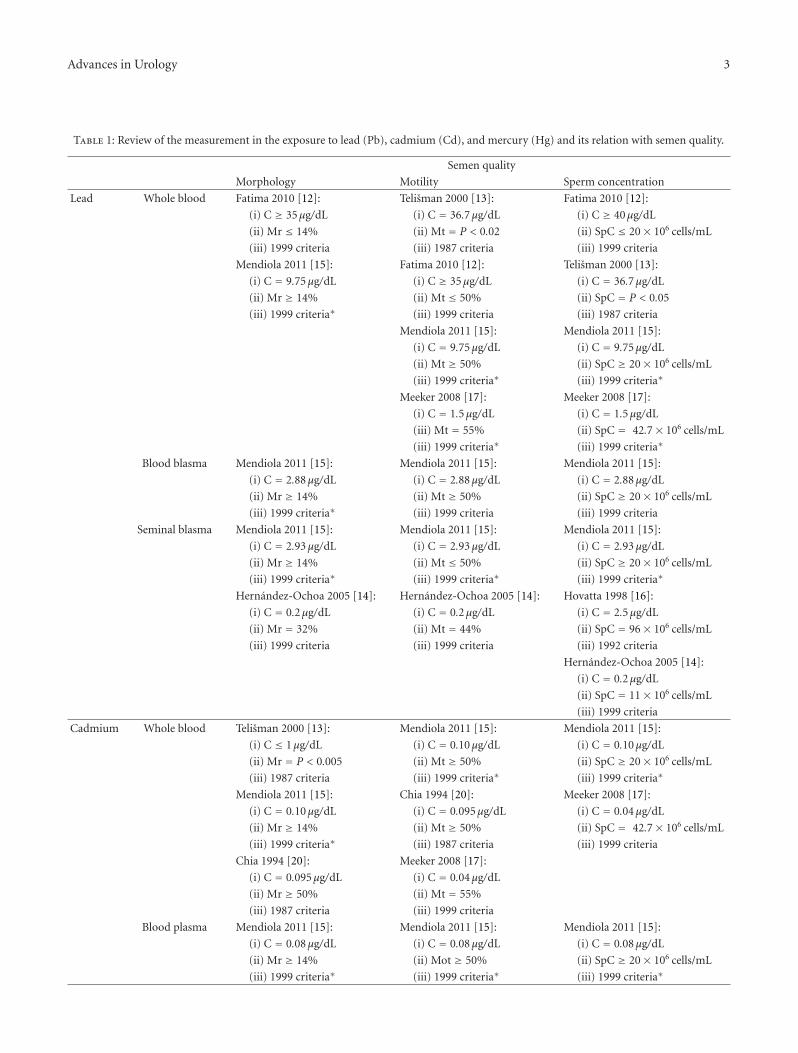
Our research interests are related to the measurement ofthe exposure to lead (Pb), cadmium (Cd), and mercury (Hg),and its relationship with human semen quality. The mainresults published on that issue are summarized in Table 1.Those studies were done using the World Health Organiza-tion (WHO) guidelines for semen analysis published in 1987[23], 1992 [24], and 1999 [25]. However, in 2010, the WHOpublished new criteria for the assessment of semen samples[26], and all the sperm parameter cutoffs were lowered. Thechanges in the three main semen parameters through time(1987–2010) are summarized in Table 2.
1.1. Lead. There is considerable agreement that high or evenmoderate concentrations of lead cause fertility problems inhumans. Fatima et al. showed that >40 μg/dL of lead in bloodproduced a decline of sperm count (<20 × 106 cells/mL).In addition, they observed lower motility (<50%) andmorphology (<14%), with >35 μg/dL in whole blood [12].Telisman and colleagues showed significantly lower spermdensity and motility with high blood lead concentrations(36.7 μg/dL) [13]. High concentrations of lead seem to beclearly associated with sperm damage.
However, there are conflicting results about the effecton semen quality at low lead exposures. Hernandez-Ochoaand colleagues found that low lead concentrations in seminalfluid (0.2 μg/dL) were associated with impaired semenquality, 44% of motility, 32% of normal morphology, and11 × 106 cell/mL of sperm concentration [14]. In contrast,Mendiola et al. found a relationship between levels of leadten times higher in the spermatic fluid (2.93 μg/dL) andlow motility, but no effect on morphology (>14%) orsperm concentration (>20 × 106 cells/mL) [15]. Similarly,Hovatta et al. reported that lead concentrations in seminalplasma of 2.5 μg/dL did not affect sperm concentration (96×106 cells/mL) [16]. Moreover, Mendiola et al. found that leadconcentrations of 9.75 μg/dL measured in whole blood and2.78 μg/dL in blood plasma had no effect on morphology(>14%), motility (>50%), or sperm concentration (>20 ×106 cells/mL) [15]. Meeker et al. also reported no effect onsperm concentration (42.7× 10⁶ cells/mL) or motility (55%)with 1.5 μg/dL of lead concentration in whole blood [17].
1.2. Cadmium. At high concentrations, cadmium couldaffect semen quality. According to Akinloye et al., menwith high concentrations of cadmium in seminal plasma(65 μg/dL) had 5.16 × 10⁶ cells/mL of sperm count and 36%of motile sperms [18].
As seen with lead, there is no agreement on theeffect of low concentrations of cadmium on semen quality.Telisman et al. found that even low concentrations ofcadmium <1 μg/dL in whole blood were associated with headpathologic sperms [13]. Benoff and colleagues concludedthat sperm concentration, motility, and morphology areaffected even with low seminal plasma concentrations ofcadmium (0.028 μg/dL) [19]. Mendiola and colleagues alsofound that low concentrations of cadmium in seminalplasma (0.085 μg/dL) were moderately associated with lowsperm motility (<50%) but had no effect on morphology(>14%) or sperm concentration (>20 × 106 cells/mL) [15].
Equally, Hovatta et al. showed no correlation between highercadmium concentrations in seminal fluid (0.15 μg/dL) andsperm concentration (96 × 106 cells/mL) [16]. Chia andcolleagues did not find an impairment of morphology(>50%) and motility (>50%) with low concentrations ofcadmium in whole blood (0.095 μg/dL) [20]. Similarly,Mendiola et al. showed that cadmium measured in wholeblood (0.10 μg/dL) and blood plasma (0.08 μg/dL) did notimpaired morphology (>14%), motility (>50%), or spermconcentration (>20 × 106 cells/mL) [15]. Moreover, Meekeret al. reported no effect of low cadmium concentrationsin whole blood (0.04 μg/dL) on sperm density (42.7 ×10⁶ cells/mL) and motility (55%) [17].
1.3. Mercury. There is clear evidence that very high concen-trations of mercury in the body will harm sperm. Choy et al.showed that high concentrations of total mercury (inorganicand organic) measured in whole blood (40.6 mmol/L)resulted in <50% of progressive motility, <14% of normalmorphology, and <20×106 cells/mL of sperm concentration[21].
However, Mendiola et al. did not find an alterationof motility (>50%), morphology (>14%), or sperm con-centration (>20 × 106 cells/mL) at low concentrations oftotal mercury in seminal plasma (1.18 μg/dL). Besides, lowconcentrations measured in whole blood (1.99 μg/dL) andblood plasma (0.6 μg/dL) were not related to decreased mor-phology (>14%), motility (>50%), or sperm concentration(> 20 × 106 cells/mL) [15]. Rignell-Hydbom et al. foundno association with sperm motility (54%) or concentration(48 × 106 sperm cells/mL) at low concentrations of organicmercury in whole blood (0.225 μg/dL) [22]. In addition,Meeker et al. reported that low mercury concentrations inwhole blood (0.11 μg/dL) did not affect motility (55%) andsperm concentration (42.7× 10⁶ cells/mL) [17].
1.4. Justification of the Study. There are at least two problemsin assessing whether low concentrations of heavy metals havean impact on human semen quality. First of all, there are justa few studies published on that issue so far. A second problemrelates to the variables measured; that is the biologicalsamples in which the concentrations of heavy metals aremeasured, and the parameters used to measure semen quality(motility, morphology, and sperm concentration).
To measure the effect produced by low doses of a heavymetal in the reproductive organs, it is necessary to clarifywhere to perform those measurements. Concentrations ofheavy metals may be measured in the whole blood, inblood plasma, and in seminal plasma. However, it is notclear whether measurements in one or another fluid areequivalent, nor to what extent there are correlations betweenthe three measurements of these heavy metals in the differentbody fluids.
The objectives of this study are (1) to examine whetherthere are correlations between the concentrations of heavymetals (lead, cadmium, and mercury) in the three bodyfluids (whole blood, blood plasma, and seminal plasma) and(2) to explore whether any one of the three measures relatesbetter than the others with the semen quality parameters.
Advances in Urology 3
Table 1: Review of the measurement in the exposure to lead (Pb), cadmium (Cd), and mercury (Hg) and its relation with semen quality.
Semen quality
Morphology Motility Sperm concentration
Lead Whole blood Fatima 2010 [12]: Telisman 2000 [13]: Fatima 2010 [12]:
(i) C ≥ 35μg/dL (i) C = 36.7μg/dL (i) C ≥ 40μg/dL
(ii) Mr ≤ 14% (ii) Mt = P < 0.02 (ii) SpC ≤ 20× 106 cells/mL
(iii) 1999 criteria (iii) 1987 criteria (iii) 1999 criteria
Mendiola 2011 [15]: Fatima 2010 [12]: Telisman 2000 [13]:
(i) C = 9.75μg/dL (i) C ≥ 35μg/dL (i) C = 36.7μg/dL
(ii) Mr ≥ 14% (ii) Mt ≤ 50% (ii) SpC = P < 0.05
(iii) 1999 criteria∗ (iii) 1999 criteria (iii) 1987 criteria
Mendiola 2011 [15]: Mendiola 2011 [15]:
(i) C = 9.75μg/dL (i) C = 9.75μg/dL
(ii) Mt ≥ 50% (ii) SpC ≥ 20× 106 cells/mL
(iii) 1999 criteria∗ (iii) 1999 criteria∗
Meeker 2008 [17]: Meeker 2008 [17]:
(i) C = 1.5μg/dL (i) C = 1.5μg/dL
(iii) Mt = 55% (ii) SpC = 42.7× 10⁶ cells/mL
(iii) 1999 criteria∗ (iii) 1999 criteria∗
Blood blasma Mendiola 2011 [15]: Mendiola 2011 [15]: Mendiola 2011 [15]:
(i) C = 2.88μg/dL (i) C = 2.88μg/dL (i) C = 2.88μg/dL
(ii) Mr ≥ 14% (ii) Mt ≥ 50% (ii) SpC ≥ 20× 106 cells/mL
(iii) 1999 criteria∗ (iii) 1999 criteria (iii) 1999 criteria
Seminal blasma Mendiola 2011 [15]: Mendiola 2011 [15]: Mendiola 2011 [15]:
(i) C = 2.93μg/dL (i) C = 2.93μg/dL (i) C = 2.93μg/dL
(ii) Mr ≥ 14% (ii) Mt ≤ 50% (ii) SpC ≥ 20× 106 cells/mL
(iii) 1999 criteria∗ (iii) 1999 criteria∗ (iii) 1999 criteria∗
Hernandez-Ochoa 2005 [14]: Hernandez-Ochoa 2005 [14]: Hovatta 1998 [16]:
(i) C = 0.2μg/dL (i) C = 0.2μg/dL (i) C = 2.5μg/dL
(ii) Mr = 32% (ii) Mt = 44% (ii) SpC = 96× 106 cells/mL
(iii) 1999 criteria (iii) 1999 criteria (iii) 1992 criteria
Hernandez-Ochoa 2005 [14]:
(i) C = 0.2μg/dL
(ii) SpC = 11× 106 cells/mL
(iii) 1999 criteria
Cadmium Whole blood Telisman 2000 [13]: Mendiola 2011 [15]: Mendiola 2011 [15]:
(i) C ≤ 1μg/dL (i) C = 0.10μg/dL (i) C = 0.10μg/dL
(ii) Mr = P < 0.005 (ii) Mt ≥ 50% (ii) SpC ≥ 20× 106 cells/mL
(iii) 1987 criteria (iii) 1999 criteria∗ (iii) 1999 criteria∗
Mendiola 2011 [15]: Chia 1994 [20]: Meeker 2008 [17]:
(i) C = 0.10μg/dL (i) C = 0.095μg/dL (i) C = 0.04μg/dL
(ii) Mr ≥ 14% (ii) Mt ≥ 50% (ii) SpC = 42.7× 10⁶ cells/mL
(iii) 1999 criteria∗ (iii) 1987 criteria (iii) 1999 criteria
Chia 1994 [20]: Meeker 2008 [17]:
(i) C = 0.095μg/dL (i) C = 0.04μg/dL
(ii) Mr ≥ 50% (ii) Mt = 55%
(iii) 1987 criteria (iii) 1999 criteria
Blood plasma Mendiola 2011 [15]: Mendiola 2011 [15]: Mendiola 2011 [15]:
(i) C = 0.08μg/dL (i) C = 0.08μg/dL (i) C = 0.08μg/dL
(ii) Mr ≥ 14% (ii) Mot ≥ 50% (ii) SpC ≥ 20× 106 cells/mL
(iii) 1999 criteria∗ (iii) 1999 criteria∗ (iii) 1999 criteria∗

4 Advances in Urology
Table 1: Continued.
Semen quality
Morphology Motility Sperm concentration
Seminal plasma Mendiola 2011 [15]: Akinloye 2006 [18]: Akinloye 2006 [18]:
(i) C = 0.085μg/dL (i) C = 65μg/dL (i) C = 65μg/dL
(ii) Mr ≥ 14% (ii) Mt = 35.75% (ii) SpC = 5.16× 10⁶ cells/mL
(iii) 1999 criteria∗ (iii) 1999 criteria (iii) 1999 criteria
Bennof 2009 [19]: Mendiola 2011 [15]: Hovatta 1998 [16]:
(i) C = 0.028μg/dL (i) C = 0.085μg/dL (i) C = 0.15μg/dL
(ii) Mr = P < 0.05 (ii) Mt ≤ 50% (ii) SpC = 96× 106 cells/mL
(iii) 1992 criteria (iii) 1999 criteria∗ (iii) 1992 criteria
Bennof 2009 [19]: Mendiola 2011 [15]:
(i) C = 0.028μg/dL (i) C = 0.085μg/dL
(ii) Mt = P < 0.05 (ii) SpC ≥ 20× 106 cells/mL
(iii) 1992 criteria (iii) 1999 criteria∗
Bennof 2009 [19]:
(i) C = 0.028μg/dL
(ii) SpC = P < 0.05
(iii) 1992 criteria
Mercury Whole blood Choy 2002 [21]: Choy 2002 [21]: Choy 2002 [21]:
(i) C = 40.6 mmol/L (i) C = 40.6 mmol/L (i) C = 40.6 mmol/L
(ii) Mr ≤ 14% (ii) Mr ≤ 50% (ii) SpC ≤ 20× 106 cells/mL
(iii) 1999 criteria (iii) 1999 criteria (iii) 1999 criteria
Mendiola 2011 [15]: Mendiola 2011 [15]: Mendiola 2011 [15]:
(i) C = 1.99μg/dL (i) C = 1.99μg/dL (i) C = 1.99μg/dL
(ii) Mr ≥ 14% (ii) Mt ≥ 50% (ii) SpC ≥ 20× 106 cells/mL
(iii) 1999 criteria∗ (iii) 1999 criteria∗ (iii) 1999 criteria∗
Rignell-Hydbom 2007 [22]: Rignell-Hydbom 2007 [22]:
(i) C = 0.225μg/dL (i) C = 0.225μg/dL
(ii) Mt = 54% (ii) SpC = 48× 106 cells/mL
(iii) 1999 criteria (iii) 1999 criteria
Meeker 2008 [17]: Meeker 2008 [17]:
(i) C = 0.11μg/dL (i) C = 0.11μg/dL
(ii) Mt = 55% (ii) SpM = 42.7× 10⁶ cells/mL
(iii) 1999 criteria (iii) 1999 criteria
Blood plasma Mendiola 2011 [15]: Mendiola 2011 [15]: Mendiola 2011 [15]:
(i) C = 0.6μg/dL (i) C = 0.6μg/dL (i) C = 0.6μg/dL
(ii) Mr ≥ 14% (ii) Mt ≥ 50% (ii) SpC ≥ 20× 106 cells/mL
(iii) 1999 criteria∗ (iii) 1999 criteria∗ (iii) 1999 criteria∗
Seminal plasma Mendiola 2011 [15]: Mendiola 2011 [15]: Mendiola 2011 [15]:
(i) C = 1.18μg/dL (i) C = 1.18μg/dL (i) C = 1.18μg/dL
(ii) Mr ≥ 14% (ii) Mt ≥ 50% (ii) SpC ≥ 20× 106 cells/mL
(iii) 1999 criteria∗ (iii) 1999 criteria∗ (iii) 1999 criteria∗
Note: This table shows author, publication year, concentration of metal in whole blood, blood plasma, and seminal plasma, their effect on semen qualityparameters, and the WHO criteria used to classify the semen quality.C: concentration of the metal, Mr: morphology, Mt: motility, SpC: sperm concentration.∗Mendiola et al. use Kruger’s strict criteria (14% of normal forms) as a cutoff for sperm morphology [25].
2. Materials and Methods
2.1. Study Population, Design, and Semen Analysis. The studypopulation, hormone, and semen analyses have been previ-ously described elsewhere [27, 28]. Sixty-one men wereparticipating in a study to explore the role of environmental
toxins and lifestyles on male infertility. Briefly, the men ofcouples attending three infertility centers in southeasternSpain between 2005 and 2007 were classified on the basis ofsemen quality, following WHO criteria [25]. Subjects pro-vided two semen samples and were requested to observe a 3-to 5-day abstinence period. The importance of the abstinence

Advances in Urology 5
Table 2: Changes in the three main semen parameters through time (1987–2010). A semen parameter was considered normal when thevalues were equal or above the presented figures [23–26].
1987 1992 1999 2010
Sperm concentration (×106 cells/mL) 20–2001 ≥20 ≥20 ≥15
Motility (%) ≥60 ≥50 ≥50 ≥40
Morphology (%) ≥50 ≥30 ≥14 ≥41range.
period was stressed on the interviews with the participants[27]. The average of the two samples was used in ourstatistical analysis. Semen parameters evaluated includedejaculate volume, sperm concentration, percentage of motilesperm, and percentage of normal forms following Kruger’sstrict criteria [25]. All patients were interviewed face-to-faceby the same interviewer and completed a comprehensiveoccupational and lifestyle questionnaire [27]. This study wasapproved by the Institutional Review Board. Patients wereincluded in the study after giving informed written consent.
2.2. Measurements of Metals. A total of 181 biological sam-ples were analyzed for Pb, Cd, and Hg, including 61 samplesof seminal plasma, 61 of blood plasma, and 59 of wholeblood, as two samples were lost during the study. Biologicalsamples were dispensed into aliquots and frozen and storedat −40◦C until analysis. Anodic stripping voltammetry(ASV) was used for measuring Pb and Cd concentrations.ASV was carried out using a voltamperometer with VA663 stand and VA 608 controller (Metrohm 626, Herisau,Switzerland). The voltamperometric cell was equipped witha drop of mercury as the working electrode, an Ag/AgCl/KCl3 M reference electrode, and a platinum auxiliary electrode.
Determination of total Hg was carried out by thermaldecomposition, amalgamation, and atomic absorption spec-trophotometry, using a mercury analyzer with quartz sampleboats (DMA-80 Direct Mercury Analyzer, Milestone, SheltonCT, USA).
The highest grade purity reagents were employed in thisprocedure including nitric acid 65% and perchloric acid 70%(Suprapur, Merck, Darmstadt, Germany). The ultrapurewater was purified with Millipore Simplicity 185 (MilliporeGmbH, Molsheim, France) obtaining conductivity values of0.054 μS/cm.
In order to prepare the working standard solutions,commercially available standard solutions for Pb 1 g/L andCd 1 g/L (Tritisol, Merck, Darmstadt, Germany) and Hg1 g/L (Certipur, Merck, Darmstadt, Germany) were used.The limits of detection (LOD) for the body’s fluid metallevels were as follows: lead, 21 μg/L; cadmium, 0.11 μg/L, andmercury, 0.1 μg/L. To guarantee the accuracy and precisionof the applied technique regarding heavy metals, whole bloodreference materials (Seronorm Trace Elements Whole Blood,SERO AS, Billingstad, Norway) were employed.
2.3. Sample Preparation. Pb and Cd determinations wereperformed using 0.2 mL of the biological sample depositedinside of 25 mL borosilicate glass. Acid digestion was carried
out by adding 2 mL of nitric acid and 2 mL of perchloric acidand evaporating it to dryness. Once the sample was dry andcooled down, 100 μL of perchloric acid and 15 mL of double-distilled water were added, transferring the final volume intoa voltamperometric cell.
Biological samples were measured by ASV accordingto the following method [24]. Briefly, differential pulse(DP) with hanging mercury drop electrode (HMDE) wasused, the voltage sweep was from −0.70 to +0.15 volts,and the peak voltage was located at −0.58 and −0.40 voltsfor Cd and Pb respectively. Deaeration, preconcentration,and resting time (without stirring) were 180, 120, and 40seconds, respectively. Sensitivity was 0.05 nAmp/mm and0.2 nAmp/mm for Cd and Pb, respectively. Standard additionmethod was applied to perform the current analyses, addingknown values of a standard solution (2, 4, and 6 ng for Cdand 20, 40, and 60 ng for Pb) to obtain a calibration curve,then the values of the measurements were interpolated intothat curve. Mercury determination was carried out followingEPA method 7473 [29], and 0.2 mL of the biological samplewas transferred directly into the quartz sample boats. Toobtain a calibration curve, standard solutions of 5, 10, 20,30, 100, 200, and 500 ng of Hg were employed.
2.4. Statistical Analysis. The statistical analysis encompasseddescriptive and inferential analyses. Basic, dispersion as wellas frequency parameters were calculated for descriptive anal-yses. Statistical analyses were performed to explore possiblepatterns in the concentrations of heavy metals measured inblood serum, whole blood, and seminal plasma. Spearman’srank correlations and scatter plots were employed forcomparison of variables. In the inferential analysis, the meancomparison tests and discriminant analysis were performed.All tests were two-tailed, and the level of statistical signifi-cance was set at 0.05. Statistical analysis was performed usingSPSS 17.0 (SPSS Inc., Chicago, IL, USA).
3. Results and Discussion
3.1. Results. Table 3 shows lead (Pb), cadmium (Cd), andmercury (Hg) concentrations in μg/dL (mean, standarderror, median, and interquartile range), in whole blood,blood plasma, and seminal plasma.
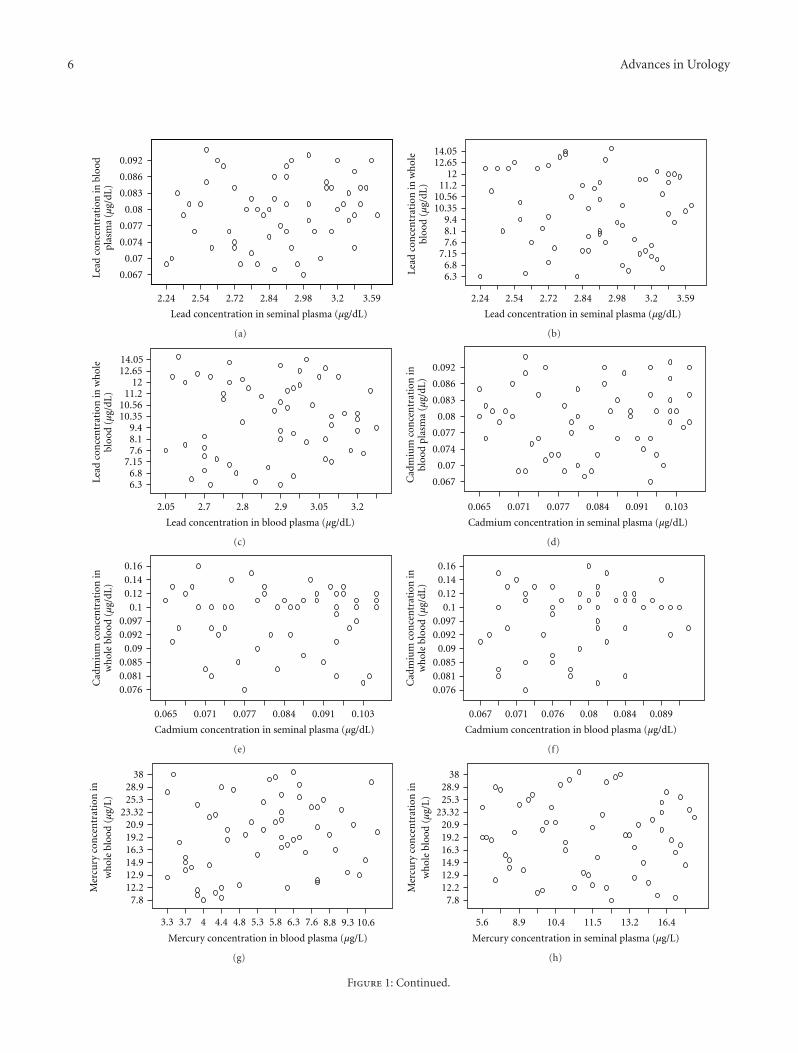
Figures 1(a)–1(i) show the scatter plots of the concentra-tions of the three metals in the three body fluids. As may beobserved, men with low concentration of one heavy metalin a fluid can show low or high concentrations of the samemetal in another fluid. There is a wide dispersion of data, and
6 Advances in Urology
Lead concentration in seminal plasma (µg/dL)
3.593.22.982.842.722.542.24
0.092
0.086
0.083
0.08
0.077
0.074
0.07
0.067Lead
con
cen
trat
ion
in b
lood
plas
ma
(µg/
dL)
(a)
Lead concentration in seminal plasma (µg/dL)
3.593.22.982.842.722.542.24
12.6514.05
1211.2
10.5610.35
9.48.17.6
7.156.86.3Le
ad c
once
ntr
atio
n in
wh
ole
bloo
d (µ
g/dL
)
(b)
Lead concentration in blood plasma (µg/dL)
3.23.052.92.82.72.05
14.0512.65
1211.2
10.5610.35
9.48.17.6
7.156.86.3Le
ad c
once
ntr
atio
n in
wh
ole
bloo
d (µ
g/dL
)
(c)
Cadmium concentration in seminal plasma (µg/dL)
0.1030.0910.0840.0770.0710.065
0.092
0.086
0.083
0.08
0.077
0.074
0.07
0.067Cad
miu
m c
once
ntr
atio
n in
bloo
d pl
asm
a (µ
g/dL
)
(d)
0.1030.0910.0840.0770.0710.065
0.160.140.12
0.10.0970.092
0.090.0850.0810.076
Cadmium concentration in seminal plasma (µg/dL)
Cad
miu
m c
once
ntr
atio
n in
wh
ole
bloo
d (µ
g/dL
)
(e)
Cadmium concentration in blood plasma (µg/dL)
0.0890.0840.080.0760.0710.067
Cad
miu
m c
once
ntr
atio
n in
wh
ole
bloo
d (µ
g/dL
)
0.160.140.12
0.10.0970.092
0.090.0850.0810.076
(f)
Mercury concentration in blood plasma (µg/L)
10.69.38.87.66.35.85.34.84.443.73.3
Mer
cury
con
cen
trat
ion
inw
hol
e bl
ood
(µg/
L)
3828.925.3
23.3220.919.216.314.912.912.2
7.8
(g)
Mercury concentration in seminal plasma (µg/L)
16.413.211.510.48.95.6
Mer
cury
con
cen
trat
ion
inw
hol
e bl
ood
(µg/
L)
3828.925.3
23.3220.919.216.314.912.912.2
7.8
(h)
Figure 1: Continued.

Advances in Urology 7
Mercury concentration in seminal plasma (µg/L)
16.212.6511.310.48.95.6M
ercu
ry c
once
ntr
atio
n in
bloo
d pl
asm
a (µ
g/L)
10.69.38.87.66.35.85.34.84.4
43.73.3
(i)
Figure 1: (a) Relation between lead concentrations in seminal plasma and blood plasma. (b) Relation between lead concentrations in seminalplasma and whole blood. (c) Relation between lead concentrations in blood plasma and whole blood. (d) Relation between cadmiumconcentrations in seminal plasma and blood plasma. (e) Relation between cadmium concentrations in seminal plasma and whole blood.(f) Relation between cadmium concentrations in blood plasma and whole blood. (g) Relation between mercury concentrations in bloodplasma and whole blood. (h) Relation between mercury concentrations in seminal plasma and whole blood. (i) Relation between mercuryconcentrations in blood plasma and whole blood.
Table 3: Heavy metal concentrations in seminal, blood plasma, and whole blood.
Lead (μg/dL) Cadmium (μg/dL) Mercury (μg/dL)
Mean (SE) Median (IQR) Mean (SE) Median (IQR) Mean (SE) Median (IQR)
Blood plasma (n = 61) 2.88 (0.22) 2.90 (2.72–3.05) 0.08 (0.007) 0.08 (0.07–0.08) 0.6 (0.22) 0.58 (0.42–0.72)
Whole blood (n = 61) 9.75 (2.28) 10.10 (7.50–11.90) 0.10 (0.02) 0.10 (0.09–0.12) 1.99 (0.69) 1.96 (1.47–2.46)
Seminal plasma (n = 61) 2.93 (0.32) 2.90 (2.72–3.15) 0.08 (0.01) 0.08 (0.07–0.09) 1.18 (0.35) 1.13 (0.92–1.49)
SE: standard Error, IQR: interquartile range.
there are no associations between the measurements made ofthe metals in one fluid and the concentrations measured inthe two other fluids.
Table 4 presents the results of the Spearman’s correlationbetween the concentrations of lead, cadmium, and mercuryin whole blood, blood plasma, and seminal plasma. Althoughthe correlation coefficients were above 0.5 for some determi-nations, no significant correlations were found between theconcentrations of the same metal and the three biologicalfluids. The correlation between the concentration of lead inblood plasma and whole blood was 0.57 (P = 0.67), betweencadmium in seminal plasma and whole blood was −0.50(P = 0.72), and between mercury in seminal plasma andwhole blood −0.34 (P = 0.80).
Figures 2(a)–2(i) show the relationship between theconcentrations of lead, cadmium, and mercury measured ineach fluid. As may be observed, there is a linear relationship,since men with low concentration of a given metal in abiological fluid also had low concentration of the other twometals in the same fluid. And, reversely, men with high con-centration of a given metal in a biological fluid also had highconcentration of the other metals in the same body fluid.
Spearman’s correlation coefficients and scatter plotsrevealed a high correlation between the concentrations of thethree metals in the same biological fluids. Table 5 shows thecorrelation of the three heavy metals (Pb, Cd, and Hg) in thesame biological fluid (whole blood, blood plasma, or seminal
plasma). High and statistically significant correlations wereobserved between the three heavy metals for the samebiological fluid. In seminal plasma, the correlation betweencadmium and lead was 0.74 (P value < 0.005) and betweenmercury and lead 0.76 (P value < 0.005).
To explore whether these correlations were determinedby associations with other factors, exploratory scatter plotswere generated between the concentrations of the three met-als in the three biological fluids and possible confoundingvariables. Possible confounders were such as “occupation,”“tobacco smoke,” “exposure to toxics at work” or “usingmetals at work.” No patterns were observed. Hypothesistests were used to detect significant differences in the meanconcentrations of metals and the possible confoundingfactors used in the scatter plots. Not significant differenceswere found (data not shown).
As a final alternative, metal concentrations were catego-rized in two, three, and four groups using the mean values,tertiles, and quartiles, respectively. Discriminant analysis wasthen used to detect whether any of the factors was relatedto the categories of the metal concentrations. To this end,different discriminant analysis evaluating the overall Wilks’lambda and the owners of each factor were produced, butnone of them were satisfactory.
3.2. Discussion. Using the Spearman’s correlation coeffi-cient and scatter plots revealed a high correlation between

8 Advances in Urology
Table 4: Spearman’s correlation coefficients between metal concentrations in seminal and blood plasma, and whole blood.
Blood plasma Whole blood
R P value R P value
LeadBlood plasma 0.57 0.67
Seminal plasma 0.13 0.32 −0.08 0.55
CadmiumBlood plasma 0.14 0.30
Seminal plasma 0.12 0.36 −0.50 0.72
MercuryBlood plasma 0.17 0.19
Seminal plasma −0.13 0.34 −0.34 0.80
Table 5: Spermean’s correlation coefficients between seminal plasma, blood plasma, and whole blood, with metal concentrations.
Cadmium Mercury
R P value R P value
Seminal plasmaLead 0.740 0.001 0.760 0.001
Cadmium 0.870 0.001
Blood plasmaLead 0.550 0.001 0.750 0.001
Cadmium 0.700 0.001
Whole bloodLead 0.850 0.001 0.950 0.001
Cadmium 0.792 0.001
the measured concentrations of the 3 heavy metals in thesame biological fluids. However, no similar relationship wasobserved when comparing the concentrations in differentbody fluids of the same metal.
It would be reasonable to expect that subjects with highand low levels of exposure to any metal would show similarpositions (low or high concentrations) in the measurementsmade in any body fluid. However, we found no correlationbetween the concentrations of any of the metal in the threebiological samples analyzed (whole blood, blood plasma, andseminal plasma).
Other authors, similarly, found no correlation betweenthe concentrations of the same metal in different fluids[14, 19]. Benoff and colleagues found no correlation betweencadmium concentrations in seminal plasma and bloodplasma. Hernandez-Ochoa et al. also reported no correlationin blood lead concentrations between whole blood-plasmablood, whole blood-seminal plasma, or blood plasma-spermin 68 Mexican men.
There are some possible hypotheses for these phenom-ena. The three heavy metals are bound and transported byerythrocytes [30–32]. Given that metals are transported byred cells, unmeasured differences in the concentration ofred cells in our study population may result in differentconcentration of the metals in the blood. However, thishypothesis cannot be tested, mainly due to information onred cell concentration was not collected.
Surprisingly, the concentrations of Pb, Cd, and Hg werecorrelated in the same biological samples. Howatta et al.also found that the concentrations of cadmium and lead inseminal plasma were correlated [16]. We do not have a firmhypothesis of why that may happen.
Correlations of the three heavy metals in the samebody biological fluid may be due to an interaction between
the different metals in the same compartment, so that theconcentration of one metal determines the concentration ofthe others. We are not aware of lead, cadmium, or mercurymodulate each other. However, it has been published thatselenium produces the redistribution of Hg from plasma toerythrocytes at higher ratio [33] and the modification ofhepatic zinc by cadmium [34]. Therefore, it could be that agiven heavy metal might modulate proteins and/or enzymesin the cells and influence the concentration of other heavymetals. [35–37].
As to how to measure the effect produced by heavymetal concentrations on semen quality, it would be betterto measure those metals in seminal plasma than in bloodplasma or whole blood. Heavy metal concentrations inblood samples do not necessarily reflect the seminal plasmaones, since heavy metal concentrations reaching the seminalplasma could be quite different.
Heavy metals have a strong capacity to induce oxidativestress in body cells by disintegration of the lipid membrane,and spermatozoa are quite sensible to oxidative stress [38,39]. Thus, in principle, it would be more accurate to measureheavy metal concentrations in seminal plasma—than inother fluids—in order to determine sperm damage. Numer-ous antioxidants such as vitamin C, vitamin E, glutathione,coenzyme Q10, and some fruits may diminish the oxidativestress caused by heavy metals [28, 40, 41].
Furthermore, as it can be seen in Table 1, high concentra-tions of heavy metals can alter sperm morphology, motility,and concentration individually. However, an alteration of thethree semen parameters can be observed with very low heavymetal concentrations only in seminal plasma, showing usthat this body fluid might reflect better the sperm damage.
Finally, our findings might be attributed to chance orbias. The sample of individuals included in the study was

Advances in Urology 9
Cadmium concentration in whole blood (µg/dL)
0.140.10.0920.0850.076
Lead
con
cen
trat
ion
in w
hol
ebl
ood
(µg/
dL)
14.0512.65
1211.2
10.5610.35
9.48.17.6
7.156.86.3
(a)
Mercury concentration in whole blood (µg/L)
31.225.322.118.515.112.67.8
Lead
con
cen
trat
ion
inw
hol
e bl
ood
(µg/
dl)
14.06
12.65
11.9
10.9
10.4
9.4
7.96
7.35
6.9
6.3
(b)
Mercury concentration in whole blood (µg/L)
31.225.322.118.515.112.67.8
Cad
miu
m c
once
ntr
atio
nin
wh
ole
bloo
d (µ
g/dL
)
0.160.140.12
0.10.0970.092
0.090.0850.0810.076
(c)
Cadmium concentration in blood plasma (µg/dL)
0.0920.0860.0830.080.0770.0740.070.067
Lead
con
cen
trat
ion
inbl
ood
plas
ma
(µg/
dL)
3.3
3.12
3.02
2.91
2.83
2.78
2.72
2.68
2.05
(d)
Mercury concentration in blood plasma (µg/L)
10.69.38.87.66.35.85.34.84.443.73.3
Lead
con
cen
trat
ion
inbl
ood
plas
ma
(µg/
dL)
3.3
3.12
3.02
2.91
2.83
2.78
2.72
2.68
2.05
(e)
Mercury concentration in blood plasma (µg/L)
10.69.38.87.66.35.85.34.84.443.73.3
Cad
miu
m c
once
ntr
atio
nin
blo
od p
lasm
a (µ
g/dl
)
0.092
0.086
0.083
0.08
0.077
0.074
0.07
0.067
(f)
Lead
con
cen
trat
ion
inse
min
al p
lasm
a (µ
g/dL
)
Cadmium concentration in seminal plasma (µg/dL)
2.89
2.24
0.065 0.071 0.077 0.084 0.091 0.103
2.512.6
2.722.8
2.983.13.3
3.59
(g)
Mercury concentration in seminal plasma (µg/L)
16.212.6511.310.48.95.6
Lead
con
cen
trat
ion
inse
min
al p
lasm
a (µ
g/dL
)
3.593.33.1
2.982.89
2.82.72
2.62.512.24
(h)
Figure 2: Continued.

10 Advances in Urology
Mercury concentration in seminal plasma (µg/L)
16.212.6511.310.48.95.6C
adm
ium
con
cen
trat
ion
inse
min
al p
lasm
a (µ
g/dL
)
0.11
0.099
0.091
0.086
0.081
0.077
0.073
0.069
0.065
(i)
Figure 2: (a) Relation between lead and cadmium concentrations in whole blood. (b) Relation between lead and mercury concentrationsin whole blood. (c) Relation between cadmium and mercury concentrations in whole blood. (d) Relation between lead and cadmiumconcentrations in blood plasma. (e) Relation between lead and mercury concentrations in blood plasma. (f) Relation between cadmium andmercury concentrations in blood plasma. (g) Relation between lead and cadmium concentrations in seminal plasma. (h) Relation betweenlead and mercury concentrations in seminal plasma. (i) Relation between cadmium and mercury concentrations seminal plasma.
small and the lack of statistically significant correlationsmay be a consequence of that. Our findings are, however,consisting with those [14, 16, 19] of that have explored thesame correlations leading us to believe that they cannot beattributed to random or systematic error.
4. Conclusions
Our study suggests that there is no correlation between theconcentrations of any of the metals in the three biologicalsamples analyzed (whole blood, blood plasma, and seminalplasma) and there is a correlation between the concentra-tions of Pb, Cd, and Hg in the same biological samples.According to our results and previous publications, seminalplasma might be the best body fluid for assessing impairmentof human semen parameters.
Conflict of Interests
The authors declare that they have no competing interests.
Acknowledgments
The authors are grateful for the assistance of Mr. LorenzoVergara Pagan for specimen handling and heavy metalanalysis. This research project was partially supported byFundacion Seneca, Agencia Regional de Ciencia y Tec-nologıa, Region de Murcia (Ref: 00694/PI/04), the Repro-ductive Medicine Chair of the Miguel Hernandez University-Instituto Bernabeu, Fondo de Investigacion Sanitaria, andGestion Clınica Avanzada.
References
[1] N. E. Skakkebæk, N. Jørgensen, K. M. Main et al., “Is humanfecundity declining?” International Journal of Andrology, vol.29, no. 1, pp. 2–11, 2006.
[2] INE, http://www.ine.es/en/inebmenu/mnu analisis en.htm.[3] M. Mills, R. R. Rindfuss, P. McDonald, and E. Te Velde, “Why
do people postpone parenthood? Reasons and social policyincentives,” Human Reproduction Update, vol. 17, no. 6, pp.848–860, 2011.
[4] D. B. Dunson, D. D. Baird, and B. Colombo, “Increasedinfertility with age in men and women,” Obstetrics andGynecology, vol. 103, no. 1, pp. 51–56, 2004.
[5] E. Carlsen, A. Giwercman, N. Keiding, and N. E. Skakkebaek,“Evidence for decreasing quality of semen during past 50years,” British Medical Journal, vol. 305, no. 6854, pp. 609–613,1992.
[6] S. Irvine, E. Cawood, D. Richardson, E. MacDonald, and J. Ait-ken, “Evidence of deteriorating semen quality in the UnitedKingdom: birth cohort study in 577 men in Scotland over 11years,” British Medical Journal, vol. 312, no. 7029, pp. 467–471,1996.
[7] M. Spano, G. Toft, L. Hagmar et al., “Exposure to PCB andp,p′-DDE in European and inuit populations: impact onhuman sperm chromatin integrity,” Human Reproduction, vol.20, no. 12, pp. 3488–3499, 2005.
[8] R. Hauser, “The environment and male fertility: recent re-search on emerging chemicals and semen quality,” Seminarsin Reproductive Medicine, vol. 24, no. 3, pp. 156–167, 2006.
[9] S. H. Swan, C. Brazil, E. Z. Drobnis et al., “Geographic differ-ences in semen quality of fertile U.S. males,” EnvironmentalHealth Perspectives, vol. 111, no. 4, pp. 414–420, 2003.
[10] J. A. Indulski and K. Sitarek, “Environmental factors whichimpair male fertility,” Medycyna Pracy, vol. 48, no. 1, pp. 85–92, 1997.
[11] J. Rubes, S. G. Selevan, D. P. Evenson et al., “Episodic airpollution is associated with increased DNA fragmentationin human sperm without other changes in semen quality,”Human Reproduction, vol. 20, no. 10, pp. 2776–2783, 2005.
[12] P. Fatima, B. C. Debnath, M. M. Hossain et al., “Relationshipof blood and semen lead level with semen parameter,” My-mensingh Medical Journal, vol. 19, no. 3, pp. 405–414, 2010.
[13] S. Talisman, P. Cvitkovic, J. Jurasovic, A. Pizent, M. Gavella,and B. Rocic, “Semen quality and reproductive endocrine

Advances in Urology 11
function in relation to biomarkers of lead, cadmium, zinc, andcopper in men,” Environmental Health Perspectives, vol. 108,no. 1, pp. 45–53, 2000.
[14] I. Hernandez-Ochoa, G. Garcıa-Vargas, L. Lopez-Carrilloet al., “Low lead environmental exposure alters semen qualityand sperm chromatin condensation in northern Mexico,”Reproductive Toxicology, vol. 20, no. 2, pp. 221–228, 2005.
[15] J. Mendiola, J. M. Moreno, M. Roca et al., “Relationshipsbetween heavy metal concentrations in three different bodyfluids and male reproductive parameters: a pilot study,” Envi-ronmental Health, vol. 10, no. 1, p. 6, 2011.
[16] O. Hovatta, E. R. Venalainen, L. Kuusimaki, J. Heikkila, T.Hirvi, and I. Reima, “Aluminium, lead and cadmium concen-trations in seminal plasma and spermatozoa, and semenquality in Finnish men,” Human Reproduction, vol. 13, no. 1,pp. 115–119, 1998.
[17] J. D. Meeker, M. G. Rossano, B. Protas et al., “Cadmium,lead, and other metals in relation to semen quality: humanevidence for molybdenum as a male reproductive toxicant,”Environmental Health Perspectives, vol. 116, no. 11, pp. 1473–1479, 2008.
[18] O. Akinloye, A. O. Arowojolu, O. B. Shittu, and J. I. Anetor,“Cadmium toxicity: a possible cause of male infertility inNigeria,” Reproductive Biology, vol. 6, no. 1, pp. 17–30, 2006.
[19] S. Benoff, R. Hauser, J. L. Marmar, I. R. Hurley, B. Napolitano,and G. M. Centola, “Cadmium concentrations in blood andseminal plasma: correlations with sperm number and motil-ity in three male populations (infertility patients, artificialinsemination donors, and unselected volunteers),” MolecularMedicine, vol. 15, no. 7-8, pp. 248–262, 2009.
[20] S. E. Chia, B. Xu, C. N. Ong, F. M. H. Tsakok, and S. T. Lee,“Effect of cadmium and cigarette smoking on human semenquality,” International Journal of Fertility and MenopausalStudies, vol. 39, no. 5, pp. 292–298, 1994.
[21] C. M. Y. Choy, C. W. K. Lam, L. T. F. Cheung, C. M. Briton-Jones, L. P. Cheung, and C. J. Haines, “Infertility, bloodmercury concentrations and dietary seafood consumption: acase-control study,” An International Journal of Obstetrics andGynaecology, vol. 109, no. 10, pp. 1121–1125, 2002.
[22] A. Rignell-Hydbom, A. Axmon, T. Lundh, B. A. Jonsson, T.Tiido, and M. Spano, “Dietary exposure to methyl mercuryand PCB and the associations with semen parameters amongSwedish fishermen,” Environmental Health, vol. 6, no. 8, article14, 2007.
[23] World Health Organization, WHO Laboratory Manual forthe Examination of Human Semen and Semen-Cervical MucusInteraction, Cambridge University Press, Cambridge, UK, 2ndedition, 1987.
[24] World Health Organization, WHO Laboratory Manual for theExamination of Human Semen and Human Sperm-CervicalMucus Interaction, Cambridge University Press, Cambridge,UK, 3rd edition, 1992.
[25] World Health Organization, WHO Laboratory Manual forthe Examination of Human Semen and Semen-Cervical MucusInteraction, Cambridge University Press, Cambridge, UK, 4thedition, 1999.
[26] World Health Organization, WHO Laboratory Manual forthe Examination of Human Semen and Semen-Cervical MucusInteraction, Cambridge University Press, Cambridge, UK, 5thedition, 2010.
[27] J. Mendiola, A. M. Torres-Cantero, J. M. Moreno-Grau et al.,“Exposure to environmental toxins in males seeking infertilitytreatment: a case-controlled study,” Reproductive BioMedicineOnline, vol. 16, no. 6, pp. 842–850, 2008.
[28] J. Mendiola, A. M. Torres-Cantero, J. M. Moreno-Grau et al.,“Food intake and its relationship with semen quality: a case-control study,” Fertility and Sterility, vol. 91, no. 3, pp. 812–818, 2009.
[29] EPA method 7473, “Mercury in solids and solutions bytermal decomposition, amalgamation, and atomic absorp-tion spectrophotometry,” 2007, http://www.epa.gov/sam/pdfs/EPA-7473.pdf.
[30] ATSDR: agency for toxic substances & disease registry, “Publichealth statement for cadmium,” 2008, http://www.atsdr.cdc.gov/.
[31] ATSDR: agency for toxic substances & disease registry, “Toxi-cologycal profile for lead,” 2007, http://www.atsdr.cdc.gov/.
[32] ATSDR: agency for toxic substances & disease registry,“Toxicologycal profile for mercury,” 1999, http://www.atsdr.cdc.gov/.
[33] T. Orct, M. Lazarus, J. Jurasovic, M. Blanusa, M. Piasek, and K.Kostial, “Influence of selenium dose on mercury distributionand retention in suckling rats,” Journal of Applied Toxicology,vol. 29, no. 7, pp. 585–589, 2009.
[34] M. M. Braga, T. Dick, D. L. Oliveira et al., “Cd modifies hepaticZn deposition and modulates δ-ALA-D activity and MT levelsby distinct mechanisms,” Journal of Applied Toxicology, vol. 32,no. 1, pp. 20–25, 2012.
[35] C. Coddou, R. A. Lorca, C. Acuna-Castillo, M. Grauso, F. Ras-sendren, and J. P. Huidobro-Toro, “Heavy metals modulate theactivity of the purinergic P2X4 receptor,” Toxicology and Ap-plied Pharmacology, vol. 202, no. 2, pp. 121–131, 2005.
[36] V. C. Borges, F. W. Santos, J. B. T. Rocha, and C. W. Nogueira,“Heavy metals modulate glutamatergic system in humanplatelets,” Neurochemical Research, vol. 32, no. 6, pp. 953–958,2007.
[37] H. M. Korashy and A. O. S. El-Kadi, “Modulation of TCDD-mediated induction of cytochrome P450 1A1 by mercury, lead,and copper in human HepG2 cell line,” Toxicology in Vitro, vol.22, no. 1, pp. 154–158, 2008.
[38] N. Ercal, H. Gurer-Orhan, and N. Aykin-Burns, “Toxic metalsand oxidative stress part I: mechanisms involved in metal-induced oxidative damage,” Current Topics in Medicinal Chem-istry, vol. 1, no. 6, pp. 529–539, 2001.
[39] D. Grotto, J. Valentini, M. Fillion et al., “Mercury exposureand oxidative stress in communities of the Brazilian Amazon,”Science of the Total Environment, vol. 408, no. 4, pp. 806–811,2010.
[40] S. A. Sheweita, A. M. Tilmisany, and H. Al-Sawaf, “Mecha-nisms of male infertility: role of antioxidants,” Current DrugMetabolism, vol. 6, no. 5, pp. 495–501, 2005.
[41] A. Tito, A. Carola, and M. Bimonte, “A tomato stem cellextract, containing antioxidant compounds and metal chelat-ing factors, protects skin cells from heavy metal-induced dam-ages,” International Journal Cosmetic Science, vol. 33, no. 6, pp.543–552, 2011.