Review Article Color Doppler Imaging Analysis of...
25
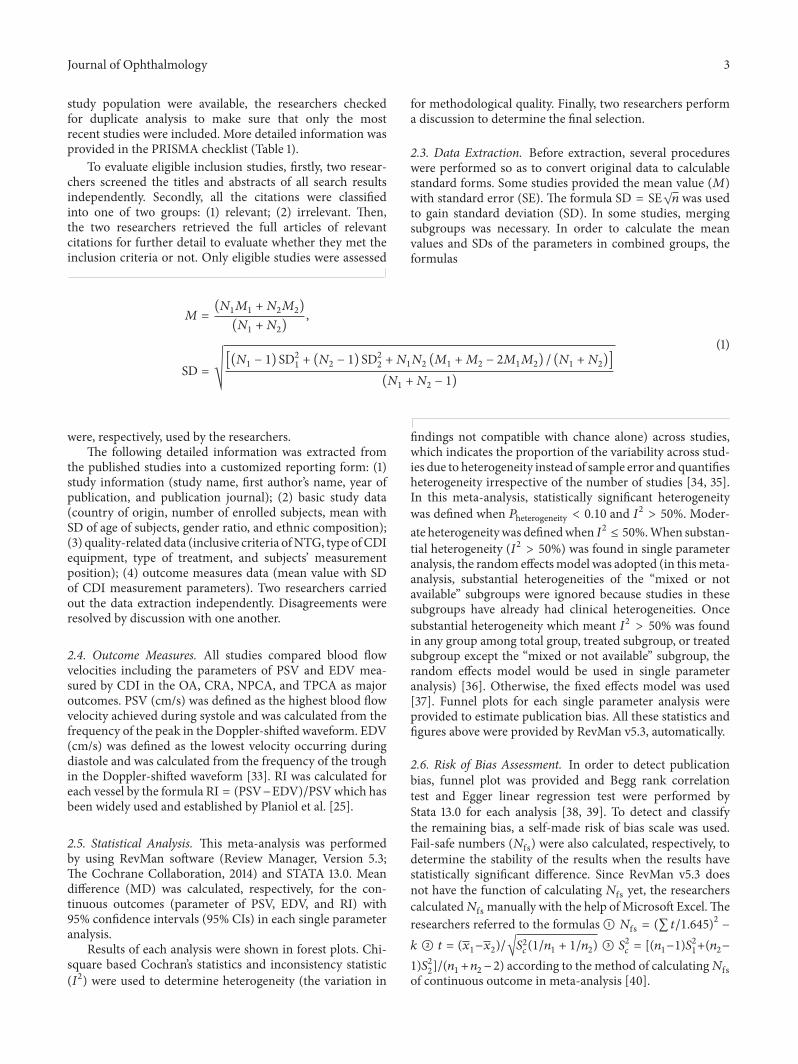
Review Article Color Doppler Imaging Analysis of Ocular Blood Flow Velocities in Normal Tension Glaucoma Patients: A Meta-Analysis Shuo Xu, 1 Shouyue Huang, 1 Zhongjing Lin, 1 Wangmin Liu, 2 and Yisheng Zhong 1 1 Department of Ophthalmology, Ruijin Hospital Affiliated Medical School, Shanghai Jiaotong University, Shanghai 200025, China 2 Hubei Provincial Center for Disease Control and Prevention, Wuhan, Hubei 430079, China Correspondence should be addressed to Wangmin Liu; [email protected] and Yisheng Zhong; [email protected] Received 17 May 2015; Accepted 26 July 2015 Academic Editor: Naoshi Kondo Copyright © 2015 Shuo Xu et al. is is an open access article distributed under the Creative Commons Attribution License, which permits unrestricted use, distribution, and reproduction in any medium, provided the original work is properly cited. Background. To evaluate the potential diagnostic value of CDI of retrobulbar hemodynamic changes in NTG patients. Methods. Relevant publications which included PSV, EDV, and RI of OA, CRA, NPCA, and TPCA in NTG patients and normal controls measured by CDI were retrieved from the Cochrane Central Register of Controlled Trials, PubMed, the ISI Web of Knowledge, and EMBASE from 1990 to 2014. Subgroup analyses were made based on IOP-lowering medications uses. Result. In OA, there was significant decrease of PSV with moderate heterogeneity ( < 0.00001, 2 = 49%) and significant decrease of EDV with significant heterogeneity ( = 0.0005, 2 = 87%) in NTG patients. In CRA, similar results of PSV ( < 0.00001, 2 = 42%) and EDV ( < 0.00001, 2 = 80%) were detected. Significant decrease of PSV and EDV with significant heterogeneity was also found in both NPCA ( < 0.0001, 2 = 70%; < 0.0001, 2 = 76%; resp.) and TPCA ( < 0.00001, 2 = 54%; < 0.00001, 2 = 65%; resp.). Statistically significant increases of RI were found in CRA ( = 0.0002, 2 = 89%) and TPCA ( = 0.02, 2 = 81%) with significant heterogeneities, though RI in OA ( = 0.25, 2 = 94%) and in NPCA ( = 0.15, 2 = 86%) showed no statistical changes with significant heterogeneities. Conclusions. Ischemic change of retrobulbar hemodynamics is one of the important manifestations of NTG. Hemodynamic parameters measured by CDI might be potential diagnostic tools for NTG. 1. Introduction Normal tension glaucoma (NTG) is a progressive optic neu- ropathy that mimics primary open angle glaucoma (POAG) but lacks the findings of elevated intraocular pressure (IOP) or other mitigating factors that can lead to optic neuropa- thy [1]. e main clinical characteristics include consistent normal IOP without treatment, open angle on gonioscope, characteristic glaucomatous optic disc change on ophthal- mofundoscope examination, and similar visual field defect with glaucomatous optic nerve abnormality which indicates the damage degree of the optic nerve [2–4]. It is generally accepted that NTG is classified as a subtype of POAG [2]. Originally, NTG was a clinical description from some clinical characteristic of glaucoma. Some of the studies involved in the cornea have indicated that the central corneal thickness (CCT) of NTG patients is thinner than that of normal healthy population and POAG patients, which leads to reduction of IOP reading in NTG patients. erefore, aſter adjusting the IOP reading according to the relevant CCT values, IOP may present relatively high in NTG patients. is indicates that the conditions in NTG are similar to those in POAG in spite of difference in CCT [5, 6]. Nevertheless, some evi- dences have been found recently which suggest the difference between NTG and POAG [3, 7, 8]. For instance, in NTG patients, the shape of defect of VF is different, the decrease of retinal nerve fiber layer is earlier, and the incidence of optic disk hemorrhage is higher significantly than those in POAG patients [9]. All in all, current researches have detected both similarity and difference between NTG and POAG [3, 7, 8]. e similarity and difference between NTG and POAG still coexist concerning pathophysiological mechanisms [1]. If increase of IOP has limited contribution to glaucoma- tous change, according to the vascular theory of glaucoma, other potential causative factors which are related to vascular abnormality may have influence [10, 11]. us, the relation- ship between retrobulbar hemodynamics and NTG becomes an important subject in the field of glaucomatous researches. Hindawi Publishing Corporation Journal of Ophthalmology Volume 2015, Article ID 919610, 24 pages http://dx.doi.org/10.1155/2015/919610
Transcript of Review Article Color Doppler Imaging Analysis of...
Review ArticleColor Doppler Imaging Analysis of Ocular Blood Flow Velocitiesin Normal Tension Glaucoma Patients: A Meta-Analysis
Shuo Xu,1 Shouyue Huang,1 Zhongjing Lin,1 Wangmin Liu,2 and Yisheng Zhong1
1Department of Ophthalmology, Ruijin Hospital Affiliated Medical School, Shanghai Jiaotong University, Shanghai 200025, China2Hubei Provincial Center for Disease Control and Prevention, Wuhan, Hubei 430079, China
Correspondence should be addressed to Wangmin Liu; [email protected] and Yisheng Zhong; [email protected]
Received 17 May 2015; Accepted 26 July 2015
Academic Editor: Naoshi Kondo
Copyright © 2015 Shuo Xu et al.This is an open access article distributed under the Creative Commons Attribution License, whichpermits unrestricted use, distribution, and reproduction in any medium, provided the original work is properly cited.
Background. To evaluate the potential diagnostic value of CDI of retrobulbar hemodynamic changes in NTG patients. Methods.Relevant publications which included PSV, EDV, and RI of OA, CRA, NPCA, and TPCA in NTG patients and normal controlsmeasured by CDI were retrieved from the Cochrane Central Register of Controlled Trials, PubMed, the ISI Web of Knowledge,and EMBASE from 1990 to 2014. Subgroup analyses were made based on IOP-lowering medications uses. Result. In OA, there wassignificant decrease of PSV with moderate heterogeneity (𝑃 < 0.00001, 𝐼2 = 49%) and significant decrease of EDV with significantheterogeneity (𝑃 = 0.0005, 𝐼2 = 87%) in NTG patients. In CRA, similar results of PSV (𝑃 < 0.00001, 𝐼2 = 42%) and EDV(𝑃 < 0.00001, 𝐼2 = 80%) were detected. Significant decrease of PSV and EDVwith significant heterogeneity was also found in bothNPCA (𝑃 < 0.0001, 𝐼2 = 70%; 𝑃 < 0.0001, 𝐼2 = 76%; resp.) and TPCA (𝑃 < 0.00001, 𝐼2 = 54%; 𝑃 < 0.00001, 𝐼2 = 65%; resp.).Statistically significant increases of RI were found in CRA (𝑃 = 0.0002, 𝐼2 = 89%) and TPCA (𝑃 = 0.02, 𝐼2 = 81%) with significantheterogeneities, though RI in OA (𝑃 = 0.25, 𝐼2 = 94%) and in NPCA (𝑃 = 0.15, 𝐼2 = 86%) showed no statistical changes withsignificant heterogeneities. Conclusions. Ischemic change of retrobulbar hemodynamics is one of the important manifestations ofNTG. Hemodynamic parameters measured by CDI might be potential diagnostic tools for NTG.
1. Introduction
Normal tension glaucoma (NTG) is a progressive optic neu-ropathy that mimics primary open angle glaucoma (POAG)but lacks the findings of elevated intraocular pressure (IOP)or other mitigating factors that can lead to optic neuropa-thy [1]. The main clinical characteristics include consistentnormal IOP without treatment, open angle on gonioscope,characteristic glaucomatous optic disc change on ophthal-mofundoscope examination, and similar visual field defectwith glaucomatous optic nerve abnormality which indicatesthe damage degree of the optic nerve [2–4]. It is generallyaccepted that NTG is classified as a subtype of POAG [2].Originally, NTGwas a clinical description from some clinicalcharacteristic of glaucoma. Some of the studies involved inthe cornea have indicated that the central corneal thickness(CCT) of NTG patients is thinner than that of normal healthypopulation and POAG patients, which leads to reductionof IOP reading in NTG patients. Therefore, after adjusting
the IOP reading according to the relevant CCT values, IOPmay present relatively high in NTG patients. This indicatesthat the conditions in NTG are similar to those in POAGin spite of difference in CCT [5, 6]. Nevertheless, some evi-dences have been found recently which suggest the differencebetween NTG and POAG [3, 7, 8]. For instance, in NTGpatients, the shape of defect of VF is different, the decrease ofretinal nerve fiber layer is earlier, and the incidence of opticdisk hemorrhage is higher significantly than those in POAGpatients [9]. All in all, current researches have detected bothsimilarity and difference between NTG and POAG [3, 7, 8].The similarity and difference between NTG and POAG stillcoexist concerning pathophysiological mechanisms [1].
If increase of IOP has limited contribution to glaucoma-tous change, according to the vascular theory of glaucoma,other potential causative factors which are related to vascularabnormality may have influence [10, 11]. Thus, the relation-ship between retrobulbar hemodynamics and NTG becomesan important subject in the field of glaucomatous researches.
Hindawi Publishing CorporationJournal of OphthalmologyVolume 2015, Article ID 919610, 24 pageshttp://dx.doi.org/10.1155/2015/919610
2 Journal of Ophthalmology
It has been hypothesized that vascular spasticity and dys-regulation of retrobulbar hemodynamics are connected withNTG, in other words, some cases with normal IOP in POAG[12].
Several techniques such as scanning laser ophthal-moscopy (SLO) [13], Fundus Fluorescein Angiography (FFA)[14], Laser Doppler Flowmetry (LDF) [15–17], Laser DopplerVelocimetry (LDV) [18], Laser Speckle Flowgraphy (LSFG)[19, 20], Pulsatile Ocular Blood Flow (POBF) [21, 22], andColor Doppler Imaging (CDI) [23, 24] have been usedto measure retrobulbar hemodynamics in patients withglaucoma. CDI is a technique which evaluates erythrocytevelocity in the large ophthalmic vessels, such as ophthalmicartery (OA), central retinal artery (CRA), and nasal andtemporal short posterior ciliary arteries (NPCA and TPCA)[12]. This ultrasonic technique combines synchronous B-ultrasonic wave imaging with color which represents themovement of blood flow based on Doppler frequency shifts.Compared with these techniques above, CDI has its par-ticular advantages. First of all, it is noninvasive. Secondly,it does not require contrast medium. Once more, it is notinfluenced by poor ocular media. Eventually, this techniquehas no radiation [23, 24]. CDI is so safe and convenient thatit has been used in ophthalmology for more than 20 years.
CDI can provide various velocity parameters of the ocularblood flow (OBF), such as the peak systolic velocity (PSV),the end diastolic velocity (EDV), the mean flow velocity(MFV), systolic mean velocity (Sm), and diastolic meanvelocity (Dm). Among them, PSV and EDV are the mostextensively used indexes. The resistive index (RI) is alsoa useful parameter for each retrobulbar vessel, which iscalculated as RI = (PSV − EDV)/PSV [12, 25]. A higher valueof RI represents greater peripheral vascular resistance, whichgenerally implies deleterious significance [26]. Some studieshave made inference that the erythrocyte velocity of OBFmeasured byCDImay prognosticate the risk of glaucomatousprogression, but among various studies the conclusions havenot been acquired in the same vessels or with the samemeasures [15].
Although OBF measurements including CDI have notbeen currently used on clinic for diagnosis or managementin patients with glaucoma yet, several studies have reportedsignificant reduction of PSV or EDV or significant increase ofRI in certain vessels of OA, CRA, NPCA, and TPCA in NTGpatients by means of CDI measurement [27–30]. Stalmanset al. have made a review and summarized the OBF velocityparameters in different studies by using CDI in healthypopulations, OHT patients, and different types of glaucomapatients [31]. However, the studies were conducted in variousconditions. Therefore, the results had a lack of comparabilityamong each other and could only be for reference. To theresearchers’ knowledge, there has been no systematic reviewpublished about the evidence of the potential diagnostic valueof CDI for NTG. A clear conclusion should be establishedin this aspect. Therefore, this time we conduct a meta-analysis of the literature for the following purposes: (1) toevaluate the potential diagnostic value of CDI of retrobulbarhemodynamics changes in OA, CRA, NPCA, and TPCA inNTG; (2) to quantify the value of OBF parameter of PSV,
EDV, and RI by means of CDI in NTG patients and normalpopulation.
2. Materials and Methods
This meta-analysis was conducted according to a predeter-mined protocol, and the methods used conformed to theMeta-Analysis of Observational Studies in Epidemiology.The related aspects were in agreement with the PRISMAstatement [32]. No ethical approval and patient consent wererequired because all the analyses were based on previouspublished studies.
2.1. Search Strategy. Two researchers seek the research articlesfrom 1990 to 2014 in four electronic databases: the CochraneCentral Register of Controlled Trials, PubMed, the ISIWeb ofKnowledge, and EMBASE, independently. The search termswere in various combinations from the key words as “colorDoppler imaging” or “colour Doppler imaging” or “Dopplerultrasound” or “CDI”, “ocular blood flow” or “retrobulbarblood flow” or “retrobulbar hemodynamics”, and “normaltension glaucoma” or “NTG” or “low tension glaucoma”or “LTG” or “normal pressure glaucoma” or “NPG”. Theresearch articles were limited in the language of English.The researchers also searched the reference lists of includedarticles for any additional study.
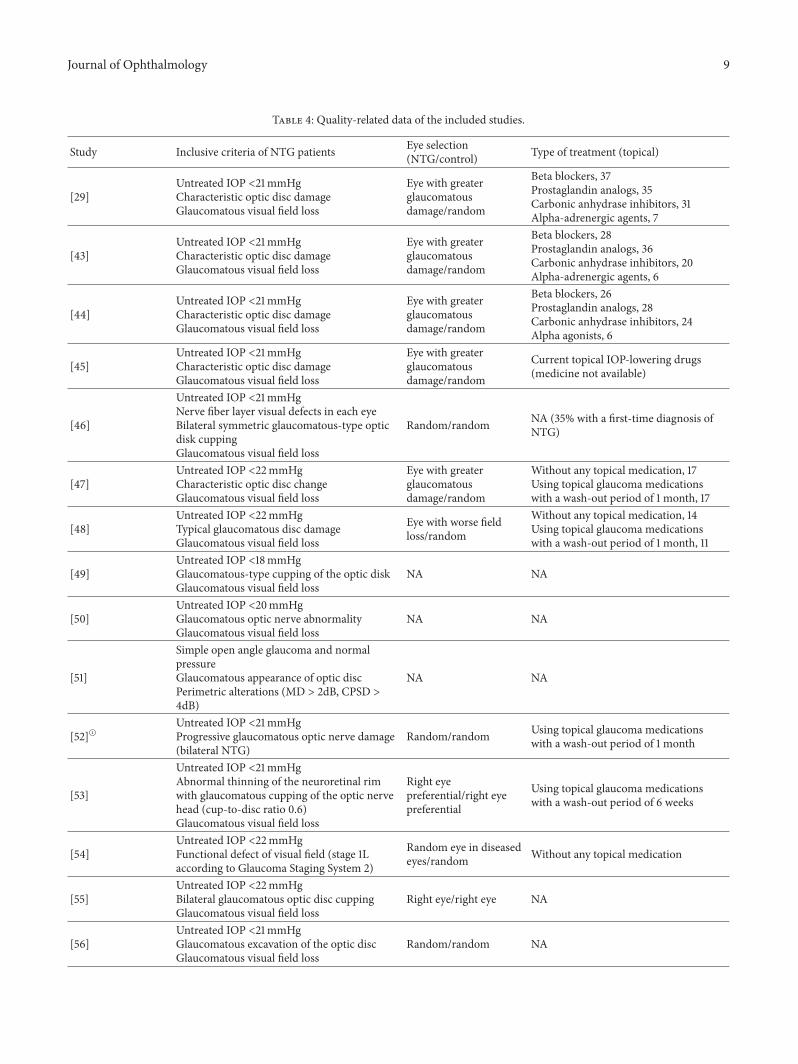
2.2. Inclusion Criteria. Inclusive criteria of NTGwere similarbut slightly different in the included studies. The inclusivecriteria were shown, respectively, for each study in Table 4.
In most of the included studies, the following inclusivecriteria of normal control subjects were used. Most of normalcontrol subjects were recruited from the persons accompa-nying the NTG patients; the rest were from the hospitalstaffs. In most studies, it was clearly declared that the normalcontrol groups were usually age-matched to NTG groups,respectively, in each inclusive study, and those who had afamily history of glaucoma, an increased or asymmetricalcup/disc ratio, or any other optic disc structural change wereconsidered as glaucoma suspects and were excluded fromnormal control subjects. The normal control subjects musthave normal IOP (in most of the included studies, IOP wasbelow 21mmHg) without current medical treatment, includ-ing systemic or topical IOP-lowering medications. They hadnormal, symmetrical optic disc appearance and had no visualfield defect. Subjects with a history of neurological or otherophthalmological diseases, ocular traumas, or surgeries werealso excluded.
This meta-analysis excluded the studies with the treat-ment of systemic vasodilator medication.
Published studies were included if they met the followinginclusion criteria: (1) studies that were randomized clinicalcontrolled trials or observational studies; (2) studies thatcompared blood flow velocities with CDI including theparameters of PSV, EDV, or RI in the OA, CRA, NPCA,or TPCA in NTG and normal eyes; (3) studies which wererelated to the use of CDI measurements performed in supineor sitting position. When multiple studies from the same
Journal of Ophthalmology 3
study population were available, the researchers checkedfor duplicate analysis to make sure that only the mostrecent studies were included. More detailed information wasprovided in the PRISMA checklist (Table 1).
To evaluate eligible inclusion studies, firstly, two resear-chers screened the titles and abstracts of all search resultsindependently. Secondly, all the citations were classifiedinto one of two groups: (1) relevant; (2) irrelevant. Then,the two researchers retrieved the full articles of relevantcitations for further detail to evaluate whether they met theinclusion criteria or not. Only eligible studies were assessed
for methodological quality. Finally, two researchers performa discussion to determine the final selection.
2.3. Data Extraction. Before extraction, several procedureswere performed so as to convert original data to calculablestandard forms. Some studies provided the mean value (𝑀)with standard error (SE). The formula SD = SE√𝑛 was usedto gain standard deviation (SD). In some studies, mergingsubgroups was necessary. In order to calculate the meanvalues and SDs of the parameters in combined groups, theformulas
𝑀 =(𝑁1𝑀1+ 𝑁2𝑀2)
(𝑁1+ 𝑁2),
SD = √[(𝑁1− 1) SD2
1+ (𝑁2− 1) SD2
2+ 𝑁1𝑁2(𝑀1+𝑀2− 2𝑀1𝑀2) / (𝑁
1+ 𝑁2)]
(𝑁1+ 𝑁2− 1)
(1)
were, respectively, used by the researchers.The following detailed information was extracted from
the published studies into a customized reporting form: (1)study information (study name, first author’s name, year ofpublication, and publication journal); (2) basic study data(country of origin, number of enrolled subjects, mean withSD of age of subjects, gender ratio, and ethnic composition);(3) quality-related data (inclusive criteria ofNTG, type ofCDIequipment, type of treatment, and subjects’ measurementposition); (4) outcome measures data (mean value with SDof CDI measurement parameters). Two researchers carriedout the data extraction independently. Disagreements wereresolved by discussion with one another.
2.4. Outcome Measures. All studies compared blood flowvelocities including the parameters of PSV and EDV mea-sured by CDI in the OA, CRA, NPCA, and TPCA as majoroutcomes. PSV (cm/s) was defined as the highest blood flowvelocity achieved during systole and was calculated from thefrequency of the peak in the Doppler-shifted waveform. EDV(cm/s) was defined as the lowest velocity occurring duringdiastole and was calculated from the frequency of the troughin the Doppler-shifted waveform [33]. RI was calculated foreach vessel by the formula RI = (PSV−EDV)/PSVwhich hasbeen widely used and established by Planiol et al. [25].
2.5. Statistical Analysis. This meta-analysis was performedby using RevMan software (Review Manager, Version 5.3;The Cochrane Collaboration, 2014) and STATA 13.0. Meandifference (MD) was calculated, respectively, for the con-tinuous outcomes (parameter of PSV, EDV, and RI) with95% confidence intervals (95% CIs) in each single parameteranalysis.
Results of each analysis were shown in forest plots. Chi-square based Cochran’s statistics and inconsistency statistic(𝐼2) were used to determine heterogeneity (the variation in
findings not compatible with chance alone) across studies,which indicates the proportion of the variability across stud-ies due to heterogeneity instead of sample error and quantifiesheterogeneity irrespective of the number of studies [34, 35].In this meta-analysis, statistically significant heterogeneitywas defined when 𝑃heterogeneity < 0.10 and 𝐼
2> 50%. Moder-
ate heterogeneitywas definedwhen 𝐼2 ≤ 50%.When substan-tial heterogeneity (𝐼2 > 50%) was found in single parameteranalysis, the random effectsmodel was adopted (in thismeta-analysis, substantial heterogeneities of the “mixed or notavailable” subgroups were ignored because studies in thesesubgroups have already had clinical heterogeneities. Oncesubstantial heterogeneity which meant 𝐼2 > 50% was foundin any group among total group, treated subgroup, or treatedsubgroup except the “mixed or not available” subgroup, therandom effects model would be used in single parameteranalysis) [36]. Otherwise, the fixed effects model was used[37]. Funnel plots for each single parameter analysis wereprovided to estimate publication bias. All these statistics andfigures above were provided by RevMan v5.3, automatically.
2.6. Risk of Bias Assessment. In order to detect publicationbias, funnel plot was provided and Begg rank correlationtest and Egger linear regression test were performed byStata 13.0 for each analysis [38, 39]. To detect and classifythe remaining bias, a self-made risk of bias scale was used.Fail-safe numbers (𝑁fs) were also calculated, respectively, todetermine the stability of the results when the results havestatistically significant difference. Since RevMan v5.3 doesnot have the function of calculating 𝑁fs yet, the researcherscalculated𝑁fs manually with the help ofMicrosoft Excel.Theresearchers referred to the formulasA 𝑁fs = (∑ 𝑡/1.645)
2−
𝑘 B 𝑡 = (𝑥1−𝑥2)/√𝑆2𝑐(1/𝑛1+ 1/𝑛2) C 𝑆2
𝑐= [(𝑛1−1)𝑆2
1+(𝑛2−
1)𝑆2
2]/(𝑛1+𝑛2−2) according to the method of calculating𝑁fs
of continuous outcome in meta-analysis [40].
4 Journal of Ophthalmology
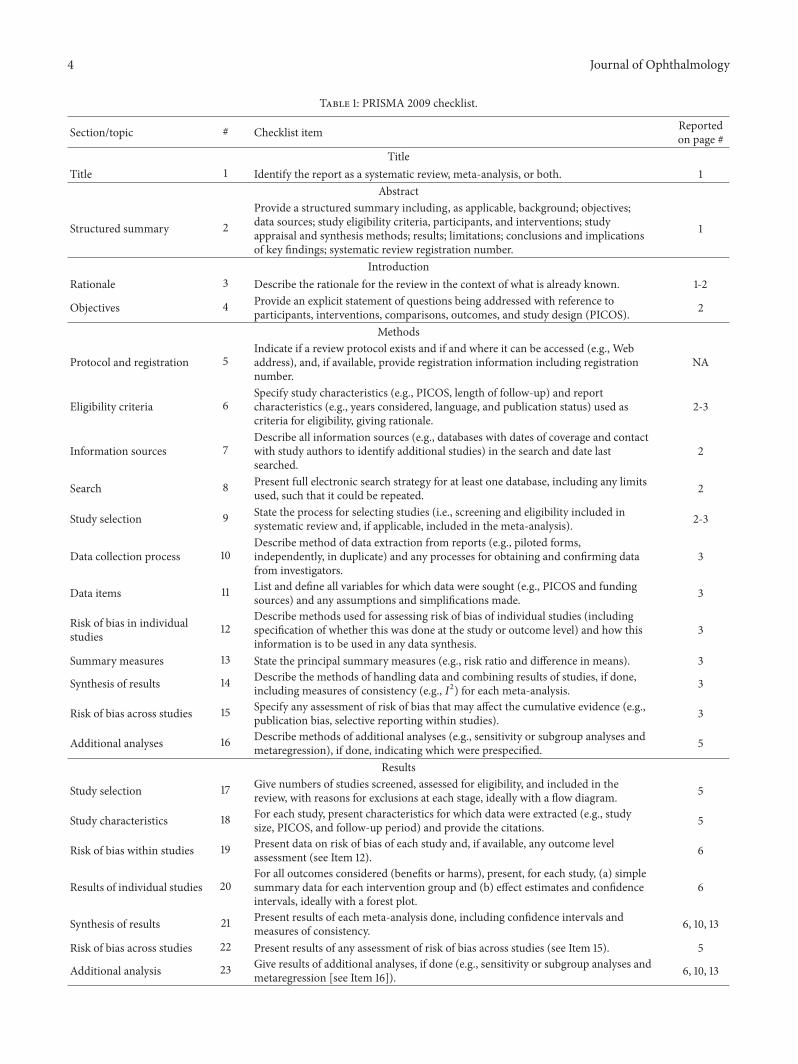
Table 1: PRISMA 2009 checklist.
Section/topic # Checklist item Reportedon page #
TitleTitle 1 Identify the report as a systematic review, meta-analysis, or both. 1
Abstract
Structured summary 2Provide a structured summary including, as applicable, background; objectives;data sources; study eligibility criteria, participants, and interventions; studyappraisal and synthesis methods; results; limitations; conclusions and implicationsof key findings; systematic review registration number.
1
IntroductionRationale 3 Describe the rationale for the review in the context of what is already known. 1-2
Objectives 4 Provide an explicit statement of questions being addressed with reference toparticipants, interventions, comparisons, outcomes, and study design (PICOS). 2
Methods
Protocol and registration 5Indicate if a review protocol exists and if and where it can be accessed (e.g., Webaddress), and, if available, provide registration information including registrationnumber.
NA
Eligibility criteria 6Specify study characteristics (e.g., PICOS, length of follow-up) and reportcharacteristics (e.g., years considered, language, and publication status) used ascriteria for eligibility, giving rationale.
2-3
Information sources 7Describe all information sources (e.g., databases with dates of coverage and contactwith study authors to identify additional studies) in the search and date lastsearched.
2
Search 8 Present full electronic search strategy for at least one database, including any limitsused, such that it could be repeated. 2
Study selection 9 State the process for selecting studies (i.e., screening and eligibility included insystematic review and, if applicable, included in the meta-analysis). 2-3
Data collection process 10Describe method of data extraction from reports (e.g., piloted forms,independently, in duplicate) and any processes for obtaining and confirming datafrom investigators.
3
Data items 11 List and define all variables for which data were sought (e.g., PICOS and fundingsources) and any assumptions and simplifications made. 3
Risk of bias in individualstudies 12
Describe methods used for assessing risk of bias of individual studies (includingspecification of whether this was done at the study or outcome level) and how thisinformation is to be used in any data synthesis.
3
Summary measures 13 State the principal summary measures (e.g., risk ratio and difference in means). 3
Synthesis of results 14 Describe the methods of handling data and combining results of studies, if done,including measures of consistency (e.g., 𝐼2) for each meta-analysis. 3
Risk of bias across studies 15 Specify any assessment of risk of bias that may affect the cumulative evidence (e.g.,publication bias, selective reporting within studies). 3
Additional analyses 16 Describe methods of additional analyses (e.g., sensitivity or subgroup analyses andmetaregression), if done, indicating which were prespecified. 5
Results
Study selection 17 Give numbers of studies screened, assessed for eligibility, and included in thereview, with reasons for exclusions at each stage, ideally with a flow diagram. 5
Study characteristics 18 For each study, present characteristics for which data were extracted (e.g., studysize, PICOS, and follow-up period) and provide the citations. 5
Risk of bias within studies 19 Present data on risk of bias of each study and, if available, any outcome levelassessment (see Item 12). 6
Results of individual studies 20For all outcomes considered (benefits or harms), present, for each study, (a) simplesummary data for each intervention group and (b) effect estimates and confidenceintervals, ideally with a forest plot.
6
Synthesis of results 21 Present results of each meta-analysis done, including confidence intervals andmeasures of consistency. 6, 10, 13
Risk of bias across studies 22 Present results of any assessment of risk of bias across studies (see Item 15). 5
Additional analysis 23 Give results of additional analyses, if done (e.g., sensitivity or subgroup analyses andmetaregression [see Item 16]). 6, 10, 13
Journal of Ophthalmology 5
Table 1: Continued.
Section/topic # Checklist item Reportedon page #
Discussion
Summary of evidence 24Summarize the main findings including the strength of evidence for each mainoutcome; consider their relevance to key groups (e.g., healthcare providers, users,and policy makers).
13-14, 16, 18
Limitations 25 Discuss limitations at study and outcome level (e.g., risk of bias) and at review level(e.g., incomplete retrieval of identified research and reporting bias).
18, 20
Conclusions 26 Provide a general interpretation of the results in the context of other evidence andimplications for future research. 21
Funding
Funding 27 Describe sources of funding for the systematic review and other support (e.g.,supply of data); role of funders for the systematic review. 21
From [32].For more information, visit http://www.prisma-statement.org/.
Since previous studies showed that topical antiglaucomamedications may have effect on retrobulbar hemodynamicsby means of increasing ocular blood flow velocity anddecreasing RI [33, 41, 42], this may contribute to the het-erogeneity across studies. Subgroup analyses were performedaccording to whether NTG patients used IOP-lowering med-ications and were divided as treated subgroup, untreatedsubgroup, and the rest (treated and untreated patients mixedor information not available in the studies). The treatedsubgroup included NTG patients with current IOP-loweringmedications treatment. The untreated subgroup includedNTG patients having previous IOP-lowering medicationstreatment with a wash-out period of at least 3 weeks, NTGpatients who never receive IOP-lowering medications treat-ment, or patients with a first-time diagnosis of NTG.
3. Results
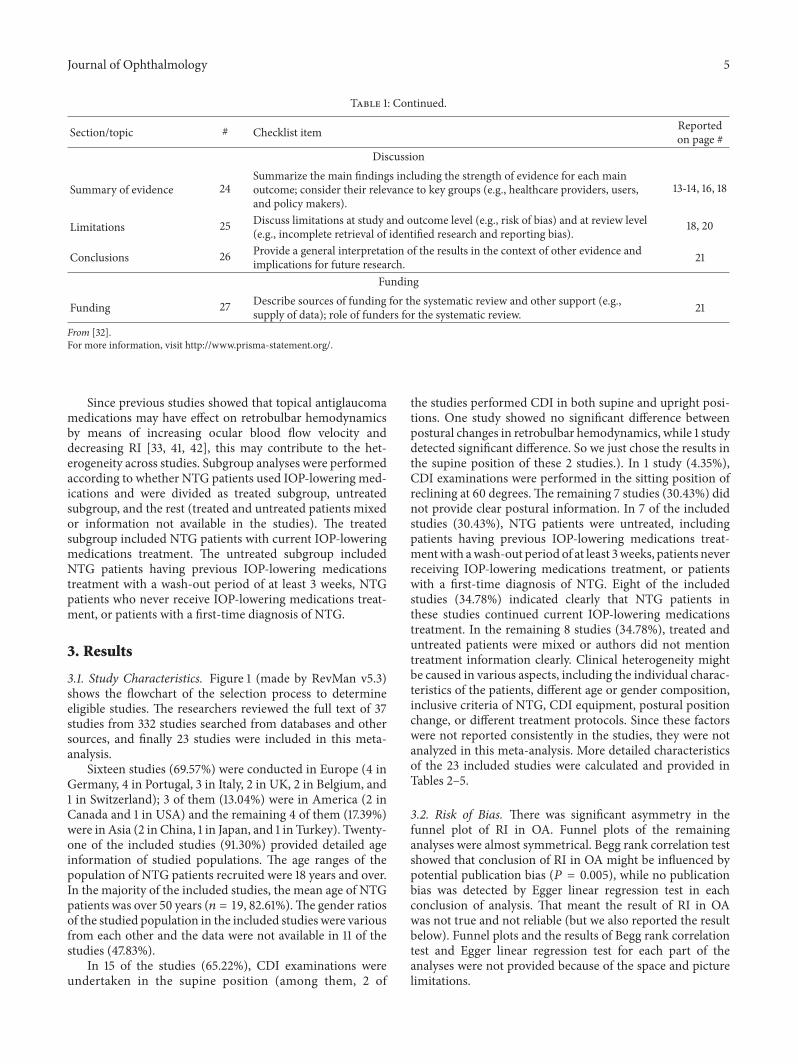
3.1. Study Characteristics. Figure 1 (made by RevMan v5.3)shows the flowchart of the selection process to determineeligible studies. The researchers reviewed the full text of 37studies from 332 studies searched from databases and othersources, and finally 23 studies were included in this meta-analysis.
Sixteen studies (69.57%) were conducted in Europe (4 inGermany, 4 in Portugal, 3 in Italy, 2 in UK, 2 in Belgium, and1 in Switzerland); 3 of them (13.04%) were in America (2 inCanada and 1 in USA) and the remaining 4 of them (17.39%)were in Asia (2 in China, 1 in Japan, and 1 in Turkey). Twenty-one of the included studies (91.30%) provided detailed ageinformation of studied populations. The age ranges of thepopulation of NTG patients recruited were 18 years and over.In the majority of the included studies, the mean age of NTGpatients was over 50 years (𝑛 = 19, 82.61%).The gender ratiosof the studied population in the included studies were variousfrom each other and the data were not available in 11 of thestudies (47.83%).
In 15 of the studies (65.22%), CDI examinations wereundertaken in the supine position (among them, 2 of
the studies performed CDI in both supine and upright posi-tions. One study showed no significant difference betweenpostural changes in retrobulbar hemodynamics, while 1 studydetected significant difference. So we just chose the results inthe supine position of these 2 studies.). In 1 study (4.35%),CDI examinations were performed in the sitting position ofreclining at 60 degrees.The remaining 7 studies (30.43%) didnot provide clear postural information. In 7 of the includedstudies (30.43%), NTG patients were untreated, includingpatients having previous IOP-lowering medications treat-mentwith awash-out period of at least 3weeks, patients neverreceiving IOP-lowering medications treatment, or patientswith a first-time diagnosis of NTG. Eight of the includedstudies (34.78%) indicated clearly that NTG patients inthese studies continued current IOP-lowering medicationstreatment. In the remaining 8 studies (34.78%), treated anduntreated patients were mixed or authors did not mentiontreatment information clearly. Clinical heterogeneity mightbe caused in various aspects, including the individual charac-teristics of the patients, different age or gender composition,inclusive criteria of NTG, CDI equipment, postural positionchange, or different treatment protocols. Since these factorswere not reported consistently in the studies, they were notanalyzed in this meta-analysis. More detailed characteristicsof the 23 included studies were calculated and provided inTables 2–5.
3.2. Risk of Bias. There was significant asymmetry in thefunnel plot of RI in OA. Funnel plots of the remaininganalyses were almost symmetrical. Begg rank correlation testshowed that conclusion of RI in OA might be influenced bypotential publication bias (𝑃 = 0.005), while no publicationbias was detected by Egger linear regression test in eachconclusion of analysis. That meant the result of RI in OAwas not true and not reliable (but we also reported the resultbelow). Funnel plots and the results of Begg rank correlationtest and Egger linear regression test for each part of theanalyses were not provided because of the space and picturelimitations.
6 Journal of Ophthalmology
332 of records identified throughdatabase searching
5 of additional records identifiedthrough other sources
142 of records excluded
14 of full-text articles excluded, with thefollowing reasons:
5 of them had insufficient data for analysis
3 of them did not divide subjects into NTG andcontrol groups as inclusion criteria
4 of them were not published in language of
2 of them did not have healthy control subjects
185 of records after duplicates removed
43 of records screened
37 of full-text articles assessed for eligibility
23 of studies included in meta-analysis
English
Figure 1: Flow diagram of the study selection process.
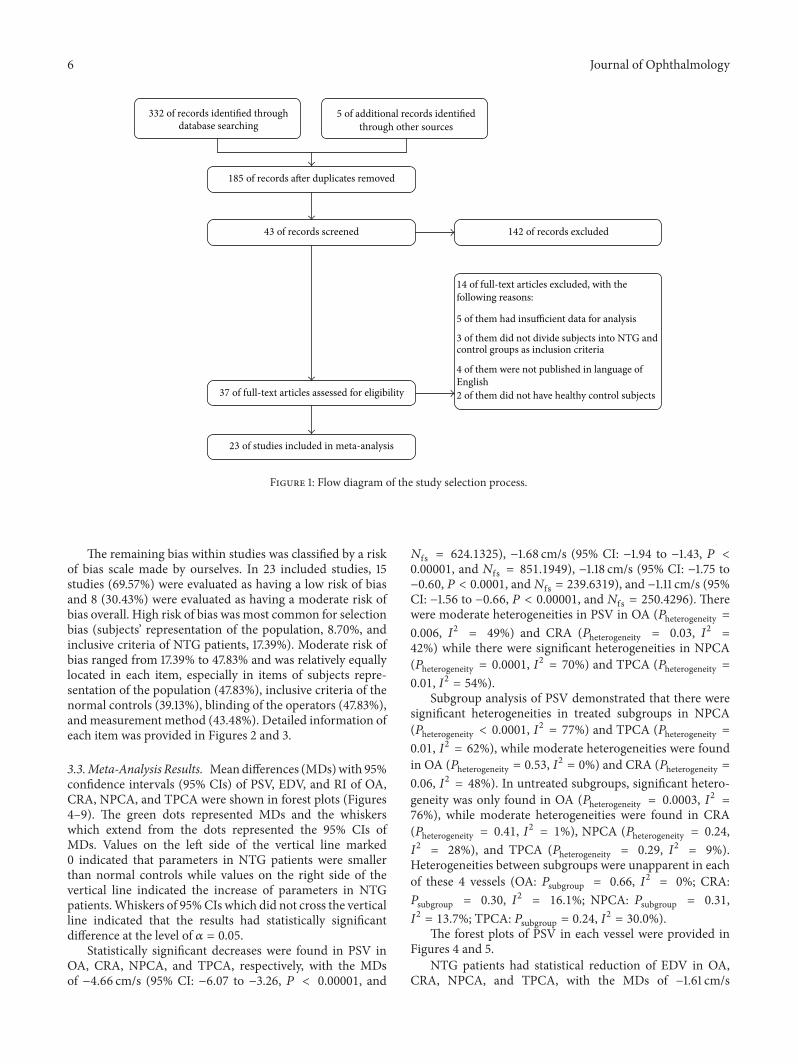
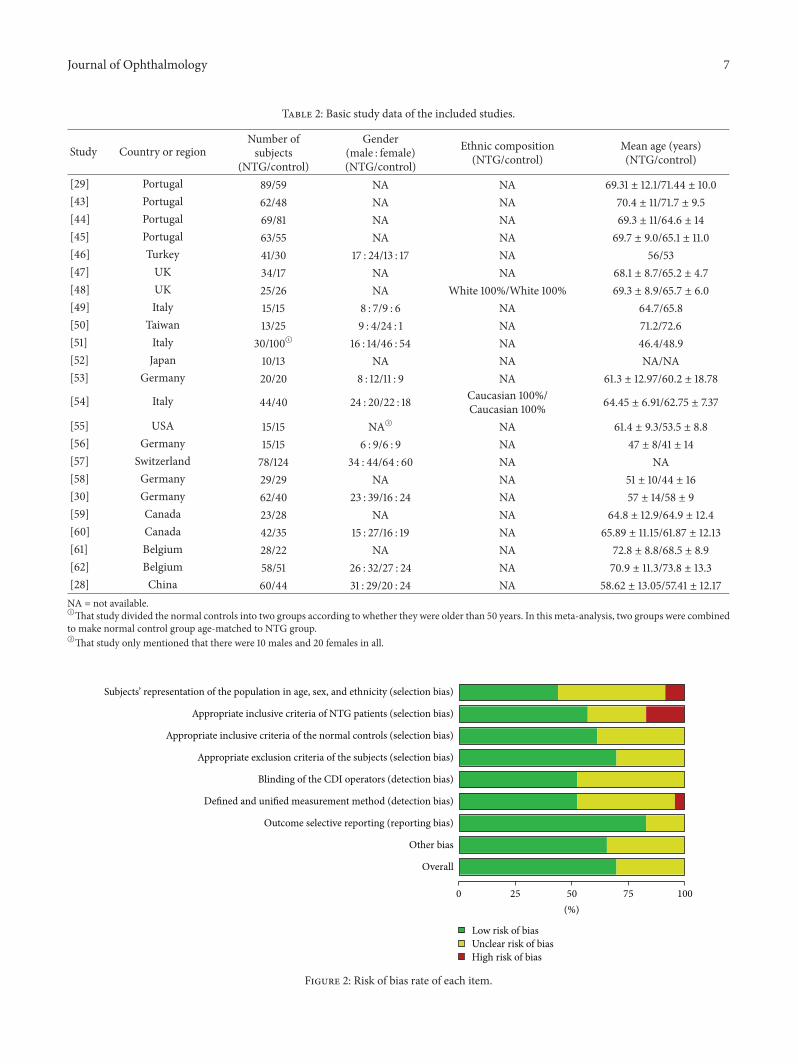
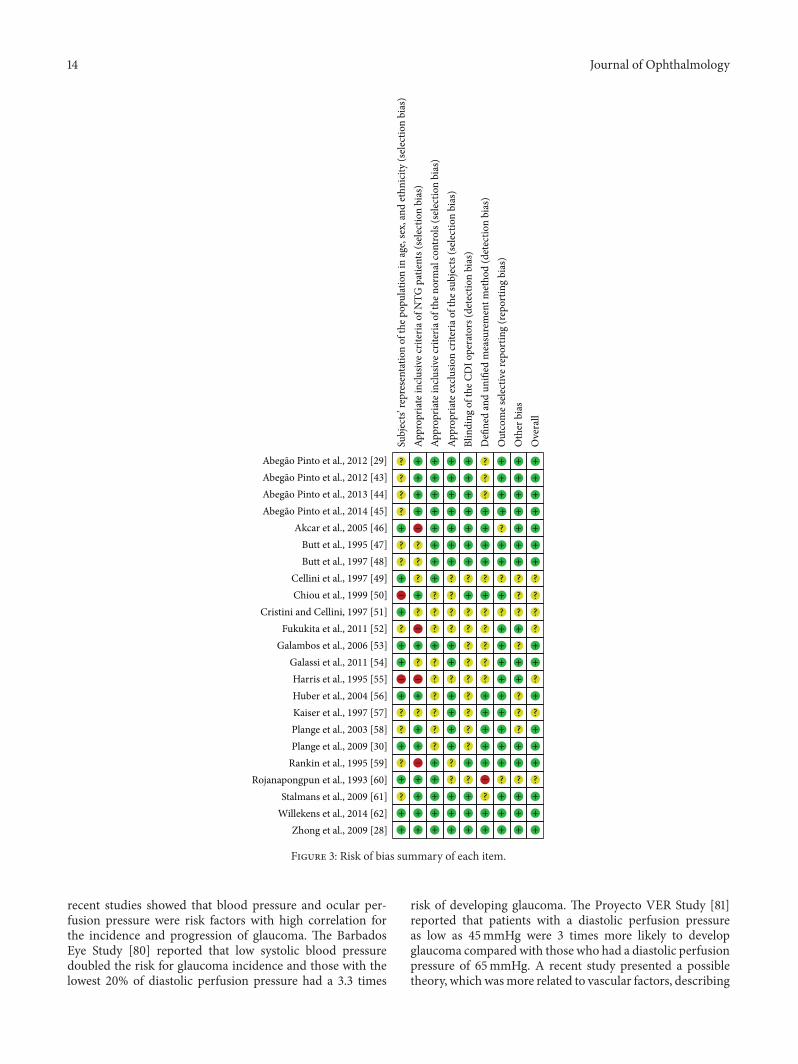
The remaining bias within studies was classified by a riskof bias scale made by ourselves. In 23 included studies, 15studies (69.57%) were evaluated as having a low risk of biasand 8 (30.43%) were evaluated as having a moderate risk ofbias overall. High risk of bias was most common for selectionbias (subjects’ representation of the population, 8.70%, andinclusive criteria of NTG patients, 17.39%). Moderate risk ofbias ranged from 17.39% to 47.83% and was relatively equallylocated in each item, especially in items of subjects repre-sentation of the population (47.83%), inclusive criteria of thenormal controls (39.13%), blinding of the operators (47.83%),andmeasurement method (43.48%). Detailed information ofeach item was provided in Figures 2 and 3.
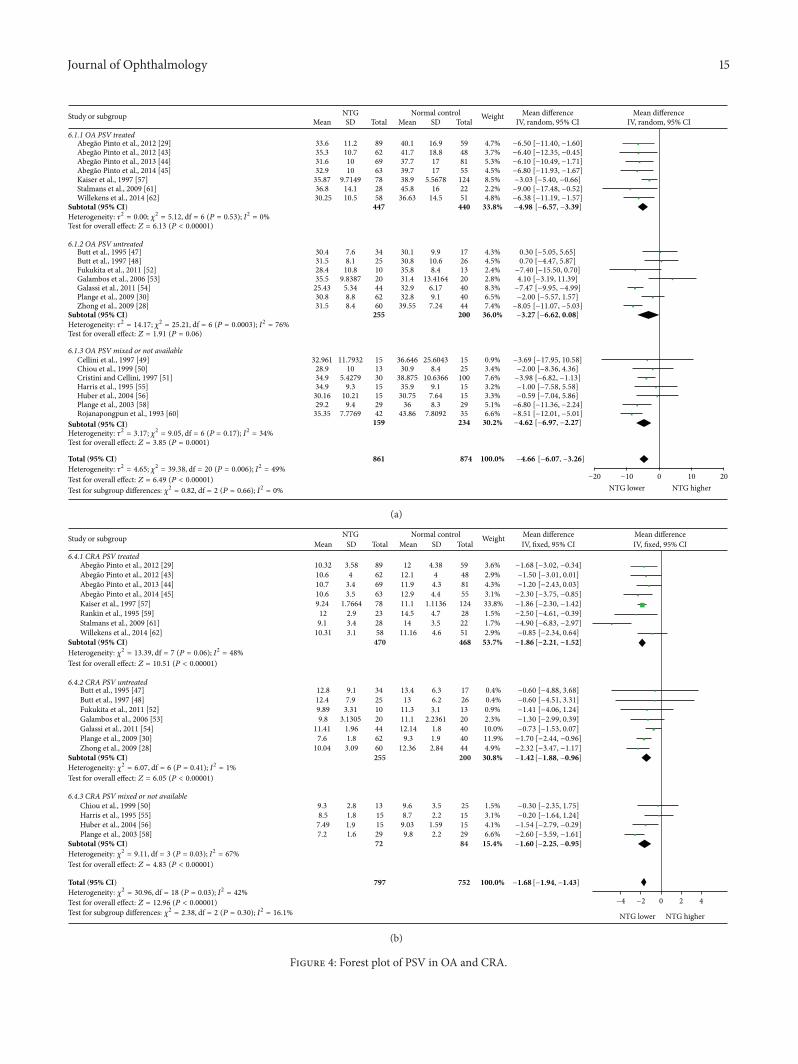
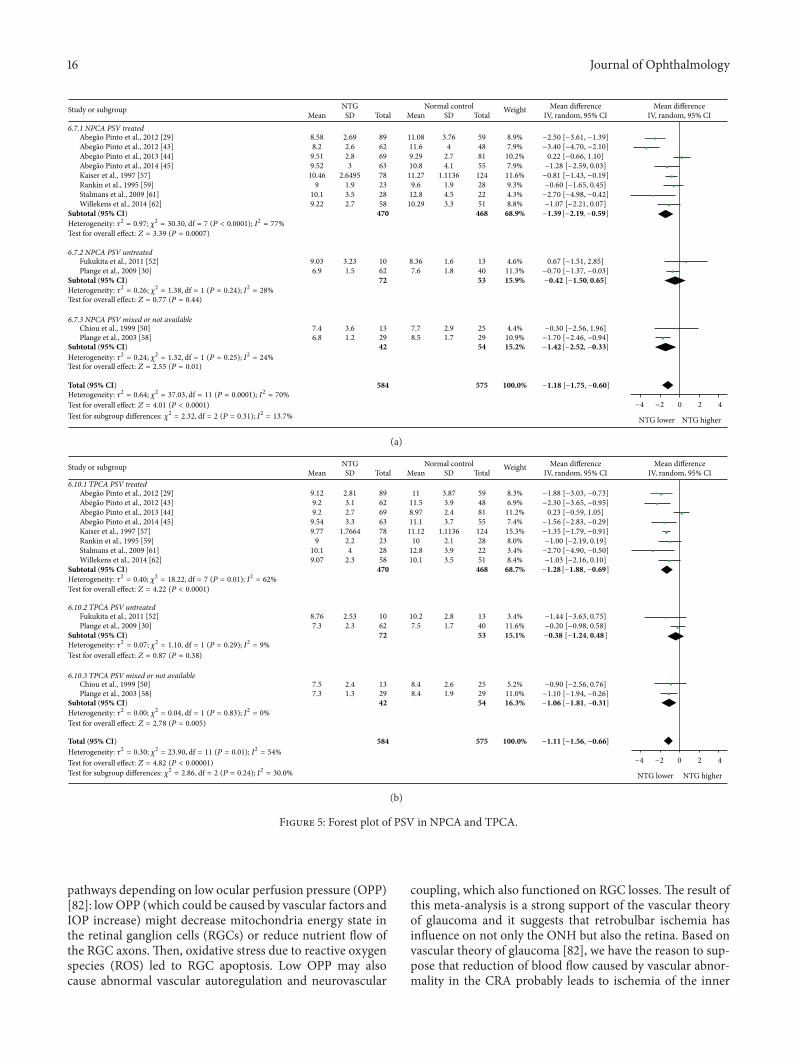
3.3.Meta-Analysis Results. Meandifferences (MDs)with 95%confidence intervals (95% CIs) of PSV, EDV, and RI of OA,CRA, NPCA, and TPCA were shown in forest plots (Figures4–9). The green dots represented MDs and the whiskerswhich extend from the dots represented the 95% CIs ofMDs. Values on the left side of the vertical line marked0 indicated that parameters in NTG patients were smallerthan normal controls while values on the right side of thevertical line indicated the increase of parameters in NTGpatients.Whiskers of 95%CIs which did not cross the verticalline indicated that the results had statistically significantdifference at the level of 𝛼 = 0.05.
Statistically significant decreases were found in PSV inOA, CRA, NPCA, and TPCA, respectively, with the MDsof −4.66 cm/s (95% CI: −6.07 to −3.26, 𝑃 < 0.00001, and
𝑁fs = 624.1325), −1.68 cm/s (95% CI: −1.94 to −1.43, 𝑃 <0.00001, and 𝑁fs = 851.1949), −1.18 cm/s (95% CI: −1.75 to−0.60, 𝑃 < 0.0001, and𝑁fs = 239.6319), and −1.11 cm/s (95%CI: −1.56 to −0.66, 𝑃 < 0.00001, and𝑁fs = 250.4296). Therewere moderate heterogeneities in PSV in OA (𝑃heterogeneity =0.006, 𝐼2 = 49%) and CRA (𝑃heterogeneity = 0.03, 𝐼
2=
42%) while there were significant heterogeneities in NPCA(𝑃heterogeneity = 0.0001, 𝐼
2= 70%) and TPCA (𝑃heterogeneity =
0.01, 𝐼2 = 54%).Subgroup analysis of PSV demonstrated that there were
significant heterogeneities in treated subgroups in NPCA(𝑃heterogeneity < 0.0001, 𝐼
2= 77%) and TPCA (𝑃heterogeneity =
0.01, 𝐼2 = 62%), while moderate heterogeneities were foundin OA (𝑃heterogeneity = 0.53, 𝐼
2= 0%) and CRA (𝑃heterogeneity =
0.06, 𝐼2 = 48%). In untreated subgroups, significant hetero-geneity was only found in OA (𝑃heterogeneity = 0.0003, 𝐼
2=
76%), while moderate heterogeneities were found in CRA(𝑃heterogeneity = 0.41, 𝐼
2= 1%), NPCA (𝑃heterogeneity = 0.24,
𝐼2= 28%), and TPCA (𝑃heterogeneity = 0.29, 𝐼
2= 9%).
Heterogeneities between subgroups were unapparent in eachof these 4 vessels (OA: 𝑃subgroup = 0.66, 𝐼
2= 0%; CRA:
𝑃subgroup = 0.30, 𝐼2= 16.1%; NPCA: 𝑃subgroup = 0.31,
𝐼2= 13.7%; TPCA: 𝑃subgroup = 0.24, 𝐼
2= 30.0%).
The forest plots of PSV in each vessel were provided inFigures 4 and 5.
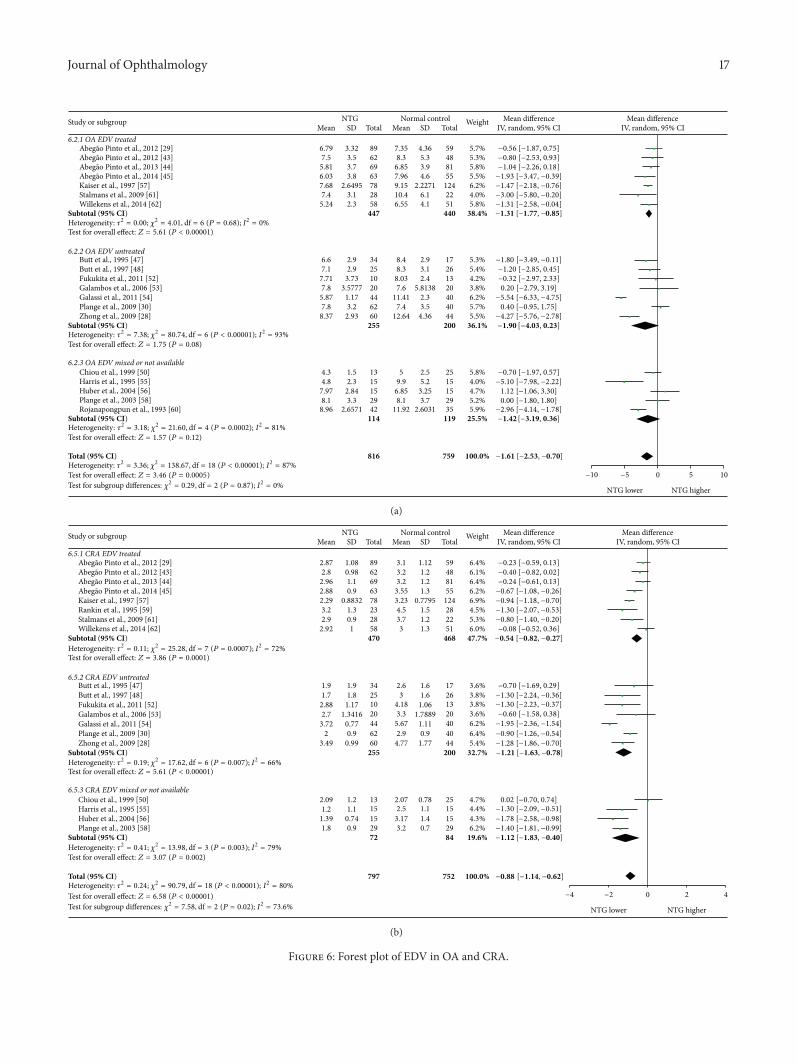
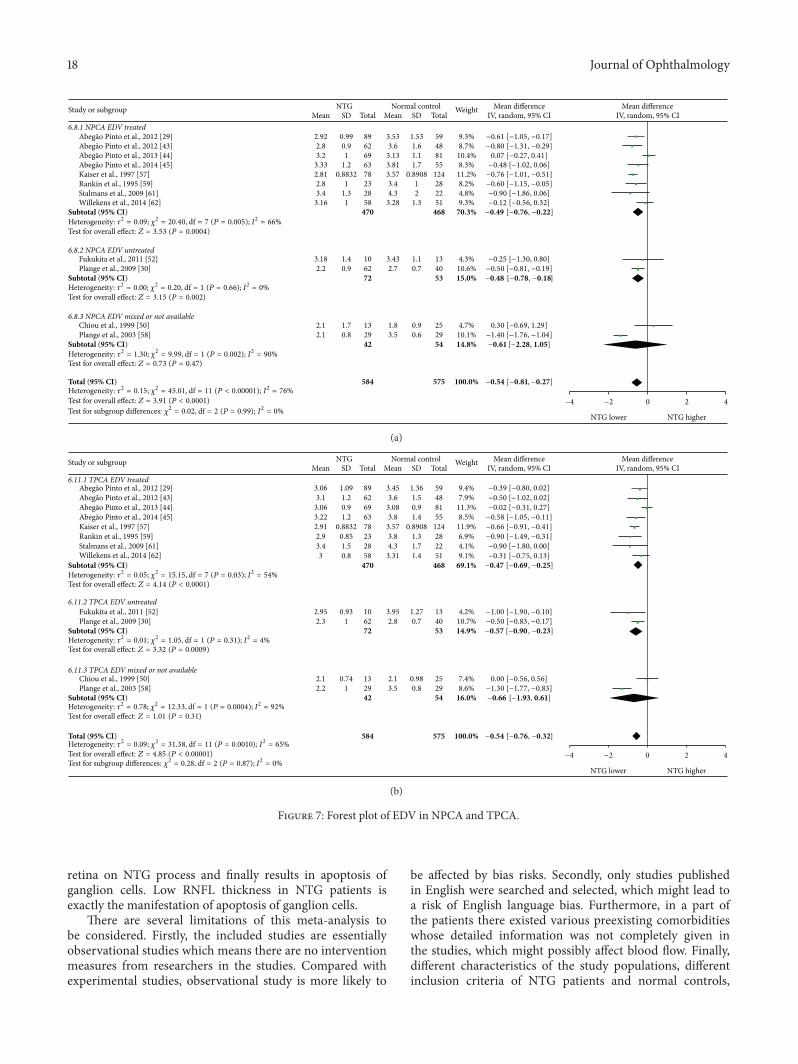
NTG patients had statistical reduction of EDV in OA,CRA, NPCA, and TPCA, with the MDs of −1.61 cm/s
Journal of Ophthalmology 7
Table 2: Basic study data of the included studies.
Study Country or regionNumber ofsubjects
(NTG/control)
Gender(male : female)(NTG/control)
Ethnic composition(NTG/control)
Mean age (years)(NTG/control)
[29] Portugal 89/59 NA NA 69.31 ± 12.1/71.44 ± 10.0[43] Portugal 62/48 NA NA 70.4 ± 11/71.7 ± 9.5[44] Portugal 69/81 NA NA 69.3 ± 11/64.6 ± 14[45] Portugal 63/55 NA NA 69.7 ± 9.0/65.1 ± 11.0[46] Turkey 41/30 17 : 24/13 : 17 NA 56/53[47] UK 34/17 NA NA 68.1 ± 8.7/65.2 ± 4.7[48] UK 25/26 NA White 100%/White 100% 69.3 ± 8.9/65.7 ± 6.0[49] Italy 15/15 8 : 7/9 : 6 NA 64.7/65.8[50] Taiwan 13/25 9 : 4/24 : 1 NA 71.2/72.6[51] Italy 30/100A 16 : 14/46 : 54 NA 46.4/48.9[52] Japan 10/13 NA NA NA/NA[53] Germany 20/20 8 : 12/11 : 9 NA 61.3 ± 12.97/60.2 ± 18.78
[54] Italy 44/40 24 : 20/22 : 18 Caucasian 100%/Caucasian 100% 64.45 ± 6.91/62.75 ± 7.37
[55] USA 15/15 NAB NA 61.4 ± 9.3/53.5 ± 8.8[56] Germany 15/15 6 : 9/6 : 9 NA 47 ± 8/41 ± 14[57] Switzerland 78/124 34 : 44/64 : 60 NA NA[58] Germany 29/29 NA NA 51 ± 10/44 ± 16[30] Germany 62/40 23 : 39/16 : 24 NA 57 ± 14/58 ± 9[59] Canada 23/28 NA NA 64.8 ± 12.9/64.9 ± 12.4[60] Canada 42/35 15 : 27/16 : 19 NA 65.89 ± 11.15/61.87 ± 12.13[61] Belgium 28/22 NA NA 72.8 ± 8.8/68.5 ± 8.9[62] Belgium 58/51 26 : 32/27 : 24 NA 70.9 ± 11.3/73.8 ± 13.3[28] China 60/44 31 : 29/20 : 24 NA 58.62 ± 13.05/57.41 ± 12.17NA = not available.AThat study divided the normal controls into two groups according to whether they were older than 50 years. In this meta-analysis, two groups were combinedto make normal control group age-matched to NTG group.BThat study only mentioned that there were 10 males and 20 females in all.
Subjects’ representation of the population in age, sex, and ethnicity (selection bias)
Appropriate inclusive criteria of NTG patients (selection bias)
Appropriate inclusive criteria of the normal controls (selection bias)
Appropriate exclusion criteria of the subjects (selection bias)
Blinding of the CDI operators (detection bias)
Defined and unified measurement method (detection bias)
Outcome selective reporting (reporting bias)
Other bias
Overall
Low risk of biasUnclear risk of biasHigh risk of bias
0 25 50 75 100(%)
Figure 2: Risk of bias rate of each item.
8 Journal of Ophthalmology
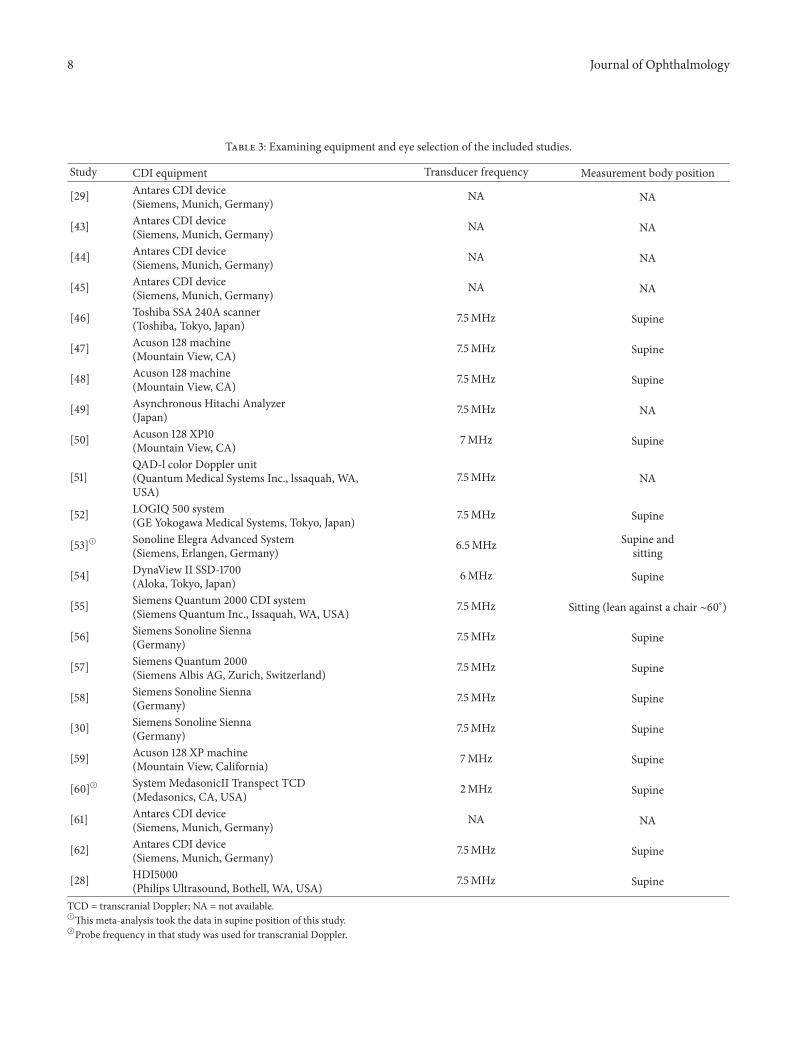
Table 3: Examining equipment and eye selection of the included studies.
Study CDI equipment Transducer frequency Measurement body position
[29] Antares CDI device(Siemens, Munich, Germany) NA NA
[43] Antares CDI device(Siemens, Munich, Germany) NA NA
[44] Antares CDI device(Siemens, Munich, Germany) NA NA
[45] Antares CDI device(Siemens, Munich, Germany) NA NA
[46] Toshiba SSA 240A scanner(Toshiba, Tokyo, Japan) 7.5MHz Supine
[47] Acuson 128 machine(Mountain View, CA) 7.5MHz Supine
[48] Acuson 128 machine(Mountain View, CA) 7.5MHz Supine
[49] Asynchronous Hitachi Analyzer(Japan) 7.5MHz NA
[50] Acuson 128 XP10(Mountain View, CA) 7MHz Supine
[51]QAD-l color Doppler unit(QuantumMedical Systems Inc., lssaquah, WA,USA)
7.5MHz NA
[52] LOGIQ 500 system(GE Yokogawa Medical Systems, Tokyo, Japan) 7.5MHz Supine
[53]A Sonoline Elegra Advanced System(Siemens, Erlangen, Germany) 6.5MHz Supine and
sitting
[54] DynaView II SSD-1700(Aloka, Tokyo, Japan) 6MHz Supine
[55] Siemens Quantum 2000 CDI system(Siemens Quantum Inc., Issaquah, WA, USA) 7.5MHz Sitting (lean against a chair ∼60∘)
[56] Siemens Sonoline Sienna(Germany) 7.5MHz Supine
[57] Siemens Quantum 2000(Siemens Albis AG, Zurich, Switzerland) 7.5MHz Supine
[58] Siemens Sonoline Sienna(Germany) 7.5MHz Supine
[30] Siemens Sonoline Sienna(Germany) 7.5MHz Supine
[59] Acuson 128 XP machine(Mountain View, California) 7MHz Supine
[60]B System MedasonicII Transpect TCD(Medasonics, CA, USA) 2MHz Supine
[61] Antares CDI device(Siemens, Munich, Germany) NA NA
[62] Antares CDI device(Siemens, Munich, Germany) 7.5MHz Supine
[28] HDI5000(Philips Ultrasound, Bothell, WA, USA) 7.5MHz Supine
TCD = transcranial Doppler; NA = not available.AThis meta-analysis took the data in supine position of this study.BProbe frequency in that study was used for transcranial Doppler.
Journal of Ophthalmology 9
Table 4: Quality-related data of the included studies.
Study Inclusive criteria of NTG patients Eye selection(NTG/control) Type of treatment (topical)
[29]Untreated IOP <21mmHgCharacteristic optic disc damageGlaucomatous visual field loss
Eye with greaterglaucomatousdamage/random
Beta blockers, 37Prostaglandin analogs, 35Carbonic anhydrase inhibitors, 31Alpha-adrenergic agents, 7
[43]Untreated IOP <21mmHgCharacteristic optic disc damageGlaucomatous visual field loss
Eye with greaterglaucomatousdamage/random
Beta blockers, 28Prostaglandin analogs, 36Carbonic anhydrase inhibitors, 20Alpha-adrenergic agents, 6
[44]Untreated IOP <21mmHgCharacteristic optic disc damageGlaucomatous visual field loss
Eye with greaterglaucomatousdamage/random
Beta blockers, 26Prostaglandin analogs, 28Carbonic anhydrase inhibitors, 24Alpha agonists, 6
[45]Untreated IOP <21mmHgCharacteristic optic disc damageGlaucomatous visual field loss
Eye with greaterglaucomatousdamage/random
Current topical IOP-lowering drugs(medicine not available)
[46]
Untreated IOP <21mmHgNerve fiber layer visual defects in each eyeBilateral symmetric glaucomatous-type opticdisk cuppingGlaucomatous visual field loss
Random/random NA (35% with a first-time diagnosis ofNTG)
[47]Untreated IOP <22mmHgCharacteristic optic disc changeGlaucomatous visual field loss
Eye with greaterglaucomatousdamage/random
Without any topical medication, 17Using topical glaucoma medicationswith a wash-out period of 1 month, 17
[48]Untreated IOP <22mmHgTypical glaucomatous disc damageGlaucomatous visual field loss
Eye with worse fieldloss/random
Without any topical medication, 14Using topical glaucoma medicationswith a wash-out period of 1 month, 11
[49]Untreated IOP <18mmHgGlaucomatous-type cupping of the optic diskGlaucomatous visual field loss
NA NA
[50]Untreated IOP <20mmHgGlaucomatous optic nerve abnormalityGlaucomatous visual field loss
NA NA
[51]
Simple open angle glaucoma and normalpressureGlaucomatous appearance of optic discPerimetric alterations (MD > 2dB, CPSD >4dB)
NA NA
[52]AUntreated IOP <21mmHgProgressive glaucomatous optic nerve damage(bilateral NTG)
Random/random Using topical glaucoma medicationswith a wash-out period of 1 month
[53]
Untreated IOP <21mmHgAbnormal thinning of the neuroretinal rimwith glaucomatous cupping of the optic nervehead (cup-to-disc ratio 0.6)Glaucomatous visual field loss
Right eyepreferential/right eyepreferential
Using topical glaucoma medicationswith a wash-out period of 6 weeks
[54]Untreated IOP <22mmHgFunctional defect of visual field (stage 1Laccording to Glaucoma Staging System 2)
Random eye in diseasedeyes/random Without any topical medication
[55]Untreated IOP <22mmHgBilateral glaucomatous optic disc cuppingGlaucomatous visual field loss
Right eye/right eye NA
[56]Untreated IOP <21mmHgGlaucomatous excavation of the optic discGlaucomatous visual field loss
Random/random NA
10 Journal of Ophthalmology
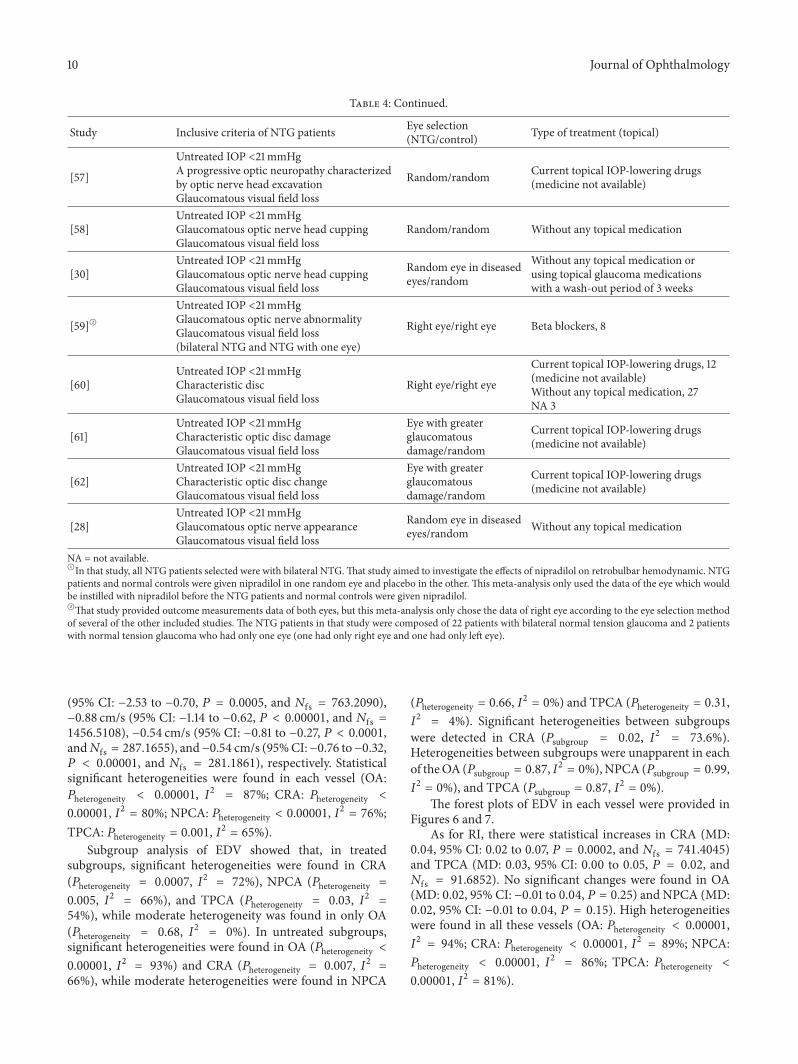
Table 4: Continued.
Study Inclusive criteria of NTG patients Eye selection(NTG/control) Type of treatment (topical)
[57]
Untreated IOP <21mmHgA progressive optic neuropathy characterizedby optic nerve head excavationGlaucomatous visual field loss
Random/random Current topical IOP-lowering drugs(medicine not available)
[58]Untreated IOP <21mmHgGlaucomatous optic nerve head cuppingGlaucomatous visual field loss
Random/random Without any topical medication
[30]Untreated IOP <21mmHgGlaucomatous optic nerve head cuppingGlaucomatous visual field loss
Random eye in diseasedeyes/random
Without any topical medication orusing topical glaucoma medicationswith a wash-out period of 3 weeks
[59]BUntreated IOP <21mmHgGlaucomatous optic nerve abnormalityGlaucomatous visual field loss(bilateral NTG and NTG with one eye)
Right eye/right eye Beta blockers, 8
[60]Untreated IOP <21mmHgCharacteristic discGlaucomatous visual field loss
Right eye/right eye
Current topical IOP-lowering drugs, 12(medicine not available)Without any topical medication, 27NA 3
[61]Untreated IOP <21mmHgCharacteristic optic disc damageGlaucomatous visual field loss
Eye with greaterglaucomatousdamage/random
Current topical IOP-lowering drugs(medicine not available)
[62]Untreated IOP <21mmHgCharacteristic optic disc changeGlaucomatous visual field loss
Eye with greaterglaucomatousdamage/random
Current topical IOP-lowering drugs(medicine not available)
[28]Untreated IOP <21mmHgGlaucomatous optic nerve appearanceGlaucomatous visual field loss
Random eye in diseasedeyes/random Without any topical medication
NA = not available.AIn that study, all NTG patients selected were with bilateral NTG.That study aimed to investigate the effects of nipradilol on retrobulbar hemodynamic. NTGpatients and normal controls were given nipradilol in one random eye and placebo in the other. This meta-analysis only used the data of the eye which wouldbe instilled with nipradilol before the NTG patients and normal controls were given nipradilol.BThat study provided outcome measurements data of both eyes, but this meta-analysis only chose the data of right eye according to the eye selection methodof several of the other included studies. The NTG patients in that study were composed of 22 patients with bilateral normal tension glaucoma and 2 patientswith normal tension glaucoma who had only one eye (one had only right eye and one had only left eye).
(95% CI: −2.53 to −0.70, 𝑃 = 0.0005, and 𝑁fs = 763.2090),−0.88 cm/s (95% CI: −1.14 to −0.62, 𝑃 < 0.00001, and 𝑁fs =1456.5108), −0.54 cm/s (95% CI: −0.81 to −0.27, 𝑃 < 0.0001,and𝑁fs = 287.1655), and−0.54 cm/s (95%CI:−0.76 to−0.32,𝑃 < 0.00001, and 𝑁fs = 281.1861), respectively. Statisticalsignificant heterogeneities were found in each vessel (OA:𝑃heterogeneity < 0.00001, 𝐼
2= 87%; CRA: 𝑃heterogeneity <
0.00001, 𝐼2 = 80%; NPCA: 𝑃heterogeneity < 0.00001, 𝐼2= 76%;
TPCA: 𝑃heterogeneity = 0.001, 𝐼2= 65%).
Subgroup analysis of EDV showed that, in treatedsubgroups, significant heterogeneities were found in CRA(𝑃heterogeneity = 0.0007, 𝐼
2= 72%), NPCA (𝑃heterogeneity =
0.005, 𝐼2 = 66%), and TPCA (𝑃heterogeneity = 0.03, 𝐼2=
54%), while moderate heterogeneity was found in only OA(𝑃heterogeneity = 0.68, 𝐼
2= 0%). In untreated subgroups,
significant heterogeneities were found in OA (𝑃heterogeneity <0.00001, 𝐼2 = 93%) and CRA (𝑃heterogeneity = 0.007, 𝐼
2=
66%), while moderate heterogeneities were found in NPCA
(𝑃heterogeneity = 0.66, 𝐼2= 0%) and TPCA (𝑃heterogeneity = 0.31,
𝐼2= 4%). Significant heterogeneities between subgroups
were detected in CRA (𝑃subgroup = 0.02, 𝐼2= 73.6%).
Heterogeneities between subgroups were unapparent in eachof theOA (𝑃subgroup = 0.87, 𝐼
2= 0%),NPCA (𝑃subgroup = 0.99,
𝐼2= 0%), and TPCA (𝑃subgroup = 0.87, 𝐼
2= 0%).
The forest plots of EDV in each vessel were provided inFigures 6 and 7.
As for RI, there were statistical increases in CRA (MD:0.04, 95% CI: 0.02 to 0.07, 𝑃 = 0.0002, and 𝑁fs = 741.4045)and TPCA (MD: 0.03, 95% CI: 0.00 to 0.05, 𝑃 = 0.02, and𝑁fs = 91.6852). No significant changes were found in OA(MD: 0.02, 95% CI: −0.01 to 0.04, 𝑃 = 0.25) and NPCA (MD:0.02, 95% CI: −0.01 to 0.04, 𝑃 = 0.15). High heterogeneitieswere found in all these vessels (OA: 𝑃heterogeneity < 0.00001,𝐼2= 94%; CRA: 𝑃heterogeneity < 0.00001, 𝐼
2= 89%; NPCA:
𝑃heterogeneity < 0.00001, 𝐼2= 86%; TPCA: 𝑃heterogeneity <
0.00001, 𝐼2 = 81%).
Journal of Ophthalmology 11
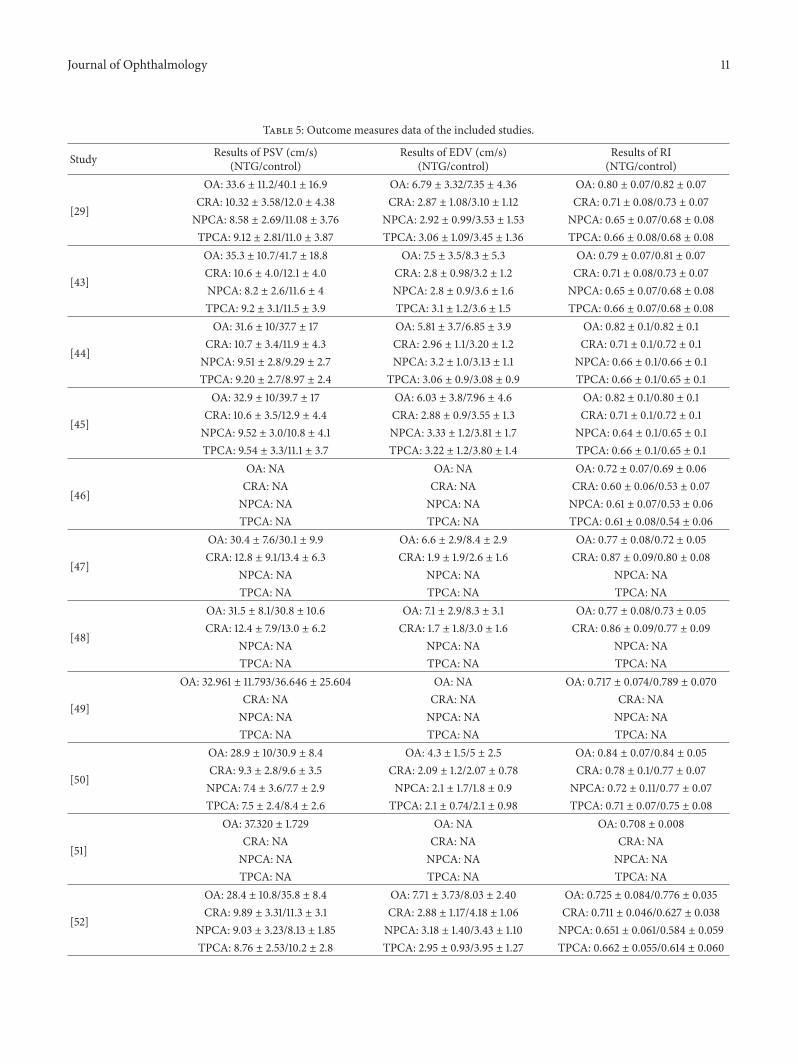
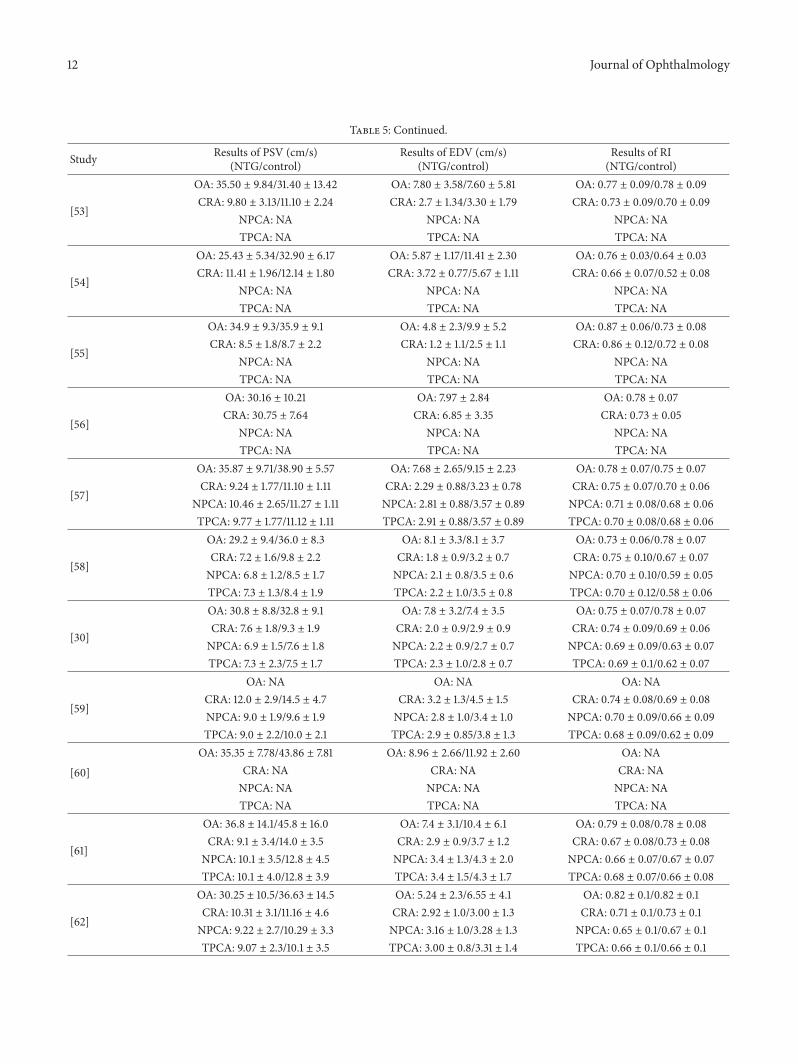
Table 5: Outcome measures data of the included studies.
Study Results of PSV (cm/s)(NTG/control)
Results of EDV (cm/s)(NTG/control)
Results of RI(NTG/control)
[29]
OA: 33.6 ± 11.2/40.1 ± 16.9 OA: 6.79 ± 3.32/7.35 ± 4.36 OA: 0.80 ± 0.07/0.82 ± 0.07CRA: 10.32 ± 3.58/12.0 ± 4.38 CRA: 2.87 ± 1.08/3.10 ± 1.12 CRA: 0.71 ± 0.08/0.73 ± 0.07NPCA: 8.58 ± 2.69/11.08 ± 3.76 NPCA: 2.92 ± 0.99/3.53 ± 1.53 NPCA: 0.65 ± 0.07/0.68 ± 0.08TPCA: 9.12 ± 2.81/11.0 ± 3.87 TPCA: 3.06 ± 1.09/3.45 ± 1.36 TPCA: 0.66 ± 0.08/0.68 ± 0.08
[43]
OA: 35.3 ± 10.7/41.7 ± 18.8 OA: 7.5 ± 3.5/8.3 ± 5.3 OA: 0.79 ± 0.07/0.81 ± 0.07CRA: 10.6 ± 4.0/12.1 ± 4.0 CRA: 2.8 ± 0.98/3.2 ± 1.2 CRA: 0.71 ± 0.08/0.73 ± 0.07NPCA: 8.2 ± 2.6/11.6 ± 4 NPCA: 2.8 ± 0.9/3.6 ± 1.6 NPCA: 0.65 ± 0.07/0.68 ± 0.08TPCA: 9.2 ± 3.1/11.5 ± 3.9 TPCA: 3.1 ± 1.2/3.6 ± 1.5 TPCA: 0.66 ± 0.07/0.68 ± 0.08
[44]
OA: 31.6 ± 10/37.7 ± 17 OA: 5.81 ± 3.7/6.85 ± 3.9 OA: 0.82 ± 0.1/0.82 ± 0.1CRA: 10.7 ± 3.4/11.9 ± 4.3 CRA: 2.96 ± 1.1/3.20 ± 1.2 CRA: 0.71 ± 0.1/0.72 ± 0.1NPCA: 9.51 ± 2.8/9.29 ± 2.7 NPCA: 3.2 ± 1.0/3.13 ± 1.1 NPCA: 0.66 ± 0.1/0.66 ± 0.1TPCA: 9.20 ± 2.7/8.97 ± 2.4 TPCA: 3.06 ± 0.9/3.08 ± 0.9 TPCA: 0.66 ± 0.1/0.65 ± 0.1
[45]
OA: 32.9 ± 10/39.7 ± 17 OA: 6.03 ± 3.8/7.96 ± 4.6 OA: 0.82 ± 0.1/0.80 ± 0.1CRA: 10.6 ± 3.5/12.9 ± 4.4 CRA: 2.88 ± 0.9/3.55 ± 1.3 CRA: 0.71 ± 0.1/0.72 ± 0.1NPCA: 9.52 ± 3.0/10.8 ± 4.1 NPCA: 3.33 ± 1.2/3.81 ± 1.7 NPCA: 0.64 ± 0.1/0.65 ± 0.1TPCA: 9.54 ± 3.3/11.1 ± 3.7 TPCA: 3.22 ± 1.2/3.80 ± 1.4 TPCA: 0.66 ± 0.1/0.65 ± 0.1
[46]
OA: NA OA: NA OA: 0.72 ± 0.07/0.69 ± 0.06CRA: NA CRA: NA CRA: 0.60 ± 0.06/0.53 ± 0.07NPCA: NA NPCA: NA NPCA: 0.61 ± 0.07/0.53 ± 0.06TPCA: NA TPCA: NA TPCA: 0.61 ± 0.08/0.54 ± 0.06
[47]
OA: 30.4 ± 7.6/30.1 ± 9.9 OA: 6.6 ± 2.9/8.4 ± 2.9 OA: 0.77 ± 0.08/0.72 ± 0.05CRA: 12.8 ± 9.1/13.4 ± 6.3 CRA: 1.9 ± 1.9/2.6 ± 1.6 CRA: 0.87 ± 0.09/0.80 ± 0.08
NPCA: NA NPCA: NA NPCA: NATPCA: NA TPCA: NA TPCA: NA
[48]
OA: 31.5 ± 8.1/30.8 ± 10.6 OA: 7.1 ± 2.9/8.3 ± 3.1 OA: 0.77 ± 0.08/0.73 ± 0.05CRA: 12.4 ± 7.9/13.0 ± 6.2 CRA: 1.7 ± 1.8/3.0 ± 1.6 CRA: 0.86 ± 0.09/0.77 ± 0.09
NPCA: NA NPCA: NA NPCA: NATPCA: NA TPCA: NA TPCA: NA
[49]
OA: 32.961 ± 11.793/36.646 ± 25.604 OA: NA OA: 0.717 ± 0.074/0.789 ± 0.070CRA: NA CRA: NA CRA: NANPCA: NA NPCA: NA NPCA: NATPCA: NA TPCA: NA TPCA: NA
[50]
OA: 28.9 ± 10/30.9 ± 8.4 OA: 4.3 ± 1.5/5 ± 2.5 OA: 0.84 ± 0.07/0.84 ± 0.05CRA: 9.3 ± 2.8/9.6 ± 3.5 CRA: 2.09 ± 1.2/2.07 ± 0.78 CRA: 0.78 ± 0.1/0.77 ± 0.07NPCA: 7.4 ± 3.6/7.7 ± 2.9 NPCA: 2.1 ± 1.7/1.8 ± 0.9 NPCA: 0.72 ± 0.11/0.77 ± 0.07TPCA: 7.5 ± 2.4/8.4 ± 2.6 TPCA: 2.1 ± 0.74/2.1 ± 0.98 TPCA: 0.71 ± 0.07/0.75 ± 0.08
[51]
OA: 37.320 ± 1.729 OA: NA OA: 0.708 ± 0.008CRA: NA CRA: NA CRA: NANPCA: NA NPCA: NA NPCA: NATPCA: NA TPCA: NA TPCA: NA
[52]
OA: 28.4 ± 10.8/35.8 ± 8.4 OA: 7.71 ± 3.73/8.03 ± 2.40 OA: 0.725 ± 0.084/0.776 ± 0.035CRA: 9.89 ± 3.31/11.3 ± 3.1 CRA: 2.88 ± 1.17/4.18 ± 1.06 CRA: 0.711 ± 0.046/0.627 ± 0.038
NPCA: 9.03 ± 3.23/8.13 ± 1.85 NPCA: 3.18 ± 1.40/3.43 ± 1.10 NPCA: 0.651 ± 0.061/0.584 ± 0.059TPCA: 8.76 ± 2.53/10.2 ± 2.8 TPCA: 2.95 ± 0.93/3.95 ± 1.27 TPCA: 0.662 ± 0.055/0.614 ± 0.060
12 Journal of Ophthalmology
Table 5: Continued.
Study Results of PSV (cm/s)(NTG/control)
Results of EDV (cm/s)(NTG/control)
Results of RI(NTG/control)
[53]
OA: 35.50 ± 9.84/31.40 ± 13.42 OA: 7.80 ± 3.58/7.60 ± 5.81 OA: 0.77 ± 0.09/0.78 ± 0.09CRA: 9.80 ± 3.13/11.10 ± 2.24 CRA: 2.7 ± 1.34/3.30 ± 1.79 CRA: 0.73 ± 0.09/0.70 ± 0.09
NPCA: NA NPCA: NA NPCA: NATPCA: NA TPCA: NA TPCA: NA
[54]
OA: 25.43 ± 5.34/32.90 ± 6.17 OA: 5.87 ± 1.17/11.41 ± 2.30 OA: 0.76 ± 0.03/0.64 ± 0.03CRA: 11.41 ± 1.96/12.14 ± 1.80 CRA: 3.72 ± 0.77/5.67 ± 1.11 CRA: 0.66 ± 0.07/0.52 ± 0.08
NPCA: NA NPCA: NA NPCA: NATPCA: NA TPCA: NA TPCA: NA
[55]
OA: 34.9 ± 9.3/35.9 ± 9.1 OA: 4.8 ± 2.3/9.9 ± 5.2 OA: 0.87 ± 0.06/0.73 ± 0.08CRA: 8.5 ± 1.8/8.7 ± 2.2 CRA: 1.2 ± 1.1/2.5 ± 1.1 CRA: 0.86 ± 0.12/0.72 ± 0.08
NPCA: NA NPCA: NA NPCA: NATPCA: NA TPCA: NA TPCA: NA
[56]
OA: 30.16 ± 10.21 OA: 7.97 ± 2.84 OA: 0.78 ± 0.07CRA: 30.75 ± 7.64 CRA: 6.85 ± 3.35 CRA: 0.73 ± 0.05
NPCA: NA NPCA: NA NPCA: NATPCA: NA TPCA: NA TPCA: NA
[57]
OA: 35.87 ± 9.71/38.90 ± 5.57 OA: 7.68 ± 2.65/9.15 ± 2.23 OA: 0.78 ± 0.07/0.75 ± 0.07CRA: 9.24 ± 1.77/11.10 ± 1.11 CRA: 2.29 ± 0.88/3.23 ± 0.78 CRA: 0.75 ± 0.07/0.70 ± 0.06
NPCA: 10.46 ± 2.65/11.27 ± 1.11 NPCA: 2.81 ± 0.88/3.57 ± 0.89 NPCA: 0.71 ± 0.08/0.68 ± 0.06TPCA: 9.77 ± 1.77/11.12 ± 1.11 TPCA: 2.91 ± 0.88/3.57 ± 0.89 TPCA: 0.70 ± 0.08/0.68 ± 0.06
[58]
OA: 29.2 ± 9.4/36.0 ± 8.3 OA: 8.1 ± 3.3/8.1 ± 3.7 OA: 0.73 ± 0.06/0.78 ± 0.07CRA: 7.2 ± 1.6/9.8 ± 2.2 CRA: 1.8 ± 0.9/3.2 ± 0.7 CRA: 0.75 ± 0.10/0.67 ± 0.07NPCA: 6.8 ± 1.2/8.5 ± 1.7 NPCA: 2.1 ± 0.8/3.5 ± 0.6 NPCA: 0.70 ± 0.10/0.59 ± 0.05TPCA: 7.3 ± 1.3/8.4 ± 1.9 TPCA: 2.2 ± 1.0/3.5 ± 0.8 TPCA: 0.70 ± 0.12/0.58 ± 0.06
[30]
OA: 30.8 ± 8.8/32.8 ± 9.1 OA: 7.8 ± 3.2/7.4 ± 3.5 OA: 0.75 ± 0.07/0.78 ± 0.07CRA: 7.6 ± 1.8/9.3 ± 1.9 CRA: 2.0 ± 0.9/2.9 ± 0.9 CRA: 0.74 ± 0.09/0.69 ± 0.06NPCA: 6.9 ± 1.5/7.6 ± 1.8 NPCA: 2.2 ± 0.9/2.7 ± 0.7 NPCA: 0.69 ± 0.09/0.63 ± 0.07TPCA: 7.3 ± 2.3/7.5 ± 1.7 TPCA: 2.3 ± 1.0/2.8 ± 0.7 TPCA: 0.69 ± 0.1/0.62 ± 0.07
[59]
OA: NA OA: NA OA: NACRA: 12.0 ± 2.9/14.5 ± 4.7 CRA: 3.2 ± 1.3/4.5 ± 1.5 CRA: 0.74 ± 0.08/0.69 ± 0.08NPCA: 9.0 ± 1.9/9.6 ± 1.9 NPCA: 2.8 ± 1.0/3.4 ± 1.0 NPCA: 0.70 ± 0.09/0.66 ± 0.09TPCA: 9.0 ± 2.2/10.0 ± 2.1 TPCA: 2.9 ± 0.85/3.8 ± 1.3 TPCA: 0.68 ± 0.09/0.62 ± 0.09
[60]OA: 35.35 ± 7.78/43.86 ± 7.81 OA: 8.96 ± 2.66/11.92 ± 2.60 OA: NA
CRA: NA CRA: NA CRA: NANPCA: NA NPCA: NA NPCA: NATPCA: NA TPCA: NA TPCA: NA
[61]
OA: 36.8 ± 14.1/45.8 ± 16.0 OA: 7.4 ± 3.1/10.4 ± 6.1 OA: 0.79 ± 0.08/0.78 ± 0.08CRA: 9.1 ± 3.4/14.0 ± 3.5 CRA: 2.9 ± 0.9/3.7 ± 1.2 CRA: 0.67 ± 0.08/0.73 ± 0.08
NPCA: 10.1 ± 3.5/12.8 ± 4.5 NPCA: 3.4 ± 1.3/4.3 ± 2.0 NPCA: 0.66 ± 0.07/0.67 ± 0.07TPCA: 10.1 ± 4.0/12.8 ± 3.9 TPCA: 3.4 ± 1.5/4.3 ± 1.7 TPCA: 0.68 ± 0.07/0.66 ± 0.08
[62]
OA: 30.25 ± 10.5/36.63 ± 14.5 OA: 5.24 ± 2.3/6.55 ± 4.1 OA: 0.82 ± 0.1/0.82 ± 0.1CRA: 10.31 ± 3.1/11.16 ± 4.6 CRA: 2.92 ± 1.0/3.00 ± 1.3 CRA: 0.71 ± 0.1/0.73 ± 0.1NPCA: 9.22 ± 2.7/10.29 ± 3.3 NPCA: 3.16 ± 1.0/3.28 ± 1.3 NPCA: 0.65 ± 0.1/0.67 ± 0.1TPCA: 9.07 ± 2.3/10.1 ± 3.5 TPCA: 3.00 ± 0.8/3.31 ± 1.4 TPCA: 0.66 ± 0.1/0.66 ± 0.1
Journal of Ophthalmology 13
Table 5: Continued.
Study Results of PSV (cm/s)(NTG/control)
Results of EDV (cm/s)(NTG/control)
Results of RI(NTG/control)
[28]
OA: 31.50 ± 8.40/39.55 ± 7.24 OA: 8.37 ± 2.93/12.64 ± 4.36 OA: 0.73 ± 0.06/0.69 ± 0.07CRA: 10.04 ± 3.09/12.36 ± 2.84 CRA: 3.49 ± 0.99/4.77 ± 1.77 CRA: 0.66 ± 0.07/0.61 ± 0.07
NPCA: NA NPCA: NA NPCA: NATPCA: NA TPCA: NA TPCA: NA
NTG= normal tension glaucoma; IOP = intraocular pressure; PSV = peak systolic velocity; EDV= end diastolic velocity; RI = resistive index; OA = ophthalmicartery; CRA = central retinal artery; NPCA = nasal short posterior ciliary artery; TPCA = temporal short posterior ciliary artery; NA = not available.
Subgroup analysis of RI showed that, in treated sub-groups, heterogeneities were significant in OA (𝑃heterogeneity =0.02, 𝐼2 = 60%), CRA (𝑃heterogeneity < 0.00001, 𝐼
2=
84%), and NPCA (𝑃heterogeneity = 0.002, 𝐼2= 68%), while
heterogeneity was moderate in only TPCA (𝑃heterogeneity =0.05, 𝐼2 = 50%). In untreated subgroups, heterogeneitieswere significant in OA (𝑃heterogeneity < 0.00001, 𝐼
2= 96%)
and CRA (𝑃heterogeneity = 0.0004, 𝐼2= 76%), while they
could be ignored in NPCA (𝑃heterogeneity = 0.81, 𝐼2= 0%)
and TPCA (𝑃heterogeneity = 0.45, 𝐼2= 0%). There were
high heterogeneities between subgroups in CRA (𝑃subgroup =0.0001, 𝐼2 = 89.1%), NPCA (𝑃subgroup = 0.0003, 𝐼
2=
87.8%), and TPCA (𝑃subgroup = 0.002, 𝐼2= 84.3%), while
there was moderate heterogeneity between subgroups in OA(𝑃subgroup = 0.64, 𝐼
2= 0%).
The forest plots of RI in each vessel were provided inFigures 8 and 9.
In addition, there were, respectively, only 2 studiesincluded in untreated subgroup in NPCA and TPCA ofeach single parameter analysis, which made the resultsof untreated subgroup in NPCA and TPCA unstable andunreliable.
4. Discussion
NTG is an optic neuropathy within the glaucoma familywhich shares many of the same pathologic characteristics asPOAG with cupping of the optic disc and visual field lossresembling that seen in other types of chronic open angleglaucoma except for the fact that a statistically elevated IOPcannot be detected [63]. Once, it was thought uncommon.But several recent population studies both in the UnitedStates and abroad have indicated that NTG accounts forbetween 20% and 40% of all open angle glaucoma [64–68].The role of IOP has long been questioned in the developmentof NTG. Several studies about asymmetric NTG showedgreater glaucomatous damage in the eye with the higher IOP,which seemed to support the theory that NTG was pressuresensitive [69, 70]. However, others found that only 27.66%of NTG patients with asymmetric visual field defects hada mean IOP difference of more than 1mmHg between twoeyes [71]. This suggested that IOP had limited impact ofNTG development. If there is no significant elevation of IOP,vascular abnormality might result in glaucomatous damageaccording to the vascular theory of glaucoma [10, 11].
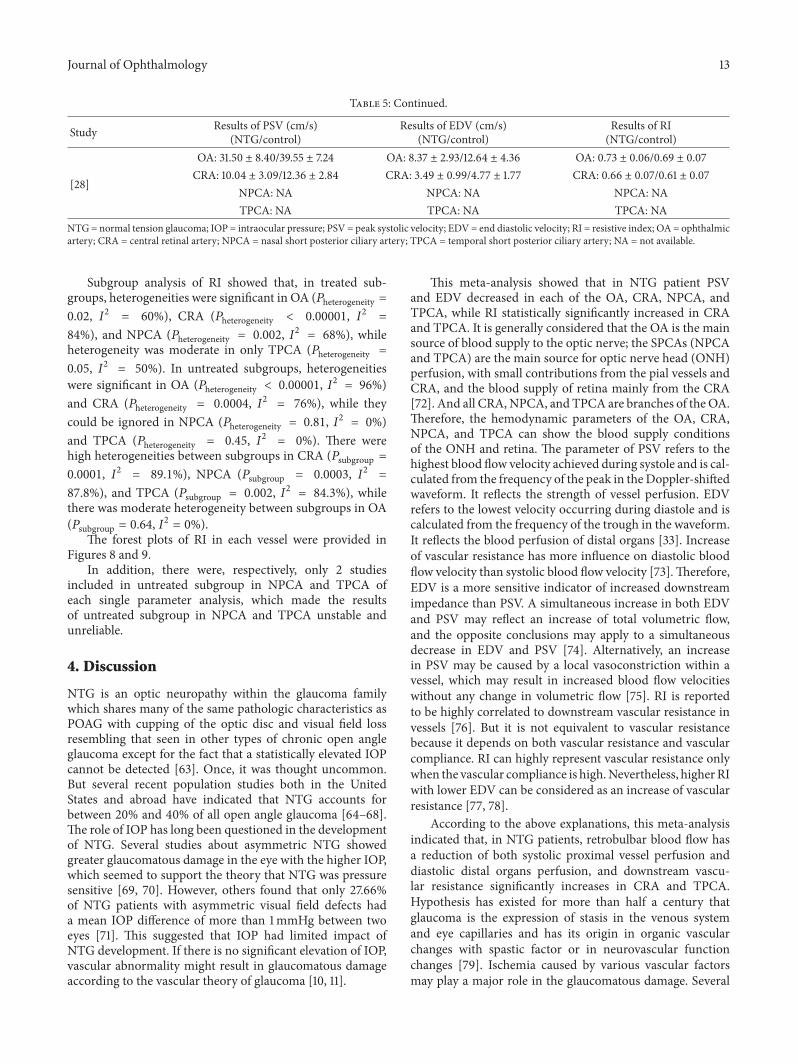
This meta-analysis showed that in NTG patient PSVand EDV decreased in each of the OA, CRA, NPCA, andTPCA, while RI statistically significantly increased in CRAand TPCA. It is generally considered that the OA is the mainsource of blood supply to the optic nerve; the SPCAs (NPCAand TPCA) are the main source for optic nerve head (ONH)perfusion, with small contributions from the pial vessels andCRA, and the blood supply of retina mainly from the CRA[72]. And all CRA, NPCA, and TPCA are branches of theOA.Therefore, the hemodynamic parameters of the OA, CRA,NPCA, and TPCA can show the blood supply conditionsof the ONH and retina. The parameter of PSV refers to thehighest blood flow velocity achieved during systole and is cal-culated from the frequency of the peak in theDoppler-shiftedwaveform. It reflects the strength of vessel perfusion. EDVrefers to the lowest velocity occurring during diastole and iscalculated from the frequency of the trough in the waveform.It reflects the blood perfusion of distal organs [33]. Increaseof vascular resistance has more influence on diastolic bloodflow velocity than systolic blood flow velocity [73].Therefore,EDV is a more sensitive indicator of increased downstreamimpedance than PSV. A simultaneous increase in both EDVand PSV may reflect an increase of total volumetric flow,and the opposite conclusions may apply to a simultaneousdecrease in EDV and PSV [74]. Alternatively, an increasein PSV may be caused by a local vasoconstriction within avessel, which may result in increased blood flow velocitieswithout any change in volumetric flow [75]. RI is reportedto be highly correlated to downstream vascular resistance invessels [76]. But it is not equivalent to vascular resistancebecause it depends on both vascular resistance and vascularcompliance. RI can highly represent vascular resistance onlywhen the vascular compliance is high.Nevertheless, higherRIwith lower EDV can be considered as an increase of vascularresistance [77, 78].
According to the above explanations, this meta-analysisindicated that, in NTG patients, retrobulbar blood flow hasa reduction of both systolic proximal vessel perfusion anddiastolic distal organs perfusion, and downstream vascu-lar resistance significantly increases in CRA and TPCA.Hypothesis has existed for more than half a century thatglaucoma is the expression of stasis in the venous systemand eye capillaries and has its origin in organic vascularchanges with spastic factor or in neurovascular functionchanges [79]. Ischemia caused by various vascular factorsmay play a major role in the glaucomatous damage. Several
14 Journal of Ophthalmology
Abegão Pinto et al., 2012 [29]Abegão Pinto et al., 2012 [43]
Abegão Pinto et al., 2014 [45]Akcar et al., 2005 [46]
Butt et al., 1995 [47]Butt et al., 1997 [48]
Cellini et al., 1997 [49]Chiou et al., 1999 [50]
Cristini and Cellini, 1997 [51]Fukukita et al., 2011 [52]
Abegão Pinto et al., 2013 [44]
Galambos et al., 2006 [53]Galassi et al., 2011 [54]Harris et al., 1995 [55]Huber et al., 2004 [56]Kaiser et al., 1997 [57]Plange et al., 2003 [58]Plange et al., 2009 [30]
Rankin et al., 1995 [59]Rojanapongpun et al., 1993 [60]
Stalmans et al., 2009 [61]Willekens et al., 2014 [62]
Zhong et al., 2009 [28]
+
+
+
+
++
+
+
+
+
+
+
+
+
+
+
+
+
+
+
+
+
+
+
+
+
+
+
+
+
+
+ +
+
+
+
+
+
+
+
+
+
+
+
+
+
+
+
+
+++
+
+
+
+
+
+
+
+
+
+
+
+
+
+
+
+
+
+
+
+
+
+
+
+
+
+
+
+
+
+
+
+
+
+
+
+
+
+
+
+
+
+
+
+
+
+
+
+
+
+
+
+
+
+ + ++
+ ++
+
+
++
+
+
+ + ++
+
+
+
++
−
−
−
−
−
−
−
???
??
?
??
? ? ? ? ? ? ?
? ?? ?? ? ? ?
?
?? ? ?
? ?? ?
? ?? ? ?
? ?
?
?
?
??
?? ??
?
??
???
??
? ?
?
??
??
?? ? ?
??
??
??
Subj
ects’
repr
esen
tatio
n of
the p
opul
atio
n in
age,
sex,
and
ethn
icity
(sel
ectio
n bi
as)
Appr
opria
te in
clusiv
e crit
eria
of N
TG p
atie
nts (
sele
ctio
n bi
as)
Appr
opria
te in
clusiv
e crit
eria
of t
he n
orm
al co
ntro
ls (s
elec
tion
bias
)Ap
prop
riate
exclu
sion
crite
ria o
f the
subj
ects
(sel
ectio
n bi
as)
Blin
ding
of t
he C
DI o
pera
tors
(det
ectio
n bi
as)
Defi
ned
and
unifi
ed m
easu
rem
ent m
etho
d (d
etec
tion
bias
)O
utco
me s
elec
tive r
epor
ting
(rep
ortin
g bi
as)
Oth
er b
ias
Ove
rall
Figure 3: Risk of bias summary of each item.
recent studies showed that blood pressure and ocular per-fusion pressure were risk factors with high correlation forthe incidence and progression of glaucoma. The BarbadosEye Study [80] reported that low systolic blood pressuredoubled the risk for glaucoma incidence and those with thelowest 20% of diastolic perfusion pressure had a 3.3 times
risk of developing glaucoma. The Proyecto VER Study [81]reported that patients with a diastolic perfusion pressureas low as 45mmHg were 3 times more likely to developglaucoma compared with those who had a diastolic perfusionpressure of 65mmHg. A recent study presented a possibletheory, whichwasmore related to vascular factors, describing
Journal of Ophthalmology 15
Study or subgroup NTG Normal control
6.1.1 OA PSV treated
6.1.2 OA PSV untreated
30.25
Mean
33.635.331.632.9
35.8736.8
30.431.528.435.5
25.4330.831.5
32.96128.934.934.9
30.1629.2
35.35
SD
11.210.71010
9.714914.110.5
7.68.1
10.89.8387
5.348.88.4
11.793210
5.42799.3
10.219.4
7.7769
Mean
40.141.737.739.738.945.8
36.63
30.130.835.831.432.932.8
39.55
36.64630.9
38.87535.9
30.7536
43.86
SD
16.918.81717
5.567816
14.5
9.910.68.4
13.41646.179.1
7.24
25.60438.4
10.63669.1
7.648.3
7.8092
Total
89626963782858
447
34251020446260
255
15133015152942
159
861
Total
59488155
1242251
440
17261320404044
200
1525
10015152935
234
874
Weight
4.7%3.7%5.3%4.5%8.5%2.2%4.8%
33.8%
4.3%4.5%2.4%2.8%8.3%6.5%7.4%
36.0%
0.9%3.4%7.6%3.2%3.3%5.1%6.6%
30.2%
100.0%
Abegão Pinto et al., 2012 [29]Abegão Pinto et al., 2012 [43]Abegão Pinto et al., 2013 [44]Abegão Pinto et al., 2014 [45]Kaiser et al., 1997 [57]Stalmans et al., 2009 [61]Willekens et al., 2014 [62]
Subtotal (95% CI)Heterogeneity: 𝜏2 = 0.00; 𝜒2 = 5.12, df = 6 (P = 0.53); I2 = 0%Test for overall effect: Z = 6.13 (P < 0.00001)
Butt et al., 1995 [47]Butt et al., 1997 [48]Fukukita et al., 2011 [52]Galambos et al., 2006 [53]Galassi et al., 2011 [54]Plange et al., 2009 [30]Zhong et al., 2009 [28]
Subtotal (95% CI)Heterogeneity: 𝜏2 = 14.17; 𝜒2 = 25.21, df = 6 (P = 0.0003); I2 = 76%Test for overall effect: Z = 1.91 (P = 0.06)
6.1.3 OA PSV mixed or not availableCellini et al., 1997 [49]Chiou et al., 1999 [50]Cristini and Cellini, 1997 [51]Harris et al., 1995 [55]Huber et al., 2004 [56]Plange et al., 2003 [58]Rojanapongpun et al., 1993 [60]
Subtotal (95% CI)Heterogeneity: 𝜏2 = 3.17; 𝜒2 = 9.05, df = 6 (P = 0.17); I2 = 34%Test for overall effect: Z = 3.85 (P = 0.0001)
Total (95% CI)Heterogeneity: 𝜏2 = 4.65; 𝜒2 = 39.38, df = 20 (P = 0.006); I2 = 49%
Test for overall effect: Z = 6.49 (P < 0.00001)
Test for subgroup differences: 𝜒2 = 0.82, df = 2 (P = 0.66); I2 = 0%
IV, random, 95% CIMean difference
−6.50 [−11.40, −1.60]−6.40 [−12.35, −0.45]−6.10 [−10.49, −1.71]−6.80 [−11.93, −1.67]−3.03 [−5.40, −0.66]−9.00 [−17.48, −0.52]−6.38 [−11.19, −1.57]−4.98 [−6.57, −3.39]
0.30 [−5.05, 5.65]0.70 [−4.47, 5.87]
−7.40 [−15.50, 0.70]4.10 [−3.19, 11.39]−7.47 [−9.95, −4.99]−2.00 [−5.57, 1.57]
−8.05 [−11.07, −5.03]−3.27 [−6.62, 0.08]
−3.69 [−17.95, 10.58]−2.00 [−8.36, 4.36]−3.98 [−6.82, −1.13]−1.00 [−7.58, 5.58]−0.59 [−7.04, 5.86]
−6.80 [−11.36, −2.24]−8.51 [−12.01, −5.01]−4.62 [−6.97, −2.27]
−4.66 [−6.07, −3.26]
IV, random, 95% CIMean difference
−10−20
NTG lower10 200
NTG higher
(a)
Heterogeneity: 𝜒2 = 13.39, df = 7 (P = 0.06); I2 = 48%
Test for overall effect: Z = 10.51 (P < 0.00001)
Heterogeneity: 𝜒2 = 6.07, df = 6 (P = 0.41); I2 = 1%
Test for overall effect: Z = 6.05 (P < 0.00001)
Heterogeneity: 𝜒2 = 9.11, df = 3 (P = 0.03); I2 = 67%
Test for overall effect: Z = 4.83 (P < 0.00001)
Heterogeneity: 𝜒2 = 30.96, df = 18 (P = 0.03); I2 = 42%
Test for overall effect: Z = 12.96 (P < 0.00001)
Test for subgroup differences: 𝜒2 = 2.38, df = 2 (P = 0.30); I2 = 16.1%
Study or subgroup
89 62 69 63 78 23 28
470
34 25 10 20 44 62 60 255
13 151529 72
58
797
Total
10.3210.6 10.7 10.6 9.24
129.1
10.31
12.812.4 9.899.8
11.41 7.6
10.04
9.3 8.5
7.2 7.49
Mean
3.584
3.4 3.5
2.93.43.1
9.17.9
3.31 3.1305
1.83.09
2.81.81.9 1.6
1.7664
1.96
SD
12 12.1 11.9 12.9 11.1 14.5 14
11.16
13.4 13
11.3 11.1 12.14
9.312.36
9.6 8.7
9.03 9.8
Mean
4.38 4
4.34.4
1.1136 4.7 3.5 4.6
6.36.23.1
2.2361 1.81.9
3.52.2
1.59 2.2
2.84
SD
59 4881
1242822 51
172613 20 40 40 44 200
2515 15 29 84
752
468
55
Total
33.8%
3.6% 2.9% 4.3% 3.1%
53.7%
1.5% 1.7% 2.9%
0.4%0.4%0.9% 2.3% 10.0%11.9%4.9%
30.8%
15.4%
1.5% 3.1% 4.1% 6.6%
100.0%
WeightNTG Normal control
−1.68 [−1.94, −1.43]
−1.68 [−3.02, −0.34]−1.50 [−3.01, 0.01]−1.20 [−2.43, 0.03]−2.30 [−3.75, −0.85]−1.86 [−2.30, −1.42]−2.50 [−4.61, −0.39]−4.90 [−6.83, −2.97]−0.85 [−2.34, 0.64]
−0.60 [−4.88, 3.68]−0.60 [−4.51, 3.31]−1.41 [−4.06, 1.24]−1.30 [−2.99, 0.39]−0.73 [−1.53, 0.07]−1.70 [−2.44, −0.96]−2.32 [−3.47, −1.17]
−0.30 [−2.35, 1.75]−0.20 [−1.64, 1.24]−1.54 [−2.79, −0.29]−2.60 [−3.59, −1.61]
−1.86 [−2.21, −1.52]
−1.42 [−1.88, −0.96]
−1.60 [−2.25, −0.95]
IV, fixed, 95% CIMean difference
6.4.1 CRA PSV treated
6.4.2 CRA PSV untreated
Abegão Pinto et al., 2012 [29]Abegão Pinto et al., 2012 [43]Abegão Pinto et al., 2013 [44]Abegão Pinto et al., 2014 [45]Kaiser et al., 1997 [57]
Stalmans et al., 2009 [61]Willekens et al., 2014 [62]
Subtotal (95% CI)
Butt et al., 1995 [47]Butt et al., 1997 [48]Fukukita et al., 2011 [52]Galambos et al., 2006 [53]Galassi et al., 2011 [54]Plange et al., 2009 [30]Zhong et al., 2009 [28]
Subtotal (95% CI)
6.4.3 CRA PSV mixed or not availableChiou et al., 1999 [50]Harris et al., 1995 [55]Huber et al., 2004 [56]Plange et al., 2003 [58]
Subtotal (95% CI)
Total (95% CI)
IV, fixed, 95% CIMean difference
−2−4
NTG lower
2 40
NTG higher
Rankin et al., 1995 [59]
(b)
Figure 4: Forest plot of PSV in OA and CRA.
16 Journal of Ophthalmology
6.7.1 NPCA PSV treatedAbegão Pinto et al., 2012 [29]Abegão Pinto et al., 2012 [43]Abegão Pinto et al., 2013 [44]Abegão Pinto et al., 2014 [45]Kaiser et al., 1997 [57]
Stalmans et al., 2009 [61]Willekens et al., 2014 [62]
6.7.2 NPCA PSV untreatedFukukita et al., 2011 [52]Plange et al., 2009 [30]
6.7.3 NPCA PSV mixed or not availableChiou et al., 1999 [50]Plange et al., 2003 [58]
Subtotal (95% CI)
Subtotal (95% CI)
Subtotal (95% CI)
Total (95% CI)
Heterogeneity: 𝜏2 = 0.97; 𝜒2 = 30.30, df = 7 (P < 0.0001); I2 = 77%
Test for overall effect: Z = 3.39 (P = 0.0007)
Heterogeneity: 𝜏2 = 0.26; 𝜒2 = 1.38, df = 1 (P = 0.24); I2 = 28%Test for overall effect: Z = 0.77 (P = 0.44)
Heterogeneity: 𝜏2 = 0.24; 𝜒2 = 1.32, df = 1 (P = 0.25); I2 = 24%Test for overall effect: Z = 2.55 (P = 0.01)
Heterogeneity: 𝜏2 = 0.64; 𝜒2 = 37.03, df = 11 (P = 0.0001); I2 = 70%
Test for overall effect: Z = 4.01 (P < 0.0001)
Test for subgroup differences: 𝜒2 = 2.32, df = 2 (P = 0.31); I2 = 13.7%
Study or subgroup
8962696378232858
470
106272
132942
584
Total
8.588.2
9.519.52
10.469
10.19.22
9.036.9
7.46.8
Mean
2.692.62.83
2.64951.93.52.7
3.231.5
3.61.2
SD
11.0811.69.2910.8
11.279.6
12.810.29
8.367.6
7.78.5
Mean
3.764
2.74.1
1.11361.94.53.3
1.61.8
2.91.7
SD
59488155
124282251
468
134053
252954
575
Total
8.9%7.9%
10.2%7.9%
11.6%9.3%4.3%8.8%
68.9%
4.6%11.3%15.9%
4.4%10.9%15.2%
100.0%
WeightNTG Normal control
−2.50 [−3.61, −1.39]−3.40 [−4.70, −2.10]0.22 [−0.66, 1.10]−1.28 [−2.59, 0.03]−0.81 [−1.43, −0.19]−0.60 [−1.65, 0.45]−2.70 [−4.98, −0.42]−1.07 [−2.21, 0.07]
0.67 [−1.51, 2.85]−0.70 [−1.37, −0.03]
−0.30 [−2.56, 1.96]−1.70 [−2.46, −0.94]
−1.39 [−2.19, −0.59]
−0.42 [−1.50, 0.65]
−1.42 [−2.52, −0.33]
−1.18 [−1.75, −0.60]
IV, random, 95% CIMean difference
−2−4
NTG lower
2 40
NTG higher
IV, random, 95% CIMean difference
Rankin et al., 1995 [59]
(a)
Study or subgroup
8962696378232858
470
106272
132942
584
Total
9.129.29.2
9.549.77
910.19.07
8.767.3
7.57.3
Mean
2.813.12.73.3
1.76642.24
2.3
2.532.3
2.41.3
SD
1111.58.9711.1
11.1210
12.810.1
10.27.5
8.48.4
Mean
3.873.92.43.7
1.11362.13.93.5
2.81.7
2.61.9
SD
59488155
124282251
468
134053
252954
575
Total
8.3%6.9%
11.2%7.4%
15.3%8.0%3.4%8.4%
68.7%
3.4%11.6%15.1%
5.2%11.0%16.3%
100.0%
WeightNTG Normal control
6.10.1 TPCA PSV treatedAbegão Pinto et al., 2012 [29]Abegão Pinto et al., 2012 [43]Abegão Pinto et al., 2013 [44]Abegão Pinto et al., 2014 [45]Kaiser et al., 1997 [57]
Stalmans et al., 2009 [61]Willekens et al., 2014 [62]
6.10.2 TPCA PSV untreatedFukukita et al., 2011 [52]Plange et al., 2009 [30]
6.10.3 TPCA PSV mixed or not availableChiou et al., 1999 [50]Plange et al., 2003 [58]
Subtotal (95% CI)
Subtotal (95% CI)
Subtotal (95% CI)
Total (95% CI)
IV, random, 95% CIMean difference
−1.88 [−3.03, −0.73]−2.30 [−3.65, −0.95]0.23 [−0.59, 1.05]
−1.56 [−2.83, −0.29]−1.35 [−1.79, −0.91]−1.00 [−2.19, 0.19]−2.70 [−4.90, −0.50]−1.03 [−2.16, 0.10]
−1.44 [−3.63, 0.75]−0.20 [−0.98, 0.58]
−0.90 [−2.56, 0.76]−1.10 [−1.94, −0.26]
−1.28 [−1.88, −0.69]
−0.38 [−1.24, 0.48]
−1.06 [−1.81, −0.31]
−1.11 [−1.56, −0.66]
Heterogeneity: 𝜏2 = 0.40; 𝜒2 = 18.22, df = 7 (P = 0.01); I2 = 62%
Test for overall effect: Z = 4.22 (P < 0.0001)
Heterogeneity: 𝜏2 = 0.07; 𝜒2 = 1.10, df = 1 (P = 0.29); I2 = 9%
Test for overall effect: Z = 0.87 (P = 0.38)
Heterogeneity: 𝜏2 = 0.00; 𝜒2 = 0.04, df = 1 (P = 0.83); I2 = 0%
Test for overall effect: Z = 2.78 (P = 0.005)
Heterogeneity: 𝜏2 = 0.30; 𝜒2 = 23.90, df = 11 (P = 0.01); I2 = 54%
Test for overall effect: Z = 4.82 (P < 0.00001)
Test for subgroup differences: 𝜒2 = 2.86, df = 2 (P = 0.24); I2 = 30.0%
IV, random, 95% CIMean difference
−2−4
NTG lower
2 40
NTG higher
Rankin et al., 1995 [59]
(b)
Figure 5: Forest plot of PSV in NPCA and TPCA.
pathways depending on low ocular perfusion pressure (OPP)[82]: lowOPP (which could be caused by vascular factors andIOP increase) might decrease mitochondria energy state inthe retinal ganglion cells (RGCs) or reduce nutrient flow ofthe RGC axons. Then, oxidative stress due to reactive oxygenspecies (ROS) led to RGC apoptosis. Low OPP may alsocause abnormal vascular autoregulation and neurovascular
coupling, which also functioned on RGC losses. The result ofthis meta-analysis is a strong support of the vascular theoryof glaucoma and it suggests that retrobulbar ischemia hasinfluence on not only the ONH but also the retina. Based onvascular theory of glaucoma [82], we have the reason to sup-pose that reduction of blood flow caused by vascular abnor-mality in the CRA probably leads to ischemia of the inner
Journal of Ophthalmology 17
6.79 3.32 89 7.35 4.36 59 5.7%7.5 3.5 62 8.3 5.3 48 5.3%
5.81 3.7 69 6.85 3.9 81 5.8%6.03 3.8 63 7.96 4.6 55 5.5%7.68 2.6495 78 9.15 2.2271 124 6.2%7.4 3.1 28 10.4 6.1 22 4.0%
5.24 2.3 58 6.55 4.1 51 5.8%447 440 38.4%
6.6 2.9 34 8.4 2.9 17 5.3%7.1 2.9 25 8.3 3.1 26 5.4%
7.71 3.73 10 8.03 2.4 13 4.2%7.8 3.5777 20 7.6 5.8138 20 3.8%
5.87 1.17 44 11.41 2.3 40 6.2%7.8 3.2 62 7.4 3.5 40 5.7%
8.37 2.93 60 12.64 4.36 44 5.5%255 200 36.1%
4.3 1.5 13 5 2.5 25 5.8%4.8 2.3 15 9.9 5.2 15 4.0%
7.97 2.84 15 6.85 3.25 15 4.7%8.1 3.3 29 8.1 3.7 29 5.2%
8.96 2.6571 42 11.92 2.6031 35 5.9%114 119 25.5%
816 759 100.0%
Study or subgroupTotalMean SD Mean SD Total
WeightIV, random, 95% CI
NTG Normal controlIV, random, 95% CI
Mean difference Mean difference
6.2.1 OA EDV treatedAbegão Pinto et al., 2012 [29]Abegão Pinto et al., 2012 [43]Abegão Pinto et al., 2013 [44]Abegão Pinto et al., 2014 [45]Kaiser et al., 1997 [57]
6.2.2 OA EDV untreatedButt et al., 1995 [47]Butt et al., 1997 [48]Fukukita et al., 2011 [52]Galambos et al., 2006 [53]Galassi et al., 2011 [54]Plange et al., 2009 [30]Zhong et al., 2009 [28]
6.2.3 OA EDV mixed or not availableChiou et al., 1999 [50]Harris et al., 1995 [55]Huber et al., 2004 [56]Plange et al., 2003 [58]Rojanapongpun et al., 1993 [60]
Subtotal (95% CI)
Subtotal (95% CI)
Subtotal (95% CI)
Total (95% CI)
Heterogeneity: 𝜏2 = 0.00; 𝜒2 = 4.01, df = 6 (P = 0.68); I2 = 0%Test for overall effect: Z = 5.61 (P < 0.00001)
Test for overall effect: Z = 1.57 (P = 0.12)
Heterogeneity: 𝜏2 = 3.36; 𝜒2 = 138.67, df = 18 (P < 0.00001); I2 = 87%Test for overall effect: Z = 3.46 (P = 0.0005)
Test for subgroup differences: 𝜒2 = 0.29, df = 2 (P = 0.87); I2 = 0%
−0.56 [−1.87, 0.75]−0.80 [−2.53, 0.93]−1.04 [−2.26, 0.18]−1.93 [−3.47, −0.39]−1.47 [−2.18, −0.76]−3.00 [−5.80, −0.20]−1.31 [−2.58, −0.04]
−1.80 [−3.49, −0.11]−1.20 [−2.85, 0.45]−0.32 [−2.97, 2.33]0.20 [−2.79, 3.19]
−5.54 [−6.33, −4.75]0.40 [−0.95, 1.75]
−4.27 [−5.76, −2.78]
−0.70 [−1.97, 0.57]−5.10 [−7.98, −2.22]1.12 [−1.06, 3.30]0.00 [−1.80, 1.80]
−2.96 [−4.14, −1.78]
−1.31 [−1.77, −0.85]
−1.90 [−4.03, 0.23]
−1.42 [−3.19, 0.36]
−1.61 [−2.53, −0.70]
−5−10
NTG lower
5 100
NTG higher
Heterogeneity: 𝜏2 = 7.38; 𝜒2 = 80.74, df = 6 (P < 0.00001); I2 = 93%Test for overall effect: Z = 1.75 (P = 0.08)
Heterogeneity: 𝜏2 = 3.18; 𝜒2 = 21.60, df = 4 (P = 0.0002); I2 = 81%
Stalmans et al., 2009 [61]Willekens et al., 2014 [62]
(a)
797 752 100.0%
2.87 1.08 89 3.1 1.12 592.8 0.98 62 3.2 1.2 48
2.96 1.1 69 3.2 1.2 812.88 0.9 63 3.55 1.3 55
78 3.23 0.7795 12423 4.5 1.5 2828 3.7 1.2 2258 3 1.3 51
470 468 47.7%
34 2.6 1725 3 2610 4.18 1320 3.3 2044 5.67 4062 2.9 4060 4.77 44
255 200 32.7%
13 2.07 0.78 2515 2.5 1.1 1515 3.17 1.4 1529 3.2 0.7 2972 84 19.6%
Study or subgroupTotalMean SD Mean SD Total
WeightIV, random, 95% CI
NTG Normal controlIV, random, 95% CI
Mean difference Mean difference
6.5.1 CRA EDV treatedAbegão Pinto et al., 2012 [29]Abegão Pinto et al., 2012 [43]Abegão Pinto et al., 2013 [44]Abegão Pinto et al., 2014 [45]Kaiser et al., 1997 [57]
6.5.2 CRA EDV untreatedButt et al., 1995 [47]Butt et al., 1997 [48]Fukukita et al., 2011 [52]Galambos et al., 2006 [53]Galassi et al., 2011 [54]Plange et al., 2009 [30]Zhong et al., 2009 [28]
6.5.3 CRA EDV mixed or not availableChiou et al., 1999 [50]Harris et al., 1995 [55]Huber et al., 2004 [56]Plange et al., 2003 [58]
Subtotal (95% CI)
Subtotal (95% CI)
Subtotal (95% CI)
Total (95% CI)
−0.23 [−0.59, 0.13]−0.40 [−0.82, 0.02]−0.24 [−0.61, 0.13]−0.67 [−1.08, −0.26]−0.94 [−1.18, −0.70]−1.30 [−2.07, −0.53]−0.80 [−1.40, −0.20]−0.08 [−0.52, 0.36]
−0.70 [−1.69, 0.29]−1.30 [−2.24, −0.36]−1.30 [−2.23, −0.37]−0.60 [−1.58, 0.38]−1.95 [−2.36, −1.54]−0.90 [−1.26, −0.54]−1.28 [−1.86, −0.70]
0.02 [−0.70, 0.74]−1.30 [−2.09, −0.51]−1.78 [−2.58, −0.98]−1.40 [−1.81, −0.99]
−0.54 [−0.82, −0.27]
−1.21 [−1.63, −0.78]
−1.12 [−1.83, −0.40]
−0.88 [−1.14, −0.62]
6.4%6.1%6.4%6.2%6.9%4.5%5.3%6.0%
3.6%3.8%3.8%3.6%6.2%6.4%5.4%
4.7%4.4%4.3%6.2%
1.61.61.061.78891.110.91.77
2.293.22.92.92
1.91.72.882.73.722
3.49
2.091.21.391.8
0.88321.30.91
1.91.81.171.34160.770.90.99
1.21.10.740.9
Heterogeneity: 𝜏2 = 0.11; 𝜒2 = 25.28, df = 7 (P = 0.0007); I2 = 72%Test for overall effect: Z = 3.86 (P = 0.0001)
Heterogeneity: 𝜏2 = 0.19; 𝜒2 = 17.62, df = 6 (P = 0.007); I2 = 66%Test for overall effect: Z = 5.61 (P < 0.00001)
Heterogeneity: 𝜏2 = 0.41; 𝜒2 = 13.98, df = 3 (P = 0.003); I2 = 79%Test for overall effect: Z = 3.07 (P = 0.002)
Heterogeneity: 𝜏2 = 0.24; 𝜒2 = 90.79, df = 18 (P < 0.00001); I2 = 80%
Test for overall effect: Z = 6.58 (P < 0.00001)
Test for subgroup differences: 𝜒2 = 7.58, df = 2 (P = 0.02); I2 = 73.6%
−2−4
NTG lower
2 40
NTG higher
Rankin et al., 1995 [59]Stalmans et al., 2009 [61]Willekens et al., 2014 [62]
(b)
Figure 6: Forest plot of EDV in OA and CRA.
18 Journal of Ophthalmology
2.92 0.99 89 3.53 1.53 59 9.3%2.8 0.9 62 3.6 1.6 48 8.7%3.2 69 3.13 1.1 81 10.4%
3.33 1.2 63 3.81 1.7 55 8.3%2.81 0.8832 78 3.57 0.8908 124 11.2%2.8 1
1
23 3.4 1
1
28 8.2%3.4 1.3 28 4.3 2 22 4.8%
3.16 58 3.28 1.3 51 9.3%470 468 70.3%
3.18 1.4 10 3.43 1.1 13 4.3%2.2 0.9 62 2.7 0.7 40 10.6%
72 53 15.0%
2.1 1.7 13 1.8 0.9 25 4.7%2.1 0.8 29 3.5 0.6 29 10.1%
42 54 14.8%
584 575 100.0%
Study or subgroupTotalMean SD Mean SD Total
WeightIV, random, 95% CI
NTG Normal controlIV, random, 95% CI
Mean difference Mean difference
6.8.1 NPCA EDV treatedAbegão Pinto et al., 2012 [29]Abegão Pinto et al., 2012 [43]Abegão Pinto et al., 2013 [44]Abegão Pinto et al., 2014 [45]Kaiser et al., 1997 [57]
Subtotal (95% CI)Heterogeneity: 𝜏2 = 0.09; 𝜒2 = 20.40, df = 7 (P = 0.005); I2 = 66%Test for overall effect: Z = 3.53 (P = 0.0004)
6.8.2 NPCA EDV untreatedFukukita et al., 2011 [52]Plange et al., 2009 [30]
Subtotal (95% CI)
Test for overall effect: Z = 3.15 (P = 0.002)
6.8.3 NPCA EDV mixed or not availableChiou et al., 1999 [50]Plange et al., 2003 [58]
Subtotal (95% CI)Heterogeneity: 𝜏2 = 1.30; 𝜒2 = 9.99, df = 1 (P = 0.002); I2 = 90%Test for overall effect: Z = 0.73 (P = 0.47)
Total (95% CI)Heterogeneity: 𝜏2 = 0.15; 𝜒2 = 45.01, df = 11 (P < 0.00001); I2 = 76%
Test for overall effect: Z = 3.91 (P < 0.0001)
Test for subgroup differences: 𝜒2 = 0.02, df = 2 (P = 0.99) I2 = 0%
−0.61 [−1.05, −0.17]−0.80 [−1.31, −0.29]0.07 [−0.27, 0.41]−0.48 [−1.02, 0.06]−0.76 [−1.01, −0.51]−0.60 [−1.15, −0.05]−0.90 [−1.86, 0.06]−0.12 [−0.56, 0.32]
−0.25 [−1.30, 0.80]−0.50 [−0.81, −0.19]
0.30 [−0.69, 1.29]−1.40 [−1.76, −1.04]
−0.49 [−0.76, −0.22]
−0.48 [−0.78, −0.18]
−0.61 [−2.28, 1.05]
−0.54 [−0.81, −0.27]
−2−4
NTG lower
2 40
NTG higher
Heterogeneity: 𝜏2 = 0.00; 𝜒2 = 0.20, df = 1 (P = 0.66); I2 = 0%
;
Rankin et al., 1995 [59]Stalmans et al., 2009 [61]Willekens et al., 2014 [62]
(a)
−2−4
NTG lower
2 40
NTG higher
3.06 1.09 89 3.45 1.36 59 9.4%3.1 1.2 62 3.6 1.5 48 7.9%
3.06 0.9 69 3.08 0.9 81 11.3%3.22 1.2 63 3.8 1.4 55 8.5%2.91 0.8832 78 3.57 0.8908 124 11.9%2.9 0.85 23 3.8 1.3 28 6.9%3.4 1.5 28 4.3 1.7 22 4.1%3 0.8 58 3.31 1.4 51 9.1%
470 468 69.1%
2.95 0.93 10 3.95 1.27 13 4.2%2.3 62 2.8 0.7 40 10.7%
72 53 14.9%
2.1 0.74 13 2.1 0.98 25 7.4%2.2 1
1
29 3.5 0.8 29 8.6%42 54 16.0%
584 575 100.0%
Study or subgroupTotalMean SD Mean SD Total
WeightIV, random, 95% CI
NTG Normal controlIV, random, 95% CI
Mean difference Mean difference
6.11.1 TPCA EDV treatedAbegão Pinto et al., 2012 [29]Abegão Pinto et al., 2012 [43]Abegão Pinto et al., 2013 [44]Abegão Pinto et al., 2014 [45]Kaiser et al., 1997 [57]
Subtotal (95% CI)
Subtotal (95% CI)
Subtotal (95% CI)
Heterogeneity: 𝜏2 = 0.05; 𝜒2 = 15.15, df = 7 (P = 0.03); I2 = 54%Test for overall effect: Z = 4.14 (P < 0.0001)
6.11.2 TPCA EDV untreatedFukukita et al., 2011 [52]Plange et al., 2009 [30]
Heterogeneity: 𝜏2 = 0.01; 𝜒2 = 1.05, df = 1 (P = 0.31); I2 = 4%Test for overall effect: Z = 3.32 (P = 0.0009)
6.11.3 TPCA EDV mixed or not availableChiou et al., 1999 [50]Plange et al., 2003 [58]
Heterogeneity: 𝜏2 = 0.78; 𝜒2 = 12.33, df = 1 (P = 0.0004); I2 = 92%
Total (95% CI)
Test for subgroup differences: 𝜒2 = 0.28, df = 2 (P = 0.87); I2 = 0%
−0.39 [−0.80, 0.02]−0.50 [−1.02, 0.02]−0.02 [−0.31, 0.27]−0.58 [−1.05, −0.11]−0.66 [−0.91, −0.41]−0.90 [−1.49, −0.31]−0.90 [−1.80, 0.00]−0.31 [−0.75, 0.13]
−1.00 [−1.90, −0.10]−0.50 [−0.83, −0.17]
0.00 [−0.56, 0.56]−1.30 [−1.77, −0.83]
−0.47 [−0.69, −0.25]
−0.57 [−0.90 , −0.23]
−0.66 [−1.93, 0.61]
−0.54 [−0.76, −0.32]
Test for overall effect: Z = 1.01 (P = 0.31)
Heterogeneity: 𝜏2 = 0.09; 𝜒2 = 31.38, df = 11 (P = 0.0010); I2 = 65%Test for overall effect: Z = 4.85 (P < 0.00001)
Rankin et al., 1995 [59]Stalmans et al., 2009 [61]Willekens et al., 2014 [62]
(b)
Figure 7: Forest plot of EDV in NPCA and TPCA.
retina on NTG process and finally results in apoptosis ofganglion cells. Low RNFL thickness in NTG patients isexactly the manifestation of apoptosis of ganglion cells.
There are several limitations of this meta-analysis tobe considered. Firstly, the included studies are essentiallyobservational studies which means there are no interventionmeasures from researchers in the studies. Compared withexperimental studies, observational study is more likely to
be affected by bias risks. Secondly, only studies publishedin English were searched and selected, which might lead toa risk of English language bias. Furthermore, in a part ofthe patients there existed various preexisting comorbiditieswhose detailed information was not completely given inthe studies, which might possibly affect blood flow. Finally,different characteristics of the study populations, differentinclusion criteria of NTG patients and normal controls,
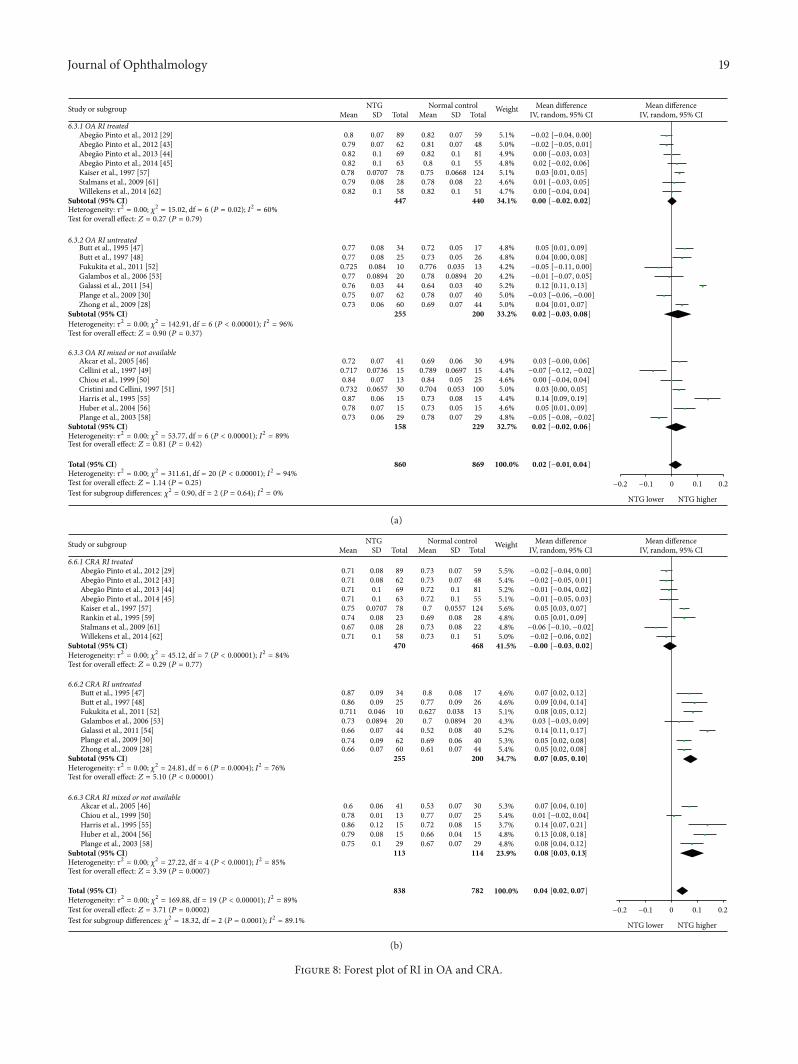
Journal of Ophthalmology 19
0.8 0.07 89 0.82 0.07 59 5.1%0.79 0.07 62 0.81 0.07 48 5.0%0.82 0.1 69 0.82 0.1 81 4.9%0.82 0.1 63 0.8 0.1 55 4.8%0.78 0.0707 78 0.75 0.0668 124 5.1%0.79 0.08 28 0.78 0.08 22 4.6%0.82 0.1 58 0.82 0.1 51 4.7%
447 440 34.1%
0.77 0.08 34 0.72 0.05 17 4.8%0.77 0.08 25 0.73 0.05 26 4.8%
0.725 0.084 10 0.776 0.035 13 4.2%0.77 0.0894 20 0.78 0.0894 20 4.2%0.76 0.03 44 0.64 0.03 40 5.2%0.75 0.07 62 0.78 0.07 40 5.0%0.73 0.06 60 0.69 0.07 44 5.0%
255 200 33.2%
0.72 0.07 41 0.69 0.06 30 4.9%0.717 0.0736 15 0.789 0.0697 15 4.4%0.84 0.07 13 0.84 0.05 25 4.6%
0.732 0.0657 30 0.704 0.053 100 5.0%0.87 0.06 15 0.73 0.08 15 4.4%0.78 0.07 15 0.73 0.05 15 4.6%0.73 0.06 29 0.78 0.07 29 4.8%
158 229 32.7%
860 869 100.0%
Study or subgroupTotalMean SD Mean SD Total
WeightIV, random, 95% CI
NTG Normal controlIV, random, 95% CI
Mean difference Mean difference
6.3.1 OA RI treatedAbegão Pinto et al., 2012 [29]Abegão Pinto et al., 2012 [43]Abegão Pinto et al., 2013 [44]Abegão Pinto et al., 2014 [45]Kaiser et al., 1997 [57]
Subtotal (95% CI)Heterogeneity: 𝜏2 = 0.00; 𝜒2 = 15.02, df = 6 (P = 0.02); I2 = 60%Test for overall effect: Z = 0.27 (P = 0.79)
6.3.2 OA RI untreatedButt et al., 1995 [47]Butt et al., 1997 [48]Fukukita et al., 2011 [52]Galambos et al., 2006 [53]Galassi et al., 2011 [54]Plange et al., 2009 [30]Zhong et al., 2009 [28]
Subtotal (95% CI)Heterogeneity: 𝜏2 = 0.00; 𝜒2 = 142.91, df = 6 (P < 0.00001); I2 = 96%Test for overall effect: Z = 0.90 (P = 0.37)
Akcar et al., 2005 [46]Cellini et al., 1997 [49]Chiou et al., 1999 [50]Cristini and Cellini, 1997 [51]Harris et al., 1995 [55]Huber et al., 2004 [56]Plange et al., 2003 [58]
Subtotal (95% CI)Heterogeneity: 𝜏2 = 0.00; 𝜒2 = 53.77, df = 6 (P < 0.00001); I2 = 89%Test for overall effect: Z = 0.81 (P = 0.42)
Total (95% CI)Heterogeneity: 𝜏2 = 0.00; 𝜒2 = 311.61, df = 20 (P < 0.00001); I2 = 94%
Test for subgroup differences: 𝜒2 = 0.90, df = 2 (P = 0.64); I2 = 0%
6.3.3 OA RI mixed or not available
−0.02 [−0.04, 0.00]−0.02 [−0.05, 0.01]0.00 [−0.03, 0.03]0.02 [−0.02, 0.06]0.03 [0.01, 0.05]0.01 [−0.03, 0.05]0.00 [−0.04, 0.04]
0.05 [0.01, 0.09]0.04 [0.00, 0.08]
−0.05 [−0.11, 0.00]−0.01 [−0.07, 0.05]0.12 [0.11, 0.13]
−0.03 [−0.06, −0.00]0.04 [0.01, 0.07]
0.03 [−0.00, 0.06]−0.07 [−0.12, −0.02]0.00 [−0.04, 0.04]0.03 [0.00, 0.05]0.14 [0.09, 0.19]0.05 [0.01, 0.09]
−0.05 [−0.08, −0.02]
0.00 [−0.02, 0.02]
0.02 [−0.03, 0.08]
0.02 [−0.02, 0.06]
0.02 [−0.01, 0.04]
0.1 0.2
NTG lower NTG higher
−0.1−0.2 0Test for overall effect: Z = 1.14 (P = 0.25)
Stalmans et al., 2009 [61]Willekens et al., 2014 [62]
(a)
0.1 0.2
NTG lower NTG higher
−0.1−0.2 0
0.71 0.08 89 0.73 0.07 59 5.5%0.71 0.08 62 0.73 0.07 48 5.4%0.71 0.1 69 0.72 0.1 81 5.2%0.71 0.1 63 0.72 0.1 55 5.1%0.75 0.0707 78 0.7 0.0557 124 5.6%0.74 0.08 23 0.69 0.08 28 4.8%0.67 0.08 28 0.73 0.08 22 4.8%0.71 0.1 58 0.73 0.1 51 5.0%
470 468 41.5%
0.87 0.09 34 0.8 0.08 17 4.6%0.86 0.09 25 0.77 0.09 26 4.6%
0.711 0.046 10 0.627 0.038 13 5.1%0.73 0.0894 20 0.7 0.0894 20 4.3%0.66 0.07 44 0.52 0.08 40 5.2%0.74 0.09 62 0.69 0.06 40 5.3%0.66 0.07 60 0.61 0.07 44 5.4%
255 200 34.7%
0.6 0.06 41 0.53 0.07 30 5.3%0.78 0.01 13 0.77 0.07 25 5.4%0.86 0.12 15 0.72 0.08 15 3.7%0.79 0.08 15 0.66 0.04 15 4.8%0.75 0.1 29 0.67 0.07 29 4.8%
113 114 23.9%
838 782 100.0%
Study or subgroupTotalMean SD Mean SD Total
WeightIV, random, 95% CI
NTG Normal controlIV, random, 95% CI
Mean difference Mean difference
6.6.1 CRA RI treatedAbegão Pinto et al., 2012 [29]Abegão Pinto et al., 2012 [43]Abegão Pinto et al., 2013 [44]Abegão Pinto et al., 2014 [45]Kaiser et al., 1997 [57]
Subtotal (95% CI)Heterogeneity: 𝜏2 = 0.00; 𝜒2 = 45.12, df = 7 (P < 0.00001); I2 = 84%Test for overall effect: Z = 0.29 (P = 0.77)
6.6.2 CRA RI untreatedButt et al., 1995 [47]Butt et al., 1997 [48]Fukukita et al., 2011 [52]Galambos et al., 2006 [53]Galassi et al., 2011 [54]Plange et al., 2009 [30]Zhong et al., 2009 [28]
Subtotal (95% CI)Heterogeneity: 𝜏2 = 0.00; 𝜒2 = 24.81, df = 6 (P = 0.0004); I2 = 76%Test for overall effect: Z = 5.10 (P < 0.00001)
Akcar et al., 2005 [46]Chiou et al., 1999 [50]Harris et al., 1995 [55]Huber et al., 2004 [56]Plange et al., 2003 [58]
Subtotal (95% CI)Heterogeneity: 𝜏2 = 0.00; 𝜒2 = 27.22, df = 4 (P < 0.0001); I2 = 85%Test for overall effect: Z = 3.39 (P = 0.0007)
Total (95% CI)Heterogeneity: 𝜏2 = 0.00; 𝜒2 = 169.88, df = 19 (P < 0.00001); I2 = 89%Test for overall effect: Z = 3.71 (P = 0.0002)
Test for subgroup differences: 𝜒2 = 18.32, df = 2 (P = 0.0001); I2 = 89.1%
6.6.3 CRA RI mixed or not available
−0.02 [−0.04, 0.00]−0.02 [−0.05, 0.01]−0.01 [−0.04, 0.02]−0.01 [−0.05, 0.03]0.05 [0.03, 0.07]0.05 [0.01, 0.09]
−0.06 [−0.10, −0.02]−0.02 [−0.06, 0.02]
0.07 [0.02, 0.12]0.09 [0.04, 0.14]0.08 [0.05, 0.12]0.03 [−0.03, 0.09]0.14 [0.11, 0.17]0.05 [0.02, 0.08]0.05 [0.02, 0.08]
0.07 [0.04, 0.10]0.01 [−0.02, 0.04]0.14 [0.07, 0.21]0.13 [0.08, 0.18]0.08 [0.04, 0.12]
−0.00 [−0.03, 0.02]
0.07 [0.05, 0.10]
0.08 [0.03, 0.13]
0.04 [0.02, 0.07]
Rankin et al., 1995 [59]Stalmans et al., 2009 [61]Willekens et al., 2014 [62]
(b)
Figure 8: Forest plot of RI in OA and CRA.
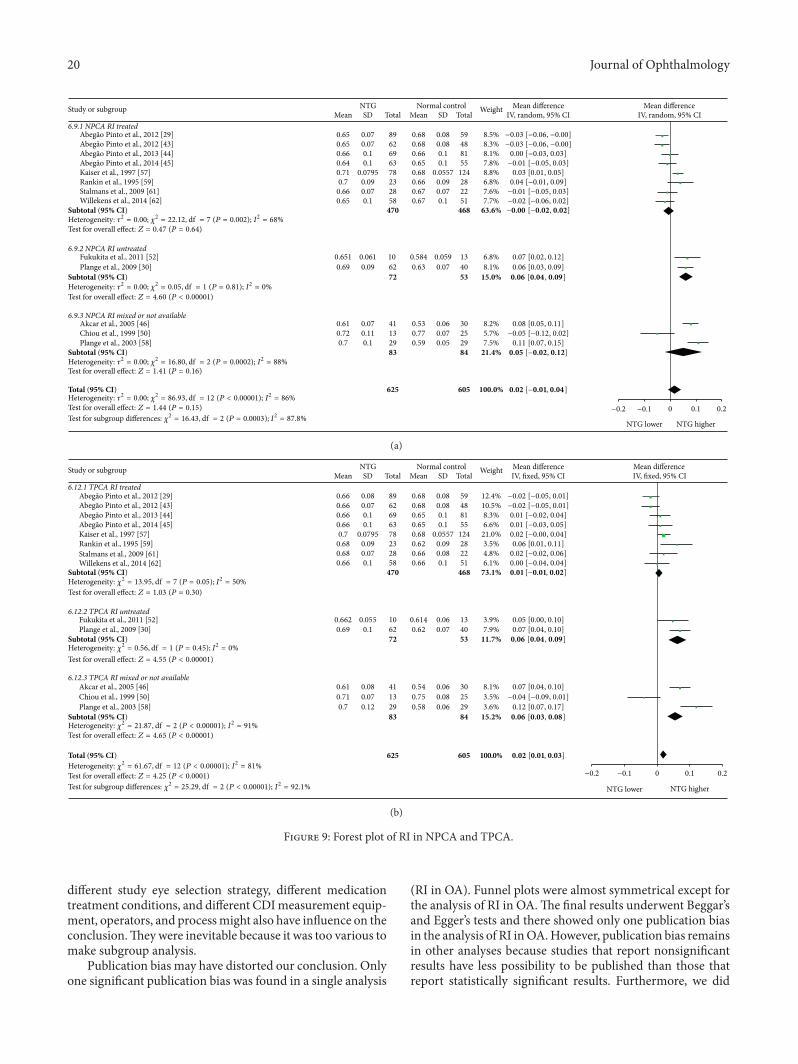
20 Journal of Ophthalmology
0.65 0.07 89 0.68 0.08 59 8.5%0.65 0.07 62 0.68 0.08 48 8.3%0.66 0.1 69 0.66 0.1 81 8.1%0.64 0.1 63 0.65 0.1 55 7.8%0.71 0.0795 78 0.68 0.0557 124 8.8%0.7 0.09 23 0.66 0.09 28 6.8%
0.66 0.07 28 0.67 0.07 22 7.6%0.65 0.1 58 0.67 0.1 51 7.7%
470 468 63.6%
0.651 0.061 10 0.584 0.059 13 6.8%0.69 0.09 62 0.63 0.07 40 8.1%
72 53 15.0%
0.61 0.07 41 0.53 0.06 30 8.2%0.72 0.11 13 0.77 0.07 25 5.7%0.7 0.1 29 0.59 0.05 29 7.5%
83 84 21.4%
625 605 100.0%
Study or subgroupTotalMean SD Mean SD Total
WeightIV, random, 95% CI
NTG Normal controlIV, random, 95% CI
Mean difference Mean difference
6.9.1 NPCA RI treated
Abegão Pinto et al., 2013 [44]Abegão Pinto et al., 2014 [45]Kaiser et al., 1997 [57]
Subtotal (95% CI)Heterogeneity: 𝜏2 = 0.00; 𝜒2 = 22.12, df = 7 (P = 0.002); I2 = 68%Test for overall effect: Z = 0.47 (P = 0.64)
6.9.2 NPCA RI untreatedFukukita et al., 2011 [52]Plange et al., 2009 [30]
Subtotal (95% CI)Heterogeneity: 𝜏2 = 0.00; 𝜒2 = 0.05, df = 1 (P = 0.81); I2 = 0%
Test for overall effect: Z = 4.60 (P < 0.00001)
6.9.3 NPCA RI mixed or not availableAkcar et al., 2005 [46]Chiou et al., 1999 [50]Plange et al., 2003 [58]
Subtotal (95% CI)Heterogeneity: 𝜏2 = 0.00; 𝜒2 = 16.80, df = 2 (P = 0.0002); I2 = 88%Test for overall effect: Z = 1.41 (P = 0.16)
Total (95% CI)Heterogeneity: 𝜏2 = 0.00; 𝜒2 = 86.93, df = 12 (P < 0.00001); I2 = 86%Test for overall effect: Z = 1.44 (P = 0.15)
Test for subgroup differences: 𝜒2 = 16.43, df = 2 (P = 0.0003); I2 = 87.8%
−0.03 [−0.06, −0.00]−0.03 [−0.06, −0.00]0.00 [−0.03, 0.03]−0.01 [−0.05, 0.03]0.03 [0.01, 0.05]0.04 [−0.01, 0.09]−0.01 [−0.05, 0.03]−0.02 [−0.06, 0.02]
0.07 [0.02, 0.12]0.06 [0.03, 0.09]
0.08 [0.05, 0.11]−0.05 [−0.12, 0.02]0.11 [0.07, 0.15]
−0.00 [−0.02, 0.02]
0.06 [0.04 , 0.09]
0.05 [−0.02, 0.12]
0.02 [−0.01, 0.04]
0.1 0.2
NTG lower NTG higher
−0.1−0.2 0
Rankin et al., 1995 [59]
Abegão Pinto et al., 2012 [29]Abegão Pinto et al., 2012 [43]
Stalmans et al., 2009 [61]Willekens et al., 2014 [62]
(a)
625 605 100.0%
89 5962 4869 8163 5578 12423 2828 2258 51
470 468
10 1362 4072 53
41 3013 2529 2983 84
Study or subgroupTotalMean SD Mean SD Total
WeightIV, fixed, 95% CI
NTG Normal controlIV, fixed, 95% CIMean difference Mean difference
6.12.1 TPCA RI treated
Abegão Pinto et al., 2013 [44]Abegão Pinto et al., 2014 [45]Kaiser et al., 1997 [57]
Subtotal (95% CI)Heterogeneity: 𝜒2 = 13.95, df = 7 (P = 0.05); I2 = 50%
Test for overall effect: Z = 1.03 (P = 0.30)
6.12.2 TPCA RI untreatedFukukita et al., 2011 [52]Plange et al., 2009 [30]
Subtotal (95% CI)Heterogeneity: 𝜒2 = 0.56, df = 1 (P = 0.45); I2 = 0%
Test for overall effect: Z = 4.55 (P < 0.00001)
6.12.3 TPCA RI mixed or not availableAkcar et al., 2005 [46]Chiou et al., 1999 [50]Plange et al., 2003 [58]
Subtotal (95% CI)Heterogeneity: 𝜒2 = 21.87, df = 2 (P < 0.00001); I2 = 91%Test for overall effect: Z = 4.65 (P < 0.00001)
Total (95% CI)Heterogeneity: 𝜒2 = 61.67, df = 12 (P < 0.00001); I2 = 81%
Test for overall effect: Z = 4.25 (P < 0.0001)
Test for subgroup differences: 𝜒2 = 25.29, df = 2 (P < 0.00001); I2 = 92.1%
−0.02 [−0.05, 0.01]−0.02 [−0.05, 0.01]0.01 [−0.02, 0.04]0.01 [−0.03, 0.05]0.02 [−0.00, 0.04]0.06 [0.01, 0.11]0.02 [−0.02, 0.06]0.00 [−0.04, 0.04]
0.05 [0.00, 0.10]0.07 [0.04, 0.10]
0.07 [0.04, 0.10]−0.04 [−0.09, 0.01]0.12 [0.07, 0.17]
0.01 [−0.01, 0.02]
0.06 [0.04 , 0.09]
0.06 [0.03, 0.08]
0.02 [0.01, 0.03]
12.4%10.5%8.3%6.6%21.0%3.5%4.8%6.1%
73.1%
3.9%7.9%
11.7%
8.1%3.5%3.6%
15.2%
0.080.080.10.1
0.05570.090.080.1
0.060.07
0.06
0.08
0.06
0.680.680.650.650.680.620.660.66
0.6140.62
0.54
0.75
0.58
0.080.070.10.1
0.07950.090.070.1
0.0550.1
0.08
0.07
0.12
0.660.660.660.660.70.680.680.66
0.6620.69
0.61
0.71
0.7
−0.1−0.2
NTG lower
0.1 0.20
NTG higher
Rankin et al., 1995 [59]
Abegão Pinto et al., 2012 [29]Abegão Pinto et al., 2012 [43]
Stalmans et al., 2009 [61]Willekens et al., 2014 [62]
(b)
Figure 9: Forest plot of RI in NPCA and TPCA.
different study eye selection strategy, different medicationtreatment conditions, and different CDImeasurement equip-ment, operators, and processmight also have influence on theconclusion.Theywere inevitable because it was too various tomake subgroup analysis.
Publication bias may have distorted our conclusion. Onlyone significant publication bias was found in a single analysis
(RI in OA). Funnel plots were almost symmetrical except forthe analysis of RI in OA.The final results underwent Beggar’sand Egger’s tests and there showed only one publication biasin the analysis of RI inOA.However, publication bias remainsin other analyses because studies that report nonsignificantresults have less possibility to be published than those thatreport statistically significant results. Furthermore, we did
Journal of Ophthalmology 21
not include unpublished studies from conference abstracts,dissertations, or pharmaceutical companies.
There were considerable heterogeneities between theincluded studies. Heterogeneities may be caused by medi-cation treatment conditions, patient characteristics, samplesize, diagnostic criteria, and operator experience. In addition,different CDI devices may also lead to heterogeneity in thismeta-analysis because of variable sensitivities, specificities,and positive predictive values. We conducted subgroupsanalyses according to whether the patients had medicationtreatment and reduced a part of the heterogeneities butthere were still great heterogeneities. The remaining factorswere too various to make subgroup analysis and their datatypes were not appropriate to performmeta-regressionwhichexplained some of the heterogeneities.
This meta-analysis was performed to assess the OBFchanges inNTGpopulations bymeans ofCDI. Contemporar-ily, CDI of retrobulbar vessels is limited to the measurementof various blood flow velocity parameters in general. Bloodflow through a vessel can be calculated by 𝑄 = MFV ⋅ 𝜋 ⋅ 𝑅2(MFV is the abbreviation of mean flow velocity, which canbe measured by CDI; 𝑅 represent the diameter of the vessel).But, since CDI method has a lack of reliable quantification ofaccurate diameter in orbital vessels in vivo [1, 33], it cannotreflect actual OBF directly. Hence, CDI results cannot beinterpreted as blood flow values, unless the diameter of thevessels is alsomeasured.There are now advances in CDI anal-ysis software that allows three-dimensional reconstructionsof blood vessels and flow. Estimation of the vessel diameterfrom these reconstructions allows calculation of volumetricflow based on volumetricmeasurements. Several studies haveattempted to measure absolute blood flow in certain vessels,but limited data on reproducibility may currently limit theuse of this technique in clinical studies [83–86].
CDI technique also has several other limitations whichmay make the results unreliable. First of all, because CDImeasurement highly depends on probe position and Dopplerangle (𝜃), the velocity of the blood flow can be describedin the formula 𝑢 = Δ𝑓 ⋅ 𝐶/(2𝑓
0⋅ cos 𝜃), in which 𝑢
is the velocity of the blood flow, 𝑓0means the frequency
of the sound source, and 𝐶 means the sound velocity inthe medium. When the probe is almost parallel to a vessel(cos 𝜃 = 1), there is the least possible influence of Dopplerangle uncertainty. However, because of the reflection effectof the sound waves by vessel wall, using very small anglesmay face technical difficulties [31]. In fact, in considerationof various factors, Doppler angles between 30∘ and 60∘ arethe most frequently used angles in clinical practice. Errors inestimating the Doppler angle always cause the result changes.In particular, when the Doppler Angle exceeds 60∘, smallerrors may lead to large changes in the velocity of the bloodflow [87]. All results of direct measurement, such as PSV,EDV, and MFV, can be influenced by Doppler angle, whereasRI is independent of the Doppler angle because changesin Doppler angle have a concomitant effect on PSV andEDV when we calculate RI. In a word, errors in estimatingthe Doppler angle may reduce the repeatability of results.Secondly, there is possibility to confuse short ciliary arterywith long ciliary artery and one ciliary artery with several
ciliary arteries because of the small size of these vessels,the proximity between them, and the variability in numberand position [72]. Once again, the reproducibility of CDIamong different operators is acceptable in certain vessels orparameters but not quite good in others. A study showed thatcoefficient of variations (COVs) for interoperators for PSV,EDV, and RI in OA reached up to 8.2%, 25.5%, and 6.2%,respectively, and 19.3%, 25%, and 6.3% in CRA, respectively[88]. Nevertheless, COVs for the same operator for PSV,EDV, MFV, and RI in OA were 7.4%, 8.5%, 8.2%, and 1.3%,respectively [72]. Moreover, individual variations on vascularorganizations and tissue densities might have great influenceon measurement results. Finally, when IOP is higher than45mmHg, the velocity of OBF hardly changes because muchof blood flow in OA cannot perfuse the eye. In this situation,it is difficult to explain the measurement results of velocityparameters measured by CDI [89]. In spite of these defects,velocity parameters of OBF measured by CDI might still behighly relative indexes to reflect OBF in vivo [73, 90].
A variety of other techniques which have been usedto determine OBF, such as FFA, LDV, LDF, LSFG, andPOBF, encounter a similar problem and have their ownlimitations when they are used in vivo. Furthermore, theOBF measurements on humans in general have quite a lotof noise and the results are highly variable. These make itdifficult to determine the fundamental characteristics of OBFand make the measurement results variable and uncertain.In fact, to date, no wide consensus has been reached asto which single technique should be used to asses OBFcomprehensively and how the results should be explained.Differentmeasurement techniques provide different details ofvascular parameters and can be explained differently. None ofthe methods has been sufficiently standardized or validatedexternally for humans as gold standard in clinical practiceyet [1, 12]. Among the available existing techniques to assessthe vascular component in glaucoma, CDI seems to be themost advisable because of its noninvasive and acceptablereproducibility compared to other techniques [72].
In a word, this meta-analysis showed that PSV and EDVdecreased in OA, CRA, NPCA, and TPCA, and RI increasedin CRA and TPCA in NTG patient.
It seems that the OBF changes in NTG development arecommon. CDI could be a potential technology for diagnosisof patients with NTG in the future.
Conflict of Interests
The authors declared that there was no funding supportregarding the publication of this paper. All the authorscertified that they had no affiliations with or involvement inany organization or entity with any financial or nonfinancialinterest in the subject matter or materials discussed in thisstudy.
Authors’ Contribution
Shuo Xu and Yisheng Zhong conducted the analyses andwrote the draft of the paper; Shouyue Huang and ZhongjingLin inputted and interpreted data; Shuo Xu and Yisheng
22 Journal of Ophthalmology
Zhong reviewed and edited the paper; Yisheng Zhong andShuo Xu participated in the planning of methods; WangminLiu was involved in the supervision of data analyses; Shuo Xuis the guarantor of this work and takes responsibility for theintegrity of the data and the accuracy of the data analyses.
References
[1] X.-S.Mi, T.-F. Yuan, andK.-F. So, “The current research status ofnormal tension glaucoma,” Clinical Interventions in Aging, vol.9, pp. 1563–1571, 2014.
[2] L. B. Cantor and D. WuDunn, “Normal-tension glaucoma,”Color Atlas of Glaucoma, vol. 1998, no. 11, p. 155, 1998.
[3] M. B. Shields, “Normal-tension glaucoma: is it different fromprimary open-angle glaucoma?” Current Opinion in Ophthal-mology, vol. 19, no. 2, pp. 85–88, 2008.
[4] M. B. Shields, Textbook of Glaucoma, Lippincott Williams &Wilkins, 1998.
[5] C. Kniestedt, S. Lin, J. Choe et al., “Correlation between intraoc-ular pressure, central corneal thickness, stage of glaucoma, anddemographic patient data: prospective analysis of biophysicalparameters in tertiary glaucoma practice populations,” Journalof Glaucoma, vol. 15, no. 2, pp. 91–97, 2006.
[6] H. Shah, C. Kniestedt, A. Bostrom, R. Stamper, and S. Lin,“Role of central corneal thickness on baseline parameters andprogression of visual fields in open angle glaucoma,” EuropeanJournal of Ophthalmology, vol. 17, no. 4, pp. 545–549, 2007.
[7] D. R. Anderson, “Collaborative normal tension glaucomastudy,”Current Opinion in Ophthalmology, vol. 14, no. 2, pp. 86–90, 2003.
[8] X.-S. Mi, X. Zhang, Q. Feng, A. C. Y. Lo, S. K. Chung, and K.-F.So, “Progressive retinal degeneration in transgenic mice withoverexpression of endothelin-1 in vascular endothelial cells,”Investigative Ophthalmology & Visual Science, vol. 53, no. 8, pp.4842–4851, 2012.
[9] C. J. Barry, R. L. Cooper, and R. H. Eikelboom, “Optic dischaemorrhages and vascular abnormalities in a glaucoma popu-lation,” Australian and New Zealand Journal of Ophthalmology,vol. 25, no. 2, pp. 137–143, 1997.
[10] J. Flammer, S. Orgul, V. P. Costa et al., “The impact of ocularblood flow in glaucoma,” Progress in Retinal and Eye Research,vol. 21, no. 4, pp. 359–393, 2002.
[11] T. Yamamoto and Y. Kitazawa, “Vascular pathogenesis ofnormal-tension glaucoma: a possible pathogenetic factor, otherthan intraocular pressure, of glaucomatous optic neuropathy,”Progress in Retinal and Eye Research, vol. 17, no. 1, pp. 127–143,1998.
[12] J. Caprioli and A. L. Coleman, “Blood pressure, perfusionpressure, and glaucoma,” American Journal of Ophthalmology,vol. 149, no. 5, pp. 704–712, 2010.
[13] S. Wolf, O. Arend, W. E. Sponsel, K. Schulte, L. B. Cantor,and M. Reim, “Retinal hemodynamics using scanning laserophthalmoscopy and hemorheology in chronic open-angleglaucoma,” Ophthalmology, vol. 100, no. 10, pp. 1561–1566, 1993.
[14] L. Tomic, O. Maepea, G. O. Sperber, and A. Alm, “Comparisonof retinal transit times and retinal blood flow: a study inmonkeys,” InvestigativeOphthalmology&Visual Science, vol. 42,no. 3, pp. 752–755, 2001.
[15] C. E. Riva andB. Falsini, “Functional laserDoppler flowmetry ofthe optic nerve: physiological aspects and clinical applications,”Progress in Brain Research, vol. 173, pp. 149–163, 2008.
[16] G. Michelson, M. Langhans, and M. Groh, “Perfusion of thejuxtapapillary retina and the neuroretinal rim area in primaryopen angle glaucoma,” Journal of Glaucoma, vol. 5, no. 2, pp. 91–98, 1996.
[17] H. S. Chung, A. Harris, L. Kagemann, and B. Martin, “Peripap-illary retinal blood flow in normal tension glaucoma,” BritishJournal of Ophthalmology, vol. 83, no. 4, pp. 466–469, 1999.
[18] G. T. Feke, “Laser Doppler instrumentation for the measure-ment of retinal blood flow: theory and practice,” Bulletin de laSociete Belge d’ophtalmologie, no. 302, pp. 171–184, 2006.
[19] N. Aizawa, H. Kunikata, Y. Shiga, Y. Yokoyama, K. Omodaka,and T. Nakazawa, “Correlation between structure/function andoptic discmicrocirculation inmyopic glaucoma,measuredwithlaser speckle flowgraphy,” BMC Ophthalmology, vol. 14, no. 1,article 113, 2014.
[20] Y. Shiga, K. Omodaka, H. Kunikata et al., “Waveform analysisof ocular blood flow and the early detection of normal tensionglaucoma,” Investigative Ophthalmology & Visual Science, vol.54, no. 12, pp. 7699–7706, 2013.
[21] M. E. Langham, “Ocular blood flow and vision in healthy andglaucomatous eyes.,” Survey of Ophthalmology, vol. 38, pp. S161–S168, 1994.
[22] D. R. Trew and S. E. Smith, “Postural studies in pulsatile ocularblood flow: II. Chronic open angle glaucoma,” British Journal ofOphthalmology, vol. 75, no. 2, pp. 71–75, 1991.
[23] H. J. Kaiser, A. Schotzau, and J. Flammer, “Blood-flow velocitiesin the extraocular vessels in normal volunteers,” AmericanJournal of Ophthalmology, vol. 122, no. 3, pp. 364–370, 1996.
[24] W. E. Lieb, S. M. Cohen, D. A. Merton, J. A. Shields, D. G.Mitchell, and B. B. Goldberg, “ColorDoppler imaging of the eyeand orbit: technique and normal vascular anatomy,” Archives ofOphthalmology, vol. 109, no. 4, pp. 527–531, 1991.
[25] T. Planiol, L. Pourcelot, J. M. Pottier, and E. Degiovanni, “Studyof carotid circulation by means of ultrasonic methods andthermography,” Revue Neurologique, vol. 126, no. 2, pp. 127–141,1972.
[26] R. Ehrlich, A. Harris, B. A. Siesky et al., “Repeatability of retrob-ulbar blood flow velocitymeasured using color doppler imagingin the indianapolis glaucoma progression study,” Journal ofGlaucoma, vol. 20, no. 9, pp. 540–547, 2011.
[27] A. Harris, R. C. Sergott, G. L. Spaeth, J. L. Katz, J. A. Shoemaker,and B. J. Martin, “Color Doppler analysis of ocular vesselblood velocity in normal-tension glaucoma,” American Journalof Ophthalmology, vol. 118, no. 5, pp. 642–649, 1994.
[28] Y. Zhong, Y. Min, Y. Jiang, Y. Cheng, J. Qin, and X. Shen, “ColorDoppler imaging and pattern visual evoked potential in normaltension glaucoma and hypertension glaucoma,” DocumentaOphthalmologica, vol. 119, no. 3, pp. 171–180, 2009.
[29] L. Abegao Pinto, E. Vandewalle, E. De Clerck, C. Marques-Neves, and I. Stalmans, “Ophthalmic artery Doppler wave-form changes associated with increased damage in glaucomapatients,” Investigative Ophthalmology & Visual Science, vol. 53,no. 4, pp. 2448–2453, 2012.
[30] N. Plange, M. Kaup, A. Weber, A. Harris, K. O. Arend, and A.Remky, “Performance of colour Doppler imaging discriminat-ing normal tension glaucoma from healthy eyes,” Eye, vol. 23,no. 1, pp. 164–170, 2009.
[31] I. Stalmans, E. Vandewalle, D. R. Anderson et al., “Use ofcolour Doppler imaging in ocular blood flow research,” ActaOphthalmologica, vol. 89, no. 8, pp. e609–e630, 2011.
Journal of Ophthalmology 23
[32] D. Moher, A. Liberati, J. Tetzlaff, and D. G. Altman, “Preferredreporting items forsystematic reviews and meta-analyses: thePRISMA statement,” PLoS Medicine, vol. 6, no. 7, Article IDe1000097, 2009.
[33] N. Meng, P. Zhang, H. Huang et al., “Color Doppler imaginganalysis of retrobulbar blood flow velocities in primary open-angle glaucomatous eyes: a meta-analysis,” PLoS ONE, vol. 8,no. 5, Article ID e62723, 2013.
[34] J. P. T. Higgins, S. G. Thompson, J. J. Deeks, and D. G. Altman,“Measuring inconsistency in meta-analyses,” British MedicalJournal, vol. 327, no. 7414, pp. 557–560, 2003.
[35] J. P. T. Higgins and S. G.Thompson, “Quantifying heterogeneityin ameta-analysis,” Statistics inMedicine, vol. 21, no. 11, pp. 1539–1558, 2002.
[36] R. DerSimonian and N. Laird, “Meta-analysis in clinical trials,”Controlled Clinical Trials, vol. 7, no. 3, pp. 177–188, 1986.
[37] N. Mantel and W. Haenszel, “Statistical aspects of the analysisof data from retrospective studies of disease,” Journal of theNational Cancer Institute, vol. 22, no. 4, pp. 719–748, 1959.
[38] M. Egger, G. D. Smith, M. Schneider, and C. Minder, “Biasin meta-analysis detected by a simple, graphical test,” BritishMedical Journal, vol. 315, no. 7109, pp. 629–634, 1997.
[39] C. B. Begg and M. Mazumdar, “Operating characteristics of arank correlation test for publication bias,” Biometrics, vol. 50,no. 4, pp. 1088–1101, 1994.
[40] J. Mai, H. Li, J. Fang et al., “Estimation of fail-safe number inmeta-analysis,” Journal of Evidence-Based Medicine, vol. 6, no.5, pp. 297–303, 2006.
[41] G. M. Baxter, T. H. Williamson, G. McKillop, and G. N.Dutton, “Color Doppler ultrasound of orbital and optic nerveblood flow: effects of posture and timolol 0.5%,” InvestigativeOphthalmology & Visual Science, vol. 33, no. 3, pp. 604–610,1992.
[42] R. D. Steigerwalt Jr., G. Belcaro, M. R. Cesarone, G. Laurora, M.T. De Sanctis, andM.Milazzo, “Doppler ultrasonography of thecentral retinal artery in normals treated with topical timolol,”Eye, vol. 7, no. 3, pp. 403–406, 1993.
[43] L. Abegao Pinto, E. Vandewalle, and I. Stalmans, “Disturbedcorrelation between arterial resistance and pulsatility in glau-coma patients,” Acta Ophthalmologica, vol. 90, no. 3, pp. e214–e220, 2012.
[44] L. Abegao Pinto, E. Vandewalle, E. De Clerck, C. Marques-Neves, and I. Stalmans, “Lack of spontaneous venous pulsation:possible risk indicator in normal tension glaucoma?” ActaOphthalmologica, vol. 91, no. 6, pp. 514–520, 2013.
[45] L. Abegao Pinto, E. Vandewalle, K. Willekens, C. Marques-Neves, and I. Stalmans, “Ocular pulse amplitude and Dopplerwaveform analysis in glaucoma patients,” Acta Ophthalmolog-ica, vol. 92, no. 4, pp. e280–e285, 2014.
[46] N. Akcar, N. Yıldırım, B. Adapınar, T. Kaya, and I. R. Ozkan,“Duplex sonography of retro-orbital and carotid arteries inpatients with normal-tension glaucoma,” Journal of ClinicalUltrasound, vol. 33, no. 6, pp. 270–276, 2005.
[47] Z. Butt, G. McKillop, C. O’Brien, P. Allan, and P. Aspinall,“Measurement of ocular blood flow velocity using colourDoppler imaging in low tension glaucoma,” Eye, vol. 9, no. 1,pp. 29–33, 1995.
[48] Z. Butt, C. O’Brien, G. McKillop, P. Aspinall, and P. Allan,“Color Doppler imaging in untreated high- and normal-pressure open-angle glaucoma,” Investigative Ophthalmology &Visual Science, vol. 38, no. 3, pp. 690–696, 1997.
[49] M. Cellini, G. L. Possati, V. Profazio,M. Sbrocca, N. Caramazza,andR.Caramazza, “ColorDoppler imaging and plasma levels ofendothelin-1 in low-tension glaucoma,” Acta OphthalmologicaScandinavica, Supplement, vol. 75, no. 224, pp. 11–13, 1997.
[50] H.-J. Chiou, Y.-H. Chou, C. J.-L. Liu et al., “Evaluation of oculararterial changes in glaucoma with color Doppler ultrasonogra-phy,” Journal of Ultrasound in Medicine, vol. 18, no. 4, pp. 295–302, 1999.
[51] G. Cristini and M. Cellini, “Diagnostic and prognostic indicesin primary open angle glaucoma: a color doppler study,” ActaOphthalmologica Scandinavica, Supplement, vol. 75, no. 224, pp.34–35, 1997.
[52] M. Fukukita, M. Ido, S. Osawa et al., “Retrobulbar hemo-dynamic effects of nipradilol in normal and normal-tensionglaucoma eyes,” Journal of Ophthalmology, vol. 2011, Article ID652904, 6 pages, 2011.
[53] P. Galambos, J. Vafiadis, S. E. Vilchez et al., “Compromisedautoregulatory control of ocular hemodynamics in glaucomapatients after postural change,” Ophthalmology, vol. 113, no. 10,pp. 1832–1836, 2006.
[54] F. Galassi, B. Giambene, andR.Varriale, “Systemic vascular dys-regulation and retrobulbar hemodynamics in normal-tensionglaucoma,” Investigative Ophthalmology & Visual Science, vol.52, no. 7, pp. 4467–4471, 2011.
[55] A. Harris, T. H. Williamson, B. Martin et al., “Test/retestreproducibility of color Doppler imaging assessment of bloodflow velocity in orbital vessels,” Journal of Glaucoma, vol. 4, no.4, pp. 281–286, 1995.
[56] K. Huber, N. Plange, A. Remky, and O. Arend, “Comparison ofcolour Doppler imaging and retinal scanning laser fluoresceinangiography in healthy volunteers and normal pressure glau-coma patients,” Acta Ophthalmologica Scandinavica, vol. 82, no.4, pp. 426–431, 2004.
[57] H. J. Kaiser, A. Schoetzau, D. Stumpfig, and J. Flammer, “Blood-flow velocities of the extraocular vessels in patients with high-tension and normal-tension primary open-angle glaucoma,”American Journal of Ophthalmology, vol. 123, no. 3, pp. 320–327,1997.
[58] N. Plange, A. Remky, and O. Arend, “Colour Doppler imagingand fluorescein filling defects of the optic disc in normal tensionglaucoma,” British Journal of Ophthalmology, vol. 87, no. 6, pp.731–736, 2003.
[59] S. J. A. Rankin, B. E. Walman, A. R. Buckley, and S. M. Drance,“Color Doppler imaging and spectral analysis of the optic nervevasculature in glaucoma,” American Journal of Ophthalmology,vol. 119, no. 6, pp. 685–693, 1995.
[60] P. Rojanapongpun, S. M. Drance, and B. J. Morrison, “Oph-thalmic artery flow velocity in glaucomatous and normalsubjects,” British Journal of Ophthalmology, vol. 77, no. 1, pp. 25–29, 1993.
[61] I. Stalmans, A. Harris, S. Fieuws et al., “Color Doppler imagingand ocular pulse amplitude in glaucomatous and healthy eyes,”European Journal of Ophthalmology, vol. 19, no. 4, pp. 580–587,2009.
[62] K. Willekens, L. Abegao Pinto, E. Vandewalle, C. Marques-Neves, and I. Stalmans, “Higher optic nerve sheath diametersare associated with lower ocular blood flow velocities in glau-coma patients,” Graefe’s Archive for Clinical and ExperimentalOphthalmology, vol. 252, no. 3, pp. 477–483, 2014.
[63] J. Sowka, “New thoughts on normal tension glaucoma,”Optom-etry, vol. 76, no. 10, pp. 600–608, 2005.

24 Journal of Ophthalmology
[64] A. Sommer, “Glaucoma: facts and fancies,” Eye, vol. 10, no. 3, pp.295–301, 1996.
[65] L. Bonomi, G. Marchini, M. Marraffa et al., “Prevalence ofglaucoma and intraocular pressure distribution in a definedpopulation: the Egna-Neumarkt study,” Ophthalmology, vol.105, no. 2, pp. 209–215, 1998.
[66] B. E. K. Klein, R. Klein, W. E. Sponsel et al., “Prevalence ofglaucoma: the Beaver Dam eye study,” Ophthalmology, vol. 99,no. 10, pp. 1499–1504, 1992.
[67] I. Dielemans, J. R. Vingerling, R. C. W. Wolfs, A. Hofman,D. E. Grobbee, and P. T. V. M. De Jong, “The prevalence ofprimary open-angle glaucoma in a population-based study inthe Netherlands: the Rotterdam study,”Ophthalmology, vol. 101,no. 11, pp. 1851–1855, 1994.
[68] A. Sommer, J. M. Tielsch, J. Katz et al., “Relationship betweenintraocular pressure and primary open angle glaucoma amongwhite and black Americans: the Baltimore eye survey,” Archivesof Ophthalmology, vol. 109, no. 8, pp. 1090–1095, 1991.
[69] M. J. Cartwright and D. R. Anderson, “Correlation of asymmet-ric damage with asymmetric intraocular pressure in normal-tension glaucoma (low-tension glaucoma),” Archives of Oph-thalmology, vol. 106, no. 7, pp. 898–900, 1988.
[70] I. O. Haefliger and R. A. Hitchings, “Relationship betweenasymmetry of visual field defects and intraocular pressuredifference in an untreated normal (low) tension glaucomapopulation,” Acta Ophthalmologica, vol. 68, no. 5, pp. 564–567,1990.
[71] A. Crichton, S. M. Drance, G. R. Douglas, and M. Schulzer,“Unequal intraocular pressure and its relation to asymmetricvisual field defects in low-tension glaucoma,” Ophthalmology,vol. 96, no. 9, pp. 1312–1314, 1989.
[72] P. Calvo, A. Ferreras, V. Polo et al., “Predictive value of retrob-ulbar blood flow velocities in glaucoma suspects,” InvestigativeOphthalmology & Visual Science, vol. 53, no. 7, pp. 3875–3884,2012.
[73] G. A. Taylor, B. L. Short, L. K. Walker, and R. J. Traystman,“Intracranial blood flow: quantification with duplex dopplerand color doppler flow US,” Radiology, vol. 176, no. 1, pp. 231–236, 1990.
[74] J. A. D. Spencer, D. A. Giussani, P. J. Moore, and M. A. Hanson,“In vitro validation of Doppler indices using blood and water,”Journal of Ultrasound in Medicine, vol. 10, no. 6, pp. 305–308,1991.
[75] M. P. Spencer and D. Whisler, “Transorbital Doppler diagnosisof intracranial arterial stenosis,” Stroke, vol. 17, no. 5, pp. 916–921, 1986.
[76] E. J. Halpern, D. A. Merton, and F. Forsberg, “Effect of distalresistance onDoppler US flow patterns,”Radiology, vol. 206, no.3, pp. 761–766, 1998.
[77] M. D. Rifkin, L. Needleman, M. E. Pasto et al., “Evaluation ofrenal transplant rejection by duplexDoppler examination: valueof the resistive index,” American Journal of Roentgenology, vol.148, no. 4, pp. 759–762, 1987.
[78] J. F. Platt, J. H. Ellis, J. M. Rubin, M. A. DiPietro, and A. B.Sedman, “Intrarenal arterial Doppler sonography in patientswith nonobstructive renal disease: correlation of resistive indexwith biopsy findings,” American Journal of Roentgenology, vol.154, no. 6, pp. 1223–1227, 1990.
[79] E. Dienstbier, J. Balik, and H. Kafka, “A contribution to thetheory of the vascular origin of glaucoma,” British Journal ofOphthalmology, vol. 34, no. 1, pp. 47–58, 1950.
[80] M. C. Leske, S.-Y. Wu, A. Hennis, R. Honkanen, and B.Nemesure, “Risk factors for incident open-angle Glaucoma: thebarbados eye studies,” Ophthalmology, vol. 115, no. 1, pp. 85–93,2008.
[81] H. A. Quigley, S. K. West, J. Rodriguez, B. Munoz, R. Klein,and R. Snyder, “The prevalence of glaucoma in a population-based study of Hispanic subjects: proyecto VER,” Archives ofOphthalmology, vol. 119, no. 12, pp. 1819–1826, 2001.
[82] A. P. Cherecheanu, G. Garhofer, D. Schmidl, R. Werkmeister,and L. Schmetterer, “Ocular perfusion pressure and ocularblood flow in glaucoma,”Current Opinion in Pharmacology, vol.13, no. 1, pp. 36–42, 2013.
[83] G. Michelson and G. Schuierer, “Absolute blood flow in theophthalmic artery,” Fortschritte der Ophthalmologie, vol. 88, no.6, pp. 687–689, 1991.
[84] F. Orge, A. Harris, L. Kagemann et al., “The first technique fornon-invasive measurements of volumetric ophthalmic arteryblood flow in humans,” British Journal of Ophthalmology, vol.86, no. 11, pp. 1216–1219, 2002.
[85] R. Katamay, C. Fleischlin, K. Gugleta, J. Flammer, and S.Orgul, “Volumetric blood flowmeasurement in the ophthalmicartery using colour doppler,”KlinischeMonatsblatter fur Augen-heilkunde, vol. 226, no. 4, pp. 249–253, 2009.
[86] O. Zeitz, S. E. Vilchez, E. T. Matthiessen, G. Richard, and M.Klemm, “Volumetric colour Doppler imaging: a useful tool forthe determination of ocular blood flow in glaucoma patients?”Eye, vol. 20, no. 6, pp. 668–673, 2006.
[87] T. H. Williamson and A. Harris, “Color Doppler ultrasoundimaging of the eye and orbit,” Survey of Ophthalmology, vol. 40,no. 4, pp. 255–267, 1996.
[88] G. M. Baxter and T. H. Williamson, “Color Doppler imaging ofthe eye: normal ranges, reproducibility, and observer variation,”Journal of Ultrasound inMedicine, vol. 14, no. 2, pp. 91–96, 1995.
[89] A. Harris, K. Joos, M. Kay et al., “Acute IOP elevation withscleral suction: effects on retrobulbar haemodynamics,” BritishJournal of Ophthalmology, vol. 80, no. 12, pp. 1055–1059, 1996.
[90] N. B. Hansen, B. S. Stonestreet, T. S. Rosenkrantz, and W. Oh,“Validity of Doppler measurements of anterior cerebral arterybloodflowvelocity: correlationwith brain bloodflow in piglets,”Pediatrics, vol. 72, no. 4, pp. 526–531, 1983.

Submit your manuscripts athttp://www.hindawi.com
Stem CellsInternational
Hindawi Publishing Corporationhttp://www.hindawi.com Volume 2014
Hindawi Publishing Corporationhttp://www.hindawi.com Volume 2014
MEDIATORSINFLAMMATION
of
Hindawi Publishing Corporationhttp://www.hindawi.com Volume 2014
Behavioural Neurology
EndocrinologyInternational Journal of
Hindawi Publishing Corporationhttp://www.hindawi.com Volume 2014
Hindawi Publishing Corporationhttp://www.hindawi.com Volume 2014
Disease Markers
Hindawi Publishing Corporationhttp://www.hindawi.com Volume 2014
BioMed Research International
OncologyJournal of
Hindawi Publishing Corporationhttp://www.hindawi.com Volume 2014
Hindawi Publishing Corporationhttp://www.hindawi.com Volume 2014
Oxidative Medicine and Cellular Longevity
Hindawi Publishing Corporationhttp://www.hindawi.com Volume 2014
PPAR Research
The Scientific World JournalHindawi Publishing Corporation http://www.hindawi.com Volume 2014
Immunology ResearchHindawi Publishing Corporationhttp://www.hindawi.com Volume 2014
Journal of
ObesityJournal of
Hindawi Publishing Corporationhttp://www.hindawi.com Volume 2014
Hindawi Publishing Corporationhttp://www.hindawi.com Volume 2014
Computational and Mathematical Methods in Medicine
OphthalmologyJournal of
Hindawi Publishing Corporationhttp://www.hindawi.com Volume 2014
Diabetes ResearchJournal of
Hindawi Publishing Corporationhttp://www.hindawi.com Volume 2014
Hindawi Publishing Corporationhttp://www.hindawi.com Volume 2014
Research and TreatmentAIDS
Hindawi Publishing Corporationhttp://www.hindawi.com Volume 2014
Gastroenterology Research and Practice
Hindawi Publishing Corporationhttp://www.hindawi.com Volume 2014
Parkinson’s Disease
Evidence-Based Complementary and Alternative Medicine
Volume 2014Hindawi Publishing Corporationhttp://www.hindawi.com