Reverse osmosis pretreatment: Quality control to extend ...
81
MASTER’S THESIS In order to obtain the PROFESSIONAL MASTER’S DEGREE In Healthcare Management and Quality Issued by: The Faculty of Sciences – Lebanese University Presented and Defended by: Ramez Mohammad Zayyat On Monday, October 12, 2015 Title Reverse osmosis pretreatment: Quality control to extend membrane life span Supervisor Dr. Jamal Charara Reviewers Dr. Mohamad Nassreddine Dr. Bassam Ghazi Lebanese University – Faculty of Sciences – www.fsciences.ul.edu.lb
Transcript of Reverse osmosis pretreatment: Quality control to extend ...
MASTER’S THESIS In order to obtain the
PROFESSIONAL MASTER’S DEGREE
In Healthcare Management and Quality
Issued by: The Faculty of Sciences – Lebanese University
Presented and Defended by:
Ramez Mohammad Zayyat
On Monday, October 12, 2015
Title
Reverse osmosis pretreatment: Quality control to extend membrane life span
Supervisor
Dr. Jamal Charara
Reviewers
Dr. Mohamad Nassreddine
Dr. Bassam Ghazi
Lebanese University – Faculty of Sciences – www.fsciences.ul.edu.lb
ii
LEBANESE UNIVERSITY Faculty of Sciences
PROFESSIONAL MASTER’S DEGREE
Healthcare Management and Quality
Reverse osmosis pretreatment: Quality control to extend
membrane life span
Ramez Mohammad Zayyat
© Ramez Mohammad Zayyat, 2016

iii
DEDICATION
To my better half

iv
ACKNOWLEDGMENT
The author would like to express his deepest gratitude to Dr. Jamal Chrara for his
guidance and assistance throughout the MP program, and for allowing this research to
proceed after 3 years. A special acknowledgment goes to Gates group for granting this
opportunity especially Mr. Adel Olleik and Mrs. Nahida Jomaa.
Special thanks are for Dr. Mohammad Nasreddine, Dr. George Ayoub, Dr. Walid
Hassan, Dr. Mahmoud Al-Hindi, Dr. Lucy Semerjian, and Mr. Joseph Daoud for their great help
in advising me on the theoretical and laboratory work.
My gratitude is addressed to Dr. Bassam Ghazi for his time, effort, and serving on the
committee, and to the Faculty of Sciences at the Lebanese University and the department of
Civil and Environmental engineering at AUB for all the support throughout the past three
years. My deepest thanks goes to Mrs. Abeer who has been very helpful throughout my stay
at LU and this would not have been possible without her support, simply put, she is one of
the best administrative officers I have ever come across.
Disclaimer
The idea of using the principle of the process of alkalizaion and softening as an
optimized pretreatment for SWRO is initiated and developed by Prof. George Ayoub and
consequently he is reserved all the rights and privileges pertaining to this idea.
v
ABSTRACT
With the rapid increase in earth population and human activity comes the increase in
water consumption, which intensified water shortages all over the globe; therefore water is
rapidly being perceived as a limited resource of high economic value. Brackish water and
Seawater Desalination advancements in both thermal and membrane technologies rendered
desalination as an important source of drinking water. The uses and application of reverse
osmosis technologies has intensified rapidly throughout the globe with the construction of
large reverse osmosis plants in arid regions such as Saudi Arabia and the rest of the gulf
region. Seawater reverse osmosis is a highly effective desalination process; however the main
drawback that has been facing this process is fouling of reverse osmosis membranes
including: inorganic, organic, colloidal, and biological fouling. Additionally dealing with
reverse osmosis reject is not an easy task; the brine can cause adverse environmental and
economic consequences. Lebanon has a somewhat weak infrastructure, with water network
wasting of 50 percent, this lead many Lebanese facilities including hospitals to seek
alternatives. The most convenient and widely accepted method of water purification became
the reverse osmosis. The present study aims at designing a reverse osmosis system with pre
and post treatment to provide water with potable quality to a hospital. Additionally, a
Laboratory scale reverse osmosis was used to test fouling and scaling information using a sea
water reverse osmosis conventional pretreatment process that optimizes the multi-process
pretreatment that is practiced at present. Based on the principle of softening the process
includes (coagulation-flocculation) using Mg(OH)2 and CaCO3, thus inducing simultaneous and
quasi-complete control of the pollutants responsible for membrane fouling. The results of the
study showed that fouling and scaling were both highly decreased using softened water of
the aforementioned procedure. Membrane autopsies showed a drop of scaling and fouling
efficiencies as high as: 100 % for Ca, 99.6% for Mg, 100% for Si, 82% for B, 99% for Fe, 93% for
VSS, and 58.4% for TOC, in addition to complete inactivation of total and fecal coliforms which
completely eliminated bacterial fouling.

vi
TABLE OF CONTENTS
DEDICATION ................................................................................................................................................... III ACKNOWLEDGMENT ..................................................................................................................................... IV ABSTRACT ...................................................................................................................................................... V TABLE OF CONTENTS ..................................................................................................................................... VI LIST OF FIGURES .......................................................................................................................................... VIII LIST OF TABLES ............................................................................................................................................... IX LIST OF ABBREVIATIONS .................................................................................................................................. X CHAPTER 1 INTRODUCTION ............................................................................................................................. 1
1.1 WATER SCARCITY ..................................................................................................................................... 1 1.2 BACKGROUND ......................................................................................................................................... 1 1.3 PROBLEM STATEMENT ............................................................................................................................ 2 1.4 OBJECTIVES .............................................................................................................................................. 3 1.5 THESIS OUTLINE ....................................................................................................................................... 4
CHAPTER 2 LITERATURE REVIEW ..................................................................................................................... 5 2.1 INTRODUCTION ....................................................................................................................................... 5 2.2 UNDERSTADING THE RO .......................................................................................................................... 7 2.3 MEMBRANE FOULING ............................................................................................................................. 9
2.3.1 Inorganic Fouling .......................................................................................................................... 11 2.3.2 Organic Fouling ............................................................................................................................ 13 2.3.3 Colloidal Fouling ........................................................................................................................... 15 2.3.4 Biological Fouling ......................................................................................................................... 19
2.4 PRETREATMENT ..................................................................................................................................... 22 2.4.1 Conventional pretreatment ......................................................................................................... 22 2.4.2 Membrane pretreatment ............................................................................................................. 23
2.5 RJECT AND BRINE DISPOSAL AND TREATMENT ..................................................................................... 24 2.5.1 Brine Disposal ............................................................................................................................... 26 2.5.2 Brine Treatment ........................................................................................................................... 26 2.5.3 Zero Liquid Discharge Systems ..................................................................................................... 27
2.6 CONCLUSION ......................................................................................................................................... 28 CHAPTER 3 RESEARCH DESIGN AND METHODOLOGY .................................................................................... 30
3.1 INTRODUCTION ..................................................................................................................................... 30 3.2 WATER INTAKE ...................................................................................................................................... 30 3.3 EXPERIMENTAL SETUP ........................................................................................................................... 31 3.4 PRODUCT AND REJECT ........................................................................................................................... 32 3.5 TESTING AND ANALYTICAL PROCEDURES .............................................................................................. 32 3.6 MEMBRANE AUTOPSY ........................................................................................................................... 33 3.7 MEMBRANE SURFACE ANALYSIS BY SEM .............................................................................................. 34 3.8 CONCLUSION ......................................................................................................................................... 35
CHAPTER 4 RESULTS AND DISCUSSION .......................................................................................................... 37 4.1 DESIGNING A WATER SUPPLY SYSTEM FOR A HOSPITAL ...................................................................... 37
4.1.1 Water Network Status.................................................................................................................. 37 4.1.2 Water intake ................................................................................................................................ 38 4.1.3 Flow considerations ..................................................................................................................... 39 4.1.4 Calculating number of elements and pressure vessels ................................................................ 41 4.1.5 Number of Vessels, Stages and Staging Ratio .............................................................................. 41 4.1.6 Balancing and comparing results with Toray DS2 ........................................................................ 44 4.1.7 Pretreatment................................................................................................................................ 47
4.2 LABORATORY SCALE SYSTEM ................................................................................................................. 48 4.3 USING PHREEQC .................................................................................................................................... 52 4.4 CONCLUSION ......................................................................................................................................... 52
CHAPTER 5 FINANCIAL STUDY ....................................................................................................................... 54

vii
5.1 PRETREATMENT COST ........................................................................................................................... 54 5.2 RO COSTING ........................................................................................................................................... 55 5.3 POST TREATMENT COSTING .................................................................................................................. 56 5.4 PROJECT REVENUE AND PROFIT ............................................................................................................ 57
CHAPTER 6 CONCLUSION AND FUTURE WORK .............................................................................................. 58 6.1 CONCLUSION ......................................................................................................................................... 58 6.2 FUTURE WORK ....................................................................................................................................... 59
REFERENCES .................................................................................................................................................. 61 APPENDIX A .................................................................................................................................................. 68 APPENDIX B ................................................................................................................................................... 69

viii
LIST OF FIGURES
Figure 2-1: Global desalination capacity by continent. ............................................................ 5 Figure 2-2: Global desalination capacity by process. ................................................................ 6 Figure 2-3: Reverse Osmosis vs. Osmosis. ................................................................................ 7 Figure 2-4: Removal capacity of RO NF MF and UF. ................................................................. 8 Figure 2-5: RO membrane model. ............................................................................................. 9 Figure 2-6: Membrane fouling process pore blocking and cake layer. ................................... 11 Figure 2-7: Schematic illustration of the formation of inorganic fouling. .............................. 12 Figure 2-8: Schematic description of the effect of solution chemistry on the conformation of NOM macromolecules in the solution and on the membrane surface, and the resulting effect on membrane permeate flux. ................................................................................................. 15 Figure 2-9: Factors affecting colloidal fouling on membrane. ................................................ 17 Figure 2-10: Concentration polarization and CEOP (a) before membrane is fouled and (b) after membrane is fouled. ............................................................................................................... 18 Figure 2-11: of Sequence events leading to the formation of a Biofilm. ................................ 19 Figure 2-12: Time-dependent development of biofilm accumulation: Δ, biofilm growth parameter (thickness, weight, etc.); inset, primary colonization; threshold of interference, arbitrary extent of biofilm development above which the biofilm interferes with the performance of a membrane system. .................................................................................... 20 Figure 2-13: Conventional pretreatment and membrane pretreatment. .............................. 22 Figure 2-14: ZLD Salt recovery scheme used by Mohammad Esmaeili. ................................. 29 Figure 3-1: 500 Liter tanks employed for water storage. ....................................................... 31 Figure 3-2: Household RO system. .......................................................................................... 31 Figure 3-3: Membrane and Autopsy Preparations. ................................................................ 32 Figure 3-4: Membrane autopsy setup. ................................................................................... 33 Figure 3-5: Membrane surface foulant removal. .................................................................... 34 Figure 3-6: SEM at CRSL AUB. ................................................................................................. 35 Figure 3-7: Double coated carbon tabs with adhesive layers. ................................................ 35 Figure 4-1: Multi stage RO system. ......................................................................................... 42 Figure 4-2: Flow diagram for Designed RO system. ................................................................ 45 Figure 4-3: SEM imaging of foulant at 1mm. .......................................................................... 49 Figure 4-4: SEM imaging of foulant at 10 μm. ........................................................................ 50 Figure 4-5: Spectrum and imaging of membrane surface. Spectrum 1 and 2 represent moderate add intensive foluing regions respectively, spectrum 3 represent the membrane exposed to pretreated water. ................................................................................................. 51 Figure 5-1: Costing of pretreatment processes. ..................................................................... 54

ix
LIST OF TABLES
Table 2-1: Evaluation of viability of treatment technologies applied to RO concentrates. ... 25 Table 4-1: Brackish water analysis. ......................................................................................... 38 Table 4-2: System design information. ................................................................................... 39 Table 4-3: Average Day and Maximum Day Demand Calculation. ......................................... 40 Table 4-4: Number of stages for BWRO. ................................................................................. 42 Table 4-5: Number of stages for SWRO. ................................................................................. 43 Table 4-6: Toray DS2 Status for Run at 62 percent recovery. ................................................. 45 Table 4-7: Simulation Software Ionic concentrations. ............................................................ 46 Table 4-8: Toray DS2 results by stage. .................................................................................... 47 Table 4-9: BWB charachteristics. ............................................................................................ 48 Table 4-10: Elemental Analysis of membrane surface............................................................ 50 Table 4-11: Log SI of Settling Species at pH 8.5. ..................................................................... 53

x
LIST OF ABBREVIATIONS
ACS American Chemical Society
ADD Average Day Demand
APHA American Public Health Association
AWWA American Water Works Association
B Boron
Ba Barium
BDL Below Detection Limit
BW Brackish Water
BWB Brackish Water Brine
BWRO Brackish water Reverse Osmosis
Ca Calcium
CEOP Cake-Enhanced Osmotic Pressure
CESP Chemically-Enhanced Seeded Precipitation
CP Concentration Polarization
CRSL Central Research Science Laboratory
DBP Disinfection Byproducts
ED Electrodialysis
EDI Electrodeionization
EDL Electrical Double Layer
EDR Electrodialysis Reversal
EPS Extracellular Polymeric Substances
ESCWA Economic and Social Commission for Western Asia
xi
GAC Granular Activated Carbon
Gpm Gallons per minute
ICD Intermediate Chemical Demineralization
IMS Integrated Membrane Systems
LSI Langelier Saturation Index
MD Membrane Distillation
MDC Membrane Distillation Crystallization
MDD Maximum Day Demand
MF Microfiltration
MFI Modified Fouling Index
Mg Magnesium
MSF Multistage Flash
NF Nanofiltration
NOM Natural Organic Matter
NTU Nephelometric Turbidity Units
PEUF Polymer Enhanced Ultrafiltration
PF Peaking Factor
RO Reverse Osmosis
SDI Silt Density Index
SEM Scanning Electron Microscope
SI Saturation Index
Si Silica
Sr Strontium
SWRO Seawater Reverse Osmosis
TDS Total Disolve Solids

xii
TNTC Too Numerous To Count
UF Ultrafilatration
UV Ultraviolet
VMD Vaccum Membrane Distillation
ZLD Zero Liquid-Discharge
1
CHAPTER 1
INTRODUCTION
1.1 WATER SCARCITY
Water scarcity is rapidly increasing all over the globe, while such scarcity frequently
occurs in arid regions, pollution of fresh water resources in addition to the extensive use of
ground water aquifers and surface water has led to the deterioration of fresh water quality
and quantity [1]. Water is increasingly perceived as a limiting resource of environmental and
economic value. According to the U.S. Geological Survey 96.5% of Earth’s water is located in
seas and oceans and 1.7% of Earth’s water is located in the ice caps. Approximately 0.8% is
considered to be fresh water. The remaining percentage is made up of brackish water, slightly
salty water found as surface water in estuaries and as groundwater in salty aquifers [2].
Therefore the only nearly inexhaustible sources of water are the oceans. The main drawback
of ocean waters, however, is the high salinity. Over 17% of the earth’s population is suffering
from the lack of clean drinking water, and approximately 40% of the population lives in
regions with chronic water shortages [3]. The increase in water demand due to population,
industrial, and agricultural growth increased water consumption intensifies the problem of
water shortage, thus providing additional and new fresh water resources is essential [4].
1.2 BACKGROUND
Desalination is the process of removing salts from water to produce fresh water with
total dissolved solids (TDS) less than 1000 mg/L, and is used for both seawater and brackish
water. Different countries have different drinking water standards for contaminants; this is
also applicable to TDS. Most desalination facilities are designed to achieve a permeate TDS
value of 500 mg/L or less [5]. Current commercial desalination technologies can be divided
into thermal distillation (MSF and MED) and membrane separation (RO) with some hybrid
plants integrating both thermal and membrane technologies [6].

2
Even though membrane technologies are thought to be the most developed of
desalination technologies, the adoption of a desalination technology is influenced by the feed
water characteristics, required permeate quality, labor cost, available area, energy cost, and
local demand for electricity [1]. A successful application of desalination using any of the two
processes requires a careful consideration of the composition of the water to be desalinated
and the application of proper pretreatment in order to alleviate the extent of damage that
might result from the presence of certain chemicals or pollutants in the raw water [4].
Although the characteristics and composition of seawater tend to be stable, yet slight
variations could exist due to environmental conditions that persist at the locations from
where such waters might be tapped. SWRO desalination invariably requires the application
of a proper pretreatment procedure with the aim of lowering the fouling propensity of the
water on the RO membrane system [7], and which in turn, is divided into two categories
conventional and membrane pretreatment.
1.3 PROBLEM STATEMENT
Reverse osmosis membranes used in water desalination are capable of producing highly
purified water by removing all the salts and some other contaminants from different water
sources [8-12]. During the past several decades, tremendous strides were made in the
research related to development of Reverse Osmosis (RO) membranes, which has resulted in
the production of new membranes capable of withstanding wide pH ranges, higher
temperatures and pressures, increased flux and reduced solute concentration in the
permeate. But unfortunately, with all these new findings, membrane fouling and scaling
remain the two major operational and maintenance issues faced by membrane water
treatment plant operators. The short-term effects of fouling and scaling are; reduction of
treated water productivity, deterioration water quality combined with increase in energy
consumption. The long term effect being membrane replacement [13, 14].
Membrane fouling stands as one of the major issues in controlling sustainable operation
of both BRWO and SWRO systems as fouling normally leads to deterioration of the basic
membrane functions such as salt passage through the membrane, reduction in permeate flux,
pressure drop across the membrane due to membrane pore plugging as well as higher
operation costs due to higher energy demand, increase of cleaning frequency, and reduced

3
lifetime of the membrane elements [1]. Membrane fouling is normally associated with
particulate matter and colloids, organic and inorganic compounds, and biological growth.
Colloidal particles are typically composed of clay, organics (where humic substances
constitute the major portion in seawater [15]and metal inorganics, while biological fouling is
related to the presence of bacteria, fungus and algae where the microbial cells accumulate
and attach to the surface of the membrane thus promoting biofilm growth [7]. Membrane
autopsies carried out by various researchers have revealed membranes to have deposits of
calcium/magnesium phosphonate, calcium alumino silicate, and iron, biological and organic
matter [13, 16].
In the Lebanese healthcare sector the most significant costs associated with reverse
osmosis plants, aside from the capital cost, are the costs of electricity, membrane
replacement, and labor. This study aims at studying different strategies employed to reduce
that cost and designing a more cost efficient system for a hospital with well water intake.
Hospitals utilize RO membranes to provide fresh water for a variety of usages including:
Potable Water (provided to stakeholders)
Service water pumped through the system
Semi-Distilled water for usage in laundry and related machinery
Water for formula room
It can be noticed from the usages of RO permeate water in hospitals that the need for a
proper evaluation of the water is necessary at all times, the presence of Calcium leads to
scaling of pipes machinery and laundry equipment, the presence of bacterium leads to
sentinel events. Therefore, the maintenance and proper usage of RO desalination system is
vital for any hospital.
1.4 OBJECTIVES
The main aim of this research was to study the effect of operating parameters
(transmembrane pressure, crossflow velocity) and solute concentrations (clayand CaCO3) on
scaling of a Reverse Osmosis membrane, and clay-CaCO3 interaction on membrane
performance as such an RO membrane at the American university of Beirut, using two
different types of influent water were operated. Later on membrane autopsy took place to
4
check for fouling and scaling considerations on each membrane. The feed water will be
directly withdrawn from a well with brackish characteristics, the second variation of the feed
will include the same water exposed to precipitation softening as carried out by Ayoub, et al.
[17]. Afterwards permeate and reject characteristics will be analyzed to create a mass balance
and account for scaling parameters. PC software including ROSA and Toray DS2 to simulate
water passage through the RO membrane were employed to improve the outcome,
additionally data acquired was analyzed using statistical modeling such as ANOVA and
regressions to check for patterns, correlations and significant effect of different scalents, and
anti scalents. Finally the design of a state of the art RO for the hospital was demonstrated
with economic feasibility using different methods to avoid membrane scaling in such a facility.
1.5 THESIS OUTLINE
This dissertation is composed of 5 chapters. Chapter 1 introduces the present work.
Chapter 2 includes the accumulated knowledge of the author on the topic, every single aspect
was expressed in details from current studies ranging throughout the years and including top
journals with high impact factors. The concept of RO pretreatment will be introduced along
with chemical reactions involved. In addition, research efforts by international
researchers/experts in this field will be critically reviewed and summarized. Chapter 3
expressed the methodology by which the experiments, design, and analysis took place,
including a detailed report of the standard methods applied and their limitations.
Chapter 4 includes the RO design for the hospital at hand, in addition to the laboratory
scale RO system scaling and fouling autopsy result. The Data collected will be used in
comparing the efficiencies of the systems under varying operating conditions and
determining the efficacy of the system. Finally the future prospective and research
opportunities are explained in chapter 5.

5
CHAPTER 2
LITERATURE REVIEW
2.1 INTRODUCTION
Desalination is a process which provides alternative sources of water, and such a
process is becoming the most widely accepted around the globe, never the less limitations to
the process are highly affecting the extent of its spread. Current commercial desalination
technologies can be divided into thermal distillation (MSF and MED) and membrane
separation (RO) with some hybrid plants integrating both thermal and membrane
technologies [6, 18]. There are other commercial technologies with less application such as
vapor compression (VC) which is used with small size units and electro dialysis (ED) used in
the treatment of water with lower salinities. There are other desalination technologies as
forward osmosis (FO), membrane distillation (MD), capacitance deionization (CDI), and gas
hydrates (GH), freezing, humidification dehumidification (HDH) and solar stills many of which
are undergoing a phase of research and development (R&D), however non compare to the
advantages of using the RO membrane system [19]. Global desalination capacity by continent
and by process are shown in Figure 2-1 and Figure 2-2 respectively witch illustrates the
dominance of RO and thermal treatment over other technologies [19, 20].
Figure 2-1: Global desalination capacity by continent.

6
Figure 2-2: Global desalination capacity by process.
Nearly all types of desalination systems exhibit weaknesses, for example, the most
widely used desalination techniques such as RO desalination and MSF are highly affected by
the contaminants present in the water intake [21]. A major limitation in RO membrane
desalination is the presence of components such as Ca, Mg, bacteria, organic matter, and
silica which cause membrane fouling and deteriorate desalinated water quality [22]. Hospitals
are highly affected by fouling, mainly because the water quality is of most importance [23,
24]. With thermal desalination (MSF and MSD), the presence of such components also affects
the process, for example the presence of Ca and its precipitation at 120oC have a scaling effect
on the MSF treatment process, therefore limiting the TBT to 120oC or imposing the need for
the addition of chemical anti-scalents to the water, which are known to have a negative
impact on water quality and force additional economic burden to the process[6]. When it
comes to membrane technologies, both SWRO and BWRO alike have faced constant
challenges throughout their development, namely the disposal of the rejected brine/
concentrate, the carbon footprint of desalination plants, membrane sensitivity, and fouling
[25]. As membrane fouling and thermal scaling occur, the need for pretreatment in RO and
thermal desalination becomes unavoidable. Pretreatment is separated into conventional and
membrane pretreatment [26].
7
2.2 UNDERSTADING THE RO
The definition of RO is the means by which one demineralize or deionize water by
pushing it under pressure through a semi-permeable Reverse Osmosis Membrane, while
thermal desalination is a processes generally use heat to evaporate water, leaving dissolved
constituents behind. When it comes to water desalination, reverse osmosis is a membrane
technology that is most widely applied, additionally RO is recently being used in tertiary
wastewater treatment. This technology has the advantages of membrane processes such as
modular construction and small footprint, which allow the combination with other treatment
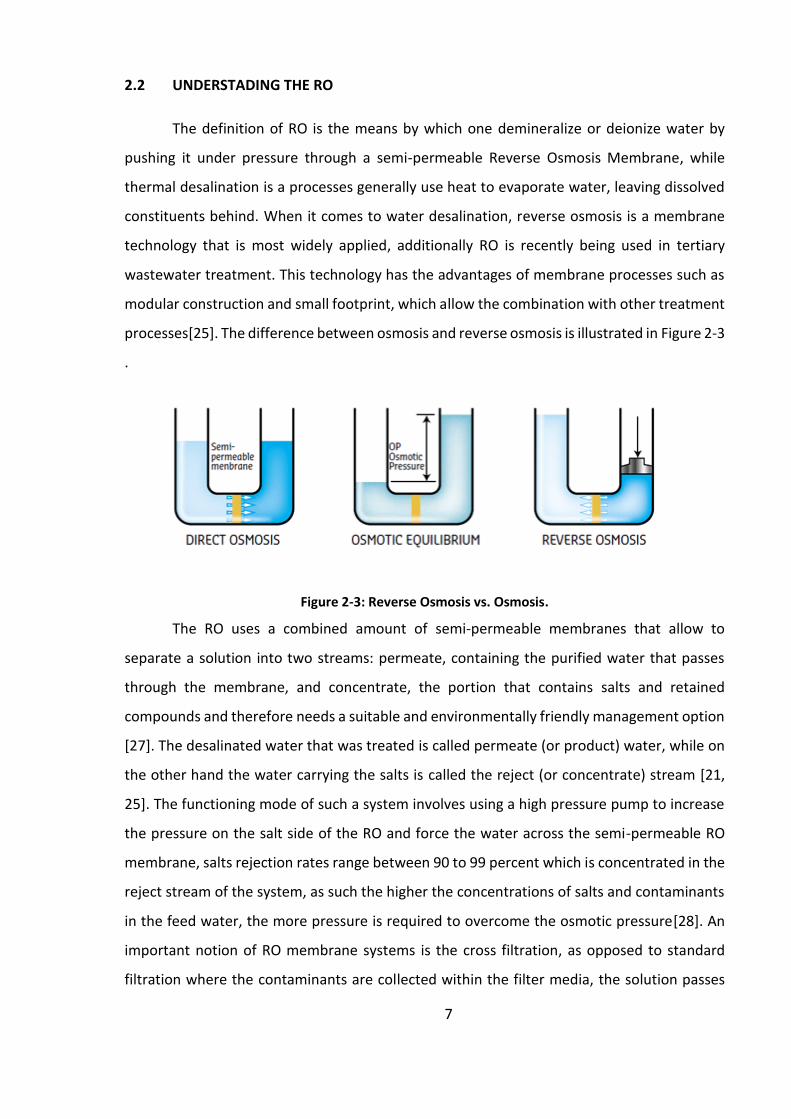
processes[25]. The difference between osmosis and reverse osmosis is illustrated in Figure 2-3
.
Figure 2-3: Reverse Osmosis vs. Osmosis.
The RO uses a combined amount of semi-permeable membranes that allow to
separate a solution into two streams: permeate, containing the purified water that passes
through the membrane, and concentrate, the portion that contains salts and retained
compounds and therefore needs a suitable and environmentally friendly management option
[27]. The desalinated water that was treated is called permeate (or product) water, while on
the other hand the water carrying the salts is called the reject (or concentrate) stream [21,
25]. The functioning mode of such a system involves using a high pressure pump to increase
the pressure on the salt side of the RO and force the water across the semi-permeable RO
membrane, salts rejection rates range between 90 to 99 percent which is concentrated in the
reject stream of the system, as such the higher the concentrations of salts and contaminants
in the feed water, the more pressure is required to overcome the osmotic pressure[28]. An
important notion of RO membrane systems is the cross filtration, as opposed to standard
filtration where the contaminants are collected within the filter media, the solution passes

8
through the filter or crosses the filter. The filtered water moves in a separate stream than the
contaminated or saturated water, a very clear advantage of such a pathway is the cleanup of
membrane surface whereby cross flow filtration allows water to sweep away contaminant
build up and also allow enough turbulence to keep the membrane surface clean. According
to empirical data RO has the ability to remove 99%+ of the dissolved salts (ions), particles,
colloids, organics, bacteria and pyrogens from the feed water, the major factor of the
rejection rates of contaminates is the respective size and charge of each contaminant[29].
Any contaminant that has a molecular weight greater than 200 is likely rejected by a properly
running RO system (for comparison a water molecule has a MW of 18). Likewise, the greater
the ionic charge of the contaminant, the more likely it will be unable to pass through the RO
membrane. Removal capacity of RO alongside other filtration processes are illustrated in
Figure 2-4. Additionally a model of typical hollow fiber RO membrane is shown in Figure 2-5.
Figure 2-4: Removal capacity of RO NF MF and UF.

9
Figure 2-5: RO membrane model.
2.3 MEMBRANE FOULING
The major limitation for RO membrane performance is membrane fouling. Four types
of fouling can occur, including inorganic (scaling), particulate, organic and biological. It has
been shown that fouling has adverse effects on membrane operation such as an increase in
pressure drop, decrease in salt rejection and flux decline [7, 30, 31]. Membrane fouling is the
loss of membrane permeability due to the accumulation of solutes onto the surface of the
membrane and/or into its pores. Fouling is one of the main disadvantages in membrane
filtration processes [32]. The term fouling is used for both reversible and irreversible solute
absorption, nevertheless the major problem in RO membrane is the irreversible fouling which
produces a flux decline that cannot be ceased via hydraulic membrane cleaning [33]. There
are various types of membrane fouling, often divided as inorganic scaling, colloidal
deposition, organic adsorption, and biofouling. The main contributors to RO membrane
fouling are colloidal particles and dissolved organic matters[34]. Si, Al, Fe, Ca and Mg were
found as the major inorganic foulants deposited on the RO membranes[35]. Humic and non-
humic NOM is the cause of organic fouling [36, 37]. Fouling reduces permeate retrieval
percentage and causes the deterioration of desalinated water quality. The frequent
replacement and chemical cleaning of membranes as a result of fouling increases the

10
operating cost, and ultimately shortens the lifespan of pressure membrane systems. This
imposes a large economic burden on RO membrane plant operation thus limiting the capacity
of such systems to replace conventional treatment systems[37]. Membrane fouling remains
to be the largest obstacle facing the RO desalination industry and membrane desalination
research, which aims at enhancing and maintaining the membrane flux without sacrificing
desalination efficiency [38]. Membrane fouling is conventionally measured using two indexes
the silt density index (SDI) and the modified fouling index (MFI) [39]. As such the types of
fouling in this review will be divided into 4 major categories as proposed by Vrouwenvelder
et al. [40-42]:
Crystalline/ inorganic material: Crystalline Si, Mg, Ca, etc.
Organic material: humic substances and oils
Colloidal/ particulate: Clay, humic substances, Si, debris
Biological: microorganisms forming biofilms on the membrane
According to Chong, et al. [43] the osmotic-resistance filtration model best describes
the fouling effect on flux with the following equations:
𝐽0 =∆𝑃−𝑀0∆Πb
𝜇𝑅m
(1)
𝐽f =∆𝑃−𝑀f∆Πb
𝜇(𝑅m+𝑅f) (2)
Where Jo is the water flux of a clean membrane, Jf is the water flux of a fouled
membrane, ΔP is the trans-membrane pressure ΔΠb is the osmotic pressure difference
between the bulk feed water and the permeate, μ is the feed water viscosity, Rm is membrane
hydraulic resistance, and Rf is additional hydraulic resistance caused by the cake layer, M0
and Mf are the concentration polarization (CP) modulus for the clean membrane and that for
the fouled membrane[38, 42, 43]. General membrane fouling processes caused by different
types of foulants are shown in Figure 2-6 [44].
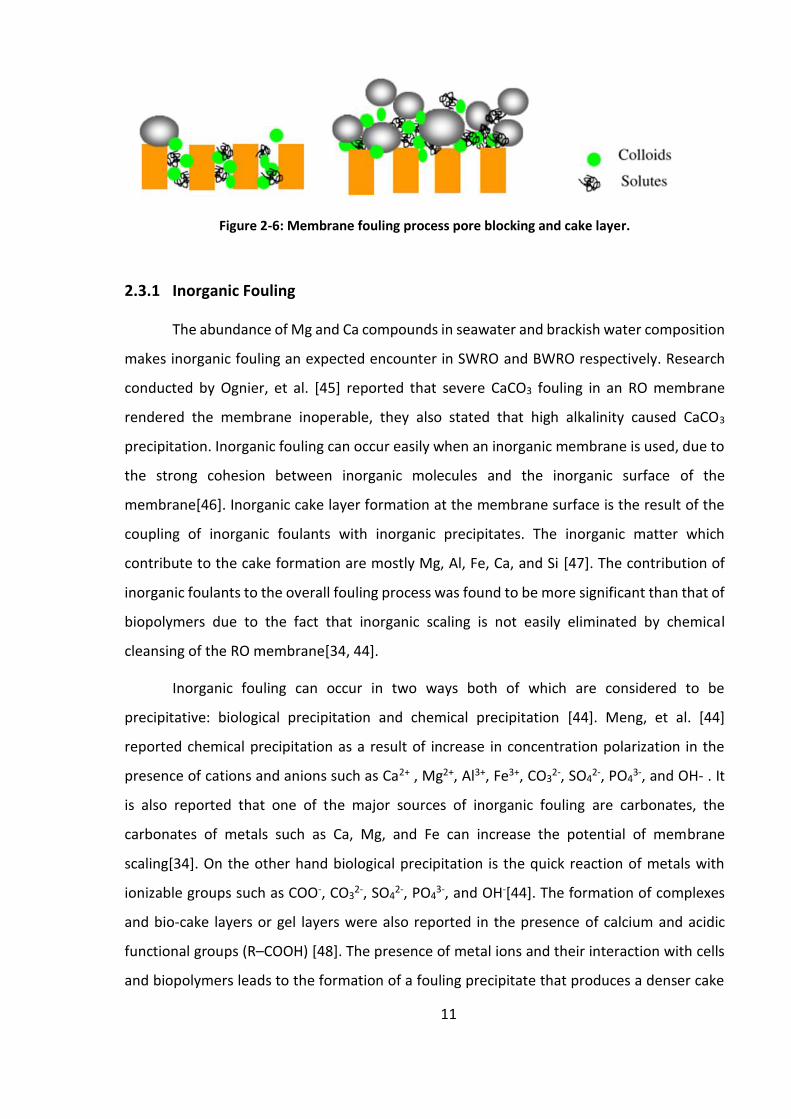
11
Figure 2-6: Membrane fouling process pore blocking and cake layer.
2.3.1 Inorganic Fouling
The abundance of Mg and Ca compounds in seawater and brackish water composition
makes inorganic fouling an expected encounter in SWRO and BWRO respectively. Research
conducted by Ognier, et al. [45] reported that severe CaCO3 fouling in an RO membrane
rendered the membrane inoperable, they also stated that high alkalinity caused CaCO3
precipitation. Inorganic fouling can occur easily when an inorganic membrane is used, due to
the strong cohesion between inorganic molecules and the inorganic surface of the
membrane[46]. Inorganic cake layer formation at the membrane surface is the result of the
coupling of inorganic foulants with inorganic precipitates. The inorganic matter which
contribute to the cake formation are mostly Mg, Al, Fe, Ca, and Si [47]. The contribution of
inorganic foulants to the overall fouling process was found to be more significant than that of
biopolymers due to the fact that inorganic scaling is not easily eliminated by chemical
cleansing of the RO membrane[34, 44].
Inorganic fouling can occur in two ways both of which are considered to be
precipitative: biological precipitation and chemical precipitation [44]. Meng, et al. [44]
reported chemical precipitation as a result of increase in concentration polarization in the
presence of cations and anions such as Ca2+ , Mg2+, Al3+, Fe3+, CO32-, SO4
2-, PO43-, and OH- . It
is also reported that one of the major sources of inorganic fouling are carbonates, the
carbonates of metals such as Ca, Mg, and Fe can increase the potential of membrane
scaling[34]. On the other hand biological precipitation is the quick reaction of metals with
ionizable groups such as COO-, CO32-, SO4
2-, PO43-, and OH-[44]. The formation of complexes
and bio-cake layers or gel layers were also reported in the presence of calcium and acidic
functional groups (R–COOH) [48]. The presence of metal ions and their interaction with cells
and biopolymers leads to the formation of a fouling precipitate that produces a denser cake
12
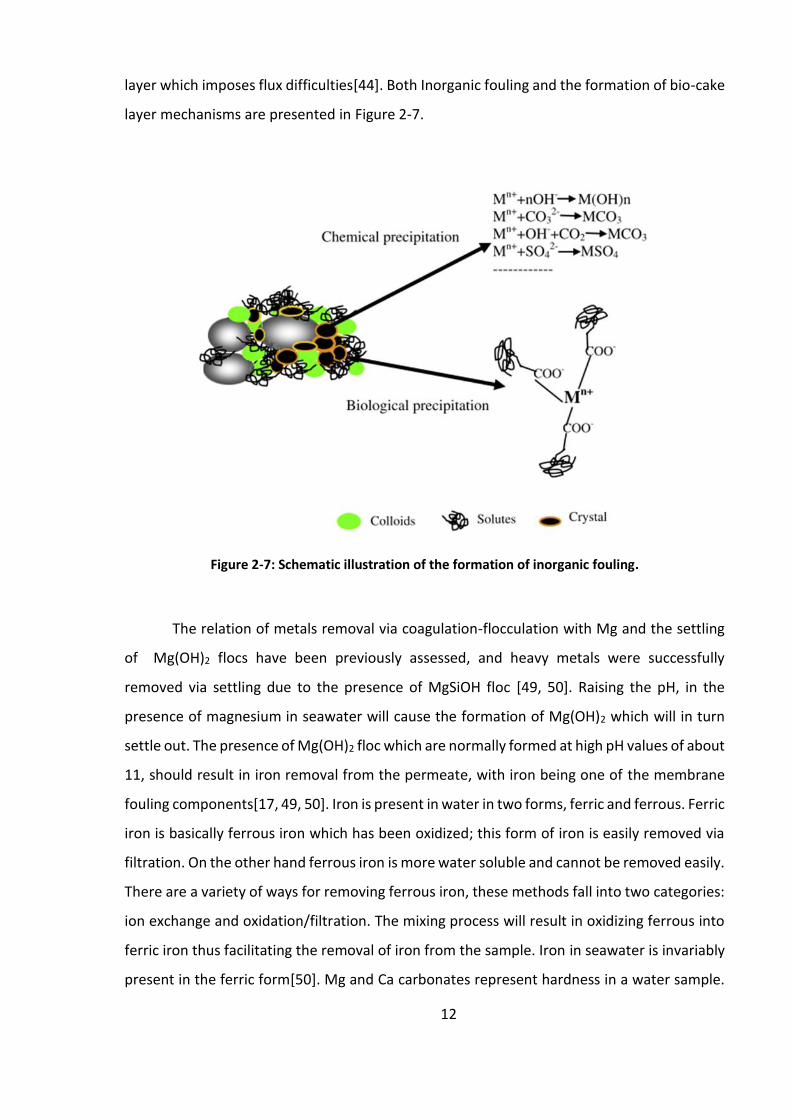
layer which imposes flux difficulties[44]. Both Inorganic fouling and the formation of bio-cake
layer mechanisms are presented in Figure 2-7.
Figure 2-7: Schematic illustration of the formation of inorganic fouling.
The relation of metals removal via coagulation-flocculation with Mg and the settling
of Mg(OH)2 flocs have been previously assessed, and heavy metals were successfully
removed via settling due to the presence of MgSiOH floc [49, 50]. Raising the pH, in the
presence of magnesium in seawater will cause the formation of Mg(OH)2 which will in turn
settle out. The presence of Mg(OH)2 floc which are normally formed at high pH values of about
11, should result in iron removal from the permeate, with iron being one of the membrane
fouling components[17, 49, 50]. Iron is present in water in two forms, ferric and ferrous. Ferric
iron is basically ferrous iron which has been oxidized; this form of iron is easily removed via
filtration. On the other hand ferrous iron is more water soluble and cannot be removed easily.
There are a variety of ways for removing ferrous iron, these methods fall into two categories:
ion exchange and oxidation/filtration. The mixing process will result in oxidizing ferrous into
ferric iron thus facilitating the removal of iron from the sample. Iron in seawater is invariably
present in the ferric form[50]. Mg and Ca carbonates represent hardness in a water sample.

13
Upon increasing the pH of a seawater sample flocs are formed. Depending on the specific
alkalizing agent used, different types of flocs such as Mg(OH)2 and CaCO3 are normally formed
[17, 49, 50].
The mechanisms of precipitation of inorganics are:
𝐶𝑎(𝑂𝐻)2 + 𝐻2𝐶𝑂3 ↔ 𝐶𝑎𝐶𝑂3 ↓ +2𝐻2𝑂
𝐶𝑎(𝑂𝐻)2 + 𝐶𝑎(𝐻𝐶𝑂3)2 ↔ 2𝐶𝑎𝐶𝑂3 ↓ +2𝐻2𝑂
3𝐶𝑎(𝑂𝐻)2 + 2𝑃𝑂4−3 ↔ 𝐶𝑎3(𝑃𝑂4)2 ↓ +6𝑂𝐻−
4𝐶𝑎(𝑂𝐻)2 + 3𝑃𝑂4−3 + 𝐻2𝑂 ↔ 𝐶𝑎4𝐻(𝑃𝑂4)3 ↓ +9𝑂𝐻−
Raising the pH by using NaOH (providing OH- ions) to a value greater than 10.5 in the
presence of Mg2+ ions will result in the following reaction [49]:
𝑀𝑔2+ + 2𝑂𝐻− → 𝑀𝑔(𝑂𝐻)2 ↓
When alkalized by either NaOH, or Ca(OH)2 magnesium sulfate and magnesium
chloride found in seawater will react to produce Mg(OH)2, following the reactions[51]:
𝑀𝑔𝑆𝑂4 + 𝐶𝑎(𝑂𝐻)2 → 𝑀𝑔(𝑂𝐻)2 ↓ +𝐶𝑎𝑆𝑂4
𝑀𝑔𝐶𝑙2 + 𝐶𝑎(𝑂𝐻)2 → 𝑀𝑔(𝑂𝐻)2 ↓ +𝐶𝑎𝐶𝑙2
𝑀𝑔𝑆𝑂4 + 2𝑁𝑎𝑂𝐻 → 𝑀𝑔(𝑂𝐻)2 ↓ +𝑁𝑎2𝑆𝑂4
𝑀𝑔𝐶𝑙2 + 2𝑁𝑎𝑂𝐻 → 𝑀𝑔(𝑂𝐻)2 ↓ +2𝑁𝑎𝐶𝑙
The coagulation-flocculation procedure is based on the theory of LMC (Lime
Magnesium Carbonate) process softening, in sea water it causes the production of
magnesium hydroxide and calcium carbonate which precipitate. In addition to pretreatment
using coagulation-flocculation, chemical cleaning agents such as EDTA are used to clean the
membrane. EDTA initiates ligand exchange reaction in the presence of Ca2+ which might
efficiently remove inorganics [51].
2.3.2 Organic Fouling
Organic matter is present in nearly all sources of natural water. Organic matter
includes bi-polymers such as proteins and polysaccharides, and natural organic matter (NOM)
[52]. Kim, et al. [53] stated that “Natural organic matter (NOM) is of concern in water

14
treatment, because it serves as the precursor for the formation of chlorinated disinfection by-
products (DBPs), it competes with synthetic organics for adsorption sites on activated carbon,
and it is a major foulant when water is treated by membrane filtration”. Humic substances
are refractory anionic macromolecules and are considered to be the major fraction of NOM
in the environment.
Organic fouling could cause either reversible or irreversible fouling. Flux decline is the
major effect of NOM fouling on the RO membrane. Chemical cleaning is considered to be a
solution for reversible flux decline, the addition of specified dosages can restore the flux lost
[17].On the other hand chemical dosing will not completely restore the flux in case of
irreversible fouling due to the presence of colloidal organic matter and the increase in
concentration polarization . Fouling caused by NOM can also be divided into external surface
fouling (build-up of a cake/gel-like layer on the upstream face of membrane) and pore
blocking fouling, an illustration of the two types is presented in Figure 2-6. Organic fouling by
NOM is affected by ionic strength (solution chemistry), pH, membrane surface, permeate flux
and operating pressure [54]. General effects on NOM fouling in membrane treatment is
illustrated in Figure 2-8.
Numerous studies were conducted to establish the effect of pH on NOM the results of
which indicate that NOM is denser at low pH as a result of the reduction of electrostatic
repulsion between the membrane surface charge and NOM [55]. Divalent cations also exhibit
a significant effects on NOM fouling; several researchers stated that as the Ca2+ concentration
increases in the presence of NOM the water flux decreases dramatically as a consequence of
the reduction reaction of the NOM and the surface charge of membrane. Flux drops were not
nearly as extensive in the presence of monovalent ions such as Na+[55].

15
Figure 2-8: Schematic description of the effect of solution chemistry on the conformation of NOM macromolecules in the solution and on the membrane surface, and the resulting effect on
membrane permeate flux.
It was also reported that membrane organic fouling potential and its effects on flux
loss is strongly dependent on Ca2+ concentration. Greenlee, et al. [21] offered an explanation
to the Ca2+ and NOM relation, whereby divalent cations interact with humic carboxyl
functional groups and reduce the charge and the electrostatic repulsion between humic
macromolecules, also according to Al-Amoudi [54]: “Divalent cations may also bridge two free
functional groups of humic acid. As a result, humic matter deposition onto the membrane
surface increases and a more densely packed fouling layer forms”. Other factors also interfere
with NOM fouling, for example membrane characteristics such as surface material and
roughness can increase fouling rate of attachment to the membrane [21, 39, 55]. Al-Amoudi
[54] summarized the methods used in NOM treatment by the following:
Changing operating conditions (in terms of flux, pressure, etc.)
Modifying the membrane (surface, type)
Antifoulants addition to the feed water
It is to be noted that NOM could be reduced by these methods but not prevented.
2.3.3 Colloidal Fouling
Despite developments in research on RO fouling the mechanisms involved in colloidal
fouling are still not entirely clear [56].Due to the size of colloids, which range between 1-1000
nm, such particles are capable of severely fouling RO membranes[57]. Colloids can be both

16
organic or inorganic at the stated size range, where major inorganic colloids present in RO
membrane fouling include aluminum silicate, silica, iron oxides/hydroxides, and elemental
sulfur [58], while organic colloids include polysaccharides, proteins, and natural organic
matter [59]. Also present are microorganism cells and cell debris which are classified as bio-
colloids [59].
Colloidal interactions are best represented by the Derjaguin–Landau–Verwey–
Overbeek theory (DLVO). It defines colloidal interaction as a function of both electrostatic
forces also known as electrical double layer (EDL), and Van der Waals force [56, 59]. Colloidal
interactions can be dominated by acid base interaction forces at high ionic strength (e.g., in
seawater) where the electrostatic interactions and VDW forces are minimized.
Valavala, et al. [60] stated that : “Suspended and colloidal particles foul a membrane
by coagulating together and forming a cake-like layer on the membrane surface, while
dissolved organics interact directly with the membrane surface and with each other to cause
fouling”. Colloidal fouling potential is highly increased in the presence of inorganic and organic
matter. Colloids can form a layer on the RO membrane “cake layer”. Other colloids, mainly
those with strong colloidal interaction (like polysaccharides in the presence of Ca, tend to
cause excessive fouling via the formation of a large three dimensional cross linked layer (gel
layer). The formation of a deposit layer on the RO membrane surface will affect membrane
flux in two ways. The first is by reducing membrane permeability, and thus forcing a higher
pressure input to maintain a constant permeate flux [60].The second is the effect imposed by
the porous layer of the cake created due to colloidal fouling, a phenomenon known as cake-
enhanced osmotic pressure (CEOP), which increases concentration polarization inside the
cake layer and significantly increases the solute concentration at the membrane surface. Thus
CEOP tends to reduce flux at constant pressure or vice versa [59]. Colloidal cake formation
can be affected by many factors, and according to Tang, et al. [59] factors can be summarized
in three groups shown in Figure 2-9.

17
Figure 2-9: Factors affecting colloidal fouling on membrane.
Feed water composition is important in determining the fouling potential, different
water intakes exhibit different types of foulants, and at different concentrations, solution
chemistry, pH, and ionic strength can drastically affect the properties of colloidal particle
present in the intake. Many of the important colloidal physiochemical properties can be
drastically affected by solution chemistry [61]. The second factor is the membrane itself, the
properties of membranes differ according to manufacturers’ preferences, surface roughness,
charge properties, and hydrophobicity [62]. In addition, studies reported by Jeong, et al. [63]
stated that:
“Smooth, low surface charge, and more hydrophilic membranes tend to show better
anti-fouling properties at the initial stage of membrane fouling. Nevertheless, under severe
fouling, this is not observed due to the fact that fouling may be dominated by deposited
foulants and foulant interaction instead”
The third factor controlling colloidal fouling mechanisms is the plant operating
conditions; variations in flux and cross flow velocity will impact the fouling mechanism. Severe
fouling can occur at higher membrane flux and/or lower cross flow. The cross flow affects the
mass transfer rate over the membrane surface [56, 59]. A higher cross flow will limit
membrane fouling potential due to colloidal particles by reducing the boundary layer
thickness and concentration polarization. Temperature variation can also significantly affect

18
colloidal fouling [59]. A scheme of colloidal fouling on the RO membrane surface is shown in
Figure 2-10.
Figure 2-10: Concentration polarization and CEOP (a) before membrane is fouled and (b) after membrane is fouled.
Media filtration is a method by which some colloids are removed from feed water;
however colloids that can highly impact the operation are finely dispersed solid particles or
liquid droplets that escape filtration by sand, multimedia and 5 or 1 micron guard filters [38,
62, 64].The control and removal of colloidal silicates and colloidal sulfate through chemical
addition (disinfectants and anticoagulants) proved to be effective. The removal of colloidal
silica and colloidal organic matter will be discussed in their respective sections. Some
treatment methods employed in removing colloids are:
Disinfection (to eliminate Bio colloids)
Membrane cleaning
Coagulation-flocculation with aluminum sulphate and ferric chloride
The coagulation-flocculation reactions as reported by Kim, et al. [65]:
Al2 (SO4)3 + 3 Ca (HCO3)2 ↔ 2 Al(OH)3 (↓)+ 3 CaSO4 + 6 CO2
Al2 (SO4)3 + Na2CO3 + H2O↔ 2Al(OH)3 (↓)+ 3 Na2SO4 + 3 CO2
Al2 (SO4)3 +6NaOH ↔ 2Al(OH)3 (↓)+ 3 Na2SO4
Al2 (SO4)3 + 6 H2O ↔ 2Al(OH)3 (↓)+ H2SO4
2FeCl3 + 6HCO3 ↔ 2Fe(OH)3 (↓)+ 6Cl- + 6CO2

19
2.3.4 Biological Fouling
Biofouling is the formation of biofilm on the RO membrane surface as a result of
bacterial attachment to the membrane. Once the bacteria are attached, they grow, multiply,
and relocate leading to severe biofilm formation, which decreases membrane performance
[53]. This type of fouling cannot be removed through pretreatment alone, due to the nature
of bacteria. If 99.99% of all bacteria were removed in the pretreatment stage a few surviving
cells entering the system will adhere to membrane surfaces, and multiply at the expense of
biodegradable substances dissolved in the feed water[31]. Biofouling has already infected
70% of the seawater RO membrane installations [7]. It was found that such fouling occurs
even after water intake pretreatment and the addition of Cl disinfectant [31].
Microorganisms present in feed water adhere to the membrane surface, the nutrients
in the water intake aid in their growth. The microorganisms secrete extracellular polymeric
substances (EPS) to form biofilms [31]. Biofilm’s physical and physiological properties are
reliant on the EPS and the nature of bacterial cells respectively, events through biofilm
formation occur as explained by Matin, et al. [7] are presented in Figure 2-11.
Figure 2-11: of Sequence events leading to the formation of a Biofilm.
The cell detachment stage is the last stage of biofilm formation, during this stage
microbial cells disperse from the population and subpopulations of detached mature biofilm
cells reinitiate biofilm formation on new sites[36, 66]. Afterwards the biofilm begins its

20
development process on the membrane surface; the three general phases of biofilm
development on the membrane surface are shown in Figure 2.7.
Figure 2-12: Time-dependent development of biofilm accumulation: Δ, biofilm growth parameter (thickness, weight, etc.); inset, primary colonization; threshold of interference, arbitrary extent of
biofilm development above which the biofilm interferes with the performance of a membrane system.
According to Matin, et al. [7] “The induction phase is characterized by an initial rapid
primary colonization followed by a primary plateau, during this phase adhesion is essentially
proportional to the cell density in the water phase and occurs owing to weak physicochemical
interactions. The second phase is the logarithmical growth phase, when cell growth on the
surface contributes more to biofilm accumulation than does the adhesion of cells suspended
in solution (water intake). Afterwards, the biofilm growth (adhesion and multiplication) is in
balance with cell detachment and cellular senescence. This stage is known as the plateau
phase and is mainly controlled by nutrient concentration and the resultant growth rate, the
mechanical stability of biofilm, and the effective shear forces. When this phase is reached,
the original surface properties of the membrane are masked by the biofilm”
Biofilm has the capacity to act as a secondary membrane when attached to the surface
of RO membrane leading to permeate flux decline, thus forcing a boost in system pressure to
compensate for the lost flux. Such compensation will increase energy consumption especially
in large separation facilities of more than 4×10⁶ L/day capacity where high electrical pumping
costs are needed to maintain operating pressures and constant product output [7]. Biofouling
of the RO membrane can be separated into two mechanisms, bacterial cells which hinder the

21
back diffusion of salt, which results in elevated osmotic pressure on the membrane surface
(increase in TMP), and hence a decline in permeate flux EPS contributes to the decrease in
flux by increasing hydraulic resistance to permeate flow.
Biofouling can occur at any given time even during membrane transfer, storage and
maintenance operations, therefore control and prevention of such fouling are necessary.
Pretreatment (conventional/membrane) reduces biofouling potential, however to a limited
extent [36]. Membrane pretreatment can obtain a lower SDI thus it can be more effective
than conventional pretreatment in inhibiting biofouling [42]. The most common method of
treatment when it comes to biofouling is the continuous dosage of chemicals which are able
to deactivate microorganisms [32, 67]. Chlorine has been dominantly used for disinfection
purposes in SWRO. Biofilm growth was not recorded when using chlorinated water containing
a residual of 0.04– 0.05 mg/L free chlorine [7]. Chemical used in disinfection processes include
free chlorine (i.e. HOCl, OCl−), chloramines (NH2 Cl), and chlorine dioxide (ClO2).
The strong oxidation potential of chlorine can cause deterioration of the RO
membrane due to chemical attack of the amide functional group present on the RO
membrane surface[46]. The addition of chlorine to water containing organic matter results in
the generation of carcinogenic by-products such as trihalomethanes (THMs) and halo acetic
acids (HAA) [46]. A more effective chemical to be used in SWRO is ozone which is a strong
oxidant as well. It has been shown to be effective against biofilms with reduced production
of toxic byproducts. However, the cost for ozone generation is high compared to that of
chlorine. Another major disadvantage of ozone usage is the generation of bromine
compounds that are carcinogenic and cause membrane surface deterioration [30].
Photochemical inactivation via UV radiation has recently seen a rebirth in usage, it is
independent of pH and does not produce disinfection byproducts it should also be noted that
both, high and low pH values, result in the inactivation of bacterial and viral content in water
[68]. In conclusion all treatment methods adopted for biofouling prevention exhibit
advantages and disadvantages.

22
2.4 PRETREATMENT
The objectives for pretreatment of water destined for RO processing are set to
eliminate the impurities that might have fouling impact on the RO membrane [69]. Reverse
osmosis membranes are very sensitive to foulants such as Si, Colloids, organic matter,
bacteria, Ca, and Mg [70, 71], thus pretreatment is a necessary step before SWRO.
Performance of an RO system and its life span will only be as good as the quality of feed water
it is receiving [69]. Pretreatment includes a variety of methods (conventional/membrane)
incorporated to alter the components of seawater thus improving the RO overall process [60].
Overall simplified scheme of current pretreatment methods is illustrated in Figure 2-13.
Figure 2-13: Conventional pretreatment and membrane pretreatment.
2.4.1 Conventional pretreatment
Conventional pretreatment typically consists of acid addition, coagulant addition,
disinfection, media filtration, and cartridge filtration, and activated carbon adsorption [21].
The first chemical additions, including acid, coagulant, and flocculent, prepare the feed water
for granular media filtration[72]. Acid treatment reduces the pH of the feed water (typical pH
range 5–7), which increases the solubility of calcium carbonate, the key potential precipitate
in many feed waters. The most common acid used to lower feed water pH is sulfuric acid
(H2SO4)[70]. According to Ma, et al. [69] the steps of conventional pretreatment are:

23
“Suspended solids are removed by filtration, pH adjustments (lowering) are made to
protect the membrane and control precipitation of salts; antiscaling inhibitors are added to
control calcium carbonates and sulfates. A disinfectant is added to control biofouling of the
membrane. Disinfection can involve chlorine species, ozone or UV light and other agents.
Marine organisms, algae and bacteria must be eliminated, and if ozone or chlorine are used
they should be neutralized prior to contact with the membrane”
Coagulation is known to be an efficient process of removing colloids and particulate
matter. However, studies proved that the type of coagulant used can have a negative effect
on the RO membrane, examples of such coagulants are aluminum sulfate and ferric chloride
[60]. Conventional pretreatment is costly, space-consuming, and the filtrate quality and
quantity are usually not steady [29].
2.4.2 Membrane pretreatment
Irreversible RO membrane fouling was reported in many SWRO and BWRO
desalination plants even in the presence of conventional pretreatment, due to the passage of
colloids and suspended particles through such treatment systems[73], this resulted in an
increased tendency towards membrane pretreatment. Membrane pretreatment involves the
use of lager pore size membrane such as UF/MF/and NF, and the selection of a specific
membrane for pretreatment is dependent on the associated contaminant removal issues in
comparison to the intended feed water chemistry[60]. NF membranes have the smallest pore
size of all three and can operate under higher flux, whereas MF removes large particulate
matter at higher flux, and NF removes dissolved contaminants as well as particulate and
colloidal material[21, 74].
A study conducted by Durham et al. (2001) compared the effectiveness of membrane
filtration (MF/UF) to that of conventional systems, the advantages related to the former
system as reported by Greenlee, et al. [21]:
Chemistry of the water intake, whereby the quality of the MF/UF product water was
found to be independent of feed quality
Capacity of the system and the space available
Amount of cleaning or maintenance required for the pretreatment system
Reliability, capital and operating costs of the NF or RO system reaching an SDI<2

24
Turbidity of the pretreated water can be lowered to less than 0.05 NTU
When comparing NTU and SDI values to that of conventional system which employ
the use of pressurized media filtration, the latter reduced SDI by a factor of 2 and turbidity
was recorded to be around 0.1 NTU [73]. The major drawback of using membrane
pretreatment is that (UF/MF/NF) membranes can become fouled themselves with reversible
and irreversible surface and pore fouling [21]. Seawater contains a tremendous amount of
salts which also poses a threat to NF membranes operation which is vulnerable to salt
precipitation and membrane scaling, due to the much smaller pore sizes[74]. The fact that
membrane pretreatment technologies are exposed to fouling just as intensely as the RO
membrane itself, coagulation with FeCl3 or Al3SO4 has been successfully used in line with
MF, UF, and NF membranes[60].
2.5 RJECT AND BRINE DISPOSAL AND TREATMENT
The properties of the brine are a function of the feed water quality, the desalination
process of choice, the recovery rate, and the added chemicals during the process [75].
Disposal and treatment of RO rejects/concentrate from desalination plants is a function of
plant location, for example coastal desalination plants directly discharge to seawater, while
in inland plants the most widely accepted method is to reduce the concentrate volume prior
to disposal [56]. Volume reduction can be easily achieved via evaporation techniques, the
main premise of such techniques is to obtain and easily manageable solid waste portion with
a decontaminated liquid portion that can be reused [76]. Another aspect is to reduce
contaminant load of the reject which occupies a significant amount of allocated funding
towards RO optimization R & D. Stanford, et al. [77] elaborated on the beneficial use of brine
byproducts and proved the technical feasibility of isolating salts of the required morphology
and purity, therefore proving that recovering commercial byproducts from RO concentrates
would be the optimum treatment option, as it solves the environmental problem of
concentrate disposal, as well as the economic profitability of reverse osmosis is improved at
the same time.
Malaeb and Ayoub [25] Conducted an extensive literature review and summarized the
traditional treatments available for reject disposal such as evaporation and crystallization

25
other technologies that have emerged in recent years to reduce the volume of the
concentrate before disposal, the WWTP section focused on reducing the organic pollutant
load through the application of innovative advanced oxidation technologies as shown in
Table 2-1.
Table 2-1: Evaluation of viability of treatment technologies applied to RO concentrates.
RO concentrates source Technology Technological
maturity
Operation drawbacks and
economic considerations
Desalination plants Solar evaporation
(Evaporation ponds)
Industrial
application
Large land areas
Low productivity
Moderate investment and
maintenance cost
WAIV
wind aided intensified
evaporation
Pilot plant scale Industrial feasibility not proved
Moderate investment cost
Membrane distillation Laboratory level Difficult operational control
Scaling and fouling
Moderate energy consumption
Forward osmosis Laboratory level Use of drawn solution
Moderate energy consumption
Liquid–liquid extraction Laboratory level Several treatment stages
Extractants consumption
Wastewater treatment
plants
Ozonation Laboratory level High chemical dosage
High investment cost
Fenton processes Laboratory level High chemical dosage
Moderate investment cost
Photocatalysis and
photooxidation
Laboratory level High chemical dosage
Moderate energy consumption
Sonolysis Laboratory level High energy consumption
Electrochemical
oxidation
Laboratory level High energy consumption
Moderate investment cost
Adsorption Laboratory level Regeneration of exhausted
resins (High chemicals
consumption)
Desalination and
wastewater treatment
plants
Electrodialysis Pilot plant scale Maintaining energy efficiency
with high saline concentrates
Precipitation on the membrane
High capital and operation cost
Crystallization Laboratory level Stricted operational conditions
SAL-PROC Patented process Applicability to RO concentrates
not completely proved
Other industrial sources EFC Pilot plant scale Complex control of operation
Moderate energy consumption
26
2.5.1 Brine Disposal
Managing brine can from RO plants can prove to be a difficult task, both economic and
environmental aspects of the process need to be addressed. For example; evaporation ponds,
can be reasonably priced but require land availability and pose a significant risk of flooding
and leakage of salts and adverse chemicals into the soil or groundwater[78, 79]. In some
regions, irrigation using the brine can be implemented, however the adverse effect on plant
growth and salt levels in the soil has proven to be a serious issue [80]. Estuaries or lakes
discharge may disturb the stability in the aquatic ecosystem, thus impairing the livelihood of
certain sensitive species, since it may have up to ten-fold the concentration as the raw water,
containing toxic chemicals, with an even higher density [78, 81]. Other discharge methods
include land disposal in unlined surface depressions, addition of the reject flow to a
wastewater stream, further concentration into solid form, and injection below water aquifers
[28, 80]. And additional problem to discharge of brine arises when the fact that high
temperature brine disposal gets into the picture, BWRO plants seldom discharge brine at high
temperatures, so thermal pollution to the receiving habitat is not a serious concern[82]. Yet,
brackish water reject tends to be more difficult and perhaps more costly to manage,
particularly if the RO plant is located away from the coast or from any wastewater network
that would otherwise facilitate the selection of disposal technique[10, 83]. As well, costs of
brine disposal are subject to regulatory enforcement, and they are affected by the quality and
quantity of the concentrate [28, 80, 84, 85]. According to the ESCWA, concentrate disposal
expenses can account for up to 33% of total costs in a desalination plant, especially so for
inland BWRO plants due to the limited availability of disposal options [17, 25].
2.5.2 Brine Treatment
It is important to add that in some cases, the brine undergoes treatment, depending
on local environmental guidelines and on the disposal option selected. These include, but are
not limited to, disinfection, aeration, degasification, and other processes [25]. The ideal target
would be to minimize liquid effluent and recover useful or valuable products from the brine,
transforming the waste into commodity [75, 76, 79]. Precipitation or lime and soda ash
softening has also been tested for treating RO concentrate by effect of pH increase, in order

27
to aid in the removal of certain scaling precursors like calcium, magnesium, and barium [10,
84, 85]. Moreover, carbon dioxide air stripping was explored as a method to enhance calcium
precipitation by pH increase for BWRO concentrates with high carbonate concentrations.
According to Malaeb and Ayoub [25] “Membrane distillation has been studied as alternative
for the processing of highly concentrated aqueous solutions. Vacuum Membrane Distillation
(VMD) is an evaporative technology that uses a membrane to support the liquid–vapor
interface”. Additionally Urtiaga, et al. [86] studies the main advantages of membrane
distillation over conventional distillation processes are that the operating temperature is in
the range of 60–80°C and that the membranes provide a high contact area per unit of
equipment volume, allowing very compact installations and reduced footprint. Mericq, et al.
[87] Assessed such systems at higher yield (40000 m3/d) and concluded that recovery has
increased by a significant fraction of 40% to 89% of water after coupling the RO with VMD.
Another advanced treatment option for RO brine is the coupling with Membrane
distillation-crystallization MDC (only applicable with seawater RO brine with TDS >50,000
ppm) [88]. MDC process allows crystallization via super salt saturation which is turn allows its
crystallization [89]. The MDC employs hollow fiber membranes to reach a high contact state
which allows the process to achieve reliable evaporation fluxes at moderate temperatures
(40–50 °C) with energy consumption of about 15–20 kW h/m3 half the energy requirement of
the conventional treatment process which is about 30 KW h/m3 [90].
2.5.3 Zero Liquid Discharge Systems
Some efforts include selling recovered salts and byproducts, irrigating salt-tolerant
crops, cultivating marine species like brine shrimps, and applying the zero liquid-discharge
concept (ZLD) [19, 75, 79]. ZLD can be achieved once the recovery reaches 100%
approximately, where all the salts are retrieved and good-quality water is produced [21].
Some attempts toward ZLD include intermediate chemical demineralization (ICD) processes
like using seawater RO along with further chemical addition to induce precipitation for BWRO
concentrate, where Gabelich, et al. [10], [91] accomplished higher removal levels of calcium,
strontium, barium and silica. As well, electrodialysis (ED) and electrodialysis reversal (EDR)
can give higher recovery than RO when used in several stages [28, 80, 84, 85]. Also, since the
presence of antiscalants and major scale-causing species, such as silica and barium sulfate,

28
hinders the effectiveness of the mentioned processes, researchers have examined treatments
like ozonation for their removal [74, 83, 92]. Experiments have been conducted using
membrane distillation (MD), a cross between membrane and thermal processes, to
effectively concentrate a groundwater RO reject [25, 93]. The salt recovery scheme for a
sample ZLD is illustrated in Figure 2-14 [84, 85].
2.6 CONCLUSION
RO technologies are continuously advancing throughout the years, R& D efforts
towards optimizing RO systems and its related fields are widely practiced throughout the
globe. Such actions rendered RO as the optimal system for both sea and brackish water
desalination. Even though the RO system possesses some disadvantages such as membrane
fouling and scaling, solutions to limit such issue are always available. Pretreatment of water
intake is a must in almost all systems, this includes conventional pretreatment which has been
employed for more than three decades. Alternatives to such systems are the membrane
pretreatment which is more adequate and aids in conserving the RO membrane and
eventually a better quality of product water. However the cost of such systems might vary
tremendously, some of which are much higher than that of a conventional pretreatment.
Brine disposal and management is a new trend in the RO industry due to raised awareness
towards ecological and environmental matters, new systems with ZLD aided in transforming
the RO technology into a green technology.
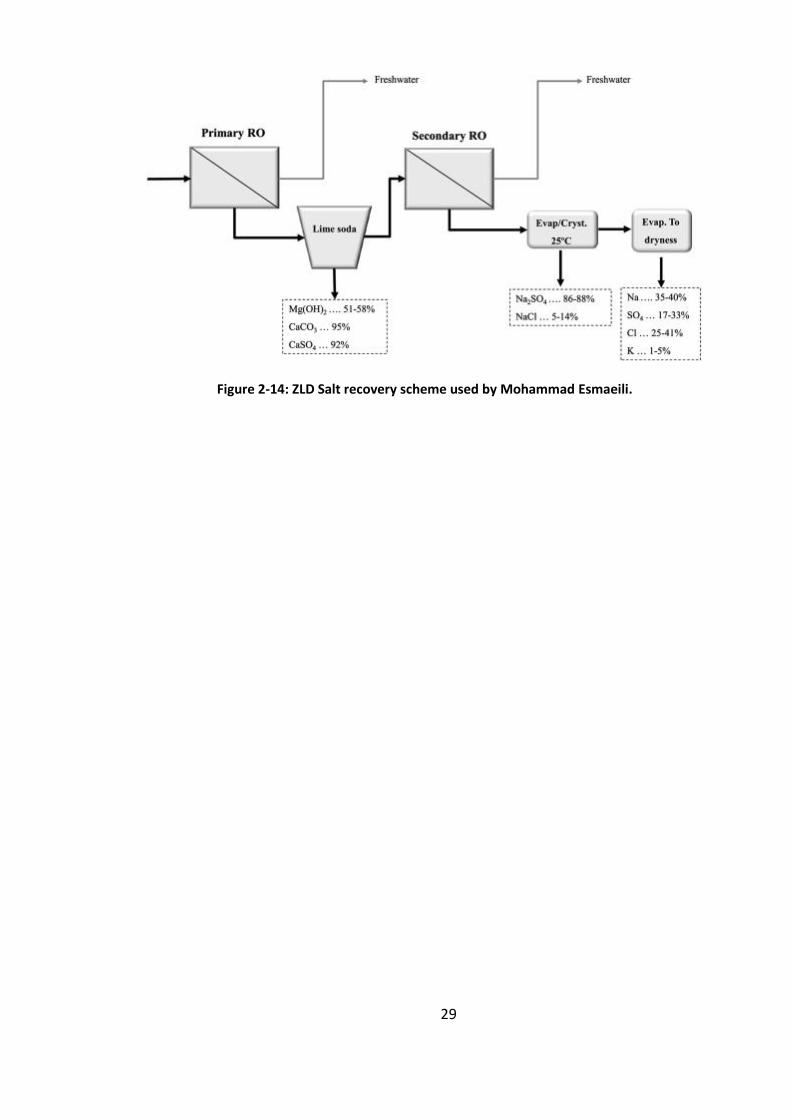
29
Figure 2-14: ZLD Salt recovery scheme used by Mohammad Esmaeili.

30
CHAPTER 3
RESEARCH DESIGN AND METHODOLOGY
3.1 INTRODUCTION
The proposed research entailed the collection of brackish water, which was obtained
from a groundwater well with slightly high salinity (TDS) in Tyre, South Lebanon. This
particular well water was selected based on prior laboratory analysis showing that its
chemical constituents are comparable with those of other typical brackish waters reported in
the literature.
3.2 WATER INTAKE
The proposed research entailed the collection of brackish water, which was obtained
from a groundwater well with slightly high salinity (TDS) in Beirut, Lebanon. This particular
well water was selected based on prior laboratory analysis showing that its chemical
constituents are comparable with those of other typical brackish waters reported in the
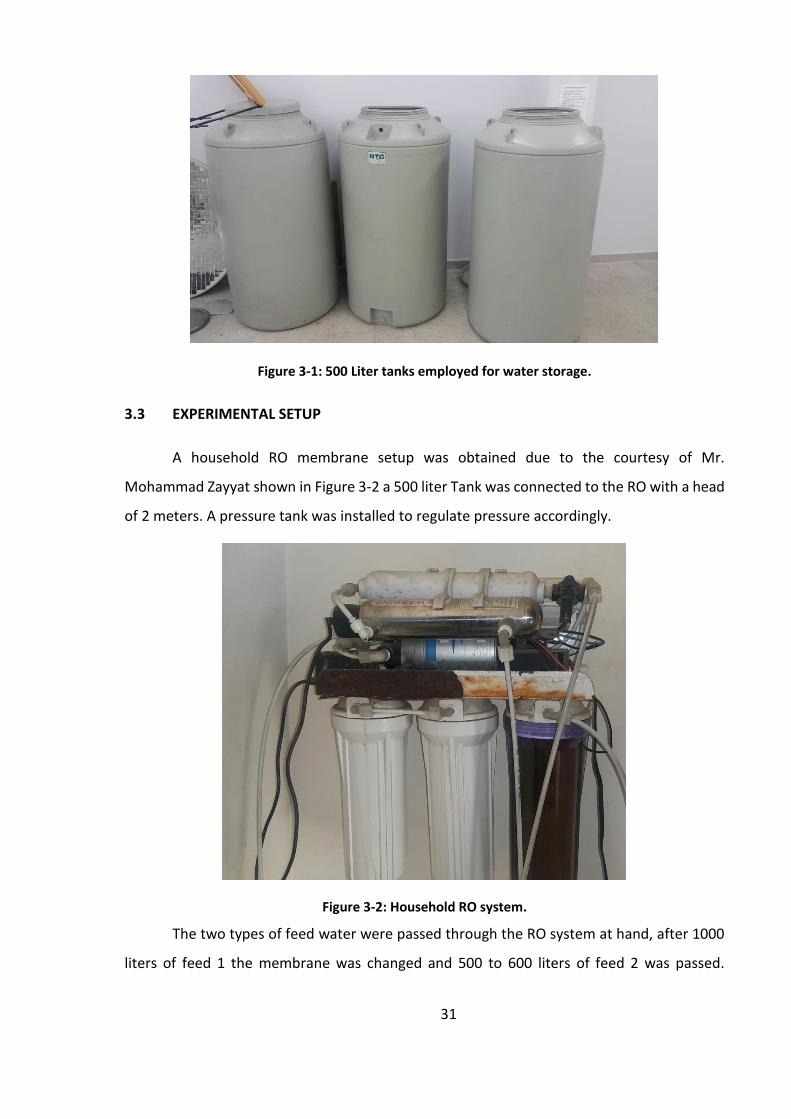
literature. Three 500 L tanks were used to collect and transfer the brackish water from the
sampling location to the American University of Beirut. The water was stored in the 500 L
tanks over a period of 5 months from October 2016 until the end of the experiment on the
beginning of March 2016. All storage tanks were cleaned and rinsed twice with the sample
water itself before filling and storage. The second type of feed was that of alkalized
pretreatment using NaOH:Na2CO3 1:1 as explained by Ayoub, et al. [17].
31
Figure 3-1: 500 Liter tanks employed for water storage.
3.3 EXPERIMENTAL SETUP
A household RO membrane setup was obtained due to the courtesy of Mr.
Mohammad Zayyat shown in Figure 3-2 a 500 liter Tank was connected to the RO with a head
of 2 meters. A pressure tank was installed to regulate pressure accordingly.
Figure 3-2: Household RO system.
The two types of feed water were passed through the RO system at hand, after 1000
liters of feed 1 the membrane was changed and 500 to 600 liters of feed 2 was passed.

32
Membranes were collected and placed on the proper autopsy setup holder as shown in
Figure 3-3.
Figure 3-3: Membrane and Autopsy Preparations.
3.4 PRODUCT AND REJECT
BWRO and BWRO product water were collected after the process of a Laboratory scale
RO system. The water was stored in 20 liter gallons at 23-25 degrees Celsius for the span of
the experiment. The BWRO membrane was placed at American University of Beirut, Faculty
of Engineering, chemical engineering Lab FS1 at around 50% recovery rate.
3.5 TESTING AND ANALYTICAL PROCEDURES
Within the objectives of the research at hand, both types of the sample water were
analyzed frequently based on the standard methods by APHA, AWWA and ACS for the
following parameters: pH, temperature, conductivity, TDS, TSS, VSS, calcium, magnesium,
silica, iron, boron, strontium, barium, sodium ions, and fecal and total coliform. The
experimental study was carried out at the Environmental Engineering Research Center at
AUB, over a year’s time, with a total of 6 months of uninterrupted laboratory work. These
experimental conditions were chosen to be consistent with findings from the literature and
previous work done in this field of study and are presented in Appendix A.

33
Software used for analyzing data was Minitab, Excel and phreeqc. Phreeqc was used
to determine the actual variation between the theoretical settling material and those who
fouled the RO membrane. Additionally ROSA and TORAY DS2 were used to check the hospital
RO design system. A comparative analysis was performed in comparison to program
simulation data and that obtained in laboratory testing.
3.6 MEMBRANE AUTOPSY
As demonstrated in Figure 3-4 the membrane was placed on a membrane holder and
the adhesive layer was carefully removed. Contact with hands was avoided at all times due to
contamination risk.
Figure 3-4: Membrane autopsy setup.
The membrane was separated into two parts, membrane layers and spacers. Spacers
are not of huge significance as they do not hold any deposits; the purpose of the spaces is to
The fouling is principally a result of dissolved organic material, or fine suspended solids
that have made it past the pre-filter system. As such samples collected shown in Figure 3-5
will be analyzed for total organic Carbon, Total Carbon, Total inorganic Carbon using Shimadzu
TOC analyzer TOC-V CSH with Solid sample module SSM 5000A. The next step was to collect
foulant off of the membrane sheet, and analyze it for chemical composition using SEM.

34
Figure 3-5: Membrane surface foulant removal.
3.7 MEMBRANE SURFACE ANALYSIS BY SEM
The SEM (scanning electron microscope) enables an investigator to create and
examine an image of the morphological features of a material. The SEM creates a seemingly
three-dimensional image of material by bombarding it with a focused electron beam. It is
used to characterize particle size, shape, texture, and topography. In this research it was
employed to determine the chemical (elemental) composition by measuring the energy of
characteristic X-rays emitted when the material is bombarded by the SEM electron beam.
Scanning electron microscope-energy dispersive spectroscope capability offers timely,
comprehensive, accurate data analysis and evaluation. The SEM from TESCAN, VEGA 3 LMU
with OXFORD EDX detector (INCA XMAW20) present at CRSL AUB is show in Figure 3-6.
Samples obtained from the RO membranes were attached to a High Purity Conductive Carbon
Tabs, 12mm double coated from PELCO Tabs™ Figure 3-7. The samples were later placed into
the SEM for analysis. Elemental analysis was performed using INCA software provided by
Oxford-Instruments.
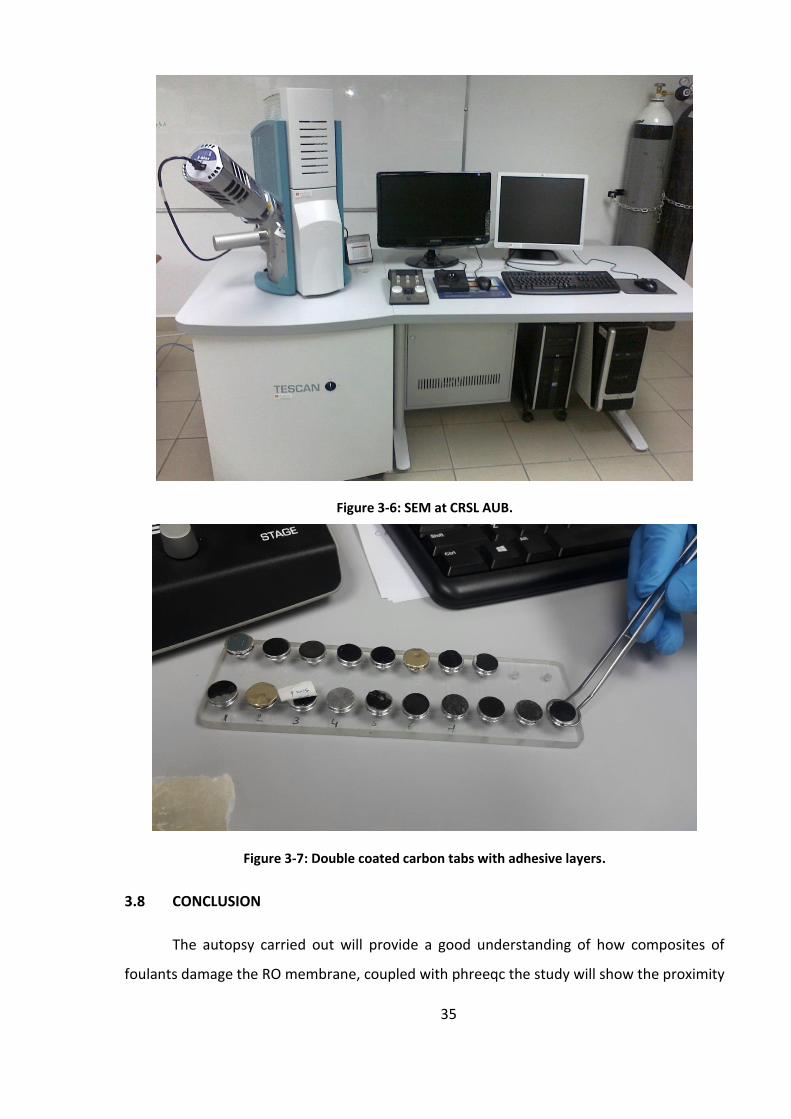
35
Figure 3-6: SEM at CRSL AUB.
Figure 3-7: Double coated carbon tabs with adhesive layers.
3.8 CONCLUSION
The autopsy carried out will provide a good understanding of how composites of
foulants damage the RO membrane, coupled with phreeqc the study will show the proximity

36
of simulation software to real life conditions. This will aid in limiting and understanding such
fouling in the near future. The design of water treatment system to a given hospital will also
aid in proving the point that fouling is a major issue and must be addressed in any system
available.

37
CHAPTER 4
RESULTS AND DISCUSSION
4.1 DESIGNING A WATER SUPPLY SYSTEM FOR A HOSPITAL
Prior to designing the actual system the water demand of such a facility need to be
calculated, additionally strategic choices should be made depending on the resources
available. Major considerations for such a facility are listed below:
1. Water network status
2. Water intake (seasonal and yearly data must be present)
3. Continuous funding (maintenance and operation)
4. Staff training and availability(proper management is key)
5. Design parameters
4.1.1 Water Network Status
The hospital at hand has a relatively good water distribution system, nevertheless it
should be noted that the system is linked to the entire facility, as such the RO water will be
used for the entire operations available at the hospital which includes but not limited to:
Toilets, floor cleaning, AC systems, medical operations, patient rooms, laundry, and external
services.
It can be argued that many operations does not require high quality water permeate
that will be produced via the designed RO unit while other operations such as Kidney dialysis
require water of higher purity reaching MilliQ water grade levels. In simple terms changing
the entire system network or separating the network to compensate for such water demand
is too costly and present little economic feasibility. As such for the current study this option
will be discarded.

38
4.1.2 Water intake
In order to properly design an RO system, the water intake constituents should be
analyzed, as such both the water parameters and system design information are presented in
Table 4-1 and Table 4-2 respectively.
Table 4-1: Brackish water analysis.
Parameter Unit Brackish water
Number of Observations
Mean Standard Deviation
pH pH units 11 7.54 0.1
Temperature ºC 11 25.3 1.7
Conductivity mS 2 10.62 0.1
Total Dissolved Solids mg/L 2 5305 49.5
Total Suspended Solids mg/L 4 34 15.5
Volatile Suspended Solids mg/L 4 33.33 20.8
Alkalinity (hydroxide) mg/L as CaCO3 7 0 0
Alkalinity (carbonate) mg/L as CaCO3 7 0 0
Alkalinity (bicarbonate) mg/L as CaCO3 7 113.2 25.9
Alkalinity (Total) mg/L as CaCO3 7 113.2 25.9
Ca Hardness mg/L as CaCO3 18 920.6 115.02
Mg Hardness mg/L as CaCO3 18 1625.6 168.8
Total Hardness mg/L as CaCO3 18 2524.4 148.9
Chlorides mg/L 14 3812.9 80.4
Silica mg/L as Si 17 4.2 1.3
mg/L as SiO2 17 9.02 2.5
Fe mg/L 4 0.04 0.004
Boron as B (mg/L) 6 1.92 0.4
as H3BO3 (mg/L) 6 10.93 2.5
Strontium mg/L Sr 7 5.56 1.5
Barium mg/L Ba 4 BDL BDL
Sodium mg/L Na 5 1695.96 216.5
Potassium mg/L K 2 18.49 4.2
Fecal Coliforms CFU in 100 mL After 24 hrs 3 4 NA
Total Coliforms CFU in 100 mL After 24 hrs 3 150 NA
Biochemical oxygen demand mg/L O2 4 59 5
Chemical oxygen demand mg/L O2 4 180 10
Total Organic Carbon mg/L C 4 25 2
Nitrate mg/L NO3²ˉ 8 10 2
Nitrite mg/L NO2- 8 0.2 0.005
Ammonia mg/L NH3+ 8 0.1 0.014
Ortho phosphates mg/L PO42– 8 2 0.1
Sulfide mg/L S²ˉ 8 2.2 0.1
Sulfates mg/L SO42- 8 19 3
Calcium mg/L Ca 4 362 20
Magnesium mg/L Mg 4 395 15
Manganese mg/L Mn 4 2 0.04
Aluminum mg/L Al 4 0.5 0.1
Turbidity NTU 5 80 4
Silt Density index SDI 5 3 NA
*BDL Below Detection Limit **NA not applicable
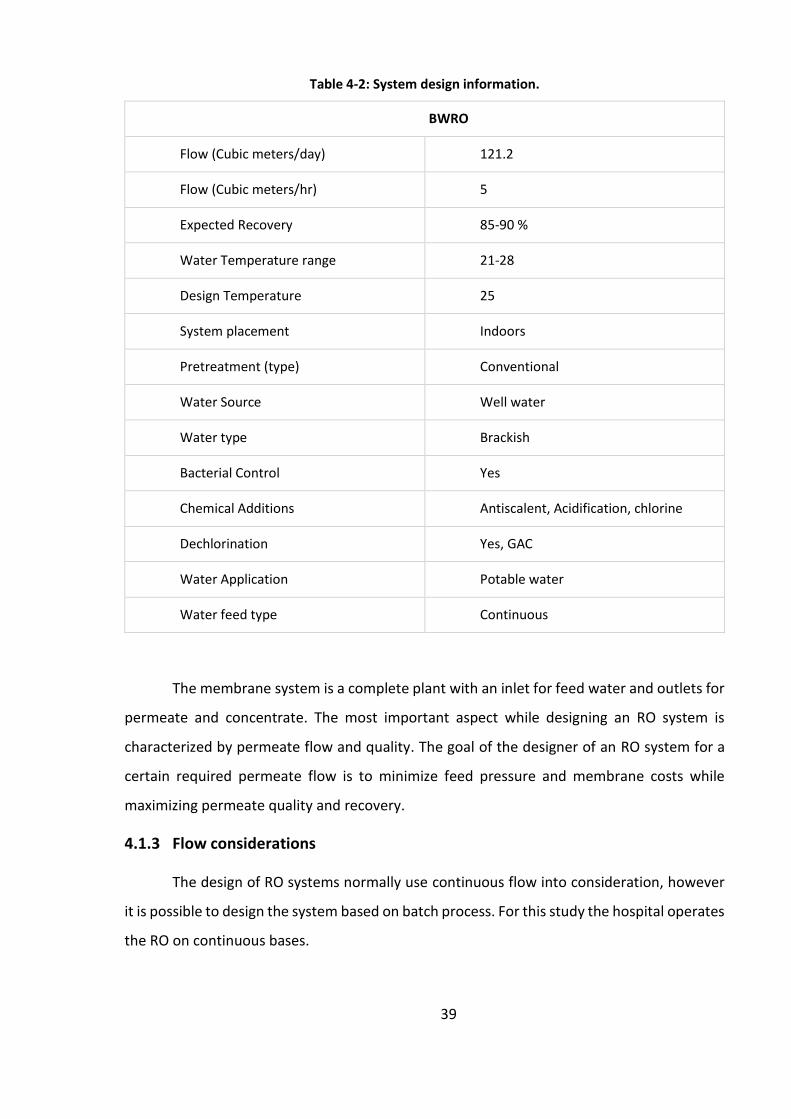
39
Table 4-2: System design information.
BWRO
Flow (Cubic meters/day) 121.2
Flow (Cubic meters/hr) 5
Expected Recovery 85-90 %
Water Temperature range 21-28
Design Temperature 25
System placement Indoors
Pretreatment (type) Conventional
Water Source Well water
Water type Brackish
Bacterial Control Yes
Chemical Additions Antiscalent, Acidification, chlorine
Dechlorination Yes, GAC
Water Application Potable water
Water feed type Continuous
The membrane system is a complete plant with an inlet for feed water and outlets for
permeate and concentrate. The most important aspect while designing an RO system is
characterized by permeate flow and quality. The goal of the designer of an RO system for a
certain required permeate flow is to minimize feed pressure and membrane costs while
maximizing permeate quality and recovery.
4.1.3 Flow considerations
The design of RO systems normally use continuous flow into consideration, however
it is possible to design the system based on batch process. For this study the hospital operates
the RO on continuous bases.
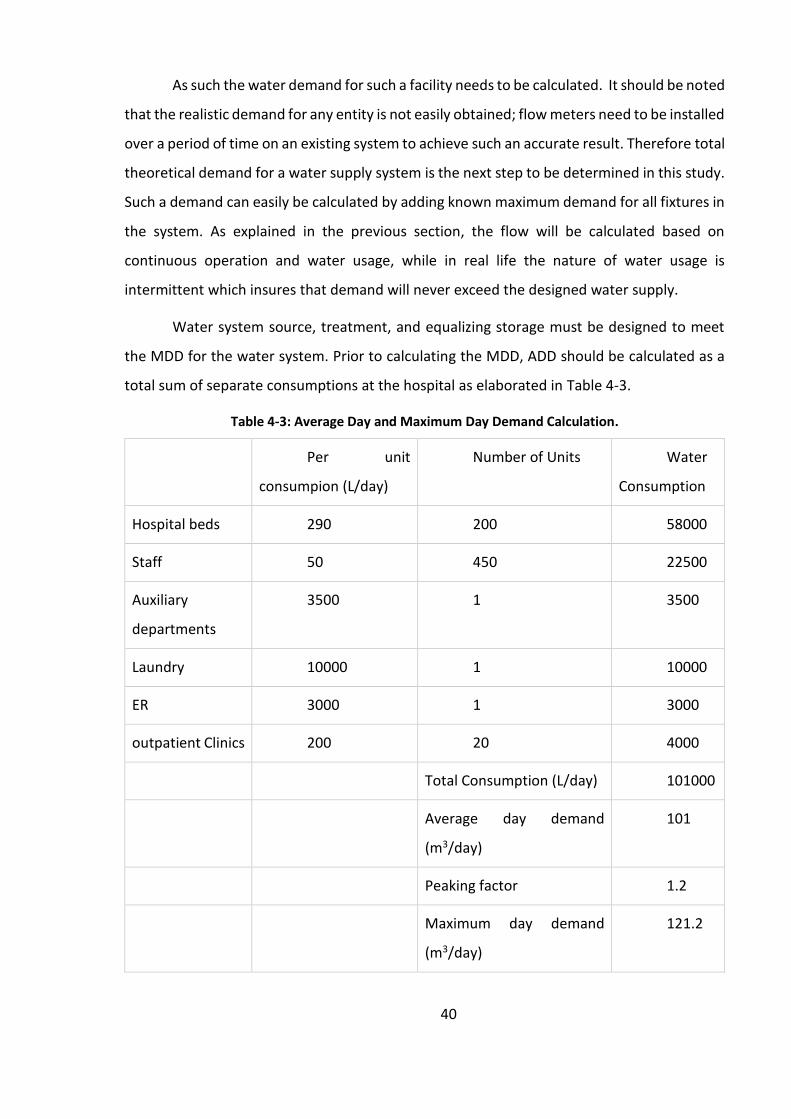
40
As such the water demand for such a facility needs to be calculated. It should be noted
that the realistic demand for any entity is not easily obtained; flow meters need to be installed
over a period of time on an existing system to achieve such an accurate result. Therefore total
theoretical demand for a water supply system is the next step to be determined in this study.
Such a demand can easily be calculated by adding known maximum demand for all fixtures in
the system. As explained in the previous section, the flow will be calculated based on
continuous operation and water usage, while in real life the nature of water usage is
intermittent which insures that demand will never exceed the designed water supply.
Water system source, treatment, and equalizing storage must be designed to meet
the MDD for the water system. Prior to calculating the MDD, ADD should be calculated as a
total sum of separate consumptions at the hospital as elaborated in Table 4-3.
Table 4-3: Average Day and Maximum Day Demand Calculation.
Per unit
consumpion (L/day)
Number of Units Water
Consumption
Hospital beds 290 200 58000
Staff 50 450 22500
Auxiliary
departments
3500 1 3500
Laundry 10000 1 10000
ER 3000 1 3000
outpatient Clinics 200 20 4000
Total Consumption (L/day) 101000
Average day demand
(m3/day)
101
Peaking factor 1.2
Maximum day demand
(m3/day)
121.2

41
4.1.4 Calculating number of elements and pressure vessels
RO elements represent the membranes present in the system; Governing factors in
element type selection are feed water salinity, feed water fouling tendency, required
rejection and energy requirements. Different elements have different sizes and surface areas
which determine the optimal functionality and application. Guidelines followed in this study
are FILMTECTM which state element size for systems greater than 10 gpm (2.3 m3/hr) is 8-inch
in diameter and 40-inch long.
Next step is to select the flux and the SDI, which will be obtained from empirical data
published in the membrane system design section from FILMTECTM. Thus the flux value used
will be 22 liters per cubic meter hour (L/m2h), and the SDI will be set to < 3.
Using the MDD as permeate flow, divide the design permeate flow rate Qp by the
design flux f and by the membrane surface area of the selected element SE (ft2 or m2). The
Surface area of every type of membrane is also provided by the company as to obtain the
number of elements NE as shown in
𝑁𝐸 =𝑄𝑝
𝑓. 𝑆𝐸
𝑁𝐸 =120 𝑚3/𝑑 × 41.7(𝐿/ℎ𝑟)/(𝑚3/𝑑)
22 𝐿/𝑚ℎ𝑟 × 37.2𝑚2 = 6.1 ≅ 7
4.1.5 Number of Vessels, Stages and Staging Ratio
In order to obtain the number of pressure vessels divide the number of elements NE
by the number of elements per pressure vessel, NEpV. For large systems, 6-element vessels
are standard.
𝑁𝑣 =𝑁𝐸
𝑁𝐸𝑝𝑉
𝑁𝑣 =𝑁𝐸
𝑁𝐸𝑝𝑉=
7
6= 1.17 ≅ 2

42
As such the total vessels so far should be 2 containing 4 and 3 respectively, another
design alteration in this case can be using 2 vessels with each containing 4 elements to
decrease pressure on each individual element.
After calculating the number of vessels in the system, the next step is to determine
the number of stages, which defines how many pressure vessels in series the feed will pass
through. A single stage contains a number of pressure vessels arranged in parallel, a schematic
of a multi stage system is shown in Figure 4-1.
Figure 4-1: Multi stage RO system.
Additionally, the number of stages is proportional to the planned water recovery
which is highly dependent on feed water quality and the number of elements calculated in
the previous section. The higher the system recovery and the lower the feed water quality,
the longer the system will be with more elements in series.
Typically, the number of serial element positions is linked with the system recovery
and the number of stages as illustrated in Table 4-4 for brackish water systems and Table 4-5
for seawater systems.
Table 4-4: Number of stages for BWRO.
System Recovery Number of Serial elements positon Number of stages
40-60 6 1
70-80 8-12 2
85-90 18 3
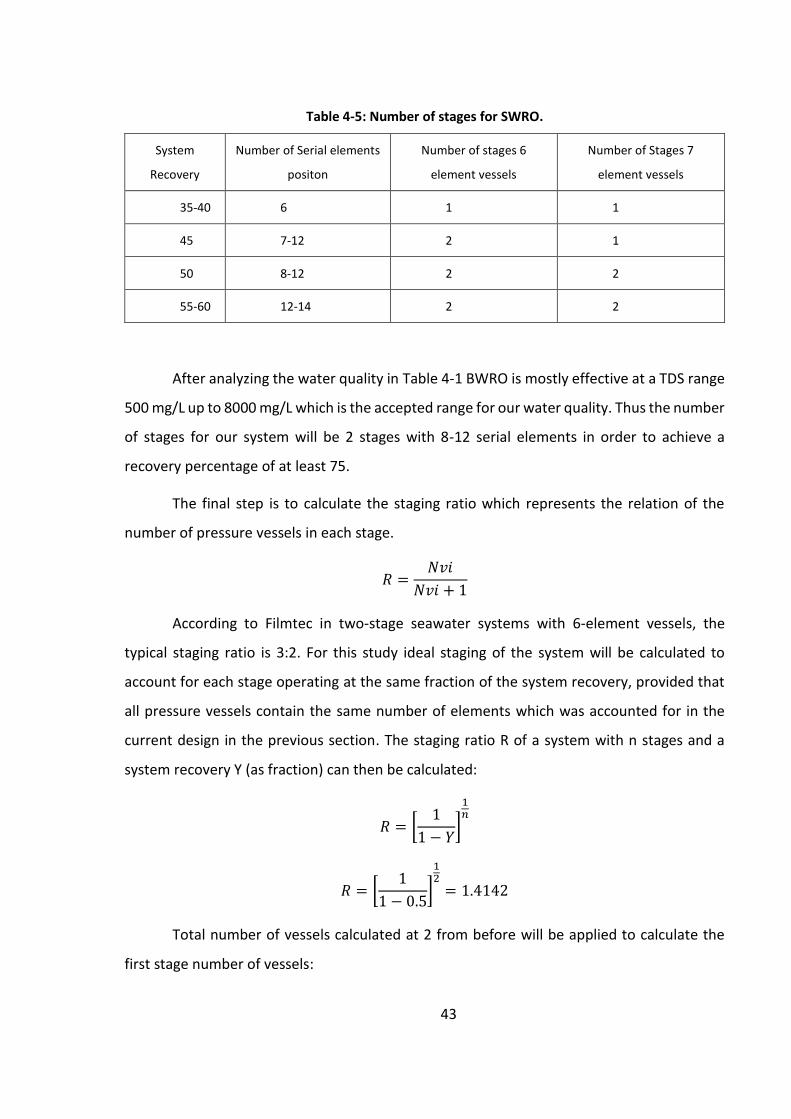
43
Table 4-5: Number of stages for SWRO.
System
Recovery
Number of Serial elements
positon
Number of stages 6
element vessels
Number of Stages 7
element vessels
35-40 6 1 1
45 7-12 2 1
50 8-12 2 2
55-60 12-14 2 2
After analyzing the water quality in Table 4-1 BWRO is mostly effective at a TDS range
500 mg/L up to 8000 mg/L which is the accepted range for our water quality. Thus the number
of stages for our system will be 2 stages with 8-12 serial elements in order to achieve a
recovery percentage of at least 75.
The final step is to calculate the staging ratio which represents the relation of the
number of pressure vessels in each stage.
𝑅 =𝑁𝑣𝑖
𝑁𝑣𝑖 + 1
According to Filmtec in two-stage seawater systems with 6-element vessels, the
typical staging ratio is 3:2. For this study ideal staging of the system will be calculated to
account for each stage operating at the same fraction of the system recovery, provided that
all pressure vessels contain the same number of elements which was accounted for in the
current design in the previous section. The staging ratio R of a system with n stages and a
system recovery Y (as fraction) can then be calculated:
𝑅 = [1
1 − 𝑌]
1𝑛
𝑅 = [1
1 − 0.5]
12
= 1.4142
Total number of vessels calculated at 2 from before will be applied to calculate the
first stage number of vessels:
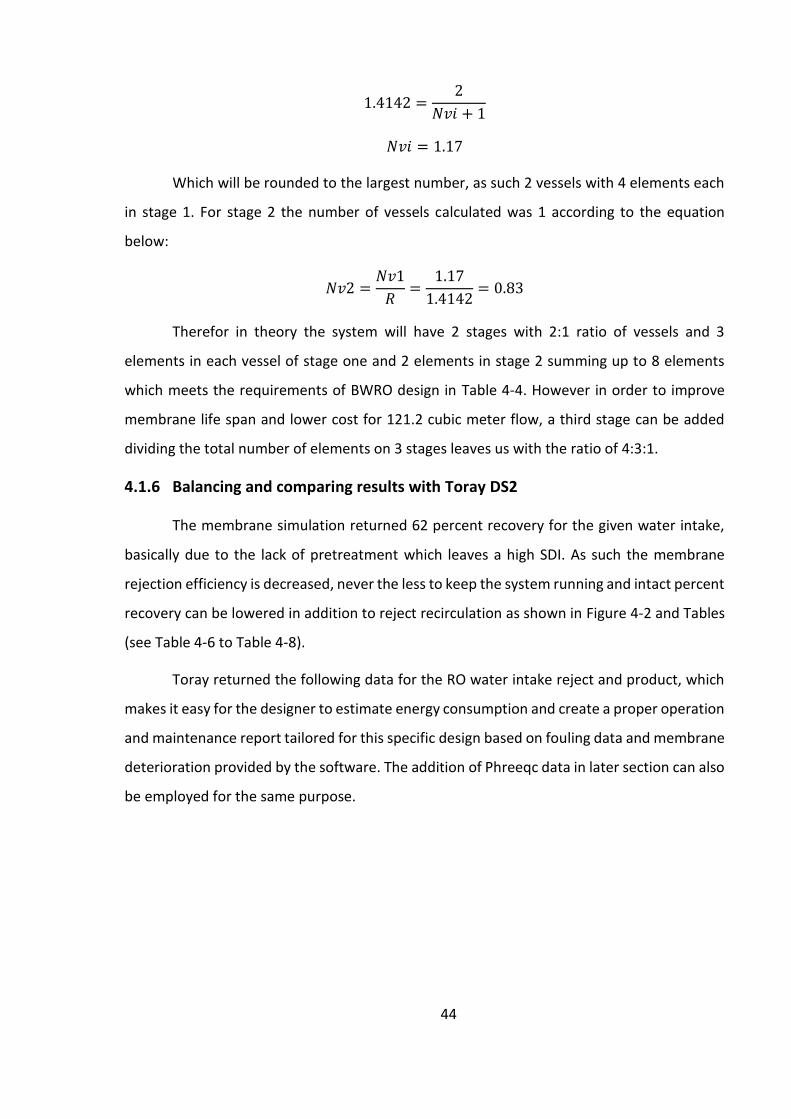
44
1.4142 =2
𝑁𝑣𝑖 + 1
𝑁𝑣𝑖 = 1.17
Which will be rounded to the largest number, as such 2 vessels with 4 elements each
in stage 1. For stage 2 the number of vessels calculated was 1 according to the equation
below:
𝑁𝑣2 =𝑁𝑣1
𝑅=
1.17
1.4142= 0.83
Therefor in theory the system will have 2 stages with 2:1 ratio of vessels and 3
elements in each vessel of stage one and 2 elements in stage 2 summing up to 8 elements
which meets the requirements of BWRO design in Table 4-4. However in order to improve
membrane life span and lower cost for 121.2 cubic meter flow, a third stage can be added
dividing the total number of elements on 3 stages leaves us with the ratio of 4:3:1.
4.1.6 Balancing and comparing results with Toray DS2
The membrane simulation returned 62 percent recovery for the given water intake,
basically due to the lack of pretreatment which leaves a high SDI. As such the membrane
rejection efficiency is decreased, never the less to keep the system running and intact percent
recovery can be lowered in addition to reject recirculation as shown in Figure 4-2 and Tables
(see Table 4-6 to Table 4-8).
Toray returned the following data for the RO water intake reject and product, which
makes it easy for the designer to estimate energy consumption and create a proper operation
and maintenance report tailored for this specific design based on fouling data and membrane
deterioration provided by the software. The addition of Phreeqc data in later section can also
be employed for the same purpose.

45
Figure 4-2: Flow diagram for Designed RO system.
Table 4-6: Toray DS2 Status for Run at 62 percent recovery.
Parameter Unit Pass 1
Raw water TDS mg/l 7,570
Feed EC @25C / @15.00C uS 12,884.3 / 10,041.8
Feed Pressure bar 26.65
Temperature deg C 25
Total DP bar 0.388
Brine Pressure bar 26.26
Fouling Max 4 yrs 0.8
SP % Increase (Max) 4 yrs 33.10%
Recovery % 62.00%
Feed Flow m3/hr 8.07
Recycle Flow m3/hr 1.4
Product Flow m3/hr 5.002
Average Flux l/m2/hr 26.92
Concentrate Flow m3/hr 1.668
Product TDS mg/l 60.97
Concentrate TDS mg/l 19,813
Primary HP Pump kW kilowatt 7.51
Power Consumption kWh/m3 1.501
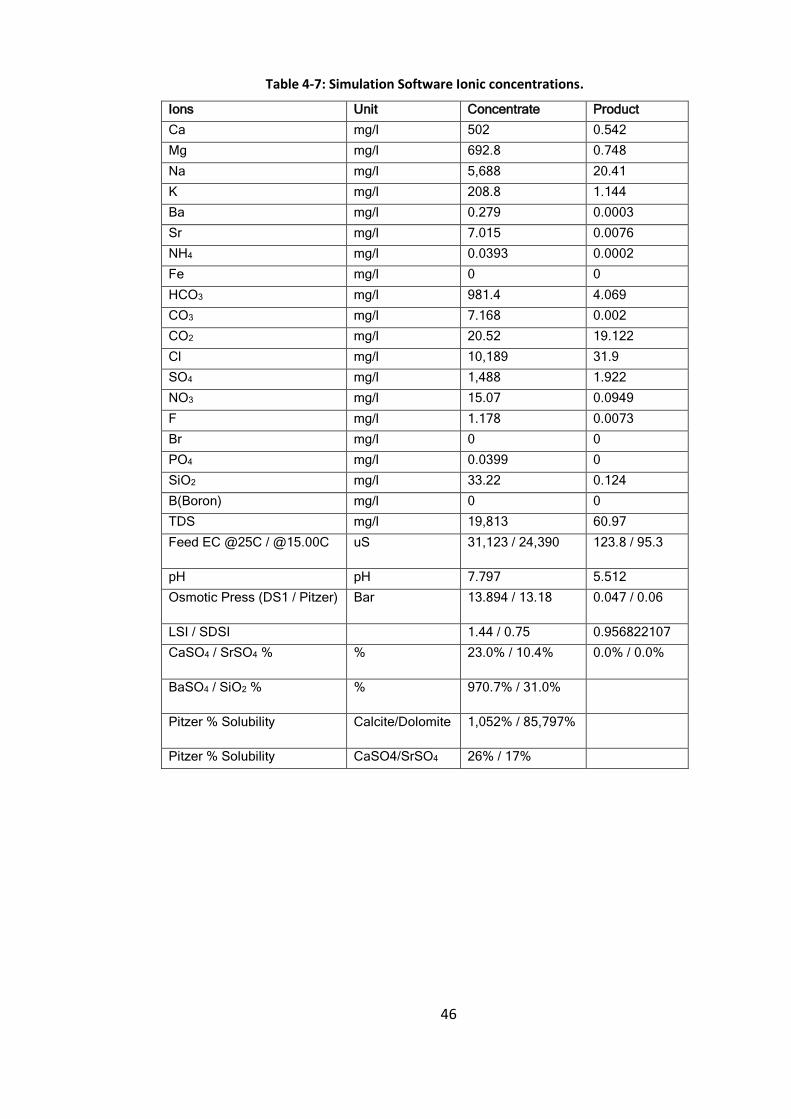
46
Table 4-7: Simulation Software Ionic concentrations.
Ions Unit Concentrate Product
Ca mg/l 502 0.542
Mg mg/l 692.8 0.748
Na mg/l 5,688 20.41
K mg/l 208.8 1.144
Ba mg/l 0.279 0.0003
Sr mg/l 7.015 0.0076
NH4 mg/l 0.0393 0.0002
Fe mg/l 0 0
HCO3 mg/l 981.4 4.069
CO3 mg/l 7.168 0.002
CO2 mg/l 20.52 19.122
Cl mg/l 10,189 31.9
SO4 mg/l 1,488 1.922
NO3 mg/l 15.07 0.0949
F mg/l 1.178 0.0073
Br mg/l 0 0
PO4 mg/l 0.0399 0
SiO2 mg/l 33.22 0.124
B(Boron) mg/l 0 0
TDS mg/l 19,813 60.97
Feed EC @25C / @15.00C uS 31,123 / 24,390 123.8 / 95.3
pH pH 7.797 5.512
Osmotic Press (DS1 / Pitzer) Bar 13.894 / 13.18 0.047 / 0.06
LSI / SDSI 1.44 / 0.75 0.956822107
CaSO4 / SrSO4 % % 23.0% / 10.4% 0.0% / 0.0%
BaSO4 / SiO2 % % 970.7% / 31.0%
Pitzer % Solubility Calcite/Dolomite 1,052% / 85,797%
Pitzer % Solubility CaSO4/SrSO4 26% / 17%

47
Table 4-8: Toray DS2 results by stage.
Stage/Bank Data Stage 1 Stage 2 Stage 3
Lead Element Type TM720D-400 TM720D-400 TM720D-400
Last Element Type TM720D-400 TM720D-400 TM720D-400
Total Elements 8 4 3 1
Total Vessels 3 1 1 1
Elements per Vessel 2 2 1
Feed Flow m3/hr 8.07 5.641 3.756
Product Flow m3/hr 2.429 1.885 0.689
Average Flux l/m2/hr 32.68 25.36 18.537
Brine Flow m3/hr 5.641 3.756 3.068
Recovery % % 30.09% 33.41% 18.34%
Feed Pressure bar 26.65 26.43 26.3
dP Elements bar 0.22 0.127 0.0406
Boost Pressure bar 0 0 0
Piping Loss bar 0 0 0
Net (Boost - dP piping) bar 0 0 0
Brine Pressure bar 26.43 26.3 26.26
Permeate Pressure bar 0 0 0
Feed TDS mg/l 7,570 10,815 16,205
Perm TDS mg/l 33.94 69.65 132.5
Lead Element Pass1 Stage 1 Stage 2 Stage 3
Feed Flow m3/hr 8.07 5.641 3.756
Product Flow m3/hr 1.27 1.022 0.689
Product TDS mg/l 28.77 56.74 132.5
Flux l/m2/hr 34.19 27.51 18.537
Last Element Pass1 Stage 1 Stage 2 Stage 3
Product Flow m3/hr 1.158 0.863 0.689
Product TDS mg/l 39.62 84.93 132.5
Brine/Product Ratio ratio 4.871 4.353 4.453
Brine Flow m3/hr 5.641 3.756 3.068
Net Driving Pressure bar 17.063 12.738 10.187
4.1.7 Pretreatment
Two errors were returned by the design program, scaling and fouling might occur and
highly impact membrane life span, flux, permeate and concentrate water quality, and as such

48
a proper pretreatment system should be installed. This case study will assume the installation
of a conventional pretreatment system with Acid and anti-scalent addition.
4.2 LABORATORY SCALE SYSTEM
After collecting water prior to RO treatment the BWB was assessed for similar
chemical parameters of BW and values are presented in Table 4-9 [17] .The comparison
between the values presented by the design software will vary tremendously from the values
given in Table 4-9 because the RO used in the study is a simple household FILMTEC RO while
the ones designed for the hospital are 8 inch RO membranes with industrial grade
certification, additionally the percent recovery is significantly different. As the max recovery
for the acquired RO is about 25 percent for water with TDS less than 6000 ppm.
Table 4-9: BWB charachteristics.
Parameter Unit
BWB
Number of Observations Mean Standard Deviation
pH pH units 11 7.4 0.1
Temperature ºC 11 25.5 1.9
Conductivity mS 2 15.3 0.3
TDS mg/L 6 9053.3 539.9
TSS mg/L 4 44 24
VSS mg/L 5 20 9.6
Alkalinity (hydroxide) mg/L as CaCO3 7 0 0
Alkalinity (carbonate) mg/L as CaCO3 7 0 0
Alkalinity (bicarbonate) mg/L as CaCO3 7 117 59.1
Ca Hardness mg/L as CaCO3 18 1197 130.7
Mg Hardness mg/L as CaCO3 18 2111 182
Total Hardness mg/L as CaCO3 18 3273 166.5
Chlorides mg/L 14 5489 216
Silica
mg/L as Si 17 6 1.4
mg/L as SiO2 17 13.1 4.6
Fe mg/L 4 0.041 0.004
Boron as B (mg/L) 6 2.1 0.2

49
as H3BO3 (mg/L) 6 11.9 1.4
Strontium mg/L 7 7.5 2.2
Barium mg/L 4 BDL BDL
Na mg/L 5 2842.7 349.7
K mg/L 2 35.2 1.4
Fecal Coliforms CFU in 100 mL
After 24 hrs 3 0 0
Total Coliforms CFU in 100 mL
After 24 hrs 3 0 0
After running the RO membrane sections on SEM the results are shown in Figure 4-3
and Figure 4-4 which clearly shows the cake layer mentioned in the literature review of this
study. Such high poring and cake formation will lead to rapid membrane flux drop eventually
leading to full membrane deterioration.
Figure 4-3: SEM imaging of foulant at 1mm.

50
Figure 4-4: SEM imaging of foulant at 10 μm.
Table 4-10: Elemental Analysis of membrane surface.
Moderate Fouling Region Intensive Fouling Region Pre-treated RO region
Element Weight% Atomic% Weight% Atomic% Weight% Atomic %
C 19.71 27.91 42.24 53.57 72.33 77.69
O 59.63 63.38 42.35 40.32 27.67 22.31
Mg 0.59 0.41 0.29 0.18 0 0
S 0.39 0.20 2.86 1.36 0 0
Ca 18.08 7.67 11.59 4.41 0 0
Zn 1.60 0.42 0.67 0.16 0 0
Totals 100.00 100 100

51
Figure 4-5: Spectrum and imaging of membrane surface. Spectrum 1 and 2 represent moderate add intensive foluing regions respectively, spectrum 3 represent the membrane exposed to
pretreated water.

52
Major foulants can now be identified as CaCO3, SO4, and Mg(OH)2 which is consistent
with the coagulation data provided in the literature review. However, the complex nature of
these compounds cannot be determined solely via the SEM, these compounds are present is
highly clustered matrix forms and will be addressed using a geochemical calculation software.
On the other hand, spectrum 3 prove that this fouling only occurred on the level of
CaCO3 which is mainly due to high alkalinity knowing that the feed water pH is 11. The
normalized permeate flux with respect to the initial permeate flux under various feed solution
pH is expected.
4.3 USING PHREEQC
PHREEQC version 3 is a computer program written in the C and C++ programming
languages that is designed to perform a wide variety of aqueous geochemical calculations.
PHREEQC implements several types of aqueous models. PHREEQC has capabilities for:
Speciation and saturation-index calculations
batch-reaction and one-dimensional transport calculations with reversible and
irreversible reactions, which include aqueous, mineral, gas, solid-solution, surface-
complexation, and ion-exchange equilibria, and specified mole transfers of reactants,
kinetically controlled reactions, mixing of solutions, and pressure and temperature
changes
Inverse modeling, which finds sets of mineral and gas mole transfers that account for
differences in composition between waters within specified compositional
uncertainty limits.
For the purpose of this study a complete model results obtained for BW via Phreeqc
is presented in Appendix B, the major settling parameters are presented in Table 4-11.
The higher the log SI of a certain species the more likely it will precipitate out of
solution at the given pH value.
4.4 CONCLUSION
Flux decline and membrane deterioration due to the presence of smaller particles was
attributed to the high cake layer resistance due to the formation of the void-less cake layer
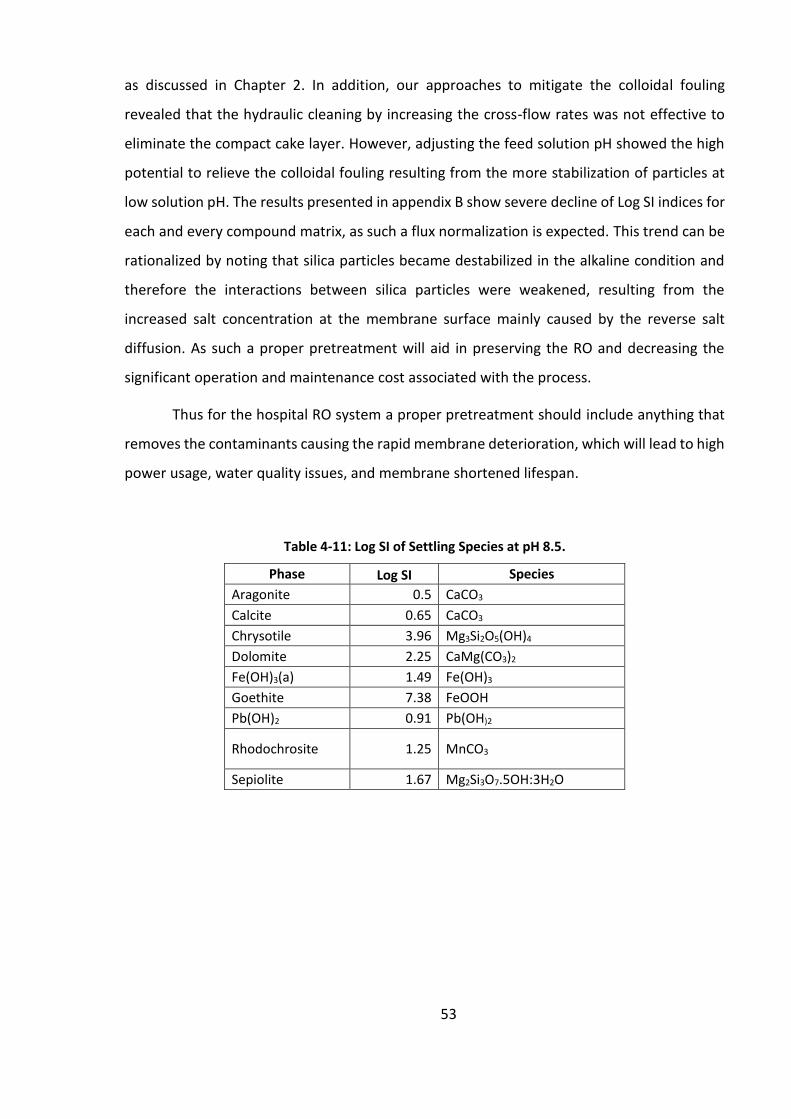
53
as discussed in Chapter 2. In addition, our approaches to mitigate the colloidal fouling
revealed that the hydraulic cleaning by increasing the cross-flow rates was not effective to
eliminate the compact cake layer. However, adjusting the feed solution pH showed the high
potential to relieve the colloidal fouling resulting from the more stabilization of particles at
low solution pH. The results presented in appendix B show severe decline of Log SI indices for
each and every compound matrix, as such a flux normalization is expected. This trend can be
rationalized by noting that silica particles became destabilized in the alkaline condition and
therefore the interactions between silica particles were weakened, resulting from the
increased salt concentration at the membrane surface mainly caused by the reverse salt
diffusion. As such a proper pretreatment will aid in preserving the RO and decreasing the
significant operation and maintenance cost associated with the process.
Thus for the hospital RO system a proper pretreatment should include anything that
removes the contaminants causing the rapid membrane deterioration, which will lead to high
power usage, water quality issues, and membrane shortened lifespan.
Table 4-11: Log SI of Settling Species at pH 8.5.
Phase Log SI Species
Aragonite 0.5 CaCO3
Calcite 0.65 CaCO3
Chrysotile 3.96 Mg3Si2O5(OH)4
Dolomite 2.25 CaMg(CO3)2
Fe(OH)3(a) 1.49 Fe(OH)3
Goethite 7.38 FeOOH
Pb(OH)2 0.91 Pb(OH)2
Rhodochrosite 1.25 MnCO3
Sepiolite 1.67 Mg2Si3O7.5OH:3H2O

54
CHAPTER 5
FINANCIAL STUDY
This financial study will consider water treatment procedure for an entire plant (not
just a hospital) this will allow the author far more flexibility in the process and it will also allow
for a much clearer breakeven analysis
5.1 PRETREATMENT COST
Wolf, et al. [94] reported into the cost of the two types of pre-treatment coupled with
a two pass RO system. The two systems at hand are the conventional system and the
membrane system, each has its unique set of disadvantages and advantages which can be
directly related to cost effectivity of each system. The breakdown of costing is shown in Error!
Reference source not found. [94].
Figure 5-1: Costing of pretreatment processes.
The graph clearly shows that both investment cost and process and overall cost are
less for UF membrane pre-treatment. Using the designed product flow of plant x is 10,000

55
m3/day, the use of UF membranes as pre-treatment as opposed to conventional filtration the
daily saving can be calculated as such:
10,000𝑚3
𝑑× 0.592
$
𝑚3− 10,000
𝑚3
𝑑× 0.582
$
𝑚3= 100
$
𝑑
There is no publically available data for costing. Attempts at contacting both GE Power
and Water and Huber Technology UK have been made in search of costing data but at the
time of this report, nothing had been received in return. Due to this, the costing for the Pre-
treatment will be done using Error! Reference source not found.. This costing method will
include the costing for the dosing pumps needed for the anti-scaler due to its cost as a pre-
treatment system as a whole.
The cost of US$202 per m3/day of product water from the plant is from 2005 [94],
using the scale that US$ 1.00 (2005) = US$ 1.10 (2009) (Worth)[95], this is raised to US$ 222
per m3/day product water. With a product water output at maximum capacity of 10,000
m3/day, the total capital cost for the pre-treatment system is US$ 2.2 million.
After calculating the capital cost, the maintenance cost should be estimated from
Error! Reference source not found. [94]:
Costing Values per m3/day product water are;
Replacement Membranes – US$ 0.0234
Process and Clean – US$ 0.0206
With a product water flow of 10,000 m3/day, and the adjusted costs of yearly
inflation;
Replacement Membranes – US$ 500 /day
Process and Clean – US$ 500 /day Totalling – US$ 1,000 /day for maintenance.
5.2 RO COSTING
Costing in RO system will be based on energy requirements and replacement
membranes, in addition to maintenance of the RO plant at hand. Using ROSA software[96],
the exact consumption in KW.hr can be calculated as such:

56
𝑇𝑜𝑡𝑎𝑙 𝐸𝑛𝑒𝑟𝑔𝑦 𝐶𝑜𝑛𝑠𝑢𝑚𝑝𝑡𝑖𝑜𝑛 𝑖𝑛 𝑡ℎ𝑒𝑅𝑂 𝑠𝑦𝑠𝑡𝑒𝑚
= 𝑇𝑜𝑡𝑎𝑙 𝑝𝑜𝑤𝑒𝑟 𝑐𝑜𝑛𝑠𝑢𝑚𝑒𝑑 𝑏𝑦 𝑒𝑎𝑐ℎ 𝑜𝑓𝑡ℎ𝑒𝑝𝑢𝑚𝑝𝑠 (𝑎𝑣𝑎𝑖𝑙𝑎𝑏𝑙𝑒 𝑖𝑛 𝑅𝑂𝑆𝐴)
= 82 + 93 + 137 = 312 𝐾
Therefore, the overall product water flow leaving the system is 10,000 m3/d. The
specific energy consumption per cubic meter can be calculated as follows:
𝑆𝐸 = 𝑤𝑇𝑜𝑡𝑎𝑙
𝑄 × 360024 × 3600
= 0.748 𝑘𝑊ℎ/𝑚3
The total cost of membranes will be
𝑇𝑜𝑡𝑎𝑙 𝐶𝑜𝑠𝑡 = 𝐶𝑜𝑠𝑡 𝑜𝑓 𝑠𝑖𝑛𝑔𝑙𝑒 𝑚𝑒𝑚𝑏𝑟𝑎𝑛 × 𝑁𝑢𝑚𝑏𝑒𝑟 𝑜𝑓 𝑚𝑒𝑚𝑏𝑟𝑎𝑛𝑒𝑠
× 𝑁𝑢𝑚𝑏𝑒𝑟 𝑜𝑓 𝑟𝑒𝑝𝑙𝑎𝑐𝑒𝑚𝑒𝑛𝑡𝑠
For our project the lifespan will be set to 5 years, and in RO systems most membranes
start to deteriorate by approximately the 5th year of its life thus leading to the replacement
of the membranes.
The total cost of membranes according to ROSA (the study assumes the BWRO
membranes are utilized at full capacity with proper replacement) is 100,000$. The cost of
pressure vessels is 160,797 $, that of high pressure pumps is 290,000 $ and the cost of booster
pumps is 10,000 $. Note that in order to estimate cost of each pump, the power of the pump
first had to be determined, and based on the power vs cost curve and the corresponding value
of the cost had to be noted. Therefore, the total overall cost will be 560,797 $.
5.3 POST TREATMENT COSTING
Post treatment in the form of SafeOX units [95] will be considered in this study. The
capital costing for the post-treatment system would consist of 2 SafeOx units
2 x US$ 20,000 = U$ 40,000
The costs for the two chemicals used for the unit were Chlorine Dioxide and Calcium
hypochlorite. The cost of Chlorine Dioxide is $4-$5 dollars per kg from Shandong Zhaoguan
Medicine Industry Co., 2011 as assessed by Bell, et al. [95] with a dose of 2kg/hr needed for
disinfection from the SafeOx unit was taken as the ClO2 needed in wholesale chemical form.

57
$4.50 x 2 kg/h =9$/h=216$/d
Hypochlorite cost is about 3$ per kg and the plant utilizes 24 kg/d
Total cost of Hypochlorite= 72$/d
As such the total cost of posttreatment=288$/d
5.4 PROJECT REVENUE AND PROFIT
Revenue can be generated by selling potable water to surrounding municipality,
especially that the project can produce 30,000 m3/d (3 times the design capacity with 1.5
times increase in price). Water is the one variable in the financial analysis as the price the
water is sold at can be altered to produce a more suitable annual ROI. The revenue generated
by the potable water accounts for the price of water increasing annually due to inflation
(again set at 2.9%).
In Lebanon the profit of $2.0/m3 seems about right, and kindly note that this number
is based on the prices offered by private water companies and it is considered to be a very
competitive price in the current market. Research performed by Bell, et al. [95] has also
shown that based on current day prices Sydney Water will be charging home owners
approximately $3.5/m3 for their drinking water supply as of 2030. The main conclusion that
can be drawn from the financial analysis is that the design being proposed by this report can
generate a reasonable return on the investment when it has to produce potable water for the
majority of 5 year working life. It is the recommendation that the owners should sell water
for approximately $3.3/m3.

58
CHAPTER 6
CONCLUSION AND FUTURE WORK
6.1 CONCLUSION
RO technologies are continuously advancing, optimizing RO systems and its related
fields are widely practiced throughout the globe, mainly because RO is viewed as the most
efficient system of water desalination. Disadvantages associated with RO include membrane
fouling, scaling, Cake layer formation, clogging and bacterial growth, solutions to limit such
issue are available and continuously being updated with alternatives being illustrated often.
Brine disposal and management is an important issue in RO plants nowadays, and new trends
of treatment and management of the brine are in continuous advancement, processes like
ZLD aided in transforming the RO technology into a green technology.
In order to achieve a proper analysis of the membrane fouling layer, an autopsy of a
used membrane and a new membrane was carried out, it aided in providing a good
understanding of how composites of foulants damage the RO membrane, water chemistry
testing supplied the author with proper data which was used in phreeqc and showed the
proximity of simulation software to real life conditions. Flux decline and membrane
deterioration due to the presence of smaller particles was attributed to the high cake layer
resistance due to the formation of the void-less cake layer as discussed in Chapter 2. In
addition, our approaches to mitigate the colloidal fouling revealed that the hydraulic cleaning
by increasing the cross-flow rates was not effective to eliminate the compact cake layer.
When the membrane was exposed for high pH feed (11.5) it exhibited high potential to relieve
the colloidal fouling resulting from the more stabilization of particles at low solution pH and
shown in the SEM imaging and INCA characterization, in turn the explanation of such a result
was the fact that silica particles became destabilized in the alkaline condition and therefore
the interactions between silica particles were weakened, resulting from the increased salt
concentration at the membrane surface mainly caused by the reverse salt diffusion. As such
a proper pretreatment will aid in preserving the RO and decreasing the significant operation
and maintenance cost associated with the process.

59
The significant findings of this research was that known mechanisms for solution and
solute transport onto RO membrane surface mainly CaCO3, Mg(OH)2, Ca(OH)2, and SO4 was
clearly demonstrated through both geotechnical simulation and bech-scale testing. This leads
to the easy identification of other significant scientific data such as solution diffusion,
electrostatic interaction (repulsion), and steric (size). The conclusions of the associated
experimental results support the objectives of this research and research hypotheses of the
foulants responsible for deteriorating RO productivity and the need for a proper pretreatment
procedure. Thus for the hospital RO system a proper pretreatment should include anything
that removes the contaminants causing the rapid membrane deterioration, which will lead to
high power usage, water quality issues, and membrane shortened lifespan.
6.2 FUTURE WORK
Although this short-term bench-testing study can predict fouling species of specific
feeds through RO even the NF and UF due to membrane similarities, to accurately model full-
scale operation, pilot-testing study is strongly recommended in order to address long-term
exposure of RO to the contaminants at hand. The future research can be focused to
1. Investigate pretreatment
2. Identify long-term performance as affected by membrane fouling
3. Performing additional experiments under the same condition, thus increasing the number
of trials and lowering standard deviations.
4. Using at least 4 Simultaneous RO apparatus and running under similar conditions with
different types of water to obtain a more accurate result for fouling of RO membrane
surfaces.
5. Intensive pilot-testing program interfaced with focused and supporting bench testing.
6. Further characterization and elemental analysis for elements such as Na+, which will
enable the calculation of osmotic pressure change at different pH levels.
7. Performing a detailed feasibility study after determining the benefit from utilizing the RO
in hospitals around Lebanon, which should also include a breakeven analysis in
comparison to buying water and/or health risks associated with the absence of such a
system

60
8. Comparing the cost of the studies system to that of conventional and membrane
pretreatment.

61
REFERENCES
[1] R. Valavala, J.-S. Sohn, J.-H. Han, N.-G. Her, and Y.-M. Yoon, "Pretreatment in Reverse Osmosis Seawater Desalination: A Short Review," Environmental Engineering Research, vol. 16, pp. 205-212, 2011.
[2] J. Dunham, " Encyclopedia of Climate and Weather," Library Journal, vol. 136, pp. 107–108, 2011.
[3] R. F. Service, " Desalination Freshens Up," Science, vol. 313, pp. 1088–1090, 2006.
[4] L. F. Greenlee, D. F. Lawler, B. D. Freeman, B. Marrot, and P. Moulin, "Reverse osmosis desalination: water sources, technology, and today's challenges," Water Research, vol. 43, pp. 2317-48, 2009.
[5] M. Petry, M. A. Sanz, C. Langlais, V. Bonnelye, J.-P. Durand, D. Guevara, et al., "The El Coloso (Chile) reverse osmosis plant," Desalination, vol. 203, pp. 141-152, 2007.
[6] O. A. Hamed and H. A. Al-Otaibi, "Prospects of operation of MSF desalination plants at high TBT and low antiscalant dosing rate," Desalination, vol. 256, pp. 181-189, 2010.
[7] A. Matin, Z. Khan, S. M. J. Zaidi, and M. C. Boyce, "Biofouling in reverse osmosis membranes for seawater desalination: Phenomena and prevention," Desalination, vol. 281, pp. 1-16, 2011.
[8] A. M. K. El-Ghonemy, "Water desalination systems powered by renewable energy sources: Review," Renewable and Sustainable Energy Reviews, vol. 16, pp. 1537-1556, 2012.
[9] S. El-Manharawy and A. Hafez, "Study of seawater alkalization as a promising RO pretreatment method," Desalination, vol. 153, pp. 109-120, 2003.
[10] C. J. Gabelich, M. D. Williams, A. Rahardianto, J. C. Franklin, and Y. Cohen, "High-recovery reverse osmosis desalination using intermediate chemical demineralization," Journal of Membrane Science, vol. 301, pp. 131-141, 2007.
[11] P. Glueckstern and M. Priel, "Boron removal in brackish water desalination systems," Desalination, vol. 205, pp. 178-184, 2007.
[12] E. Güler, N. Kabay, M. Yüksel, E. Yavuz, and Ü. Yüksel, "A comparative study for boron removal from seawater by two types of polyamide thin film composite SWRO membranes," Desalination, vol. 273, pp. 81-84, 2011.
[13] G. Fernandez-Álvarez, G. Garralón, F. Plaza, A. Garralón, J. Pérez, and M. A. Gómez, "Autopsy of SWRO membranes from desalination plant in Ceuta after 80 years in operation," Desalination, vol. 263, pp. 264-270, 2010.
[14] E. Filloux, H. Gallard, and J. P. Croue, "Identification of effluent organic matter fractions responsible for low-pressure membrane fouling," Water Res, vol. 46, pp. 5531-40, 2012.

62
[15] A. G. I. Dalvi, R. Al-Rasheed, and M. A. Javeed, "Studies on organic foulants in the seawater feed of reverse osmosis plants of SWCC," Desalination, vol. 132, pp. 217-232, 2000.
[16] N. Melián-Martel, J. J. Sadhwani, S. Malamis, and M. Ochsenkühn-Petropoulou, "Structural and chemical characterization of long-term reverse osmosis membrane fouling in a full scale desalination plant," Desalination, vol. 305, pp. 44-53, 2012.
[17] G. M. Ayoub, R. M. Zayyat, and M. Al-Hindi, "Precipitation softening: a pretreatment process for seawater desalination," Environmental Science and Pollution Research, vol. 21, pp. 2876-2887, 2013.
[18] O. A. Hamed, "Overview of hybrid desalination systems — current status and future prospects," Desalination, vol. 186, pp. 207-214, 2005.
[19] ESCWA, "Role of Desalination in Addressing Water Scarcity (3rd ed.)," United Nations, Economic and Social Commission for Western Asia, 2009.
[20] ClimatecWikia. (2015, April). Desalination.
[21] L. F. Greenlee, D. F. Lawler, B. D. Freeman, B. Marrot, and P. Moulin, "Reverse osmosis desalination: Water sources, technology, and today's challenges," Water Research, vol. 43, pp. 2317-2348, 2009.
[22] S. Belfer, J. Gilron, Y. Purinson, R. Fainshtain, N. Daltrophe, M. Priel, et al., "Effect of surface modification in preventing fouling of commercial SWRO membranes at the Eilat seawater desalination pilot plant," Desalination, vol. 139, pp. 169-176, 2001.
[23] "Emergency water supply planning guide for hospitals and health care facilities available online," J Environ Health, vol. 75, pp. 36-7, 2012.
[24] E. J. Anaissie, S. R. Penzak, and M. C. Dignani, "The hospital water supply as a source of nosocomial infections: a plea for action," Arch Intern Med, vol. 162, pp. 1483-92, 2002.
[25] L. Malaeb and G. M. Ayoub, "Reverse osmosis technology for water treatment: State of the art review," Desalination, vol. 267, pp. 1-8, 2011.
[26] M. Pontié, S. Rapenne, A. Thekkedath, J. Duchesne, V. Jacquemet, J. Leparc, et al., "Tools for membrane autopsies and antifouling strategies in seawater feeds: a review," Desalination, vol. 181, pp. 75-90, 2005.
[27] G. Mauguin and P. Corsin, "Concentrate and other waste disposals from SWRO plants: characterization and reduction of their environmental impact," Desalination, vol. 182, pp. 355-364, 2005.
[28] P. Chelme-Ayala, D. W. Smith, and M. G. El-Din, "Membrane concentrate management options: a comprehensive critical reviewA paper submitted to the Journal of Environmental Engineering and Science," Canadian Journal of Civil Engineering, vol. 36, pp. 1107-1119, 2009.
[29] J. N. Hakizimana, B. Gourich, C. Vial, P. Drogui, A. Oumani, J. Naja, et al., "Assessment of hardness, microorganism and organic matter removal from seawater by electrocoagulation as a pretreatment of desalination by reverse osmosis," Desalination, vol. 393, pp. 90-101, 2016.

63
[30] K. Doederer, M. J. Farré, M. Pidou, H. S. Weinberg, and W. Gernjak, "Rejection of disinfection by-products by RO and NF membranes: Influence of solute properties and operational parameters," Journal of Membrane Science, vol. 467, pp. 195-205, 2014.
[31] H.-C. Flemming, "Reverse osmosis membrane biofouling," Experimental Thermal and Fluid Science, vol. 14, pp. 382-391, 1997.
[32] H.-C. Kim, J.-H. Hong, and S. Lee, "Fouling of microfiltration membranes by natural organic matter after coagulation treatment: A comparison of different initial mixing conditions," Journal of Membrane Science, vol. 283, pp. 266-272, 2006.
[33] K. L. Jones and C. R. O’Melia, "Protein and humic acid adsorption onto hydrophilic membrane surfaces: effects of pH and ionic strength," Journal of Membrane Science, vol. 165, pp. 31-46, 2000.
[34] Y. Yu, S. Lee, K. Hong, and S. Hong, "Evaluation of membrane fouling potential by multiple membrane array system (MMAS): Measurements and applications," Journal of Membrane Science, vol. 362, pp. 279-288, 2010.
[35] H. L. Yang, C. Huang, and J. C.-T. Lin, "Seasonal fouling on seawater desalination RO membrane," Desalination, vol. 250, pp. 548-552, 2010.
[36] J. Lee and I. S. Kim, "Microbial community in seawater reverse osmosis and rapid diagnosis of membrane biofouling," Desalination, vol. 273, pp. 118-126, 2011.
[37] N. Lee, G. Amy, and J. Lozier, "Understanding natural organic matter fouling in low-pressure membrane filtration," Desalination, vol. 178, pp. 85-93, 2005.
[38] E. M. Vrijenhoek, S. Hong, and M. Elimelech, "Influence of membrane surface properties on initial rate of colloidal fouling of reverse osmosis and nanofiltration membranes," Journal of Membrane Science, vol. 188, pp. 115-128, 2001.
[39] K. Hong, S. Lee, S. Choi, Y. Yu, S. Hong, J. Moon, et al., "Assessment of various membrane fouling indexes under seawater conditions," Desalination, vol. 247, pp. 247-259, 2009.
[40] J. C. Schrotter, S. Rapenne, J. Leparc, P. J. Remize, and S. Casas, "2.03 - Current and Emerging Developments in Desalination with Reverse Osmosis Membrane Systems," in Comprehensive Membrane Science and Engineering, ed Oxford: Elsevier, 2010, pp. 35-65.
[41] J. S. Vrouwenvelder, D. A. Graf von der Schulenburg, J. C. Kruithof, M. L. Johns, and M. C. M. van Loosdrecht, "Biofouling of spiral-wound nanofiltration and reverse osmosis membranes: A feed spacer problem," Water Research, vol. 43, pp. 583-594, 2009.
[42] J. S. Vrouwenvelder, S. A. Manolarakis, J. P. van der Hoek, J. A. M. van Paassen, W. G. J. van der Meer, J. M. C. van Agtmaal, et al., "Quantitative biofouling diagnosis in full scale nanofiltration and reverse osmosis installations," Water Research, vol. 42, pp. 4856-4868, 2008.
[43] T. H. Chong, F. S. Wong, and A. G. Fane, "Enhanced concentration polarization by unstirred fouling layers in reverse osmosis: Detection by sodium chloride tracer response technique," Journal of Membrane Science, vol. 287, pp. 198-210, 2007.

64
[44] F. Meng, S.-R. Chae, A. Drews, M. Kraume, H.-S. Shin, and F. Yang, "Recent advances in membrane bioreactors (MBRs): Membrane fouling and membrane material," Water Research, vol. 43, pp. 1489-1512, 2009.
[45] S. Ognier, C. Wisniewski, and A. Grasmick, "Characterisation and modelling of fouling in membrane bioreactors," Desalination, vol. 146, pp. 141-147, 2002.
[46] G.-D. Kang, C.-J. Gao, W.-D. Chen, X.-M. Jie, Y.-M. Cao, and Q. Yuan, "Study on hypochlorite degradation of aromatic polyamide reverse osmosis membrane," Journal of Membrane Science, vol. 300, pp. 165-171, 2007.
[47] X.-M. Wang and T. D. Waite, "Gel layer formation and hollow fiber membrane filterability of polysaccharide dispersions," Journal of Membrane Science, vol. 322, pp. 204-213, 2008.
[48] A. R. Costa, M. N. de Pinho, and M. Elimelech, "Mechanisms of colloidal natural organic matter fouling in ultrafiltration," Journal of Membrane Science, vol. 281, pp. 716-725, 2006.
[49] G. M. Ayoub, F. Merhebi, A. Acra, M. El-Fadel, and B. Koopman, "Seawater bittern for the treatment of alkalized industrial effluents," Water Research, vol. 34, pp. 640-656, 2000.
[50] G. M. Ayoub, "Heavy Metal Removal by Coagulation with Seawater Liquid Bittern," Journal of Environmental Engineering, vol. 127, pp. 196-207, 2001.
[51] L. Semerjian and G. M. Ayoub, "High-pH–magnesium coagulation–flocculation in wastewater treatment," Advances in Environmental Research, vol. 7, pp. 389-403, 2003.
[52] Y. A. Le Gouellec and M. Elimelech, "Calcium sulfate (gypsum) scaling in nanofiltration of agricultural drainage water," Journal of Membrane Science, vol. 205, pp. 279-291, 2002.
[53] D. Kim, S. Jung, J. Sohn, H. Kim, and S. Lee, "Biocide application for controlling biofouling of SWRO membranes — an overview," Desalination, vol. 238, pp. 43-52, 2009.
[54] A. S. Al-Amoudi, "Factors affecting natural organic matter (NOM) and scaling fouling in NF membranes: A review," Desalination, vol. 259, pp. 1-10, 2010.
[55] A. E. Childress and S. S. Deshmukh, "Effect of humic substances and anionic surfactants on the surface charge and performance of reverse osmosis membranes," Desalination, vol. 118, pp. 167-174, 1998.
[56] W. Tang and H. Y. Ng, "Concentration of brine by forward osmosis: Performance and influence of membrane structure," Desalination, vol. 224, pp. 143-153, 2008.
[57] Z. Wang, T. Lin, and W. Chen, "Effect on membrane fouling and intrinsic characteristics of UF subjected to potassium permanganate pre-oxidation," Desalination and Water Treatment, vol. 57, pp. 13404-13414, 2016.
[58] S. R. Suwarno, S. Hanada, T. H. Chong, S. Goto, M. Henmi, and A. G. Fane, "The effect of different surface conditioning layers on bacterial adhesion on reverse osmosis membranes," Desalination, vol. 387, pp. 1-13, 2016.

65
[59] C. Y. Tang, T. H. Chong, and A. G. Fane, "Colloidal interactions and fouling of NF and RO membranes: A review," Advances in Colloid and Interface Science, vol. 164, pp. 126-143, 2011.
[60] R. Valavala, J. Sohn, J. Han, N. Her, and Y. Yoon, "Pretreatment in reverse osmosis seawater desalination: A short review," Environmental Engineering Research, vol. 16, pp. 205-212, 2011.
[61] J. S. Vrouwenvelder, J. A. M. van Paassen, L. P. Wessels, A. F. van Dam, and S. M. Bakker, "The Membrane Fouling Simulator: A practical tool for fouling prediction and control," Journal of Membrane Science, vol. 281, pp. 316-324, 2006.
[62] H. Y. Ng and M. Elimelech, "Influence of colloidal fouling on rejection of trace organic contaminants by reverse osmosis," Journal of Membrane Science, vol. 244, pp. 215-226, 2004.
[63] S. Jeong, R. Vollprecht, K. Cho, T. Leiknes, S. Vigneswaran, H. Bae, et al., "Advanced organic and biological analysis of dual media filtration used as a pretreatment in a full-scale seawater desalination plant," Desalination, vol. 385, pp. 83-92, 2016.
[64] Y. Ju and S. Hong, "Nano-colloidal fouling mechanisms in seawater reverse osmosis process evaluated by cake resistance simulator-modified fouling index nanofiltration," Desalination, vol. 343, pp. 88-96, 2014.
[65] W. K. Kim, Y. K. Sung, H. S. Yoo, and J. T. Kim, "Optimization of coagulation/flocculation for phosphorus removal from activated sludge effluent discharge using an online charge analyzing system titrator (CAST)," Journal of Industrial and Engineering Chemistry, vol. 21, pp. 269-277, 2015.
[66] S. Jeong, K. Cho, H. Bae, P. Keshvardoust, S. A. Rice, S. Vigneswaran, et al., "Effect of microbial community structure on organic removal and biofouling in membrane adsorption bioreactor used in seawater pretreatment," Chemical Engineering Journal, vol. 294, pp. 30-39, 2016.
[67] J. Kim, Z. Cai, and M. M. Benjamin, "Effects of adsorbents on membrane fouling by natural organic matter," Journal of Membrane Science, vol. 310, pp. 356-364, 2008.
[68] R. O. Pereira, C. Postigo, M. L. de Alda, L. A. Daniel, and D. Barceló, "Removal of estrogens through water disinfection processes and formation of by-products," Chemosphere, vol. 82, pp. 789-799, 2011.
[69] W. Ma, Y. Zhao, and L. Wang, "The pretreatment with enhanced coagulation and a UF membrane for seawater desalination with reverse osmosis," Desalination, vol. 203, pp. 256-259, 2007.
[70] V. Bonnelye, M. A. Sanz, J.-P. Durand, L. Plasse, F. Gueguen, and P. Mazounie, "Reverse osmosis on open intake seawater: pre-treatment strategy," Desalination, vol. 167, pp. 191-200, 2004.
[71] P. Côté, M. Masini, and D. Mourato, "Comparison of membrane options for water reuse and reclamation," Desalination, vol. 167, pp. 1-11, 2004.
[72] N. Prihasto, Q.-F. Liu, and S.-H. Kim, "Pre-treatment strategies for seawater desalination by reverse osmosis system," Desalination, vol. 249, pp. 308-316, 2009.

66
[73] A. Brehant, V. Bonnelye, and M. Perez, "Comparison of MF/UF pretreatment with conventional filtration prior to RO membranes for surface seawater desalination," Desalination, vol. 144, pp. 353-360, 2002.
[74] L. F. Greenlee, F. Testa, D. F. Lawler, B. D. Freeman, and P. Moulin, "The effect of antiscalant addition on calcium carbonate precipitation for a simplified synthetic brackish water reverse osmosis concentrate," Water Research, vol. 44, pp. 2957-2969, 2010.
[75] S. Jamaly, N. N. Darwish, I. Ahmed, and S. W. Hasan, "A short review on reverse osmosis pretreatment technologies," Desalination, vol. 354, pp. 30-38, 2014.
[76] J. M. Arnal, M. Sancho, I. Iborra, J. M. Gozálvez, A. Santafé, and J. Lora, "Concentration of brines from RO desalination plants by natural evaporation," Desalination, vol. 182, pp. 435-439, 2005.
[77] B. D. Stanford, J. F. Leising, R. G. Bond, and S. A. Snyder, "Chapter 11 Inland Desalination: Current Practices, Environmental Implications, and Case Studies in Las Vegas, NV," in Sustainability Science and Engineering. vol. Volume 2, C. E. Isabel and I. S. Andrea, Eds., ed: Elsevier, 2010, pp. 327-350.
[78] H. Cooley, P. H. Gleick, and G. Wolff, "Desalination, with a grain of salt: A California Perspective. California: Pacific Institute for Studies in Development, Environment, and Security.," 2006.
[79] M. Ahmed, W. H. Shayya, D. Hoey, and J. Al-Handaly, "Brine Disposal from Inland Desalination Plants," Water International, vol. 27, pp. 194-201, 2002.
[80] A. M. O. Mohamed, M. Maraqa, and J. Al Handhaly, "Impact of land disposal of reject brine from desalination plants on soil and groundwater," Desalination, vol. 182, pp. 411-433, 2005.
[81] Sandia, "Desalination and Water Purification Roadmap – A Report of the Executive Committee," Denver, CO: U.S. Department of the Interior, Bureau of Reclamation and Sandia National Laboratories.2003.
[82] T. Mezher, H. Fath, Z. Abbas, and A. Khaled, "Techno-economic assessment and environmental impacts of desalination technologies," Desalination, vol. 266, pp. 263-273, 2011.
[83] B. C. McCool, A. Rahardianto, and Y. Cohen, "Antiscalant removal in accelerated desupersaturation of RO concentrate via chemically-enhanced seeded precipitation (CESP)," Water Research, vol. 46, pp. 4261-4271, 2012.
[84] F. Mohammadesmaeili, M. K. Badr, M. Abbaszadegan, and P. Fox, "Byproduct recovery from reclaimed water reverse osmosis concentrate using lime and soda-ash treatment," Water Environ Res, vol. 82, pp. 342-50, 2010.
[85] F. Mohammadesmaeili, M. K. Badr, M. Abbaszadegan, and P. Fox, "Mineral recovery from inland reverse osmosis concentrate using isothermal evaporation," Water Res, vol. 44, pp. 6021-30, 2010.
[86] A. M. Urtiaga, E. D. Gorri, G. Ruiz, and I. Ortiz, "Parallelism and differences of pervaporation and vacuum membrane distillation in the removal of VOCs from

67
aqueous streams," Separation and Purification Technology, vol. 22–23, pp. 327-337, 2001.
[87] J.-P. Mericq, S. Laborie, and C. Cabassud, "Vacuum membrane distillation of seawater reverse osmosis brines," Water Research, vol. 44, pp. 5260-5273, 2010.
[88] X. Ji, E. Curcio, S. Al Obaidani, G. Di Profio, E. Fontananova, and E. Drioli, "Membrane distillation-crystallization of seawater reverse osmosis brines," Separation and Purification Technology, vol. 71, pp. 76-82, 2010.
[89] M. Gryta, "CONCENTRATION OF NaCl SOLUTION BY MEMBRANE DISTILLATION INTEGRATED WITH CRYSTALLIZATION," Separation Science and Technology, vol. 37, pp. 3535-3558, 2002.
[90] E. Korngold, L. Aronov, N. Belayev, and K. Kock, "Electrodialysis with brine solutions oversaturated with calcium sulfate," Desalination, vol. 172, pp. 63-75, 2005.
[91] C. J. Gabelich, A. Rahardianto, C. R. Northrup, T. I. Yun, and Y. Cohen, "Process evaluation of intermediate chemical demineralization for water recovery enhancement in production-scale brackish water desalting," Desalination, vol. 272, pp. 36-45, 2011.
[92] A. Pérez-González, A. M. Urtiaga, R. Ibáñez, and I. Ortiz, "State of the art and review on the treatment technologies of water reverse osmosis concentrates," Water Research, vol. 46, pp. 267-283, 2012.
[93] M. H. Vingerhoeds, M. A. Nijenhuis-de Vries, N. Ruepert, H. van der Laan, W. L. P. Bredie, and S. Kremer, "Sensory quality of drinking water produced by reverse osmosis membrane filtration followed by remineralisation," Water Research, vol. 94, pp. 42-51, 2016.
[94] P. H. Wolf, S. Siverns, and S. Monti, "Desalination and the EnvironmentUF membranes for RO desalination pretreatment," Desalination, vol. 182, pp. 293-300, 2005
[95] K. Bell, P. Budd, S. Emery, S. Farnfield, K. Pereira, and C. Scott, "A Feasibility Study for the Construction of a Next Generation Desalination Plant in New South Wales, Australia," University of Surrey, Australia2009.
[96] DOW, "ROSA," 9.1 ed. http://www.dow.com/en-us/water-and-process-solutions/resources/design-software/rosa-software: The Dow Chemical Company (1995-2016), 2016.

68
APPENDIX A
Parameter Method of Analysis Method Reference (APHA/ HACH)
pH Electrometric Method 4500-H+
Temperature Thermometric Method 2550
Turbidity Nephelometric Method 2130
TDS Gravimetric Method 2540-C
TSS Gravimetric Method 2540-D
VSS Gravimetric Method 2540-E
Alkalinity Titrimetric Method 2320
Calcium Hardness EDTA TitrimetricMethod 3500-Ca
Total Hardness EDTA Titrimetric Method 2340-C
Sodium Flame Emission Photometric Method 3500-Na
Iron Flame Emission Photometric Method 3500-Fe
Sulfates Spectrophotometric Method 4500-SO42-
Chlorides Argentometric Method 4500-Cl-
Boron Carmine Method 4500-B
Silica Molybdosilicate Method 4500-SiO2-C
Strontium Flame Emission Photometric Method 3500-Sr
Barium Turbidimetric Method HACH Method 8014
Fecal Coliforms Fecal Coliform Membrane Filter Procedure
9222-D
Total Coliforms Total Coliform Membrane Filter Procedure
9222-B

69
APPENDIX B
Phase pH 8.5 pH 9.5 pH 10 pH 10.5 pH 11 pH 11.5 pH 12 Species
Aragonite 0.5 1.38 1.5 1.8 2.02 0 0 CaCO3
Calcite 0.65 1.53 1.5 1.95 2.16 0 0 CaCO3
Cerrusite 0.46 -0.76 -0.4 0 0 0 0 PbCO3
Chalcedony -0.45 -0.65 -0.8 -1.49 0 0 0 SiO2
Chrysotile 3.96 9.51 11 13.6 0 0 0 Mg3Si2O5(OH)4
CO2(g) -3.58 -4.67 -5 -6.2 -6.91 -7.59 -8.59 CO2
Dolomite 2.25 4.02 4.22 4.86 5.28 0 0 CaMg(CO3)2
Fe(OH)3(a) 1.49 0.95 0 0 0 0 0 Fe(OH)3
Goethite 7.38 6.84 3 0 0 0 0 FeOOH
H2(g) -25.05 -27 -28 -29 -30.05 -31.05 -32.05 H2
H2O(g) -1.51 -1.51 -1.51 -1.51 -1.51 -1.5 -1.5 H2O
Halite -3.54 -3.54 -3.54 -3.54 -3.55 -3.55 -3.37 NaCl
Hausmannite -0.48 4.3 2 0 0 0 0 Mn3O4
Hematite 16.77 15.69 5 0 0 0 0 Fe2O3
Manganite -0.99 0.94 0 0 0 0 0 MnOOH
O2(g) -33.19 -29.19 -27 -25.19 -23.19 -21.19 -19.19 O2
Pb(OH)2 0.91 0.72 0 0 0 0 0 Pb(OH)2
Pyrochroite -3.35 -2.42 0 0 0 0 0 Mn(OH)2
Pyrolusite -4.53 -1.61 0 0 0 0 0 MnO2:H2O
Quartz -0.02 -0.22 -0.8 -1.06 0 0 0 SiO2
Rhodochrosite 1.25 1.09 0.5 0 0 0 0
MnCO3
Sepiolite 1.67 5.05 5.25 6.42 0 0 Mg2Si3O7.5OH:3H2O
Sepiolite(d) -1.23 2.15 2.5 3.52 0 0 0
Mg2Si3O7.5OH:3H2O
Siderite -3.94 -6.57 0 0 0 0 0 FeCO3
SiO2(a) -1.29 -1.48 -1.5 -2.32 0 0 0 SiO2
Strontianite -0.01 0.89 1.02 1.07 0 0 0
SrCO3
Sylvite -5.03 -5.01 -5.03 -5.03 -5.03 -5.02 -4.93 KCl
Talc 6.76 11.92 12 14.41 0 0 0 Mg3Si4O10(OH)2
Witherite -2.53 -1.93 -1.7 -1.47 0 0 0 BaCO3