Reverse and normal drag along a fault - uni-mainz.de · Reverse and normal drag along a fault...
12
Reverse and normal drag along a fault Bernhard Grasemann a, * , Steve Martel b , Cees Passchier c a Department of Geological Sciences, University of Vienna, Althanstr. 14, 1090 Vienna, Austria b Department of Geology & Geophysics, University of Hawaii, Honolulu, HI, USA c Department of Geosciences, University of Mainz, Mainz, Germany Received 6 August 2004 Available online 9 June 2005 Abstract An analysis of the theoretical displacement field around a single dip-slip fault at depth reveals that normal and reverse fault drag develop by perturbation flow induced by fault slip. We analytically model the heterogeneous part of the instantaneous displacement field of an isolated two-dimensional mode II fault in an infinite, homogeneous elastic body in response to fault slip. Material on both sides of the fault is displaced and ‘opposing circulation cells’ arise on opposite sides of the fault, with displacement magnitudes increasing towards the center of the fault. Both normal and reverse drag can develop at the fault center depending on the angle between the markers and the fault; normal drag develops there for low angles (!30–408) and reverse drag for higher angles. A comparison of the theoretical results with published models and natural examples reveals that the characteristics of normal and reverse fault drag are largely insensitive to the scale and rheology of the faulted rocks and that drag forces generated by frictional resistance need not be the primary cause of fault drag. Fault drag has some interesting geometric implications for normal and reverse fault terminology emphasizing the importance for discrimination of vertical separation and throw. Furthermore, our results lead us to propose an alternative model for the formation of rollover anticlines above normal faults. q 2005 Elsevier Ltd. All rights reserved. Keywords: Fault drag; Listric fault; Rollover; Analytical modeling; Stress function 1. Introduction Fault drag refers to the deflection of curved markers adjacent to a fault (e.g. Kearey, 1993). Normal drag (Fig. 1) refers to markers that are convex in the direction of slip and reverse drag to markers that are concave in the direction of slip (e.g. Hamblin, 1965). Normal drag is probably the more commonly recognized phenomenon. Several explanations have been proposed to explain reverse drag, such as pre- brittle failure followed by reversal of movement on the fault, elastic and isostatic rebound, diapirism, sagging, differential compaction, and topological irregularities rep- resented by fault overlap zones. Recognizing that reverse drag is not an abnormal structure but a common feature associated with normal faults, Hamblin (1965) suggested a model in which normal slip along a listric fault results in the formation of a rollover anticline. This model has appealed to petroleum geologists because of the potential of the anticline to form a hydrocarbon trap (e.g. Tearpock and Bischke, 2003) and has been widely accepted in structural geology textbooks (e.g. Twiss and Moores, 1992). However, Barnett et al. (1987) suggested that reverse drag results from a local decrease in displacement in the fault-normal direction and warned that hanging wall rollover anticlines cannot be used to distinguish listric from planar normal faults. Furthermore, Reches and Eidelman (1995) have shown by means of numerical modeling that fault drag reflects non-uniform deformation near a fault and that reverse drag may also form above anti-listric faults. While Reches and Eidelman (1995) demonstrated that drag effects can change along a single fault from reverse at its center to normal at its termination, they concluded (a) that reverse drag is mainly associated with ‘short’ faults (of unspecified length), and (b) that there is no consistent rule-of-thumb for fault drag. Grasemann et al. (2003) investigated with a finite element model the deflection of markers around a fault of finite length in a linear viscous medium. They considered various far-field velocity boundary conditions and Journal of Structural Geology 27 (2005) 999–1010 www.elsevier.com/locate/jsg 0191-8141/$ - see front matter q 2005 Elsevier Ltd. All rights reserved. doi:10.1016/j.jsg.2005.04.006 * Corresponding author. Tel.: C43 1 4277 53472; fax: C43 1 4277 9534. E-mail address: [email protected] (B. Grasemann).
Transcript of Reverse and normal drag along a fault - uni-mainz.de · Reverse and normal drag along a fault...
Reverse and normal drag along a fault
Bernhard Grasemanna,*, Steve Martelb, Cees Passchierc
aDepartment of Geological Sciences, University of Vienna, Althanstr. 14, 1090 Vienna, AustriabDepartment of Geology & Geophysics, University of Hawaii, Honolulu, HI, USA
cDepartment of Geosciences, University of Mainz, Mainz, Germany
Received 6 August 2004
Available online 9 June 2005
Abstract
An analysis of the theoretical displacement field around a single dip-slip fault at depth reveals that normal and reverse fault drag develop
by perturbation flow induced by fault slip. We analytically model the heterogeneous part of the instantaneous displacement field of an
isolated two-dimensional mode II fault in an infinite, homogeneous elastic body in response to fault slip. Material on both sides of the fault is
displaced and ‘opposing circulation cells’ arise on opposite sides of the fault, with displacement magnitudes increasing towards the center of
the fault. Both normal and reverse drag can develop at the fault center depending on the angle between the markers and the fault; normal drag
develops there for low angles (!30–408) and reverse drag for higher angles. A comparison of the theoretical results with published models
and natural examples reveals that the characteristics of normal and reverse fault drag are largely insensitive to the scale and rheology of the
faulted rocks and that drag forces generated by frictional resistance need not be the primary cause of fault drag. Fault drag has some
interesting geometric implications for normal and reverse fault terminology emphasizing the importance for discrimination of vertical
separation and throw. Furthermore, our results lead us to propose an alternative model for the formation of rollover anticlines above normal
faults.
q 2005 Elsevier Ltd. All rights reserved.
Keywords: Fault drag; Listric fault; Rollover; Analytical modeling; Stress function
1. Introduction
Fault drag refers to the deflection of curved markers
adjacent to a fault (e.g. Kearey, 1993). Normal drag (Fig. 1)
refers to markers that are convex in the direction of slip and
reverse drag to markers that are concave in the direction of
slip (e.g. Hamblin, 1965). Normal drag is probably the more
commonly recognized phenomenon. Several explanations
have been proposed to explain reverse drag, such as pre-
brittle failure followed by reversal of movement on the
fault, elastic and isostatic rebound, diapirism, sagging,
differential compaction, and topological irregularities rep-
resented by fault overlap zones. Recognizing that reverse
drag is not an abnormal structure but a common feature
associated with normal faults, Hamblin (1965) suggested a
model in which normal slip along a listric fault results in the
0191-8141/$ - see front matter q 2005 Elsevier Ltd. All rights reserved.
doi:10.1016/j.jsg.2005.04.006
* Corresponding author. Tel.:C43 1 4277 53472; fax:C43 1 4277 9534.
E-mail address: [email protected] (B. Grasemann).
formation of a rollover anticline. This model has appealed to
petroleum geologists because of the potential of the
anticline to form a hydrocarbon trap (e.g. Tearpock and
Bischke, 2003) and has been widely accepted in structural
geology textbooks (e.g. Twiss and Moores, 1992). However,
Barnett et al. (1987) suggested that reverse drag results from
a local decrease in displacement in the fault-normal
direction and warned that hanging wall rollover anticlines
cannot be used to distinguish listric from planar normal
faults. Furthermore, Reches and Eidelman (1995) have
shown by means of numerical modeling that fault drag
reflects non-uniform deformation near a fault and that
reverse drag may also form above anti-listric faults. While
Reches and Eidelman (1995) demonstrated that drag effects
can change along a single fault from reverse at its center to
normal at its termination, they concluded (a) that reverse
drag is mainly associated with ‘short’ faults (of unspecified
length), and (b) that there is no consistent rule-of-thumb for
fault drag. Grasemann et al. (2003) investigated with a finite
element model the deflection of markers around a fault of
finite length in a linear viscous medium. They considered
various far-field velocity boundary conditions and
Journal of Structural Geology 27 (2005) 999–1010
www.elsevier.com/locate/jsg

Fig. 1. Fault drag of a central marker along normal and reverse (thrust)
faults. Normal drag refers to markers that are convex in the direction of slip
and reverse drag to markers that are concave in the direction of slip. The
angle q is the acute angle measured from the fault to the undeformed central
marker (anticlockwise angles are positive). The presented work demon-
strates that low angles favor normal drag and high angles favor reverse
drag.
B. Grasemann et al. / Journal of Structural Geology 27 (2005) 999–10101000
compared the results with natural examples collectively
called flanking structures (Passchier, 2001). Confirming the
results of Reches and Eidelman (1995) that the drag of
marker lines may change along a fault, Grasemann et al.
(2003) showed that the drag of a central marker is only a
function of the angle q, the acute angle measured from the
fault to the undeformed central marker (anticlockwise
angles are positive). At low angles (jqj!w308) faults
develop a normal drag but if the marker meets the fault at
higher angles (jqjOw308) reverse drag develops (compare
Fig. 1). Surprisingly, the model results suggest that the type
of fault drag is independent of the kinematic vorticity
number of the far-field deformation, but no further
explanation why normal or reverse drag forms is given
and therefore its origin is still unknown.
Our aim here is to demonstrate how normal and reverse
drag can develop naturally because of heterogeneous
deformation around a fault, in accord with previous
suggestions (Barnett et al., 1987; Reches and Eidelman,
1995). We use predictions of standard linear elasticity
theory to describe the displacement fields around a fault
idealized as a mode II fracture. Note that we do not consider
fault-inception folds (e.g. van der Pluijm and Marshak,
2004) that include all folds that developed during ductile
deformation preceding faulting (e.g. fault folds, flexure
faults). Furthermore, we do not model drag folds, which are
folds that have formed by shear parallel to layering
(Ramberg, 1963) but focus on folds that develop in response
to single slip along a fault. However, we are aware that
fault-inception folds, drag folds or pre-brittle failure
followed by reversal of movement on the fault might result
in similar geometric pictures discussed in this work. The
major goal of this study is to explain the instantaneous
development of fault drag along a single fault by
investigating the heterogeneous part of the deformation
field caused by fault slip. For the progressive developments
of large strain, complex flanking structures, which may
record rotation of faults and fault slip reversals, the readers
are referred to the work of Exner et al. (2004) and references
cited therein.
2. Conceptual model
When a fault slips, heterogeneous stress and displace-
ment fields develop in the surrounding rock (Pollard and
Segall, 1987). In order to understand the associated drag
effects, we idealize a fault as a simple two-dimensional
crack with plane strain sliding displacement (mode II) in an
infinite elastic body. We also postulate that the driving stress
Ds, the difference between the shear traction on the fault
before and after slip (Pollard and Segall, 1987), is uniform.
The slip distribution on such a fault is elliptical, reaching a
maximum at the center of the fault and dropping to zero at
the fault tips (Rippon, 1985; Barnett et al., 1987; Pollard and
Segall, 1987; Walsh and Watterson, 1989). A nearly
elliptical slip pattern also is conceivable for a fault that is
more than two fault lengths below the surface. Decidedly
non-elliptical and asymmetric slip distributions can arise,
however, for many reasons (Burgmann et al., 1994), such as
non-uniform driving stresses, irregular fault geometries,
interactions with other faults, or intersections with a free
surface (e.g. the earth’s surface). Where the slip distribution
is not elliptical, the complete displacement field will yield
drag patterns different to those we describe here. We focus
on certain first-order processes that lead to fault drag, and do
not address important questions pertaining to the initiation
and propagation of faults. Nor do we investigate the
progressive development of fault drag along slip surfaces,
which rotate or even may record a reversal of fault slip
(Exner et al., 2004). We also ignore complex fault
geometries. For modeling purposes we assume that all
displacement except along the fault is accommodated by
continuous deformation, although we are aware that on
many natural faults a significant amount of discontinuous
deformation is accommodated through secondary syn- and
antithetic faults, secondary fracturing, or solution precipi-
tation mechanisms (e.g. Walsh and Watterson, 1991; Martel
and Boger, 1998).
The model here is based on linear elasticity theory and is
idealized in terms of geometry, material properties and
boundary conditions in order to highlight the first order
influences of fault drag formation. The model captures the
mechanics of an idealized single slip event or a series of
events that do not include any stress relaxation. However,
by setting Poisson’s ratio to 0.5 and replacing the modulus
of rigidity with the coefficient of viscosity and displacement
magnitudes with velocity, the results can be directly
translated to solutions for incompressible Newtonian
viscous materials (Grasemann et al., 2003). Viscoelastic
constitutive properties that would account for stress
relaxation during accumulation of slip in a series of events
are not considered. We emphasize, however, that the similar
B. Grasemann et al. / Journal of Structural Geology 27 (2005) 999–1010 1001
geometries of fault drag in different lithologies and in a wide
range of non- to high-grade metamorphic rocks (Passchier,
2001) suggest that certain basic characteristics of fault drag
are largely scale independent. Existing theoretical treat-
ments also reveal only a minor dependence on the rheology
of the host rock (e.g. Barr and Houseman, 1992; Grasemann
and Stuwe, 2001). In light of these findings, we contend that
an elastic analysis should provide insight into fault drag.
Because we are interested in the instantaneous develop-
ment of fault drag, which is caused by heterogeneous
deformation induced by the fault slip, we ignore the
homogeneous part of the deformation, which is a common
procedure in analytical solutions (e.g. ignoring the second
part of eq. 28.8 which is related to the remote stress in
Pollard and Segall (1987)). In other words we focus on the
heterogeneous deformation caused by the relative motion of
a mode II crack ignoring any homogeneous background
field. This displacement field is similar to the perturbation
flow (e.g. Cobbold, 1975; Mancktelow, 1991), which has
been recently used by Passchier et al. (2005) to classify
natural structures. As a consequence the homogeneous
background field and its orientation are immaterial for the
origin (not the sense of slip, magnitude of drag, etc.) of fault
drag, because homogeneous deformation cannot bend/fold/
drag initially linear marker lines. For the further progressive
development of fault drag the readers are referred to
analogue and numerical models published elsewhere
(Grasemann et al., 2003; Exner et al., 2004; Wiesmayr
and Grasemann, 2005; Passchier et al., 2005).
The fault in our two-dimensional model extends along
the x-axis from xZKa to xZa. Displacements are confined
to the x, y-plane and do not vary in the z-direction (i.e. we
consider a plane strain case). Slip occurs if the ambient
remote shear stress parallel to the fault differs from the shear
traction on the fault, the difference of both is known as the
driving stress Ds. However, the uniform ambient stress field
causes a homogeneous deformation field that does not
contribute to fault drag (planar markers can be deformed but
they remain planar). Therefore, we focus on the displace-
ment field associated with slip on the fault, which results in
a non-homogeneous deformation field responsible for the
fault drag.
2.1. Stress functions for a mode II fault
We calculate the displacement field around a fault that
has slipped using Westergaard stress functions (Wester-
gaard, 1939; Tada et al., 2000). The interested reader can
consult (Pollard and Segall, 1987; Burgmann et al., 1994;
Martel, 1997, 1999) for more detailed mathematical and
physical aspects of these functions.
The displacement components ux and uy are found from
two complex functions, and Z (Tada et al., 2000):
ux Z1
2Gð2ð1KnÞIm �Z Cy Re ZÞ (1a)
uy Z1
2GðKð1K2nÞRe �Z Ky Im ZÞ (1b)
where n is Poisson’s ratio, G is the modulus of rigidity (i.e.
shear modulus), and
Z Zd �Z
dz(2)
The stress functions that yield the displacement field
solely due to slip on a fault with a uniform driving stress are
(Tada et al., 2000):
�Z ZDsffiffiffiffiffiffiffiffiffiffiffizKa
p ffiffiffiffiffiffiffiffiffiffiffizCa
pKz
� �(3a)
Z ZDszffiffiffiffiffiffiffiffiffiffiffi
zKap ffiffiffiffiffiffiffiffiffiffiffi
zCap K1
� �(3b)
where zZxCiy. Note, that the termffiffiffiffiffiffiffiffiffiffiffiffiffiffiz2Ka2
pis factored asffiffiffiffiffiffiffiffiffiffi
zKap ffiffiffiffiffiffiffiffiffiffi
zCap
in order to yield correct values for the stress
functions in all four quadrants of the complex plane (for a
detailed discussion see Martel (1997)).
2.2. Displacement field near the center of a fault
The displacement field associated with fault slip is
complex and heterogeneous. As a result, slip on a fault will
cause an offset marker to be deformed as well. In order to
describe this deformation as clearly as we can, we discuss
the x- and y-components of the displacement field separately
(Fig. 2). We pay particular attention to the effects on a
marker that passes through the center of a fault; we
henceforth call such a marker a central marker. As we will
show, the deformation near the center of a fault is relatively
uniform, so a marker does not need to pass precisely through
the center of a fault to display the drag characteristics we
discuss below.
First consider the displacement in the x-direction of a
central marker perpendicular to the fault (Fig. 2a). The
displacements along the marker are exclusively in the x-
direction (uyZ0) and increase towards the fault:
uxjxZ0 ZDs
2Ga
! 2ð1KnÞ
ffiffiffiffiffiffiffiffiffiffiffiffiffiffiffiffiffiffiffiffi1C
y
a
� �2r" #
K ð3K2nÞjy
ajC
ya
� �2ffiffiffiffiffiffiffiffiffiffiffiffiffiffiffiffiffi1C y
a
� �2q0B@
1CA sgnðyÞ
(4a)
The radical terms can be expanded using the binomial
theorem. Dropping terms of (y/a) higher than first order
yields a simpler approximate expression:
uxzDs
2Ga ½2ð1KnÞ�K ð3K2nÞ
y
a
� �� �(4b)
This matches eq. 8.59b of Pollard and Segall (1987) for
the approximate value of ux anywhere within roughly half a
fault length from the fault center. Interestingly, Eq. (4b) is

Fig. 2. Displacement fields in the (a) x-direction ux and (b) y-direction uy generated by dextral slip along a mode II fault fromK1!x!1 at yZ0. Poisson’s ratio
nZ0.3 and the ratio of driving stress to the modulus of rigidity Ds/GZ1/100. In order to illustrate the heterogeneous deformation of the elastic solutions,
displacements in the figures are exaggerated by a factor of 100 (Pollard and Segall, 1987). Marker lines (dotted line) perpendicular or at high angles to the fault
will be primarily deformed by the discontinuous displacement field ux into a concave shape in the shear direction and therefore record a reverse drag. Marker
lines parallel or at low angles to the fault will be displaced predominantly by the continuous displacement field uy into a convex shape recording a normal drag.
The total displacement field composed of ux and uy are shown in Fig. 3.
Fig. 3. Total displacement field near a dextral mode II fault and
corresponding deformation of marker lines, initially passing through the
origin at different angles. Marker lines meeting the fault at higher angles
(Ow30–408) are dominated by the influence of ux resulting in reverse fault
drag. At lower angles (!w30–408), however, where ux is less significant,
the deformation of the marker lines are mainly a function of uy and
therefore result in a normal fault drag (compare with Fig. 2).
B. Grasemann et al. / Journal of Structural Geology 27 (2005) 999–10101002
not a function of x, reflecting the fact that ux changes little
with x near the center of the fault. The term in square
brackets corresponds to the fault wall displacement at the
center of the fault (i.e. half the maximum slip). The
remainder of the expression reveals a nearly linear decay in
ux with distance from the fault; note that the terms
containing Poisson’s ratio are positive because y is less
than 0.5. The fault-parallel component of displacement
causes a central marker perpendicular to the fault to be bent
concave in the direction of slip: a reverse drag contribution
develops. The same conclusion applies to fault-perpendicu-
lar markers near the fault center in light of Eq. (4b), as well
as to originally planar markers of other orientations.
Now consider the displacement in the y-direction
(Fig. 2b). We start by considering uy along the plane of
the fault, which has a simple, exact analytical form (Pollard
and Segall, 1987):
uyjyZ0 ZDsð1K2nÞ
2Gx; jxj%a (5a)
uyjyZ0 ZDsð1K2nÞ
2GðxK
ffiffiffiffiffiffiffiffiffiffiffiffiffiffiffix2 Ka2
pÞ; jxjOa (5b)
Figs. 2b and 3 show a counterclockwise rotation of the
medium containing the fault for the ‘apparent right-lateral’
sense of slip depicted. For an opposite sense of slip, the
rotation would be clockwise. Adjacent to the fault (jxj%a,
yZ0G) uy is directly proportional to the distance from the
center of the fault and the driving stress (see Eq. (5a)). This

B. Grasemann et al. / Journal of Structural Geology 27 (2005) 999–1010 1003
means that the rock bordering the fault experiences a
uniform rotation, with the amount of rotation scaling with
the driving stress (Martel, 1999). Pollard and Segall (1987)
show that Eq. (5a) is also the first-order solution for uy
anywhere within roughly half a fault length from the fault
center. Analogous to the ux field near the fault being nearly
independent of x, the uy field near the fault is nearly
independent of y (compare Fig. 2a and b). The uy field near
the fault thus would cause a marker adjacent and parallel to
the fault to be rotated but not bent. With increasing distance
r from the fault center though, uy (as well as ux) decreases,
eventually decaying as a/r. The rotation becomes negligible
far from the fault. As a result, originally planar markers that
are oblique to the fault are rotated more strongly near the
fault center than they are far from the fault. This rotation
change causes the marker to be bent (dragged) in a direction
that is concave in the direction of slip. However, the fault-
normal component of displacement causes a central marker
oblique to the fault to be bent convex in the direction of slip:
a normal drag contribution develops (this superposition of a
normal drag on the reverse drag is discussed in more detail
below, compare Fig. 7a and c). Although our focus is
primarily on deformation of a marker near a fault, we show
one example of how deformation along a long marker can
be complicated (Fig. 2b). Consider a marker that intersects
the fault at a shallow angle: at xZa, uy attains its maximum
amplitude (Eqs. (5a) and (5b)) and for xOa, uy decreases
monotonically towards zero. The marker is deformed in a
complex wave-like shape with an inflexion point opposite
the fault tip.
The total displacement field around a fault reflects a
superposition of both the ux and uy components (Fig. 3).
Whether a central marker displays normal or reverse drag
will depend on the relative contributions of the displace-
ment field to reverse drag and normal drag. Given the
complexity of the displacement field around a fault, the
sense of drag can vary with the orientation of a marker,
where a marker intersects a fault, and the position along the
marker. The difference between normal drag and normal
drag superposed on reverse drag is outlined in more detail in
the discussion section.
Fig. 4. Plot of fault angle q versus the magnitude of the curvature k of the
central marker. Negative values for k indicate a normal drag, whilst marker
lines with a positive k have a reverse drag. Close to the fault (1/10 of the
fault half-length) normal drag arises for fault-marker angles q!w408, with
reverse drag occurring for fault-marker angles qOw408 (dotted line). If the
central marker is evaluated at a larger distance to the fault (3/4 of the fault
half-length) normal drag arises for fault-marker angles q!w308, with
reverse drag occurring for fault-marker angles qOw308 (solid line).
2.3. Drag of markers
The sense of drag depends on whether a marker becomes
concave or convex in the direction of slip. We investigate
now how the relative orientation of a fault and a marker
affects the direction of marker curvature near a fault using
the exact analytical expressions for the displacement field
obtained from Eqs. (1a), (1b), (3a) and (3b). We calculate
the curvature vector by fitting an osculating circle with
radius R to three points on the deformed marker. The
curvature k, measured in diopters (mK1), is given by:
kZ1
R(6)
Close to the fault (i.e. within 1/10 of the fault half-length)
our results show that normal drag (negative diopters) at the
fault center arises for fault-marker angles q!w408, with
reverse drag occurring for fault-marker angles qOw408
(dotted line in Fig. 4). However, in natural examples the
drag very close to the fault might be difficult to recognize
and it has therefore been suggested to investigate fault drag
up to a distance of about half the fault-length (e.g. Barnett et
al., 1987). If the central marker is evaluated at a larger
distance to the fault (e.g. within 3/4 of the fault half-length)
normal drag arises for fault-marker angles q!w308, with
reverse drag occurring for fault-marker angles qOw308
(solid line in Fig. 4), which is consistent with results from
finite element solutions of Grasemann et al. (2003).
Although our focus is on the fault center, we also
investigate how the sense of drag can vary with position
along a fault. The theoretical results here allow four classes
of drag structures to be distinguished (Fig. 5). However, in
order to understand the heterogeneous deformation induced
by slip along a fault, we modeled the heterogeneous part of
the deformation field without an imposed background strain.
Therefore, the instantaneous structures in Fig. 5 cannot be
directly compared with finite structures represented by the
natural examples in Fig. 6. However, analogue and
numerical models of finite deformation and the comparison
of model results with natural examples (Grasemann et al.,
2003; Exner et al., 2004; Wiesmayr and Grasemann, 2005)
show that at low finite strain the geometries are very similar
to the instantaneous structures presented in this study. For
this reason, we think it is useful to refer to natural examples
in the following discussion of our modeled structures,
although we are aware that a direct comparison is
inadequate.
2.3.1. Normal fault-normal drag
Large-scale examples are so-called ‘low-angle’ normal
faults, which commonly reveal a normal drag (e.g.
Wernicke, 1981). Other natural examples of this structure
at smaller scale are shear bands (Berthe et al., 1979; White,

Fig. 5. Array of markers deflected by the displacement field (Eqs. (1a) and (1b)) generated by a fault of finite length (parameters and exaggeration see Fig. 2). In
order to compare the model results with faults cutting through a horizontal layering or bedding, the coordinate system of Fig. 3 is rotated until the marker lines
are parallel to a horizontal reference line. Dependent on the angle between the markers in the far field and the fault, four different structures can be
distinguished: (a) normal fault–normal drag; (b) normal fault–reverse drag; (c) reverse fault–normal drag; (d) reverse fault–reverse drag.
B. Grasemann et al. / Journal of Structural Geology 27 (2005) 999–10101004
1979), which are secondary synthetic slip surfaces.
Statistically shear bands have low angles to the shear zone
boundary (Passchier, 1984; Goscombe et al., 2004), but
depending on the rheology, anisotropy and rotation during
progressive deformation, shear bands may be also oriented
at higher angles (Platt, 1984; Williams and Price, 1990;
Stock, 1992). Typical natural examples of shear bands are
illustrated in many publications. For example, Snoke et al.
(1998) illustrate shear bands from many different rock types
developed under a broad range of metamorphic conditions.
Fig. 5a shows a central marker (in a heavy line) with normal
drag from our model for qZ208. Interestingly, normal drag
also develops along the fault in the two quadrants where slip
results in a decrease in the mean compressive stress,
whereas reverse drag develops in the quadrants where the
mean compressive stress increases. Although the orientation
of the fault in the field example given in Fig. 6a is higher
than in the instantaneous solution (Fig. 5a), the overall
geometry of the fault drag of marker lines matches the
geometry predicted by our model fairly well.
2.3.2. Normal fault-reverse drag
Hamblin (1965), who coined the term ‘reverse drag’,
provided a superb example from the Hurricane Fault (Grand
Canyon, Arizona) nearly four decades ago. Grasemann and
Stuwe (2001), Passchier (2001) and Grasemann et al. (2003)

Fig. 6. Natural examples of structures modeled in Fig. 5. (a) Normal faults (shear band boudinage) in greenschist facies marbles mylonites showing a marked
normal drag (N Naxos, Greece; N37811 026.200/E25830 048.800). (b) Normal fault with reverse drag from the same outcrop. (c) Reverse fault with normal drag in
the Tethyan sediments of the fold and thrust belt in Spiti (Pin Valley, NW-Himalaya; N32805 053.0400/E78809 059.64 00). Note the similarity of the structure with a
fault propagation fold. (d) Reverse fault associated with reverse fault drag in marbles of the Goantagab Domain (Kaoko Belt, Namibia;
S20840 0033.000/E014825 0049.700).
B. Grasemann et al. / Journal of Structural Geology 27 (2005) 999–1010 1005
described other examples of reverse drag-along faults with
extensional slip. Surprisingly few studies exist, however,
that focus on the origin of reverse drag (e.g. Hamblin, 1965).
Fig. 5b shows a central marker (in a heavy line) with reverse
drag from our model for qZ408. Note that the sense of drag
changes along the model fault in Fig. 5b in a manner
analogous to that of Fig. 5a. Our analytical results,
represented in Fig. 5b, are consistent with the numerical
results of Grasemann et al. (2003), and also similar to the
field example of Fig. 6b. Reverse drag associated with
regional normal faults is commonly referred to as a rollover
anticline. Rollover anticlines typically are attributed to slip
along listric normal faults, even though many reported
examples of reverse drag do not occur along listric faults.
Our model shows that reverse drag does not require curved
fault geometry. We discuss this point further below.
2.3.3. Reverse fault-normal drag
Regional reverse faults with normal drag are widely
recognized and are commonly attributed to folding that
coincides with the upper tip of a thrust fault (e.g. Boyer,
1986; Suppe and Medwedeff, 1990). Passchier (2001) also
presented natural examples of reverse faults with normal
drag, terming the drag features ‘s-Type flanking folds’. An
exceptional illustrative example from the Pin Valley in the
NW-Himalayas is given in Fig. 6c. Most of the published
examples are associated with a fault ramp that is connected
to a flat detachment fault, and the footwall commonly is
considered as undeformed (e.g. Jackson and McKenzie,
1983). We find that neither a flat detachment fault nor a rigid
footwall is required for normal drag on a reverse fault.
Footwall deformation along reverse faults generally has
been interpreted as indicating folding preceding faulting
during early development of break-thrust folds (Fischer et
al., 1992). Nevertheless, McConnell et al. (1997) presented
excellent natural examples of fault-related folds, where the
hanging walls and footwalls are deformed, displacements
decrease up- and down-dip from the centers of the faults,

B. Grasemann et al. / Journal of Structural Geology 27 (2005) 999–10101006
and fault ramps do not join a flat-lying detachment. The
kinematic model of McConnell et al. (1997) for folding
yields geometric forms similar to our mechanical model
(Fig. 5c). Note that normal drag of the central marker and at
the leading edge of the reverse may be accompanied by
reverse drag between the fault centers at the trailing tip. Our
results thus should be distinguishable from folds considered
to be break-thrust folds (Wiesmayr and Grasemann, 2005).
2.3.4. Reverse fault-reverse drag
Fig. 6d shows reverse drag along a reverse fault at a steep
angle (w608) to a mylonitic foliation. Although this
structure has been predicted by mechanical finite element
models (Grasemann et al., 2003), to our knowledge no
natural example has been previously published. In the upper
part of the picture above the tip of the fault a leading edge
fold can be recognized. Towards the middle of the picture,
the slip along the fault increases, revealing a pronounced
reverse drag effect. This field example is consistent with our
model results of Fig. 5d.
3. Discussion
3.1. Drag forces versus flow perturbation
Explanations of normal drag commonly have appealed to
intuition. A typical suggestion invokes a reduction in the
flow velocity of the wall rocks owing to frictional resistance
along the fault. Therefore fault drag has been used to infer
the sense of slip along faults (e.g. Hills, 1963; Billings,
1972; Twiss and Moores, 1992). This practice seems highly
suspect to us, especially since the sense of drag can change
Fig. 7. Both vertical separation vs and throw t can be used to investigate possible
(d)): if the throw is less than the vertical separation (t1!vs), then normal drag mus
then no net drag occurs ( in (a) and (b)). If throw exceeds the vertical separation
must exceed the vertical separation (t1,2,3Ovs in (c) and (d)) and an offset horizonta
normal drag ( ), no drag ( ) or reverse drag ( ).
along the same side of a fault. If drag was produced by
frictional resistance to slip, then the amount of drag should
increase with frictional resistance. However, mechanical
models predict that if frictional resistance to slip increases,
the slip on a fault decreases (Pollard and Segall, 1987) but
also the drag decreases (Reches and Eidelman, 1995;
Grasemann and Stuwe, 2001). Thus if frictional resistance
accounted for drag, then the largest fault drag would be
expected along faults with vanishing amounts of slip (i.e.
where faults are absent; compare Fig. 6a, b and d). This
conclusion is untenable. Finally, our investigation reveals
that both normal and reverse drag can occur along a single
fault (e.g. Figs. 5b and 6d; see also Mansfield and
Cartwright, 2000), and that normal drag can be superposed
on reverse drag (Figs. 5a and 6a). Frictional resistance
cannot account for these observations either. We therefore,
reject frictional resistance as a primary cause for fault drag.
3.2. Normal drag sensu stricto, vertical separation, and
throw
Our analyses (Fig. 5a and c) and our observations (Fig. 6a
and c) of faults show that ‘normal drag’ is in fact a
superposition of a normal drag on the reverse drag
associated with the fault-parallel displacement field. This
has some interesting geometric implications for normal and
thrust fault terminology. In our discussion here we follow
the terminology of Tearpock and Bischke (2003), which
reflects usage in the petroleum exploration community. We
take vertical separation (vs) to be the vertical distance
between very widely spaced points, which lie in a section
perpendicular to the fault plane on opposing sides of a fault
along a once continuous horizontal marker (Fig. 7). Throw
fault drag geometries along normal ((a) and (c)) and reverse faults ((b) and
t exist ( in (a) and (b)). If the throw equals the vertical separation (t2Zvs),
(t3Ovs) reverse drag must exist ( in (a) and (b)). If vsZ0, then the throw
l marker must record reverse drag. Superposed on this reverse drag could be

B. Grasemann et al. / Journal of Structural Geology 27 (2005) 999–1010 1007
(t) is the vertical distance between piercing points on
opposing walls of the fault. By these definitions, vertical
separation is measured using points far from a fault, whereas
throw relies on points that border a fault. As a result, vertical
separation is independent of local displacements near a fault
that produces fault drag, whereas throw depends strongly on
fault drag. Pure normal drag or no drag is only possible
geometrically if the vertical separation is greater than zero
(Fig. 7).
Both vertical separation and throw can be used to
investigate possible fault drag geometries of a marker
through the center of a dip-slip fault (Fig. 7). Three cases are
possible. First, the throw is less than the vertical separation
(t1!vs), then normal drag must exist (Fig. 7a and b).
Second, if the throw equals the vertical separation (t2Zvs),
then no net drag occurs. Third, if throw exceeds the vertical
separation (t3Ovs) reverse drag must exist. If no vertical
separation occurs across a fault, then the throw must exceed
the vertical separation (t1,2,3Ovs in Fig. 7c and d). In such a
case, an offset horizontal marker must record reverse drag.
Superposed on this reverse drag could be normal drag (t1),
no drag (t2) or reverse drag (t3). A major result of this simple
geometrical observation is that any fault with no vertical
separation must have fault drag. Additionally, if no drag
occurs across a fault, then vertical separation must occur.
Because the established terminology is insufficient to
describe complex fault drag geometries, Coelho et al.
(2005) have recently suggested a new quantitative descrip-
tive terminology using cubic Bezier curves.
3.3. Listric faults and rollover anticlines
The concept of a listric (based on the Greek word listron
or shovel), concave-up normal fault was introduced by
Suess (1909) as part of his description of curved faults in the
coal mines of Saint-Eloi and Leon (northern France). They
are now recognized in many places around the world (e.g.
Shelton, 1984). Three features have been considered as
characteristic of listric normal faults: a flat detachment
surface, a rigid footwall, and hanging wall strata with a dip
that increases toward a normal fault (i.e. rollover anticline or
reverse drag; Shelton, 1984). Balanced cross-section
analyses of listric faults are widely applied to investigate
these features, to quantify regional extension, and in the
exploration for hydrocarbons (e.g. Tearpock and Bischke,
2003). Rollover anticlines, for example, are one of the most
important hydrocarbon traps (Tearpock and Bischke, 2003
and references cited therein). Since these methods also are
used to assess the geometry of normal faults, which can seal
subsurface fluid flow, they are important in defining the
volume of a hydrocarbon reservoir (Hardman and Booth,
1991). The impact and widespread use of listric fault models
prompt us to re-examine two of the commonly held
perceptions about these faults.
We start with the assumption that a hanging wall rollover
implies a listric fault geometry (e.g. Shelton, 1984 and
references therein). This assumption seems highly precar-
ious to us. First, although listric faults appear common, not
all normal faults have listric geometries. For example,
seismic reflection data commonly indicate normal fault
traces that are not concave up in cross-sections (e.g.
Jackson, 1987). Additionally, earthquake data provide little
evidence for the notion that large-scale normal faults
invariably flatten with depth. Second, reverse drag and
rollover-like geometries occur at all scales and within a
broad range of different homogeneous and heterogeneous
rheologies (compare the presented and referenced examples
in this work), including faults that have non-listric
geometries. Third, in addition to our results, many
mechanical models of planar faults (King et al., 1988;
Gibson et al., 1989; Ma and Kusznir, 1993; Reches and
Eidelman, 1995; Grasemann et al., 2003) show reverse drag.
So listric fault geometries are not a prerequisite for reverse
drag to develop. Our results show instead that reverse drag
can be a consequence of heterogeneous perturbation
deformation as a result of fault slip. Although other
mechanisms before, during or after faulting could affect
the development of reverse fault drag, we are in accord with
Barnett et al. (1987) who suggested that the displacement
field associated with slip is the primary cause for reverse
drag (e.g. Fig. 5b).
The second perception that appears suspect to us is that
the footwall of a normal fault is rigid. This assumption has
no mechanical basis, and it certainly does not make sense in
cases where rocks of similar lithology (or rheology) are
juxtaposed by faulting (Kusznir et al., 1991). Indeed,
geodetic measurements for single slip events, high-resol-
ution three-dimensional seismic data sets, and detailed
investigations of faults in outcrops commonly reveal reverse
drag profiles in both the hanging wall and footwall
(Kasahara, 1981; McConnell et al., 1997; Mansfield and
Cartwright, 2000). A few reasons might contribute to the
perception that fault footwalls are rigid.
The first is that displacements (and drag effects) in the
footwall can be much less than those in the hanging wall.
Such an association would be strong evidence for a stiffness
difference for faults that are substantially deeper than their
down-dip extent (i.e. faults that behave as though they were
in an infinite body). Mechanical analyses of normal faults
that intersect or interact with the earth’s surface, however,
reveal decidedly different slip profiles from faults far from
the surface. Surface-breaching faults or near-surface faults
tend to have a slip maximum at or near the surface rather
than near the fault center; they offset markers in a manner
somewhat similar to that in the lower half of Fig. 5b.
Perhaps more significantly though, unlike faults in an
infinite elastic body with no free surface, normal faults in an
elastic half-space generate an asymmetric displacement
field, with greater displacement (and more pronounced
drag) in the hanging wall than in the footwall (Ma and
Kusznir, 1993; Roberts and Yielding, 1994; Langley, 2000).
The contrast in displacement could be mistaken for an
B. Grasemann et al. / Journal of Structural Geology 27 (2005) 999–10101008
increase in rigidity in the footwall, when it actually reflects a
difference in the ‘effective thickness’ of the units on the
opposing sides of the fault. For a fault near the surface, the
hanging wall is thin relative to the ‘infinitely thick’ footwall.
Rigidity (i.e. the shear modulus) is an intrinsic property of a
rock and does not depend on the geometry of a rock body. It
should not be confused with ‘flexural rigidity’, the
resistance to bending, which is highly dependent on the
geometry of a body (Turcotte and Schubert, 2002).
A second reason that might contribute to the perception
that fault footwalls are rigid is that reverse drag on either
side of the fault may be associated with little of no drag on
the opposing side, especially if structural levels above or
below the central marker are observed (compare Figs. 4
and 5).
A third reason relates to the ease of preparing physical
models with rigid footwalls (e.g. McClay et al., 1991) that
yield hanging wall deformation akin to that in outcrops or
inferred in seismic cross-sections. The similarity in results
does not mean that the footwalls of faults in the earth are
rigid though.
Listric fault models and the associated hanging wall
rollover have been extensively applied by many workers to
quantify regional extension, probably due to the ease with
which hanging wall collapse may be restored using the
vertical shear construction or one of its many derivatives
(Yamada and McClay, 2003). However, because these
techniques commonly are predicted on the assumption of a
listric fault geometry (Tearpock and Bischke, 2003), they
will necessarily predict a listric geometry even for faults that
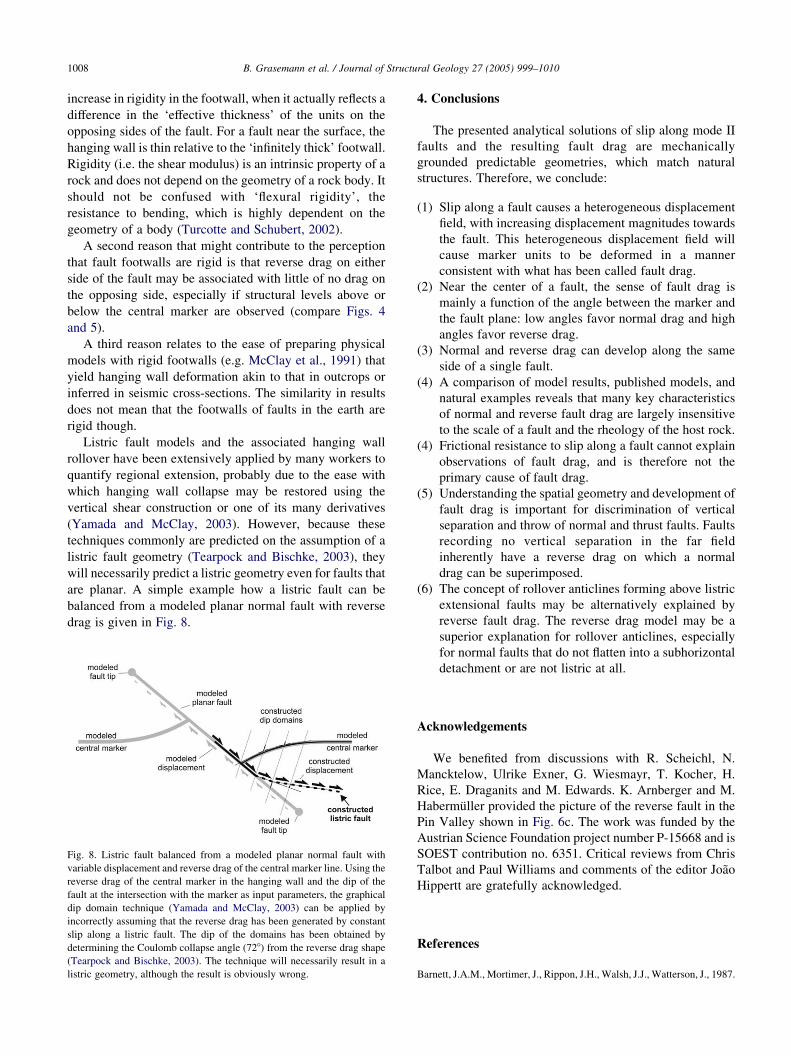
are planar. A simple example how a listric fault can be
balanced from a modeled planar normal fault with reverse
drag is given in Fig. 8.
Fig. 8. Listric fault balanced from a modeled planar normal fault with
variable displacement and reverse drag of the central marker line. Using the
reverse drag of the central marker in the hanging wall and the dip of the
fault at the intersection with the marker as input parameters, the graphical
dip domain technique (Yamada and McClay, 2003) can be applied by
incorrectly assuming that the reverse drag has been generated by constant
slip along a listric fault. The dip of the domains has been obtained by
determining the Coulomb collapse angle (728) from the reverse drag shape
(Tearpock and Bischke, 2003). The technique will necessarily result in a
listric geometry, although the result is obviously wrong.
4. Conclusions
The presented analytical solutions of slip along mode II
faults and the resulting fault drag are mechanically
grounded predictable geometries, which match natural
structures. Therefore, we conclude:
(1)
Slip along a fault causes a heterogeneous displacementfield, with increasing displacement magnitudes towards
the fault. This heterogeneous displacement field will
cause marker units to be deformed in a manner
consistent with what has been called fault drag.
(2)
Near the center of a fault, the sense of fault drag ismainly a function of the angle between the marker and
the fault plane: low angles favor normal drag and high
angles favor reverse drag.
(3)
Normal and reverse drag can develop along the sameside of a single fault.
(4)
A comparison of model results, published models, andnatural examples reveals that many key characteristics
of normal and reverse fault drag are largely insensitive
to the scale of a fault and the rheology of the host rock.
(4)
Frictional resistance to slip along a fault cannot explainobservations of fault drag, and is therefore not the
primary cause of fault drag.
(5)
Understanding the spatial geometry and development offault drag is important for discrimination of vertical
separation and throw of normal and thrust faults. Faults
recording no vertical separation in the far field
inherently have a reverse drag on which a normal
drag can be superimposed.
(6)
The concept of rollover anticlines forming above listricextensional faults may be alternatively explained by
reverse fault drag. The reverse drag model may be a
superior explanation for rollover anticlines, especially
for normal faults that do not flatten into a subhorizontal
detachment or are not listric at all.
Acknowledgements
We benefited from discussions with R. Scheichl, N.
Mancktelow, Ulrike Exner, G. Wiesmayr, T. Kocher, H.
Rice, E. Draganits and M. Edwards. K. Arnberger and M.
Habermuller provided the picture of the reverse fault in the
Pin Valley shown in Fig. 6c. The work was funded by the
Austrian Science Foundation project number P-15668 and is
SOEST contribution no. 6351. Critical reviews from Chris
Talbot and Paul Williams and comments of the editor Joao
Hippertt are gratefully acknowledged.
References
Barnett, J.A.M., Mortimer, J., Rippon, J.H., Walsh, J.J., Watterson, J., 1987.

B. Grasemann et al. / Journal of Structural Geology 27 (2005) 999–1010 1009
Displacement geometry in the volume containing a single normal fault.
The American Association of Petroleum Geologist Bulletin 71, 925–
937.
Barr, T.D., Houseman, G.A., 1992. Distribution of deformation around a
fault in a non-linear ductile medium. Geophysical Research Letters 19,
1145–1148.
Berthe, D., Choukroune, P., Jegouzo, P., 1979. Orthogneiss, mylonite and
non coaxial deformation of granites: the example of the South
Armorican shear zone. Journal of Structural Geology 1, 31–43.
Billings, M.P., 1972. Structural Geology. Prentice-Hall, Englewood Cliffs,
NJ.
Boyer, S.E., 1986. Styles of folding within thrust sheets: examples from the
Appalachians and Rocky Mountains of the USA and Canada. Journal of
Structural Geology 8, 325–339.
Burgmann, R., Pollard, D.D., Martel, S.J., 1994. Slip distributions on faults:
effects of stress gradients, inelastic deformation, heterogeneous host-
rock stiffness, and fault interaction. Journal of Structural Geology 16,
1675–1690.
Cobbold, P.R., 1975. Fold propagation in single embedded layers.
Tectonophysics 27, 333–351.
Coelho, S., Passchier, C.W., Grasemann, B., 2005. Classification of fault
drag. Journal of Structural Geology 27, 597–606.
Exner, U., Mancktelow, N.S., Grasemann, B., 2004. Progressive develop-
ment of s-type flanking folds in simple shear. Journal of Structural
Geology 26, 2191–2201.
Fischer, M.P., Woodward, N.B., Mitchell, M.M., 1992. The kinematics of
break-thrust folds. Journal of Structural Geology 14, 451–460.
Gibson, H.D., Walsh, J.J., Watterson, J., 1989. Modelling of bed contours
and cross-sections adjacent to planar normal faults. Journal of Structural
Geology 11, 317–328.
Goscombe, B.D., Passchier, C.W., Hand, M., 2004. Boudinage classifi-
cation: end-member boudin types and modified boudin structures.
Journal of Structural Geology 26, 739–763.
Grasemann, B., Stuwe, K., 2001. The development of flanking folds during
simple shear and their use as kinematic indicators. Journal of Structural
Geology 23, 715–724.
Grasemann, B., Stuwe, K., Vannay, J.-C., 2003. Sense and non-sense of
shear in flanking structures. Journal of Structural Geology 25, 19–34.
Hamblin, W.K., 1965. Origin of ‘reverse drag’ on the down-thrown side of
normal faults. Geological Society of America Bulletin 76, 1145–1164.
Hardman, R.F.P., Booth, J.E., 1991. The significance of normal faults in the
exploration and production of North Sea hydrocarbons. In:
Roberts, A.M., Yielding, G., Freeman, B. (Eds.), The Geometry of
Normal Faults Geological Society Special Publication, vol. 56, pp. 1–
16.
Hills, E.S., 1963. Elements of Structural Geology. Methuen and Co,
London.
Jackson, J.A., 1987. Active normal faulting and crustal extension. In:
Coward, M.P., Dewey, J.F., Hancock, P.L. (Eds.), Continental
Extensional Tectonics Geological Society Special Publication, vol.
28, pp. 3–17.
Jackson, J., McKenzie, D., 1983. The geometrical evolution of normal fault
systems. Journal of Structural Geology 5, 471–482.
Kasahara, K., 1981. Earthquake Mechanics. Cambridge University Press,
Cambridge.
Kearey, P., 1993. The Encyclopedia of the Solid Earth Sciences. Blackwell
Science, Oxford.
King, G.C.P., Stein, R., Rundle, J., 1988. The growth of geological
structures by repeated earthquakes, 1: conceptual framework. Journal of
Geophysical Research 93, 13307–13318.
Kusznir, N.J., Marsden, G., Egan, S.S., 1991. A flexural-cantilever simple-
shear/pure-shear model of continental lithosphere extension: appli-
cations to the Jeanne d’ Arc Basin, Grand Banks and Viking Graben,
North Sea. In: Robersts, A.M., Yielding, G., Freeman, B. (Eds.), The
Geometry of Normal Faults Geological Society Special Publication,
vol. 56, pp. 41–60.
Langley, J.S., 2000. Processes of normal faulting and surface deformation
along the Koae fault system, Hawaii. Unpublished MS thesis,
University of Hawaii.
Ma, X.Q., Kusznir, N.J., 1993. Modelling of near-field subsurface
displacements for generalized faults and fault arrays. Journal of
Structural Geology 15, 1471–1484.
Mancktelow, N.S., 1991. The analysis of progressive deformation from an
inscribed grid. Journal of Structural Geology 13, 859–864.
Mansfield, C.S., Cartwright, J.A., 2000. Stratal fold patterns adjacent to
normal faults: observations from the Gulf of Mexico. In:
Cosgrove, J.W., Ameen, M.S. (Eds.), Forced Folds and Fractures
Geological Society Special Publication, vol. 169, pp. 115–128.
Martel, S.J., 1997. Effects of cohesive zones on small faults and
implications for secondary fracturing and fault trace geometry. Journal
of Structural Geology 19, 835–847.
Martel, S.J., 1999. Mechanical controls on fault geometry. Journal of
Structural Geology 21, 585–596.
Martel, S.J., Boger, W., 1998. Geometry and mechanics of secondary
fracturing around small three-dimensional faults in granitic rock.
Journal of Geophysical Research 103, 21299–21314.
McClay, K.R., Waltham, D.A., Scott, A.D., Abousetta, A., 1991. Physical
and seismic modelling of listric normal fault geometries. In:
Robersts, A.M., Yielding, G., Freeman, B. (Eds.), The Geometry of
Normal Faults Geological Society Special Publication, vol. 56, pp. 231–
240.
McConnell, D.A., Kattenhorn, S.A., Benner, L.M., 1997. Distribution of
fault slip in outcrop-scale fault-related folds, Appalachian Mountains.
Journal of Structural Geology 19, 257–267.
Passchier, C.W., 1984. The generation of ductile and brittle shear bands in a
low angle mylonite zone. Journal of Structural Geology 6, 273–281.
Passchier, C.W., 2001. Flanking structures. Journal of Structural Geology
23, 951–962.
Passchier, C.W., Mancktelow, N., Grasemann, B., 2005. Flow pertur-
bations: a tool to study and characterize heterogeneous deformation.
Journal of Structural Geology. doi:10.1016/jsg.2005.01.016.
Platt, J.P., 1984. Secondary cleavages in ductile shear zones. Journal of
Structural Geology 6, 439–442.
Pollard, D.D., Segall, P., 1987. Theoretical displacements and stresses near
fractures in rocks. In: Atkinson, B.K. (Ed.), Fracture Mechanics of
Rock. Academic Press, London, pp. 277–349.
Ramberg, H., 1963. Evolution of drag folds. Geological Magazine 100, 97–
106.
Reches, Z., Eidelman, A., 1995. Drag along faults. Tectonophysics 247,
145–156.
Rippon, J.H., 1985. Contoured patterns of throw and hade of normal faults
in the coal measures (Westphalian) of northeast Derbyshire. Proceed-
ings of the Yorkshire Geological Society 45, 147–161.
Roberts, A.M., Yielding, G., 1994. Continental extensional tectonics. In:
Hancock, P.L. (Ed.), Continental Deformation. Pergamon Press,
Oxford, pp. 223–250.
Shelton, W., 1984. Listric normal faults: an illustrated summary. The
American Association of Petroleum Geologist Bulletin 68, 801–815.
Snoke, A.W., Tullis, J., Todd, V.R., 1998. Fault-related Rocks. Princeton
University Press, Princeton, NJ.
Stock, P., 1992. A strain model for antithetic fabric rotation in shear band
structures. Journal of Structural Geology 14, 1267–1275.
Suess, E. 1909. Das Antlitz der Erde. Tempsky, F.; Freytag, G., Prag and
Wien; Leipzig.
Suppe, J., Medwedeff, D.A., 1990. Geometry and kinematics of fault-
propagation folding. Eclogae Geologicae Helvetiae 83, 409–454.
Tada, H., Paris, P.C., Irwin, G.R., 2000. The Stress Analysis of Cracks
Handbook. The American Society of Mechanical Engineers, New York.
Tearpock, D.J., Bischke, R.E., 2003. Applied Subsurface Geological
Mapping. Prentice Hall, New Jersey.
Turcotte, D.L., Schubert, G., 2002. Geodynamics. Cambridge University
Press, Cambridge.
B. Grasemann et al. / Journal of Structural Geology 27 (2005) 999–10101010
Twiss, R.J., Moores, E.M., 1992. Structural Geology. W.H. Freeman and
Company, New York.
van der Pluijm, B., Marshak, S., 2004. Earth Structure—an Introduc-
tion to Structural Geology and Tectonics. WCM/McGraw-Hill,
New York.
Walsh, J.J., Watterson, J., 1989. Displacement gradients on fault surfaces.
Journal of Structural Geology 11, 307–316.
Walsh, J.J., Watterson, J., 1991. Geometric and kinematic coherence and
scale effects in normal fault systems. In: Robersts, A.M., Yielding, G.,
Freeman, B. (Eds.), The Geometry of Normal Faults Geological Society
Special Publication, vol. 56, pp. 193–206.
Wernicke, B., 1981. Low-angle normal faults in the Basin and Range
Province-Nappe tectonics in an extending orogen. Nature 291, 645–648.
Westergaard, H.M., 1939. Bearing pressures and cracks. Journal of Applied
Mechanics 66, 107–125.
White, S., 1979. Large strain deformation: report on a Tectonic Studies
Group discussion meeting held at Imperial College, London on 14
November 1979. Journal of Structural Geology 1, 333–339.
Wiesmayr, G., Grasemann, B., 2005. Sense and non-sense of shear in
flanking structures with layer-parallel shortening: implications for fault-
related folds. Journal of Structural Geology 27, 249–264.
Williams, P.F., Price, G.P., 1990. Origin of kinkbands and shear-band
cleavage in shear zones; an experimental study. Journal of Structural
Geology 12, 145–164.
Yamada, Y., McClay, K., 2003. Application of geometric models to
inverted listric fault systems in sandbox experiments. Paper 1: 2D
hanging wall deformation and section restoration. Journal of Structural
Geology 25, 1551–1560.