Revenue Cycle 2025 - Becker's Hospital Review Thursday...Revenue Cycle 2025 SEPTEMBER 20, 2018...
37
Revenue Cycle 2025 SEPTEMBER 20, 2018 Transforming Reimbursements and Collections Cultures with Analytics and Automation 4 th Annual Health IT and Revenue Cycle Conference 2018 Jonathan G. Wiik, MSHA, MBA Principal, Healthcare Strategy TransUnion Healthcare [email protected]
Transcript of Revenue Cycle 2025 - Becker's Hospital Review Thursday...Revenue Cycle 2025 SEPTEMBER 20, 2018...

Revenue Cycle 2025
SEPTEMBER 20, 2018
Transforming Reimbursements and
Collections Cultures with Analytics and
Automation
4th Annual Health IT and
Revenue Cycle Conference 2018
Jonathan G. Wiik, MSHA, MBAPrincipal, Healthcare Strategy
TransUnion Healthcare

Traditional Revenue Cycle
Market Trends

© 2018 TransUnion LLC All Rights Reserved | 3
Deloitte healthcare sector outlook
“Public and private health systems have been facing
revenue pressures and declining margins for years. The
trend is expected to persist as increasing demand,
infrastructure upgrades, and therapeutic and technology
advancements strain the already limited financial
resources. As a result, spending is expected to be driven
by aging and growing populations, developing market
expansion, clinical and technology advances, and rising
labor costs. As health care costs increase though,
affordability and insurance coverage remain problematic.
Health care providers are also collaborating to gain
competitive advantage.”
Source: Deloitte - https://www2.deloitte.com/global/en/pages/life-sciences-and-healthcare/articles/global-health-care-sector-outlook.html#

© 2018 TransUnion Healthcare, Inc. All Rights Reserved | 4
Healthcare reform…Quadruple Aim (Outcomes, Cost, Patient experience, Clinician Experience), ACA
“reconciliation”, CMS waivers, and state transparency laws are all gaining momentum. Well
care through Value Based Outcome reimbursement.
The good, the bad and the ugly – Big Data and AnalyticsEverybody wants some, but WHERE is it and HOW do I use it effectively? Focus on Social
Determinants of Health (SDOH) and preventative medicine to engage patients and curb
utilization costs.
Pay me now or pay me later, but please payDenials and underpayments are drivers to revenue leakage that cannot occur in a value-
based care world. Provider patient facilitated financing and payer revenue protection are key
areas of focus
Patient Financial Experience through RCM TransparencyProviders must create loyalty for the patient consumer “Amazonians”. “Go mobile, or go
home” is a focus as well as the impact of AI and voice. The clinical and payment experience
must to be “frictionless”.
Mergers and Acquisitions - Slow economic growth has stalled spending in
healthcare sector, and costs continue to rise. Has led to exponential M & A activity, and
also in non-traditional areas with retail, insurance, and others. Market size is shrinking,
negotiating power is limited, and competition is fierce.
TOP TRENDS IN RCM

© 2018 TransUnion LLC All Rights Reserved | 5
Hospital and Health System M&A Activity is largest it has
been in recent history
Source: KH: https://www.kaufmanhall.com/sites/default/files/2017-in-Review_The-Year-that-Shook-Healthcare.pdf
Hospital and Health System M&A Activity, 2000-2017

© 2018 TransUnion LLC All Rights Reserved | 6
Examples of Health System M&A Activity

Non traditional Merger and Acquisitions are disrupting hospital market
Source: HFMA Annual 2018: Jared Sorensen, 3M

© 2018 TransUnion LLC All Rights Reserved | 8
For the first time since 2013, uncompensated care
increased by $2.6B in 2016
Source: AHA Dec 2017 Uncompensated Care Report
$35.7
$38.3
4500
4600
4700
4800
4900
5000
5100
5200
5300
5400
5500
$-
$5
$10
$15
$20
$25
$30
$35
$40
$45
$50
1990 1991 1992 1993 1994 1995 1996 1997 1998 1999 2000 2001 2002 2003 2004 2005 2006 2007 2008 2009 2010 2011 2012 2013 2014 2015 2016
Num
be
r o
f H
osp
ita
ls
Un
co
mp
en
sa
ted
Ca
re (
$B
)
UNCOMPENSATED CARE 1990-2016

© 2018 TransUnion LLC All Rights Reserved | 9
Hospitals have three areas of focus to contain costs in 2018:
Deloitte, AHA, Healthcaredive:
https://www.healthcaredive.com/news/hospital-budgets-2018/512137/
▪ In 2016, annual expense growth rate outpaced annual revenue growth rate for nonprofit
and public healthcare organizations
▪ Declining reimbursement and payer steerage to less expensive, low acuity settings is
prevalent
▪ Revenue cycle costs have remained flat in recent years despite increased consolidation
in the industry, indicating health systems have not realized greater savings by pooling
their revenue cycle functions…
“Hospital leaders will need to focus more on ‘blocking and tackling’
and ongoing efforts to seek out efficiencies, reduce costs and find
ways to grow their business.”
“Technology will be a critical tool for cost containment efforts…
analytics and EMRs should be considered as a tool to target savings.”
1CLINICAL VARIATION
REDUCTION 2 LABOR MANAGEMENT 3REVENUE CYCLE
MANAGEMENT

© 2018 TransUnion LLC All Rights Reserved | 10
$
Underinsured
Patient
Balance After
Insurance
Denials
Medical
Necessity,
Eligibility,
Authorization,
out of
network,
OOTF etc.
Uninsured
Self Pay
Bad Debt
Medicare
Underpayments
(TDRG,
IME/GME, etc.)
Claims
Management
Commercial
contractual
Underpayments
Payer and Patient Revenue
Revenue Leakage
Revenue Leakage

© 2018 TransUnion LLC All Rights Reserved | 11
Underpayments
Medicare
– Combined underpayments were $68.8 billion in 2016.
– This includes a shortfall of $48.8billion for Medicare and $20.0 billion for Medicaid.
– For every dollar spent by hospitals caring for patients in 2016, 87 and 88 cents for Medicaid
respectively
Commercial
– $69 Billion spent nationally by providers on payer rules
– Over half (58%) of commercial claims deny initially (4% increase in denied claims from 2015-
2016)
– 5% of average hospital NPR is LOST in underpayments ~ $2.5M for a mid size hospital
Sources: 1)AHA: https://www.aha.org/system/files/2018-01/medicaremedicaidunderpmt%202017.pdf, 2)Advisory Board:
https://static1.squarespace.com/static/554b97b8e4b01f8ee692d265/t/5a5947538165f53cdc4475d9/1515800410085/9.+Optimizing+AR+-+Beadle+Ryby.pdf, 3)MGMA
https://www.mgma.com/MGMA/media/files/fellowship%20papers/Prior-Authorization-Denial-Challenges-for-an-Integrated-Health-System-fellowship-paper.pdf?ext=.pdf

© 2018 TransUnion LLC All Rights Reserved | 12
77% $25B3%-
5%25% 15.3%
Percentage
of providers
that still use
paper-based
patient billing
methods
Dollars in
Medicare
Spend
related to
payment
integrity and
cost reporting
Percentage
of charges
never
posted. This
equates to
$30-$50M
additional
revenue for a
$1 billion
organization
Percentage
of claims
that are
denied
according to a
GAO study
Average
recovery
rates for
hospitals,
21.8% for
non-hospital
providers
Revenue leakage and market impacts are staggering
Sources :Black Book ; accusttream; meddata, rev cycle intelligence
HFMA, HPS, TU proprietary TransUnion data

Innovative Revenue Cycle
What is working and why

© 2018 TransUnion Healthcare, Inc. All Rights Reserved | 14Sources: HBI, HFMA
Denials
POS Collections
Centralize Patient Access
Patient Financial Experience
Payer Scorecards
CDI
Productivity/Labor
Recruitment/Retention RCM
Charge Capture
CDM / Transparency
Bundled Payments
Insourcing (from 3rd party)
HBI: Top Revenue Cycle Priority?
7/10OF THESE AREASARE ON BOTH LISTS
Revenue Integrity
CDI
BI/Analytics
E.H.R. Workflow/reports
Self pay management
Coding
Productivity Labor
Recruitment/Retention RCM
HFMA: Which RCM capability is your organization most focused on next year?
79%OF THESE AREAS INVOLVE
(OR ARE ENABLED BY)
TECHNOLOGY
RCM INITIATIVES FOR 2020

Identifying
difficult,
hard-to-find
correct insurers
& policy numbers
Managing
timing delays
& changes in
payer eligibility
databases
Identifying
correct payer
for a specific
service
Unique
Medicare
billing
challenges
Accounts with
no “meaningful”
activity due to
information gaps
Unique, atypical
billing
requirements
Zero balance
accounts – either
“paid” or written off
to free care/charity
allowances
Bad debt accounts
for deductibles
and copays – no
activity but have
secondary payer
Determining
correct OP
primary payer
when multiple
coverage exists
Billing system
setup issues –
incorrectly
or not billing
claims
C H A L L E N G E S
A D D R E S S E D B Y
U N D E R PAY M E N T
R E V I E W
10
06
02
05
01
08
04
07
03
09
And, with increasingly demanding timely filing limits © 2018 TransUnion Healthcare, Inc. All Rights Reserved | 4

Physician-owned company in New York, focused on ED, Urgent Care, Hospitalists and Intensivists billing, and closely examined self pay patients with no apparent insurance coverage…
Significantly lowered cost to collect by re-billing missed eligibility that otherwise would have gone to bad debt
Recovered over $1,000,000 in insurance payments from found coverage
INSURANCE DISCOVERY CASE STUDY

© 2018 TransUnion Healthcare, Inc. All Rights Reserved | 17
“Ensure the solution finds the needle without
going through the haystack.”
VICE PRESIDENT, FINANCE, LARGE HEALTH SYSTEM IN GREATER NEW YORK AREA
Underpayment Review Case Study
COMPREHENSIVE CONSULTATIVE ACCURATE
▪ All payer class, all services
▪ Reviews all accounts, including
zero-balance
▪ Targets timely filing, rapidly aging
and complex accounts
▪ Provides detailed guidance &
knowledge sharing for continuous
improvement
▪ 20+ years’ experience serving
academic medical centers
▪ Results are 90%+ actionable,
inpatient accounts are closer to
100%
▪ Technology-driven results are
reviewed by experienced analysts
Delivered over $10 Million in realized revenue to a
large health system in the greater New York City area.

© 2018 TransUnion LLC All Rights Reserved | 18
Medicare reimbursement optimization are an underserved
segment of RCM
• Requires gathering, validating and integrating
large and disparate data sets from multiple
sources — hospital, Medicare, and Medicaid
• Requires expert knowledge of the complex
regulations developed by CMS and the often
inconsistent way in which these regulations are
administered by the MACs
• Requires deep understanding of hospital
information systems and business processes to
identify how these areas impact the
reimbursement available to the hospital
Key Attributes of These Payment Issues
Ensure solution
leverages one (1)
data set
These underpayments represent $25B Portion of Medicare Spend
Look at all areas within
PPS, LTAC, IRF, and
CAH Hospitals
Closely evaluate Recurring
and Retrospective Revenue
Opportunities
Insurance
Verification
Scheduling/
Registration
Enrollment/
Admission
Charge
Capture
Coding
Claims
ProcessingDenial
Management
Payment
Integrity
Cost
Reports
Revenue Cycle
Management
Uncompensated
Care Analytics
Medicare
Bad Debt
Volume Decrease
Adjustment
Shadow Billing
Compliance
(IME/GME)
Medicare
Transfer DRG
Complex DRG Review
Disproportionate Share
Maximizing reimbursement in these issues
requires leading edge technology, deep domain
experience and proven analytics and reporting

© 2018 TransUnion LLC All Rights Reserved | 19
Medicare Underpayments Case Study
Identified $828K in Medicare Underpayments and Unrealized Revenue
Large Medical Center in Mountain States
• 306-Bed Acute Care Facility
• Part of Large National Health network
• $1.8M Charity Care and $8.9M in Free Care 2017
• Identified $522,961 in missed
recovery for 2009–2011
• Average increase of 92% in
recovery above hospital findings
Medicare DSH
• Identified $184,483 in missed
recovery for 2012
• Located 6,000 Total Medicaid Days
for 2012
• 10% increase in Medicaid days from
years past
Transfer DRG
• FY 2012 Recovery of $105,739
• Average amount per claim of
$3,411
• Facility’s internal review confirmed
111 claims
• Validated facility’s findings to
confirm an increase of 37% from
past years
• FY 2012 Recovery of $14,640
Shadow Billing
Medicare Bad Debt
0
$1.0M
$1.5M
92%
$8MM
$6MM
$4MM
$2MM
2009 - 2011
$632,629
$522,961
3,000
3,500
2012Discharges
1%
3,429Discharges
31 Claims
0
$2M
10%
$1.5M
$1,548,227
$184,483
$1MM
2012
0
37%300
200
100
Total Claims
187 Claims
111 Claims$14,640
© 2018 TransUnion LLC All Rights Reserved | 20
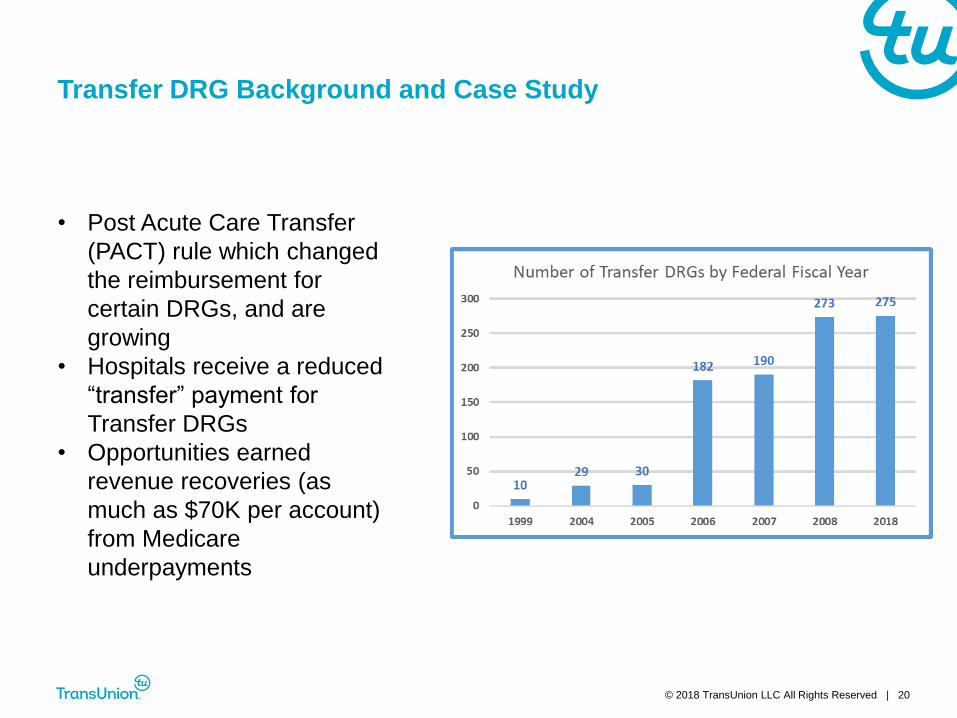
Transfer DRG Background and Case Study
• Post Acute Care Transfer
(PACT) rule which changed
the reimbursement for
certain DRGs, and are
growing
• Hospitals receive a reduced
“transfer” payment for
Transfer DRGs
• Opportunities earned
revenue recoveries (as
much as $70K per account)
from Medicare
underpayments

Five hospital health system on west coast leveraged technology and tools to recover millions in Medicare underpayments

Organization▪ Banner Health
▪ 50,000 employees
Size
▪ 28 acute care facilities, from 22 to 744 beds, across 6 states
▪ Also provides Home health, Hospice, and Behavioral health services
▪ 2.1 million annual patient visits
Adoption
▪ NOV YTD 2017 Bad Debt ~ $289M
▪ NOV YTD 2017 Charity Care ~ $389M
▪ Provided an estimate to every patient, every time
Improvements
over home
grown
estimation
system
▪ Migrated from homegrown excel-based estimation to TU ClearIQ
▪ TU Loaded complex payer contracts
▪ Performs professional estimates as well as facility estimates
▪ Provides enhanced accuracy for estimation
▪ Estimate letter easy for staff to understand and explain to patients
Banner Health

© 2018 TransUnion LLC All Rights Reserved | 23
Banner Health has had consistent YOY performance in POS
Collections

Banner Health processes and implementation of tool enhanced POS collections significantly…

Preventing Revenue Leakage
Strategies to protect your earned revenue

© 2018 TransUnion LLC All Rights Reserved | 26
Stratifying patient risk and payments
Identity Verification
▪ Prevent fraud
▪ Verify identity and protect PHI
▪ Validate address and demographic information
Insurance Discovery / Presumptive Charity
▪ Establish Coverage
▪ Balance their bad debt portfolio
▪ Re-classify accounts as charity
Propensity to Pay
▪ Prioritize high balance accounts
▪ Increase POS collections and cash flow
▪ Help patients truly in need and collect from those who can pay
Bad Debt
Payment
Charity
COLLECTIONS
Rapidly determine

© 2018 TransUnion LLC All Rights Reserved | 27
The Bottom Line
30%
SELF-PAY ACCOUNTS
80% OF
COLLECTED
CASH
Critical to rapidly identify the accounts that will pay
— from both the patient and the payer
1-5% of self-pay accounts* written off to bad debt have billable
insurance coverage unknown to the
hospital or its vendors
30% of self-pay accounts will generate over 80% of cash collected*
*Transunion Proprietary Data

© 2018 TransUnion LLC All Rights Reserved | 28
Sample Workflow* – Self-Pay / High BAI After Discharge
Sample Self Pay / Patient High PBAI Workflow
SE
LF
-PA
Y /
HIG
H B
AI
Coverage
Found?
Patient Payment
collected?
NO
Done
Credit info
returned?
Probability of
financial aid?
Patient ability to
pay bills?
NO
Cascade to
Alternative Data
Model
YES
Probability of financial
aid? Propensity to
pay bills?
YES
No FA application required,
collection zero; write off account
to charity
Collect FA application, attempt to
collect any payment based on
sliding scale, or AGB
Collect 100% of payment, or
seek alternative care or payment
recovery options
Collect first payment and
establish payment plan over time
for 2-3 year term
MAYBE: Charity
Potential: FAP
FPL 201%-350%
LOW Score – Low
collections probability
YES: 100% Charity
No FA required: PE
FPL < 200%
Lowest Account Score
No collections
probability
NO: Not eligible for Charity
FPL > 500%
HIGH Recovery Score
Ask for full payment
NOT LIKELY:
Possible Charity
FPL 351%-500%
MODERATE Score
Partial Payments
NOYES
*Example provided for illustrative purposes and organizations should follow their unique Financial Assistance Policy(s)

© 2018 TransUnion LLC All Rights Reserved | 29
Once underpayments are identified, undergo a strict
documentation process to validate opportunity
Ensure discovered underpayments are delivered for your review
and approval in an automated and seamless fashion
Where necessary, deploy teams to complete all claim
correction and appeal work to ensure payment
Monitor all underpaid accounts on a daily basis until you
receive the incremental reimbursement
Have a third party review your accounts to identify qualifying
payments
Identify and resolve underpayments – protect your earned
revenue from leakage

© 2018 TransUnion LLC All Rights Reserved | 30
$
Underinsured
Patient
Balance After
Insurance
Denials
Medical
Necessity,
Eligibility,
Authorization,
out of
network,
OOTF etc.
Uninsured
Self Pay
Bad Debt
Medicare
Under-
payments
(TDRG,
IME/GME, etc.)
Claims
Management
Commercial
contractual
Under-
payments
Payer and Patient Revenue
Revenue Leakage
Denials
Prevention
Medicare
Payment
Recovery
Optimization
Increased
insurance
yield
Increased
Claims
throughput
and
productivity
✓ Eligibility
✓ Estimation
✓ Payment/Financing
✓ Insurance
Discovery
✓ Charity
Determination
$ $ $ $ $ $
✓ Authorization
✓ Medical Necessity
✓ Predictive
Analytics
✓ Automated audits and
retrospective payment reviews
✓ Resubmitted Claims
✓ Increased Medicare Payment
Yield for TDRG, IME/GME,
DSH and Medicare Beneficiary
Bad Debt
✓ Claim Status
Inquiry
✓ Resubmittal of
assumed $0
claims
✓ Revenue
Assurance
✓ Insurance
Discovery
✓ Corrected Claims
✓ TPL/SUBRO
Resolution
REVENUE
PROTECTION
Revenue Protection

Revenue Cycle 2025
What to expect in a data and consumer-driven
collections culture

HiMSS Patient Financial Experience of the Future
32
PRIMARY CARE
PHYSICIAN
URGENT
CARE
EMERGENCY
DEPARTMENT
$
$25.00
$$
$150.00
$$$
$564.23
5.1 mi 2.8 mi 11.3mi
2 day No Wait 1 hour

© 2018 TransUnion Healthcare, Inc. All Rights Reserved | 33
Source: HFMA https://www.hfma.org/Content.aspx?id=55353
Financial ClearanceRobots can be positioned to verify / flag the necessary financial clearance-related tasks for a
patient and then access a variety of websites or applications to complete them
Credit BalancesCredit balance reversal through automated transaction posting can eliminate thousands of
transactions over time, helping to reduce costs and reallocate staff to higher value activities
Accounts PayableRPA affords automation and streamlined workflows by managing the receipt, accrual and
payment according to contract terms
Claims / Denials ManagementRobotic programming can be prepared in accordance with COB/ Eligibility rules to replicate the
human resolution process
Robotic Process Automation applications to revenue cycle

© 2018 TransUnion Healthcare, Inc. All Rights Reserved | 34
Source: HFMA Central PA: Visiquate – Waller and Briner
STAGE 1 STAGE 2 STAGE 3 STAGE 4 STAGE 5 STAGE 6
DATA
ANALYSIS
INVESTIGATIVE
ANALYTICS
BUSINESS
INTELLIGENCE
PREDICTIVE
ANALYTICS
PRESCRIPTIVE
ANALYTICS
CONTINUOUS
LEARNING ACTION
What happened
yesterday?
Why did it
happen yesterday?
What is
happening now?
What will
happen tomorrow?
How do we
influence tomorrow?
Action-step
optimization
PA
TIE
NT
AC
CE
SS
I can see that yesterday’s
First Pass Denial Rate was
30% of claims.
I can see that the majority
of denials are related to
authorization & eligibility
issues.
Today we have X% of pre-
authorizations obtained
prior to service.
Because we are currently
running a low percentage of
pre-authorizations prior to
service, we can expect X%
higher rates of first pass
denials related to
authorizations in the next
90 days.
I get work queues of
accounts that have been
identified as high
opportunity & are missing
pre-auth so that they can be
addressed before services
are performed.
Patient Access staff gets
visibility into the
downstream impact of low
authorization percentages
along with daily reporting of
Patient Access KPIs to help
mitigate this issue in the
long run.
RE
VE
NU
E IN
TE
GR
ITY
I can see that the prior
period’s discharges had an
Actual LOS to Expected
LOS ratio
of 1.1.
I can see that 15% of
discharges associated with
3 DRG codes are being
delayed primarily due to
patient status & DME
waitlist issues.
Expected LOS projections
for currently in-house
patients with those same
diagnosis codes match the
projections for those that
had a 15% discharge rate
from the prior period.
Projections show that we
will continue to run at a ratio
of 1.1 or higher for the
current & future periods.
Automated forensics
produces worklists of
accounts to investigate
where there has been a
recent change in the typical
mix of procedure codes
associated with these
DRGs.
– I get reports & alerts on
DME usage, status & wait-
times.
Clinical staff provided with
daily visibility into
downstream impact of
clinical procedure changes.
– System recommends an
audit of the DME inventory
& recommends reviewing
/revising the expected LOS
for these DRGs.
PF
S/B
US
INE
SS
OF
FIC
E
A/R turnover rate is
declining.
I can see that my collector
team’s daily average for
number of closed accounts
has fallen by 6%.
# of Touches Per Account
Until Conclusion is higher
than the rolling 90-day
average.
– % of Touches Within
Follow up Guidelines is
greater than the 90-day
average.
A\R Days projected to
increase by 2-3 days within
45 days.
– Cost to Collect projected
to increase 4% by end of
current month
Automated forensic analysis
looks for statistically
meaningful commonalities
on accounts with higher
than average number of
touches (DRG, Assignee,
CARC/RARC. Etc.), findings
reported to stakeholders
with recommended actions.
Collections staff is provided
visibility into key
performance metrics &
alerted to declining
performance trends.
– System provides
organizational transparency
(how much is coming vs
how much is going out) so
that every department can
see if they are ahead or
falling behind.
BI Maturity Curve

© 2018 TransUnion Healthcare, Inc. All Rights Reserved | 35
SOURCES: 1) HFMA https://www.triple-tree.com/strategic-insights/2018/june/hfma-highlighting-rcms-next-round-of-innovation/ l 2) https://www.mdconnectinc.com/medical-marketing-insights/voice-
search-improve-healthcare-patients-providers 3) HFN https://www.healthcarefinancenews.com/news/us-bank-optum360-partner-solution-streamline-boost-revenue-cycle-management
Mobile and voice2
The fastest growing technology will enable patients to check wait times, pay bills, book appointments and
arrangement for transport. For staff, theit entire workflow could come from asking a question. Think for patients -
“Alexa…I hurt my arm” or for staff - “Hey Siri…what are the unpaid claims for today? ”.
Banking hits the healthcare beachfront3
Banking capabilities will help hospitals and providers automate tasks for patient financing, denial management
workflows, paper and electronic receivables, primarily claim payments from insurers, and identifying root causes
and accelerating revenue recoupment.
Healthcare catches up to technology1
AI, RPA, MLE will afford automation and streamlined workflows to repetitive tasks of payment review, invoicing,
payment, billing, and collections. A new competency around intelligently extracting data, analyzing that data with
context, and delivering actionable intelligence into the workflows to the providers’ staff will become norm.
Analysts will replace Billers and hospitals and payers may finally be on level ground.
Patient Access and acceleration of patient pay1
Transparency and personalized engagement plans will drive the patient to be more likely to pay, and they will
have a better experience with higher levels of satisfaction and loyalty to the provider
Where is RCM going?

THANK YOU!
Jonathan G. Wiik, MSHA, MBAPrincipal, Healthcare Strategy
TransUnion Healthcare
QUESTIONS