
Return Preparer Industry Analysis - Internal - IRS tax forms · requirements for registered tax...
28
1 The authors wish to acknowledge helpful comments and assistance from Ed Emblom, John Guyton, Janice Hedemann, Drew Johns, David Ludlum, Dayanand Manoli, Karen Masken, Esmeralda Stuk and the Compliance Data Warehouse group at IRS. 2 On Friday, Jan. 18, 2013, the United States District Court for the District of Columbia enjoined the Internal Revenue Service from enforcing the regulatory requirements for registered tax return preparers. In accordance with this order, tax return preparers covered by this program are not required to complete competency testing or secure continuing education. The ruling does not affect the regulatory practice requirements for CPAs, attorneys, enrolled agents, enrolled retirement plan agents or enrolled actuaries. 3 Analysis begins in processing year 2004 due to data processing issues prior to this period. PTINs consist of a leading ‘P’ followed by a numeric value. Prior to PY2004, PTINs were processed without modification and the leading ‘P’ resulted in some data loss. After PY2004, the leading character value was stored separately from the numeric portion enabling consistent identification of preparers. 4 Counts in the Appendix tables and throughout this report were generated using the prep_tin and prep_ein variables entered on the tax return which appear in the irtf_entity table in the Compliance Data Warehouse (CDW). These variables correspond to the PTIN and EIN fields on the tax forms. Included in the counts are the returns for which there was a PTIN present on the form, as well as the cases in which there was no PTIN present on the form, but for which there was an EIN. Most of the data rely on the individual return transaction file data housed in CDW. In addition, the PTIN database, which retains information from registrants, was matched onto the preparers identified in the CDW irtf_entity table. Return Preparer Industry Analysis 1 Patrick Langetieg, Mark Payne, and Melissa Vigil, Office of Research: Taxpayer Analysis & Modeling, Internal Revenue Service I n 2010, the IRS adopted regulations aimed at establishing standards among tax return preparers. e ob- jective was to improve voluntary compliance by supporting the paid preparer community and providing oversight of the industry with the goal of reducing errors on tax returns. By January 1, 2011, preparers were required to register with the IRS in order to receive a preparer tax identification number (PTIN) that is to be entered on the returns completed by the preparer. Preparers pay an annual fee for the PTIN. Additionally, those without professional credentials were required to fulfill new continuing education requirements and pass a new standardized test designed to ensure that minimum competencies or proficiencies are met. 2 Concurrently, larger preparers were statutorily required to electronically file the tax returns they prepared. IRS implementa- tion of the e-file mandate required preparers in processing year 2011 to electronically submit returns if they expected to prepare and file at least 100 returns. is threshold was lowered to 11 or more returns in processing year 2012. is report summarizes individual income tax preparer industry trends, trends in individual income tax return accuracy, and preliminary evidence regarding effects the preparer registration initiative may have had on these trends. Trends in the number of preparers from processing years 2004 3 through 2013 are examined based on in- formation provided on the individual income tax return. 4 e number of preparers in each processing year is determined by the count of unique identification numbers entered in the preparer identification field on the tax return. roughout this report we refer to preparers, but it is important to note that we are referring to the self-identification of said preparers who have signed an individual income tax return using either a PTIN, social security number (SSN), employer identification number (EIN), or some other number. Preparer tax identification numbers were first introduced in processing year 1999, but preparers may have entered a PTIN, an SSN, an EIN, or some other number in this field. Prior to the initiative, relatively few preparers obtained a PTIN, because there was no requirement to do so. To the extent that individual preparers may have used a PTIN for some returns and an SSN or EIN on other returns, the number of preparers will be overstated. It is also possible that non-professional individuals, assisting friends and family, sign the return and enter their SSN. Some preparers sign some returns using an SSN and others using a PTIN. is results in a count of iden- tifiers that exceeds the associated number of actual preparers. We were able to address this overstatement by finding all the identifiers a preparer used when preparing returns—both over time and across returns. We then developed a unique, consistent preparer identifier for tabulation and analysis. As shown in Figure 1, this adjustment reduces the count of preparers by about ninety thousand in processing year 2004. is difference narrows over time, particularly aſter the registration initiative, demonstrating that preparers are now more
Transcript of Return Preparer Industry Analysis - Internal - IRS tax forms · requirements for registered tax...

1 The authors wish to acknowledge helpful comments and assistance from Ed Emblom, John Guyton, Janice Hedemann, Drew Johns, David Ludlum, Dayanand Manoli, Karen Masken, Esmeralda Stuk and the Compliance Data Warehouse group at IRS.
2 On Friday, Jan. 18, 2013, the United States District Court for the District of Columbia enjoined the Internal Revenue Service from enforcing the regulatory requirements for registered tax return preparers. In accordance with this order, tax return preparers covered by this program are not required to complete competency testing or secure continuing education. The ruling does not affect the regulatory practice requirements for CPAs, attorneys, enrolled agents, enrolled retirement plan agents or enrolled actuaries.
3 Analysis begins in processing year 2004 due to data processing issues prior to this period. PTINs consist of a leading ‘P’ followed by a numeric value. Prior to PY2004, PTINs were processed without modifi cation and the leading ‘P’ resulted in some data loss. After PY2004, the leading character value was stored separately from the numeric portion enabling consistent identifi cation of preparers.
4 Counts in the Appendix tables and throughout this report were generated using the prep_tin and prep_ein variables entered on the tax return which appear in the irtf_entity table in the Compliance Data Warehouse (CDW). These variables correspond to the PTIN and EIN fi elds on the tax forms. Included in the counts are the returns for which there was a PTIN present on the form, as well as the cases in which there was no PTIN present on the form, but for which there was an EIN. Most of the data rely on the individual return transaction fi le data housed in CDW. In addition, the PTIN database, which retains information from registrants, was matched onto the preparers identifi ed in the CDW irtf_entity table.
Return Preparer Industry Analysis1
Patrick Langetieg, Mark Payne, and Melissa Vigil, Offi ce of Research: Taxpayer Analysis & Modeling, Internal Revenue Service
In 2010, the IRS adopted regulations aimed at establishing standards among tax return preparers. Th e ob-jective was to improve voluntary compliance by supporting the paid preparer community and providing oversight of the industry with the goal of reducing errors on tax returns. By January 1, 2011, preparers were
required to register with the IRS in order to receive a preparer tax identifi cation number (PTIN) that is to be entered on the returns completed by the preparer. Preparers pay an annual fee for the PTIN. Additionally, those without professional credentials were required to fulfi ll new continuing education requirements and pass a new standardized test designed to ensure that minimum competencies or profi ciencies are met.2 Concurrently, larger preparers were statutorily required to electronically fi le the tax returns they prepared. IRS implementa-tion of the e-fi le mandate required preparers in processing year 2011 to electronically submit returns if they expected to prepare and fi le at least 100 returns. Th is threshold was lowered to 11 or more returns in processing year 2012.
Th is report summarizes individual income tax preparer industry trends, trends in individual income tax return accuracy, and preliminary evidence regarding eff ects the preparer registration initiative may have had on these trends.
Trends in the number of preparers from processing years 2004 3 through 2013 are examined based on in-formation provided on the individual income tax return.4 Th e number of preparers in each processing year is determined by the count of unique identifi cation numbers entered in the preparer identifi cation fi eld on the tax return. Th roughout this report we refer to preparers, but it is important to note that we are referring to the self-identifi cation of said preparers who have signed an individual income tax return using either a PTIN, social security number (SSN), employer identifi cation number (EIN), or some other number.
Preparer tax identifi cation numbers were fi rst introduced in processing year 1999, but preparers may have entered a PTIN, an SSN, an EIN, or some other number in this fi eld. Prior to the initiative, relatively few preparers obtained a PTIN, because there was no requirement to do so. To the extent that individual preparers may have used a PTIN for some returns and an SSN or EIN on other returns, the number of preparers will be overstated. It is also possible that non-professional individuals, assisting friends and family, sign the return and enter their SSN.
Some preparers sign some returns using an SSN and others using a PTIN. Th is results in a count of iden-tifi ers that exceeds the associated number of actual preparers. We were able to address this overstatement by fi nding all the identifi ers a preparer used when preparing returns—both over time and across returns. We then developed a unique, consistent preparer identifi er for tabulation and analysis. As shown in Figure 1, this adjustment reduces the count of preparers by about ninety thousand in processing year 2004. Th is diff erence narrows over time, particularly aft er the registration initiative, demonstrating that preparers are now more

Langetieg, Payne, and Vigil18
consistently signing returns using their PTINs. Some redundant identifi cation persists with respect to prepar-ers identifi ed by EIN, as we are unable to unambiguously link an EIN to a single preparer. Th ese EIN-identifi ed preparers may already be represented on other returns by an SSN or PTIN. Th ey may also represent more than one actual preparer.
FIGURE 1. Comparison of the Number of Identifi able Preparers Before and After Adjusting for a Consistent Preparer Identifi er, Processing Years 2004–2013
Changes in return accuracy are measured based on errors for which the IRS systematically checks the en-tire individual taxpayer population. While this excludes many important types of errors, it allows an unbiased, albeit limited, measurement of certain aspects of return accuracy.
Th e intent of this analysis is to understand how the industry and preparers have changed over time and inform our understanding of how the industry and the taxpayer base continue to respond to changes in the regulation of preparers. It is also important to note that the counts in this report do not necessarily refl ect preparers who registered as part of the preparer initiative, except where noted.
Preparer and Prepared Return TrendsTh e number of preparers who prepared returns from processing years 2004 to 2013 is presented below in Table 1. In the years leading up to the initiative year, the number of preparers declined steadily from 1.23 million preparers in processing year 2004 to 0.98 million preparers in 2010. In 2011, the fi rst year of the initiative, the number of preparers declined by about 17 percent to 0.82 million preparers, and then by an additional 10 per-cent the second and third years of the initiative, to settle at 0.66 million preparers. As mentioned above, some of this decline can be explained by increased uniformity observed among preparers when signing tax returns, especially aft er adoption of the initiative. Another explanation may be that per the initiative, preparers who are supervised by a PTIN holder should not be signing tax returns, although they are required to obtain a PTIN. Instead, these preparers’ supervisors are required to sign the return.

Return Preparer Industry Analysis 19
TABLE 1. Preparers and Prepared Returns, Processing Years 2004–2013*
Processing Year
AllIndividual Returns
GrowthNumber ofPreparers (millions)
GrowthPrepared Returns
(millions)Growth
Average Returns
Prepared per Preparer
Growth
2004 131.3 1.23 78.62 64
2005 131.2 0.0% 1.17 -4.8% 78.35 -0.4% 67 4.6%
2006 132.4 0.9% 1.12 -4.3% 80.00 2.1% 71 6.7%
2007 133.8 1.1% 1.08 -3.5% 80.84 1.0% 75 4.7%
2008 140.5 5.0% 1.07 -1.2% 83.90 3.8% 79 5.1%
2009 139.5 -0.7% 1.04 -2.5% 82.16 -2.1% 79 0.4%
2010 137.6 -1.4% 0.98 -5.5% 80.51 -2.0% 82 3.7%
2011 140.0 1.8% 0.82 -16.9% 80.94 0.5% 99 21.0%
2012 142.4 1.7% 0.73 -10.1% 81.42 0.6% 111 11.9%
2013 141.7 -0.5% 0.66 -9.7% 80.99 -0.5% 122 10.2%* Source: RAS:R:TAM tabulations using the IRTF table from December 2013 CDW Excludes preparers that solely prepared SS/PR/NR/NR-EZ, stimulus, or TETR returns and no others. Data also exclude all volunteer preparers (e.g., VITA, TCE).
Th e decrease in the number of preparers does not appear, however, to have noticeably reduced the overall number of prepared returns. Ignoring processing year 2008, which had an unusually high number of prepared returns due to the large volume of stimulus claimant returns processed that year, the total number of prepared returns remained relatively constant between processing years 2007 and 2013. While the absolute number of prepared returns has remained constant, it has declined as a percent of overall returns.
A necessary correlate of these two trends is an increasing number of returns prepared per preparer. With the exception of processing year 2009, the average number of returns prepared per preparer consistently in-creased, as illustrated in Figure 2. In processing year 2011 the number increased to an average of 99 returns prepared per preparer compared to an average of 82 returns the previous year. In processing years 2012 and 2013, the average number increased further to an average of 111 and 122 returns per preparer, respectively.
FIGURE 2. Number of Prepared Returns and Number of Returns per Preparer,Processing Years 2004–2013
Langetieg, Payne, and Vigil20
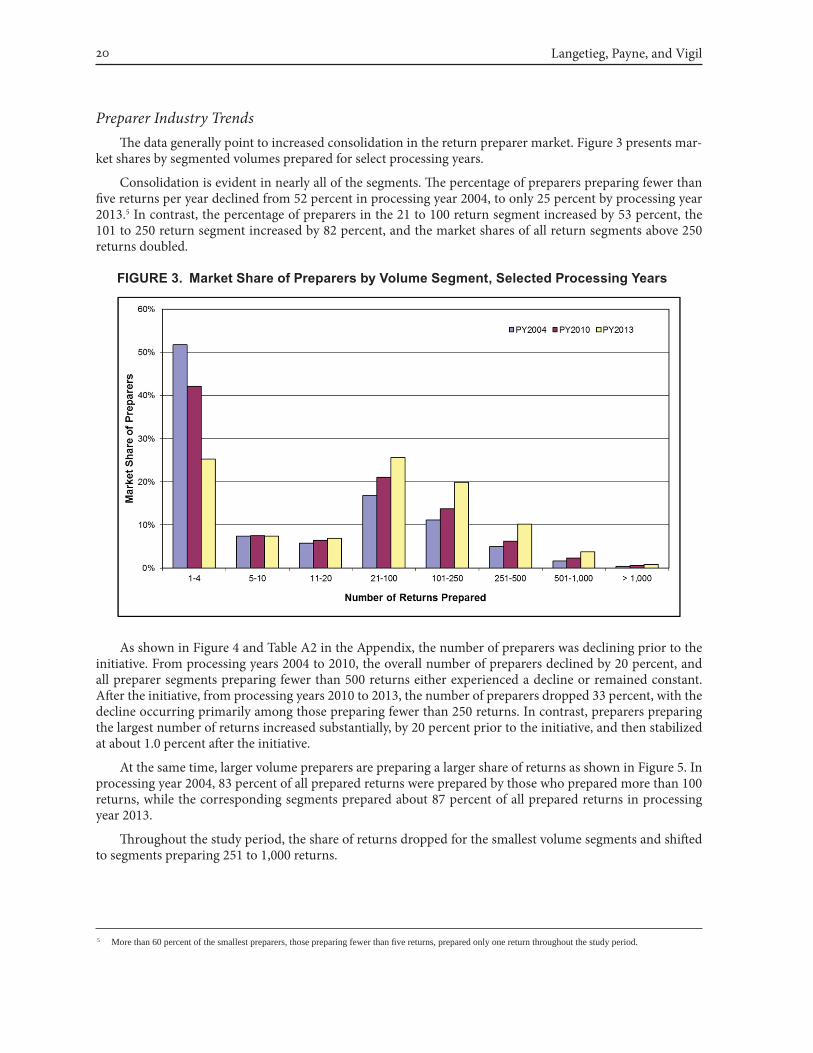
Preparer Industry TrendsTh e data generally point to increased consolidation in the return preparer market. Figure 3 presents mar-
ket shares by segmented volumes prepared for select processing years.
Consolidation is evident in nearly all of the segments. Th e percentage of preparers preparing fewer than fi ve returns per year declined from 52 percent in processing year 2004, to only 25 percent by processing year 2013.5 In contrast, the percentage of preparers in the 21 to 100 return segment increased by 53 percent, the 101 to 250 return segment increased by 82 percent, and the market shares of all return segments above 250 returns doubled.
FIGURE 3. Market Share of Preparers by Volume Segment, Selected Processing Years
As shown in Figure 4 and Table A2 in the Appendix, the number of preparers was declining prior to the initiative. From processing years 2004 to 2010, the overall number of preparers declined by 20 percent, and all preparer segments preparing fewer than 500 returns either experienced a decline or remained constant. Aft er the initiative, from processing years 2010 to 2013, the number of preparers dropped 33 percent, with the decline occurring primarily among those preparing fewer than 250 returns. In contrast, preparers preparing the largest number of returns increased substantially, by 20 percent prior to the initiative, and then stabilized at about 1.0 percent aft er the initiative.
At the same time, larger volume preparers are preparing a larger share of returns as shown in Figure 5. In processing year 2004, 83 percent of all prepared returns were prepared by those who prepared more than 100 returns, while the corresponding segments prepared about 87 percent of all prepared returns in processing year 2013.
Th roughout the study period, the share of returns dropped for the smallest volume segments and shift ed to segments preparing 251 to 1,000 returns.
5 More than 60 percent of the smallest preparers, those preparing fewer than fi ve returns, prepared only one return throughout the study period.

Return Preparer Industry Analysis 21
FIGURE 4. Percentage Change in the Number of Preparers by Volume Segment, Selected Ranges of Processing Years
FIGURE 5. Share of Returns Prepared by Preparer Segment, Selected Processing Years
Figure 6 and Appendix Table A2 present growth in the number of prepared returns by volume segment. Th e overall number of prepared returns increased modestly, by 2 percent between processing years 2004 and 2010, and increased by only 1 percent in the years following the initiative. Similar to the results presented in Figure 4, the number of prepared returns by the smaller segments declined substantially since processing year 2004 and growth was observed only among the largest segments. Th e exception is among the largest prepared volume segments, which contracted by 2 percent following the initiative.

Langetieg, Payne, and Vigil22
FIGURE 6. Percentage Change in the Number of Prepared Returns by Volume Segment, Selected Ranges of Processing Years
Preparer Industry DynamicsFigure 7 presents data on the dynamics of the return preparer industry. Th e data compare pairs of adjacent years. Included are preparers who did not prepare returns in the previous year, but did prepare in the current year (new preparers), preparers who prepared returns in both the previous and current years, and those who prepared the previous year but not the current year (prepared previous year, but not current year).
FIGURE 7. Preparer Status, Processing Years 2004–2013

Return Preparer Industry Analysis 23
A larger than normal attrition rate in processing year 2011, combined with fewer preparers entering the market, and a substantial decrease in the preparers who prepared both years, result in a smaller preparer market. Th e number of new preparers entering the market continued to decline in processing years 2012 and 2013. Furthermore, preparers who prepared both years declined by an average of 7 percent aft er processing year 2010, compared with an average of 2 percent before the initiative. However, the attrition rate among all preparers in processing years 2012 and 2013 was lower than all previous years. See Appendix Table A3 for ad-ditional data.
New preparers typically are not fully replacing those who stop preparing. Th is phenomenon was par-ticularly strong in processing year 2011, nearly tripling from the previous year, but moderating the following processing year. As Appendix Table A1 shows, most of this volatility is driven by preparers who prepare fewer than fi ve returns.
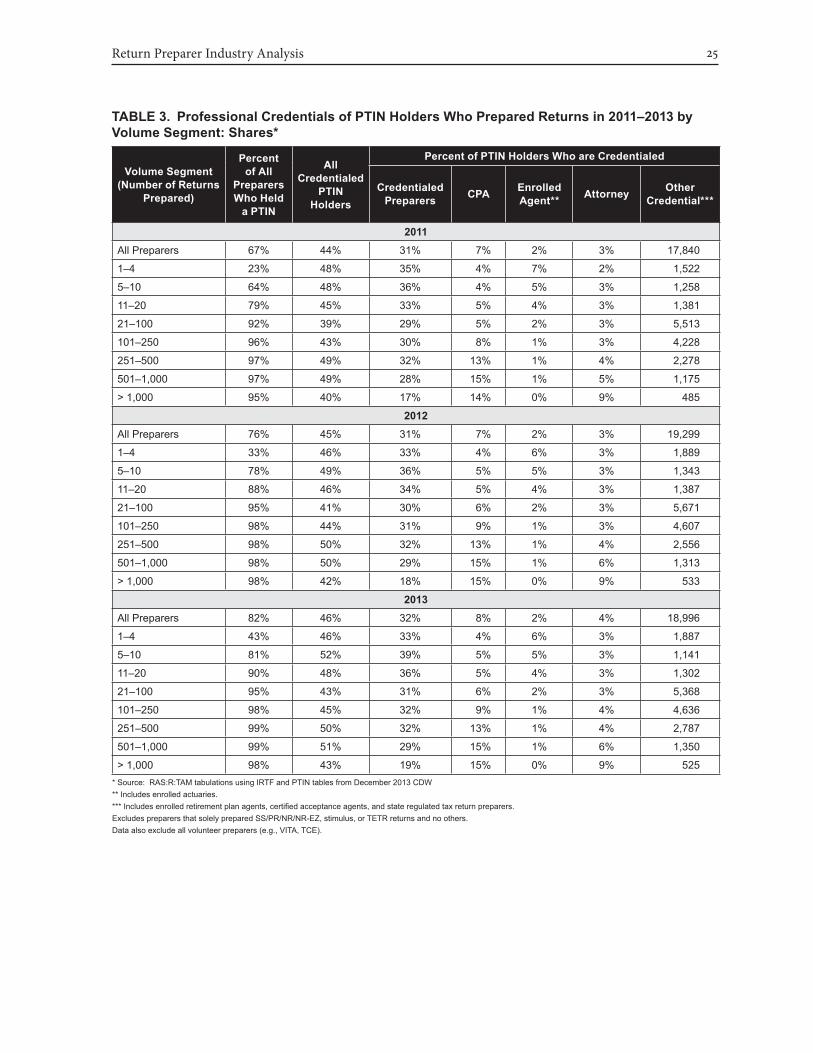
Characteristics of PTIN HoldersTh e data up to this point included all preparers, regardless of whether they held a PTIN or not. In this next section we look only at preparers who hold a PTIN and use it to sign returns they prepare. Table 2 and Table 3 present data on the professional credentials of PTIN holders by volume segment for processing years 2011 through 2013.
About 546,000 preparers who held a PTIN in processing year 2011 prepared individual income tax re-turns. Th is represents 67 percent of all preparers who prepared returns that year. Of those, about 238,000 self-reported credentials as CPAs, enrolled agents, or attorneys.6 Th is number represents 29 percent of all preparers who prepared returns in processing year 2011. Among credentialed PTIN holders, 31 percent self-reported they were CPAs, 7 percent enrolled agents, 2 percent attorneys and 3 percent other credentials. A relatively large share, 48 percent of PTIN holders who prepared fewer than fi ve returns, self-reported as credentialed. Most of these preparers are CPAs and attorneys. In contrast, a relatively larger share of enrolled agents pre-pared larger volumes of returns.
Th e number of preparers with a PTIN in processing year 2012 increased to about 556,000, or about 76 percent of all preparers who prepared returns in processing year 2012. Forty-fi ve percent of these preparers self-reported credentials, with similar composition among the types of credentials as in processing year 2011. Aggregate data for processing year 2013 remain relatively stable with continued increases in the percentage of preparers holding a PTIN and credentials, and similar composition among the types of credentials held.
Figure 8 compares the percent of preparers who held a PTIN by volume segment in processing years 2011 to 2013. Over 90 percent of those preparing more than 10 returns had registered by processing year 2013.
Trends in Return AccuracyTh e IRS regulates tax return preparers with the goal of supporting more accurate return preparation. Developing a strong baseline understanding of relationships between return accuracy and how returns are prepared can inform regulatory eff orts. Th e focus in this section is on errors for which the IRS systematically checks the entire individual taxpayer population. While this excludes many important types of errors, it allows a direct measurement of certain aspects of return accuracy. Th is section analyzes return accuracy by focusing on math errors 7 and potential AUR mismatches 8 for individual income tax returns by type of preparer, prepa-ration method, and submission method.
6 Many preparers hold more than one credential. For example, a preparer can both be a CPA and an attorney, CPA and enrolled agent, etc. These preparers were ranked to eliminate any overlap. They are ranked in the following order: CPA, enrolled agent, attorney, other credential.
7 Math errors refer to all types of errors that fall under the math error authority of Title 26 of the United States Code, as described in Section 6213(b). They include a variety of conditions such as computational errors, incorrectly transcribed values, and omitted entries identifi ed during the processing of tax returns.
8 AUR is an abbreviation for the IRS Automated Underreporter program, the automated analysis and processing of potential underreported or over-deducted issues identifi ed by matching tax returns against information returns provided by third parties. In the remainder of this report, the term “potential AUR mismatch” will be replaced by “AUR mismatch.” What is being referred to here is the fi nding in the AUR computer matching program of an inconsistency between a line on the return and the information documents reported to the IRS for that taxpayer. Among the potential mismatches that result from this process, a signifi cant number are false positives. Only about one quarter to one third of these potential mismatches are selected for review by the IRS and an even smaller proportion is sent a notice. Based on the IRS review, several hundred thousand are removed from the caseload (“screened out”) and some of those taxpayers receiving a notice adequately explain the inconsistency.

Langetieg, Payne, and Vigil24
TABLE 2. Professional Credentials of PTIN Holders Who Prepared Returns in 2011–2013,by Volume Segment: Levels*
Volume Segment(Number of Returns
Prepared)
Number of Preparers
PTIN Holders
Type of CredentialCredentialed
Preparers CPA Enrolled Agent** Attorney Other
Credential***2011
All Preparers 817,004 546,272 238,252 169,340 38,166 12,906 17,840
1–4 274,705 63,141 30,242 22,185 2,358 4,177 1,522
5–10 65,198 41,846 20,028 14,897 1,820 2,053 1,258
11–20 56,655 44,754 19,945 14,804 2,139 1,621 1,381
21–100 190,919 174,839 68,117 50,129 9,266 3,209 5,513
101–250 135,779 130,888 55,798 39,760 10,530 1,280 4,228
251–500 64,566 62,644 30,937 20,292 7,952 415 2,278
501–1,000 23,251 22,504 10,937 6,293 3,337 132 1,175
> 1,000 5,931 5,656 2,248 980 764 19 485
2012All Preparers 734,386 556,202 248,976 174,762 41,276 13,639 19,299
1–4 217,297 70,686 32,825 23,579 2,861 4,496 1,889
5–10 55,058 42,732 21,050 15,487 2,027 2,193 1,343
11–20 49,602 43,659 19,923 14,710 2,209 1,617 1,387
21–100 181,253 172,389 70,263 51,323 9,856 3,413 5,671
101–250 134,917 132,046 57,919 40,698 11,273 1,341 4,607
251–500 66,060 65,015 32,603 21,086 8,540 421 2,556
501–1,000 24,148 23,751 11,888 6,806 3,640 129 1,313
> 1,000 6,051 5,924 2,505 1,073 870 29 533
2013All Preparers 663,054 541,509 249,960 175,035 42,472 13,457 18,996
1–4 167,582 71,746 32,867 23,465 3,018 4,497 1,887
5–10 49,176 39,819 20,684 15,336 2,111 2,096 1,141
11–20 45,945 41,229 19,897 14,766 2,237 1,592 1,302
21–100 170,175 162,261 69,710 50,919 10,061 3,362 5,368
101–250 131,886 129,380 58,229 40,834 11,424 1,335 4,636
251–500 67,654 66,818 33,678 21,500 8,978 413 2,787
501–1,000 24,585 24,299 12,325 7,092 3,746 137 1,350
> 1,000 6,051 5,957 2,570 1,123 897 25 525 * Source: RAS:R:TAM tabulations using IRTF and PTIN tables from December 2013 CDW** Includes enrolled actuaries.*** Includes enrolled retirement plan agents, certifi ed acceptance agents, and state regulated tax return preparers.Excludes preparers that solely prepared SS/PR/NR/NR-EZ, stimulus, or TETR returns and no others.Data also exclude all volunteer preparers (e.g., VITA, TCE).
Return Preparer Industry Analysis 25
TABLE 3. Professional Credentials of PTIN Holders Who Prepared Returns in 2011–2013 by Volume Segment: Shares*
Volume Segment(Number of Returns
Prepared)
Percent of All
Preparers Who Held
a PTIN
AllCredentialed
PTIN Holders
Percent of PTIN Holders Who are Credentialed
Credentialed Preparers CPA Enrolled
Agent** Attorney Other Credential***
2011All Preparers 67% 44% 31% 7% 2% 3% 17,840
1–4 23% 48% 35% 4% 7% 2% 1,522
5–10 64% 48% 36% 4% 5% 3% 1,258
11–20 79% 45% 33% 5% 4% 3% 1,381
21–100 92% 39% 29% 5% 2% 3% 5,513
101–250 96% 43% 30% 8% 1% 3% 4,228
251–500 97% 49% 32% 13% 1% 4% 2,278
501–1,000 97% 49% 28% 15% 1% 5% 1,175
> 1,000 95% 40% 17% 14% 0% 9% 485
2012All Preparers 76% 45% 31% 7% 2% 3% 19,299
1–4 33% 46% 33% 4% 6% 3% 1,889
5–10 78% 49% 36% 5% 5% 3% 1,343
11–20 88% 46% 34% 5% 4% 3% 1,387
21–100 95% 41% 30% 6% 2% 3% 5,671
101–250 98% 44% 31% 9% 1% 3% 4,607
251–500 98% 50% 32% 13% 1% 4% 2,556
501–1,000 98% 50% 29% 15% 1% 6% 1,313
> 1,000 98% 42% 18% 15% 0% 9% 533
2013All Preparers 82% 46% 32% 8% 2% 4% 18,996
1–4 43% 46% 33% 4% 6% 3% 1,887
5–10 81% 52% 39% 5% 5% 3% 1,141
11–20 90% 48% 36% 5% 4% 3% 1,302
21–100 95% 43% 31% 6% 2% 3% 5,368
101–250 98% 45% 32% 9% 1% 4% 4,636
251–500 99% 50% 32% 13% 1% 4% 2,787
501–1,000 99% 51% 29% 15% 1% 6% 1,350
> 1,000 98% 43% 19% 15% 0% 9% 525 * Source: RAS:R:TAM tabulations using IRTF and PTIN tables from December 2013 CDW ** Includes enrolled actuaries.*** Includes enrolled retirement plan agents, certifi ed acceptance agents, and state regulated tax return preparers.Excludes preparers that solely prepared SS/PR/NR/NR-EZ, stimulus, or TETR returns and no others. Data also exclude all volunteer preparers (e.g., VITA, TCE).

Langetieg, Payne, and Vigil26
FIGURE 8. Percent of Preparers, by Volume Segment, and by Who Held a PTIN for Processing Years 2011 to 2013
Th e percentage of returns with a math error is substantially lower for returns prepared with tax prepara-tion soft ware and electronically fi led. Aft er controlling for use of soft ware and e-fi ling, the math error rate for returns prepared by PTIN holders is lower than the rate associated with returns prepared by preparers who do not hold a PTIN. Among e-fi led returns, preparers who self-report credentials have similar math error rates to those who do not; however, the math error rate for paper returns prepared by self-reported credentialed preparers is lower than the rate associated with non-PTIN holders and PTIN holders without credentials.
Th e percentage of returns that have at least one AUR mismatch is infl uenced more signifi cantly by return complexity 9 and the number of income and deduction items that can be matched to information returns than by preparation and submission method. But, the type of preparer appears to be a factor in AUR mismatch rates, which are lower for returns prepared by PTIN holders than for returns prepared by non-PTIN holders. AUR mismatches are also less common for preparers who prepare a relatively large number of returns.
Math ErrorsTh e analysis indicates that math errors are much more likely to occur on self-prepared paper returns than on self-prepared soft ware returns or paid-prepared returns. Th e error rate for self-prepared paper returns is 28 times greater than for paid-prepared returns and 21 times greater than for returns prepared by taxpayers using soft ware. Th e self-prepared paper returns’ math error rate is 37.0 percent while for paid-prepared returns it is 1.3 percent and for soft ware-prepared returns it is 1.8 percent.
9 In the more detailed tables provided on AUR mismatches in the Appendix, returns are classifi ed into three complexity categories—simple, intermediate, and complex—according to the defi nition in the Electronic Tax Administration IMF database. Simple returns are those without any schedules attached. Intermediate returns are Form 1040A returns with schedules or Form 1040 returns with Schedules A, B, D, Additional Child Tax Credit, Educational Credits, Child Care Credit, Credit for the Elderly, or Earned Income Tax Credit. Complex returns are Form 1040 returns with schedules C, E or F or other schedules.

Return Preparer Industry Analysis 27
As shown in Table 4, the comparatively low paid-prepared return math error rate appears to come in large part from the greater likelihood that such returns have been prepared with the use of soft ware and are submitted electronically. For example, returns prepared by hand by paid preparers have a math error rate of 18.0 percent. Th is rate drops to 5.5 percent when the paid preparer uses soft ware to prepare the return, but fi les the return by mail. It drops to 0.6 percent when the paid preparer uses soft ware and submits the return electronically. Soft ware helps taxpayers avoid math errors by ensuring that all of the computations are done correctly, line amounts from specifi c schedules are accurately transferred to the 1040 form, and by accurately determining eligibility for certain credits and deductions, given taxpayer inputs for income, fi ling status, fam-ily structure, etc. Electronic fi ling provides additional fi lters before returns are accepted, including ensuring that social security numbers and names are valid and entered accurately, that claimed dependents have not been previously claimed on another return, that all necessary schedules and forms are included with the re-turn, and that the return is signed.10
TABLE 4. Percentage of Returns with a Math Error by Preparation and Submission Method, Tax Year 2010
Submission MethodPreparation Method
Paid Preparer Self-Prepared TotalE-fi le 0.6 1.1 0.8
Software-Prepared Paper Return 5.5 5.3 5.4
Hand-Prepared Paper Return 18.0 37.0 35.5
Total 1.3 6.8 3.6Source: RAS:R:TAM. Analysis of data from CDW: IRTF through 3/2014.NOTE: 1040PR, 1040NR, 1040NR-EZ and 1040SS and returns prepared at VITA sites are excluded. Limited to returns fi led in 2011.
Similarly, when self-preparing taxpayers use soft ware but do not e-fi le, their error rate is 5.3 percent (com-pared to the 37.0 percent rate for paper returns self-prepared by hand) and falls to 1.1 percent when these returns are e-fi led.
Math error rates also diff er across types of preparers (Table 5). Returns prepared by preparers who hold a PTIN have fewer math errors than returns prepared by other preparers, even aft er considering their diff erent rates of using soft ware and e-fi ling their returns. While e-fi led, soft ware-prepared paper returns, and hand-prepared returns of PTIN holders have math error rates of 0.6 percent, 5.2 percent, and 15.1 percent, respec-tively, the error rates for other paid returns are 0.9 percent, 7.2 percent, and 26.1 percent.
TABLE 5. Percentage of Returns with a Math Error by Type of Preparer and Submission Method, Tax Year 2010
Submission MethodPreparer Type
PTIN Holders Non-PTIN HoldersE-fi le 0.6 0.9
Software-Prepared Paper Return 5.2 7.2
Hand-Prepared Paper Return 15.1 26.1
Total 1.2 4.1Source: RAS:R:TAM. Analysis of data from CDW: IRTF, IMF and Return Preparer Registration Database through 3/2014.NOTE: 1040PR, 1040NR, 1040NR-EZ and 1040SS and returns prepared at VITA sites are excluded. Limited to returns fi led in 2011. Preparers are considered as having a PTIN if it was obtained by the end of 2011.
10 To the extent that some returns rejected by the e-fi le fi lters may transfer to paper submission this would tend to lower the math error rate for e-fi ling and raise it for paper returns. For instance, in the case of divorced parents claiming the same dependents on separate returns, the fi rst return that is e-fi led would be accepted while the second return would be rejected. If the second fi ler then fi les on paper, this return would be subject to a math error even if this taxpayer is the primary provider for the children. A further risk with rejected returns is that the taxpayer may not fi le the return at all.
Langetieg, Payne, and Vigil28
Soft ware-prepared paper returns and hand-prepared returns prepared by self-reported, credentialed, PTIN holders have lower error rates than returns prepared by PTIN holders who do not self-report such cre-dentials and by non-PTIN holders. While 4.4 percent of the soft ware-prepared paper returns by credentialed preparers have math errors and 12.7 percent of their hand-prepared returns have math errors, these numbers are 6.1 percent and 19.4 percent respectively for non-credentialed preparers. On the other hand, e-fi led returns prepared by such credentialed preparers have a slightly higher math error rate (0.7 percent) than the rest of the e-fi led paid-prepared returns (0.6 percent) (see Appendix: Table A7).
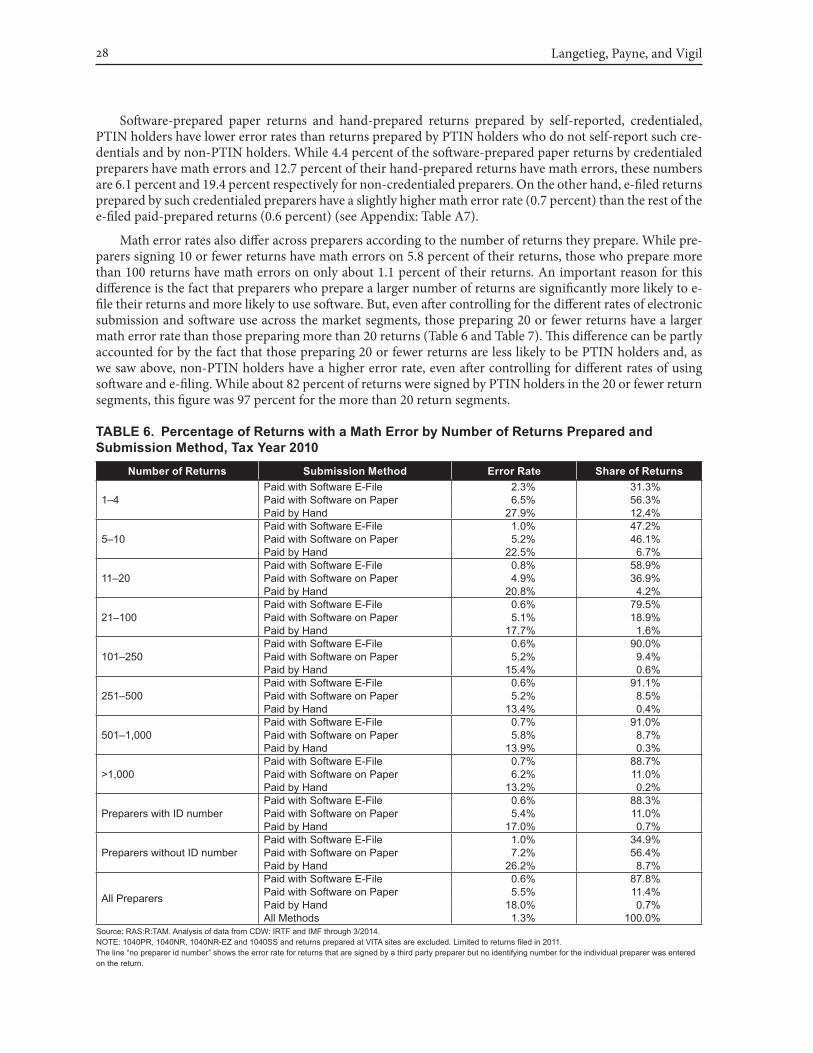
Math error rates also diff er across preparers according to the number of returns they prepare. While pre-parers signing 10 or fewer returns have math errors on 5.8 percent of their returns, those who prepare more than 100 returns have math errors on only about 1.1 percent of their returns. An important reason for this diff erence is the fact that preparers who prepare a larger number of returns are signifi cantly more likely to e-fi le their returns and more likely to use soft ware. But, even aft er controlling for the diff erent rates of electronic submission and soft ware use across the market segments, those preparing 20 or fewer returns have a larger math error rate than those preparing more than 20 returns (Table 6 and Table 7). Th is diff erence can be partly accounted for by the fact that those preparing 20 or fewer returns are less likely to be PTIN holders and, as we saw above, non-PTIN holders have a higher error rate, even aft er controlling for diff erent rates of using soft ware and e-fi ling. While about 82 percent of returns were signed by PTIN holders in the 20 or fewer return segments, this fi gure was 97 percent for the more than 20 return segments.
TABLE 6. Percentage of Returns with a Math Error by Number of Returns Prepared and Submission Method, Tax Year 2010
Number of Returns Submission Method Error Rate Share of Returns
1–4Paid with Software E-File 2.3% 31.3%Paid with Software on Paper 6.5% 56.3%Paid by Hand 27.9% 12.4%
5–10Paid with Software E-File 1.0% 47.2%Paid with Software on Paper 5.2% 46.1%Paid by Hand 22.5% 6.7%
11–20Paid with Software E-File 0.8% 58.9%Paid with Software on Paper 4.9% 36.9%Paid by Hand 20.8% 4.2%
21–100Paid with Software E-File 0.6% 79.5%Paid with Software on Paper 5.1% 18.9%Paid by Hand 17.7% 1.6%
101–250Paid with Software E-File 0.6% 90.0%Paid with Software on Paper 5.2% 9.4%Paid by Hand 15.4% 0.6%
251–500Paid with Software E-File 0.6% 91.1%Paid with Software on Paper 5.2% 8.5%Paid by Hand 13.4% 0.4%
501–1,000Paid with Software E-File 0.7% 91.0%Paid with Software on Paper 5.8% 8.7%Paid by Hand 13.9% 0.3%
>1,000Paid with Software E-File 0.7% 88.7%Paid with Software on Paper 6.2% 11.0%Paid by Hand 13.2% 0.2%
Preparers with ID numberPaid with Software E-File 0.6% 88.3%Paid with Software on Paper 5.4% 11.0%Paid by Hand 17.0% 0.7%
Preparers without ID numberPaid with Software E-File 1.0% 34.9%Paid with Software on Paper 7.2% 56.4%Paid by Hand 26.2% 8.7%
All Preparers
Paid with Software E-File 0.6% 87.8%Paid with Software on Paper 5.5% 11.4%Paid by Hand 18.0% 0.7%All Methods 1.3% 100.0%
Source: RAS:R:TAM. Analysis of data from CDW: IRTF and IMF through 3/2014.NOTE: 1040PR, 1040NR, 1040NR-EZ and 1040SS and returns prepared at VITA sites are excluded. Limited to returns fi led in 2011.The line “no preparer id number” shows the error rate for returns that are signed by a third party preparer but no identifying number for the individual preparer was entered on the return.

Return Preparer Industry Analysis 29
TABLE 7. Percentage of Returns with a Math Error by Number of Returns Prepared and Preparer Type, Tax Year 2010
Number of Returns Preparer Type Error Rate Share of Returns
1–4 PTIN Holder 4.8% 50.2%No PTIN 10.9% 49.8%
5–10 PTIN Holder 3.6% 85.1%No PTIN 8.8% 14.9%
11–20 PTIN Holder 2.7% 90.3%No PTIN 7.2% 9.7%
21-100 PTIN Holder 1.6% 95.4%No PTIN 4.5% 4.6%
101–250 PTIN Holder 1.1% 97.3%No PTIN 2.8% 2.7%
251–500 PTIN Holder 1.0% 97.5%No PTIN 2.2% 2.5%
501–1,000 PTIN Holder 1.1% 97.2%No PTIN 2.1% 2.8%
>1,000 PTIN Holder 1.4% 96.2%No PTIN 1.8% 3.8%
Total
PTIN Holder 1.2% 96.7%No PTIN 3.4% 3.3%No preparer ID number 6.7% 0.0%All Preparers 1.3% 0.0%
Source: RAS:R:TAM. Analysis of data from CDW: IRTF and IMF through 3/2014.NOTE: 1040PR, 1040NR, 1040NR-EZ and 1040SS and returns prepared at VITA sites are excluded. Limited to returns fi led in 2011. Preparers are considered as having a PTIN if it was obtained by the end of 2011. The line “no preparer id number” shows the error rate for returns that are signed by a third party preparer but no identifying number for the individual preparer was entered on the return.
Th e long-term trends in tax return preparation and submission methods, including the increased use of soft ware, increases in e-fi ling rates, and decreases in the number of returns prepared by preparers who prepare relatively few returns, have all contributed to reducing the rate of math errors (see Figure 9). In the period prior to tax year 2010, the main forces driving these preparation and submission trends were technological and fi nancial in nature, including better and less expensive soft ware, increased computer and internet access and literacy among taxpayers and preparers, and the fact that e-fi led returns generate faster refunds and facilitated a variety of associated fi nancial products. Th ese trends by themselves reduced the rate of math errors from 4.6 percent in tax year 2000 to 1.9 percent in tax year 2009.11 But, in tax years 2010 and 2011, two IRS administra-tive actions—the e-fi le mandate and the return preparer initiative—accelerated these trends in tax preparation and submission methods. Th e combined eff ect of the prevailing trends and these initiatives further reduced the overall rate of math errors to 1.3 percent in tax year 2011. Th e math error rate for paid prepared returns fell from 0.7 percent in tax year 2009 to 0.5 percent in tax year 2011.
IRS implementation of the e-fi le mandate required preparers in processing year 2011 to electronically sub-mit returns if they expected to prepare and fi le at least 100 returns. Th is threshold was lowered to 11 or more returns in processing year 2012. At the same time, starting at the beginning of 2011, preparers of individual tax returns were required under the return preparer initiative to obtain and use a PTIN on the returns they prepare. Th ese new regulations increased the rate of e-fi ling for paid-prepared returns and accelerated the pre-existing trend increasing the share of returns prepared by larger volume preparers.
11 In developing the math error rate estimates for each year, math errors associated with temporary or one-year tax credits, including the Rate Reduction Credit (2001), Recovery Rebate Credit (2008), Making Work Pay Credit (2008), and the First-Time Homebuyer Credit (2009 and 2010) are excluded. Tax year 2003 is omitted because of the diffi culty of distinguishing errors related to recurring and non-recurring tax law changes involving the Child Tax Credit. The spike in tax year 2003 is due to an increase in errors related to the Child Tax Credit because of provisions in the Jobs and Growth Tax Relief Reconciliation Act of 2003, which raised the maximum credit per child to $1,000 and also provided that eligible taxpayers who claimed children on their 2002 return would receive advance payments in 2003 of up to $400 per child.

Langetieg, Payne, and Vigil30
Compared to the existing trend, we estimate that about 6 million additional returns were e-fi led in tax year 2010 and about 7 million additional returns were e-fi led in tax year 2011 (Figure 10).12 As a consequence of this higher rate of e-fi ling for paid prepared returns, we estimate that the number of returns with math errors was reduced by about 300,000 in tax year 2010 and about 220,000 in tax year 2011.
We also estimate that preparers preparing fewer than 100 returns prepared about 1.4 percent (1.1 million) fewer returns in tax year 2010, and 1.9 percent (1.5 million) fewer returns in tax year 2011, than would have been the case without these initiatives (Figure 11). We estimate that this acceleration in the rate of transfer of returns from smaller to larger volume preparers reduced the number of math errors by about 60,000 in tax year 2010 and 30,000 in tax year 2011.
FIGURE 9. Math Error Rate for Returns With and Without Paid Preparers (ExcludingYear-Specifi c Errors), Tax Years 2000–2011
NOTE: Math errors related to non-recurring credits, including the Rate Reduction Credit (2001), Recovery Rebate Credit (2008), Making Work Pay Credit (2009 and 2010), and the First Time Homebuyer Credit (2009 to 2011) are excluded. 2003 is omitted because of the diffi culty of distinguishing errors related to recur-ring and non-recurring tax law changes involving the child tax credit.
12 Tax year 2007 was excluded in generating the predicted trend line for e-fi le rates by volume segment and for the share of returns prepared by each volume segment because of the distorting infl uence of economic stimulus fi lings for that year.

Return Preparer Industry Analysis 31
FIGURE 10. Actual and Predicted Rates of E-Filing by Number of Returns Prepared, Tax Years 2003–2011
NOTE: Tax year 2007 was excluded in generating the predicted trend lines because of the distorting infl uence of economic stimulus fi lings in that year.
AUR MismatchesAUR mismatch rates are more closely related to return complexity and the number of income and deduction items on the tax return that can be matched against information returns, than they are to preparation or sub-mission method. For instance, just 8.5 percent of all returns with two or fewer matchable items have at least one AUR mismatch, while 23.8 percent of those with six or more matchable items do.13 Th e weaker infl uence of preparation method on AUR mismatches is understandable, given that avoiding a mismatch depends on taxpayers receiving, securely storing, retrieving, and accurately reporting all of the relevant information pro-vided on information returns—regardless of preparation method. Soft ware and third-party preparation can help mitigate such errors by, for example, providing reminders from the previous year’s return about items that may need to be reported, and by permitting the electronic uploading of information from fi nancial institutions and employers. Despite the benefi ts of soft ware and preparer assistance, however, avoiding AUR mismatches depends importantly on the taxpayer.
For all types of returns, paid-prepared returns have lower AUR mismatch rates than those self-prepared using tax preparation soft ware. In addition, paid-prepared returns have fewer mismatches than returns self-prepared by hand for returns with three or more income or deduction items that can be matched. But returns self-prepared by hand have slightly fewer mismatches when just two or fewer items can be matched (see Ap-pendix: Table A10).
13 The rates reported here are the percent of returns with potential mismatches resulting from the computerized matching of information reported on tax returns with that reported by third parties on information returns (Forms 1099, 1098, W-2, etc.) Mismatches related to education credits are excluded since a large share of them are false positives and do not enter the potential work stream of the AUR program.

Langetieg, Payne, and Vigil32
For paid-prepared returns, AUR mismatch rates are lower for PTIN holders than non-PTIN holders when all returns are considered and when they are broken out by the number of matched items on the return. Th e comparison between PTIN holders and non-PTIN holders is similar when one controls for income or return complexity rather than AUR items. Th e overall percentage of returns with mismatches is greater for self-reported credentialed PTIN holders than non-credentialed PTIN holders and non-PTIN holding preparers. Controlling for the number of potential AUR mismatch items shows a lower mismatch rate for credentialed preparers only in the case of returns with two or fewer AUR items but not in the case of returns with three or more AUR items. Credentialed preparers have lower mismatch rates for lower and middle levels of income and lower levels of complexity but higher mismatch rates for the higher level of income and the middle and higher levels of complexity (Appendix: Table A10).
AUR mismatches are less likely for preparers who prepare a larger number of returns, even when one controls for the diff erent shares of preparers who are PTIN holders across the volume segments. While 17.3 percent of returns of those preparing 4 or fewer returns have mismatches, this rate diminishes to less than 13 percent for those preparing more than 500 returns (Appendix: Table A12). But, at each level of preparer activity, and regardless of the number of matchable items, the returns of PTIN holders are less prone to AUR mismatches than preparers who do not hold a PTIN (Table 8). We estimate that the acceleration in the trend in return preparation towards larger volume preparers that followed the adoption of the e-fi le mandate and the return preparer initiative reduced the number of returns with AUR mismatches by approximately 15,000 in each of tax years 2010 and 2011. Nonetheless, these numbers represent a very small fraction (less than 0.08 percent) of all mismatches in those years.
TABLE 8. Percentage of Returns with AUR Mismatches by Number of Returns Prepared, Preparer Type and Number of AUR Items, Tax Year 2010
Number of Returns Preparer Type*
Number of AUR Items**2 or fewer items 3 to 5 items 6 or more items Overall
1–4PTIN Holder 9.16 16.07 26.96 16.64
No PTIN 9.00 18.38 30.31 18.04
5–10PTIN Holder 8.90 15.19 26.79 15.92
No PTIN 9.15 16.75 28.20 15.99
11–20PTIN Holder 8.77 14.99 26.23 15.35
No PTIN 9.27 16.81 28.16 15.71
21–100PTIN Holder 8.74 14.16 25.28 14.46
No PTIN 9.21 16.37 27.18 15.17
101–250PTIN Holder 8.32 13.36 23.32 13.85
No PTIN 8.71 15.38 25.29 14.41
251–500PTIN Holder 7.60 12.91 21.77 13.35
No PTIN 8.32 14.65 23.58 13.80
501–1,000PTIN Holder 7.13 12.84 20.96 12.81
No PTIN 9.68 14.95 23.19 14.31
>1,000PTIN Holder 7.11 13.23 21.26 12.17
No PTIN 12.22 15.04 23.21 14.82
Total
PTIN Holder 7.84 13.24 22.52 13.44
No PTIN 9.39 15.52 25.16 14.70
No preparer ID number*** 9.51 16.77 27.78 15.65
All Preparers 7.91 13.35 22.62 13.50Source: RAS:R:TAM. Analysis of data from CDW: IRTF, CDW: AUR and CDW: Return Preparer Registration Database through 3/2014. NOTE: 1040PR, 1040NR, 1040NR-EZ and 1040SS and returns prepared at VITA sites are excluded. Limited to returns fi led in 2011.*Preparers are considered as having a PTIN if it was obtained by the end of 2011. Mismatches related to education credits are excluded.**AUR Items classifi es returns according to the number of income or deduction items on the return subject to the AUR matching process. ***The line “no preparer id number” shows the error rate for returns that are signed. by a third party preparer but no identifying number for the individual preparer was entered on the return.

Return Preparer Industry Analysis 33
APPENDIX
Proc
essi
ng
Year
Tot
al P
repa
rers
Pr
epar
ed P
revi
ous
Year
&
Cur
rent
Yea
rN
ew P
repa
rers
Prep
ared
Pre
viou
s Ye
ar, B
ut N
ot C
urre
nt Y
ear
Tota
l Ret
urns
Pre
pare
d
Num
ber
Gro
wth
R
ate
Num
ber
Gro
wth
R
ate
Shar
e:C
urre
nt
Year
Num
ber
Gro
wth
R
ate
Shar
e:
Cur
rent
Ye
arN
umbe
rG
row
th
Rat
e
Shar
e:
Prev
ious
Year
A
ttri
tion
Net
In
crea
se/
Dec
reas
eN
umbe
rSh
are
of A
ll R
etur
ns
Ret
urns
pe
r Pr
epar
er
All
Prep
arer
s
2004
1,22
9,25
978
,624
,459
100%
64
2005
1,17
0,75
4-5
%71
7,45
761
%45
7,54
639
%51
6,15
742
%-5
8,61
178
,347
,514
100%
67
2006
1,11
9,95
9-4
%70
2,82
1-2
%63
%42
1,20
7-8
%38
%47
2,18
2-9
%40
%-5
0,97
580
,002
,267
100%
71
2007
1,08
0,74
8-4
%69
3,25
0-1
%64
%39
8,46
7-5
%37
%43
0,77
8-9
%38
%-3
2,31
180
,841
,652
100%
75
2008
1,06
7,26
8-1
%68
6,98
3-1
%64
%45
7,32
315
%43
%40
4,73
4-6
%37
%52
,589
83,9
01,6
8410
0%79
2009
1,04
0,91
9-2
%67
6,23
4-2
%65
%36
9,35
5-1
9%35
%46
8,07
216
%44
%-9
8,71
782
,155
,100
100%
79
2010
983,
219
-6%
657,
735
-3%
67%
329,
504
-11%
34%
387,
854
-17%
37%
-58,
350
80,5
08,1
5410
0%82
2011
817,
004
-17%
571,
414
-13%
70%
249,
117
-24%
30%
415,
825
7%42
%-1
66,7
0880
,943
,432
100%
99
2012
734,
386
-10%
551,
476
-3%
75%
185,
980
-25%
25%
269,
055
-35%
33%
-83,
075
81,4
24,4
5010
0%11
1
2013
663,
054
-10%
521,
119
-6%
79%
144,
771
-22%
22%
216,
337
-20%
29%
-71,
566
80,9
88,7
0310
0%12
2
Prep
ared
1–4
retu
rns
2004
635,
968
902,
604
1% 1
2005
581,
420
-9%
215,
996
37%
365,
424
63%
444,
137
70%
-78,
713
834,
599
1% 1
2006
534,
080
-8%
200,
880
-7%
38%
333,
200
-9%
62%
401,
974
-9%
69%
-68,
774
771,
558
1% 1
2007
494,
953
-7%
190,
934
-5%
39%
304,
019
-9%
61%
363,
376
-10%
68%
-59,
357
718,
823
1% 1
2008
478,
838
-3%
181,
281
-5%
38%
297,
557
-2%
62%
335,
819
-8%
68%
-38,
262
694,
066
1% 1
2009
452,
023
-6%
174,
267
-4%
39%
277,
756
-7%
61%
395,
717
18%
83%
-117
,961
656,
514
1% 1
2010
414,
238
-8%
161,
599
-7%
39%
252,
639
-9%
61%
312,
683
-21%
69%
-60,
044
605,
890
1% 1
2011
274,
705
-34%
117,
115
-28%
43%
157,
590
-38%
57%
322,
575
3%78
%-1
64,9
8543
3,83
61%
2
2012
217,
297
-21%
97,0
48-1
7%45
%12
0,24
9-2
4%55
%19
9,02
8-3
8%72
%-7
8,77
934
5,05
50%
2
2013
167,
582
-23%
80,0
26-1
8%48
%87
,556
-27%
52%
152,
379
-23%
70%
-64,
823
273,
146
0% 2
Prep
ared
5–1
0 re
turn
s20
0491
,030
642,
086
1% 7
2005
88,0
41-3
%72
,263
82%
15,7
7818
%17
,454
19%
-1,6
7662
1,99
11%
7
2006
84,3
27-4
%69
,481
-4%
82%
14,8
46-6
%18
%16
,853
-3%
19%
-2,0
0759
5,63
11%
7
2007
81,5
19-3
%66
,922
-4%
82%
14,5
97-2
%18
%15
,955
-5%
19%
-1,3
5857
6,86
61%
7
2008
78,8
38-3
%64
,077
-4%
81%
14,7
611%
19%
15,8
21-1
%19
%-1
,060
558,
737
1% 7
2009
77,7
64-1
%62
,040
-3%
80%
15,7
247%
20%
16,9
657%
22%
-1,2
4155
2,80
31%
7
2010
73,7
83-5
%58
,807
-5%
80%
14,9
76-5
%20
%17
,503
3%23
%-2
,527
524,
693
1% 7
2011
65,1
98-1
2%49
,267
-16%
76%
15,9
316%
24%
25,1
8144
%34
%-9
,250
463,
548
1% 7
2012
55,0
58-1
6%43
,758
-11%
79%
11,3
00-2
9%21
%19
,465
-23%
30%
-8,1
6539
4,02
80%
7
2013
49,1
76-1
1%38
,839
-11%
79%
10,3
37-9
%21
%14
,333
-26%
26%
-3,9
9635
2,57
90%
7
* S
ourc
e: R
AS
:R:T
AM
tabu
latio
ns u
sing
the
IRTF
tabl
e fro
m D
ecem
ber 2
013
CD
WE
xclu
des
prep
arer
s th
at s
olel
y pr
epar
ed S
S/P
R/N
R/N
R-E
Z, s
timul
us, o
r TE
TR re
turn
s an
d no
oth
ers.
D
ata
also
exc
lude
all
volu
ntee
r pre
pare
rs (e
.g.,
VIT
A, T
CE
).
TAB
LE A
1. P
repa
rers
and
Pre
pare
d R
etur
ns, P
roce
ssin
g Ye
ars
2004
–201
3*
100%100%100%
Langetieg, Payne, and Vigil34
Proc
essi
ng
Year
Tot
al P
repa
rers
Pr
epar
ed P
revi
ous
Year
&
Cur
rent
Yea
rN
ew P
repa
rers
Prep
ared
Pre
viou
s Ye
ar, B
ut N
ot C
urre
nt Y
ear
Tota
l Ret
urns
Pre
pare
d
Num
ber
Gro
wth
R
ate
Num
ber
Gro
wth
R
ate
Shar
e:C
urre
nt
Year
Num
ber
Gro
wth
R
ate
Shar
e:
Cur
rent
Ye
arN
umbe
rG
row
th
Rat
e
Shar
e:
Prev
ious
Year
A
ttri
tion
Net
In
crea
se/
Dec
reas
eN
umbe
rSh
are
of A
ll R
etur
ns
Ret
urns
pe
r Pr
epar
er
Prep
ared
11-
20 re
turn
s
2004
71,0
511,
065,
011
1%15
2005
69,7
45-2
%57
,265
82%
12,4
8018
%11
,537
16%
943
1,04
6,94
41%
15
2006
67,5
28-3
%55
,692
-3%
82%
11,8
36-5
%18
%11
,514
0%17
%32
21,
014,
301
1%15
2007
66,4
58-2
%54
,255
-3%
82%
12,2
033%
18%
10,8
67-6
%16
%1,
336
998,
581
1%15
2008
66,2
620%
53,4
52-1
%81
%12
,810
5%19
%11
,480
6%17
%1,
330
997,
053
1%15
2009
66,6
511%
52,5
83-2
%79
%14
,068
10%
21%
12,2
697%
19%
1,79
91,
004,
138
1%15
2010
63,6
45-5
%51
,201
-3%
80%
12,4
44-1
2%20
%13
,623
11%
20%
-1,1
7995
8,73
21%
15
2011
56,6
55-1
1%43
,866
-14%
77%
12,7
893%
23%
17,2
2226
%27
%-4
,433
854,
249
1%15
2012
49,6
02-1
2%39
,948
-9%
81%
9,65
4-2
5%19
%12
,374
-28%
22%
-2,7
2074
9,47
51%
15
2013
45,9
45-7
%37
,511
-6%
82%
8,43
4-1
3%18
%10
,473
-15%
21%
-2,0
3969
4,24
51%
15
Prep
ared
21–
100
retu
rns
2004
206,
095
10,8
95,8
4814
%53
2005
206,
993
0%16
4,28
379
%42
,710
21%
32,2
7116
%10
,439
10,9
56,9
0514
%53
2006
206,
052
0%16
5,30
31%
80%
40,7
49-5
%20
%32
,166
0%16
%8,
583
10,9
62,2
0814
%53
2007
209,
246
2%16
6,83
11%
80%
42,4
154%
20%
30,9
72-4
%15
%11
,443
11,1
20,7
8914
%53
2008
209,
512
0%16
6,54
60%
79%
42,9
661%
21%
32,1
264%
15%
10,8
4011
,156
,238
13%
53
2009
215,
749
3%17
1,45
63%
79%
44,2
933%
21%
33,4
534%
16%
10,8
4011
,440
,877
14%
53
2010
206,
862
-4%
171,
372
0%83
%35
,490
-20%
17%
35,5
626%
16%
-72
10,9
81,8
6814
%53
2011
190,
919
-8%
152,
328
-11%
80%
38,5
919%
20%
39,6
8112
%19
%-1
,090
10,2
55,7
7013
%54
2012
181,
253
-5%
150,
970
-1%
83%
30,2
83-2
2%17
%29
,214
-26%
15%
1,06
99,
847,
157
12%
54
2013
170,
175
-6%
144,
723
-4%
85%
25,4
52-1
6%15
%29
,116
0%16
%-3
,664
9,25
4,16
011
%54
Prep
ared
101
–250
retu
rns
2004
137,
571
22,2
23,7
2228
%16
2
2005
137,
564
0%12
2,02
089
%15
,544
11%
9,51
57%
6,02
922
,204
,215
28%
161
2006
138,
776
1%12
3,65
31%
89%
15,1
23-3
%11
%8,
760
-8%
6%6,
363
22,4
35,7
2328
%16
2
2007
138,
555
0%12
3,88
30%
89%
14,6
72-3
%11
%8,
612
-2%
6%6,
060
22,3
74,0
1828
%16
1
2008
139,
249
1%12
4,82
91%
90%
14,4
20-2
%10
%8,
459
-2%
6%5,
961
22,5
14,0
7927
%16
2
2009
137,
786
-1%
125,
735
1%91
%12
,051
-16%
9%8,
471
0%6%
3,58
022
,177
,188
27%
161
2010
134,
678
-2%
125,
537
0%93
%9,
141
-24%
7%7,
584
-10%
6%1,
557
21,7
43,4
9827
%16
1
2011
135,
779
1%12
0,52
8-4
%89
%15
,251
67%
11%
9,62
327
%7%
5,62
822
,024
,495
27%
162
2012
134,
917
-1%
124,
784
4%92
%10
,133
-34%
8%7,
833
-19%
6%2,
300
21,9
27,3
8227
%16
3
2013
131,
886
-2%
122,
948
-1%
93%
8,93
8-1
2%7%
8,66
111
%6%
277
21,5
27,7
0427
%16
3
* S
ourc
e: R
AS
:R:T
AM
tabu
latio
ns u
sing
the
IRTF
tabl
e fro
m D
ecem
ber 2
013
CD
WE
xclu
des
prep
arer
s th
at s
olel
y pr
epar
ed S
S/P
R/N
R/N
R-E
Z, s
timul
us, o
r TE
TR re
turn
s an
d no
oth
ers.
D
ata
also
exc
lude
all
volu
ntee
r pre
pare
rs (e
.g.,
VIT
A, T
CE
).
TAB
LE A
1. P
repa
rers
and
Pre
pare
d R
etur
ns, P
roce
ssin
g Ye
ars
2004
–201
3*—
Con
tinue
d
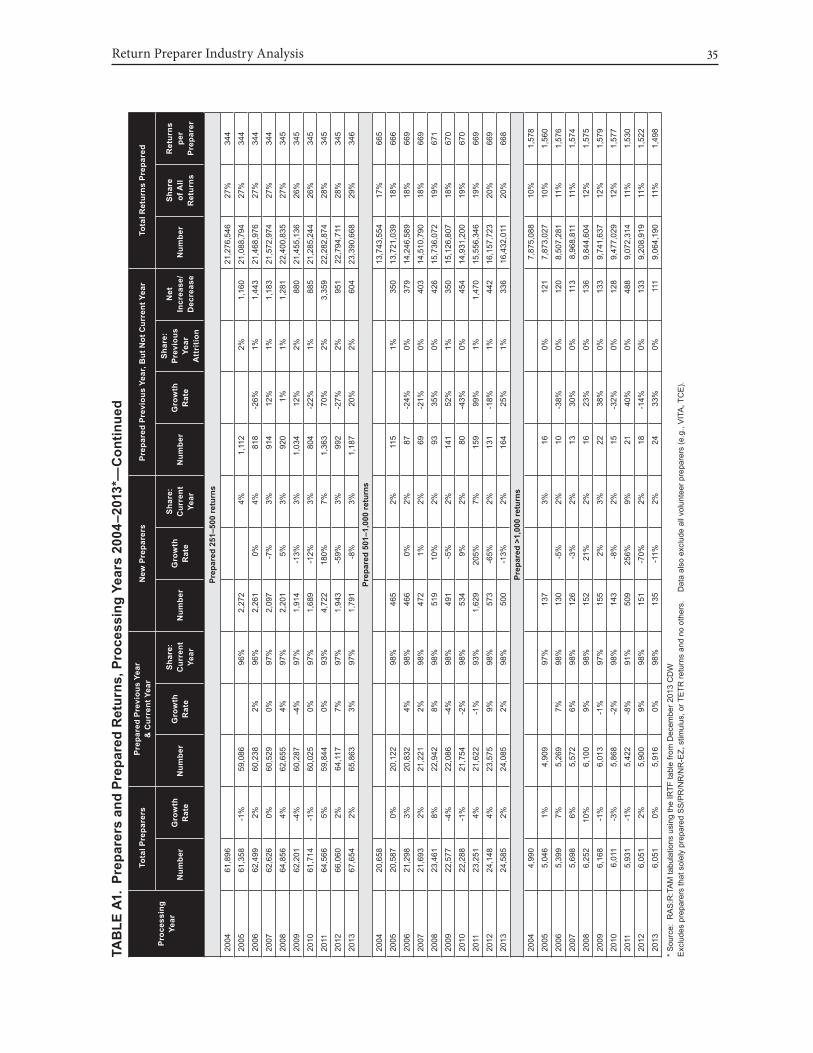
Return Preparer Industry Analysis 35
Proc
essi
ng
Year
Tot
al P
repa
rers
Pr
epar
ed P
revi
ous
Year
&
Cur
rent
Yea
rN
ew P
repa
rers
Prep
ared
Pre
viou
s Ye
ar, B
ut N
ot C
urre
nt Y
ear
Tota
l Ret
urns
Pre
pare
d
Num
ber
Gro
wth
R
ate
Num
ber
Gro
wth
R
ate
Shar
e:C
urre
nt
Year
Num
ber
Gro
wth
R
ate
Shar
e:
Cur
rent
Ye
arN
umbe
rG
row
th
Rat
e
Shar
e:
Prev
ious
Year
A
ttri
tion
Net
In
crea
se/
Dec
reas
eN
umbe
rSh
are
of A
ll R
etur
ns
Ret
urns
pe
r Pr
epar
er
Prep
ared
251
–500
retu
rns
2004
61,8
9621
,276
,546
27%
344
2005
61,3
58-1
%59
,086
96%
2,27
24%
1,11
22%
1,16
021
,088
,794
27%
344
2006
62,4
992%
60,2
382%
96%
2,26
10%
4%81
8-2
6%1%
1,44
321
,468
,976
27%
344
2007
62,6
260%
60,5
290%
97%
2,09
7-7
%3%
914
12%
1%1,
183
21,5
72,9
7427
%34
4
2008
64,8
564%
62,6
554%
97%
2,20
15%
3%92
01%
1%1,
281
22,4
00,8
3527
%34
5
2009
62,2
01-4
%60
,287
-4%
97%
1,91
4-1
3%3%
1,03
412
%2%
880
21,4
55,1
3626
%34
5
2010
61,7
14-1
%60
,025
0%97
%1,
689
-12%
3%80
4-2
2%1%
885
21,2
85,2
4426
%34
5
2011
64,5
665%
59,8
440%
93%
4,72
218
0%7%
1,36
370
%2%
3,35
922
,282
,874
28%
345
2012
66,0
602%
64,1
177%
97%
1,94
3-5
9%3%
992
-27%
2%95
122
,794
,711
28%
345
2013
67,6
542%
65,8
633%
97%
1,79
1-8
%3%
1,18
720
%2%
604
23,3
90,6
6829
%34
6
Prep
ared
501
–1,0
00 re
turn
s20
0420
,658
13,7
43,5
5417
%66
5
2005
20,5
870%
20,1
2298
%46
52%
115
1%35
013
,721
,039
18%
666
2006
21,2
983%
20,8
324%
98%
466
0%2%
87-2
4%0%
379
14,2
46,5
8918
%66
9
2007
21,6
932%
21,2
212%
98%
472
1%2%
69-2
1%0%
403
14,5
10,7
9018
%66
9
2008
23,4
618%
22,9
428%
98%
519
10%
2%93
35%
0%42
615
,736
,072
19%
671
2009
22,5
77-4
%22
,086
-4%
98%
491
-5%
2%14
152
%1%
350
15,1
26,8
0718
%67
0
2010
22,2
88-1
%21
,754
-2%
98%
534
9%2%
80-4
3%0%
454
14,9
31,2
0019
%67
0
2011
23,2
514%
21,6
22-1
%93
%1,
629
205%
7%15
999
%1%
1,47
015
,556
,346
19%
669
2012
24,1
484%
23,5
759%
98%
573
-65%
2%13
1-1
8%1%
442
16,1
57,7
2320
%66
9
2013
24,5
852%
24,0
852%
98%
500
-13%
2%16
425
%1%
336
16,4
32,0
1120
%66
8
Prep
ared
>1,
000
retu
rns
2004
4,99
07,
875,
088
10%
1,57
8
2005
5,04
61%
4,90
997
%13
73%
160%
121
7,87
3,02
710
%1,
560
2006
5,39
97%
5,26
97%
98%
130
-5%
2%10
-38%
0%12
08,
507,
281
11%
1,57
6
2007
5,69
86%
5,57
26%
98%
126
-3%
2%13
30%
0%11
38,
968,
811
11%
1,57
4
2008
6,25
210
%6,
100
9%98
%15
221
%2%
1623
%0%
136
9,84
4,60
412
%1,
575
2009
6,16
8-1
%6,
013
-1%
97%
155
2%3%
2238
%0%
133
9,74
1,63
712
%1,
579
2010
6,01
1-3
%5,
868
-2%
98%
143
-8%
2%15
-32%
0%12
89,
477,
029
12%
1,57
7
2011
5,93
1-1
%5,
422
-8%
91%
509
256%
9%21
40%
0%48
89,
072,
314
11%
1,53
0
2012
6,05
12%
5,90
09%
98%
151
-70%
2%18
-14%
0%13
39,
208,
919
11%
1,52
2
2013
6,05
10%
5,91
60%
98%
135
-11%
2%24
33%
0%11
19,
064,
190
11%
1,49
8
* S
ourc
e: R
AS
:R:T
AM
tabu
latio
ns u
sing
the
IRTF
tabl
e fro
m D
ecem
ber 2
013
CD
WE
xclu
des
prep
arer
s th
at s
olel
y pr
epar
ed S
S/P
R/N
R/N
R-E
Z, s
timul
us, o
r TE
TR re
turn
s an
d no
oth
ers.
D
ata
also
exc
lude
all
volu
ntee
r pre
pare
rs (e
.g.,
VIT
A, T
CE
).
TAB
LE A
1. P
repa
rers
and
Pre
pare
d R
etur
ns, P
roce
ssin
g Ye
ars
2004
–201
3*—
Con
tinue
d

Langetieg, Payne, and Vigil36
Volu
me
Seg
men
t(N
umbe
r of R
etur
ns
Prep
ared
)
Prep
arer
sR
etur
ns P
repa
red
PY20
04PY
2010
PY20
11PY
2012
PY20
13PY
2004
PY20
10PY
2011
PY20
12PY
2013
Num
ber
Num
ber
All
Pre
pare
rs1,
229,
259
983,
219
817,
004
734,
386
663,
054
78,6
24,4
5980
,508
,154
80,9
43,4
3281
,424
,450
80,9
88,7
03
1–4
635,
968
414,
238
274,
705
217,
297
167,
582
902,
604
605,
890
433,
836
345,
055
273,
146
5–10
91,0
3073
,783
65,1
9855
,058
49,1
7664
2,08
652
4,69
346
3,54
839
4,02
835
2,57
9
11–2
071
,051
63,6
4556
,655
49,6
0245
,945
1,06
5,01
195
8,73
285
4,24
974
9,47
569
4,24
5
21–1
0020
6,09
520
6,86
219
0,91
918
1,25
317
0,17
510
,895
,848
10,9
81,8
6810
,255
,770
9,84
7,15
79,
254,
160
101–
250
137,
571
134,
678
135,
779
134,
917
131,
886
22,2
23,7
2221
,743
,498
22,0
24,4
9521
,927
,382
21,5
27,7
04
251–
500
61,8
9661
,714
64,5
6666
,060
67,6
5421
,276
,546
21,2
85,2
4422
,282
,874
22,7
94,7
1123
,390
,668
501–
1,00
020
,658
22,2
8823
,251
24,1
4824
,585
13,7
43,5
5414
,931
,200
15,5
56,3
4616
,157
,723
16,4
32,0
11
> 1,
000
4,99
06,
011
5,93
16,
051
6,05
17,
875,
088
9,47
7,02
99,
072,
314
9,20
8,91
99,
064,
190
M
arke
t Sha
res
Mar
ket S
hare
s1–
452
%42
%34
%30
%25
%1%
1%1%
0%0%
5–10
7%8%
8%7%
7%1%
1%1%
0%0%
11–2
06%
6%7%
7%7%
1%1%
1%1%
1%
21–1
0017
%21
%23
%25
%26
%14
%14
%13
%12
%11
%
101–
250
11%
14%
17%
18%
20%
28%
27%
27%
27%
27%
251–
500
5%6%
8%9%
10%
27%
26%
28%
28%
29%
501–
1,00
02%
2%3%
3%4%
17%
19%
19%
20%
20%
> 1,
000
0%1%
1%1%
1%10
%12
%11
%11
%11
%
Pe
rcen
t Cha
nge
Perc
ent C
hang
ePY
04
to P
Y10
PY04
to P
Y13
PY10
to P
Y11
PY10
to P
Y12
PY10
to P
Y13
PY 0
4 to
PY1
0PY
04 to
PY1
3PY
10 to
PY1
1PY
10 to
PY1
2PY
10 to
PY1
3A
ll P
repa
rers
-20%
-40%
-17%
-25%
-33%
2%3%
1%1%
1%
1-4
-35%
-66%
-34%
-48%
-60%
-33%
-70%
-28%
-43%
-55%
5-10
-19%
-40%
-12%
-25%
-33%
-18%
-45%
-12%
-25%
-33%
11-2
0-1
0%-3
0%-1
1%-2
2%-2
8%-1
0%-3
5%-1
1%-2
2%-2
8%
21-1
000%
-12%
-8%
-12%
-18%
1%-1
5%-7
%-1
0%-1
6%
101-
250
-2%
-2%
1%0%
-2%
-2%
-3%
1%1%
-1%
251-
500
0%7%
5%7%
10%
0%10
%5%
7%10
%
501-
1,00
08%
17%
4%8%
10%
9%20
%4%
8%10
%
> 1,
000
20%
21%
-1%
1%1%
20%
15%
-4%
2%-2
%
Aver
age
Num
ber o
f Ret
urns
Pre
pare
d by
Pre
pare
rPY
2004
PY20
10PY
2011
PY20
12PY
2013
All
Pre
pare
rs 6
4 8
2 9
9 1
11
122
1-4
1
1
2
2
2
5-10
7
7
7
7
7
11-2
0 1
5 1
5 1
5 1
5 1
5
21-1
00 5
3 5
3 5
4 5
4 5
4
101-
250
162
1
61
162
1
63
163
251-
500
344
3
45
345
3
45
346
501-
1,00
0 6
65
670
6
69
669
6
68
> 1,
000
1,5
78
1,5
77
1,5
30
1,5
22
1,4
98
* S
ourc
e: R
AS
:R:T
AM
tabu
latio
ns u
sing
the
IRTF
tabl
e fro
m D
ecem
ber 2
013
CD
W E
xclu
des
prep
arer
s th
at s
olel
y pr
epar
ed S
S/P
R/N
R/N
R-E
Z, s
timul
us, o
r TE
TR re
turn
s an
d no
oth
ers.
D
ata
also
exc
lude
all
volu
ntee
r pre
pare
rs (e
.g.,
VIT
A, T
CE
).
TAB
LE A
2. N
umbe
r, M
arke
t Sha
res,
Per
cent
Cha
nge,
and
Ave
rage
—by
Pre
pare
rs, R
etur
ns P
repa
red,
Vol
ume
Segm
ent,
and
Sele
cted
R
ange
s of
Pro
cess
ing
Year
s*

Return Preparer Industry Analysis 37
TABLE A3. Preparer Dynamics, Processing Years 2005–2013*
Processing Year
New Preparers Prepared Previous Year, But Not Current Year Prepared Both Years
NumberGrowth
Rate
Share: Current
YearNumber
Growth Rate
Share: Previous
Year Attrition
Net Increase/ Decrease
NumberGrowth
Rate
Share: Current
Year
2005 457,546 39% 516,157 42% -58,611 717,457 61%
2006 421,207 -8% 38% 472,182 -9% 40% -50,975 702,821 -2% 63%
2007 398,467 -5% 37% 430,778 -9% 38% -32,311 693,250 -1% 64%
2008 457,323 15% 43% 404,734 -6% 37% 52,589 686,983 -1% 64%
2009 369,355 -19% 35% 468,072 16% 44% -98,717 676,234 -2% 65%
2010 329,504 -11% 34% 387,854 -17% 37% -58,350 657,735 -3% 67%
2011 249,117 -24% 30% 415,825 7% 42% -166,708 571,414 -13% 70%
2012 185,980 -25% 25% 269,055 -35% 33% -83,075 551,476 -3% 75%
2013 144,771 -22% 22% 216,337 -20% 29% -71,566 521,119 -6% 79%
* Source: RAS:R:TAM tabulations using the IRTF table from December 2013 CDW Excludes preparers that solely prepared SS/PR/NR/NR-EZ, stimulus, or TETR returns and no others. Data also exclude all volunteer preparers (e.g., VITA, TCE).
TABLE A4. Percent of Returns with Math Errors by Preparation Method, Tax Year 2010
Preparation Method With Errors No Errors TotalSelf-prepared by hand 37.0 63.0 100.0
Self-prepared with software 1.8 98.2 100.0
Paid-prepared 1.3 98.7 100.0
Total 3.6 96.4 100.0Source: RAS:R:TAM. Analysis of data from CDW: IRTF and IMF through 3/2014.NOTE: Forms 1040PR, 1040NR, 1040NR-EZ, and 1040SS, and returns prepared at VITA sites are excluded. Limited to returns fi led in 2011.
TABLE A5. Percent of Returns with Math Errors by Preparation and Submission Method, Tax Year 2010
Preparation Method With Errors No Errors TotalSelf-prepared by hand 37.0 63.0 100.0
Self-prepared with software e-fi led 1.1 98.9 100.0
Self-prepared with software on paper 5.3 94.7 100.0
Paid-prepared by hand 18.0 82.0 100.0
Paid-prepared with software e-fi led 0.6 99.4 100.0
Paid-prepared with software on paper 5.5 94.5 100.0
Total 3.6 96.4 100.0Source: RAS:R:TAM. Analysis of data from CDW: IRTF and IMF through 3/2014.NOTE: 1040PR, 1040NR, 1040NR-EZ and 1040SS and returns prepared at VITA sites are excluded. Limited to returns fi led in 2011.

Langetieg, Payne, and Vigil38
TABLE A6. Percent of Returns with Math Errors by Preparation and Submission Method and Preparer Type, Tax Year 2010
Preparation and Submission Method and Preparer Type
With Errors No Errors Total
Self-prepared by hand 37.0 63.0 100.0
Self-prepared with software e-fi led 1.1 98.9 100.0
Self-prepared with software on paper 5.3 94.7 100.0
Paid with software e-fi led PTIN holder 0.6 99.4 100.0
Paid with software e-fi led no PTIN 0.9 99.1 100.0
Paid with software on paper PTIN holder 5.2 94.8 100.0
Paid with software on paper no PTIN 7.2 92.8 100.0
Paid by hand PTIN holder 15.1 84.9 100.0
Paid by hand no PTIN 26.1 73.9 100.0
Paid PTIN holder 1.2 98.8 100.0
Paid no PTIN 4.1 95.9 100.0
Total 3.6 96.4 100.0Source: RAS:R:TAM. Analysis of data from CDW: IRTF and IMF through 3/2014.NOTE: Forms 1040PR, 1040NR, 1040NR-EZ, and 1040SS, and returns prepared at VITA sites are excluded. Limited to returns fi led in 2011. Preparers are considered as having a PTIN if it was obtained by the end of 2011.
TABLE A7. Percent of Returns with Math Errors by Preparation and Submission Method and Preparer Type, Tax Year 2010
Preparation and Submission Method and Preparer Type
With Errors No Errors Total
Self-prepared by hand 37.0 63.0 100.0
Self-prepared with software e-fi led 1.1 98.9 100.0
Self-prepared with software on paper 5.3 94.7 100.0
Paid with software e-fi led credentialed 0.7 99.3 100.0
Paid with software e-fi led not credentialed 0.6 99.4 100.0
Paid with software on paper credentialed 4.4 95.6 100.0
Paid with software on paper not credentialed 6.1 93.9 100.0
Paid by hand credentialed 12.7 87.3 100.0
Paid by hand not credentialed 19.4 80.6 100.0
Paid credentialed 1.1 98.9 100.0
Paid not credentialed 1.5 98.5 100.0
Total 3.6 96.4 100.0Source: RAS:R:TAM. Analysis of data from CDW: IRTF and IMF through 3/2014.NOTE: Forms 1040PR, 1040NR, 1040NR-EZ, and 1040SS, and returns prepared at VITA sites are excluded. Limited to returns fi led in 2011. The designation ‘creden-tialed’ means that the preparer self-reported in the registration for a PTIN that he/she is a Certifi ed Public Accountant, Enrolled Agent, or an Attorney.
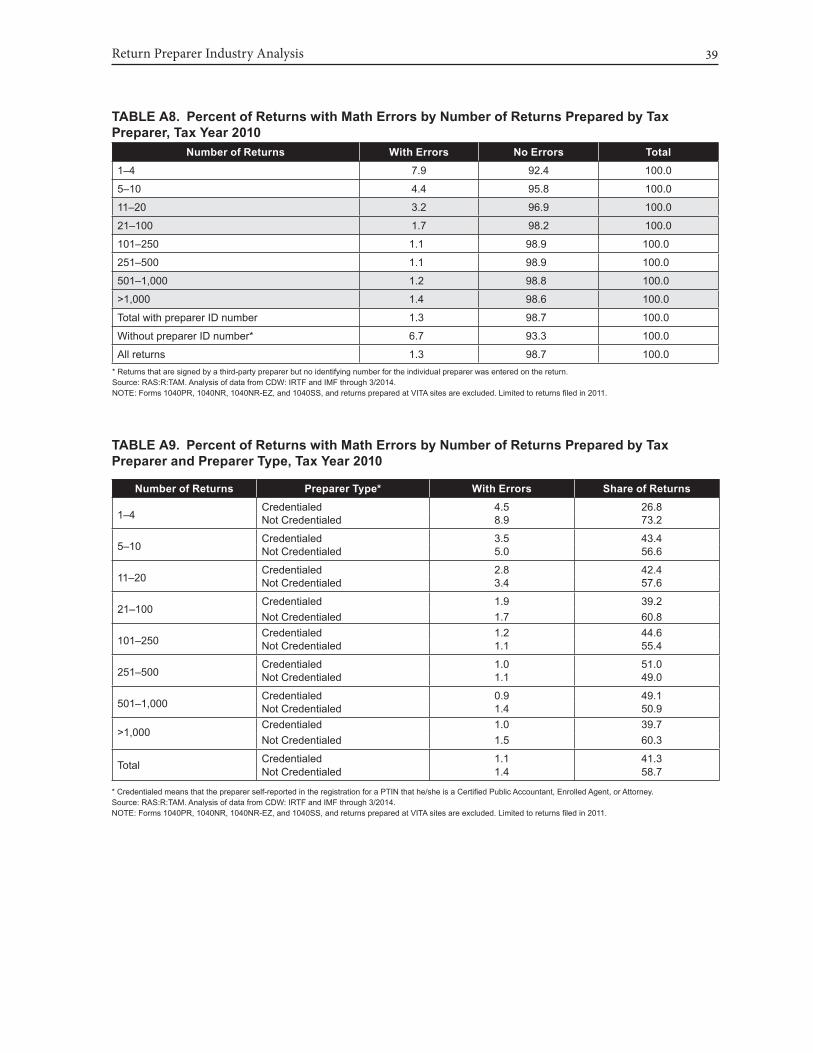
Return Preparer Industry Analysis 39
TABLE A8. Percent of Returns with Math Errors by Number of Returns Prepared by Tax Preparer, Tax Year 2010
Number of Returns With Errors No Errors Total1–4 7.9 92.4 100.0
5–10 4.4 95.8 100.0
11–20 3.2 96.9 100.0
21–100 1.7 98.2 100.0
101–250 1.1 98.9 100.0
251–500 1.1 98.9 100.0
501–1,000 1.2 98.8 100.0
>1,000 1.4 98.6 100.0
Total with preparer ID number 1.3 98.7 100.0
Without preparer ID number* 6.7 93.3 100.0
All returns 1.3 98.7 100.0* Returns that are signed by a third-party preparer but no identifying number for the individual preparer was entered on the return. Source: RAS:R:TAM. Analysis of data from CDW: IRTF and IMF through 3/2014.NOTE: Forms 1040PR, 1040NR, 1040NR-EZ, and 1040SS, and returns prepared at VITA sites are excluded. Limited to returns fi led in 2011.
TABLE A9. Percent of Returns with Math Errors by Number of Returns Prepared by Tax Preparer and Preparer Type, Tax Year 2010
Number of Returns Preparer Type* With Errors Share of Returns
1–4Credentialed 4.5 26.8Not Credentialed 8.9 73.2
5–10Credentialed 3.5 43.4Not Credentialed 5.0 56.6
11–20Credentialed 2.8 42.4Not Credentialed 3.4 57.6
21–100Credentialed 1.9 39.2Not Credentialed 1.7 60.8
101–250Credentialed 1.2 44.6Not Credentialed 1.1 55.4
251–500Credentialed 1.0 51.0Not Credentialed 1.1 49.0
501–1,000Credentialed 0.9 49.1Not Credentialed 1.4 50.9
>1,000Credentialed 1.0 39.7Not Credentialed 1.5 60.3
Total CredentialedNot Credentialed
1.11.4
41.3 58.7
* Credentialed means that the preparer self-reported in the registration for a PTIN that he/she is a Certifi ed Public Accountant, Enrolled Agent, or Attorney.Source: RAS:R:TAM. Analysis of data from CDW: IRTF and IMF through 3/2014.NOTE: Forms 1040PR, 1040NR, 1040NR-EZ, and 1040SS, and returns prepared at VITA sites are excluded. Limited to returns fi led in 2011.
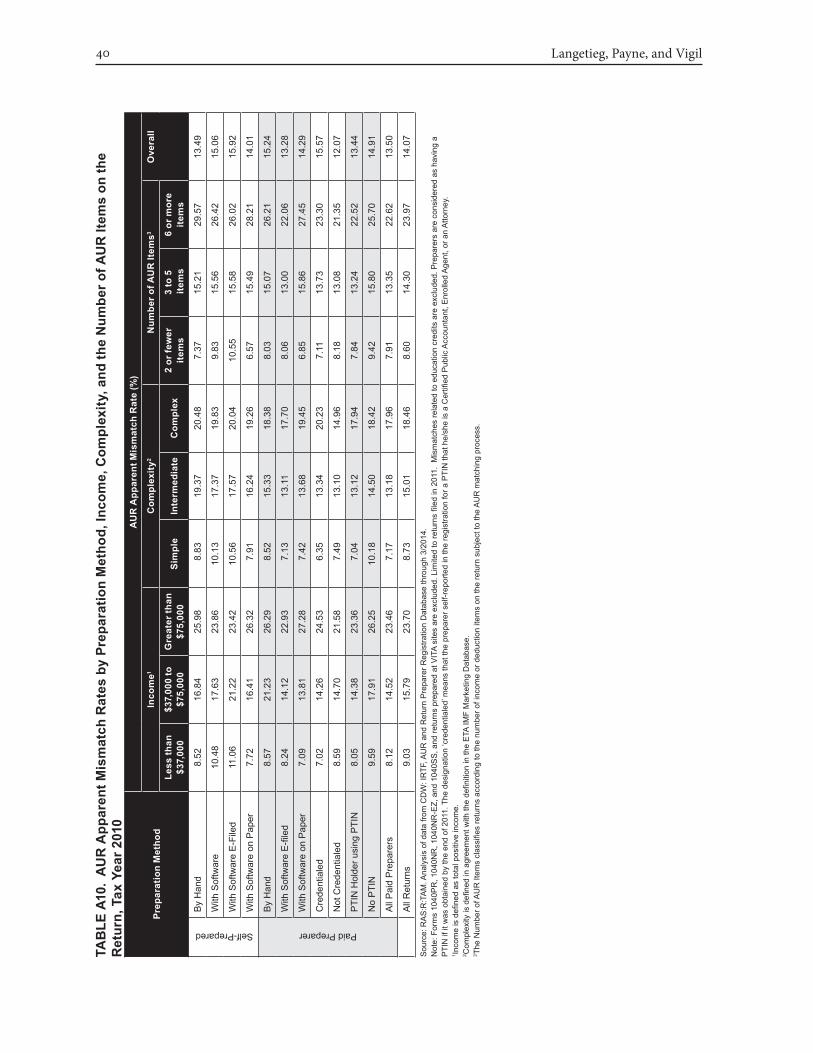
Langetieg, Payne, and Vigil40
Prep
arat
ion
Met
hod
AU
R A
ppar
ent M
ism
atch
Rat
e (%
)
Inco
me1
Com
plex
ity2
Num
ber o
f AU
R It
ems3
Ove
rall
Less
than
$3
7,00
0$3
7,00
0 to
$7
5,00
0G
reat
er th
an
$75,
000
Sim
ple
Inte
rmed
iate
Com
plex
2 or
few
er
item
s3
to 5
item
s6
or m
ore
item
s
Self-Prepared
By
Han
d8.
5216
.84
25.9
8 8
.83
19.3
720
.48
7.37
15.2
129
.57
13.4
9
With
Sof
twar
e10
.48
17.6
323
.86
10.1
317
.37
19.8
39.
8315
.56
26.4
215
.06
With
Sof
twar
e E
-File
d11
.06
21.2
223
.42
10.5
617
.57
20.0
410
.55
15.5
826
.02
15.9
2
With
Sof
twar
e on
Pap
er7.
7216
.41
26.3
2 7
.91
16.2
419
.26
6.57
15.4
928
.21
14.0
1
Paid Preparer
By
Han
d8.
5721
.23
26.2
9 8
.52
15.3
318
.38
8.03
15.0
726
.21
15.2
4
With
Sof
twar
e E
-fi le
d8.
2414
.12
22.9
3 7
.13
13.1
117
.70
8.06
13.0
022
.06
13.2
8
With
Sof
twar
e on
Pap
er7.
0913
.81
27.2
8 7
.42
13.6
819
.45
6.85
15.8
627
.45
14.2
9
Cre
dent
iale
d7.
0214
.26
24.5
3 6
.35
13.3
420
.23
7.11
13.7
323
.30
15.5
7
Not
Cre
dent
iale
d8.
5914
.70
21.5
8 7
.49
13.1
014
.96
8.18
13.0
821
.35
12.0
7
PTI
N H
olde
r usi
ng P
TIN
8.05
14.3
823
.36
7.0
413
.12
17.9
47.
8413
.24
22.5
213
.44
No
PTI
N9.
5917
.91
26.2
510
.18
14.5
018
.42
9.42
15.8
025
.70
14.9
1
All
Pai
d P
repa
rers
8.12
14.5
223
.46
7.1
713
.18
17.9
67.
9113
.35
22.6
213
.50
All
Ret
urns
9.03
15.7
923
.70
8.7
315
.01
18.4
68.
6014
.30
23.9
714
.07
Sou
rce:
RA
S:R
:TA
M. A
naly
sis
of d
ata
from
CD
W: I
RTF
, AU
R a
nd R
etur
n P
repa
rer R
egis
tratio
n D
atab
ase
thro
ugh
3/20
14.
Not
e: F
orm
s 10
40P
R, 1
040N
R, 1
040N
R-E
Z, a
nd 1
040S
S, a
nd re
turn
s pr
epar
ed a
t VIT
A si
tes
are
excl
uded
. Lim
ited
to re
turn
s fi l
ed in
201
1. M
ism
atch
es re
late
d to
edu
catio
n cr
edits
are
exc
lude
d. P
repa
rers
are
con
side
red
as h
avin
g a
PTI
N if
it w
as o
btai
ned
by th
e en
d of
201
1. T
he d
esig
natio
n ‘c
rede
ntia
led’
mea
ns th
at th
e pr
epar
er s
elf-r
epor
ted
in th
e re
gist
ratio
n fo
r a P
TIN
that
he/
she
is a
Cer
tifi e
d P
ublic
Acc
ount
ant,
Enr
olle
d A
gent
, or a
n A
ttorn
ey.
1 Inco
me
is d
efi n
ed a
s to
tal p
ositi
ve in
com
e.2 C
ompl
exity
is d
efi n
ed in
agr
eem
ent w
ith th
e defi n
ition
in th
e E
TA IM
F M
arke
ting
Dat
abas
e.3 T
he N
umbe
r of A
UR
Item
s cl
assifi e
s re
turn
s ac
cord
ing
to th
e nu
mbe
r of i
ncom
e or
ded
uctio
n ite
ms
on th
e re
turn
sub
ject
to th
e A
UR
mat
chin
g pr
oces
s.
TAB
LE A
10.
AU
R A
ppar
ent M
ism
atch
Rat
es b
y Pr
epar
atio
n M
etho
d, In
com
e, C
ompl
exity
, and
the
Num
ber o
f AU
R It
ems
on th
e R
etur
n, T
ax Y
ear 2
010

Return Preparer Industry Analysis 41
Paid
Pre
para
tion
Met
hod
AU
R A
ppar
ent M
ism
atch
Rat
e (%
)
Inco
me1
Com
plex
ity2
Num
ber o
f AU
R It
ems3
Ove
rall
Less
than
$3
7,00
0$3
7,00
0 to
$7
5,00
0G
reat
er th
an
$75,
000
Sim
ple
Inte
rmed
iate
Com
plex
2 or
few
er
item
s3
to 5
item
s6
or m
ore
item
s
Credentialed
E-F
iled
6.97
14.0
023
.99
6.22
13.1
619
.87
6.96
13.2
522
.76
15.2
4
Sof
twar
e on
Pap
er7.
4316
.51
28.6
07.
5115
.19
22.7
58.
1817
.30
29.0
118
.31
By
Han
d7.
6717
.24
27.9
57.
0915
.09
21.5
67.
7915
.90
27.8
915
.98
NotCredentialed
E-F
iled
8.79
14.4
620
.84
7.48
13.0
914
.63
8.42
12.8
220
.67
11.9
4
Sof
twar
e on
Pap
er6.
9616
.21
25.3
67.
3912
.97
16.3
36.
4114
.87
25.5
312
.80
By
Han
d8.
7817
.21
25.4
98.
8415
.39
17.2
68.
0914
.85
25.5
614
.09
PTIN Holder
E-F
iled
8.17
14.1
722
.84
7.01
13.0
817
.69
7.97
12.9
322
.01
13.2
7
Sof
twar
e on
Pap
er6.
9816
.10
27.1
27.
3313
.54
19.5
16.
7815
.76
27.4
114
.86
By
Han
d7.
5516
.38
25.4
67.
2414
.50
18.0
17.
0614
.32
25.4
213
.75
No PTIN
E-F
iled
10.2
417
.79
24.9
611
.01
14.2
317
.89
10.2
615
.27
24.3
314
.65
Sof
twar
e on
Pap
er7.
8617
.86
27.8
78.
1514
.73
19.0
57.
3616
.56
27.7
815
.16
By
Han
d11
.27
19.6
028
.94
11.9
517
.67
19.4
910
.67
17.2
028
.75
16.6
1
All
Pai
d P
repa
rers
8.12
14.5
223
.46
7.17
13.1
817
.96
7.91
13.3
522
.62
13.5
0S
ourc
e: R
AS
:R:T
AM
. Ana
lysi
s of
dat
a fro
m C
DW
: IR
TF, A
UR
and
Ret
urn
Pre
pare
r Reg
istra
tion
Dat
abas
e th
roug
h 3/
2014
. N
OTE
: For
ms
1040
PR
, 104
0NR
, 104
0NR
-EZ,
and
104
0SS
, and
retu
rns
prep
ared
at V
ITA
site
s ar
e ex
clud
ed. L
imite
d to
retu
rns fi l
ed in
201
1. M
ism
atch
es re
late
d to
edu
catio
n cr
edits
are
exc
lude
d. P
repa
rers
are
con
side
red
as h
avin
g a
PTI
N if
it w
as o
btai
ned
by th
e en
d of
201
1. T
he d
esig
natio
n ‘c
rede
ntia
led’
mea
ns th
at th
e pr
epar
er s
elf-r
epor
ted
in th
e re
gist
ratio
n fo
r a P
TIN
that
he/
she
is a
Cer
tifi e
d P
ublic
Acc
ount
ant,
Enr
olle
d A
gent
, or a
n A
ttorn
ey.
1 Inco
me
is d
efi n
ed a
s to
tal p
ositi
ve in
com
e.2 C
ompl
exity
is d
efi n
ed in
agr
eem
ent w
ith th
e defi n
ition
in th
e E
TA IM
F M
arke
ting
Dat
abas
e.3 T
he N
umbe
r of A
UR
Item
s cl
assifi e
s re
turn
s ac
cord
ing
to th
e nu
mbe
r of i
ncom
e or
ded
uctio
n ite
ms
on th
e re
turn
sub
ject
to th
e A
UR
mat
chin
g pr
oces
s.
TAB
LE A
11.
AU
R A
ppar
ent M
ism
atch
Rat
es b
y Pa
id P
repa
rer T
ype,
Sub
mis
sion
Met
hod,
Inco
me,
Com
plex
ity, a
nd N
umbe
r of A
UR
Ite
ms,
Tax
Yea
r 201
0
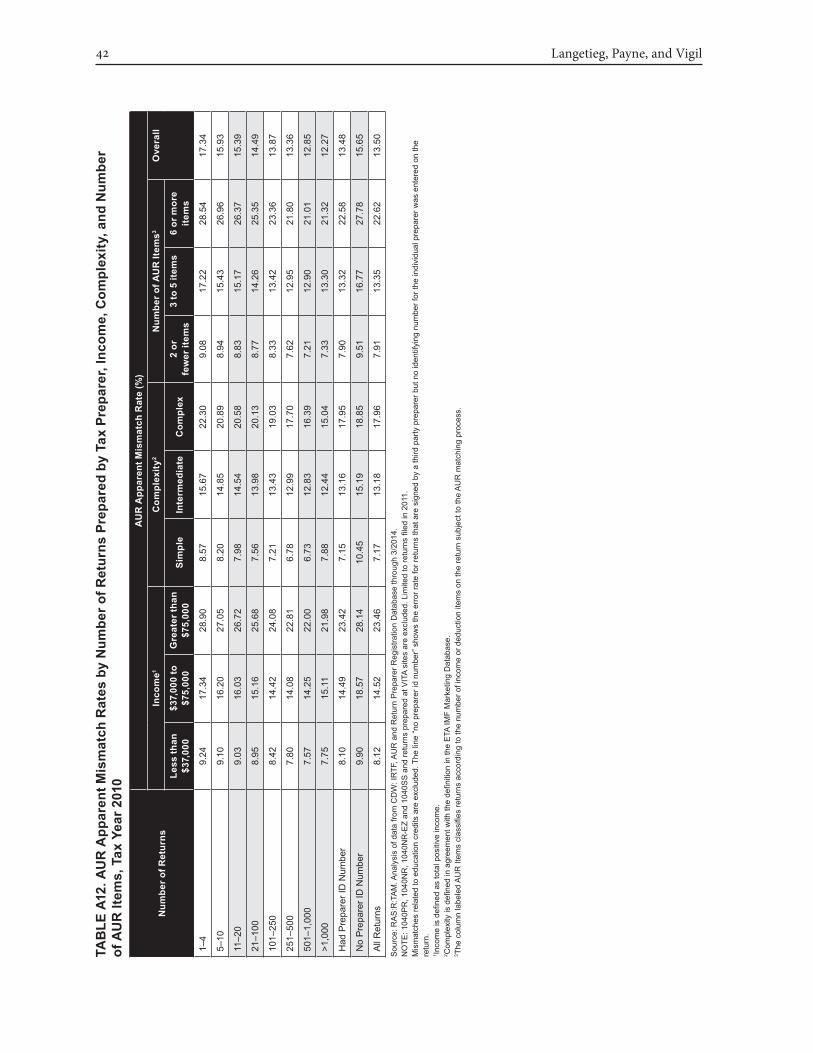
Langetieg, Payne, and Vigil42
Num
ber o
f Ret
urns
AU
R A
ppar
ent M
ism
atch
Rat
e (%
)
Inco
me1
Com
plex
ity2
Num
ber o
f AU
R It
ems3
Ove
rall
Less
than
$3
7,00
0$3
7,00
0 to
$7
5,00
0G
reat
er th
an
$75,
000
Sim
ple
Inte
rmed
iate
Com
plex
2 or
few
er it
ems
3 to
5 it
ems
6 or
mor
e ite
ms
1–4
9.24
17.3
428
.90
8.57
15.6
722
.30
9.08
17.2
228
.54
17.3
4
5–10
9.10
16.2
027
.05
8.20
14.8
520
.89
8.94
15.4
326
.96
15.9
3
11–2
09.
0316
.03
26.7
27.
9814
.54
20.5
88.
8315
.17
26.3
715
.39
21–1
008.
9515
.16
25.6
87.
5613
.98
20.1
38.
7714
.26
25.3
514
.49
101–
250
8.42
14.4
224
.08
7.21
13.4
319
.03
8.33
13.4
223
.36
13.8
7
251–
500
7.80
14.0
822
.81
6.78
12.9
917
.70
7.62
12.9
521
.80
13.3
6
501–
1,00
07.
5714
.25
22.0
06.
7312
.83
16.3
97.
2112
.90
21.0
112
.85
>1,0
007.
7515
.11
21.9
87.
8812
.44
15.0
47.
3313
.30
21.3
212
.27
Had
Pre
pare
r ID
Num
ber
8.10
14.4
923
.42
7.15
13.1
617
.95
7.90
13.3
222
.58
13.4
8
No
Pre
pare
r ID
Num
ber
9.90
18.5
728
.14
10.4
515
.19
18.8
59.
5116
.77
27.7
815
.65
All
Ret
urns
8.12
14.5
223
.46
7.17
13.1
817
.96
7.91
13.3
522
.62
13.5
0
Sou
rce:
RA
S:R
:TA
M. A
naly
sis
of d
ata
from
CD
W: I
RTF
, AU
R a
nd R
etur
n P
repa
rer R
egis
tratio
n D
atab
ase
thro
ugh
3/20
14.
NO
TE: 1
040P
R, 1
040N
R, 1
040N
R-E
Z an
d 10
40S
S a
nd re
turn
s pr
epar
ed a
t VIT
A si
tes
are
excl
uded
. Lim
ited
to re
turn
s fi l
ed in
201
1.M
ism
atch
es re
late
d to
edu
catio
n cr
edits
are
exc
lude
d. T
he li
ne “n
o pr
epar
er id
num
ber”
sho
ws
the
erro
r rat
e fo
r ret
urns
that
are
sig
ned
by a
third
par
ty p
repa
rer b
ut n
o id
entif
ying
num
ber f
or th
e in
divi
dual
pre
pare
r was
ent
ered
on
the
retu
rn.
1 Inco
me
is d
efi n
ed a
s to
tal p
ositi
ve in
com
e.2 C
ompl
exity
is d
efi n
ed in
agr
eem
ent w
ith th
e defi n
ition
in th
e E
TA IM
F M
arke
ting
Dat
abas
e.3 T
he c
olum
n la
bele
d A
UR
Item
s cl
assifi e
s re
turn
s ac
cord
ing
to th
e nu
mbe
r of i
ncom
e or
ded
uctio
n ite
ms
on th
e re
turn
sub
ject
to th
e A
UR
mat
chin
g pr
oces
s.
TAB
LE A
12. A
UR
App
aren
t Mis
mat
ch R
ates
by
Num
ber o
f Ret
urns
Pre
pare
d by
Tax
Pre
pare
r, In
com
e, C
ompl
exity
, and
Num
ber
of A
UR
Item
s, T
ax Y
ear 2
010
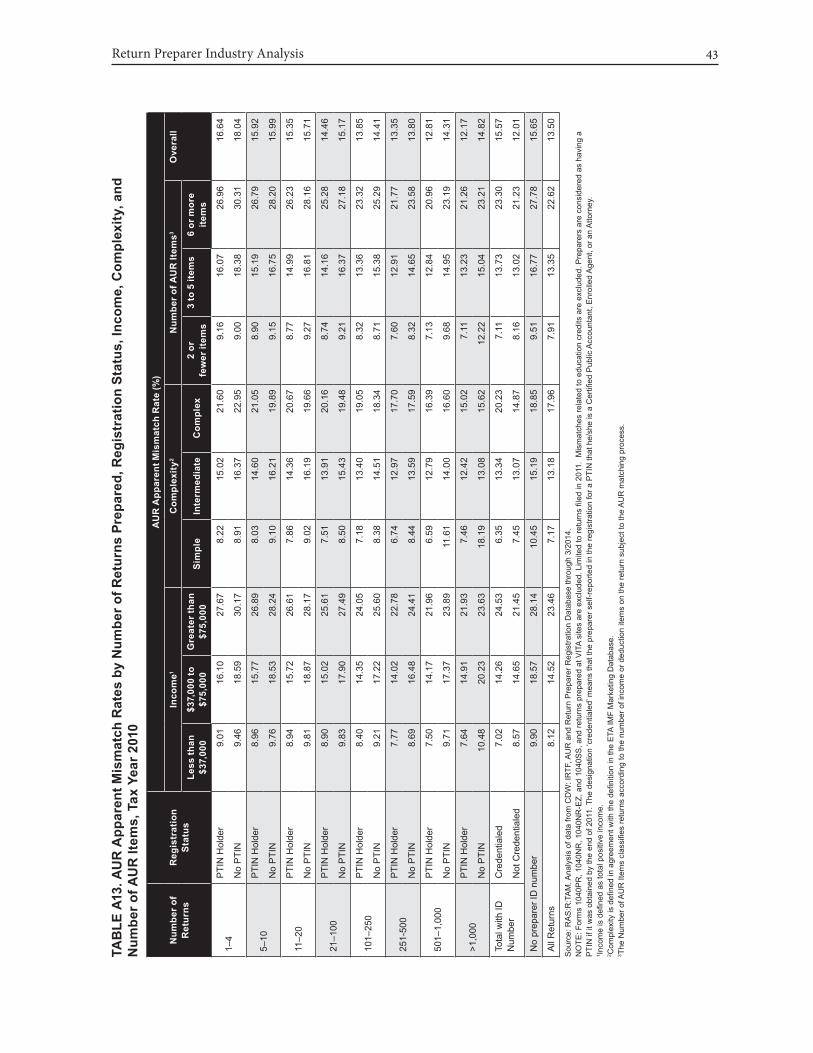
Return Preparer Industry Analysis 43
Num
ber o
f R
etur
nsR
egis
trat
ion
Stat
us
AU
R A
ppar
ent M
ism
atch
Rat
e (%
)
Inco
me1
Com
plex
ity2
Num
ber o
f AU
R It
ems3
Ove
rall
Less
than
$3
7,00
0$3
7,00
0 to
$7
5,00
0G
reat
er th
an
$75,
000
Sim
ple
Inte
rmed
iate
Com
plex
2 or
few
er it
ems
3 to
5 it
ems
6 or
mor
e ite
ms
1–4
PTI
N H
olde
r9.
0116
.10
27.6
78.
2215
.02
21.6
09.
1616
.07
26.9
616
.64
No
PTI
N9.
4618
.59
30.1
78.
9116
.37
22.9
59.
0018
.38
30.3
118
.04
5–10
PTI
N H
olde
r8.
9615
.77
26.8
98.
0314
.60
21.0
58.
9015
.19
26.7
915
.92
No
PTI
N9.
7618
.53
28.2
49.
1016
.21
19.8
99.
1516
.75
28.2
015
.99
11–2
0P
TIN
Hol
der
8.94
15.7
226
.61
7.86
14.3
620
.67
8.77
14.9
926
.23
15.3
5
No
PTI
N9.
8118
.87
28.1
79.
0216
.19
19.6
69.
2716
.81
28.1
615
.71
21–1
00P
TIN
Hol
der
8.90
15.0
225
.61
7.51
13.9
120
.16
8.74
14.1
625
.28
14.4
6
No
PTI
N9.
8317
.90
27.4
98.
5015
.43
19.4
89.
2116
.37
27.1
815
.17
101–
250
PTI
N H
olde
r8.
4014
.35
24.0
57.
1813
.40
19.0
58.
3213
.36
23.3
213
.85
No
PTI
N9.
2117
.22
25.6
08.
3814
.51
18.3
48.
7115
.38
25.2
914
.41
251-
500
PTI
N H
olde
r7.
7714
.02
22.7
86.
7412
.97
17.7
07.
6012
.91
21.7
713
.35
No
PTI
N8.
6916
.48
24.4
18.
4413
.59
17.5
98.
3214
.65
23.5
813
.80
501–
1,00
0P
TIN
Hol
der
7.50
14.1
721
.96
6.59
12.7
916
.39
7.13
12.8
420
.96
12.8
1
No
PTI
N9.
7117
.37
23.8
911
.61
14.0
016
.60
9.68
14.9
523
.19
14.3
1
>1,0
00P
TIN
Hol
der
7.64
14.9
121
.93
7.46
12.4
215
.02
7.11
13.2
321
.26
12.1
7
No
PTI
N10
.48
20.2
323
.63
18.1
913
.08
15.6
212
.22
15.0
423
.21
14.8
2
Tota
l with
ID
Num
ber
Cre
dent
iale
d7.
0214
.26
24.5
36.
3513
.34
20.2
37.
1113
.73
23.3
015
.57
Not
Cre
dent
iale
d8.
5714
.65
21.4
57.
4513
.07
14.8
78.
1613
.02
21.2
312
.01
No
prep
arer
ID n
umbe
r9.
9018
.57
28.1
410
.45
15.1
918
.85
9.51
16.7
727
.78
15.6
5
All
Ret
urns
8.12
14.5
223
.46
7.17
13.1
817
.96
7.91
13.3
522
.62
13.5
0
Sou
rce:
RA
S:R
:TA
M. A
naly
sis
of d
ata
from
CD
W: I
RTF
, AU
R a
nd R
etur
n P
repa
rer R
egis
tratio
n D
atab
ase
thro
ugh
3/20
14.
NO
TE: F
orm
s 10
40P
R, 1
040N
R, 1
040N
R-E
Z, a
nd 1
040S
S, a
nd re
turn
s pr
epar
ed a
t VIT
A si
tes
are
excl
uded
. Lim
ited
to re
turn
s fi l
ed in
201
1. M
ism
atch
es re
late
d to
edu
catio
n cr
edits
are
exc
lude
d. P
repa
rers
are
con
side
red
as h
avin
g a
PTI
N if
it w
as o
btai
ned
by th
e en
d of
201
1. T
he d
esig
natio
n ‘c
rede
ntia
led’
mea
ns th
at th
e pr
epar
er s
elf-r
epor
ted
in th
e re
gist
ratio
n fo
r a P
TIN
that
he/
she
is a
Cer
tifi e
d P
ublic
Acc
ount
ant,
Enr
olle
d A
gent
, or a
n A
ttorn
ey.
1 Inco
me
is d
efi n
ed a
s to
tal p
ositi
ve in
com
e.2 C
ompl
exity
is d
efi n
ed in
agr
eem
ent w
ith th
e defi n
ition
in th
e E
TA IM
F M
arke
ting
Dat
abas
e.3 T
he N
umbe
r of A
UR
Item
s cl
assifi e
s re
turn
s ac
cord
ing
to th
e nu
mbe
r of i
ncom
e or
ded
uctio
n ite
ms
on th
e re
turn
sub
ject
to th
e A
UR
mat
chin
g pr
oces
s.
TAB
LE A
13. A
UR
App
aren
t Mis
mat
ch R
ates
by
Num
ber o
f Ret
urns
Pre
pare
d, R
egis
trat
ion
Stat
us, I
ncom
e, C
ompl
exity
, and
N
umbe
r of A
UR
Item
s, T
ax Y
ear 2
010
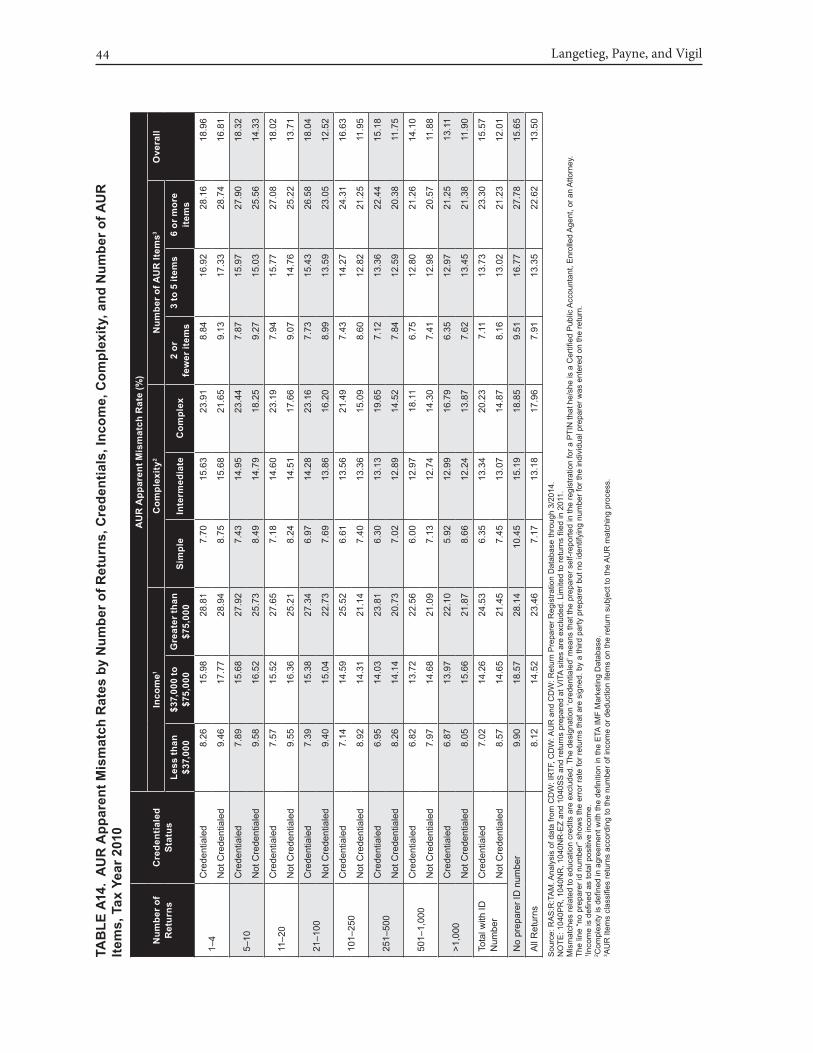
Langetieg, Payne, and Vigil44
Num
ber o
f R
etur
nsC
rede
ntia
led
Stat
us
AU
R A
ppar
ent M
ism
atch
Rat
e (%
)
Inco
me1
Com
plex
ity2
Num
ber o
f AU
R It
ems3
Ove
rall
Less
than
$3
7,00
0$3
7,00
0 to
$7
5,00
0G
reat
er th
an
$75,
000
Sim
ple
Inte
rmed
iate
Com
plex
2 or
few
er it
ems
3 to
5 it
ems
6 or
mor
e ite
ms
1–4
Cre
dent
iale
d8.
2615
.98
28.8
17.
7015
.63
23.9
18.
8416
.92
28.1
618
.96
Not
Cre
dent
iale
d9.
4617
.77
28.9
48.
7515
.68
21.6
59.
1317
.33
28.7
416
.81
5–10
Cre
dent
iale
d7.
8915
.68
27.9
27.
4314
.95
23.4
47.
8715
.97
27.9
018
.32
Not
Cre
dent
iale
d9.
5816
.52
25.7
38.
4914
.79
18.2
59.
2715
.03
25.5
614
.33
11–2
0C
rede
ntia
led
7.57
15.5
227
.65
7.18
14.6
023
.19
7.94
15.7
727
.08
18.0
2
Not
Cre
dent
iale
d9.
5516
.36
25.2
18.
2414
.51
17.6
69.
0714
.76
25.2
213
.71
21–1
00C
rede
ntia
led
7.39
15.3
827
.34
6.97
14.2
823
.16
7.73
15.4
326
.58
18.0
4
Not
Cre
dent
iale
d9.
4015
.04
22.7
37.
6913
.86
16.2
08.
9913
.59
23.0
512
.52
101–
250
Cre
dent
iale
d7.
1414
.59
25.5
26.
6113
.56
21.4
97.
4314
.27
24.3
116
.63
Not
Cre
dent
iale
d8.
9214
.31
21.1
47.
4013
.36
15.0
98.
6012
.82
21.2
511
.95
251–
500
Cre
dent
iale
d6.
9514
.03
23.8
16.
3013
.13
19.6
57.
1213
.36
22.4
415
.18
Not
Cre
dent
iale
d8.
2614
.14
20.7
37.
0212
.89
14.5
27.
8412
.59
20.3
811
.75
501–
1,00
0C
rede
ntia
led
6.82
13.7
222
.56
6.00
12.9
718
.11
6.75
12.8
021
.26
14.1
0
Not
Cre
dent
iale
d7.
9714
.68
21.0
97.
1312
.74
14.3
07.
4112
.98
20.5
711
.88
>1,0
00C
rede
ntia
led
6.87
13.9
722
.10
5.92
12.9
916
.79
6.35
12.9
721
.25
13.1
1
Not
Cre
dent
iale
d8.
0515
.66
21.8
78.
6612
.24
13.8
77.
6213
.45
21.3
811
.90
Tota
l with
ID
Num
ber
Cre
dent
iale
d7.
0214
.26
24.5
36.
3513
.34
20.2
37.
1113
.73
23.3
015
.57
Not
Cre
dent
iale
d8.
5714
.65
21.4
57.
4513
.07
14.8
78.
1613
.02
21.2
312
.01
No
prep
arer
ID n
umbe
r9.
9018
.57
28.1
410
.45
15.1
918
.85
9.51
16.7
727
.78
15.6
5
All
Ret
urns
8.12
14.5
223
.46
7.17
13.1
817
.96
7.91
13.3
522
.62
13.5
0
Sou
rce:
RA
S:R
:TA
M. A
naly
sis
of d
ata
from
CD
W: I
RTF
, CD
W: A
UR
and
CD
W: R
etur
n P
repa
rer R
egis
tratio
n D
atab
ase
thro
ugh
3/20
14.
NO
TE: 1
040P
R, 1
040N
R, 1
040N
R-E
Z an
d 10
40S
S a
nd re
turn
s pr
epar
ed a
t VIT
A si
tes
are
excl
uded
. Lim
ited
to re
turn
s fi l
ed in
201
1.M
ism
atch
es re
late
d to
edu
catio
n cr
edits
are
exc
lude
d. T
he d
esig
natio
n ‘c
rede
ntia
led’
mea
ns th
at th
e pr
epar
er s
elf-r
epor
ted
in th
e re
gist
ratio
n fo
r a P
TIN
that
he/
she
is a
Cer
tifi e
d P
ublic
Acc
ount
ant,
Enr
olle
d A
gent
, or a
n A
ttorn
ey.
The
line
“no
prep
arer
id n
umbe
r” s
how
s th
e er
ror r
ate
for r
etur
ns th
at a
re s
igne
d. b
y a
third
par
ty p
repa
rer b
ut n
o id
entif
ying
num
ber f
or th
e in
divi
dual
pre
pare
r was
ent
ered
on
the
retu
rn.
1 Inco
me
is d
efi n
ed a
s to
tal p
ositi
ve in
com
e.2 C
ompl
exity
is d
efi n
ed in
agr
eem
ent w
ith th
e defi n
ition
in th
e E
TA IM
F M
arke
ting
Dat
abas
e.3 A
UR
Item
s cl
assifi e
s re
turn
s ac
cord
ing
to th
e nu
mbe
r of i
ncom
e or
ded
uctio
n ite
ms
on th
e re
turn
sub
ject
to th
e A
UR
mat
chin
g pr
oces
s.
TAB
LE A
14.
AU
R A
ppar
ent M
ism
atch
Rat
es b
y N
umbe
r of R
etur
ns, C
rede
ntia
ls, I
ncom
e, C
ompl
exity
, and
Num
ber o
f AU
R
Item
s, T
ax Y
ear 2
010


