
Return on Knowledge Global Inflation-Linked Bonds 8 February 2011.
17
Return on Knowledge Global Inflation-Linked Bonds 8 February 2011
-
Upload
charlie-mallen -
Category
Documents
-
view
215 -
download
0
Transcript of Return on Knowledge Global Inflation-Linked Bonds 8 February 2011.
Return on Knowledge
Global Inflation-Linked Bonds8 February 2011
2
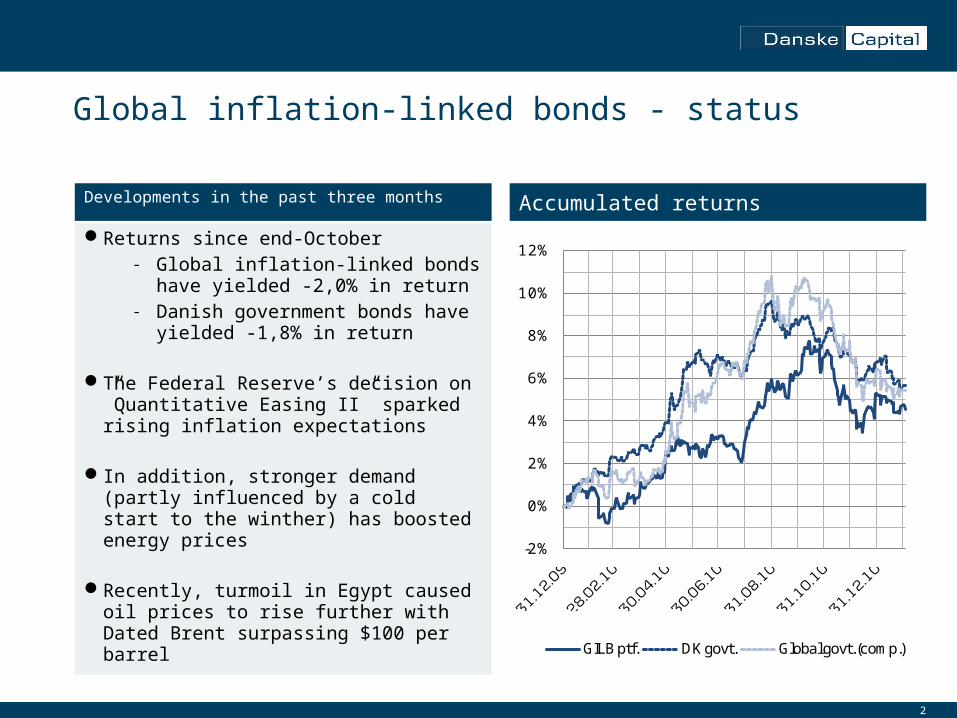
Global inflation-linked bonds - status
Developments in the past three months
Returns since end-October- Global inflation-linked bonds have
yielded -2,0% in return- Danish government bonds have
yielded -1,8% in return
The Federal Reserve’s decision on ”Quantitative Easing II” sparked rising inflation expectations
In addition, stronger demand (partly influenced by a cold start to the winther) has boosted energy prices
Recently, turmoil in Egypt caused oil prices to rise further with Dated Brent surpassing $100 per barrel
Accumulated returns
-2%
0%
2%
4%
6%
8%
10%
12%
GILB ptf. DK govt. Global govt. (comp.)
3
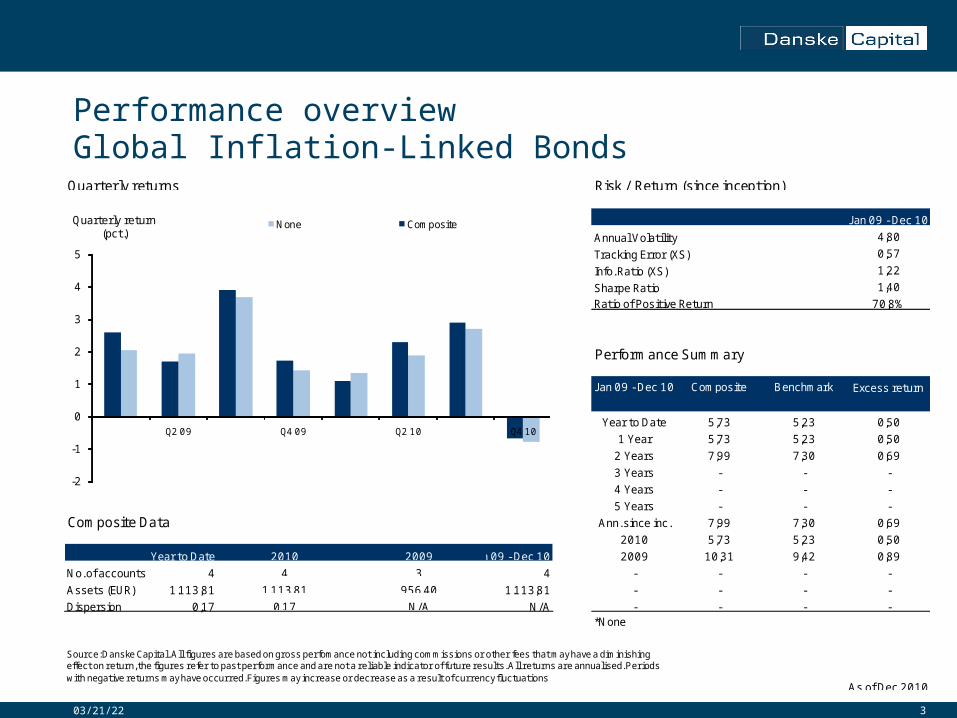
Performance overviewGlobal Inflation-Linked Bonds
04/18/23
J an 09 - Dec 10
Annual Volatility 4,80
Tracking Error (XS) 0,57
Info. Ratio (XS) 1,22
Sharpe Ratio 1,40
Ratio of Positive Return 70,8%
Performance Summary
Composite Return (EUR)
Benchmark return*
Excess return
Year to Date 5,73 5,23 0,50
1 Year 5,73 5,23 0,50
2 Years 7,99 7,30 0,69
3 Years - - -
4 Years - - -
5 Years - - -Composite Data Ann. since inc. 7,99 7,30 0,69
2010 5,73 5,23 0,50
Year to Date J an 09 - Dec 10 2009 10,31 9,42 0,89
No. of accounts 4 4 - - - -
Assets (EUR) 1.113,81 1.113,81 - - - -
Dispersion 0,17 N/A - - - -
2009
*None
Source: Danske Capital. All figures are based on gross perfomance not including commissions or other fees that may have a diminishing effect on return, the figures refer to past performance and are not a reliable indicator of future results. All returns are annualised. Periods with negative returns may have occurred. Figures may increase or decrease as a result of currency fluctuations
As of Dec 2010
Quarterly returns Risk / Return (since inception)
N/A0,17
J an 09 - Dec 10
1.113,81
4
2010
956,40
3
-2
-1
0
1
2
3
4
5
Q4 10Q2 10Q4 09Q2 09
Quarterly return (pct.)
None Composite
4
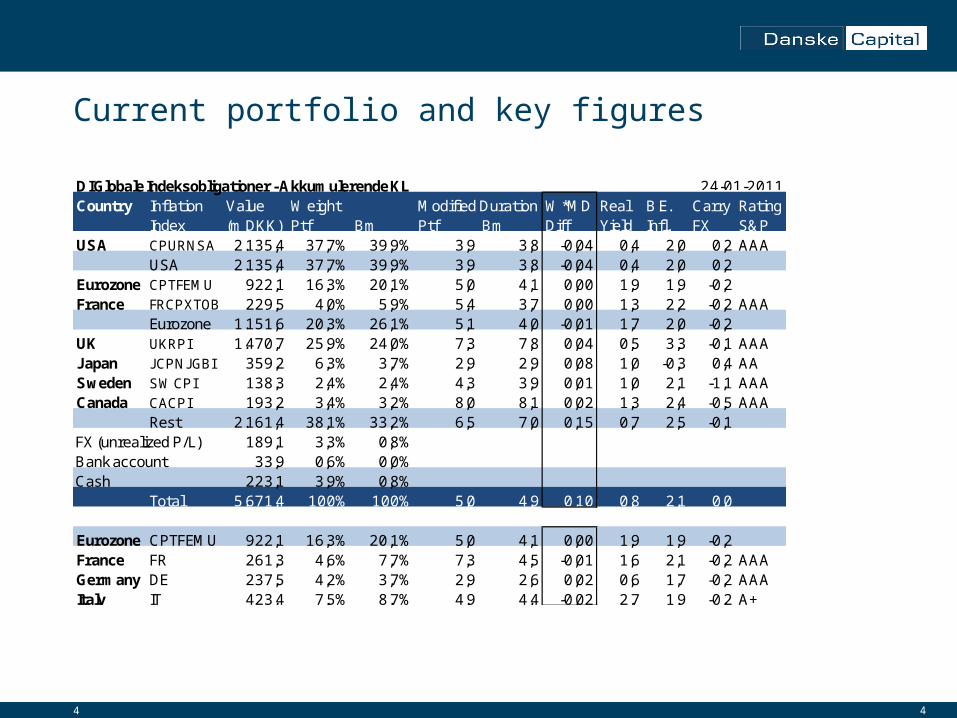
Current portfolio and key figures
4
DI Globale Indeksobligationer - Akkumulerende KLCountry Inflation Value Weight Modified Duration W*MD Real B.E. Carry Rating
Index (m.DKK) Ptf Bm Ptf Bm Diff Yield Infl. FX S&PUSA CPURNSA 2.135,4 37,7% 39,9% 3,9 3,8 -0,04 0,4 2,0 0,2 AAA
USA 2.135,4 37,7% 39,9% 3,9 3,8 -0,04 0,4 2,0 0,2Eurozone CPTFEMU 922,1 16,3% 20,1% 5,0 4,1 0,00 1,9 1,9 -0,2France FRCPXTOB 229,5 4,0% 5,9% 5,4 3,7 0,00 1,3 2,2 -0,2 AAA
Eurozone 1.151,6 20,3% 26,1% 5,1 4,0 -0,01 1,7 2,0 -0,2UK UKRPI 1.470,7 25,9% 24,0% 7,3 7,8 0,04 0,5 3,3 -0,1 AAAJ apan J CPNJ GBI 359,2 6,3% 3,7% 2,9 2,9 0,08 1,0 -0,3 0,4 AASweden SWCPI 138,3 2,4% 2,4% 4,3 3,9 0,01 1,0 2,1 -1,1 AAACanada CACPI 193,2 3,4% 3,2% 8,0 8,1 0,02 1,3 2,4 -0,5 AAA
Rest 2.161,4 38,1% 33,2% 6,5 7,0 0,15 0,7 2,5 -0,1FX (unrealized P/L) 189,1 3,3% 0,8%Bank account 33,9 0,6% 0,0%Cash 223,1 3,9% 0,8%
Total 5.671,4 100% 100% 5,0 4,9 0,10 0,8 2,1 0,0
Eurozone CPTFEMU 922,1 16,3% 20,1% 5,0 4,1 0,00 1,9 1,9 -0,2France FR 261,3 4,6% 7,7% 7,3 4,5 -0,01 1,6 2,1 -0,2 AAAGermany DE 237,5 4,2% 3,7% 2,9 2,6 0,02 0,6 1,7 -0,2 AAAItaly IT 423,4 7,5% 8,7% 4,9 4,4 -0,02 2,7 1,9 -0,2 A+
24-01-2011
5
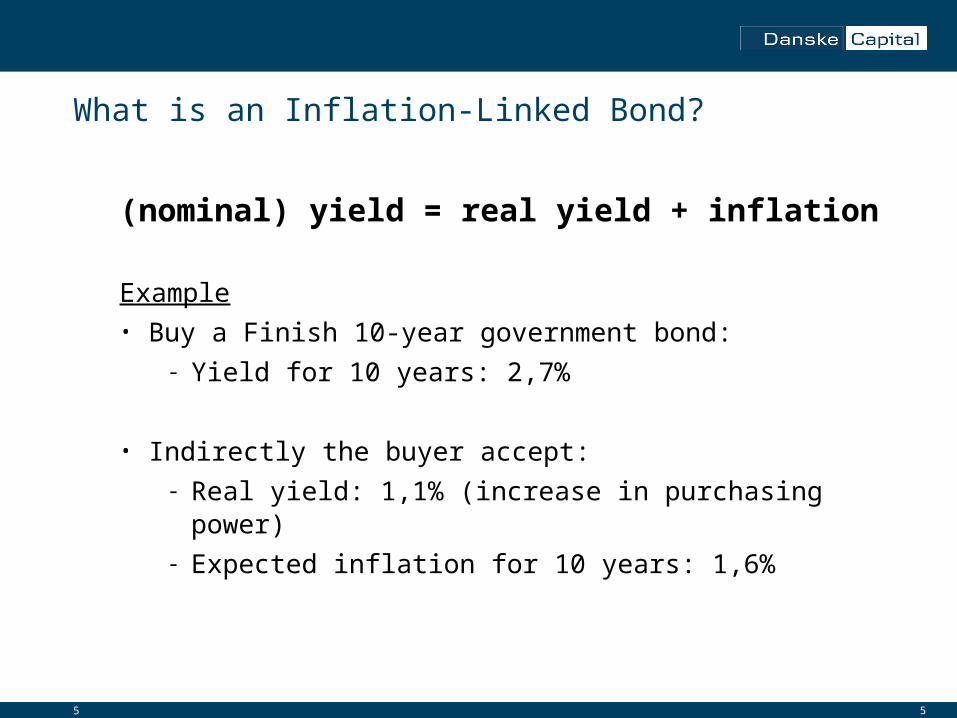
What is an Inflation-Linked Bond?
(nominal) yield = real yield + inflation
Example• Buy a Finish 10-year government bond:
- Yield for 10 years: 2,7%
• Indirectly the buyer accept:- Real yield: 1,1% (increase in purchasing power)- Expected inflation for 10 years: 1,6%
5
6
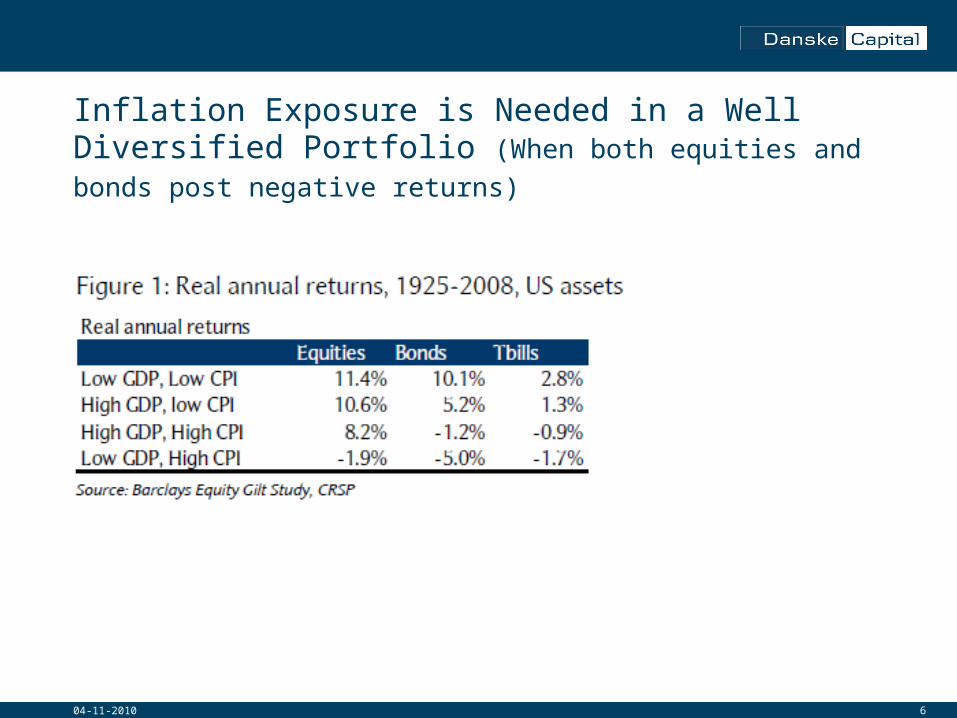
Inflation Exposure is Needed in a Well Diversified Portfolio (When both equities and bonds post negative returns)
04-11-2010
7
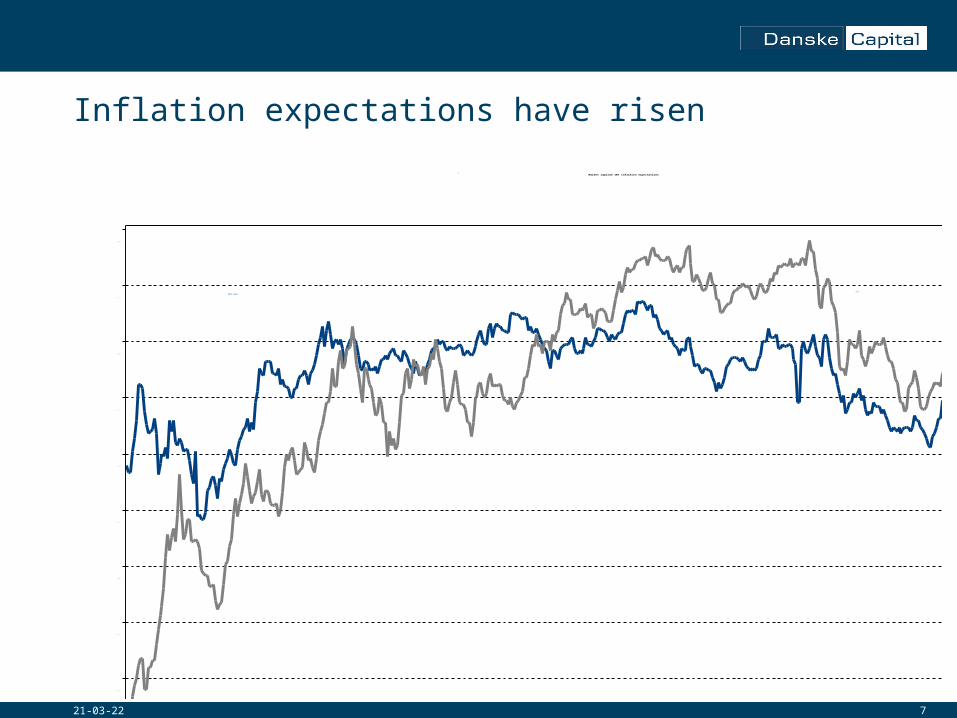
Inflation expectations have risen
18-04-23
Market implied 10Y inflation expectations
jan
09
mar maj jul sep nov jan
10
mar maj jul sep nov jan
11
Perc
ent
0,00
0,25
0,50
0,75
1,00
1,25
1,50
1,75
2,00
2,25
2,50
Euro area
USA
8
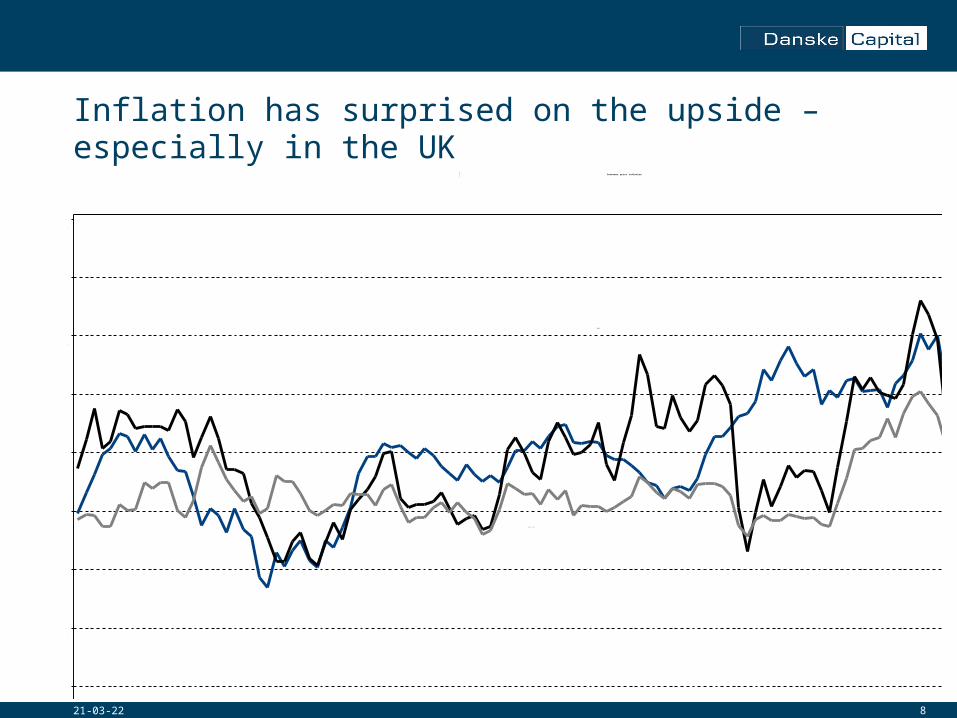
Inflation has surprised on the upside – especially in the UK
18-04-23
Consumer price inflation
00 01 02 03 04 05 06 07 08 09 10 110
1
2
3
4
5
6
7
8
9
10
Perc
enta
ge c
hang
e, Y
oY
-3
-2
-1
0
1
2
3
4
5
6
7
USA
Euro zone
UK (RPI)
918-04-23
1018-04-23
USA: Unemployment and wages
80 82 84 86 88 90 92 94 96 98 00 02 04 06 08 10
Perc
ent
1
2
3
4
5
6
7
8
9
10
11
Average hourly earnings, YoY
Unemployment rate

1118-04-23
As Share of GDP
USA: Federal Reserve Total Assets
90 91 92 93 94 95 96 97 98 99 00 01 02 03 04 05 06 07 08 09 10
Perc
enta
ge
5
6
7
8
9
10
11
12
13
14
15
16
17
Perc
enta
ge
5
6
7
8
9
10
11
12
13
14
15
16
17
1218-04-23
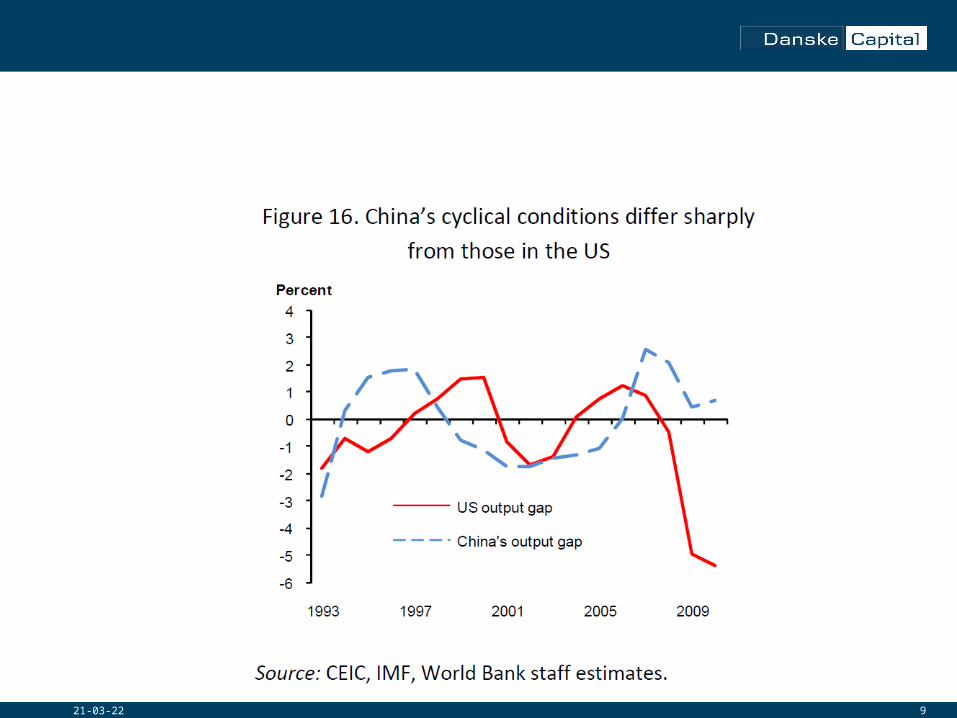
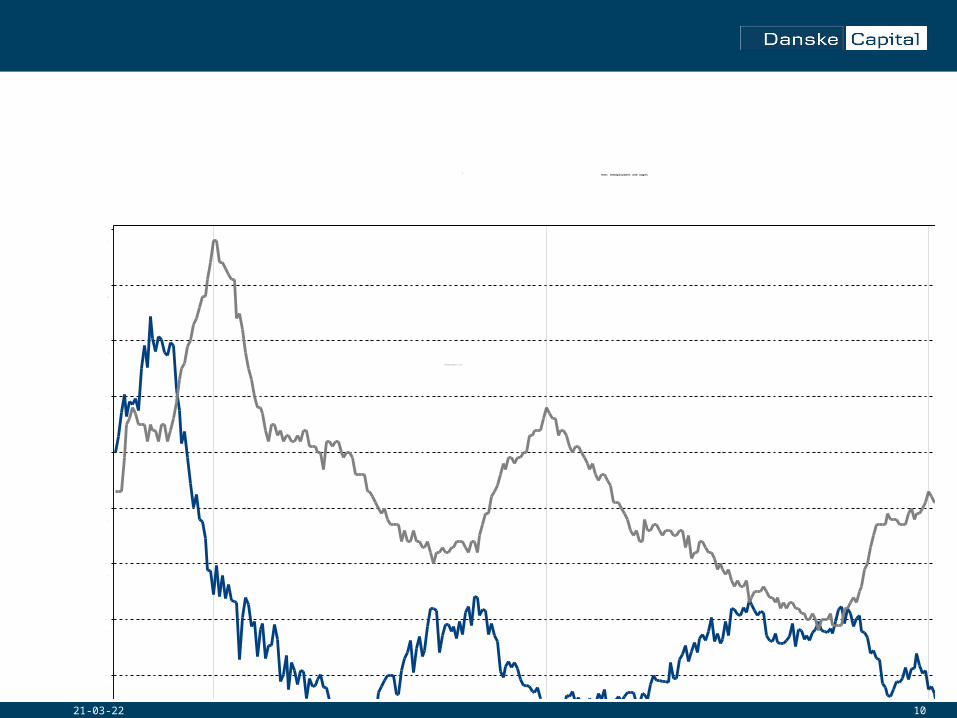
Absolute annual change in USD GDP (at market exchange rates)
Global: USA vs China
00 01 02 03 04 05 06 07 08 09 10
USD
(th
ousa
nd b
illio
ns)
-0,2
-0,1
0,0
0,1
0,2
0,3
0,4
0,5
0,6
0,7
0,8
0,9
1,0
USD
(th
ousa
nd b
illio
ns)
-0,2
-0,1
0,0
0,1
0,2
0,3
0,4
0,5
0,6
0,7
0,8
0,9
1,0
USA
China
1318-04-23
1418-04-23
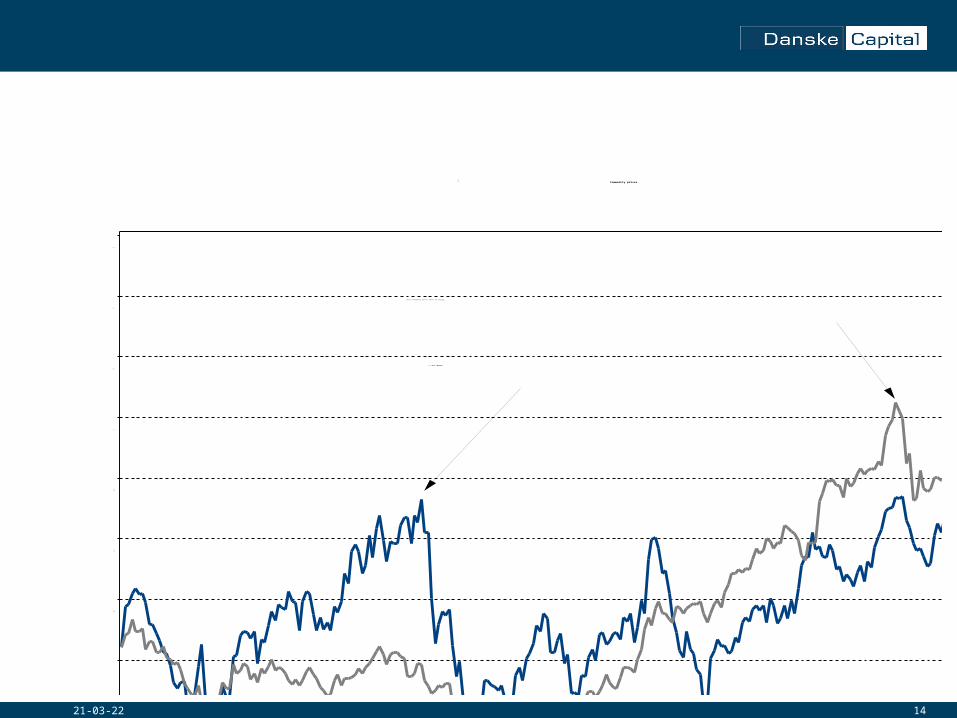
Commodity prices
jan
10
feb mar apr maj jun jul aug sep okt nov dec jan
11
Inde
x
300
325
350
375
400
425
450
475
500
525
USD/
Barre
l
65
70
75
80
85
90
95
100
105
110
<< Oil (Brent)
GSCI Commodity price index ex energy
1515
Why are Global Inflation-Linked Bonds Attractive?
•Basic component in a well diversified portfolio- Different by nature from nominal bonds and equities- Diversify equities better than nominal bonds
• Inflation risk is currently underestimated in the market
- Plenty of slack in the Western world, inflationary pressures building in EM… implications for commodities, end of cheap labour?
- Central banks currently give inflation second priority to growth due to the global credit crisis
- Political interest in inflation “on the high side” has increased with increased issuance in government bonds and growth in public debt – and increased number of technically insolvent households
16
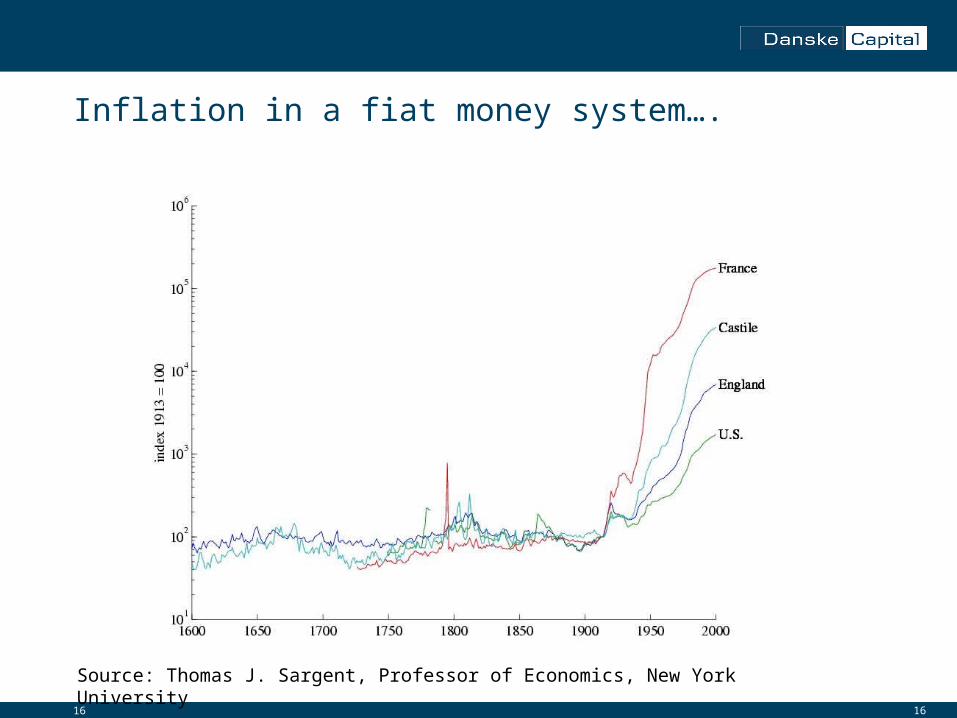
Inflation in a fiat money system….
16
Source: Thomas J. Sargent, Professor of Economics, New York University
1718-04-23
Disclaimer
This publication has been prepared to be read exclusively in conjunction with the oral
presentation provided by Danske Capital. Readers should not replace their own judgement with
any information or opinions herein and should contact their investment advisor whenever
necessary. Any information or opinions contained herein are not intended for distribution to or
use by any person in any jurisdiction or country where such distribution or use would be unlaw-
ful and, specifically, are not intended for distribution to or use by any "US Person" within the
meaning of the United States Securities Act of 1934, nor any personal customer in the United
Kingdom.