Retrospective Cohort Study of Phototherapy and Childhood Cancer ...
12
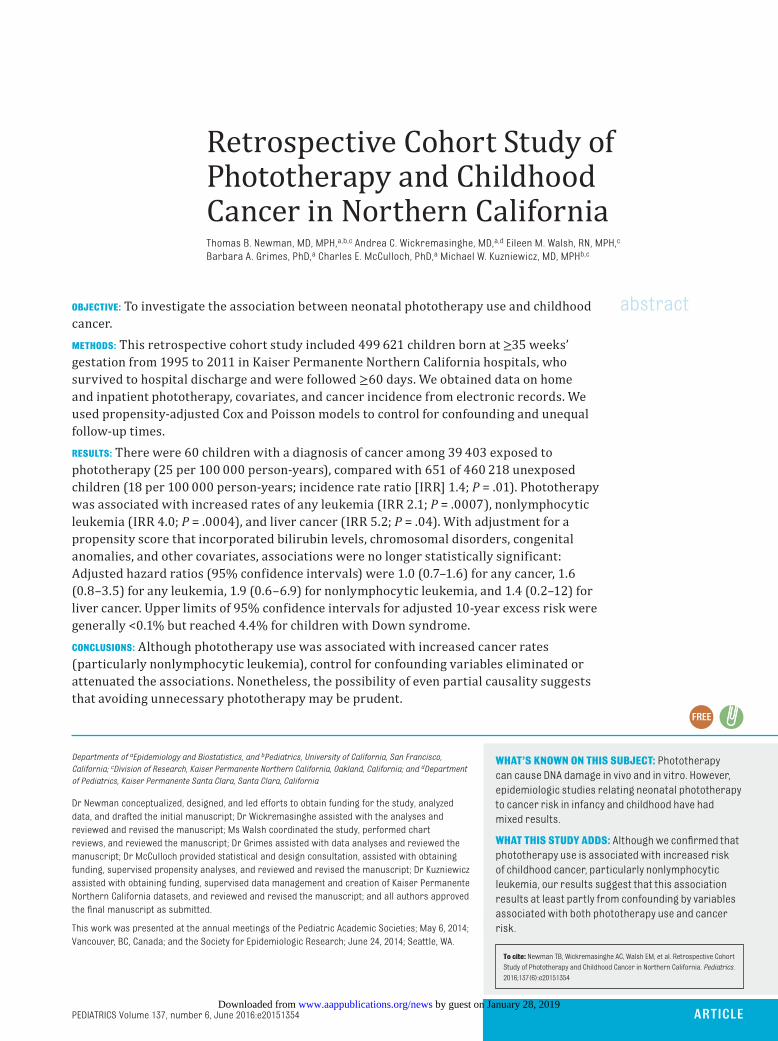
ARTICLE PEDIATRICS Volume 137, number 6, June 2016:e20151354 Retrospective Cohort Study of Phototherapy and Childhood Cancer in Northern California Thomas B. Newman, MD, MPH, a,b,c Andrea C. Wickremasinghe, MD, a,d Eileen M. Walsh, RN, MPH, c Barbara A. Grimes, PhD, a Charles E. McCulloch, PhD, a Michael W. Kuzniewicz, MD, MPH b,c abstract OBJECTIVE: To investigate the association between neonatal phototherapy use and childhood cancer. METHODS: This retrospective cohort study included 499 621 children born at ≥35 weeks’ gestation from 1995 to 2011 in Kaiser Permanente Northern California hospitals, who survived to hospital discharge and were followed ≥60 days. We obtained data on home and inpatient phototherapy, covariates, and cancer incidence from electronic records. We used propensity-adjusted Cox and Poisson models to control for confounding and unequal follow-up times. RESULTS: There were 60 children with a diagnosis of cancer among 39 403 exposed to phototherapy (25 per 100 000 person-years), compared with 651 of 460 218 unexposed children (18 per 100 000 person-years; incidence rate ratio [IRR] 1.4; P = .01). Phototherapy was associated with increased rates of any leukemia (IRR 2.1; P = .0007), nonlymphocytic leukemia (IRR 4.0; P = .0004), and liver cancer (IRR 5.2; P = .04). With adjustment for a propensity score that incorporated bilirubin levels, chromosomal disorders, congenital anomalies, and other covariates, associations were no longer statistically significant: Adjusted hazard ratios (95% confidence intervals) were 1.0 (0.7–1.6) for any cancer, 1.6 (0.8–3.5) for any leukemia, 1.9 (0.6–6.9) for nonlymphocytic leukemia, and 1.4 (0.2–12) for liver cancer. Upper limits of 95% confidence intervals for adjusted 10-year excess risk were generally <0.1% but reached 4.4% for children with Down syndrome. CONCLUSIONS: Although phototherapy use was associated with increased cancer rates (particularly nonlymphocytic leukemia), control for confounding variables eliminated or attenuated the associations. Nonetheless, the possibility of even partial causality suggests that avoiding unnecessary phototherapy may be prudent. Departments of a Epidemiology and Biostatistics, and b Pediatrics, University of California, San Francisco, California; c Division of Research, Kaiser Permanente Northern California, Oakland, California; and d Department of Pediatrics, Kaiser Permanente Santa Clara, Santa Clara, California Dr Newman conceptualized, designed, and led efforts to obtain funding for the study, analyzed data, and drafted the initial manuscript; Dr Wickremasinghe assisted with the analyses and reviewed and revised the manuscript; Ms Walsh coordinated the study, performed chart reviews, and reviewed the manuscript; Dr Grimes assisted with data analyses and reviewed the manuscript; Dr McCulloch provided statistical and design consultation, assisted with obtaining funding, supervised propensity analyses, and reviewed and revised the manuscript; Dr Kuzniewicz assisted with obtaining funding, supervised data management and creation of Kaiser Permanente Northern California datasets, and reviewed and revised the manuscript; and all authors approved the final manuscript as submitted. This work was presented at the annual meetings of the Pediatric Academic Societies; May 6, 2014; Vancouver, BC, Canada; and the Society for Epidemiologic Research; June 24, 2014; Seattle, WA. To cite: Newman TB, Wickremasinghe AC, Walsh EM, et al. Retrospective Cohort Study of Phototherapy and Childhood Cancer in Northern California. Pediatrics. 2016;137(6):e20151354 WHAT’S KNOWN ON THIS SUBJECT: Phototherapy can cause DNA damage in vivo and in vitro. However, epidemiologic studies relating neonatal phototherapy to cancer risk in infancy and childhood have had mixed results. WHAT THIS STUDY ADDS: Although we confirmed that phototherapy use is associated with increased risk of childhood cancer, particularly nonlymphocytic leukemia, our results suggest that this association results at least partly from confounding by variables associated with both phototherapy use and cancer risk. by guest on January 28, 2019 www.aappublications.org/news Downloaded from
Transcript of Retrospective Cohort Study of Phototherapy and Childhood Cancer ...
ARTICLEPEDIATRICS Volume 137 , number 6 , June 2016 :e 20151354
Retrospective Cohort Study of Phototherapy and Childhood Cancer in Northern CaliforniaThomas B. Newman, MD, MPH, a, b, c Andrea C. Wickremasinghe, MD, a, d Eileen M. Walsh, RN, MPH, c Barbara A. Grimes, PhD, a Charles E. McCulloch, PhD, a Michael W. Kuzniewicz, MD, MPHb, c
abstractOBJECTIVE: To investigate the association between neonatal phototherapy use and childhood
cancer.
METHODS: This retrospective cohort study included 499 621 children born at ≥35 weeks’
gestation from 1995 to 2011 in Kaiser Permanente Northern California hospitals, who
survived to hospital discharge and were followed ≥60 days. We obtained data on home
and inpatient phototherapy, covariates, and cancer incidence from electronic records. We
used propensity-adjusted Cox and Poisson models to control for confounding and unequal
follow-up times.
RESULTS: There were 60 children with a diagnosis of cancer among 39 403 exposed to
phototherapy (25 per 100 000 person-years), compared with 651 of 460 218 unexposed
children (18 per 100 000 person-years; incidence rate ratio [IRR] 1.4; P = .01). Phototherapy
was associated with increased rates of any leukemia (IRR 2.1; P = .0007), nonlymphocytic
leukemia (IRR 4.0; P = .0004), and liver cancer (IRR 5.2; P = .04). With adjustment for a
propensity score that incorporated bilirubin levels, chromosomal disorders, congenital
anomalies, and other covariates, associations were no longer statistically significant:
Adjusted hazard ratios (95% confidence intervals) were 1.0 (0.7–1.6) for any cancer, 1.6
(0.8–3.5) for any leukemia, 1.9 (0.6–6.9) for nonlymphocytic leukemia, and 1.4 (0.2–12) for
liver cancer. Upper limits of 95% confidence intervals for adjusted 10-year excess risk were
generally <0.1% but reached 4.4% for children with Down syndrome.
CONCLUSIONS: Although phototherapy use was associated with increased cancer rates
(particularly nonlymphocytic leukemia), control for confounding variables eliminated or
attenuated the associations. Nonetheless, the possibility of even partial causality suggests
that avoiding unnecessary phototherapy may be prudent.
Departments of aEpidemiology and Biostatistics, and bPediatrics, University of California, San Francisco,
California; cDivision of Research, Kaiser Permanente Northern California, Oakland, California; and dDepartment
of Pediatrics, Kaiser Permanente Santa Clara, Santa Clara, California
Dr Newman conceptualized, designed, and led efforts to obtain funding for the study, analyzed
data, and drafted the initial manuscript; Dr Wickremasinghe assisted with the analyses and
reviewed and revised the manuscript; Ms Walsh coordinated the study, performed chart
reviews, and reviewed the manuscript; Dr Grimes assisted with data analyses and reviewed the
manuscript; Dr McCulloch provided statistical and design consultation, assisted with obtaining
funding, supervised propensity analyses, and reviewed and revised the manuscript; Dr Kuzniewicz
assisted with obtaining funding, supervised data management and creation of Kaiser Permanente
Northern California datasets, and reviewed and revised the manuscript; and all authors approved
the fi nal manuscript as submitted.
This work was presented at the annual meetings of the Pediatric Academic Societies; May 6, 2014;
Vancouver, BC, Canada; and the Society for Epidemiologic Research; June 24, 2014; Seattle, WA.
To cite: Newman TB, Wickremasinghe AC, Walsh EM, et al. Retrospective Cohort
Study of Phototherapy and Childhood Cancer in Northern California. Pediatrics.
2016;137(6):e20151354
WHAT’S KNOWN ON THIS SUBJECT: Phototherapy
can cause DNA damage in vivo and in vitro. However,
epidemiologic studies relating neonatal phototherapy
to cancer risk in infancy and childhood have had
mixed results.
WHAT THIS STUDY ADDS: Although we confi rmed that
phototherapy use is associated with increased risk
of childhood cancer, particularly nonlymphocytic
leukemia, our results suggest that this association
results at least partly from confounding by variables
associated with both phototherapy use and cancer
risk.
by guest on January 28, 2019www.aappublications.org/newsDownloaded from
NEWMAN et al
Phototherapy is widely used to treat
hyperbilirubinemia in newborns.
Although it is generally regarded as
safe, 1, 2 the number needed to treat
to prevent 1 infant from reaching
exchange transfusion levels may
be >1000, 3 and very few of those
reaching exchange levels have
adverse effects.4–8 Thus, even rare
adverse effects of phototherapy
could warrant changes in treatment
thresholds.9
Concerns about a possible
carcinogenic effect of neonatal
phototherapy date back to the 1970s,
when Speck and Rosenkranz10
reported positive results on the
Ames test for mutagenicity of blue
light in salmonellae. More recent
studies have confirmed DNA damage
in vivo from phototherapy.11–14
Epidemiologic studies have
focused on leukemia. Three studies
from northern Europe found no
association.15–17 In contrast, a
Washington State study18 reported an
adjusted odds ratio (OR) of 2.5 (95%
confidence interval [CI], 1.0–6.2) for
all childhood leukemias (excluding
infants with Down syndrome), and
a Swedish matched case–control
study19 reported an OR of 7.5 (95%
CI, 1.8–31.9) for myelogenous
leukemia. After infants with Down
syndrome were excluded from the
Swedish study, the association was
no longer statistically significant (OR
4.3; 95% CI, 0.9–21.9).
In the California Late Impact of
Phototherapy Study, which used
linked birth certificates and discharge
abstracts, Wickremasinghe et al20
reported statistically significant
propensity-adjusted ORs for any
cancer, myeloid leukemia, kidney,
and other cancer diagnoses before
age 1 year. A limitation of that study
is that follow-up was only 1 year,
raising the question of whether the
increased risk persists. A limitation
shared with previous studies is lack
of data on bilirubin levels, limiting
ability to control for confounding by
indication. This report from the Late
Impact of Getting Hyperbilirubinemia
or Phototherapy study investigates
the associations between neonatal
phototherapy use and cancer in a
large Kaiser Permanente Northern
California (KPNC) cohort, with
up to 19 years of follow-up and
measurements of bilirubin levels and
other potential confounding variables
from the electronic medical record.
METHODS
Study Design, Subjects, and Approvals
The Late Impact of Getting
Hyperbilirubinemia or Phototherapy
study is a retrospective cohort study
of 525 409 children born at ≥35
weeks’ gestation from January 1,
1995 through December 31, 2011
at 15 KPNC hospitals. We excluded
344 infants (0.07%) who died during
their birth hospitalization, 891
(0.17%) whose birth hospitalization
ended with a transfer out of the KPNC
system, 24 532 (4.7%) who were
followed <60 days, and 21 (<0.01%)
with a first cancer diagnosis before
60 days, leaving a cohort of 499 621
infants.
The institutional review boards for
the protection of human subjects
at the University of California, San
Francisco and KPNC approved the
study.
Phototherapy
For children born before
implementation of the Epic (Verona,
WI) electronic medical record (80%
of subjects), we identified those who
received inpatient phototherapy
from procedure codes (99.82 and
99.83) for admissions before age
30 days. For children born after
implementation of Epic, we classified
infants as having received inpatient
phototherapy if they had either a
phototherapy nursing flow sheet or
both a procedure code and an order
for phototherapy. We ascertained
home phototherapy from the KPNC
durable medical equipment database.
Because we did not have reliable
data on the duration or intensity
of phototherapy, the primary
prespecified predictor variable for
all analyses was a dichotomous
variable for any phototherapy,
whether provided in the hospital,
at home, or both. To investigate a
dose-–response relation we created
a phototherapy dosage variable with
values of 0 for no phototherapy, 1
for home phototherapy only, 2 for
phototherapy during 1 admission,
and 3 for phototherapy during 2 or
more admissions.
Covariates
We obtained covariates from
electronic records, including gender,
race and ethnicity, maternal age,
delivery mode, multiple birth, birth
weight, gestational age, Apgar
scores, and total serum bilirubin
(TSB) levels. To optimize control
for confounding, we assessed each
TSB level in relation to the 2004
American Academy of Pediatrics
(AAP) phototherapy guidelines21
by using direct antiglobulin test
and gestational age to determine
the neurotoxicity risk group,
as previously described.3 We
determined whether each subject
had ≥1 TSB level between −3 and
+4.9 mg/dL from the appropriate
AAP phototherapy threshold and, if
so, created a variable equal to the
difference (in 1-mg/dL categories)
between the first such TSB level and
the phototherapy threshold.
We identified subjects with genetic
disorders and congenital anomalies
based on International Classification
of Diseases, Ninth Revision (ICD-9)
codes from inpatient and outpatient
encounters; we required ≥2
encounters with the same ICD-9
code to reduce false-positive
diagnoses due to coding errors.
We created dichotomous variables
for Down syndrome (758.0), other
chromosomal abnormalities (758.1–
758.9), and congenital anomalies
diagnosed at <15 days (740–759.9
2 by guest on January 28, 2019www.aappublications.org/newsDownloaded from
PEDIATRICS Volume 137 , number 6 , June 2016
except 743.65 [nasolacrimal passage
anomaly]).
Follow-up Time
For purposes of quantifying incidence
rates and use of proportional hazards
models, follow-up began at age 60
days and ended at death, the date of
the first diagnosis of cancer, or the
last follow-up date, defined as the
last day of the last calendar month
of coverage by the KPNC health plan
or the last encounter date through
March 11, 2014, whichever came
later.
Outcome Variables
We identified cancer cases from
the KPNC tumor registry and the
KPNC Virtual Data Warehouse,
which captures diagnoses from all
inpatient and outpatient encounters.
For children not in the tumor
registry, we required ≥2 encounters
with diagnoses of cancer (ICD-9
codes 140–209.36) or carcinoma
in situ (230–234.9). We confirmed
diagnoses of leukemia, kidney, bone,
and liver cancer by medical record
review.
We included only the first diagnosis
of cancer in each child. We grouped
cancers into the following categories:
lymphocytic leukemia, myelocytic
leukemia, nonlymphocytic leukemia,
other leukemia, brain and nervous
system, liver, kidney, bone, skin, and
other cancers. We excluded subjects
whose first diagnosis of cancer was
made before 60 days, to reduce the
possibility of finding associations due
to preexisting cancer.
Statistical Analysis
We created datasets by using SAS
9.4 (SAS Institute, Inc, Cary, NC), and
performed statistical analyses by
using Stata 13 (Stata Corp, College
Station, TX) and SAS 9.4.
We compared children who did and
did not receive any phototherapy
by using descriptive statistics with
χ2 and analysis of variance tests, as
appropriate. We calculated incidence
rates by dividing the number of
cancer cases by person-years of
follow-up. To compare KPNC cancer
incidence rates with California
statewide data (obtained from
CDC Wonder22), we standardized
California rates to the age
distribution of follow-up in the KPNC
cohort used for this study.
We investigated which variables
were independently associated with
each cancer type by using backward
stepwise Cox models, keeping terms
with P < .1, and forcing phototherapy
into all models. Candidate covariates,
selected based on associations with
childhood cancer in previous studies,
were gender, race or ethnicity (in
5 categories), birth weight (in 6
categories), maternal age ≥35 years,
multiple birth, Down syndrome,
other chromosomal abnormalities,
congenital anomalies, and 5-minute
Apgar score <7. In addition, to
investigate confounding by indication
we included candidate predictors for
the AAP risk group (low, medium,
and high), 21 early jaundice (defined
as a TSB within 3 mg/dL of the
AAP phototherapy threshold at
<24 hours), and a dichotomous
variable for ever exceeding the AAP
phototherapy threshold. We did not
include the maximum TSB level as a
candidate predictor because it could
be affected by phototherapy and thus
act as a possible mediator or collider
(see directed acyclic graph in the
Supplemental Fig 4).
Propensity-adjusted analyses
control for measured confounding
variables by creating a model for
the probability of exposure (in
this case, phototherapy) and then
controlling for that probability.
When the exposure is more common
than the outcome, this allows control
for more possible confounding
variables.
We created 2 propensity models
for our primary predictor (any
phototherapy). Our restricted model
(the prespecified primary analysis)
included only subjects with ≥1 TSB
level between −3 and +4.9 mg/
dL from the AAP phototherapy
threshold. We included indicator
variables for the difference between
the first such TSB level and the AAP
threshold in 1-mg/dL intervals
(eg, −3 to −2.1 mg/dL) and the age
(in days) at which it occurred, as
3
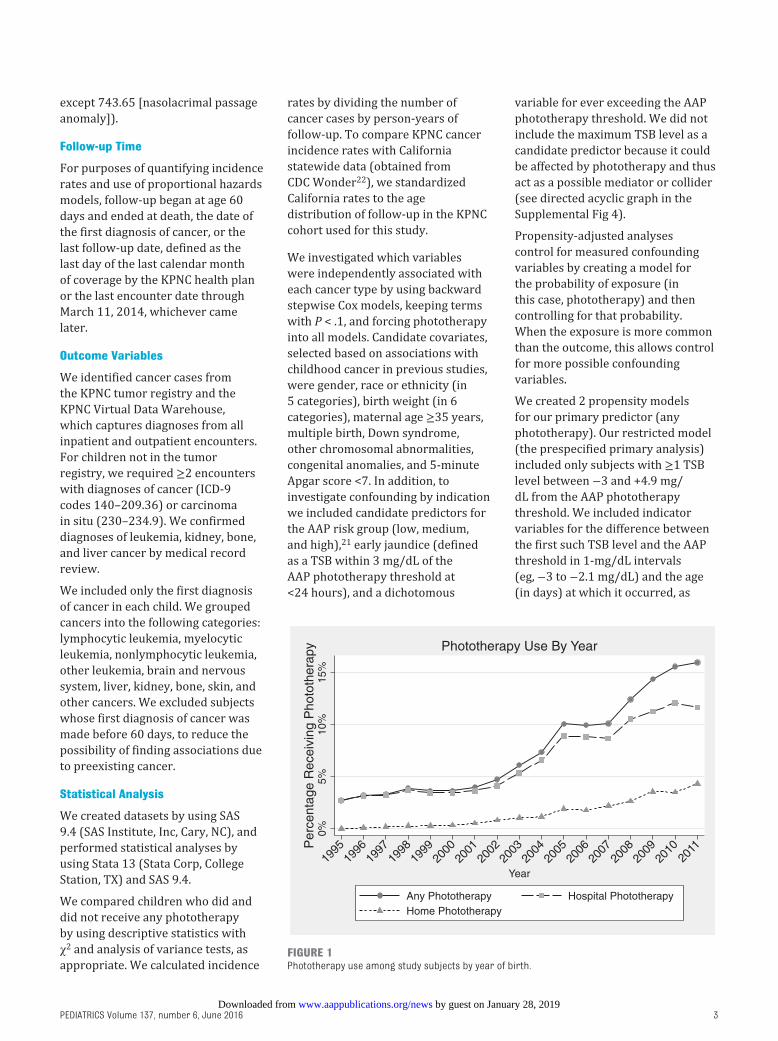
FIGURE 1Phototherapy use among study subjects by year of birth.
by guest on January 28, 2019www.aappublications.org/newsDownloaded from
NEWMAN et al
explained in our previous studies.3, 23
This restricted model has the
advantage that it includes only
infants in whom the probability of
receiving phototherapy is not close to
0 or 1, a requirement for validity of
propensity-adjusted analyses.24 Our
inclusive model had the advantage
that it included all subjects. It used
the same bilirubin variables as the
stepwise Cox models described
earlier.
To create these propensity scores,
we used forward stepwise logistic
regression models with P to enter
<0.05 and P to remove >0.05. Based
on previous research, we forced the
following variables into propensity
models: gender, gestational age,
birth weight, Down syndrome,
other chromosomal abnormalities,
congenital anomalies, and 5-minute
Apgar score <7. Additional candidate
predictors included those previously
listed for backward stepwise
models for cancer as well as hospital
and year of birth and all 2-way
interactions. (The computational
intensity of including all possible
2-way interactions necessitated
forward stepwise models.) Our final
propensity models were selected
based on negligible improvement
(<0.001) in a cross-validated
area under the receiver operating
characteristic curve. Propensity
scores were entered in multivariate
Cox models as either quintile
indicators or restricted cubic splines.
We created the propensity score
for ≥2 phototherapy admissions by
using the bilirubin variables from
the restricted model, gestational
age, delivery mode, and variables
significant in any of the stepwise Cox
models described earlier.
The Cox model provides hazard
ratios (HRs) but not estimates
of absolute risk. To estimate
phototherapy-associated absolute
risk increases and their 95% CIs,
we used Poisson models adjusting
for the restricted model propensity
score. Because the baseline risk in
children with Down syndrome is
so much higher than in the general
population, we created these models
and estimated marginal 10-year risk
differences and 95% CIs separately
in children with and without Down
syndrome. We accounted for
clustering by hospital by using robust
standard errors in all analyses.
RESULTS
Phototherapy Exposure and Description of Study Subjects
Use of phototherapy increased during
the course of this study, from 2.7% in
1995 to 15.9% in 2011 (Fig 1). Most
infants received phototherapy in the
hospital, during the birth admission
only (N = 23 284), a readmission only
(N = 10 498), or both (N = 854); only
5003 received phototherapy at home
only. As expected, infants exposed to
phototherapy had more risk factors
for hyperbilirubinemia (Table 1).
Exposed infants were also much
more likely to have Down syndrome,
another chromosomal disorder, or a
congenital anomaly.
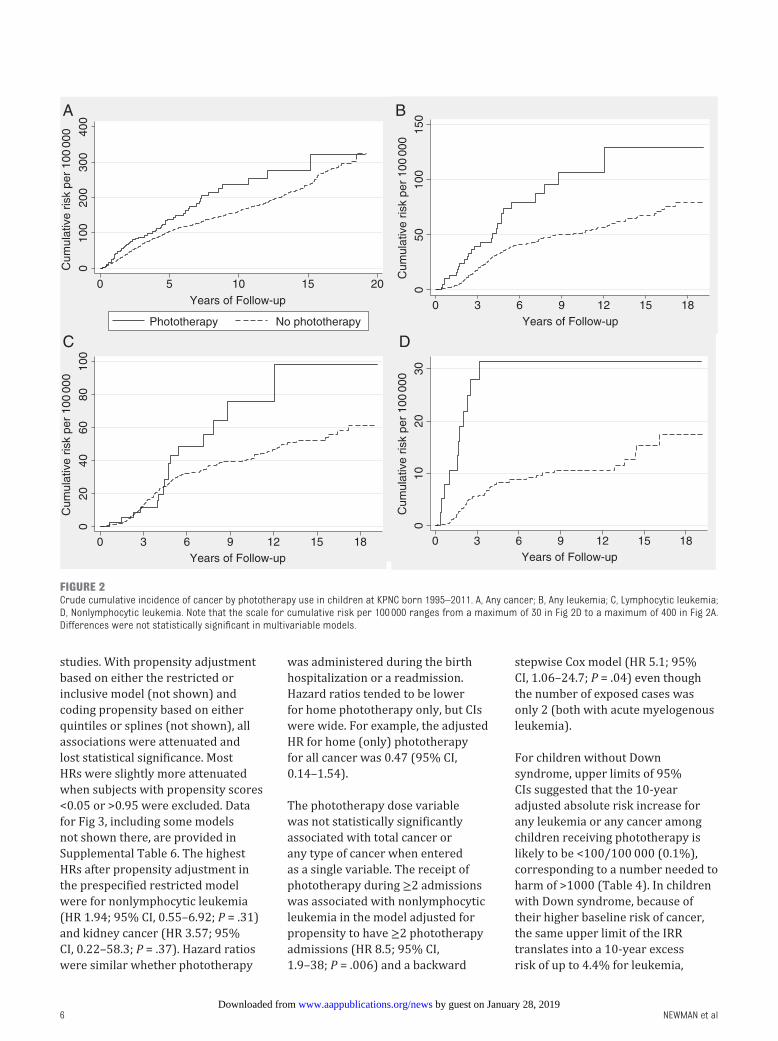
Crude Cancer Incidence Rates
Because phototherapy use increased
during the study period, mean (±SD)
follow-up time was shorter in infants
who had received phototherapy
(6.2 ± 4.3 years) than in those who
had not (8.3 ± 5.2 years). A total of 711
children were diagnosed with cancer
4
TABLE 1 Demographic and Clinical Characteristics of Infants Exposed to Phototherapy and 2 Groups
of Unexposed Infants
Phototherapy No Phototherapy
≥1 TSB −3 to
4.9 mg/dL From
Phototherapy
Threshold
No TSB −3 to 4.9 mg/
dL From Phototherapy
Threshold
Number of infants 39 403 62 592 397 626
Year of birth ≥2003, % 79.2 66.1 50.8
Male, % 56.0 53.8 50.2
Race, %
White 34.0 38.7 43.7
Black 4.9 5.1 8.5
Asian 30.4 24.8 16.6
Hispanic 23.6 24.2 24.2
Other or unknown 7.2 7.1 7.0
Down syndrome, % 0.53 0.21 0.05
Other chromosomal anomaly, % 0.3 0.2 0.1
Congenital anomaly, % 3.8 2.4 1.8
Birth wt, mean ± SD, g 3260 ± 589 3354 ± 526 3467 ± 493
Birth wt ≥4500 g, % 1.9 1.9 2.2
Gestational age, mean ± SD, wk 38.2 ± 1.7 38.6 ± 1.6 39.3 ± 1.3
5-minute Apgar <7, % 1.6 0.8 0.8
Maximum TSB, mean ± SD, mg/dL 16.5 ± 3.8 15.2 ± 3.3 N/A
Maximum TSB, mg/dL, %
Not done or not found 0.4 0.0 61.7
<10 3.2 8.3 24.3
10–14.9 29.5 33.5 11.9
15–19.9 50.1 53.4 2.2
20–24.9 15.7 4.7 0.0
≥25 1.2 0.1 0.0
Direct antiglobulin test result, %
Positive 11 6 1
Negative 58 50 31
Not done 31 43 68
Follow-up, y 6.2 ± 4.3 7.3 ± 4.9 8.4 ± 5.3
P values comparing the 3 phototherapy exposure groups with χ2 or ANOVA tests were <.001 for all variables in the table.
N/A, not applicable.
by guest on January 28, 2019www.aappublications.org/newsDownloaded from
PEDIATRICS Volume 137 , number 6 , June 2016
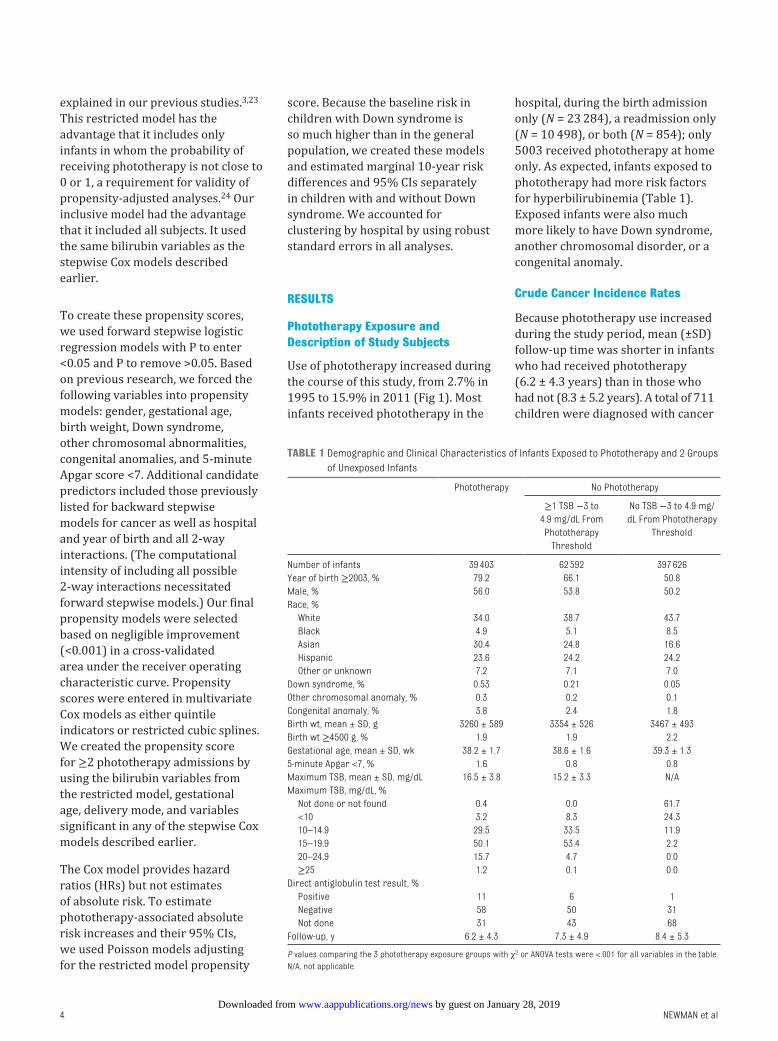
after 60 days of age, a rate of 17.6 per
100 000 person-years. Total and site-
specific cancer incidence rates were
similar to California rates (Table 2).22
There were 60 cancer cases (24.6
per 100 000 person-years) among
children exposed to phototherapy,
compared with 651 cases (17.2
per 100 000 person-years) among
unexposed children. Crude incidence
rate ratios (IRRs) were elevated,
with P < .05 for any cancer, any
leukemia, myelocytic leukemia,
other leukemia, and liver cancer,
with slightly higher P values (.05 <
P < .10) for lymphocytic leukemia
and kidney cancer (Table 2). There
was no evidence that any of these
IRRs varied by year of birth (in three
5- to 6-year groups). Although total
cancer and total leukemia showed
approximately constant hazards
in both exposed and unexposed
infants, the excess of nonlymphocytic
leukemia occurred early (<3 years),
whereas the excess lymphocytic
leukemia cases began later (Fig 2).
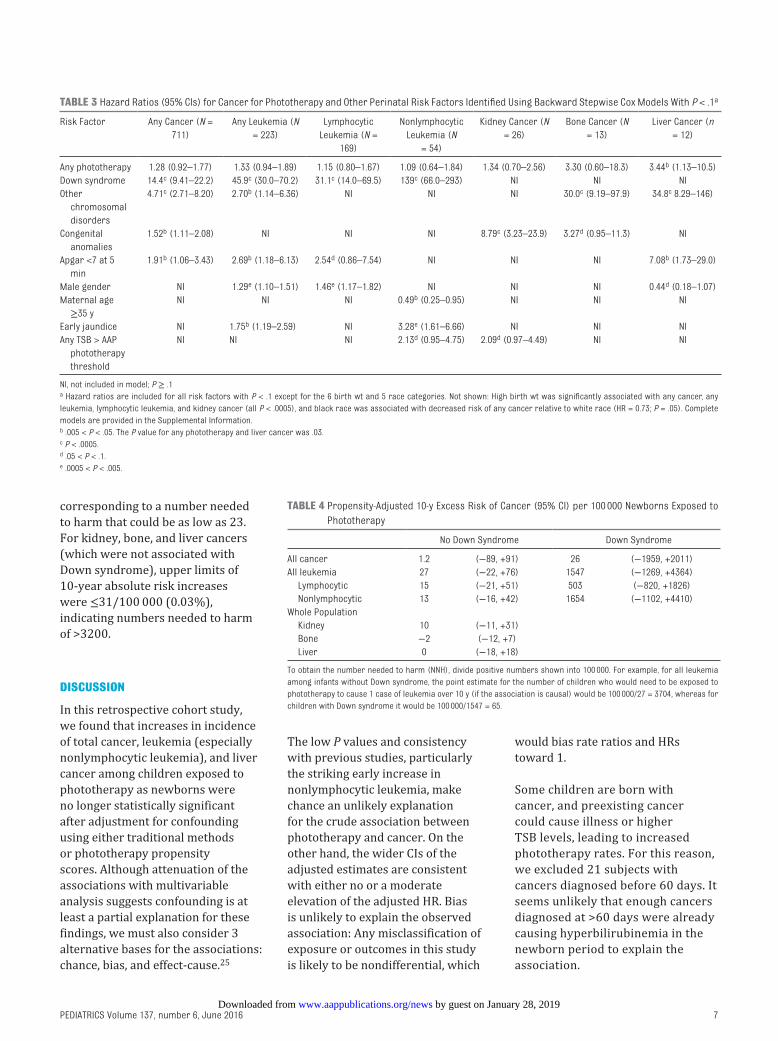
Multivariate Models
Backward stepwise Cox regression
models yielded lower HRs and
higher P values than unadjusted
analyses (Table 3). Variables
related to hyperbilirubinemia were
associated with nonlymphocytic
leukemia, any leukemia, and kidney
cancer, indicating the potential for
confounding by indication. Down
syndrome was a powerful risk
factor for any cancer (HR 14.4) and
for leukemia (HR 45.9) but not for
kidney, bone, or liver cancer. Other
risk factors for cancer included
high birth weight, 5-minute Apgar
<7, other chromosomal disorders,
and congenital anomalies. The full
adjusted Cox models for all cancer
types are provided in Supplemental
Table 5.
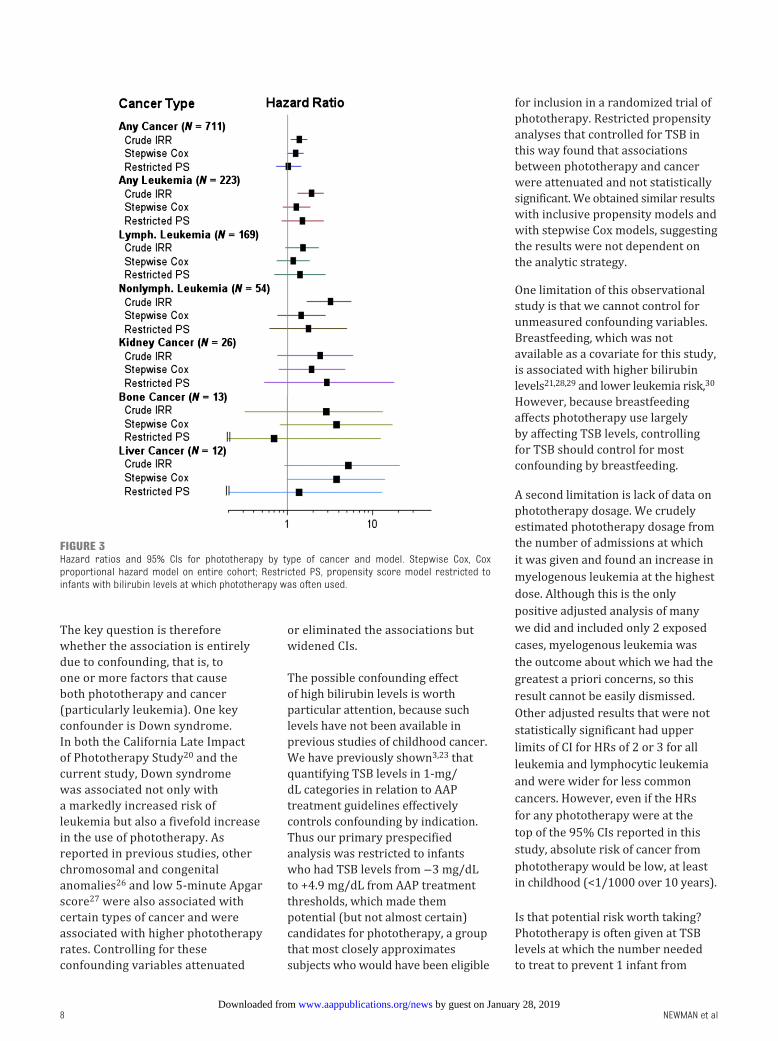
Crude IRRs and adjusted HRs
with 95% CIs are shown in Fig
3 for cancers at sites associated
with phototherapy in this or other
5
TABL
E 2
Inci
den
ce o
f C
ance
r D
iagn
osed
at
≥ 60
d p
er 1
00 0
00 P
erso
n-Y
ears
by
Use
of
Ph
otot
her
apy
in K
PN
C, C
omp
ared
Wit
h C
alif
orn
ia S
tate
wid
e R
ates
Tota
l Cas
esTo
tal K
PN
C IR
CA
IRP
hot
oth
erap
yN
o P
hot
oth
erap
yC
rud
e IR
R (
95%
CI)
Pa
Cas
esIR
Cas
esIR
Any
can
cer
711
17.6
17.7
6025
.265
117
.51.
4 (1
.1–
1.9)
.010
Any
leu
kem
ia22
35.
56.
527
11.4
196
5.3
2.1
(1.4
–3.
2).0
007
Ly
mp
hoc
ytic
169
4.2
5.1
166.
715
34.
11.
6 (0
.9–
2.7)
.08
N
only
mp
hoc
ytic
leu
kem
ia
541.
31.
411
4.6
431.
24.
0 (1
.8–
7.8)
.000
4
Mye
locy
tic
360.
91.
07
2.9
290.
83.
7 (1
.4–
8.7)
.006
Oth
er
non
lym
ph
ocyt
ic
leu
kem
ia
180.
40.
44
1.7
140.
44.
4 (1
.1–
14)
.02
Bra
in a
nd
ner
vou
s ti
ssu
e15
23.
84.
66
2.5
146
3.9
0.6
(0.2
– 1
.4)
.28
Ski
n29
0.7
N/A
20.
827
0.7
1.2
(0.1
–4.
6).7
9
Kid
ney
260.
61.
04
1.7
220.
62.
8 (0
.7–
8.3)
.09
Bon
e13
0.3
0.5
20.
811
0.3
2.8
(0.3
– 1
3).2
2
Live
r12
0.3
0.4
31.
39
0.2
5.2
(0.9
– 2
1).0
4
All o
ther
s25
66.
3N
/A16
6.6
240
6.6
1.0
(0.6
, 1.7
).8
6
CA,
Cal
ifor
nia
; IR
, in
cid
ence
rat
e p
er 1
00 0
00 p
erso
n-y
ears
; N/A
, not
ap
plic
able
, bec
ause
CD
C W
ond
er d
oes
not
incl
ud
e sk
in c
ance
rs.
a B
y ex
act,
2-t
aile
d t
est.
by guest on January 28, 2019www.aappublications.org/newsDownloaded from
NEWMAN et al
studies. With propensity adjustment
based on either the restricted or
inclusive model (not shown) and
coding propensity based on either
quintiles or splines (not shown), all
associations were attenuated and
lost statistical significance. Most
HRs were slightly more attenuated
when subjects with propensity scores
<0.05 or >0.95 were excluded. Data
for Fig 3, including some models
not shown there, are provided in
Supplemental Table 6. The highest
HRs after propensity adjustment in
the prespecified restricted model
were for nonlymphocytic leukemia
(HR 1.94; 95% CI, 0.55–6.92; P = .31)
and kidney cancer (HR 3.57; 95%
CI, 0.22–58.3; P = .37). Hazard ratios
were similar whether phototherapy
was administered during the birth
hospitalization or a readmission.
Hazard ratios tended to be lower
for home phototherapy only, but CIs
were wide. For example, the adjusted
HR for home (only) phototherapy
for all cancer was 0.47 (95% CI,
0.14–1.54).
The phototherapy dose variable
was not statistically significantly
associated with total cancer or
any type of cancer when entered
as a single variable. The receipt of
phototherapy during ≥2 admissions
was associated with nonlymphocytic
leukemia in the model adjusted for
propensity to have ≥2 phototherapy
admissions (HR 8.5; 95% CI,
1.9–38; P = .006) and a backward
stepwise Cox model (HR 5.1; 95%
CI, 1.06–24.7; P = .04) even though
the number of exposed cases was
only 2 (both with acute myelogenous
leukemia).
For children without Down
syndrome, upper limits of 95%
CIs suggested that the 10-year
adjusted absolute risk increase for
any leukemia or any cancer among
children receiving phototherapy is
likely to be <100/100 000 (0.1%),
corresponding to a number needed to
harm of >1000 (Table 4). In children
with Down syndrome, because of
their higher baseline risk of cancer,
the same upper limit of the IRR
translates into a 10-year excess
risk of up to 4.4% for leukemia,
6
FIGURE 2Crude cumulative incidence of cancer by phototherapy use in children at KPNC born 1995–2011. A, Any cancer; B, Any leukemia; C, Lymphocytic leukemia; D, Nonlymphocytic leukemia. Note that the scale for cumulative risk per 100 000 ranges from a maximum of 30 in Fig 2D to a maximum of 400 in Fig 2A. Differences were not statistically signifi cant in multivariable models.
by guest on January 28, 2019www.aappublications.org/newsDownloaded from
PEDIATRICS Volume 137 , number 6 , June 2016
corresponding to a number needed
to harm that could be as low as 23.
For kidney, bone, and liver cancers
(which were not associated with
Down syndrome), upper limits of
10-year absolute risk increases
were ≤31/100 000 (0.03%),
indicating numbers needed to harm
of >3200.
DISCUSSION
In this retrospective cohort study,
we found that increases in incidence
of total cancer, leukemia (especially
nonlymphocytic leukemia), and liver
cancer among children exposed to
phototherapy as newborns were
no longer statistically significant
after adjustment for confounding
using either traditional methods
or phototherapy propensity
scores. Although attenuation of the
associations with multivariable
analysis suggests confounding is at
least a partial explanation for these
findings, we must also consider 3
alternative bases for the associations:
chance, bias, and effect-cause.25
The low P values and consistency
with previous studies, particularly
the striking early increase in
nonlymphocytic leukemia, make
chance an unlikely explanation
for the crude association between
phototherapy and cancer. On the
other hand, the wider CIs of the
adjusted estimates are consistent
with either no or a moderate
elevation of the adjusted HR. Bias
is unlikely to explain the observed
association: Any misclassification of
exposure or outcomes in this study
is likely to be nondifferential, which
would bias rate ratios and HRs
toward 1.
Some children are born with
cancer, and preexisting cancer
could cause illness or higher
TSB levels, leading to increased
phototherapy rates. For this reason,
we excluded 21 subjects with
cancers diagnosed before 60 days. It
seems unlikely that enough cancers
diagnosed at >60 days were already
causing hyperbilirubinemia in the
newborn period to explain the
association.
7
TABLE 3 Hazard Ratios (95% CIs) for Cancer for Phototherapy and Other Perinatal Risk Factors Identifi ed Using Backward Stepwise Cox Models With P < .1a
Risk Factor Any Cancer (N =
711)
Any Leukemia (N
= 223)
Lymphocytic
Leukemia (N =
169)
Nonlymphocytic
Leukemia (N
= 54)
Kidney Cancer (N
= 26)
Bone Cancer (N
= 13)
Liver Cancer (n
= 12)
Any phototherapy 1.28 (0.92–1.77) 1.33 (0.94–1.89) 1.15 (0.80–1.67) 1.09 (0.64–1.84) 1.34 (0.70–2.56) 3.30 (0.60–18.3) 3.44b (1.13–10.5)
Down syndrome 14.4c (9.41–22.2) 45.9c (30.0–70.2) 31.1c (14.0–69.5) 139c (66.0–293) NI NI NI
Other
chromosomal
disorders
4.71c (2.71–8.20) 2.70b (1.14–6.36) NI NI NI 30.0c (9.19–97.9) 34.8c 8.29–146)
Congenital
anomalies
1.52b (1.11–2.08) NI NI NI 8.79c (3.23–23.9) 3.27d (0.95–11.3) NI
Apgar <7 at 5
min
1.91b (1.06–3.43) 2.69b (1.18–6.13) 2.54d (0.86–7.54) NI NI NI 7.08b (1.73–29.0)
Male gender NI 1.29e (1.10–1.51) 1.46e (1.17–1.82) NI NI NI 0.44d (0.18–1.07)
Maternal age
≥35 y
NI NI NI 0.49b (0.25–0.95) NI NI NI
Early jaundice NI 1.75b (1.19–2.59) NI 3.28e (1.61–6.66) NI NI NI
Any TSB > AAP
phototherapy
threshold
NI NI NI 2.13d (0.95–4.75) 2.09d (0.97–4.49) NI NI
NI, not included in model; P ≥ .1a Hazard ratios are included for all risk factors with P < .1 except for the 6 birth wt and 5 race categories. Not shown: High birth wt was signifi cantly associated with any cancer, any
leukemia, lymphocytic leukemia, and kidney cancer (all P < .0005), and black race was associated with decreased risk of any cancer relative to white race (HR = 0.73; P = .05). Complete
models are provided in the Supplemental Information.b .005 < P < .05. The P value for any phototherapy and liver cancer was .03.c P < .0005.d .05 < P < .1.e .0005 < P < .005.
TABLE 4 Propensity-Adjusted 10-y Excess Risk of Cancer (95% CI) per 100 000 Newborns Exposed to
Phototherapy
No Down Syndrome Down Syndrome
All cancer 1.2 (−89, +91) 26 (−1959, +2011)
All leukemia 27 (−22, +76) 1547 (−1269, +4364)
Lymphocytic 15 (−21, +51) 503 (−820, +1826)
Nonlymphocytic 13 (−16, +42) 1654 (−1102, +4410)
Whole Population
Kidney 10 (−11, +31)
Bone −2 (−12, +7)
Liver 0 (−18, +18)
To obtain the number needed to harm (NNH), divide positive numbers shown into 100 000. For example, for all leukemia
among infants without Down syndrome, the point estimate for the number of children who would need to be exposed to
phototherapy to cause 1 case of leukemia over 10 y (if the association is causal) would be 100 000/27 = 3704, whereas for
children with Down syndrome it would be 100 000/1547 = 65.
by guest on January 28, 2019www.aappublications.org/newsDownloaded from
NEWMAN et al
The key question is therefore
whether the association is entirely
due to confounding, that is, to
one or more factors that cause
both phototherapy and cancer
(particularly leukemia). One key
confounder is Down syndrome.
In both the California Late Impact
of Phototherapy Study20 and the
current study, Down syndrome
was associated not only with
a markedly increased risk of
leukemia but also a fivefold increase
in the use of phototherapy. As
reported in previous studies, other
chromosomal and congenital
anomalies26 and low 5-minute Apgar
score27 were also associated with
certain types of cancer and were
associated with higher phototherapy
rates. Controlling for these
confounding variables attenuated
or eliminated the associations but
widened CIs.
The possible confounding effect
of high bilirubin levels is worth
particular attention, because such
levels have not been available in
previous studies of childhood cancer.
We have previously shown3, 23 that
quantifying TSB levels in 1-mg/
dL categories in relation to AAP
treatment guidelines effectively
controls confounding by indication.
Thus our primary prespecified
analysis was restricted to infants
who had TSB levels from −3 mg/dL
to +4.9 mg/dL from AAP treatment
thresholds, which made them
potential (but not almost certain)
candidates for phototherapy, a group
that most closely approximates
subjects who would have been eligible
for inclusion in a randomized trial of
phototherapy. Restricted propensity
analyses that controlled for TSB in
this way found that associations
between phototherapy and cancer
were attenuated and not statistically
significant. We obtained similar results
with inclusive propensity models and
with stepwise Cox models, suggesting
the results were not dependent on
the analytic strategy.
One limitation of this observational
study is that we cannot control for
unmeasured confounding variables.
Breastfeeding, which was not
available as a covariate for this study,
is associated with higher bilirubin
levels21, 28, 29 and lower leukemia risk, 30
However, because breastfeeding
affects phototherapy use largely
by affecting TSB levels, controlling
for TSB should control for most
confounding by breastfeeding.
A second limitation is lack of data on
phototherapy dosage. We crudely
estimated phototherapy dosage from
the number of admissions at which
it was given and found an increase in
myelogenous leukemia at the highest
dose. Although this is the only
positive adjusted analysis of many
we did and included only 2 exposed
cases, myelogenous leukemia was
the outcome about which we had the
greatest a priori concerns, so this
result cannot be easily dismissed.
Other adjusted results that were not
statistically significant had upper
limits of CI for HRs of 2 or 3 for all
leukemia and lymphocytic leukemia
and were wider for less common
cancers. However, even if the HRs
for any phototherapy were at the
top of the 95% CIs reported in this
study, absolute risk of cancer from
phototherapy would be low, at least
in childhood (<1/1000 over 10 years).
Is that potential risk worth taking?
Phototherapy is often given at TSB
levels at which the number needed
to treat to prevent 1 infant from
8
FIGURE 3Hazard ratios and 95% CIs for phototherapy by type of cancer and model. Stepwise Cox, Cox proportional hazard model on entire cohort; Restricted PS, propensity score model restricted to infants with bilirubin levels at which phototherapy was often used.
by guest on January 28, 2019www.aappublications.org/newsDownloaded from
PEDIATRICS Volume 137 , number 6 , June 2016
reaching exchange levels is in the
hundreds or thousands.3 Recent
data suggest that unless exchange
transfusion thresholds are exceeded
by at least 10 mg/dL, there is little
or no increased risk of cerebral
palsy7 or hearing loss.8 Thus, even
the low upper limit of risk of cancer
may exceed the likely benefits of
treatment in many infants. The
likelihood of harms exceeding
benefits is greatest in children
with Down syndrome, whose much
higher baseline risk of leukemia
might lead cautious clinicians to
increase the treatment threshold for
initiation of phototherapy in these
infants, despite the fact that the
association between phototherapy
and cancer has not yet been proven
to be causal.
CONCLUSIONS
Although we confirmed a crude
association between phototherapy
and childhood cancer, particularly
nonlymphocytic leukemia,
associations were diminished and
no longer statistically significant
after we controlled for confounding
variables. Nonetheless, consistent
crude associations, clinically relevant
upper limits of adjusted 95% CIs, and
the statistically significant adjusted
association between multiple
phototherapy admissions and
myelogenous leukemia suggest that
avoiding unnecessary phototherapy
would be prudent, especially in
children with Down syndrome.
REFERENCES
1. Maisels MJ, McDonagh AF.
Phototherapy for neonatal jaundice.
N Engl J Med. 2008;358(9):920–928
2. Xiong T, Qu Y, Cambier S, Mu D. The
side effects of phototherapy for
neonatal jaundice: what do we know?
What should we do? Eur J Pediatr.
2011;170(10):1247–1255
3. Newman TB, Kuzniewicz MW, Liljestrand
P, Wi S, McCulloch C, Escobar GJ.
Numbers needed to treat with
phototherapy according to American
Academy of Pediatrics guidelines.
Pediatrics. 2009;123(5):1352–1359
4. Newman TB, Liljestrand P, Jeremy RJ,
et al; Jaundice and Infant Feeding
Study Team. Outcomes among
newborns with total serum bilirubin
levels of 25 mg per deciliter or more.
N Engl J Med. 2006;354(18):1889–1900
5. Ebbesen F, Bjerre JV, Vandborg PK.
Relation between serum bilirubin
levels ≥450 μmol/L and bilirubin
encephalopathy; a Danish population-
based study. Acta Paediatr.
2012;101(4):384–389
6. Kuzniewicz MW, Wickremasinghe
AC, Wu YW, et al. Incidence, etiology,
and outcomes of hazardous
hyperbilirubinemia in newborns.
Pediatrics. 2014;134(3):504–509
7. Wu YW, Kuzniewicz MW,
Wickremasinghe AC, et al. Risk for
cerebral palsy in infants with total
serum bilirubin levels at or above the
exchange transfusion threshold: a
population-based study. JAMA Pediatr.
2015;169(3):239–246
8. Wickremasinghe AC, Risley RJ,
Kuzniewicz MW, et al. Risk of
sensorineural hearing loss and
bilirubin exchange transfusion
thresholds. Pediatrics.
2015;136(3):505–512
9. Oláh J, Tóth-Molnár E, Kemény L, Csoma
Z. Long-term hazards of neonatal blue-
light phototherapy. Br J Dermatol.
2013;169(2):243–249
10. Speck WT, Rosenkranz HS.
Phototherapy for neonatal
hyperbilirubinemia: a potential
environmental health hazard to
newborn infants: a review. Environ
Mutagen. 1979;1(4):321–336
9
ABBREVIATIONS
AAP: American Academy of
Pediatrics
CI: confidence interval
HR: hazard ratio
ICD-9: International
Classification of Diseases,
Ninth Revision
IRR: incidence rate ratio
KPNC: Kaiser Permanente
Northern California
OR: odds ratio
TSB: total serum bilirubin
DOI: 10.1542/peds.2015-1354
Accepted for publication Mar 25, 2016
Address correspondence to Thomas B. Newman, MD, MPH, UCSF Department of Epidemiology & Biostatistics, Box 0560, 550 16th St, 2nd Fl, San Francisco, CA
94143. E-mail: [email protected]
PEDIATRICS (ISSN Numbers: Print, 0031-4005; Online, 1098-4275).
Copyright © 2016 by the American Academy of Pediatrics
FINANCIAL DISCLOSURE: The authors have indicated they have no fi nancial relationships relevant to this article to disclose.
FUNDING: Supported by grant R01HS020618 from the Agency for Healthcare Research and Quality. The content is solely the responsibility of the authors and does
not necessarily represent the offi cial views of the Agency for Healthcare Research and Quality. The funder played no role in the design and conduct of the study;
collection, management, analysis, and interpretation of the data; and preparation, review, or approval of the manuscript.
POTENTIAL CONFLICT OF INTEREST: The authors have indicated they have no potential confl icts of interest to disclose.
COMPANION PAPER: Companions to this article can be found on online at www. pediatrics. org/ cgi/ doi/ 10. 1542/ peds. 2015- 1354 and www. pediatrics. org/ cgi/ doi/ 10.
1542/ peds. 2016- 0983.
by guest on January 28, 2019www.aappublications.org/newsDownloaded from
NEWMAN et al
11. Aycicek A, Kocyigit A, Erel O, Senturk
H. Phototherapy causes DNA damage
in peripheral mononuclear leukocytes
in term infants. J Pediatr (Rio J).
2008;84(2):141–146
12. Tatli MM, Minnet C, Kocyigit A,
Karadag A. Phototherapy increases
DNA damage in lymphocytes of
hyperbilirubinemic neonates. Mutat
Res. 2008;654(1):93–95
13. Karadag A, Yesilyurt A, Unal S, et al.
A chromosomal-effect study of intensive
phototherapy versus conventional
phototherapy in newborns with jaundice.
Mutat Res. 2009;676(1–2):17–20
14. Kahveci H, Dogan H, Karaman A, Caner
I, Tastekin A, Ikbal M. Phototherapy
causes a transient DNA damage in
jaundiced newborns. Drug Chem
Toxicol. 2013;36(1):88–92
15. Olsen JH, Hertz H, Kjaer SK, Bautz A,
Mellemkjaer L, Boice JD Jr. Childhood
leukemia following phototherapy
for neonatal hyperbilirubinemia
(Denmark). Cancer Causes Control.
1996;7(4):411–414
16. Cnattingius S, Zack MM, Ekbom A, et al.
Prenatal and neonatal risk factors for
childhood lymphatic leukemia. J Natl
Cancer Inst. 1995;87(12):908–914
17. Roman E, Ansell P, Bull D. Leukaemia
and non-Hodgkin’s lymphoma in
children and young adults: are
prenatal and neonatal factors
important determinants of disease?
Br J Cancer. 1997;76(3):406–415
18. Podvin D, Kuehn CM, Mueller BA,
Williams M. Maternal and birth
characteristics in relation to childhood
leukaemia. Paediatr Perinat Epidemiol.
2006;20(4):312–322
19. Cnattingius S, Zack M, Ekbom A,
Gunnarskog J, Linet M, Adami HO.
Prenatal and neonatal risk factors
for childhood myeloid leukemia.
Cancer Epidemiol Biomarkers Prev.
1995;4(5):441–445
20. Wickremasinghe AC, Kuzniewicz
MW, Grimes BA, et al. Neonatal
phototherapy and infantile cancer.
Pediatrics. 137(6):e20151353. Available
at: www. pediatrics. org/ cgi/ content/ full/
137/ 6/ e1353
21. American Academy of Pediatrics
Subcommittee on Hyperbilirubinemia.
Management of hyperbilirubinemia
in the newborn infant 35 or more
weeks of gestation. Pediatrics.
2004;114(1):297–316
22. United States Cancer Statistics.
1999–2011 Incidence, WONDER Online
Database. US Department of Health
and Human Services, Centers for
Disease Control and Prevention
and National Cancer Institute; 2014.
Available at: http:// wonder. cdc. gov/
cancer- v2011. html. Accessed July 10,
2014
23. Newman TB, Vittinghoff E, McCulloch
CE. Effi cacy of phototherapy for
newborns with hyperbilirubinemia: a
cautionary example of an instrumental
variable analysis. Med Decis Making.
2012;32(1):83–92
24. Vittinghoff E, Glidden D, Shiboski S,
McCulloch C. Regression Methods in
Biostatistics: Linear, Logistic, Survival,
and Repeated Measures Models. 2nd
ed. New York, NY: Springer; 2012
25. Newman TB, Browner WS, Hulley
SB. Enhancing causal inference in
observational studies. In: Hulley SB,
Cummings SR, Browner WS, Grady D,
Newman TB, eds. Designing Clinical
Research. 4th ed. Philadelphia, PA:
Wolters Kluwer Health; 2013:85–96
26. Puumala SE, Ross JA, Aplenc R, Spector
LG. Epidemiology of childhood acute
myeloid leukemia. Pediatr Blood
Cancer. 2013;60(5):728–733
27. Li J, Cnattingus S, Gissler M, et al. The
5-minute Apgar score as a predictor of
childhood cancer: a population-based
cohort study in fi ve million children.
BMJ Open. 2012;2(4):e001095
28. Maisels MJ, Gifford K. Normal serum
bilirubin levels in the newborn and the
effect of breast-feeding. Pediatrics.
1986;78(5):837–843
29. Saigal S, Lunyk O, Bennett KJ,
Patterson MC. Serum bilirubin levels in
breast- and formula-fed infants in the
fi rst 5 days of life. Can Med Assoc J.
1982;127(10):985–989
30. Kwan ML, Buffl er PA, Abrams B, Kiley
VA. Breastfeeding and the risk of
childhood leukemia: a meta-analysis.
Public Health Rep. 2004;119(6):521–535
10 by guest on January 28, 2019www.aappublications.org/newsDownloaded from
DOI: 10.1542/peds.2015-1354 originally published online May 23, 2016; 2016;137;Pediatrics
Grimes, Charles E. McCulloch and Michael W. KuzniewiczThomas B. Newman, Andrea C. Wickremasinghe, Eileen M. Walsh, Barbara A.
CaliforniaRetrospective Cohort Study of Phototherapy and Childhood Cancer in Northern
ServicesUpdated Information &
http://pediatrics.aappublications.org/content/137/6/e20151354including high resolution figures, can be found at:
Referenceshttp://pediatrics.aappublications.org/content/137/6/e20151354#BIBLThis article cites 26 articles, 8 of which you can access for free at:
Subspecialty Collections
subhttp://www.aappublications.org/cgi/collection/hematology:oncology_Hematology/Oncologybhttp://www.aappublications.org/cgi/collection/hyperbilirubinemia_suHyperbilirubinemiasubhttp://www.aappublications.org/cgi/collection/fetus:newborn_infant_Fetus/Newborn Infantfollowing collection(s): This article, along with others on similar topics, appears in the
Permissions & Licensing
http://www.aappublications.org/site/misc/Permissions.xhtmlin its entirety can be found online at: Information about reproducing this article in parts (figures, tables) or
Reprintshttp://www.aappublications.org/site/misc/reprints.xhtmlInformation about ordering reprints can be found online:
by guest on January 28, 2019www.aappublications.org/newsDownloaded from
DOI: 10.1542/peds.2015-1354 originally published online May 23, 2016; 2016;137;Pediatrics
Grimes, Charles E. McCulloch and Michael W. KuzniewiczThomas B. Newman, Andrea C. Wickremasinghe, Eileen M. Walsh, Barbara A.
CaliforniaRetrospective Cohort Study of Phototherapy and Childhood Cancer in Northern
http://pediatrics.aappublications.org/content/137/6/e20151354located on the World Wide Web at:
The online version of this article, along with updated information and services, is
http://pediatrics.aappublications.org/content/suppl/2016/05/18/peds.2015-1354.DCSupplementalData Supplement at:
1073-0397. ISSN:60007. Copyright © 2016 by the American Academy of Pediatrics. All rights reserved. Print
the American Academy of Pediatrics, 141 Northwest Point Boulevard, Elk Grove Village, Illinois,has been published continuously since 1948. Pediatrics is owned, published, and trademarked by Pediatrics is the official journal of the American Academy of Pediatrics. A monthly publication, it
by guest on January 28, 2019www.aappublications.org/newsDownloaded from