1 SENTECH SHORTWAVE SERVICES: Communicating with Africa HFCC B15 – Brisbane - August 2015.


ii
Acknowledgements
This study has benefitted from a number of individuals. James Eberhardt, Chief Scientist of the Vehicle Technologies Program (VTP) of the Office of Energy Efficiency and Renewable Energy (EERE), was extraordinarily generous with his time, in helping to define the scope of this study, and insight, in guiding me to correctly place this study within the context of the Department of Energy’s (DOE’s) involvement in combustion research. Through Eberhardt’s efforts, I was able to interview on several occasions Marvin Gunn, former Manager of the Combustion Research Program at DOE, and William McLean, former Director of the Combustion Research Facility (CRF) at Sandia/Livermore. These two individuals provided an invaluable historical overview of the evolution of DOE’s Combustion Research Program.
Gurpreet Singh, Team Leader of the Advanced Combustion Engine R&D sub-program within the VTP, and Dennis Sieberts, Manager of the Engine Combustion Research Program at the CRF, spent tireless hours ensuring that the technical descriptions within this report are correct. They kindly provided me with contact information of scientists at Caterpillar, Cummins Engine, and Detroit Diesel Corporation. Information from these industry scientists was fundamental in quantifying the economic benefits described in this report.
Gretchen Jordan (Study Project Manager, Sandia National Laboratories) and Rosalie Ruegg (TIA Consulting Inc.), who worked closely with Jeff Dowd (DOE Study Project Manager) of EERE, authored the guidelines for conducting retrospective benefit-cost evaluations of EERE programs. This report has greatly benefitted from these guidelines. In addition, Ruegg and Patrick Thomas (1790 Analytics LLC) prepared Section 3.3.4 on knowledge benefits and the related Appendix D. Michael Gallaher (RTI International) prepared Appendix C. Any shortcoming or omissions in this report are my own responsibility.
Several reviewers offered many useful comments and suggestions on earlier drafts of this report.
DOE Staff, DOE Contractor, and Project Team Reviewers:
• Sam Baldwin, DOE EERE • Jeff Dowd, DOE EERE • James Eberhardt, DOE EERE • Mike Gallaher, RTI International (Project Team) • Fred Glatstein, Sentech Inc. (Contractor to DOE) • Allan Hoffman, DOE EERE • Alan O’Connor, RTI International (Project Team) • Tom Pelsoci, Delta Research Co. (Project Team) • Philip Patterson, DOE EERE • Eric A. Rohlfing, DOE Office of Science • Rosalie Ruegg, TIA Consulting Inc. (Project Team) • Gurpreet Singh, DOE EERE • Thomas White, DOE Office of Policy

iii
External Reviewers:
• Irwin Feller, Director, Institute for Policy Research and Evaluation, and Professor Emeritus of Economics, Pennsylvania State University
• Jeanne Powell, Economic Consultant, and retired Senior Economist, Advanced Technology Program, National Institute of Standards and Technology, U.S. Department of Commerce
• Jon P. Nelson, Economics Consultant, and Professor Emeritus of Economics, Pennsylvania State University
• David Miller, Professor of Mechanical Engineering, Drexel University Last, but certainly not least, is Anne Crook Lutes at RTI International, who shepherded this report from its first draft to this final product. A special thanks to her for sharing with me her editorial and pedagogical skills to help to ensure that this report is professional in every aspect.
NOTICE
This document was prepared as an account of work sponsored by an agency of the United States government. Neither the United States government nor any agency thereof, nor any of their employees, makes any warranty, express or implied, or assumes any legal liability or responsibility for the accuracy, completeness, usefulness or any information, apparatus, product, or process disclosed, or represents that its use would not infringe privately owned rights. Reference herein to any specific commercial product, process, or service by trade name, trademark, manufacturer, or otherwise does not necessarily constitute or imply its endorsement, recommendation, or favoring by the United States government or any agency thereof. The views and opinions of authors expressed herein do not necessarily state or reflect those of the United States government or any agency thereof.

iv
Contents
Section Page
Executive Summary .............................................................................................................................. ES-1
1. Introduction ...................................................................................................................................... 1-1 1.1 Purpose of the Study and Background .................................................................................... 1-1 1.2 Overview of the ACE R&D Sub-Program ............................................................................. 1-2 1.3 Overview of the Report .......................................................................................................... 1-3
2. Advanced Combustion Engine Technologies ................................................................................. 2-1 2.1 Early History of Advanced Combustion Research ................................................................. 2-1 2.2 Laser and Optical Diagnostics ................................................................................................ 2-2 2.3 Combustion Modeling ............................................................................................................ 2-5 2.4 Direct-Injection Diesel Engine ............................................................................................... 2-6
3. Benefit-Cost Evaluation Framework and Analysis ....................................................................... 3-1 3.1 Overview of the Benefit-Cost Evaluation ............................................................................... 3-1 3.2 Budget History of Advanced Combustion Engineering R&D ................................................ 3-1 3.3 Estimation of Benefits ............................................................................................................ 3-5
3.3.1 Economic Benefits ..................................................................................................... 3-5 3.3.2 Environmental and Health Benefits ......................................................................... 3-19 3.3.3 Energy Security Benefits ......................................................................................... 3-21 3.3.4 Knowledge Benefits ................................................................................................. 3-22
3.4 Economic Evaluation Analysis ............................................................................................. 3-32 3.5 Sensitivity Analysis .............................................................................................................. 3-35 3.6 Comparison Studies .............................................................................................................. 3-38
4. Summary of the Findings and Concluding Statement .................................................................. 4-1
References ................................................................................................................................................ R-1
Appendix A Legislative Background.................................................................................................... A-1
Appendix B Economic Rationale for Government Support of Combustion Research .................... B-1
Appendix C Summary of the Co-Benefits Risk Assessment (COBRA) Model ................................ C-1
Appendix D Bibliometrics Methodology Used in the Knowledge Benefits Analysis ........................ D-1
v
Figures
Number Page
Figure ES-1. Total ACE R&D Plus CRF Research Budget ($2008 millions) ...................................... ES-1 Figure 2-1. Raman Energy Levels ......................................................................................................... 2-3 Figure 2-2. Advanced Laser Diagnostics of Combustion ...................................................................... 2-5 Figure 2-3. Diesel Fuel Ignition Technology ......................................................................................... 2-8 Figure 3-1. Total ACE R&D Plus CRF Research Budgets ($2008 millions) ........................................ 3-5 Figure 3-2. Trend in BTE over Time ..................................................................................................... 3-6 Figure 3-3. Trend in BTE over Time with Counterfactual Scenario ................................................... 3-10 Figure 3-4. Number of EERE-Attributed Advanced Combustion U.S. Patents Issued, 1975–
2009 ................................................................................................................................... 3-23 Figure 3-5. Organizations by Average Number of Subsequent Combustion Patent Families of
Leading Companies Linked to Each of Their Earlier Combustion Patent Families (Leading Innovative Vehicle and Engine Companies and EERE Only) ........................... 3-25
Figure 3-6. Organizations with the Largest Number of Patent Families Linked to Earlier EERE-Attributed Advanced Combustion Patents (All Organizations) ............................. 3-26
Figure 3-7. A Network of Organizations Facilitates Combustion Knowledge Creation and Flow ..... 3-31 Figure C-1. COBRA Model Overview .................................................................................................. C-1

vi
Tables
Number Page
Table ES-1. Emissions from 1995 through 2007 ................................................................................. ES-4 Table ES-2. Total Economic and Health Benefits from Reduction in Diesel Fuel Consumption,
1995 through 2007 ........................................................................................................... ES-6 Table ES-3. Evaluation Metrics for Monetized Economic and Health Benefits .................................. ES-6 Table 1-1. Current Programs within EERE .......................................................................................... 1-1 Table 1-2. Current Activity Areas within the VTP............................................................................... 1-2 Table 1-3. Cluster of Research Areas within the ACE R&D Sub-Program ......................................... 1-2 Table 3-1. Annual Appropriations for the VTP, the ACE R&D Sub-Program, and the CRF
($millions) ........................................................................................................................... 3-2 Table 3-2. Cost Data Used in the Evaluation of Economic Benefits ($millions) ................................. 3-4 Table 3-3. Values of BTE Shown in Figure 3-2 ................................................................................... 3-7 Table 3-4. Summary of EPA NOx, PM, and SOx Emission Regulations on Heavy-Duty Diesel
Trucks.................................................................................................................................. 3-8 Table 3-5. Trends and Summary Statistics on Heavy-Duty Diesel Trucks ........................................ 3-13 Table 3-6. Regression Results from the Estimation of Equation (3.1) ............................................... 3-14 Table 3-7. Calculation of Decrease in Fuel Economy Absent the ACE R&D Sub-Program’s
Technologies ..................................................................................................................... 3-16 Table 3-8. Reduced Fuel Consumption with the ACE R&D Sub-Program’s Laser and Optical
Diagnostics and Combustion Modeling Technologies (rounded) ..................................... 3-17 Table 3-9. Economic Benefits of Reduced Fuel Consumption from the ACE R&D Sub-
Program’s Research on Laser and Optical Diagnostics and Combustion Modeling Technologies (rounded) .................................................................................................... 3-18
Table 3-10. Emissions from 1995 through 2007 .................................................................................. 3-19 Table 3-11. Health Benefits from Reduced Environmental Emissions from the ACE R&D Sub-
Program’s Research on Laser and Optical Diagnostics and Combustion Modeling (rounded) ........................................................................................................................... 3-20
Table 3-12. Illustration of Health Cost Calculations from the COBRA Model, Year 2000 ................ 3-21 Table 3-13. EERE-Attributed Combustion Patent Families Linked to the Largest Number of
Subsequent Patent Families of All Companies in All Application Areas ......................... 3-29 Table 3-14. ACE R&D Sub-Program and CRF Costs and Economic Benefits Associated with
the ACE R&D Sub-Program’s Research in Laser and Optical Diagnostics and Combustion Modeling ....................................................................................................... 3-33
Table 3-15. Evaluation Metrics Calculated from the Cost and Benefit Data in Table 3-14 ................. 3-34 Table 3-16. Sales of New Heavy-Duty Diesel Trucks ......................................................................... 3-36

vii
Table 3-17. Economic Benefits of Reduced Fuel Consumption from the ACE R&D Sub-Program’s Research on Laser and Optical Diagnostics and Combustion Modeling Under the Alternative Assumption that New Heavy-Duty Diesel Trucks Sold Each Year Use a Proportionate Amount of Fuel Each Year and that Proportion Remains Constant Over Time (rounded) ......................................................................................... 3-37
Table 3-18. Evaluation Metrics Calculated from the Cost and Benefit Data in Table 3-17 ................. 3-38 Table 3-19. Summary of Selected Benefit-to-Cost Studies Conducted by NIST for Comparison ....... 3-39 Table B-1. Factors Creating Barriers to Innovation that Lead to Technological Market Failure ........ B-2 Table C-1. Health Endpoints Included in COBRA .............................................................................. C-3 Table D-1. Vehicle and Engine Companies with the Most U.S. Patents Granted Since 1992 ............. D-7

ES-1
EXECUTIVE SUMMARY
Overview of the Study
The Vehicle Technologies Program (VTP) is one of 10 energy programs within the Department of Energy’s (DOE) Office of Energy Efficiency and Renewable Energy (EERE). Advanced Combustion Engine R&D (ACE R&D) is one of eight sub-programs within the VTP. The ACE sub-program’s R&D is conducted in cooperation with the DOE Combustion Research Facility (CRF). This report summarizes the findings from a retrospective study of the net benefits to society from investments by DOE (both EERE and cooperative CRF efforts) in laser diagnostic and optical engine technologies and combustion modeling for heavy-duty diesel engines.
The findings in this report came from a retrospective comparison of quantifiable public benefits to public costs. The benefits to society are associated with selected technologies within the ACE R&D sub-program focused on heavy-duty diesel engines, namely laser diagnostic and optical engine technologies and combustion modeling, including cooperative use of CRF resources. The public costs are the total research costs of the entire ACE R&D sub-program, including the research costs associated with the DOE’s CRF.
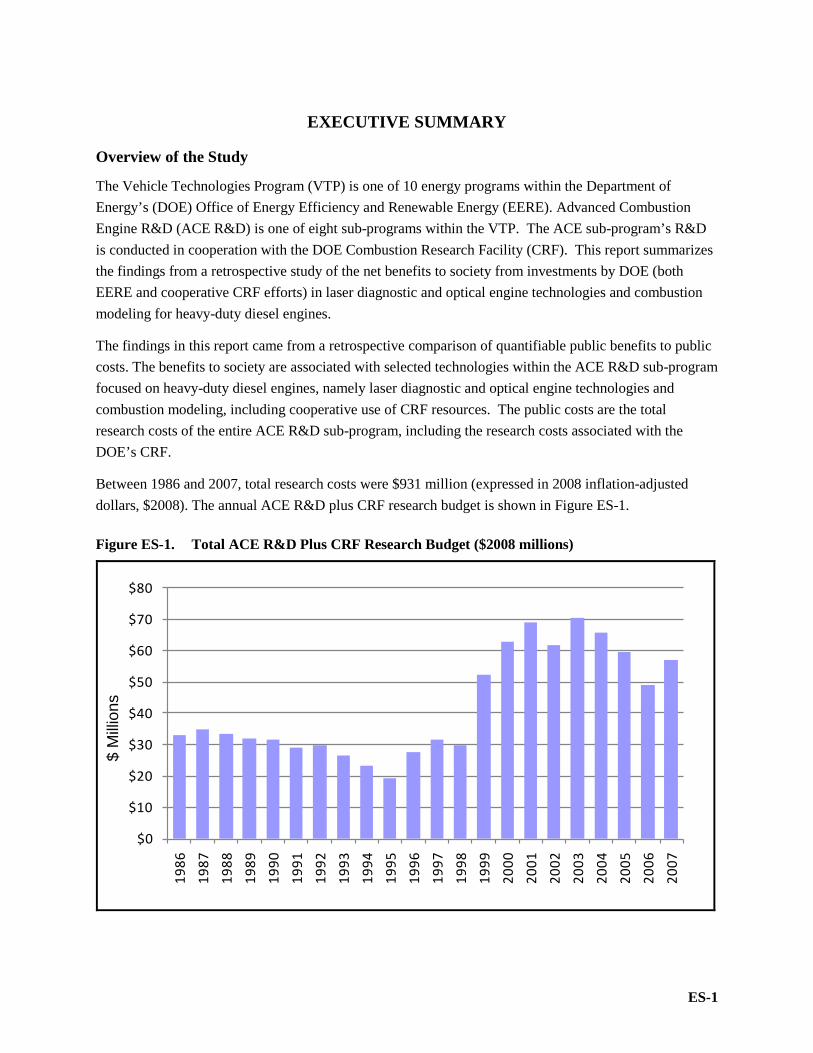
Between 1986 and 2007, total research costs were $931 million (expressed in 2008 inflation-adjusted dollars, $2008). The annual ACE R&D plus CRF research budget is shown in Figure ES-1.
Figure ES-1. Total ACE R&D Plus CRF Research Budget ($2008 millions)
$0
$10
$20
$30
$40
$50
$60
$70
$80
1986
1987
1988
1989
1990
1991
1992
1993
1994
1995
1996
1997
1998
1999
2000
2001
2002
2003
2004
2005
2006
2007
$ M
illion
s

Retrospective Benefit-Cost Evaluation of U.S. DOE Vehicle Combustion Engine R&D Investments
ES-2
Based on a conservative calculation of traditional economic evaluation metrics, applying a discount rate of 7% yields a present value of net benefits of $23.1 billion, a benefit-to-cost ratio of 53 to 1, and an internal rate of return of 63%. These economic results indicate that DOE’s investments in the ACE R&D sub-program and the CRF have been socially valuable.
Background
The Department of Energy Organization Act of 1977 (Public Law 95-91) created DOE for, among other purposes, carrying out the planning, coordination, support, and management of a balanced and comprehensive energy research and development program. DOE began active R&D on vehicle technologies, with early emphasis on electric vehicle technology, as authorized by Congress through the Electric and Hybrid Vehicle Research, Development, and Demonstration Act (Public Law 94-413) of 1976. As part of the DOE mission, the CRF at Sandia National Laboratories in Livermore, California, was formed in 1978 and began operations in 1981 with the intent of developing the most advanced possible diagnostic systems for combustion applications. Following a number of public programs focused on fuel efficiency and reducing emissions, DOE’s energy efficiency and renewable energy activities were reorganized in 2001 into 10 energy programs—the VTP being one. The VTP encompasses eight broad sub-program areas, including ACE R&D.
Cluster of Technologies
The cluster of research areas in the ACE R&D sub-program is as follows:
• laser diagnostic and optical engine technologies; • combustion modeling; • emission control technologies; and • solid state energy conversion.
This study focuses on two research areas from the larger ACE R&D cluster, selected in consultation with EERE scientists: (1) laser diagnostic and optical engine technologies (hereafter laser and optical diagnostics) and (2) combustion modeling, both focused on heavy-duty diesel engines. These two research areas are associated with technologies that have measurable milestones and outcomes directly tied to the ACE R&D sub-program’s research. The selected technologies include the following:
• Laser Raman spectroscopy (LRS) uses a monochromatic light source (e.g., a laser) to probe a sample, and a detector measures the spectrum of frequencies contained in the light scattered in all directions from the sample. Molecules in the sample may either absorb radiation or contribute to the energy of scattered photons, resulting in a series of output frequencies that provide information about the molecules present.
• Laser Doppler velocimetry (LDV) measures the direction and speed of fluids (or other materials). Particle image velocimetry (PIV) is another diagnostic technique for measuring instantaneous velocity. Unlike LDV, PIV produces a two-dimensional vector field, while LDV measures velocity at a point.
• Mie scattering is an elastic scattering mechanism that occurs when light scatters off of particles with diameters on the same scale as the wavelength of light. The Mie scattering diagnostic is typically applied to particles in the 0.1–10 micron range. Fuel droplets exhibit Mie scattering when probed by lasers, and the scattered light can be collected by a detector to provide information about the spatial distribution of the droplets. Mie scattering is a useful phenomenon
Executive Summary
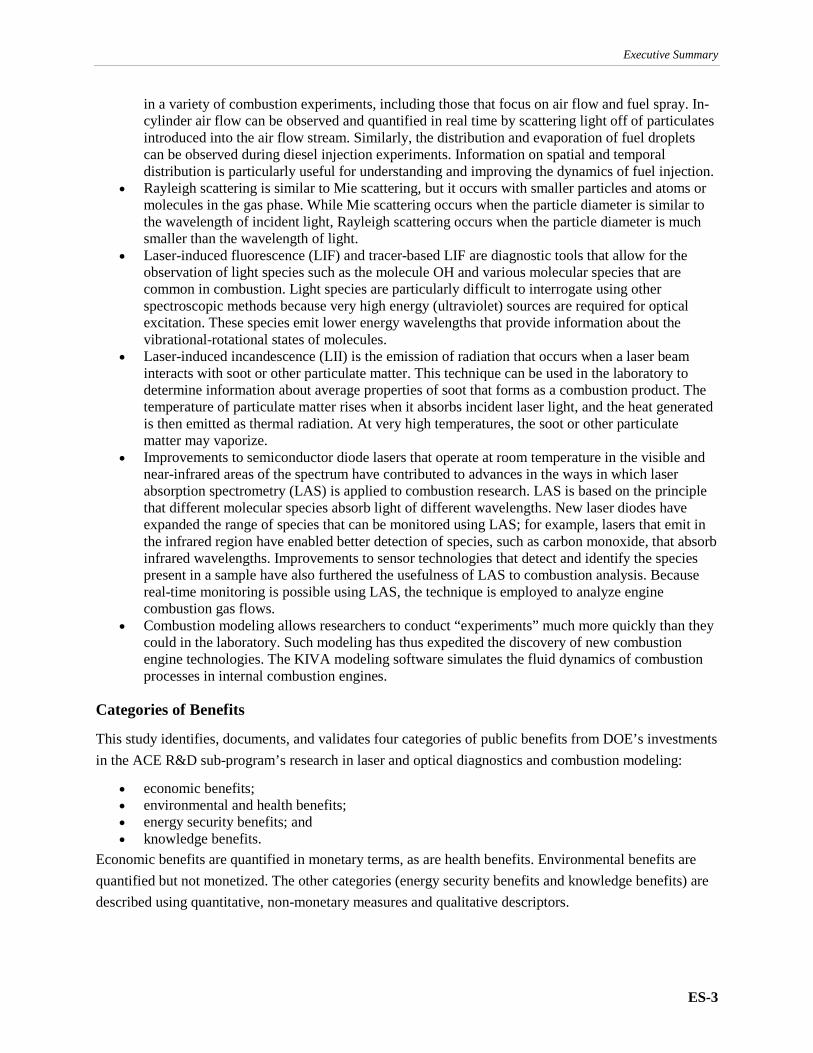
ES-3
in a variety of combustion experiments, including those that focus on air flow and fuel spray. In-cylinder air flow can be observed and quantified in real time by scattering light off of particulates introduced into the air flow stream. Similarly, the distribution and evaporation of fuel droplets can be observed during diesel injection experiments. Information on spatial and temporal distribution is particularly useful for understanding and improving the dynamics of fuel injection.
• Rayleigh scattering is similar to Mie scattering, but it occurs with smaller particles and atoms or molecules in the gas phase. While Mie scattering occurs when the particle diameter is similar to the wavelength of incident light, Rayleigh scattering occurs when the particle diameter is much smaller than the wavelength of light.
• Laser-induced fluorescence (LIF) and tracer-based LIF are diagnostic tools that allow for the observation of light species such as the molecule OH and various molecular species that are common in combustion. Light species are particularly difficult to interrogate using other spectroscopic methods because very high energy (ultraviolet) sources are required for optical excitation. These species emit lower energy wavelengths that provide information about the vibrational-rotational states of molecules.
• Laser-induced incandescence (LII) is the emission of radiation that occurs when a laser beam interacts with soot or other particulate matter. This technique can be used in the laboratory to determine information about average properties of soot that forms as a combustion product. The temperature of particulate matter rises when it absorbs incident laser light, and the heat generated is then emitted as thermal radiation. At very high temperatures, the soot or other particulate matter may vaporize.
• Improvements to semiconductor diode lasers that operate at room temperature in the visible and near-infrared areas of the spectrum have contributed to advances in the ways in which laser absorption spectrometry (LAS) is applied to combustion research. LAS is based on the principle that different molecular species absorb light of different wavelengths. New laser diodes have expanded the range of species that can be monitored using LAS; for example, lasers that emit in the infrared region have enabled better detection of species, such as carbon monoxide, that absorb infrared wavelengths. Improvements to sensor technologies that detect and identify the species present in a sample have also furthered the usefulness of LAS to combustion analysis. Because real-time monitoring is possible using LAS, the technique is employed to analyze engine combustion gas flows.
• Combustion modeling allows researchers to conduct “experiments” much more quickly than they could in the laboratory. Such modeling has thus expedited the discovery of new combustion engine technologies. The KIVA modeling software simulates the fluid dynamics of combustion processes in internal combustion engines.
Categories of Benefits
This study identifies, documents, and validates four categories of public benefits from DOE’s investments in the ACE R&D sub-program’s research in laser and optical diagnostics and combustion modeling:
• economic benefits; • environmental and health benefits; • energy security benefits; and • knowledge benefits.
Economic benefits are quantified in monetary terms, as are health benefits. Environmental benefits are quantified but not monetized. The other categories (energy security benefits and knowledge benefits) are described using quantitative, non-monetary measures and qualitative descriptors.
Retrospective Benefit-Cost Evaluation of U.S. DOE Vehicle Combustion Engine R&D Investments
ES-4
Economic Benefits
The economic benefits relate to the reduced fuel consumption in heavy-duty diesel trucks resulting from research in and the application of laser and optical diagnostics and combustion modeling.
Based on interview information from current and retired scientists at the CRF and from scientists at the three leading U.S. manufacturers of heavy-duty diesel engines (Caterpillar, Cummins, and Detroit Diesel), it was concluded that in the absence of DOE’s investments in the ACE R&D sub-program’s research in laser and optical diagnostics and combustion modeling, brake thermal efficiency (BTE; a measure of fuel efficiency) of new heavy-duty diesel engines would have been 4.5% lower than the actual BTE from 1995 through 2007.
ACE R&D research on laser and optical diagnostics and combustion modeling for heavy-duty diesel engines began in 1986 and continues today.
As a result of the ACE R&D sub-program’s research in and application of laser and optical diagnostics and combustion modeling, 17.6 billion gallons of diesel fuel have been saved in heavy-duty diesel truck use from 1995 through 2007. The monetary value of this reduced fuel consumption is $34.5 billion ($2008, undiscounted), which comes from a statistical analysis of the impact of a reduction in BTE and a reduction in miles per gallon (MPG) in heavy-duty diesel trucks.
Health and Environmental Benefits
Reduced diesel fuel consumption leads to reduced emissions, which in turn leads to reduced greenhouse gas and air pollutants such as carbon dioxide (CO2), oxides of nitrogen (NOx), particulate matter (PM), and sulfur oxides (SOX).
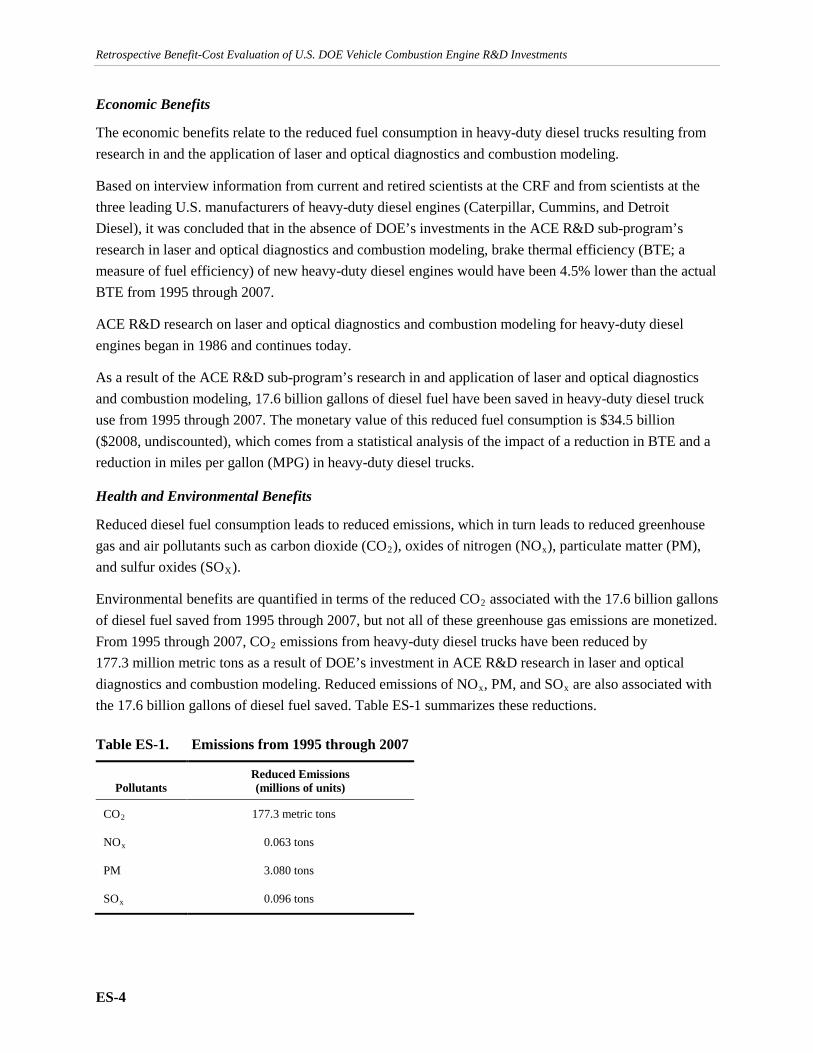
Environmental benefits are quantified in terms of the reduced CO2 associated with the 17.6 billion gallons of diesel fuel saved from 1995 through 2007, but not all of these greenhouse gas emissions are monetized. From 1995 through 2007, CO2 emissions from heavy-duty diesel trucks have been reduced by 177.3 million metric tons as a result of DOE’s investment in ACE R&D research in laser and optical diagnostics and combustion modeling. Reduced emissions of NOx, PM, and SOx are also associated with the 17.6 billion gallons of diesel fuel saved. Table ES-1 summarizes these reductions.
Table ES-1. Emissions from 1995 through 2007
Pollutants Reduced Emissions (millions of units)
CO2 177.3 metric tons
NOx 0.063 tons
PM 3.080 tons
SOx 0.096 tons
Executive Summary
ES-5
Health benefits associated with reduced diesel fuel consumption and reduced NOx, PM, and SOx emissions are quantified in monetary terms using the U.S. Environmental Protection Agency’s (EPA’s) Co-Benefits Risk Assessment (COBRA) model. From 1995 through 2007, the monetary value of the health impacts (e.g., increased mortality) from the reduced consumption of 17.6 billion gallons of diesel fuel was $35.7 billion ($2008, undiscounted).
Energy Security Benefits
Security benefits are discussed qualitatively in terms of reduced national dependence on imported oil resulting from the reduced fuel consumption in heavy-duty diesel trucks. A reduction of 17.6 billion gallons of diesel fuel from 1995 through 2007 is approximately equal to a reduction of 417.9 million barrels of imported crude oil; a reduction of 417.9 million barrels of imported crude oil is approximately equal to a reduction of 1 percent of the total crude oil imported by the United States from 1995 through 2007.
Knowledge Benefits
Knowledge benefits feature the results of a bibliometric analysis conducted by Ruegg and Thomas (2010). The results show that DOE’s investment in advanced combustion research generated a knowledge base that has helped form a foundation for more than a dozen important technologies, including fuel injection, homogeneous charge compression ignition, exhaust gas recirculation, and low-emissions diesel fuel. Although the influence of DOE’s investment in advanced combustion research is seen primarily in combustion technologies (as intended by EERE), it also extends beyond combustion to materials analysis. EERE’s advances in ion mobility spectrometry—a research tool used to improve understanding of in-cylinder combustion processes—appear to have underpinned subsequent developments in spectrometry for materials analysis used to detect substances such as narcotics and explosives.
Economic Evaluation Metrics
A statistical analysis of increased diesel fuel efficiency due to laser and optical diagnostics and combustion modeling, along with related decreased diesel fuel usage, shows that 17.6 billion gallons of diesel fuel have been saved from 1995 through 2007. These diesel fuel savings have a monetary value of $34.5 billion ($2008, undiscounted). Discussion with industry scientists suggests that these fuel savings are completely attributable to DOE’s investments in the ACE R&D sub-program’s research in laser and optical diagnostics and combustion modeling.
Health benefits, including reductions in mortality and the incidence of a variety of other health conditions, are associated with these diesel fuel savings. The monetary value of health benefits resulting from reduced diesel fuel consumption and the corresponding reduction in heavy-duty diesel engine emissions totals $35.7 billion ($2008, undiscounted) from 1995 through 2007.
Table ES-2 summarizes the total economic and health benefits associated with the 17.6 billion gallon reduction in diesel fuel consumption from 1995 through 2007.

Retrospective Benefit-Cost Evaluation of U.S. DOE Vehicle Combustion Engine R&D Investments
ES-6
Table ES-2. Total Economic and Health Benefits from Reduction in Diesel Fuel Consumption, 1995 through 2007
Categories of Monetized Benefits Sum of Benefits
($2008 rounded, undiscounted)
Economic benefits $34.5 billion
Health benefits $35.7 billion
Total economic and health benefits $70.2 billion
A comparison of the present value of monetized economic and health benefits associated with laser and optical diagnostics and combustion modeling relative to the present value of the total $931 million cost of EERE’s investments in the cluster of ACE R&D sub-program research from 1986 through 2007, including related cooperative DOE Office of Science investments in the CRF, yields the evaluation metrics shown in Table ES-3. Net present value and the benefit-to-cost ratio are evaluated using 7% and 3% discount rates.
Table ES-3. Evaluation Metrics for Monetized Economic and Health Benefits
Evaluation Metric Value
Net present value (discount rate 7%, base year 1986, $2008) $23.1 billion
Net present value (discount rate 3%, base year 1986, $2008) $42.6 billion
Benefit-to-cost ratio (discount rate 7%, base year 1986, $2008) 53 to 1
Benefit-to-cost ratio (discount rate 3%, base year 1986, $2008) 66 to 1
Internal rate of return 63%
These evaluation metrics are likely conservative for several reasons:
• The estimated benefits to society are from only the selected technologies within the cluster of ACE R&D technologies, but are compared to the total research costs for the entire ACE R&D sub-program.
• Benefits beyond 2007 continue to accrue but are not included in the figures above. A sensitivity analysis of the economic benefits was performed using an alternative approach to calculate reduced fuel consumption associated with ACE’s research. At a 7% discount rate, a NPV of $17.8 billion and a 41 to 1 benefit-to-cost ratio is calculated, based on the sensitivity analysis; the internal rate of return is 50%. These economic evaluation metrics are comparable to those in Table ES-3.

1-1
1. INTRODUCTION
1.1 Purpose of the Study and Background
This retrospective study evaluates the public benefits of investments in the Advanced Combustion Engine R&D (ACE R&D) sub-program within EERE’s Vehicle Technologies Program (VTP). The ACE R&D sub-program also worked cooperatively with the DOE Office of Science Combustion Research Facility (CRF). The benefits to society from the ACE R&D sub-program’s research (including CRF) on laser diagnostics and optical engine technologies (hereafter laser and optical diagnostics) and combustion modeling are compared to the total sub-program’s research costs, including research support costs of the CRF.
The Department of Energy Organization Act of 1977 created DOE for, among other purposes, carrying out the planning, coordination, support, and management of a balanced and comprehensive energy research and development program.1, 2
Energy efficiency and renewable energy activities in DOE were reorganized in 2001 into 10 energy programs in EERE (see Table 1-1), of which the VTP is one. The VTP encompasses eight broad activity areas (see Table 1-2), including ACE R&D.
Table 1-1. Current Programs within EERE
Biomass Program
Building Technologies Program
Federal Energy Management Program
Geothermal Technologies Program
Hydrogen and Fuel Cell Technologies Program
Industrial Technologies Program
Solar Energy Technologies Program
Vehicle Technologies Program
Wind and Hydropower Technologies Program
Weatherization and Intergovernmental Program
Source: EERE (2009a).
1 DOE began active R&D on vehicle technologies, with early emphasis on electric vehicle technology, as authorized by
Congress through the Electric and Hybrid Vehicle Research, Development, and Demonstration Act (Public Law 94-413) of 1976. As part of the DOE mission, the Combustion Research Facility at Sandia National Laboratories, Livermore, California, was established in 1978 and began operations in 1981 with the intent of developing the most advanced possible diagnostic systems possible for combustion applications. A more detailed legislative history is found in Appendix A.
2 The net benefits to society attributable to the ACE R&D sub-program (discussed below) can ultimately be traced to the foresight of the DOE Office of Basic Energy Sciences, which established the Combustion Research Facility and provided discoveries enabling the technologies used in the design of today’s modern internal combustion engines (Eberhardt, January 20, 2010).

Retrospective Benefit-Cost Evaluation of U.S. DOE Vehicle Combustion Engine R&D Investments
1-2
Table 1-2. Current Activity Areas within the VTP
Sub-Program Description
Hybrid and Vehicle Systems Technologies
Analysis and testing activities that provide support and guidance for many cutting-edge automotive and truck technologies now under development
Energy Storage Technologies
Critical enabling battery technologies for the development of advanced, fuel-efficient light- and heavy-duty vehicles
Power Electronics and Electrical Machines Technologies
Motors, inverters/converters, sensors, control systems, and other interface elements that are critical to hybrid electric and fuel cell vehicles
Advanced Combustion Engine R&D (ACE R&D)
Technologies that contribute to more efficient, advanced internal combustion engines in light-, medium-, and heavy-duty vehicles
Fuels and Lubricants Technologies
Fuel and lubricant options that are cost-competitive, enable high fuel economy, deliver lower emissions, and contribute to petroleum displacement
Materials Technologies Lightweight, high-performance materials that can play an important role in improving the efficiency of transportation engines and vehicles
EPAct Programs in support of the Energy Policy Act of 1992 (EPAct), which was passed to reduce our nation's reliance on foreign petroleum and improved air quality
Educational Activities Collegiate programs that help encourage engineering and science students to pursue careers in the transportation sector
Source: EERE (2009b).
1.2 Overview of the ACE R&D Sub-Program
The research areas in the ACE R&D sub-program are shown in Table 1-3. The application of laser and optical diagnostics and combustion modeling to heavy-duty diesel engines was selected from the larger ACE R&D research areas in consultation with scientists from EERE.
Table 1-3. Cluster of Research Areas within the ACE R&D Sub-Program
Laser Diagnostics and Optical Engine Technologies
Combustion Modeling
Combustion and Emission Control
Solid State Energy Conversion
Source: ACE R&D sub-program staff.
Laser and optical diagnostics and combustion modeling are two research areas for which there are measurable milestones and outcomes (e.g., improvements in brake thermal efficiency and miles per gallon, as discussed in Section 3) that are directly associated with the ACE R&D sub-program’s research.
The emphasis on heavy-duty diesel trucks reflects the fact that trucking is a vital industry to the U.S. economy and to national income. Trucks account for about 25% of the transportation industry’s total revenues. Based on the Economic Census of 2002:

Section 1 — Introduction
1-3
“[T]he truck transportation industry consisted [in 2002] of more than 112,698 separate establishments, with total revenues of $165 billion. These establishments employ 1,437,259 workers, who take home an annual payroll of $47 billion.” (NRC, 2008, p. 9)
Trucks also account for nearly 58% of total highway transportation energy consumption; heavy-duty trucks account for nearly 24% of total highway transportation energy consumption (Davis et al., 2009, Table 2.7).
The number of heavy-duty diesel truck registrations has increased since 1970. In 1970, 905,000 heavy-duty diesel trucks were registered and they were driven 35.1 billion miles; in 2007, the number of registered heavy-duty diesel trucks rose to 2.2 million and they were driven 145.0 billion miles.3
1.3 Overview of the Report
The remainder of this report is organized as follows:
• Section 2 provides an overview of laser and optical diagnostics and combustion modeling, the technologies selected for a more detailed benefit analysis within the ACE R&D sub-program. Section 2 begins with an early history of advanced combustion research at DOE’s Sandia/Livermore research facility. Laser and optical diagnostics and combustion modeling are then discussed in detail, along with their application to direct-injection diesel engines.
• Section 3 provides the budget history of the VTP and the ACE R&D sub-program. These are the costs used in the benefit-cost evaluation. Section 3 also provides a detailed discussion of the estimation of economic benefits, environmental and health benefits, energy security benefits, and knowledge benefits. Economic benefits and health benefits are quantified in monetary terms and are used in the benefit-cost evaluation. The section concludes with a sensitivity analysis of the calculation of economic benefits.
• Section 4 concludes the report with a brief summary statement.
3 Between 1970 and 2007, the average annual percentage increase in trucks registrations was 2.5%; the average annual increase
in miles driven was 3.9%.

2-1
2. ADVANCED COMBUSTION ENGINE TECHNOLOGIES
2.1 Early History of Advanced Combustion Research4
In 1956, Sandia Corporation established a research branch in Livermore, California (once referred to as Sandia/Livermore and now referred to as Sandia/California). Its early projects focused on advancements in nuclear weapons, and its programs were closely coordinated with Lawrence Livermore National Laboratory (LLNL). This focus continued throughout the Cold War.
Because of budgetary cut-backs in the early 1970s and the emergence of energy security as a national priority, Sandia National Laboratories (SNL) in Albuquerque, New Mexico, had diversified into broader areas of energy research. In late 1972, SNL received a research grant from the National Science Foundation to conduct a feasibility study related to harnessing solar energy, and Sandia/Livermore became involved in the project. As a result of the oil embargo and the energy crisis in 1973, and with the establishment of the Energy Research and Development Administration (ERDA),5 Sandia/Livermore gained responsibilities in the area of combustion research.6
During this time period, interest in creating a national combustion research center grew, championed by several scientists at Sandia/Livermore.7 In 1975, the Combustion Research Program within ERDA was established.8 It was recognized within ERDA at that time that “a major shift in national combustion research was necessary, not just a single new project at the principal-investigator level” (Carlisle et al., 2002, pp. 5–6).9 The purpose of the program was to help industry design and implement new technologies by experimentally validating computer modeling and simulations.10 Early on, the Combustion Research Program developed links with industrial firms that built and used combustion devices. These partners included General Motors, Ford, Chrysler, Cummins, Caterpillar, Babcock and Wilcox, Combustion Engineering, Bechtel, General Electric, and Westinghouse.11 Other partners included, from time to time, Exxon, Unocal, and Chevron (Gunn, October 20, 2009).
The idea for a research center was based on the belief that combustion research in general had been hampered by the lack of detailed information about the combustion process, and to gain such information, state-of-the-art tools would be needed as enabling technologies.12 Such tools were very expensive and
4 This section draws from telephone conversations with Marvin Gunn, former Manager of the Combustion Research Program
at DOE, and William McLean, former Director of the Combustion Research Facility at Sandia/Livermore. 5 See Appendix A for a legislative history related to DOE. 6 In the early 1970s, Dan Hartley and Ron Hill at Sandia/Livermore created laser systems for analyzing gas flows, and this
technology later became a backbone for on-site future combustion research. 7 These scientists were Hartley and Arlyn Blackwell (Carlisle et al., 2002). 8 E. Karl Bastress was commissioned to establish the program (Carlisle et al., 2002). 9 Organizationally, the combustion research program came under DOE’s Energy Conservation and Utilization Technologies
Division. 10 According to Gunn (October 20, 2009), this was the thesis of Bastress’ program. 11 According to Gunn (October 20, 2009), Volvo, Peugeot, Citron, and Fiat were involved with the combustion research
program through the International Energy Agency. 12 More specifically, Bastress recognized the need to apply laser-based diagnostics and computational modeling to further
combustion research.
Retrospective Benefit-Cost Evaluation of U.S. DOE Vehicle Combustion Engine R&D Investments
2-2
neither principal investigators nor individual engine companies could justify their expense.13 A site for the collaborative development and use of such technologies would be needed. In October 1975, ERDA agreed in principle with the concept of a Combustion Research Facility (CRF), and it appeared in President Carter’s FY1978 budget at $9.4 million (Carlisle et al., 2002).14 The DOE Office of Basic Energy Sciences established the CRF and provided the discoveries enabling the technologies used in the design of today’s modern internal combustion engines (Eberhardt, January 20, 2010).
At the same time, the Office of Energy Research at the former Atomic Energy Commission began to focus on fundamental research in chemical sciences with application to energy conversion processes, principally combustion sciences. At the CRF, the Office of Energy Research had responsibility for basic research and for building, equipping, and operating the CRF as a DOE-designated User Facility. The Office of Energy Research cooperated with the DOE conservation office and the fossil energy office, encouraging their program to make use of the CRF’s state-of-the-art capabilities. Thus, from early on, a spirit of cooperation, especially among the DOE’s conservation and basic sciences programs, enabled CRF’s work to focus on the often-elusive gap between basic research (usually carried out in scientific laboratories) and applied research (conducted in industry with full-scale devices).
2.2 Laser and Optical Diagnostics15 “The Combustion Research Facility … [was] created with the intent of developing the most advanced diagnostic systems possible for combustion applications, with a special emphasis on combustion in engines. The formula for the program was… half of the research dedicated to fundamentals in diagnostics and combustion, half of the research dedicated to applications of those tools to problems in practical combustors.” (Hartley and Dyer, 1985, p. 27)
Over time, scientists have developed a broad range of spectroscopic methods to probe the electronic structures of atoms and the vibrational and rotational structure of molecules by observing their interaction with electromagnetic radiation. Through various forms of spectroscopy, researchers have been able to identify the chemical species present at different stages of combustion. Raman spectroscopy was one such early tool.
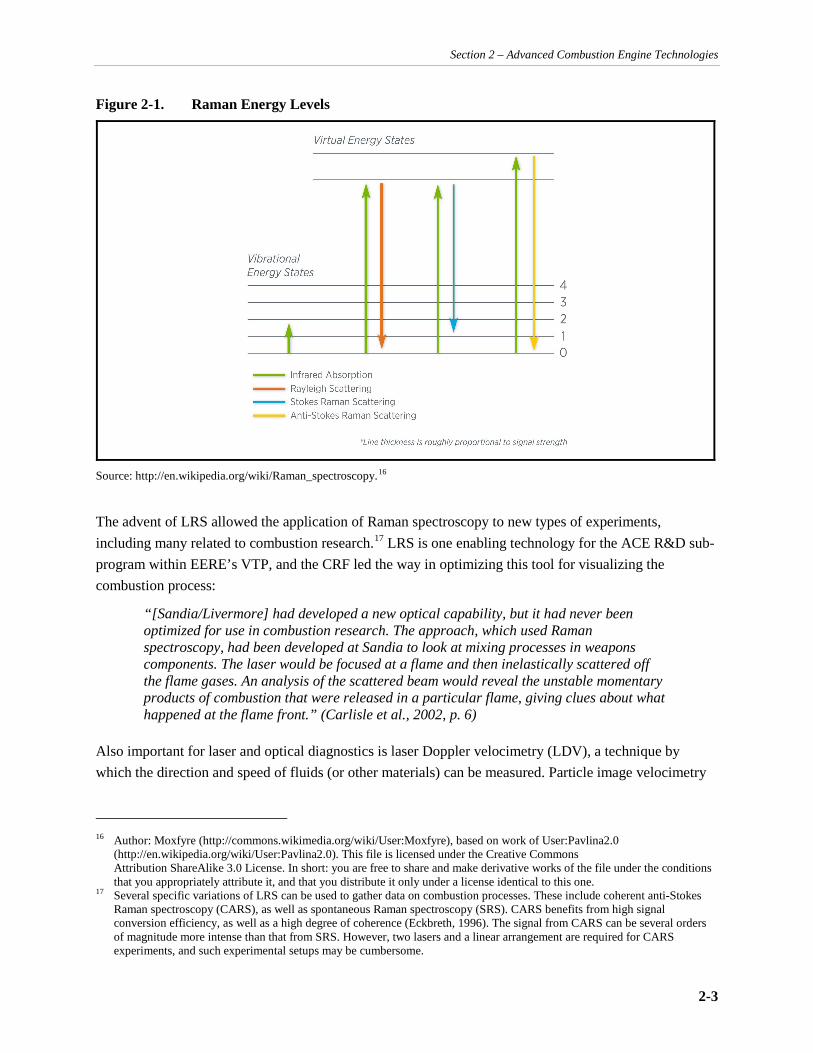
Laser Raman spectroscopy (LRS) was an important early success of laser and optical diagnostics. In LRS, a monochromatic light source (e.g., a laser) is used to probe a sample, and a detector measures the spectrum of frequencies contained in the light scattered in all directions from the sample. As Figure 2-1 illustrates, molecules in the sample may either absorb radiation or contribute to the energy of scattered photons, resulting in a series of output frequencies that provide information about the molecules present.
13 This point was revisited by McLean (October 22, 2009) when discussing the attribution of the net social benefits measured in
this study to DOE’s research. See Section 3. 14 Hartley was the first director of the CRF. It was put into use in November 1980, and the ribbon cutting ceremony was on
March 6, 1981. According to McLean (October 21, 2009), line-item funding was important. The CRF was a new “center of excellence” and at its genesis, it did not have credibility in combustion research. Line-item funding removed the possibility that university researchers would think that CRF’s funding was at the expense of additional university research dollars. As McLean explained, as a center of excellence, the “tide would raise all boats.”
15 This section has greatly benefitted from comments and suggestions by Dennis Siebers, Manager of the Engine Combustion Research Program at the CRF.
Section 2 – Advanced Combustion Engine Technologies
2-3
Figure 2-1. Raman Energy Levels
Source: http://en.wikipedia.org/wiki/Raman_spectroscopy.16
The advent of LRS allowed the application of Raman spectroscopy to new types of experiments, including many related to combustion research.17 LRS is one enabling technology for the ACE R&D sub-program within EERE’s VTP, and the CRF led the way in optimizing this tool for visualizing the combustion process:
“[Sandia/Livermore] had developed a new optical capability, but it had never been optimized for use in combustion research. The approach, which used Raman spectroscopy, had been developed at Sandia to look at mixing processes in weapons components. The laser would be focused at a flame and then inelastically scattered off the flame gases. An analysis of the scattered beam would reveal the unstable momentary products of combustion that were released in a particular flame, giving clues about what happened at the flame front.” (Carlisle et al., 2002, p. 6)
Also important for laser and optical diagnostics is laser Doppler velocimetry (LDV), a technique by which the direction and speed of fluids (or other materials) can be measured. Particle image velocimetry
16 Author: Moxfyre (http://commons.wikimedia.org/wiki/User:Moxfyre), based on work of User:Pavlina2.0
(http://en.wikipedia.org/wiki/User:Pavlina2.0). This file is licensed under the Creative Commons Attribution ShareAlike 3.0 License. In short: you are free to share and make derivative works of the file under the conditions that you appropriately attribute it, and that you distribute it only under a license identical to this one.
17 Several specific variations of LRS can be used to gather data on combustion processes. These include coherent anti-Stokes Raman spectroscopy (CARS), as well as spontaneous Raman spectroscopy (SRS). CARS benefits from high signal conversion efficiency, as well as a high degree of coherence (Eckbreth, 1996). The signal from CARS can be several orders of magnitude more intense than that from SRS. However, two lasers and a linear arrangement are required for CARS experiments, and such experimental setups may be cumbersome.

Retrospective Benefit-Cost Evaluation of U.S. DOE Vehicle Combustion Engine R&D Investments
2-4
(PIV) is another diagnostic technique for measuring instantaneous velocity. PIV produces a two-dimensional vector field, while LDV measures velocity at a point.
Mie scattering is an elastic scattering mechanism that occurs when light scatters off of particles with diameters on the same scale as the wavelength of light. The Mie scattering diagnostic is typically applied to particles in the 0.1- to10-micron range (Asanuma, 1996). Fuel droplets exhibit Mie scattering when probed by lasers, and the scattered light can be collected by a detector to provide information about the spatial distribution of the droplets. Mie scattering is a useful phenomenon in a variety of combustion experiments, including those that focus on air flow and fuel spray. In-cylinder air flow can be observed and quantified in real time by scattering light off of particulates introduced into the air flow stream.18 Similarly, the distribution and evaporation of fuel droplets can be observed during diesel injection experiments. Information on spatial and temporal distribution is particularly useful for understanding and improving the dynamics of fuel injection.
Rayleigh scattering (noted in Figure 2-1) is similar to Mie scattering, but it occurs with smaller particles and atoms or molecules in the gas phase. While Mie scattering occurs when the particle diameter is similar to the wavelength of incident light, Rayleigh scattering occurs when the particle diameter is much smaller than the wavelength of light.
A variety of spectroscopic techniques are used to probe the combustion process in the laboratory, and many were applied to engine combustion in the early 1980s. Laser-induced fluorescence (LIF) and tracer-based LIF are diagnostic tools that allow for the observation of light species such as the molecule OH and various molecular species that are common in combustion.19 Light species are particularly difficult to interrogate using other spectroscopic methods because very high energy (ultraviolet) sources are required for optical excitation. The energy difference between the ground and excited states of light species can be on the order of 10 electron volts (Forch et al., 1990). In LIF, a fixed-wavelength or tunable laser is used to interrogate species in a combustion chamber. These species emit lower energy wavelengths that provide information about the vibrational-rotational states of molecules. The emission spectrum from the molecules of interest is sometimes complicated by interference from other emission processes, such as combustion luminosity.
Laser-induced incandescence (LII) is the emission of radiation that occurs when a laser beam interacts with soot or other particulate matter (AIAA, 2009). This technique can be used in the laboratory to determine information about average properties of soot that forms as a combustion product. The temperature of particulate matter rises when it absorbs incident laser light, and the heat generated is then emitted as thermal radiation. At very high temperatures, the soot or other particulate matter may vaporize. Like all laboratory techniques, LII has limitations, including complications with high soot loadings and long path lengths. In either case, signal attenuation is likely (AIAA, 2009).
18 The velocity fields can be quantified via LDV and PIV. 19 An ideal tracer is a molecule that easily fluoresces that can be added to examine scalar mixing processes (e.g., how fast air
and fuel mix).
Section 2 – Advanced Combustion Engine Technologies
2-5
Improvements to semiconductor diode lasers that operate at room temperature in the visible and near-infrared areas of the spectrum have contributed to advances in the ways in which laser absorption spectrometry (LAS) is applied to combustion research (Allen, 1998). LAS is based on the principle that different molecular species absorb light of different wavelengths. New laser diodes have expanded the range of species that can be monitored using LAS; for example, lasers that emit in the infrared region have enabled better detection of species, such as carbon monoxide, that absorb infrared wavelengths (Hanson et al., 2002). Improvements to sensor technologies that detect and identify the species present in a sample have also furthered the usefulness of LAS to combustion analysis. Because real-time monitoring is possible using LAS, the technique is employed to analyze engine combustion gas flows (Mattison et al., 2007).
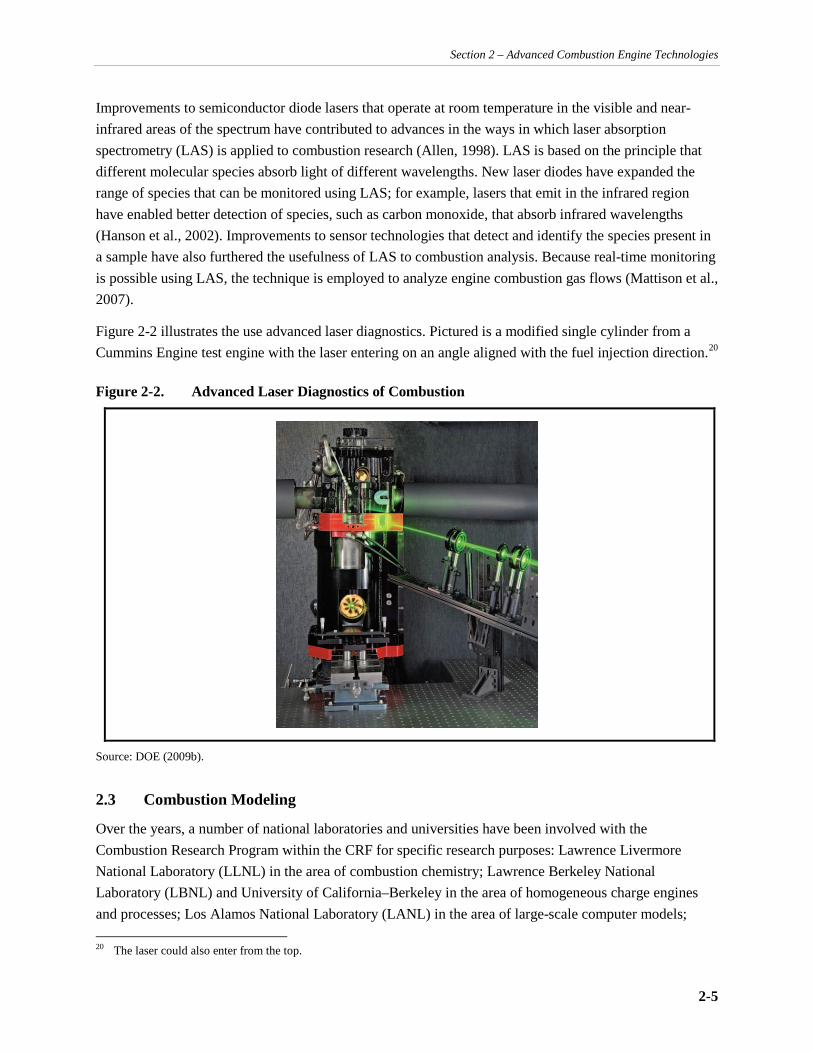
Figure 2-2 illustrates the use advanced laser diagnostics. Pictured is a modified single cylinder from a Cummins Engine test engine with the laser entering on an angle aligned with the fuel injection direction.20
Figure 2-2. Advanced Laser Diagnostics of Combustion
Source: DOE (2009b).
2.3 Combustion Modeling
Over the years, a number of national laboratories and universities have been involved with the Combustion Research Program within the CRF for specific research purposes: Lawrence Livermore National Laboratory (LLNL) in the area of combustion chemistry; Lawrence Berkeley National Laboratory (LBNL) and University of California–Berkeley in the area of homogeneous charge engines and processes; Los Alamos National Laboratory (LANL) in the area of large-scale computer models; 20 The laser could also enter from the top.

Retrospective Benefit-Cost Evaluation of U.S. DOE Vehicle Combustion Engine R&D Investments
2-6
Purdue University in the area of heat and mass transfer; Princeton University in the area of direct fuel injection engines; the University of Wisconsin in the area of experimental engineering processes; the Massachusetts Institute of Technology (MIT) in the area of flame propagation; and others. Fluid mechanics in engines was studied at both Pennsylvania State University and Imperial College (London).
Combustion modeling allows researchers to conduct “experiments” much more quickly than they could in the laboratory. Such modeling has thus expedited the discovery of new combustion engine technologies. It is important to note, however, that modeling results are only helpful when verified by a subset of empirical data. It is the combination of advanced spectroscopic techniques (see Section 2.2) and increasing computational capability that has provided a basis for innovation with respect to advanced combustion engines in the VTP (Eberhardt, June 26, 2009).
In 1982, LANL developed the “KIVA” codes,21 which simulate the fluid dynamics of combustion processes in internal combustion engines. However, computers at that time were not fast enough to make the tool practical. In 1983, LANL began working with a small community of potential adopters of the KIVA technology and shared their codes with General Motors, Cummins Engine, and others. The software was released to the public in 1985, and throughout the development of the KIVA codes, government scientists worked closely with industrial partners and others in the user community (Amsden and Amsden, 1993). In fact, the CRF had dedicated laboratory space for visiting researchers from partner automotive companies who spent months at a time contributing to the project (Eberhardt, June 26, 2009).
Adoption of the latest version of the KIVA codes is widespread; users include Caterpillar, Cummins Engine, General Motors, Ford, and Chrysler (Amsden and Amsden, 1993). Some of the patents for vehicle technologies in the automotive industry specifically cite the KIVA codes as an enabler of the inventions. In addition, the code has broad applications beyond modeling combustion in vehicle engines, and it has been used for modeling gas turbines, incinerators, and waste heaters.
From an economic perspective, the KIVA codes are similar to a general purpose technology in that they leverage the application of laser and optical diagnostics. A general purpose technology has the characteristics of pervasiveness, an inherent potential for technological improvements, and innovational complexities that give rise to increasing returns to scale in research and development (R&D) (Bresnahan and Trajtenberg, 1995).
2.4 Direct-Injection Diesel Engine
Diesel engines are a type of combustion engine in which fuel ignites when compressed. Diesel engines are traditionally known for high efficiency but also for emitting high levels of oxides of nitrogen (NOx) and particulate matter (PM). Modern diesel engines burn cleaner than their traditional counterparts as a result of advances in producing cleaner diesel fuels, modification of the air handling and combustion system resulting from improved understanding of diesel combustion, introduction of electronic control of
21 A “kiva” is a subterranean room used for religious purposes by the Pueblo people of the Los Alamos region (Eberhardt, June
26, 2009). The name of the codes reflects the geographic area where they were developed.

Section 2 – Advanced Combustion Engine Technologies
2-7
engine functions, major improvements in fuel injection equipment, and employment of various emission control techniques such as exhaust gas recirculation.
The basic design of the four-stroke combustion ignition engine is illustrated in Figure 2-3. In the first stroke, the piston moves away from the intake valve, drawing air into a cylinder. Next, the piston compresses the air, and fuel is injected at the end of this second stroke (when air is at maximum pressure and temperature). As ignition and combustion occurs, the piston is forced downward by the expanding gases, after which the piston swings upward on the fourth stroke, clearing post-combustion gases from the cylinder. The high efficiency of diesel engines is the result of high compression ratios, rapid combustion, and the ability to control engine load through the quantity of fuel injected (as opposed to controlling load by restricting the intake air flow, as is used in spark-ignition engines). The high temperatures associated with both the high compression ratios and the ignition properties of diesel fuel enable the fuel/air mixture to spontaneously ignite.
Although the basic design of the engine has not significantly changed over the past century, today’s direct injection diesel engines have much lower emissions than the previous generation of indirect injection diesel engines. In older diesel engines, fuel and air were mixed in a pre-combustion chamber prior to injection into the cylinder. Because the mixing and injection steps were mechanically controlled, they could not always be optimized for specific engine conditions and often led to the release of uncombusted fuels. Modern, direct injection equipment is computer controlled and designed to deliver the optimal amount of fuel at the optimal time.22 Compared to older diesel engines, today’s direct-injection diesel engines are characterized by higher efficiency (fuel economy), lower emissions (for some categories of pollutants), and higher power.
The major advantage of direct injection is increased efficiency, not reduced emissions. Early direct injection diesel engines injected the fuel when the piston was top dead center, and fuel burned very efficiently. However, at such peak flame temperatures, there are high emissions of NOx and PM.23 Emissions of these two classes of pollutants have been reduced by over 90% in modern direct-injection diesel engines, but still create a challenge in meeting U.S. emissions standards (DOE, 2008). NOx and PM emissions can be reduced with the introduction of an aftertreatment technology, but the high cost of such technologies must be compared to other potential technologies for in-cylinder reductions of emissions before this technology is widely adopted (Nam, 2004).
22 The electronic control module communicates with various sensors in different parts of the engine that provide information on
engine speed, piston position, and temperature. 23 Direct injection reduced the total mass of PM emitted, but it increased the total number of smaller particles. As a result, they
were kept in suspension longer by Brownian motion.

Retrospective Benefit-Cost Evaluation of U.S. DOE Vehicle Combustion Engine R&D Investments
2-8
Figure 2-3. Diesel Fuel Ignition Technology
Source: U.S. DOE (2003).
Advances in engine technologies themselves have also occurred. These include high-pressure electronically controlled fuel injection, exhaust gas recirculation (EGR), and new combustion approaches such as homogeneous charge compression ignition (HCCI).24
High-pressure electronically controlled fuel injection for heavy-duty diesel engines is a system in which standing high pressure exists in a common rail. The system uses fuel injectors that are controlled electronically to deliver fuel appropriate to changing engine demands and to optimize performance (Fort et al., 1980).
EGR is a technology used in both gasoline and diesel engines to reduce NOx emissions by lowering the temperature in the combustion chamber. EGR involves recirculating a fraction of the exhaust back into the intake stream. In diesel engines, the exhaust replaces oxygen in the pre-combustion gas mixture. The exhaust is first cooled and compressed, allowing a larger volume of gas to be re-injected. Although EGR reduces NOx emissions, it may also increase PM emissions. The goal is to reduce engine-out particulate emissions so as to reduce the demand on (or need for) aftertreatment (i.e., diesel particulate filters). Materials engineering may provide solutions for mitigating durability issues currently associated with EGR. Because exhaust chemistry varies with choice of fuel, EGR must also be optimized for different operating conditions (Lance and Sluder, 2009). 24 DOE-funded research using laser and optical diagnostics and combustion modeling has directly addressed these three
particular technologies and continues to contribute to the development of strategies today. Industry typically addresses nearer term research needs, while DOE and academic laboratories perform longer term research and address more fundamental issues. According to McLean (November 20, 2009), this complementary relationship has led to faster progress than industry could accomplish alone. One such example of enhanced progress is Dec’s development of a new conceptual model for diesel combustion (Dec, 1997).

Section 2 – Advanced Combustion Engine Technologies
2-9
HCCI refers to a strategy employing chemical-kinetically controlled volumetric combustion of a mostly premixed charge. The strategy differs from conventional combustion-ignition engines by avoiding the rich burn during fuel injection, and from conventional spark-injection engines by avoiding flame propagation. As a result of this process, fuel efficiency increases and NOx and PM emissions decrease.
The application of laser and optical diagnostics and combustion modeling has made significant contributions to the study and development of improved diesel combustion, EGR, and HCCI strategies. New fuel-injector technologies came out of advancements in electronics, but visualization diagnostics have provided important details for optimization of spray targeting, evaporation, mixing, ignition, and combustion.
DOE-funded research performed using laser and optical diagnostics and combustion modeling has contributed to spark injection engine improvements starting in the late 1970s, and research applicable to diesel engines began in the mid 1980s and continues today within EERE (Siebers, October 13, 2009). The major impact of this research on heavy-duty diesel engines began in the mid 1990s, and it too continues today. Resulting enhancement of the understanding of in-cylinder processes has contributed to improvements in both engine thermal efficiency and engine-out emissions.
In an effort to promote efficient combustion without reaching the peak flame temperatures and without reducing performance (i.e., fuel efficiency), research on injection rate shaping (i.e., the way in which the fuel is injected) was funded by DOE during the 1980s.25 The goal of the technology is to shape the pressure rise by controlling the rate at which the fuel is injected. With fuel being injected optimally throughout the stroke process, more fuel reacts with oxygen and less nitrogen combines with oxygen to produce harmful NOx emissions. By optimizing fuel injection, emissions are reduced without compromising engine performance.
In summary, improving engine efficiency and simultaneously meeting stringent new emissions regulations (discussed in Section 3.3.1 and summarized in Table 3-4) required significant new and detailed knowledge of diesel combustion processes. Without this understanding, engine designers would have been left with decades of “cut and try” approaches to arrive at the required improvements in engine design. Laser diagnostics and optical engine technologies allowed the combustion process in an operating diesel to be probed and measured in real time. The understanding developed with laser diagnostics and other optical methods has had two impacts. First it directly helped engine designers improve diesel designs by providing an accurate picture of how diesel combustion occurs and scales with a multitude of engine parameters. Second, the data and understanding allowed the validation of computer models for predicting diesel combustion. These models are now widely used by automotive and engine companies to design and optimize diesel engines. Together, these two impacts have led to greatly improved diesel engine designs and efficiency.
25 The Arrhenius equation describes the temperature dependence of a chemical reaction. Above the Zeldovich temperature, the
rate at which NOx is produced during combustion increases exponentially, leading to increased emissions.


3-1
3. BENEFIT-COST EVALUATION FRAMEWORK AND ANALYSIS
3.1 Overview of the Benefit-Cost Evaluation
This is a retrospective benefit-cost evaluation analysis; only benefits and costs through 2007 are considered, although laser and optical diagnostics and combustion modeling will impact diesel fuel engine efficiency into the future.26 As a result of this retrospective focus, and other assumptions discussed below, the findings presented herein are conservative.27
The study identifies, documents, and validates four categories of benefits:
• economic benefits; • environmental and health benefits; • energy security benefits; and • knowledge benefits.
Economic benefits for fuel reduction are quantified in monetary terms, as are the health benefits. Environmental emission reduction benefits are quantified but not monetized. The security and knowledge benefits are described using quantitative, non-monetary measures and qualitative descriptors.
Categories of benefits quantified in monetary terms, which are associated with research in and the application of laser and optical diagnostics and combustion modeling applied to heavy-duty diesel engines, are compared to the total research costs of the entire ACE R&D sub-program’s research areas (see Table 1-3), including the research costs associated with the CRF. These comparisons are then calculated using traditional economic evaluation metrics.
3.2 Budget History of Advanced Combustion Engineering R&D
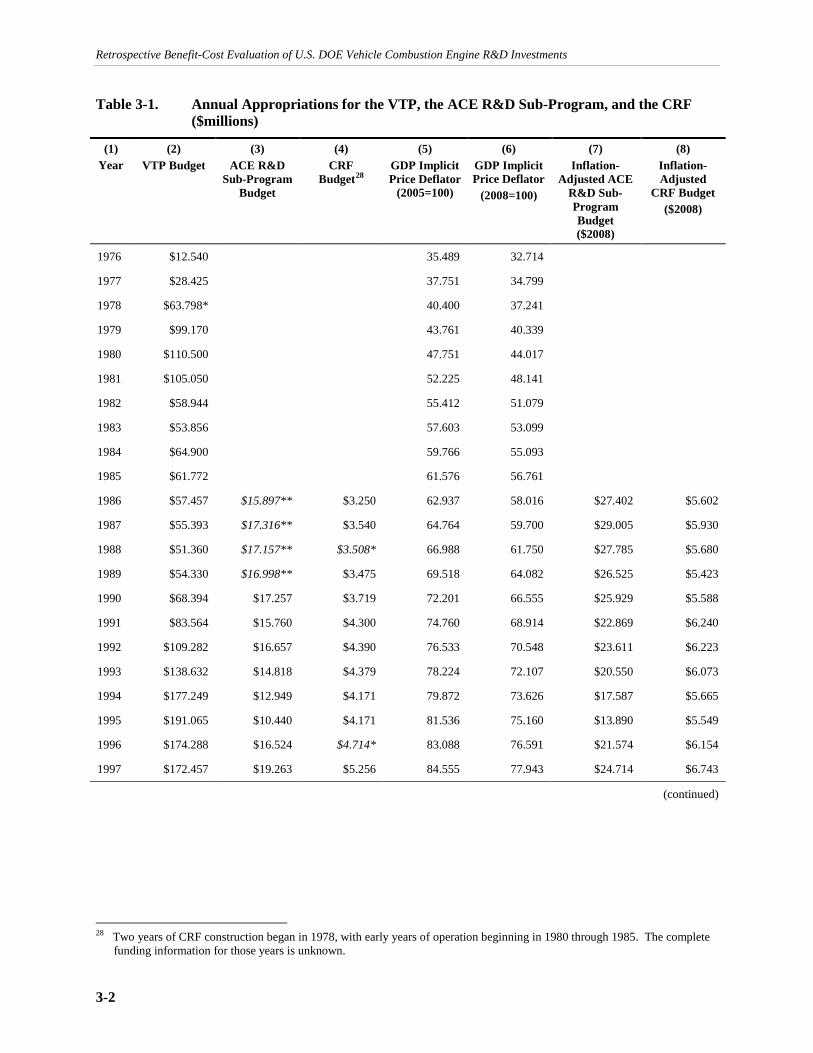
Table 3-1 shows the aggregate annual appropriation budgets for both the VTP and the ACE R&D sub-program. It also shows the annual DOE Office of Science budgets for the cross-cutting research programs that are related to combustion and that are within the CRF. Data are missing for several years. Approximations for these missing data are shown in italics, with explanations about the approximations in the Notes following the table. For reference purposes only, the VTP budget is reported in Column (2). In 2008, the ACE R&D sub-program budget was nearly 21% of the VTP budget.
The sum of the cost data for ACE R&D sub-program and for the CRF, by year, is used in the economic evaluation in Section 3.4 as the appropriate cost basis for research that led to advances in laser and optical diagnostics and combustion modeling related to heavy-duty diesel engines. There, all data are in inflation-adjusted (real) 2008 dollars (see Columns 7 and 8 of Table 3-1). The conversion of actual (nominal) costs to real costs is through the Gross Domestic Product (GDP) Implicit Price Deflator, shown in Column (5) with 2005 as the base year and in Column (6) with 2008 as the base year.
26 Cost data for 2008 are available but were not used because benefit data needed for the economic evaluation (see Section 3.3)
are only available through 2007. 27 The methodology used in the economic evaluation follows the guidelines set forth in the draft Guideline for Conducting
EERE Retrospective Benefit-Cost Studies (Ruegg and Jordan, 2009).
Retrospective Benefit-Cost Evaluation of U.S. DOE Vehicle Combustion Engine R&D Investments
3-2
Table 3-1. Annual Appropriations for the VTP, the ACE R&D Sub-Program, and the CRF ($millions)
(1) Year
(2) VTP Budget
(3) ACE R&D
Sub-Program Budget
(4) CRF
Budget28
(5) GDP Implicit Price Deflator
(2005=100)
(6) GDP Implicit Price Deflator
(2008=100)
(7) Inflation-
Adjusted ACE R&D Sub-Program Budget ($2008)
(8) Inflation-Adjusted
CRF Budget ($2008)
1976 $12.540 35.489 32.714
1977 $28.425 37.751 34.799
1978 $63.798* 40.400 37.241
1979 $99.170 43.761 40.339
1980 $110.500 47.751 44.017
1981 $105.050 52.225 48.141
1982 $58.944 55.412 51.079
1983 $53.856 57.603 53.099
1984 $64.900 59.766 55.093
1985 $61.772 61.576 56.761
1986 $57.457 $15.897** $3.250 62.937 58.016 $27.402 $5.602
1987 $55.393 $17.316** $3.540 64.764 59.700 $29.005 $5.930
1988 $51.360 $17.157** $3.508* 66.988 61.750 $27.785 $5.680
1989 $54.330 $16.998** $3.475 69.518 64.082 $26.525 $5.423
1990 $68.394 $17.257 $3.719 72.201 66.555 $25.929 $5.588
1991 $83.564 $15.760 $4.300 74.760 68.914 $22.869 $6.240
1992 $109.282 $16.657 $4.390 76.533 70.548 $23.611 $6.223
1993 $138.632 $14.818 $4.379 78.224 72.107 $20.550 $6.073
1994 $177.249 $12.949 $4.171 79.872 73.626 $17.587 $5.665
1995 $191.065 $10.440 $4.171 81.536 75.160 $13.890 $5.549
1996 $174.288 $16.524 $4.714* 83.088 76.591 $21.574 $6.154
1997 $172.457 $19.263 $5.256 84.555 77.943 $24.714 $6.743
(continued)
28 Two years of CRF construction began in 1978, with early years of operation beginning in 1980 through 1985. The complete
funding information for those years is unknown.

Section 3 – Benefit-Cost Evaluation Framework and Evaluation Analysis
3-3
Table 3-1. Annual Appropriations for the VTP, the ACE R&D Sub-Program, and the CRF ($millions) (cont.)
(1) Year
(2) VTP
Budget
(3) ACE R&D
Sub-Program Budget
(4) CRF Budget
(5) GDP Implicit
Price Deflator
(2005=100)
(6) GDP Implicit
Price Deflator
(2008=100)
(7) Inflation-
Adjusted ACE R&D
Sub-Program Budget ($2008)
(8) Inflation-Adjusted
CRF Budget ($2008)
1998 $189.972 $18.318 $5.161 85.511 78.824 $23.239 $6.547
1999 $198.665 $36.976 $5.024 86.768 79.983 $46.230 $6.281
2000 $228.756 $46.750 $4.736 88.647 81.715 $57.211 $5.796
2001 $251.462 $52.205 $5.463 90.650 83.561 $62.475 $6.538
2002 $181.352 $47.160 $5.377 92.118 84.915 $55.538 $6.332
2003 $174.171 $55.267 $5.935 94.100 86.742 $63.714 $6.842
2004 $172.395 $52.736 $5.892 96.770 89.203 $59.119 $6.605
2005 $161.326 $48.480 $6.437 100 92.180 $52.593 $6.983
2006 $178.351 $40.594 $6.251 103.257 95.183 $42.649 $6.567
2007 $183.580 $48.346 $7.648 106.214 97.908 $49.379 $7.811
2008 $208.359 $43.443 $6.755 108.483 100 $43.443 $6.755
Notes:
When data are not available for a particular year/program, the cell is blank.
* denotes values that were constructed as the average for the juxtaposed years.
** denotes values that were constructed on the basis of the average ratio of the CRF budget to the ACE R&D sub-program budget for all available years.
Column (4) represents DOE Office of Science funding for cross-cutting research programs that are related to combustion and that are within the CRF.
Column (6) = Column (5) / (108.483 / 100).
Column (7) = Column (3) / (Column (6) / 100).
Column (8) = Column (4) / (Column (6) / 100).
Year 2008 shown to benchmark the GDP deflator in Column (6).
Sources:
Nominal budget data in Columns (2) – (4) provided by EERE.
GDP Implicit Price Deflator (2005=100) from U.S. DoC (2009).
The sum of the ACE R&D sub-program and CRF budgets overstates the costs of laser and optical diagnostics and combustion modeling research for several reasons. First, laser and optical diagnostics and combustion modeling are only two of the four research areas within the ACE R&D sub-program (see Table 1-3). In 1986 only about 33% of the ACE R&D’s engine budget was focused on diesel engines for

Retrospective Benefit-Cost Evaluation of U.S. DOE Vehicle Combustion Engine R&D Investments
3-4
light- and heavy-duty applications, but that percentage increased over time to about 80% by the mid-1990s and was even larger by 2007, with heavy-duty applications of interest in this report being about a third of the total. 29
Table 3-2 summarizes the specific costs that will be compared to the benefits attributable to laser and optical diagnostics and combustion modeling in Section 3.4. Specifically, the total of the ACE R&D sub-program research costs and the CRF research costs (hereafter, simply ACE R&D sub-program costs) are used in the benefit-cost evaluation calculations in Section 3.4. These costs began in 1986, the first year of available cost data for the ACE R&D sub-program and the CRF; more importantly, this is also the approximate date when laser and optical diagnostics and combustion modeling research started to be applied to heavy-duty diesel engines.
Table 3-2. Cost Data Used in the Evaluation of Economic Benefits ($millions)
(1) Year
(2) ACE R&D Sub-Program
($2008)
(3) CRF
($2008)
(4) Total
($2008)
1986 $27.402 $5.602 $33.004
1987 $29.005 $5.930 $34.935
1988 $27.785 $5.680 $33.465
1989 $26.525 $5.423 $31.948
1990 $25.929 $5.588 $31.517
1991 $22.869 $6.240 $29.109
1992 $23.611 $6.223 $29.834
1993 $20.550 $6.073 $26.623
1994 $17.587 $5.665 $23.252
1995 $13.890 $5.549 $19.439
1996 $21.574 $6.154 $27.728
1997 $24.714 $6.743 $31.457
1998 $23.239 $6.547 $29.786
1999 $46.230 $6.281 $52.511
2000 $57.211 $5.796 $63.007
2001 $62.475 $6.538 $69.013
(continued)
29 Siebers (October 13, 2009). McLean (October 22, 2009) agrees with this funding trend assessment. Beginning in the late-
1990s, a significant portion of the ACE R&D budget was devoted to exhaust aftertreatment research.
Section 3 – Benefit-Cost Evaluation Framework and Evaluation Analysis
3-5
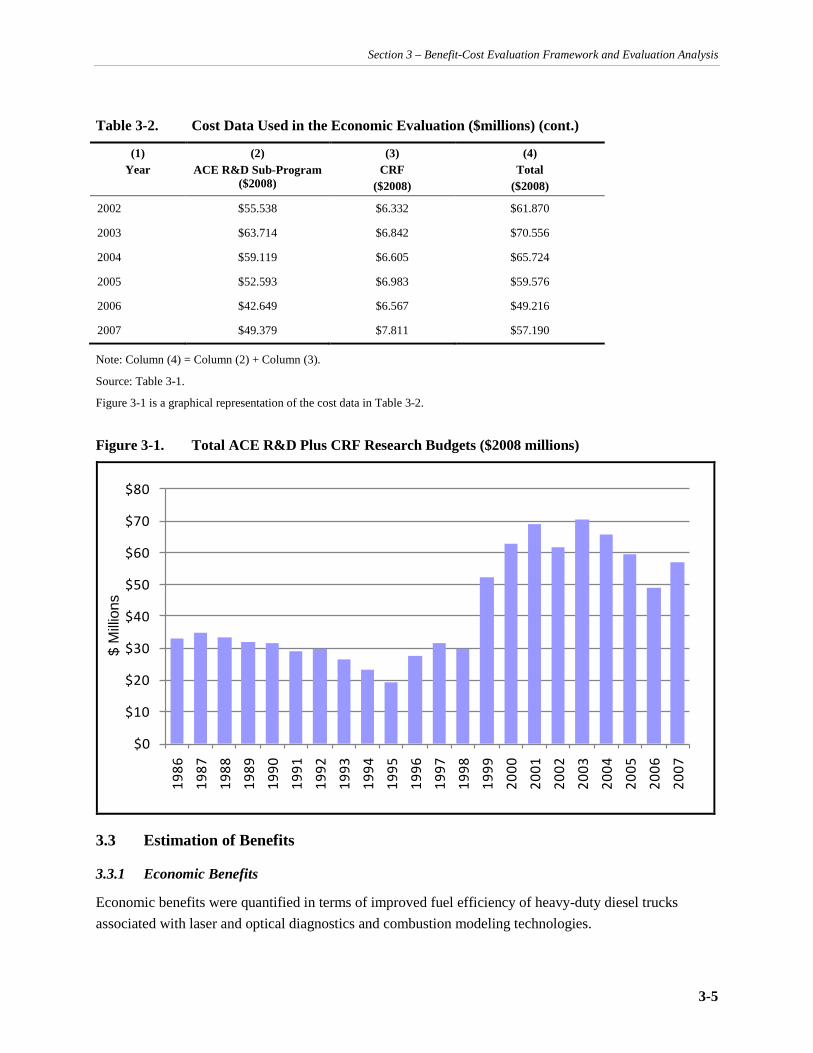
Table 3-2. Cost Data Used in the Economic Evaluation ($millions) (cont.)
(1) Year
(2) ACE R&D Sub-Program
($2008)
(3) CRF
($2008)
(4) Total
($2008)
2002 $55.538 $6.332 $61.870
2003 $63.714 $6.842 $70.556
2004 $59.119 $6.605 $65.724
2005 $52.593 $6.983 $59.576
2006 $42.649 $6.567 $49.216
2007 $49.379 $7.811 $57.190
Note: Column (4) = Column (2) + Column (3).
Source: Table 3-1.
Figure 3-1 is a graphical representation of the cost data in Table 3-2.
Figure 3-1. Total ACE R&D Plus CRF Research Budgets ($2008 millions)
$0
$10
$20
$30
$40
$50
$60
$70
$80
1986
1987
1988
1989
1990
1991
1992
1993
1994
1995
1996
1997
1998
1999
2000
2001
2002
2003
2004
2005
2006
2007
3.3 Estimation of Benefits
3.3.1 Economic Benefits
Economic benefits were quantified in terms of improved fuel efficiency of heavy-duty diesel trucks associated with laser and optical diagnostics and combustion modeling technologies.
$ M
illion
s
Retrospective Benefit-Cost Evaluation of U.S. DOE Vehicle Combustion Engine R&D Investments
3-6
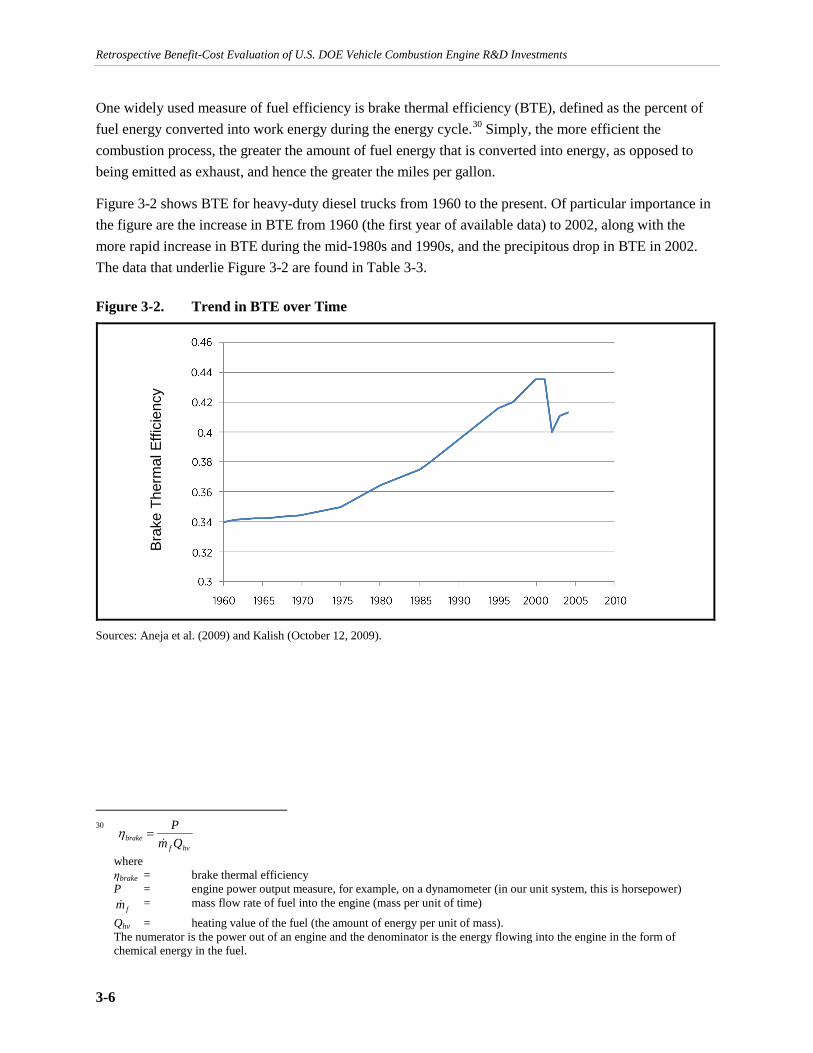
One widely used measure of fuel efficiency is brake thermal efficiency (BTE), defined as the percent of fuel energy converted into work energy during the energy cycle.30 Simply, the more efficient the combustion process, the greater the amount of fuel energy that is converted into energy, as opposed to being emitted as exhaust, and hence the greater the miles per gallon.
Figure 3-2 shows BTE for heavy-duty diesel trucks from 1960 to the present. Of particular importance in the figure are the increase in BTE from 1960 (the first year of available data) to 2002, along with the more rapid increase in BTE during the mid-1980s and 1990s, and the precipitous drop in BTE in 2002. The data that underlie Figure 3-2 are found in Table 3-3.
Figure 3-2. Trend in BTE over Time
Sources: Aneja et al. (2009) and Kalish (October 12, 2009).
30
hvfbrake Qm
P
=η
where ηbrake = brake thermal efficiency P = engine power output measure, for example, on a dynamometer (in our unit system, this is horsepower)
fm = mass flow rate of fuel into the engine (mass per unit of time)
Qhv = heating value of the fuel (the amount of energy per unit of mass). The numerator is the power out of an engine and the denominator is the energy flowing into the engine in the form of
chemical energy in the fuel.
Brak
e Th
erm
al E
ffici
ency

Section 3 – Benefit-Cost Evaluation Framework and Evaluation Analysis
3-7
Table 3-3. Values of BTE Shown in Figure 3-2
(1) Year
(2) BTE
(1) Year (cont.)
(2) BTE (cont.)
(1) Year (cont.)
(2) BTE (cont.)
1960 0.340 1976 0.353 1992 0.403
1961 0.341 1977 0.356 1993 0.407
1962 0.341 1978 0.359 1994 0.411
1963 0.342 1979 0.361 1995 0.415
1964 0.342 1980 0.365 1996 0.418
1965 0.343 1981 0.367 1997 0.421
1966 0.343 1982 0.369 1998 0.425
1967 0.343 1983 0.371 1999 0.430
1968 0.343 1984 0.373 2000 0.435
1969 0.344 1985 0.375 2001 0.435
1970 0.345 1986 0.379 2002 0.400
1971 0.346 1987 0.383 2003 0.411
1972 0.347 1988 0.387 2004 0.413
1973 0.348 1989 0.391 2005 0.416
1974 0.349 1990 0.395 2006 0.419
1975 0.350 1991 0.399 2007 0.422
Source: Aneja et al. (2009) and Kalish (2009). These sources report BTE values only for selected years due to the confidential nature of such data. Intervening years of data were interpolated and estimated (shown in italics) on the basis of extensive discussions with industry scientists from Cummins Engine and Detroit Diesel Corporation.
The trend in BTE in Figure 3-2 is important in the calculation of economic benefits below. In particular, changes in U.S. Environmental Protection Agency (EPA) regulations have influenced BTE over time. In the statistical analysis related to the calculation of economic benefits, that influence is held constant or controlled for in the relationship between BTE and related fuel savings.
The EPA applied its first emissions standards to heavy-duty diesel engines beginning with model year 1974, setting upper limits for NOx, sulfur dioxide (SOx), and hydrocarbon emissions. Standards were first placed on PM for vehicles in model year 1988. In 2000, the EPA finalized the rules that require additional reductions in NOx for newly manufactured highway diesel engines. The higher standard was intended to apply to heavy-duty diesel trucks beginning in model year 2004. In 1998, the EPA, the U.S. Department of Justice, and the California Air Resources Board settled a lawsuit over several manufacturers’ installation of “defeat devices” in heavy-duty diesel trucks. These engine-performance enhancing devices also increased NOx emissions during specific performance intervals, thereby evading proper emissions testing and violating the emissions standards passed in 1974. As part of the settlement (referred to as the
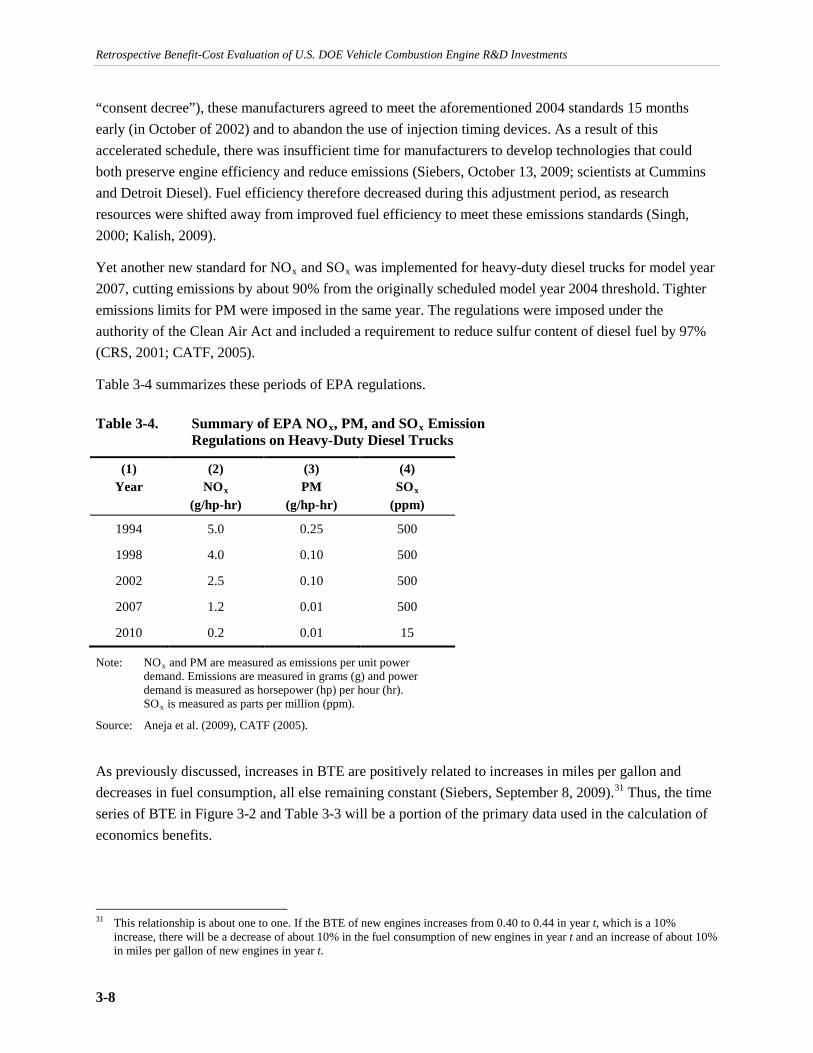
Retrospective Benefit-Cost Evaluation of U.S. DOE Vehicle Combustion Engine R&D Investments
3-8
“consent decree”), these manufacturers agreed to meet the aforementioned 2004 standards 15 months early (in October of 2002) and to abandon the use of injection timing devices. As a result of this accelerated schedule, there was insufficient time for manufacturers to develop technologies that could both preserve engine efficiency and reduce emissions (Siebers, October 13, 2009; scientists at Cummins and Detroit Diesel). Fuel efficiency therefore decreased during this adjustment period, as research resources were shifted away from improved fuel efficiency to meet these emissions standards (Singh, 2000; Kalish, 2009).
Yet another new standard for NOx and SOx was implemented for heavy-duty diesel trucks for model year 2007, cutting emissions by about 90% from the originally scheduled model year 2004 threshold. Tighter emissions limits for PM were imposed in the same year. The regulations were imposed under the authority of the Clean Air Act and included a requirement to reduce sulfur content of diesel fuel by 97% (CRS, 2001; CATF, 2005).
Table 3-4 summarizes these periods of EPA regulations.
Table 3-4. Summary of EPA NOx, PM, and SOx Emission Regulations on Heavy-Duty Diesel Trucks
(1) Year
(2) NOx
(g/hp-hr)
(3) PM
(g/hp-hr)
(4) SOx
(ppm)
1994 5.0 0.25 500
1998 4.0 0.10 500
2002 2.5 0.10 500
2007 1.2 0.01 500
2010 0.2 0.01 15
Note: NOx and PM are measured as emissions per unit power demand. Emissions are measured in grams (g) and power demand is measured as horsepower (hp) per hour (hr). SOx is measured as parts per million (ppm).
Source: Aneja et al. (2009), CATF (2005).
As previously discussed, increases in BTE are positively related to increases in miles per gallon and decreases in fuel consumption, all else remaining constant (Siebers, September 8, 2009).31 Thus, the time series of BTE in Figure 3-2 and Table 3-3 will be a portion of the primary data used in the calculation of economics benefits.
31 This relationship is about one to one. If the BTE of new engines increases from 0.40 to 0.44 in year t, which is a 10%
increase, there will be a decrease of about 10% in the fuel consumption of new engines in year t and an increase of about 10% in miles per gallon of new engines in year t.
Section 3 – Benefit-Cost Evaluation Framework and Evaluation Analysis
3-9
Based on data provided during extensive telephone interviews with a scientist at each of three companies, Caterpillar, Cummins Engine, and Detroit Diesel Corporation,32 which collectively account for about 75% of the heavy-duty diesel engines manufactured in the United States,33 the consensus opinion from these experts is that:
• The impact of the ACE R&D sub-program’s research on and application of laser and optical diagnostics and combustion modeling, which began in 1986, had a measurable impact on the BTE of heavy-duty diesel engines not later than 1995.34, 35, 36
• Without the ACE R&D sub-program’s research in and application of laser and optical diagnostics and combustion modeling to heavy-duty diesel engines, BTE from 1995 through 2007 would have been 4.5% lower per year than shown in Figure 3-2.37, 38 This percentage is a critical datum in the calculation of economic benefits (below). Figure 3-3 illustrates this assumption.39
• Without the ACE R&D sub-program’s research in and application of laser and optical diagnostics and combustion modeling, the U.S. diesel engine industry would not have been able to conduct the research necessary to duplicate the application of these technologies to heavy-duty diesel engines, even with the research assistance of universities. The industry could not have absorbed the requisite capital cost of R&D and could not have achieved the needed economies of scale in R&D to warrant the effort.40
32 Contacts were provided by Singh (September 9, 2009). It was agreed with each industry expert during his telephone interview
that his name would not be reported in this study and that specific responses would not be attributed to his company. On the one hand, it could be argued that scientists at these companies, all of which have been funded by DOE in the past, might be less than objective when providing information related to this study. On the other hand, there are no other companies that have the insight necessary to provide the information needed in the calculation of benefits for this study (or that would be likely to participate in such a study).
33 This information is based on market share information provided by one of these companies. Caterpillar is in the process of exiting the heavy-duty truck market, and as their market share declined in 2008 and 2009, the market share of Cummins and Detroit Diesel increased.
34 This statement implies that there was a 10-year lag between laser and optical diagnostics and combustion modeling research relevant to heavy-duty diesel engines and its impact on newly manufactured engines. According to McLean (October 22, 2009), a 10-year lag was relevant then but not now. Today, primarily because of more powerful lasers and improved measurement tools, the lag between ACE R&D’s research and its application in industry is much shorter, possibly a few years for incremental improvements in efficiency.
35 The initial response by company scientists about the date or time period when laser and optical diagnostics and combustion modeling began to have an impact on the BTE of heavy-duty diesel engines was “mid-1990s.” When queried about an exact impact date, 1995 was the year that was always given. Still, 1995 should be viewed as a point estimate.
36 These starting dates for the relevant research, and hence for cost, came from Siebers (October 13, 2009) and McLean (October 22, 2009).
37 Responses from all three company scientists were the same, 4–5%. The mean response was 4.5%. Ample interview time was spent with company scientists to ensure that each fully understood the counterfactual interview question about the post-1995 trend in BTE absent the ACE R&D sub-program’s diagnostics and modeling research.
38 Also mentioned by the industry scientists was that EERE’s investments in the entire ACE R&D sub-program have increased the fuel efficiency of heavy-duty diesel engines by 5–10% since 1995. No analysis was done on this reported fuel savings.
39 All of the company scientists were of the opinion that a vertical drop in Figure 3-2 of 4.5% of the graphed value beginning in 1995 is the most appropriate characterization of the counterfactual scenario. None were of the opinion that BTE would, instead, drop gradually over time. In fact, one scientist drew on a rendition of Figure 3-2 his view of the counterfactual BTE diagram to emphasize his opinion about a vertical drop of 4.5% beginning in 1995.
40 One industry interviewee emphasized the importance of the public/private partnership among the DOE laboratories, industries, and universities (participating through DOE funding). Absent this public/private partnership, many, if not most, of the advancements in heavy-duty engine efficiency would not have occurred. Relatedly, Aneja and Kayes (2009) and U.S. DOE (2006), using the pre-2002 data in Figure 3-2, projected that BTE would have continued to decline after 2002 if DOE funding had not continued. In fact, this scenario was presented by them at the 2009 Directions in Engine-Efficiency and Emissions Research conference.

Retrospective Benefit-Cost Evaluation of U.S. DOE Vehicle Combustion Engine R&D Investments
3-10
Figure 3-3. Trend in BTE over Time with Counterfactual Scenario
Sources: Table 3-3 and interview information.
With reference to the Guidelines for Conducting EERE Retrospective Benefit-Cost Studies (Ruegg and Jordan, 2009), two critical elements of a benefit-cost evaluation are: A) the documentation of the next best alternative technology that would have existed without the studied technologies; and B) the degree of the attributable impact of public funding assignable to the benefits associated with the technology being studied compared to the next best alternative technology.
3.3.1.1 Next Best Alternative Technology
Absent the ACE R&D sub-program’s research in and application of laser and optical diagnostics and combustion modeling, the next best technology would be the state-of-the-art in diesel engine design and related BTE that existed prior to 1995. Thus, the next best alternative technology is represented in Figure 3-3 by the “BTE Absent ACE R&D Research on Diagnostics and Modeling” trend line from 1995 through 2007.
As discussed, the data underlying the counterfactual situation of an absence of the ACE R&D sub-program’s research in and application of laser and optical diagnostics and combustion modeling came from interview information with scientists at Caterpillar, Cummins Engine, and Detroit Diesel Corporation.
Brak
e Th
erm
al E
ffici
ency

Section 3 – Benefit-Cost Evaluation Framework and Evaluation Analysis
3-11
3.3.1.2 Attribution
The measured increase in BTE of heavy-duty diesel engines from 1995 through 2007 is 100% attributable to ACE R&D sub program’s research in and application of laser and optical diagnostics and combustion modeling. That is, in the absence of the ACE R&D sub-program’s research, the U.S. diesel engine industry would not have been able to conduct the research necessary to duplicate the resultant technologies, even with the research assistance of universities.
This assumption of 100% attribution follows from three independent sources: 1) a documented argument used to justify the initial creation of the CRF, 2) insight from DOE scientists and industry experts about industry’s research capabilities at that time, and 3) economic theory.
Regarding the argument used to justify the initial creation of the CRF, McLean (October 22, 2009) is of the opinion that the level of knowledge and complexity required to develop and implement laser and optical diagnostics and combustion modeling measurements was too costly for industry to have developed on its own. Even under the hypothetical assumption that industry could have funded such an endeavor, including the cost of the equipment, industry would still not have been able to achieve the synergies among scientists from various fields that were achieved at the DOE-funded CRF. According to McLean (October 22, 2009), the capital costs to replicate the knowledge from the ACE R&D sub-program’s research in laser and optical diagnostics and combustion modeling were prohibitive from industry’s perspective. And, as discussed in Section 2.1 with respect to the history of the CRF, the initial rationale for the facility was that companies could not incur the capital costs to learn detailed information about the combustion process (Carlisle et al., 2002).
Of course, the engine companies have contributed to improvements in BTE over time, but the measured increase in BTE above the counterfactual level posited herein is 100% attributable to ACE R&D sub-program’s research.
Regarding the insights about industry capabilities from DOE scientists and industry experts, the discussion above in Section 3.3.1.1 explains that the next best technology would be the state-of-the-art in diesel engine design and related BTE that existed prior to 1995. The consensus opinion of scientists and industry experts interviewed was that BTE of heavy-duty truck engines from 1995 through 2007 was 4.5% lower than it would have been, absent DOE’s involvement.
Finally, the assumption of 100% attribution follows from the theoretical discussion in Appendix B, Table B-1, regarding the economic rationale for government support of combustion research. One factor that creates barriers to innovation that lead to technological market failure is high capital costs to undertake the underlying R&D.
3.3.1.3 Statistical Measurements
A statistical approach was adopted for the calculation of the economic benefits associated with the ACE R&D sub-program’s research in and application of laser and optical diagnostics and combustion modeling. This statistical approach depends on the opinion of industry experts (discussed above) that in

Retrospective Benefit-Cost Evaluation of U.S. DOE Vehicle Combustion Engine R&D Investments
3-12
the absence of the ACE R&D sub-program’s diagnostics and modeling research, BTE from 1995 to the present would be 4.5% lower than actual BTE over that same period, as illustrated in Figure 3-3.
To calculate the statistical relationship between changes in BTE in year t (BTEt) and changes in the fuel economy of heavy-duty diesel engines in year t measured by miles per gallon in year t (MPGt) holding constant the influence of the EPA regulations in Table 3-4 on fuel economy, the following regression model was estimated:
MPGt = α + β1 BTEt + β2 d94 + β3 d98 + β4 d02 + ε t (3.1)
where d94, d98, and d02 are binary variables equal to 1 for EPA regulation periods (see Table 3-4), and where ε t is a normal and randomly distributed error term.41
Fundamental to quantifying the economic benefits attributable to the ACE R&D sub-program’s research in and application of laser and optical diagnostics and combustion modeling is the calculation of reduced fuel consumption per year from 1995 through 2007 on heavy-duty diesel engines. Table 3-5 shows diesel fuel consumption and fuel economy (miles per gallon [MPG]) over time. The data for MPGt in equation (3.1) are in Column (5). These available data related to fuel economy, or MPG, are specific to all vintages of Class 7 and Class 8 heavy-duty diesel trucks registered, by year, not to only new ones.42 Because changes in BTE in year t will have an impact only on new heavy-duty diesel engines in trucks registered in year t, the estimated coefficient on BTE in equation (3.1) implicitly controls for the fact that available data on MPG are not vintage/class specific.43
The regression results from the estimation of equation (3.1) using data from 1970 through 2007 are reported in Table 3-6.44 The estimated coefficient on BTE is positive, as expected, and statistically significant at the 0.001 level or better. Also, the estimated coefficients on each of the binary variables, denoting various periods of EPA regulation, are negative, as expected. The estimated coefficient on d94 is not statistically significant at a conventional level (it is statistically significant at the 0.15 level), but the estimated coefficients on d98 and d02 are statistically significant at the 0.001 level or better.
41 A binary variable for 2007, d07, was not included in the regression model. Rather, d02 = 1 for years 2002–2007 and 0
otherwise. As discussed below, data on MPGt are available through 2007, thus d07 would equal 1 for only one year, 2007, and it would be 0 otherwise. As a result, if d07 was included as an additional regressor, β1 would be identical to that estimated in a regression in which the data for 2007 were deleted.
42 Class 7 trucks are greater than 26,000 pounds, and Class 8 trucks are greater than 33,000 pounds (NRC, 2008). 43 If this were not the case, and given the previously noted relationship between BTE and MPG being about one to one, β1 from
equation (3.1) would be approximately equal to 1, other factors held constant. 44 Data prior to 1970 and for 2008 are not available in the Transportation Energy Data Book, 28th Edition (Davis et al., 2009).

Section 3 – Benefit-Cost Evaluation Framework and Evaluation Analysis
3-13
Table 3-5. Trends and Summary Statistics on Heavy-Duty Diesel Trucks
(1) Year
(2) Registrations (thousands)
(3) Vehicle Travel (million
miles)
(4) Fuel Consumption
(million gallons)
(5) Fuel Economy
(MPG)
1970 905 35,134 7,348 4.781
1971 919 37,217 7,595 4.900
1972 961 40,706 8,120 5.013
1973 1,029 45,649 9,026 5.058
1974 1,085 45,966 9,080 5.062
1975 1,131 46,724 9,177 5.091
1976 1,225 49,680 9,703 5.120
1977 1,240 55,682 10,814 5.149
1978 1,342 62,992 12,165 5.178
1979 1,386 66,992 12,864 5.208
1980 1,417 68,678 13,037 5.268
1981 1,261 69,134 13,509 5.118
1982 1,265 70,765 13,583 5.210
1983 1,304 73,586 13,796 5.334
1984 1,340 77,377 14,188 5.454
1985 1,403 78,063 14,005 5.574
1986 1,408 81,038 14,475 5.598
1987 1,530 85,495 14,990 5.703
1988 1,667 88,551 15,224 5.817
1989 1,707 91,879 15,733 5.840
1990 1,709 94,341 16,133 5.848
1991 1,691 96,645 16,809 5.750
1992 1,675 99,510 17,216 5.780
1993 1,680 103,116 17,748 5.810
1994 1,681 108,932 18,653 5.840
1995 1,696 115,451 19,777 5.838
1996 1,747 118,899 20,192 5.888
1997 1,790 124,584 20,302 6.137
(continued)

Retrospective Benefit-Cost Evaluation of U.S. DOE Vehicle Combustion Engine R&D Investments
3-14
Table 3.5. Trends and Summary Statistics on Heavy-Duty Diesel Trucks (cont.)
(1) Year
(2) Registrations (thousands)
(3) Vehicle Travel (million
miles)
(4) Fuel Consumption (million gallons)
(5) Fuel Economy
(miles per gallon)
1998 1,831 128,159 21,100 6.074
1999 2,029 132,384 24,537 5.395
2000 2,097 135,020 25,666 5.261
2001 2,154 136,584 25,512 5.354
2002 2,277 138,737 26,480 5.239
2003 1,908 140,160 23,815 5.885
2004 2,010 142,370 24,191 5.885
2005 2,087 144,028 27,689 5.202
2006 2,170 142,169 28,107 5.058
2007 2,221 145,008 28,515 5.085
Note: Fuel economy was reported to one significant digit. It was recalculated to three significant digits based on reported data for fuel consumption and miles of vehicle travel for this table and for use in the economic evaluation analysis.
Source: Davis et al. (2009), Table 5.2 as recommended by the ACE R&D staff.
Table 3-6. Regression Results from the Estimation of Equation (3.1)
(1) Variable
(2) Estimated Coefficient
(3) Standard Error
(4) t-value
BTE 0.153* 0.018 8.49
d94 -0.218 0.142 -1.54
d98 -0.564* 0.146 -3.86
d02 -0.661* 0.113 -5.86
constant -0.283 0.666 -0.42
R2 0.82
D-W 1.91
n 38
Note: * = significant at the 0.01 level or greater.
Autocorrelation corrected using the Yule-Walker estimation method.
Source: Data on MPGt from Table 3-5, Column (5); data on BTEt from Table 3-3, Column (2), times 100.
These regression results show a positive correlation between BTE and MPG, holding constant periods of EPA regulation. The regression R2 is 0.82, implying that 82% of the variation in MPG over time is explained by variation in BTE over time, or only 18% of the variation in MPG has not been explained by

Section 3 – Benefit-Cost Evaluation Framework and Evaluation Analysis
3-15
the model in equation (3.1).45 The estimated coefficient on BTE is 0.153. Based on this estimated coefficient, a one unit change in BTE is associated with a 0.153 unit change in MPG, holding constant periods of regulation. Thus:
∂MPG/∂BTE = 0.153 (3.2)
Industry experts were of the opinion that in the absence of EERE’s investments in the ACE R&D sub-program’s research in laser and optical diagnostics and combustion modeling, BTE of heavy-duty truck engines from 1995 through 2007 would have been 4.5% lower than it actually was, as shown in Figure 3-3. Thus, BTE absent the ACE R&D sub-program’s research in laser and optical diagnostics and combustion modeling equals BTE times (1 – 0.045) from 1995 through 2007.46 The decrease in BTE resulting from the counterfactual absence of these technologies is therefore the difference between actual or observed BTE and BTE absent the ACE R&D sub program’s research in laser and optical diagnostics and combustion modeling.
Based on the regression results in Table 3-6 (as interpreted in equation 3.2), the decrease in MPG that would have occurred under the counterfactual absence of the ACE R&D sub-program’s research in laser and optical diagnostics and combustion modeling equals the decrease in actual BTE times 0.153.47 The calculations for these counterfactual-decreased MPG values are shown in Table 3-7. All other relevant data for the following calculation of these fuel efficiency benefits are shown in Table 3-8.
The calculated data in Column (5) of Table 3-7 are critical to the calculated economic benefits attributable to ACE R&D sub-program’s research in laser and optical diagnostics and combustion modeling. The calculations follow directly from the bulleted assumptions stated above, especially the assumptions related to the next best alternative technology and attribution.
In Table 3-8, actual fuel consumption (Column (3)), and actual fuel economy (Column (4)) reflect fuel efficiency from heavy-duty diesel engines that embody the ACE R&D sub-program’s research in laser and optical diagnostics and combustion modeling. Absent these technologies from 1995 through 2007, actual fuel economy (Column (4)) would be lower by the amount shown in Column (5). Lower fuel economy, or the miles per gallon that would have existed under the counterfactual situation of no laser and optical diagnostics and combustion modeling technologies, is in Column (6). Fuel consumption under the counterfactual situation (and under the implicit assumption that vehicle miles are independent of DOE research) is in Column (7). Therefore, reduced fuel consumption that can be fully attributable to the ACE R&D sub-program’s research in laser and optical diagnostics and combustion modeling in heavy-duty diesel engines is in Column (8). Over the years 1995 through 2007, a total of 17,552 million gallons of diesel fuel have been saved.
45 Factors not in the model that are positively related to MPG are truck weight, aerodynamic design of the truck, and improved
tires. Data on these variables for heavy-duty diesel trucks were not readily available. 46 This calculation underlies the “BTE Absent ACE R&D Research on Diagnostics and Modeling” curve in Figure 3-3. 47 These calculations implicitly assume that the average relationship between BTE and MPG from 1970 through 2007 also holds
for intra-year periods from1995 through 2007. To test this assumption empirically, equation (3.1) was re-estimated with three additional regressors, each constructed as the product of BTEt times the relevant binary variable for each period of EPA regulation. As a group, the regulation period–specific coefficients on BTE were not statistically different than zero.

Retrospective Benefit-Cost Evaluation of U.S. DOE Vehicle Combustion Engine R&D Investments
3-16
Table 3-7. Calculation of Decrease in Fuel Economy Absent the ACE R&D Sub-Program’s Technologies
(1) Year
(2) BTE
(3) BTE Absent ACE
R&D Sub-Program Technologies
(4) Decrease in BTE Absent ACE R&D Sub-Program
Technologies
(5) Decrease in Fuel Economy Absent
ACE R&D Sub-Program Technologies
(MPG)
1995 41.5 39.633 1.867 0.286
1996 41.8 39.919 1.881 0.288
1997 42.1 40.206 1.894 0.290
1998 42.5 40.588 1.912 0.293
1999 43.0 41.065 1.935 0.296
2000 43.5 41.543 1.957 0.299
2001 43.5 41.543 1.957 0.299
2002 40.0 38.200 1.800 0.275
2003 41.1 39.251 1.849 0.283
2004 41.3 39.442 1.858 0.284
2005 41.6 39.728 1.872 0.286
2006 41.9 40.015 1.885 0.288
2007 42.2 40.301 1.899 0.291
Notes:
Column (3) = Column (2) x (1 – 0.045).
Column (4) = Column (2) – Column (3).
Column (5) = Column (4) x 0.153.
Source: BTE data from Column (2) in Table 3-3, times 100.

Section 3 – Benefit-Cost Evaluation Framework and Evaluation Analysis
3-17
Table 3-8. Reduced Fuel Consumption with the ACE R&D Sub-Program’s Laser and Optical Diagnostics and Combustion Modeling Technologies (rounded)
(1) Year
(2) Vehicle Travel (million miles)
(3) Fuel
Consumption (million gallons)
(4) Fuel
Economy (MPG)
(5) Decrease in
Fuel Economy Absent ACE R&D Sub-Program’s
Technologies (MPG)
(6) Fuel
Economy Absent ACE R&D Sub-Program’s
Technologies (MPG)
(7) Fuel
Consumption Absent ACE R&D Sub-Program’s
Technologies (million gallons)
(8) Reduced Fuel Consumption
with ACE R&D Sub-Program’s
Technologies (million gallons)
1995 115,451 19,777 5.838 0.286 5.552 20,794 1,017
1996 118,899 20,192 5.888 0.288 5.600 21,232 1,040
1997 124,584 20,302 6.137 0.290 5.847 21,307 1,005
1998 128,159 21,100 6.074 0.293 5.781 22,169 1,069
1999 132,384 24,537 5.395 0.296 5.099 25,963 1,426
2000 135,020 25,666 5.261 0.299 4.962 27,211 1,545
2001 136,584 25,512 5.354 0.299 5.055 27,020 1,508
2002 138,737 26,480 5.239 0.275 4.964 27,949 1,469
2003 140,160 23,815 5.885 0.283 5.602 25,020 1,205
2004 142,370 24,191 5.885 0.284 5.601 25,419 1,228
2005 144,028 27,689 5.202 0.286 4.916 29,298 1,609
2006 142,169 28,107 5.058 0.288 4.770 29,805 1,698
2007 145,008 28,515 5.085 0.291 4.794 30,248 1,733
Total 17,552
Notes:
Column (6) = Column (4) – Column (5).
Column (7) = Column (2) / Column (6).
Column (8) = Column (7) – Column (3).
Source: Column (5) from Column (5) in Table 3-7.

Retrospective Benefit-Cost Evaluation of U.S. DOE Vehicle Combustion Engine R&D Investments
3-18
Table 3-9 summarizes the monetary value of the economic benefits associated with reduced fuel consumption, by year. Fuel savings in the table are valued in terms of the average annual market price of diesel fuel. From 1995 through 2007, these savings totaled $34,496 million ($2008).
Table 3-9. Economic Benefits of Reduced Fuel Consumption from the ACE R&D Sub-Program’s Research on Laser and Optical Diagnostics and Combustion Modeling Technologies (rounded)
(1) Year
(2) Reduced Fuel
Consumption with ACE R&D Sub-
Program’s Technologies
(million gallons)
(3) Average Retail
Price Diesel Fuel (per gallon)
(4) Dollar Value of Reduced Fuel Consumption (millions $)
(5) GDP Implicit Price Deflator
(2008=100)
(6) Dollar Value of Reduced Fuel Consumption
(millions $2008)
1995 1,017 $1.11 $1,128.9 75.160 $1,502.0
1996 1,040 $1.24 $1,289.6 76.591 $1,683.7
1997 1,005 $1.20 $1,206.0 77.943 $1,547.3
1998 1,069 $1.04 $1,111.8 78.824 $1,410.7
1999 1,426 $1.12 $1,597.1 79.983 $1,996.8
2000 1,545 $1.49 $2,302.1 81.715 $2,817.2
2001 1,508 $1.40 $2,111.2 83.561 $2,526.5
2002 1,469 $1.32 $1,939.1 84.915 $2,283.6
2003 1,205 $1.51 $1,819.6 86.742 $2,097.7
2004 1,228 $1.81 $2,222.7 89.203 $2,491.7
2005 1,609 $2.40 $3,861.6 92.180 $4,189.2
2006 1,698 $2.71 $4,601.6 95.183 $4,834.5
2007 1,733 $2.89 $5,008.4 97.908 $5,115.4
Total 17,552 $34,496.4
Notes:
Column (4) = Column (2) x Column (3).
Column (6) = Column (4) / (Column (5) / 100).
Sources: Column (2) from Column (8) in Table 3-8. Column (3) from EIA (2009).

Section 3 – Benefit-Cost Evaluation Framework and Evaluation Analysis
3-19
3.3.2 Environmental and Health Benefits
The environmental benefits associated with the 17.6 billion gallons of diesel fuel saved between 1995 through 2007 are quantified in terms of reduced emissions of carbon dioxide (CO2), but these greenhouse gas emission reductions are not monetized. From 1995 through 2007, the emission of CO2 from heavy-duty diesel trucks was reduced by 177.3 million metric tons,48 and this reduction is fully attributable to DOE’s investment in the research in laser and optical diagnostics and combustion modeling.
The environmental benefits associated with the 17.6 billion gallons of diesel fuel saved are further quantified in terms of reduced emissions of NOx, PM, and SOx using EPA’s Co-Benefits Risk Assessment (COBRA) model. Those reductions are shown in Table 3-10. A discussion of EPA’s COBRA model is provided in Appendix C.
Table 3-10. Emissions from 1995 through 2007
Pollutants Reduced Emissions (millions of units)
CO2 177.3 metric tons
NOx 0.063 tons
PM 3.808 tons
SOx 0.096 tons
The COBRA model also produces monetary values of avoided health incidents associated with the emission reductions of NOx, PM, and SOx shown in Table 3-10. These monetary values are shown in Table 3-11 by year. The total health benefits associated with emission reductions from research in and the application of laser and optical diagnostics and combustion modeling are estimated to be $35.7 billion ($2008) from 1995 through 2007. This estimate (Column (6), Table 3-11) is approximately equal to the dollar value of reduced fuel consumption—$34.5 billion (Column (6), Table 3-9).
Table 3-12 illustrates the monetary health benefits calculated by the COBRA model for the year 2000, the year of the greatest monetary health benefits from Table 3-11. In that year, avoided mortality accounted for 92% of total monetized health benefits.
48 Based on EPA (2010), CO2 emissions per gallon of diesel fuel = 10.1 kg.

Retrospective Benefit-Cost Evaluation of U.S. DOE Vehicle Combustion Engine R&D Investments
3-20
Table 3-11. Health Benefits from Reduced Environmental Emissions from the ACE R&D Sub-Program’s Research on Laser and Optical Diagnostics and Combustion Modeling (rounded)
(1)
Year (2)
Reduced Fuel Consumption
with ACE R&D Sub-Program’s
Technologies (million gallons)
(3) PM
(g/hp-hr) per EPA
Regulations
(4) NOx
(g/hp-hr) per EPA
Regulations
(5) SOx
(ppm) per EPA Regulations
(6) Monetary Value of Health Impacts (millions $2008)
1995 1,017 0.1 5.0 500 $2,597.8
1996 1,040 0.1 5.0 500 $2,681.1
1997 1,005 0.1 5.0 500 $2,615.8
1998 1,069 0.1 4.0 500 $2,435.4
1999 1,426 0.1 4.0 500 $3,278.1
2000 1,545 0.1 4.0 500 $3,675.1
2001 1,508 0.1 4.0 500 $3,623.5
2002 1,469 0.1 2.5 500 $2,735.7
2003 1,205 0.1 2.5 500 $2,263.4
2004 1,228 0.1 2.5 500 $2,327.9
2005 1,609 0.1 2.5 500 $3,078.0
2006 1,698 0.1 2.5 500 $3,279.0
2007 1,733 0.01 1.2 500 $1,114.0
Total 17,552 $35,704.8
Source: COBRA model; see Appendix C.
Column (2) from Column (2) in Table 3-9.

Section 3 – Benefit-Cost Evaluation Framework and Evaluation Analysis
3-21
Table 3-12. Illustration of Health Cost Calculations from the COBRA Model, Year 2000
(1) Category of Health Benefit
(2) Incidence
(3) Monetary Value of Health Impacts
(millions $2008)
Mortality 531 $3,373.2
Infant Mortality 1 $9.1
Chronic Bronchitis 357 $158.2
Non-fatal Heart Attacks 836 $91.9
Respiratory Hospital Admissions 125 $1.7
Cardio-vascular Related Hospital Admissions 258 $7.2
Acute Bronchitis 883 $0.38
Upper Respiratory Symptoms 7,899 $0.24
Lower Respiratory Symptoms 10,473 $0.20
Asthma Emergency Room Visits 466 $0.17
Minor Restricted Activity Days 438,832 $26.8
Work Loss Days 74,012 $6.0
Total $3,675.1
Source: COBRA model.
3.3.3 Energy Security Benefits
Security benefits are not monetized, but they are quantified in terms of the reduction of our Nation’s dependency on imported crude oil. As discussed above and shown in Table 3-11, the ACE R&D sub-program’s research on and application of laser and optical diagnostics and combustion modeling resulted in a reduction of 17.6 billions of diesel fuel by heavy-duty diesel trucks from 1995 through 2007.
Approximately 10.31 gallons of diesel fuel are refined from a barrel of crude oil (DOE, 2010b). However, other petroleum products are produced from a barrel of crude oil, including gasoline, heavy fuel oil, liquefied petroleum gases, and other distillates. According to DOE (2010b), 42 gallons of crude oil (~1 barrel) yields 44 gallons of petroleum products. Thus, if one assumes that 1 gallon of imported crude oil corresponds to 1 gallon of avoided diesel fuel, then from 1995 through 2007, 17.6 billion gallons of imported crude oil have been saved, or 417.9 million barrels of imported crude oil have been avoided.
From 1995 through 2007, the United States imported about 43.08 billion barrels of crude oil (DOE, 2010a). A reduction of 417.9 million barrels (0.4179 billion barrels) is approximately equal to a reduction of 1 percent of the total crude oil imported by the United States over that period of time.

Retrospective Benefit-Cost Evaluation of U.S. DOE Vehicle Combustion Engine R&D Investments
3-22
3.3.4 Knowledge Benefits49
This section presents an overview of knowledge creation and dissemination for the research areas within the ACE R&D sub-program (see Section 1, Table 1-3), with a focus on results of a patent analysis. It points out knowledge flows pertaining to the diagnostic tools selected for detailed treatment in the benefit-cost analysis presented in this report, as well as contributions to a broader knowledge base. A summary of the methodology used for the patent analyses is summarized in Appendix D; the focus in this section is on findings.
Principal conclusions supported by the patent analysis are that EERE's investment in the ACE R&D sub-program generated a knowledge base that has provided a foundation for further innovation in heavy-duty engine performance, as well as further advances in spectrometry that have been applied in materials analysis. Evidence for these conclusions includes the following:
• Companies, universities, and DOE National Laboratories were funded by EERE to conduct advanced combustion research, resulting in knowledge captured in an estimated 109 EERE-attributed patent families (i.e., groups of patents based on the same invention), most of which originated since 1999. In comparison, 10 leading vehicle and engine companies were assigned a total of 22,103 patent families related to combustion technology. Thus, EERE’s attributed patent set represents a relatively small fraction of total patenting in combustion technology (see Appendix D for a description of how the data sets were constructed).
• When the analysis was adjusted for EERE's comparatively small combustion patent portfolio by using averages instead of absolute numbers, and when the focus was on the period in which EERE-attributed patenting is concentrated, i.e., since 1999, the results reveal a strong influence of EERE's combustion patents on subsequent combustion patenting by others.
• Earlier EERE-attributed patents describing fuel injection techniques and more recent EERE-attributed patents describing compression ignition engines and engine control technologies are linked extensively to subsequent combustion patents owned by the leading innovative vehicle and engine companies.
• Highly cited combustion patents of the leading companies describing HCCI engines, EGR, and fuel injection have extensive links to earlier EERE-attributed combustion patents.
• Taking into account all application areas and all those citing, the study identified more than a dozen high-impact EERE-attributed advanced combustion patents.
• The influence of EERE’s advanced combustion research has extended beyond subsequent developments in combustion technology to include spectrometry used to analyze materials and to detect substances such as narcotics and explosives.
• Other knowledge outputs and outcomes of EERE's ACE R&D sub-program include publications; research tools; models and codes; test data; trained and experienced professionals; and a network among DOE-funded laboratories, companies, universities, and other organizations.
3.3.4.1 Trends in Combustion Patenting Attributed to EERE and to Others
The number of advanced combustion patents attributed to EERE and granted by the U.S. Patent and Trademark Office since 1975 is shown in Figure 3-4 by five-year periods. There was low patenting activity in the 1970s and 1980s, slightly more in the 1990s, and a dramatic increase since 1999. Indeed,
49 This section, prepared by Rosalie Ruegg, TIA Consulting, Inc., and Patrick Thomas, 1790 Analytics, LLC, is based on a
larger impact evaluation report coauthored by Ruegg and Thomas, entitled Linkages from DOE's Vehicle Technologies R&D in Advanced Combustion to Higher-Efficiency, Cleaner-Burning Engines: A Bibliometric Study (Ruegg and Thomas, 2010). For more details about the approach and findings, consult Appendix D and the larger source report by Ruegg and Thomas.

Section 3 – Benefit-Cost Evaluation Framework and Evaluation Analysis
3-23
more EERE-attributed advanced combustion U.S. patents were granted in the five years between 2005 and 2009 than were granted in the previous 30 years. Of DOE's 109 advanced combustion patent families, 79% were filed in the last decade.
Figure 3-4. Number of EERE-Attributed Advanced Combustion U.S. Patents Issued, 1975–2009
It is instructive to place the recent increase in EERE-attributed advanced combustion patenting in a wider context. Compared with combustion patenting by others, the EERE-attributed combustion portfolio is small. For example, the 10 leading innovative vehicle and engine companies (as identified in Appendix D) filed a total of more than 2,000 combustion patent families in each five year period since 1979. This number increased during the 1990s, and peaked at over 5,000 patents between 1999 and 2003.
The size of the EERE-attributed patent portfolio in combustion (109) is quite small compared to the more than 22,000 combustion patent families filed since 1974 by the 10 leading innovative companies. Toyota, for example, has a portfolio containing 3,658 combustion patent families; Honda, 3,179; and Ford, 2,696. Thousands of these combustion patent families predate the recent period of increase in EERE-attributed advanced combustion patents. The data comparison suggests that EERE was a relatively recent entrant into a well-established technology area. This is not surprising given that vehicle and engine manufacturers have been making improvements to engines for many decades and patenting these improvements extensively.
Yet, there remained a lack of fundamental scientific understanding of the in-cylinder combustion processes, and this technical barrier impeded improvements in efficiency and emission reductions in heavy-duty diesel engines. Thus, EERE increased its activity in the ACE R&D sub-program with a focused research agenda and the use of special research facilities and tools to increase understanding of
Num
ber o
f U.S
. Pat
ents

Retrospective Benefit-Cost Evaluation of U.S. DOE Vehicle Combustion Engine R&D Investments
3-24
in-cylinder combustion processes. This effort yielded a relatively small, but apparently potent, set of patents.
To compare EERE's influence with that of other actors in the backward tracing analysis (explained in Appendix D), the analysis needed to take into account and adjust for the comparatively small size and young age of EERE’s patent portfolio. To overcome size and timing differences, the analysis was performed using the average (mean) number of linkages since 1999, rather than the absolute numbers of patents over the entire period.
3.3.4.2 EERE-Attributed Combustion Patents as a Knowledge Base for Combustion Innovation by Leading Companies
The purpose of the study’s backward patent tracing analysis (Appendix D) was to assess if, and the extent to which, the 109 EERE-attributed combustion patent families have provided a knowledge base on which further combustion innovations by leading companies have built. To answer this question, the average number of combustion patent families of the leading companies that are linked to earlier EERE-attributed combustion patents is compared to the average number of linkages to earlier patent families of other organizations.
Based on citation averages and patent families filed since 1999, Figure 3-5 lists the leading companies and EERE in declining order of the influence of each of their combustion patent families on later patent families of these companies. EERE is in second place. Each of its combustion patents families filed since 1999 is linked to an average of 2.35 subsequent patent families owned by the leading companies. The average number of later patent families linked to DOE-attributed patents is second only to that of Nissan, whose combustion patent families filed since 1999 are each linked to an average of 2.67 later patent families of the leading companies. This comparison suggests that although EERE’s patent portfolio in advanced combustion is very small compared to those of the leading companies, EERE-attributed patents appear to have had a notable influence on subsequent developments in combustion technology.50 This finding is consistent with the fact that EERE's research was designed to overcome technical barriers impeding further improvements in combustion performance.
An analysis of the leading companies’ combustion patent families showed that many of them have built extensively on earlier EERE-funded advanced combustion research. Caterpillar leads this group in terms of its links to the earlier EERE set, with 111 of its combustion patent families linked a total of 181 times to earlier EERE-attributed combustion patents. Ford, Daimler-Chrysler (now Chrysler), and General Motors are next in number of linkages to the earlier EERE set.51 Japanese auto companies follow in terms of the total number of links of their combustion patent families to earlier EERE-attributed combustion families. 50 Without the adjustment for relative size of patent portfolios and their different age profiles, different results are obtained.
Absolute size of patent portfolios becomes the dominant factor. Results with and without the adjustments for portfolio size and time period covered are shown in detail in Ruegg and Thomas (2010).
51 It should be noted that few to none of the patents of the three companies with the most linkages to earlier EERE-attributed combustion patents (Caterpillar, DaimlerChrysler [now Chrysler], and Ford) are themselves attributable to EERE-funded combustion research.

Section 3 – Benefit-Cost Evaluation Framework and Evaluation Analysis
3-25
Figure 3-5. Organizations by Average Number of Subsequent Combustion Patent Families of Leading Companies Linked to Each of Their Earlier Combustion Patent Families (Leading Innovative Vehicle and Engine Companies and EERE Only)
0 0.5 1 1.5 2 2.5 3
Honda
Denso
Caterpillar
GM
Delphi
Ford
Toyota
Daimler
Fiat
DOE
Nissan
Average Number of Linked Families
Note: Based on the average number of citations since 1999.
3.3.4.3 Extension of the Influence of EERE-Attributed Combustion Patent Families beyond the Area of Combustion
The results of tracing forward from the 109 EERE-attributed combustion patent families to all future patent families confirm that the strongest influence has been on subsequent developments in engine and combustion technologies, as intended by EERE. However, the results also reveal a broader influence—namely, on the analyses of the properties of materials. EERE-attributed combustion patents were found to be linked to the International Patent Classification categories of "Separation of Materials" and "Investigating Materials," in addition to multiple categories relating directly to engines and fuel supply. EERE-attributed combustion patents linked to the investigation of materials are mainly concerned with ion mobility spectrometry, a research tool advanced and used by EERE's combustion research to "see" the combustion process within the cylinder.
The organizations revealed by the forward tracing to have the largest number of their patent families linked to earlier EERE-attributed combustion patents are shown in Figure 3-6. This figure includes all patent families assigned to all organizations, not just the combustion patents of leading vehicle and engine companies, as were shown previously. It is dominated by the leading vehicle and engine companies included in the backward tracing, with Ford and Caterpillar at the top. However, there are additional companies involved in engine research that now also appear on the list, such as Cummins, Bosch, Honeywell, and Hitachi. The Cummins patents describe a variety of technologies related to combustion,

Retrospective Benefit-Cost Evaluation of U.S. DOE Vehicle Combustion Engine R&D Investments
3-26
notably EGR and charge compression ignition engines. The Bosch patent is largely concerned with spark plugs and fuel injection techniques. Thus, the forward tracing reinforces that much of the impact of DOE-attributed combustion patents has been on companies developing technologies related to engines in general and combustion in particular.
Figure 3-6 also provides additional evidence of an influence of EERE-attributed combustion patent portfolio beyond engine and combustion technologies and into materials analysis. Note that the forward tracing identified three organizations (Thermo Electron, Sionex, and Charles Stark Draper Laboratory) that have significant numbers of spectrometry patents linked back to Sandia patent US #5,789,745, a 1998 patent describing ion mobility spectrometry and attributed to EERE’s funding of the ACE R&D sub-program’s research.
Figure 3-6. Organizations with the Largest Number of Patent Families Linked to Earlier EERE-Attributed Advanced Combustion Patents (All Organizations)
0 20 40 60 80 100 120 140
Southwest Res InstHitachi
LubrizolDraper Lab
HondaSionex
Siemens VDO AutoHoneywell
General ElectricThermo Electron
DelphiGeneral Motors
BoschToyota
CumminsDaimler
CaterpillarFord
Number of Patent Families
3.3.4.4 Individual EERE-Attributed Combustion Patent Families with Strong Influence52
The analysis so far has focused on results at the organizational level; however, results at the individual patent level deserve scrutiny as well. Individual EERE-attributed combustion patents are deemed to be particularly influential when they are (1) heavily cited by subsequent combustion patents of leading
52 As noted in Ruegg and Thomas (2010) and summarized in Appendix D, past research studies have shown a correlation
between intensity of patent citations and measures of technological and scientific importance. Thus, heavy citing of a patent is interpreted as suggesting that it is particularly influential, despite the fact that not every citation is significant.

Section 3 – Benefit-Cost Evaluation Framework and Evaluation Analysis
3-27
companies; (2) heavily cited by others, including those outside the field of combustion technologies; or (3) linked to subsequent high-impact patents assigned to others.
The backward tracing element of the study identified EERE-attributed combustion patent families that are linked to the largest numbers of subsequent combustion patent families owned by the leading vehicle and engine companies. The EERE patent family at the head of the list, US #4,924,828, issued in 1990, is based on research at LBNL on improved fuel injection techniques and is assigned to the University of California, the manager of the laboratory. It is linked to 110 subsequent combustion patent families owned by leading vehicle and engine companies, almost twice as many links as any other EERE-attributed combustion patent. It is one of three LBNL patent families in this group that describe improved fuel injection techniques, especially for diesel engines. The others are US #4,974,571 and US #4,926,818.
The backward tracing element also identified individual combustion patent families of the leading companies with the most citation links to EERE-attributed combustion patents. The patent family at the top of this list is patent US #7,484,494, issued in 2009 to General Motors, describing fuel injection for spark-ignited direct injection engines. It is linked to eight earlier EERE-attributed combustion patent families related to improved fuel injection. In addition, a number of patents assigned to Caterpillar are among those with the most citation links back to EERE's set. All very recent, the patents cover various advanced combustion engine techniques and are built on earlier EERE-attributed patent families. For example, the Caterpillar patent family represented by US #7,398,743, issued in 2008, describes a compression ignition device. It is linked to seven earlier EERE-attributed patent families, including families describing compression ignition engines.
The backward tracing also identified EERE-linked patents of the leading companies that had received intense citing by others.53 The patent at the top of this list is a 2002 patent assigned to Ford that describes an engine control strategy, specifically a method for transitioning between HCCI and spark ignition operation. This Ford patent is linked to an earlier EERE combustion patent and in turn is cited by 42 patents, more than six times as many citations as expected given its age and technology area. Other high-impact patents of the leading companies that are linked back to the EERE combustion set include several concerned with EGR: for example, patents assigned to Toyota through its Hino Motors subsidiary (US #6,338,245), to Ford (US #6,095,127), to Daimler through its Detroit Diesel subsidiary (US #6,305,167), and to Caterpillar (US #6,609,374). These patents are linked to a variety of earlier EERE-attributed patents describing air intake and engine control, and are themselves linked to large numbers of subsequent patents. This evidence suggests that EERE-funded research within the ACE R&D sub-program has helped form part of the foundation for important technologies, such as HCCI and EGR technologies, taken forward by leading vehicle and engine companies.
53 The degree of intensity of citing is measured by the use of Citation Index values, normalized measures derived by dividing
the number of citations received by a patent by the mean number of citations received by peer patents from the same issue year and technology. The expected index value for an individual patent is 1. A value of 10, for example, means that the patent has been cited 10 times more than would be expected given its age and technology. Patents with high Citation Index values are often referred to as "high-impact patents" in the field of patent citation evaluation.

Retrospective Benefit-Cost Evaluation of U.S. DOE Vehicle Combustion Engine R&D Investments
3-28
Shifting to a counterpart analysis for organizations not on the list of the 10 leading innovative vehicle and engine companies, another set of highly cited patents linked back to earlier EERE-attributed combustion patents was identified. These included combustion-related patents of other engine companies—most notably US #6,739,295, describing compression ignition, assigned to Hitachi, and US #6,561,157, describing engine multiple operating modes, assigned to Cummins; as well as several others assigned to Cummins and to Hitachi, all relating to engines. This analysis also identified highly cited patents outside the field of combustion, assigned to organizations totally outside the areas of engines and vehicles. These included four highly cited patents assigned to the National Research Council of Canada, all relating to mass spectrometry; two patents on ion mobility filter and detection assigned to Charles Stark Draper Laboratory, Inc.; and two patents on ion detection assigned to Thermo Electron Corporation. This finding provides further evidence of the wider importance of EERE's investment in research tools used to advance knowledge of in-cylinder combustion processes.
Taking into account all application areas and all those citing, the forward tracing element of the study also identified highly cited EERE-attributed combustion patents more broadly, defined using Citation Index values. The analysis found that EERE has funded not just one or two successful technologies, but more than a dozen highly cited combustion technologies. Among these are US #6,923,167, assigned to the University of California, describing the control and operation of HCCI engines; US #5789745, assigned to Sandia Corporation, describing ion mobility spectrometer; US #6035640, assigned to Ford Motor Company, describing a control method for turbocharged diesel engines having exhaust gas recirculation; and US #5746783, assigned to Lockheed Martin, describing a low emissions diesel fuel. Several Caterpillar patents are on the list, including US #6,769,635, describing fuel injection.
Table 3-13 lists EERE-attributed advanced combustion patents that are linked through two generations of citations to the largest number of all subsequent patent families.54 This table separates linkages to the patents of the 10 leading innovative companies and linkages to patents of others, making it possible to identify those EERE-attributed patents with a large influence that extends beyond the combustion technologies developed by the 10 leading companies. For example, only about one-third of the patent families linked to the most-linked DOE patent (US #4,924,828, a patent from LBNL research describing fuel injection for diesel engines) are those owned by the 10 leading vehicle and engine companies. Similarly, only 40% of the patent families linked to EERE-attributed patent US #6,035,640—a Ford patent describing intake for turbocharged engines—are owned by the leading companies. Even more extreme is the pattern of linkage to Sandia patent US #5,789,745, describing ion mobility spectrometry, for which none of the linkages are to combustion families owned by leading vehicle and engine companies. Similarly, none of the 58 patent families linked to EERE-attributed patent US #5,451,781, an LLNL patent describing a mass spectrometer, are combustion patents owned by the leading vehicle and engine companies. Thus, the table helps identify applications of EERE-funded ACE R&D sub-program’s research that extend beyond the leading companies and beyond combustion.
54 These results are not adjusted using Citation Index measures, which are applicable to only a single generation of citations.

Section 3 – Benefit-Cost Evaluation Framework and Evaluation Analysis
3-29
Table 3-13. EERE-Attributed Combustion Patent Families Linked to the Largest Number of Subsequent Patent Families of All Companies in All Application Areas
DOE Anchor Patent
Issue Year
Total Linked Patents
# Linked to Combustion Patents of...
Assignee Title
Leading Companies
Others
4,924,828 1990 339 110 229 University of California
Method and system for controlled combustion engines
5,789,745 1998 200 0 200 Sandia Corp. Ion mobility spectrometer using frequency-domain separation
6,035,640 2000 165 66 99 Ford Motor Co. Control method for turbocharged diesel engines having exhaust gas recirculation
6,116,026 2000 135 39 96 Daimler (Detroit Diesel)
Engine air intake manifold having built-in intercooler
4,974,571 1990 122 19 103 University of California
Pulsed jet combustion generator for non premixed charge engines
4,493,297 1985 121 12 109 Geo-Centers Inc. Plasma jet ignition device
6,119,451 2000 111 12 99 University of California
Nitrogen oxide removal using diesel fuel and a catalyst
6,173,567 2001 87 27 60 University of Chicago
Method to reduce diesel engine exhaust emissions
6,055,808 2000 84 24 60 University of Chicago
Method and apparatus for reducing particulates and NOx emissions from diesel engines utilizing oxygen enriched combustion air
4,926,818 1990 68 9 59 University of California
Pulsed jet combustion generator for premixed charge engines
5,746,783 1998 65 2 63 Lockheed Martin Low emissions diesel fuel
5,451,781 1995 58 0 58 University of California
Mini ion trap mass spectrometer
5,671,716 1997 43 18 25 Ford Motor Co. Fuel injection system and strategy
5,271,365 1993 41 10 31 DOE Jet plume injection and combustion system for internal combustion engines
5,876,195 1999 40 0 40 University of California
Laser preheat enhanced ignition
6,199,519 2001 33 1 32 Sandia Corp Free-piston engine
5,921,221 1999 30 2 28 Lockheed Martin/Ford
Method of controlling cyclic variation in engine combustion
6,843,231 2005 29 27 2 Caterpillar Inc. Cylinder to cylinder balancing using intake valve actuation

Retrospective Benefit-Cost Evaluation of U.S. DOE Vehicle Combustion Engine R&D Investments
3-30
3.3.4.5 Publications
A set of 112 publications in advanced combustion topics was identified by searching DOE's Office of Scientific and Technical Information (OSTI) database by topic and sponsoring organization. Slightly more than half were technical reports, and the rest mostly conference publications. By topic, research tools accounted for 16% of these publications; HCCI engines, 14%; fuel-related publications, 23%, and fuel injection, 8%, among other topics treated.
A few of these publications had relatively high citation rates. Among these were LANL publications on the KIVA code, discussed in Section 2.3. Affiliations of those citing the KIVA code publications included Caterpillar, Ford, General Motors, NASA, and numerous domestic and foreign institutes and universities. The KIVA codes are also cited by a publication on modeling bio-spray for upper airways (of humans), as well as by those dealing with vaporization of gasoline in direct injection and HCCI engines, indicating multiple applications of the KIVA code.
Other highly cited publications included three on HCCI by LLNL researchers, including one with coauthors from Cummins Engine Company, the University of Wisconsin-Madison, and the University of California-Berkeley. Affiliations of those citing these publications included Caterpillar, Markel Engineering, Ford, General Motors, Volvo Powertrain, Shell, ExxonMobil, Jaguar Cars, other DOE researchers, and many domestic and foreign institutes and universities. Another highly cited publication was a conference publication by researchers from the National Renewable Energy Laboratory, along with other DOE coauthors and coauthors from West Virginia University, dealing with emissions from trucks using Fischer-Tropsch diesel fuel. Affiliations of those citing this publication included environmental and health offices in New York State, Canada, Sweden, Australia, and Taiwan; ExxonMobil, Shell, and BP; engineering and consulting companies; and a number of national institutes, research councils, and universities.
It should also be emphasized that considerable publishing on advanced combustion research by DOE researchers occurs in industry journals and special publications, such as those by the Society of Automotive Engineers (SAE), and many of these publications appear not to have been found by the search of the DOE OSTI database. For example, two recent SAE special collections—Combustion and Flow Diagnostics and Fundamental Advances in Thermal and Fluid Sciences and Compression Ignition Combustion Processes—include multiple publications by Sandia researchers and researchers in university combustion research centers funded by EERE. Reportedly, publishing by EERE combustion researchers in SAE and other industry journals provides a targeted path of knowledge flow direct to commercial users.55
3.3.4.6 Other Knowledge Outputs and Outcomes
There are notable categories of DOE and EERE knowledge outputs and outcomes that are not well captured by patent and publication analyses. Among these are models and computer codes distributed
55 A fuller analysis of EERE contributions in advanced combustion through SAE publications is provided in the larger report by
Ruegg and Thomas (2010).

Section 3 – Benefit-Cost Evaluation Framework and Evaluation Analysis
3-31
through software licensing agreements, databases of test data accessed electronically, and tacit knowledge that has not been codified, but remains embodied in researchers and other people.
The ACE R&D sub-program’s research in advanced combustion has not only resulted in the training of researchers in the field, but also the fostering of a network among them across organizations. Networks of organizations and people enhance knowledge creation through collaborative research and the flow of knowledge. This network, depicted by Figure 3-7, has facilitated both knowledge creation and flow.
Universities have been strongly represented among the organizations funded by DOE's ACE R&D sub-program. Among them, the University of Wisconsin's Engine Research Center conducts combustion research and produces trained researchers and technologists in the field. The facility also coordinates a Diesel Emission Reduction Consortium, which fosters further collaborative activities among companies, EERE, and universities.
Figure 3-7. A Network of Organizations Facilitates Combustion Knowledge Creation and Flow

Retrospective Benefit-Cost Evaluation of U.S. DOE Vehicle Combustion Engine R&D Investments
3-32
Industry partnerships among EERE and companies serve as another important element of the network. These partnerships link EERE's ACE R&D sub-program directly to companies who help to develop new combustion technologies and are positioned to apply the resulting innovations commercially to increase the performance of engines. Participating companies included companies from the automotive industry, the heavy equipment industry, and the oil and gas industry. Among them are General Motors, Ford, and Chrysler; as well as automotive companies headquartered in other countries, through an arrangement with the International Energy Agency. Partnering companies from the heavy truck and other heavy equipment industry have included Cummins, Caterpillar, Babcock and Wilcox, Makel Corporation, Detroit Diesel Corporation, and Engelhard. Companies from the oil and gas sector have included ExxonMobil, Marathon-Ashland, Shell, and others.
3.4 Economic Evaluation Analysis
Table 3-14 shows the annual costs of EERE’s investments in the ACE R&D sub-program and related CRF research costs, and the calculated annual benefits associated with the ACE R&D sub-program’s research in laser and optical diagnostics and combustion modeling. Costs are relevant from 1986 through 2007,56 and benefits are relevant from 1995 through 2007. All values are in 2008 dollars. Benefits were truncated at the end of 2007 due to lack of mileage and fuel use data for 2008; these variables were not extrapolated to 2008 because the economy was in a recession, and thus, any choice of a base year for the extrapolation would have been speculative. However, benefits beyond 2007 will continue to accrue, although they are not considered in the economic analysis, thus adding to its conservativeness.
Three economic evaluation metrics are calculated using the data in Table 3-14: present value of net benefits (NB), benefit-to-cost ratio (B/C), and internal rate of return (i).
Mathematically:
NB = ∑ [B1995 /(1+r)10 + … + B2007 /(1+r)22] – ∑ [C1986 /(1+r)0 + … + C2007 /(1+r)21] (3.3)
B/C = ∑ [B1995 /(1+r)10 + … + B2007 /(1+r)22] / ∑ [C1986 /(1+r)0 + … + C2007 /(1+r)21] (3.4)
∑ [B1995 /(1+i)10 + … + B2007 /(1+i)22] = ∑ [C1986 /(1+i)0 + … + C2007 /(1+i)21] (3.5)
where, in equations (3.3) through (3.5), B represents annual total economic benefits from Column (5) in Table 3-14 and C represents total research costs from column (4) in Table 3-14. In equations (3.3) and (3.4), r is the discount rate used to reference previous years’ benefits and cost to the beginning of
56 In concept, an additional cost category could be considered in an economic evaluation of EERE’s investments in the ACE
R&D sub-program’s research in laser and optical diagnostics and combustion modeling. This additional cost category relates to the investment cost that industry incurred to pull in the developed technologies and apply them to manufacturing processes. The justification for this comes from three sources: (1) discussion with industry scientists involved in diesel engine combustion; (2) the documented fact that it was very common to have one or more scientists from industry in residence at the CRF and participating in the research, often on cylinders or engines brought to the CRF by visiting researchers and then left for the CRF to use (Carlisle et al., 2002); and (3) Gunn (November 6, 2009). These costs are assumed to be zero for lack of more specific information, although Gunn did speculate that in some years, industry’s “donated” equipment could have had a value equal to as much as 5% of the CRF’s annual budget.

Section 3 – Benefit-Cost Evaluation Framework and Evaluation Analysis
3-33
1986.57, 58 In equation (3.5), i is the internal rate of return equal to that rate that equates the present value of benefits to the present value of costs.
Table 3-14. ACE R&D Sub-Program and CRF Costs and Economic Benefits Associated with the ACE R&D Sub-Program’s Research in Laser and Optical Diagnostics and Combustion Modeling
(1) Year
(2) Costs: ACE R&D
Sub-Program (millions $2008)
(3) Costs: CRF (millions
$2008)
(4) Total Costs (millions
$2008)
(5) Total Economic Benefits
(millions $2008)
1986 $27.402 $5.602 $33.004 –
1987 $29.005 $5.930 $34.935 –
1988 $27.785 $5.680 $33.465 –
1989 $26.525 $5.423 $31.948 –
1990 $25.929 $5.588 $31.517 –
1991 $22.869 $6.240 $29.109 –
1992 $23.611 $6.223 $29.834 –
1993 $20.550 $6.073 $26.623 –
1994 $17.587 $5.665 $23.252 –
1995 $13.890 $5.549 $19.439 $4,099.8
1996 $21.574 $6.154 $27.728 $4,364.8
1997 $24.714 $6.743 $31.457 $4,163.1
1998 $23.239 $6.547 $29.786 $3,846.1
1999 $46.230 $6.281 $52.511 $5,274.9
2000 $57.211 $5.796 $63.007 $6,492.3
2001 $62.475 $6.538 $69.013 $6,150.0
2002 $55.538 $6.332 $61.870 $5,019.3
2003 $63.714 $6.842 $70.556 $4,361.1
2004 $59.119 $6.605 $65.724 $4,819.6
2005 $52.593 $6.983 $59.576 $7,267.2
2006 $42.649 $6.567 $49.216 $8,113.5
2007 $49.379 $7.811 $57.190 $6,229.4
Total $793.59 $137.17 $930.76 $70,201.1
Notes: Cost data available through 2008 in Table 3-1, but benefits data only available through 2007. Column (5) = Column (6) in Table 3-9 + Column (6) in Table 3-11.
Sources: Tables 3-1, 3-9, and 3-11. 57 Because all of the benefit and cost values are in 2008 dollars, a real, inflation-adjusted discount rate is appropriate. 58 Following Ruegg and Jordan (2009), costs are assumed to be incurred at the beginning of each year, but benefits are assumed
to be realized at the end of each year. Thus, the time period for the discounting of B is one year longer than for C.

Retrospective Benefit-Cost Evaluation of U.S. DOE Vehicle Combustion Engine R&D Investments
3-34
Two alternative discount rates, r, are used in the economic evaluation.59 The first equals the real, inflation-adjusted rate of 7% (OMB, 1992),60 and the second equals the real, inflation-adjusted rate of 3% (OMB, 2003).
The values of the three economic evaluation metrics are provided in Table 3-15. The present value of net benefits is equal to $23.1 billion (using a 7% discount rate), the benefit-to-cost ratio is 53 to 1, and the internal rate of return is 63%. The net economic benefits of DOE-funded research on laser and optical diagnostic technologies suggest that this use of public moneys has been socially valuable.
Table 3-15. Evaluation Metrics Calculated from the Cost and Benefit Data in Table 3-14
Metric 7% Discount Rate
3% Discount Rate
Internal Rate of Return
Present Value of Net Benefits (billions $2008)
$23.1 $42.6
Benefit-to-Cost Ratio 53 to 1 66 to 1
Internal Rate of Return 63%
59 For federal economic evaluations, the Office of Management and Budget (OMB) issues directives on discounting and
discount rates for different types of evaluations. Circular A-94, issued in 1992, directs the use of a 7% real discount rate for federal benefit-cost analysis. More recent guidance is provided by Circular A-4, issued in 2003, which pertains to benefit-cost analysis used as a tool for regulatory analysis. It notes that Circular A-94 stated that a real discount rate of 7% should be used in benefit-cost analysis as an estimate of the average before-tax rate of return to private capital in the U.S. economy. This rate is an approximation of the opportunity cost of capital. Commenting on the 7% real discount rate, OMB (2003, p. 33) observed: “The 7 percent [real] rate is an estimate of the average before-tax rate of return to private capital in the U.S. economy. It is a broad measure that reflects the returns to real estate and small business capital as well as corporate capital. It approximates the opportunity cost of capital, and it is the appropriate discount rate whenever the main effect of a regulation is to displace or alter the use of capital in the private sector.” Circular A-4 further notes that that OMB found in a subsequent analysis that the average rate of return to capital remained near 7%. It also points out that Circular A-94 recommends using other discount rates to show the sensitivity of the estimates to the discount rate assumption, and notes that the average real rate of return on long-term government debt has averaged about 3%. It requires the use of both a 7% and a 3% real discount rate for a benefit-cost analysis conducted for regulatory purposes. When regulation primarily and directly affects private consumption (e.g., through higher consumer prices for goods and services), a lower discount rate is appropriate, and OMB suggests a 3% real rate of time preference. OMB revised Circular A-94 in 1992 after extensive internal review and public comment. Further, OMB (2003, p. 33) observed: “The pre-tax rates of return better measure society’s gains from investment. Since the rates of return on capital are higher in some sectors of the economy than others, the government needs to be sensitive to possible impacts of regulatory policy on capital allocation.” However, OMB (2003, p. 33) observed: “The effects of regulation do not always fall exclusively or primarily on the allocation of capital. When regulation primarily and directly affects private consumption (e.g., through higher consumer prices for goods and services), a lower discount rate is appropriate,” and OMB suggests a 3% real rate of time preference. For the purpose of discounting constant dollar cash flows in this study, both rates are used—a 7% and a 3% real discount rate—even though the purpose is not regulatory as discussed in Ruegg and Jordan (2009).
60 Fundamental to implementing the present value of net benefits or the benefit-to-cost ratio is a value for the discount rate, r. While the discount rate representing the opportunity cost for public funds could differ across a portfolio of public investments available to the DOE, the evaluation metrics in this study follow the guidelines set forth by OMB (1992) in Circular A-94, under the authority of the Budget and Accounting Act of 1921: “Constant-dollar benefit-cost analyses of proposed investments and regulations should report net present value and other outcomes determined using a real discount rate of 7 percent.” The authority for Circular A-94 is the Budget and Accounting Act of 1921.
Section 3 – Benefit-Cost Evaluation Framework and Evaluation Analysis
3-35
3.5 Sensitivity Analysis
The quantitative economic evaluation analysis above, using regression estimates from equation (3.1), is based on three explicit assumptions. The first assumption relates to the next best alternative technology, the second assumption relates to attribution, and the third assumption relates to the interpretation of the regression results in Table 3-6. These assumptions are as follows:
• In the absence of the ACE R&D sub-program’s research in and application of laser and optical diagnostics and combustion modeling to heavy-duty diesel engines, BTE from 1995 through 2007 would have been 4.5% lower per year than it actually was over that time period.
• In the absence of the ACE R&D sub-program’s research in and application of laser and optical diagnostics and combustion modeling, the U.S. diesel engine industry would not have been able to conduct the research necessary to duplicate the research on or application of these technologies to heavy-duty diesel engines, even with the research assistance of universities.
• The statistical relationship between BTE and MPG from 1970 to 2007 in Table 3-6 applies, on average, to the intra-year statistical relationship between BTE and MPG from 1995 through 2007.61
The third assumption is reconsidered here based in part on data on sales of new heavy-duty diesel trucks shown in Table 3-16.
If the third assumption is replaced with the assumption that new heavy-duty diesel trucks sold each year consume a proportionate amount of fuel each year and that proportion remains constant over time. Specifically, as shown in Table 3-17 and in the Notes to the table, the analytical steps in the sensitivity analysis are first to calculate the percent of registered heavy-duty diesel trucks each year that are new, and then to calculate the amount of fuel consumed each year by the new, heavy-duty diesel trucks under the assumption that fuel consumption is proportional to the number of registered heavy-duty trucks. In the absence of the ACE R&D sub-program’s technologies, fuel consumption in each year would have been higher because the implementation of laser and optical diagnostics and combustion modeling lowered the BTE by 4.5%.62
It follows from this alternative analytical approach that the reduced fuel consumption associated with ACE R&D sub-program’s research in and application of laser and optical diagnostics and combustion modeling technologies totals 15,119.9 million gallons; the dollar value of reduced fuel consumption is $32.1 billion ($2008). The dollar value of improved health benefits, from the COBRA model, is $28.4 billion ($2008), as shown in Column (7) of Table 3-17.63
61 The regression in equation (3.1), with correction for autocorrelation, could not be estimated for the years 1996 through 2007
because of insufficient degrees of freedom. 62 The relationship between BTE and fuel efficiency is about one to one in new heavy-duty diesel trucks, as previously
discussed. 63 The dollar value of reduced fuel consumption and health benefits here is lower than in Table 3-11 because the fuel savings
here increase over time and the present 1986 value of these larger current values is decreased.

Retrospective Benefit-Cost Evaluation of U.S. DOE Vehicle Combustion Engine R&D Investments
3-36
Table 3-16. Sales of New Heavy-Duty Diesel Trucks
(1) Year
(2) New Class 7 Trucks 26,001 to 33,000 lbs
(thousands)
(3) New Class 8 Trucks 33,001 lbs and over
(thousands)
(4) Total New
Heavy-Duty Trucks (thousands)
1970 36 89 125
1975 23 83 106
1980 58 117 175
1981 51 100 151
1982 62 76 138
1983 59 82 141
1984 78 138 216
1985 97 134 231
1986 101 113 214
1987 103 131 234
1988 103 148 251
1989 93 145 238
1990 85 121 206
1991 73 99 172
1992 73 119 192
1993 81 158 239
1994 98 186 284
1995 107 201 308
1996 104 170 274
1997 114 179 293
1998 115 209 324
1999 130 262 392
2000 123 212 335
2001 92 140 232
2002 69 146 215
2003 67 142 209
2004 75 203 278
2005 89 253 342
2006 91 284 375
2007 70 151 221
Note: Sales through 1985 are domestic; sales after 1985 are domestic and import.
Source: Davis et al. (2009), Table 5.3.
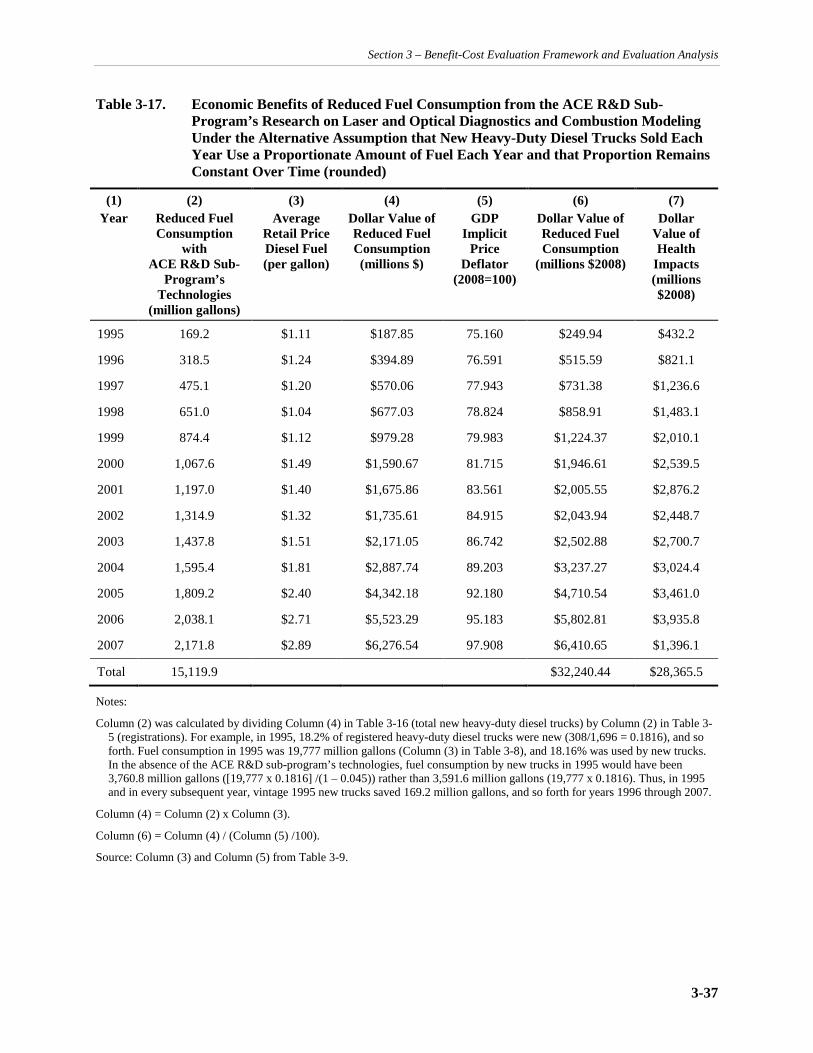
Section 3 – Benefit-Cost Evaluation Framework and Evaluation Analysis
3-37
Table 3-17. Economic Benefits of Reduced Fuel Consumption from the ACE R&D Sub-Program’s Research on Laser and Optical Diagnostics and Combustion Modeling Under the Alternative Assumption that New Heavy-Duty Diesel Trucks Sold Each Year Use a Proportionate Amount of Fuel Each Year and that Proportion Remains Constant Over Time (rounded)
(1) Year
(2) Reduced Fuel Consumption
with ACE R&D Sub-
Program’s Technologies
(million gallons)
(3) Average
Retail Price Diesel Fuel (per gallon)
(4) Dollar Value of Reduced Fuel Consumption (millions $)
(5) GDP
Implicit Price
Deflator (2008=100)
(6) Dollar Value of Reduced Fuel Consumption
(millions $2008)
(7) Dollar
Value of Health
Impacts (millions $2008)
1995 169.2 $1.11 $187.85 75.160 $249.94 $432.2
1996 318.5 $1.24 $394.89 76.591 $515.59 $821.1
1997 475.1 $1.20 $570.06 77.943 $731.38 $1,236.6
1998 651.0 $1.04 $677.03 78.824 $858.91 $1,483.1
1999 874.4 $1.12 $979.28 79.983 $1,224.37 $2,010.1
2000 1,067.6 $1.49 $1,590.67 81.715 $1,946.61 $2,539.5
2001 1,197.0 $1.40 $1,675.86 83.561 $2,005.55 $2,876.2
2002 1,314.9 $1.32 $1,735.61 84.915 $2,043.94 $2,448.7
2003 1,437.8 $1.51 $2,171.05 86.742 $2,502.88 $2,700.7
2004 1,595.4 $1.81 $2,887.74 89.203 $3,237.27 $3,024.4
2005 1,809.2 $2.40 $4,342.18 92.180 $4,710.54 $3,461.0
2006 2,038.1 $2.71 $5,523.29 95.183 $5,802.81 $3,935.8
2007 2,171.8 $2.89 $6,276.54 97.908 $6,410.65 $1,396.1
Total 15,119.9 $32,240.44 $28,365.5
Notes:
Column (2) was calculated by dividing Column (4) in Table 3-16 (total new heavy-duty diesel trucks) by Column (2) in Table 3-5 (registrations). For example, in 1995, 18.2% of registered heavy-duty diesel trucks were new (308/1,696 = 0.1816), and so forth. Fuel consumption in 1995 was 19,777 million gallons (Column (3) in Table 3-8), and 18.16% was used by new trucks. In the absence of the ACE R&D sub-program’s technologies, fuel consumption by new trucks in 1995 would have been 3,760.8 million gallons ([19,777 x 0.1816] /(1 – 0.045)) rather than 3,591.6 million gallons (19,777 x 0.1816). Thus, in 1995 and in every subsequent year, vintage 1995 new trucks saved 169.2 million gallons, and so forth for years 1996 through 2007.
Column (4) = Column (2) x Column (3).
Column (6) = Column (4) / (Column (5) /100).
Source: Column (3) and Column (5) from Table 3-9.

Retrospective Benefit-Cost Evaluation of U.S. DOE Vehicle Combustion Engine R&D Investments
3-38
The economic evaluation metrics corresponding to this sensitivity analysis are shown in Table 3-18. These alternative evaluation metrics complement those above and support the previous conclusions.64
Table 3-18. Evaluation Metrics Calculated from the Cost and Benefit Data in Table 3-17
Metric 7% Discount Rate 3% Discount Rate Internal Rate of Return
Present Value of Net Benefits (billions $2008)
$17.8 $35.0
Benefit-to-Cost Ratio 41 to 1 54 to 1
Internal Rate of Return 50%
3.6 Comparison Studies
One could make the argument that the ACE R&D sub-program’s research in and application of laser and optical diagnostics and combustion modeling are similar to an infrastructure technology, which has similar characteristics to a general purpose technology, meaning that their applicability to industry leverages industry’s own R&D investments, resulting in improved engine fuel efficiency (Link and Tassey, 1993). These technologies have a quasi–public good characteristic, in that the application of these technologies to one engine manufacturer does not limit the effectiveness of the application to another. As such, the value of the evaluation metrics calculated in this study, although they are conservatively calculated, are of the same order of magnitude as those reported for public investments in similar infrastructure, quasi–public good technologies. For example, the National Institute of Standards and Technology (NIST) has conducted a number of evaluation studies of publicly funded infrastructure that has benefited industry in particular and society in general.65 Table 3-19 briefly summarizes three such studies and reports the benefit-to-cost ratio calculated in each study.
64 Two empirical issues that were beyond the scope of this sensitivity analysis are the fuel consumption difference between
Class 7 and Class 8 trucks and the impact of imported trucks in Column (4) in Table 3-16. Scientists are Caterpillar, Cummings Engine, and Detroit Diesel were queried about the latter issue, but they did not know of any public-domain data that could be used to adjust sales in Table 3-16. Were such an adjustment possible, quantified net economic benefits would increase.
65 Selected studies related to activities at NIST are summarized at http://www.nist.gov/director/planning/studies.htm.

Section 3 – Benefit-Cost Evaluation Framework and Evaluation Analysis
3-39
Table 3-19. Summary of Selected Benefit-to-Cost Studies Conducted by NIST for Comparison
Infrastructure Technology Area
Description of the Technology Benefit-to-Cost Ratio
Real-time control system (RCS) architecture
NIST has been involved in research on real-time control systems for automation and robotics since the mid-1970s. RCS architecture is an engineering methodology that can be used across a spectrum of industrial applications. RCS consists of establishing a set of integration rules, identifying information models and real-time software execution models to highlight critical components of the RCS problem domain, and selecting software engineering implementation techniques that are compatible with these models.
161 to 1
Power and energy calibration services
There are three primary areas or outputs from NIST’s power and energy calibration services: maintenance of the national standard for the watt-hour, research to lower the level of uncertainty association with watt-hour revenue meters, and general technical support to industry associated with measurement activities.
41 to 1
Software error compensation research*
Software error compensation is a computer-based mathematical technique for increasing the accuracy of coordinated measuring machines used in industrial automated manufacturing systems.
85 to 1
Note: * For this technology area, an internal rate of return of 99% was also calculated.
Sources: Link (1996), Link and Scott (1998).


4-1
4. SUMMARY OF THE FINDINGS AND CONCLUDING STATEMENT
This study shows that EERE’s research investments in the ACE R&D sub-program’s research in and application of laser and optical diagnostics and combustion modeling, and supporting DOE investments in the CRF have been socially valuable. This conclusion follows from the calculation of three traditional economic evaluation metrics: present value of net benefits ($23.1 billion, at a 7% discount rate), benefit-to-cost ratio (53 to 1, at a 7% discount rate), and the internal rate of return (63%).
These metrics are calculated on the basis of extant public-domain data and a set of operational assumptions, which are:
• In the absence of the ACE R&D sub-program’s research in and application of laser and optical diagnostics and combustion modeling to heavy-duty diesel engines, BTE from 1995 through 2007 would have been 4.5% lower per year than it actually was over that period of time.
• In the absence of the ACE R&D sub-program’s research in and application of laser and optical diagnostics and combustion modeling, the U.S. diesel engine industry would not have been able to conduct the research necessary to duplicate these technologies to heavy-duty diesel engines, even with the research assistance of universities.
• The statistical relationship between BTE and MPG from 1970 to 2007 shown in Table 3-6 applies, on average, to the intra-year statistical relationship between BTE and MPG from 1995 through 2007.
The first assumption about BTE is based on interview data from scientists at each of three companies—Caterpillar, Cummins Engine, and Detroit Diesel. On the one hand, three scientists is a small sample from which to gather such a critical datum, although there was consistency among the three that the reduction in BTE would have been between 4 and 5% per year. On the other hand, these scientists have a unique insight to provide information about the effect of the ACE R&D sub-program’s research.
The second assumption about attribution follows from three independent sources: a documented argument used to justify the initial creation of the CRF, insight from DOE scientists about industry’s research capabilities, and economic theory.
The third assumption about the interpretation of the regression relationship between BTE and MPG results from limited data, although to the extent possible, the assumption was statistically verified in Section 3.3.1 through alternative specification tests.
Based on the findings of this study, one should not generalize about the net benefits from EERE’s investments in other sub-programs within the VTP or within other energy programs.

R-1
REFERENCES
Abbey, D.E., Ostro, B.E., Petersen, F., & Burchette, R.J. (1995). Chronic respiratory symptoms associated with estimated long-term ambient concentrations of fine particulates less than 2.5 microns in aerodynamic diameter (PM2.5) and other air pollutants. Journal of Exposure Analysis and Environmental Epidemiology, 5(2), 137–159.
Abt Associates Inc. (2009, January). Economic Impact of Wise County, Virginia Coal-Fired Power Plant. Prepared for Wise Energy For Virginia Coalition.
Allen, M.G. (1998). Diode laser absorption sensors for gas-dynamic and combustion flows. Meas Sci Technol, 9(4):545-62. Available at http://www.ncbi.nlm.nih.gov/pubmed/11543363.
AllGov.com. (2009). Office of Energy Efficiency and Renewable Energy [Web page]. Retrieved July 6, 2009 from http://www.allgov.com/agency/Office_of_Energy_Efficiency_and_Renewable_Energy.
AIAA (American Institute of Aeronautics and Astronautics). (2009). Laser induced incandescence [Web page]. Retrieved September 23, 2009 from https://info.aiaa.org/tac/ASG/AMTTC/Shared%20Documents/Technique%20Overviews/lii.html.
Amsden, D.C., & Amsden, A.A. (1993). The KIVA story: A paradigm of technology transfer. IEEE Transactions on Professional Communication 36:190–195.
Aneja, R., & Kayes, D. (2009). Reduction of heavy-duty fuel consumption and CO2 generations: What the industry does and what government can do. Presented at the Directions in Engine-Efficiency and Emissions Research Conference (DEER), August 5, 2009.
Aneja, R., Kalish, Y., & Kayes, D. (2009). Integrated powertrain and vehicle technologies for fuel efficiency improvement and CO2 reduction. Presented at the Directions in Engine-Efficiency and Emissions Research Conference (DEER), August 5, 2009.
Asanuma, T. (1996). New visualization and image techniques for engine combustion research. In The Visualization Society of Japan (ed.), Atlas of visualization. Boca Raton, FL: CRC Press.
Breitzman, A., & Mogee, M. (2002). The many applications of patent analysis. Journal of Information Science, 28(3):187–205.
Bresnahan, T.F., & Trajtenberg, M. (1995). General purpose technologies. Journal of Econometrics 65: 83–108.
Carlisle, R.P., Monetta, D.J., & Sparks, W.L. (2002). The Combustion Research Facility: Model for a 21st-century open user facility. Albuquerque, NM, and Livermore, CA: Sandia National Laboratories.
CATF (Clean Air Task Force). (2005, February). Diesel engines: Emissions sources and regulations. v.2. Boston: Clean Air Task Force. Available at http://www.catf.us/publications/factsheets/Diesel_Sources_and_Regulations.pdf.
Retrospective Benefit-Cost Evaluation of U.S. DOE Vehicle Combustion Engine R&D Investments
R-2
CRS (Congressional Research Service). (2001, May 1). Diesel fuel and engines: An analysis of EPA’s new regulations [Report to Congress].
Davis, S.C., Diegel, S.W., & Boundy, R.G. (2009). Transportation energy data book, 28th Edition. ORNL 69-84. Oak Ridge, TN: Oak Ridge National Laboratory.
Dec, J.E. (1997). A conceptual model of DI diesel combustion based on laser-sheet imaging. SAE Transactions, 106:1319–1348.
DoC (Department of Commerce). (2009). National income and product accounts table: Table 1.1.9. Implicit price deflators for Gross Domestic Product. Revised October 29, 2009. Bureau of Economic Analysis. Retrieved from http://www.bea.gov/national/nipaweb/.
Dockery, D.W., Cunningham, J., Damokosh, A.I., Neas, L.M., Spengler, J.D., Koutrakis, P., Ware, J.H., Raizenne, M., & Speizer, F.E. (1996). Health effects of acid aerosols on North American children—Respiratory symptoms. Environmental Health Perspectives, 104(5), 500–505.
DOE (Department of Energy). (2003, August). Just the basics: Diesel engine. Washington DC: Office of Energy Efficiency and Renewable Energy. Available at http://www1.eere.energy.gov/vehiclesandfuels/pdfs/basics/jtb_diesel_engine.pdf.
DOE (Department of Energy). (2006, December). 21st Century Truck Partnership: Roadmap and technical white papers. 21CTP-0003. Available at http://www1.eere.energy.gov/vehiclesandfuels/pdfs/program/21ctp_roadmap_2007.pdf.
DOE (Department of Energy). (2008, December). FY 2008 Progress report for advanced combustion engine technologies. Washington DC: Office of Energy Efficiency and Renewable Energy, Vehicle Technologies Program. Available at http://www1.eere.energy.gov/vehiclesandfuels/pdfs/program/2008_adv_combustion_engine.pdf.
DOE (Department of Energy). (2009a). About the Department of Energy: Origins & evolution of the Department of Energy [Web page]. Retrieved July 3, 2009 from http://www.energy.gov/about/origins.htm.
DOE (Department of Energy). (2009b, March). Advanced combustion engine R&D: Goals, strategies, and top accomplishments. DOE/GO-102009-2762. Washington DC: Office of Energy Efficiency and Renewable Energy, Vehicle Technologies Program. Available at. http://www1.eere.energy.gov/vehiclesandfuels/pdfs/adv_combustion_goals.pdf.
DOE (Department of Energy). (2009c). Measuring diesel exhaust particulates by using laser-induced incandescence. Technology Transportation R&D Center. Retrieved August 30, 2009 from http://www.transportation.anl.gov/engines/lii_testing.html.
DOE (Department of Energy). (2009d). Historical savings. Presentation of cost and energy savings data provided to the Office of Energy Efficiency and Renewable Energy by Caterpillar, Cummins, and Detroit Diesel, September 10, 2009.
DOE (Department of Energy). (2010a). U.S. Imports of Crude Oil [Web page]. Energy Information Administration. Retrieved February 8, 2010, from http://tonto.eia.doe.gov/dnav/pet/hist/LeafHandler.ashx?n=PET&s=MCRIMUS1&f=M.

References
R-3
DOE (Department of Energy). (2010b). Oil Crude and Petroleum Products Explained [Web page]. Energy Information Administration. Retrieved February 8, 2010, from http://tonto.eia.doe.gov/energyexplained/index.cfm?page=oil_home.
Dooley, J.J. (2008, October). U.S. federal investments in energy R&D: 1961–2008. Pacific Northwest National Laboratory, U.S. Department of Energy.
Eberhardt, J.J. (2009). Personal interview. June 26, 2009; E-mail correspondence and telephone interviews. July 31, 2009, and September 9, 2009.
Eberhardt, J.J. (2010). E-mail correspondence. January 20, 2010.
Eckbreth, A.C. (1996). Laser diagnostics for combustion temperature and species, 2nd ed. Volume 3 of Sirignano, W. A. (ed.), Combustion Science and Technology Book Series. Amsterdam: Gordon and Breach Science Publishers
EERE (Energy Efficiency and Renewable Energy). 2009a. About the Office of EERE: Organization [Web page]. Retrieved November 9, 2009, from http://www1.eere.energy.gov/office_eere/organization.html.
EERE (Energy Efficiency and Renewable Energy). 2009b. Vehicle Technologies Program: Program areas [Web page]. Retrieved November 9, 2009, from http://www1.eere.energy.gov/vehiclesandfuels/program_areas/index.html
EIA (Energy Information Administration). (2009). Annual energy review: Petroleum [Web page]. Washington DC: U.S. Department of Energy Retrieved October 21, 2009 from http://www.eia.DOE.gov/emeu/aer/petro.html.
EPA (Environmental Protection Agency). (2005, March). Regulatory impact analysis for the final Clean Air Interstate Rule. EPA-452/R-05-002. Research Triangle Park, NC: Office of Air Quality Planning and Standards; Emission, Monitoring, and Analysis Division and Clean Air Markets Division. Available at http://www.epa.gov/cair/pdfs/finaltech08.pdf.
EPA (Environmental Protection Agency). (2006, June). User’s manual for the Co-Benefits Risk Assessment (COBRA) screening model. Developed by Abt Associates Inc.
EPA (Environmental Protection Agency). (2010). Emission Facts: Average Carbon Dioxide Emissions Resulting from Gasoline and Diesel Fuel [Web page]. Washington DC: Office of Transportation and Air Quality. Retrieved February 4, 2010, from http://www.epa.gov/oms/climate/420f05001.htm.
Executive Office of the President. (1990). U.S. technology policy. Washington, DC: Office of Science and Technology Policy.
Executive Office of the President. (1994). Economic report of the President. Washington, DC: Government Printing Office.
Executive Office of the President. (2000). Economic report of the President. Washington, DC: Government Printing Office.
Retrospective Benefit-Cost Evaluation of U.S. DOE Vehicle Combustion Engine R&D Investments
R-4
Fehner, T.R., & Holl, J.M. (1994, November). Department of Energy 1977–1994: A summary history. Washington, DC: U.S. Department of Energy, History Division.
Forch, B.E., Morris, J.B., & Miziolek, A.M. (1990). Laser induced florescence and ionization techniques for combustion diagnostics. In T. Vo-Dinh and D. Eastwood (eds.), Laser Techniques in Luminescence Spectroscopy (pp. 50-68). Philadelphia: American Society for Testing Materials.
Fort, L.N., Burton, A.F., Bellevue, E.P., & Darragh, K. (1980). U.S. Patent 4,217,862, High constant pressure, electronically controlled diesel fuel injection system. Washington, DC: U.S. Patent and Trademark Office.
Gunn, M., (2009). E-mail correspondence and telephone interviews, October 20, 2009, November 6, 2009, and November 20, 2009.
Hanson, R.K., Baer, D.S., & Jeffries, J.B. (2002). Multiplexed diode-laser absorption sensors for real-time measurements and controls of combustion systems. Final report to the National Center for Environmental Research.
Hartley, D. L., & Dyer, T.M. (1985). New diagnostic techniques in engine combustion research. Paper presented at COMODIA 1985, the International Symposium on Diagnostics and Modeling in Internal Combustion Engines. Tokyo, Japan, September 4, 1985.
Ito, K. (2003). Associations of particulate matter components with daily mortality and morbidity in Detroit, Michigan. In: Revised analyses of time-series studies of air pollution and health. Boston, MA: Health Effects Institute.
Kalish, Y. (2009). Telephone interview on October 12, 2009.
Lance, M.J., & Sluder, C.S. (2009). Materials issues associated with EGR systems. Presentation at the DOE 2009 Vehicle Technologies Annual Merit Review and Peer Evaluation Meeting, April 21, 2009.
Link, A.N. (1996). Evaluating public sector research and development. New York: Praeger.
Link, A.N., & Scott, J.T. (1998). Public accountability: Evaluating technology-based institutions. Norwell, MA: Kluwer Academic Publishers.
Link, A.N., & Scott, J.T. (2005). Evaluating public research institutions: The U.S. Advanced Technology Program’s intramural research initiative, London: Routledge.
Link, A.N., & Scott, J.T. (In press). Public goods, public gains: Calculating the social benefits of public R&D. Oxford: Oxford University Press.
Link, A.N., & Tassey, G. (1993). The technology infrastructure of firms: Investments in infratechnology. IEEE Transactions on Engineering Management, 40:312–315.
Mattison, D.W., Jeffries, J.B., Hanson, R.K., Steeper, R.R., DeZilwa, S., Dec, J.E., Sjoberg, M., & Hwang, W. (2007). In-cylinder gas temperature and water concentration measurements in HCCI engines using a multiplexed-wavelength diode-laser system: Sensor development and initial demonstration. Proceedings of the Combustion Institute, 31:791–798.

References
R-5
McLean, W. (2009). E-mail correspondence and telephone interviews, October 22, 2009, November 4, 2009, and November 20, 2009.
Meho, L.I. (2007, January). The rise and rise of citation analysis. Physics World 20(1):32–36.
Moolgavkar, S.H. (2000). Air pollution and hospital admissions for chronic obstructive pulmonary disease in three metropolitan areas in the United States. Inhalation Toxicology, 12(Suppl 4), 75–90.
Moolgavkar, S.H. (2003). Air pollution and daily deaths and hospital admissions in Los Angeles and Cook Counties. In: Revised analyses of time-series studies of air pollution and health. Boston, MA: Health Effects Institute.
Nam, E. (2004). Advanced technology vehicle modeling in PERE. Washington, DC: U.S. Environmental Protection Agency.
Nixon, R.M. (1974). Address on the state of the union delivered before a joint session of the Congress, January 30, 1974. Available at http://www.presidency.ucsb.edu/ws/index.php?pid=4327.
Norris, G., YoungPong, S.N., Koenig, J.Q., Larson, T.V., Sheppard, L., & Stout, J.W. (1999). An association between fine particles and asthma emergency department visits for children in Seattle. Environmental Health Perspectives, 107(6), 489–93.
NRC (National Research Council). (2001). Energy research at DOE: Was it worth it? Energy efficiency and fossil energy research 1978 to 2000. Washington, DC: National Academy Press.
NRC (National Research Council). (2008). Review of the 21st Century Truck Partnership. Washington, DC: National Academy Press.
OMB (Office of Management and Budget). (1992). Circular no. A–94: Guidelines and discount rates for benefit–cost analysis of federal programs. Washington, DC: Government Printing Office.
OMB (Office of Management and Budget). (2003). Circular no. A–4: Regulatory analysis, Washington, DC: Government Printing Office.
Ostro, B.D. (1987). Air pollution and morbidity revisited: A specification test. Journal of Environmental Economics and Management, 14, 87–98.
Ostro, B.D., & Rothschild, S. 1989. Air pollution and acute respiratory morbidity - an observational study of multiple pollutants. Environmental Research, 50(2), 238–247.
Peters, A., Dockery, D.W., Muller, J.E., & Mittleman, M.A. (2001). Increased particulate air pollution and the triggering of myocardial infarction. Circulation, 103 (23), 2810–5.http://www.ncbi.nlm.nih.gov/htbinpost/Entrez/query?db=m&form=6&dopt=r&uid=11401937
PNGV (Partnership for a New Generation of Vehicles). (2009). About Partnership for a New Generation of Vehicles [Web page]. Retrieved August 3, 2009, from http://www.pngv.org/main/index.php?option=com_content&task=blogcategory&id=14&Itemid=26.
Retrospective Benefit-Cost Evaluation of U.S. DOE Vehicle Combustion Engine R&D Investments
R-6
Pope, C.A., 3rd, Burnett, R.T., Thun, M.J., Calle, E.E., Krewski, D., Ito, K., & Thurston, G.D. (2002). Lung cancer, cardiopulmonary mortality, and long-term exposure to fine particulate air pollution. Journal of the American Medical Association, 287(9), 1132–41.
Ruegg, R., & Jordan, G.B. (2009, September 28). Guidelines for conducting EERE retrospective benefit-cost studies, Draft.
Ruegg, R., & Thomas, P. (2010). Linkages from DOE's Vehicle Technologies R&D in Advanced Combustion to Improved Heavy-duty Diesel Engines. Washington DC: Department of Energy, Office of Energy Efficiency and Renewable Energy.
Schwartz, J., & Neas, L.M. (2000). Fine particles are more strongly associated than coarse particles with acute respiratory health effects in schoolchildren. Epidemiology, 11(1), 6–10.
Sheppard, L., Levy, D., Norris, G., Larson, T.V., & Koenig, J.Q. (1999). Effects of ambient air pollution on nonelderly asthma hospital admissions in Seattle, Washington, 1987-1994. Epidemiology, 10(1), 23–30.
Siebers, D. (2009). E-mail correspondence and telephone interviews, August 18, 2009; September 8, 2009; October 13, 2009; and October 23, 2009.
Singh, G. (2000). Additional combustion and emission control projects, heavy truck engine program and performance measures for the engine team. Presentation at the Heavy-Duty Vehicle Technology Annual Review, April 12, 2000.
Singh, G. (2009). Telephone interview, September 9, 2009.
Thomas, P. (1999). Fashions in Management Research. Ashgate Press.

A-1
APPENDIX A
LEGISLATIVE BACKGROUND
“The [OPEC] Oil Embargo which began on October 19, 1973 sparked a fundamental reassessment of the nation’s vulnerability to imported energy and also forced a reassessment of the role that energy R&D could play in helping secure the nation against hostile acts like the Oil Embargo.” (Dooley, 2008, p. 9)
At the time of the Organization of the Petroleum Exporting Countries (OPEC) oil embargo, the U.S. infrastructure related to energy was the Atomic Energy Commission.1, 2 In response to the OPEC oil embargo, President Nixon launched Project Independence on November 7, 1973; the goal of the project was to achieve energy independence by 1980. In his State of the Union Address on January 30, 1974, President Nixon stated:
“Let it be our national goal: At the end of this decade, in the year 1980, the United States will not be dependent on any other country for the energy we need to provide our jobs, to heat our homes, and to keep our transportation moving.” (Nixon, 1974)
On December 4, 1973, President Nixon created the Federal Energy Office in the Executive Office of the White House to allocate then scarce petroleum supplies to refiners and consumers (Fehner and Holl, 1994).
The Atomic Energy Commission laboratories, particularly Sandia National Laboratories (SNL), were asked to contribute to the effort of energy independence:3
“[through a] study on how the automobile could be made more efficient in its use of liquid fuel. … [T]o get cleaner-burning and more fuel-efficient engines required better understanding of the combustion process inside the gasoline and diesel engines…” 4 (Carlisle et al., 2002, p. 2)
On October 11, 1974, President Ford reestablished the Nixon emphasis on energy independence by signing the Energy Reorganization Act of 1974, Public Law 93-438. This Act built on the Federal Nonnuclear Energy Research and Development Act of 1974, which stated:
1 The Atomic Energy Commission was created by the Atomic Energy Act of 1946, Public Law 585-79th Congress, to maintain
control over atomic research and development. The Atomic Energy Act of 1954, Public Law 83-703, declared that “[a]tomic energy is capable of application for peaceful as well as military purposes,” and thus the Atomic Energy Commission was given authority to regulate a commercial nuclear power industry (U.S. DOE, 2009a). This separation of focus between government and commercial use of the atom was the precursor to the Energy Reorganization Act of 1974.
2 The OPEC oil embargo was not the first U.S. energy shortage. Some shortages were realized in the “great blackout” of 1965—a disruption of electric service in Ontario, Canada, and Connecticut, Massachusetts, New Hampshire, Rhode Island, Vermont, New York, and New Jersey in the United States, on November 9, 1965, due to human error—and several brownouts in 1971 (Fehner and Holl, 1994). President Nixon “warned that the United States could no longer take its energy supply for granted. Since 1967, Nixon observed, America’s rate of energy consumption had outpaced the Nation’s production of goods and services [and] he asked Congress to establish a department of natural resources to unify all important energy resource development programs” (Fehner and Holl, 1994, pp. 4–5).
3 The Commission Chairman at this time was Dixie Lee Ray. 4 It was realized at this time that reducing the weight of an automobile would also lead to fuel efficiency.
Retrospective Benefit-Cost Evaluation of U.S. DOE Vehicle Combustion Engine R&D Investments
A-2
“The Congress declares the purpose of this Act to be to establish and vigorously conduct a comprehensive, national program of basic and applied research and development, including but not limited to demonstrations of practical applications, of all potentially beneficial energy sources and utilization technologies.” (Energy Reorganization Act of 1974, Public Law 93-438)
The Energy Reorganization Act established the Nuclear Regulatory Commission to carry out the responsibilities of the abolished Atomic Energy Commission and the Energy Research and Development Administration (ERDA) to, among other things, encourage and conduct5
“research and development in energy conservation, which shall be directed toward the goals of reducing total energy consumption to the maximum extent practicable, and toward maximum possible improvement in the efficiency of energy use… and research and development in clean and renewable energy sources.” (Energy Reorganization Act of 1974, Public Law 93-438)
On August 4, 1977, President Carter signed the Department of Energy Organization Act of 1977, Public Law 95-91, transferring the mission of ERDA to the newly formed Department of Energy (DOE). As stated in the Act, Congress finds that:
• the United States faces an increasing shortage of nonrenewable energy resources; • this energy shortage and our increasing dependence on foreign energy supplies present a serious
threat to the national security of the United States and to the health, safety and welfare of its citizens;
• a strong national energy program is needed to meet the present and future energy needs of the Nation consistent with overall national economic, environmental and social goals;
• responsibility for energy policy, regulation, and research, development and demonstration is fragmented in many departments and agencies and thus does not allow for the comprehensive, centralized focus necessary for effective coordination of energy supply and conservation programs; and
• formulation and implementation of a national energy program require the integration of major Federal energy functions into a single department in the executive branch.
By this Act, Congress declared that the establishment of such a department in the Executive Branch is in the public interest and will promote the general welfare by assuring coordinated and effective administration of Federal energy policy and programs. The DOE will, according to the Act:
“carry out the planning, coordination, support, and management of a balanced and comprehensive energy research and development program, including—(A) assessing the requirements for energy research and development; (B) developing priorities necessary to meet those requirements; (C) undertaking programs for the optimal development of the various forms of energy production and conservation; and (D) disseminating information resulting from such programs…” (Department of Energy Organization Act of 1977, Public Law 95-91)
5 According to James Eberhardt, Chief Scientist of the Vehicle Technologies Program of the Energy Efficiency and Renewable
Energy Program of the Department of Energy (personal interview on June 26, 2009), this legislation gave statutory authority to the federal government to support combustion research. But, in a much broader sense, according to Eberhardt, that authority could be traced to the Manhattan Project and the research of J. Robert Oppenheimer.

Appendix A — Legislative Background
A-3
The Office of Conservation and Solar Energy was created after the passage of the National Energy Conservation Policy Act of 1978, Public Law 95-619.
DOE was one of the major participants involved in President Clinton’s establishment of the Partnership for a New Generation of Vehicles (PNGV) in 1993. Joining DOE in this partnership were seven other government agencies (the departments of Commerce, Defense, Interior, and Transportation; the National Science Foundation; the National Aeronautics and Space Administration; and the Environmental Protection Agency); national laboratories; and the Chrysler Corporation, the Ford Motor Company, and General Motors (through the United States Council for Automotive Research). The goals of the PNGV were:
“(1) to improve national manufacturing competitiveness, (2) to implement commercially viable technologies that increase the fuel efficiency and reduce the emissions from conventional vehicles, and (3) to develop technologies for a new class of vehicles with up to three times the fuel efficiency of 1994 midsize family sedans (80 mpg) while meeting emission standards and without sacrificing performance, affordability, utility, safety, or comfort.” (NRC, 2001, p. 146)
The Bush Administration modified the PNGV program in 2001 and adopted a new focus through the creation of FreedomCAR in 2003. One emphasis of FreedomCAR was on hydrogen fuel cells (PNGV, 2009).
The counterpart to the PNGV for passenger vehicles was the 21st Century Truck Partnership, announced in April 2000. The goals of this government program were to improve fuel efficiency in long-haul trucks, increasing Class 7 and Class 8 highway truck fuel efficiency by 20%, from the current 42% thermal efficiency to 50% thermal efficiency by 2010 and 55% thermal efficiency by 2013; and to lower emission beyond the expected standard for 2010 (NRC, 2008).6 Initially, the 21st Century Truck Partnership was under the administrative authority of the U.S. Army Tank-Automotive Research and Development Command within the Department of Defense. But, in November 2002, authority over the Partnership passed to DOE, specifically to the VTP under EERE:
“[DOE was] assigned to lead the federal R&D component of this program because of the close alignment of the stated 21st Century Truck Program goals and research objectives with DOE’s mission ‘to foster a secure and reliable energy system that is environmentally and economically sustainable.’” (NRC, 2008, p. 9)
EERE was formed in 2001 when the Office of Conservation and Solar Energy was renamed and reorganized. EERE is currently organized into 10 energy programs. The VTP encompasses eight broad sub-program areas, ACE R&D being one. In the most general terms, the ACE R&D sub-program sponsors R&D to address technical barriers to the commercialization of higher efficiency internal combustion engines used in passenger and commercial vehicles (see DOE, 2003).
6 Class 7 and Class 8 trucks are referred to as heavy-duty trucks. Class 7 trucks are greater than 26,000 pounds and Class 8
trucks are greater than 33,000 pounds (NRC, 2008).

B-1
APPENDIX B
ECONOMIC RATIONALE FOR GOVERNMENT SUPPORT OF COMBUSTION RESEARCH
The theoretical basis for government’s role in market activity is based on the concept of market failure. Market failure is typically attributed to market power, imperfect information, externalities, and public goods. The explicit application of market failure to justify government’s role in innovation, and in R&D activity in particular, is a relatively recent phenomenon within public policy.1
Market failure, technological or innovation market failure in particular, results from conditions that prevent organizations from fully realizing or appropriating the benefits created by their investments. To explain, consider a marketable technology to be produced through an R&D process where conditions prevent full appropriation of the benefits from technological advancement by the R&D-investing firm. Other firms in the market or in related markets will realize some of the profits from the innovation, and of course consumers will typically place a higher value on a product than the price paid for it. Then, because of such conditions, the R&D-investing firm will calculate that the marginal benefits it can receive from a unit investment in such R&D will be less than could be earned in the absence of the conditions, reducing the appropriated benefits of R&D below their potential, namely the full social benefits. Thus, the R&D-investing firm might underinvest in R&D, relative to what it would have chosen as its investment in the absence of the conditions. Stated another way, the R&D-investing firm might determine that its private rate of return is less than its private hurdle rate (i.e., the firm’s minimum acceptable rate of return); therefore, it will not undertake socially valuable R&D.
There are a number of non–mutually exclusive factors that can explain why a firm will perceive that its expected rate of return will fall below its hurdle rate:
1. High technical risk (i.e., the outcomes of its R&D might not be technically sufficient to meet needs) might cause market failure, given that when the firm is successful, the private returns fall short of the social returns.
2. High technical risk can relate to high commercial or market risk, as well as to technical risk, when the requisite R&D is highly capital intensive. The investment could require too much capital for a firm—any firm—to feel comfortable with the outlay, and thus the firm will not make the investment, even though it would be better off if it had, and so would society.
1 Many point in the United States to President George H.W. Bush’s 1990 U.S. Technology Policy (Executive Office of the
President, 1990) as that nation’s first formal domestic technology policy statement. Albeit an important initial policy effort, it failed to articulate a foundation for the government’s role in innovation and technology. Rather, it implicitly assumed that the government had a role and then set forth the general statement: “The goal of U.S. technology policy is to make the best use of technology in achieving the national goals of improved quality of life for all Americans, continued economic growth, and national security.” (Executive Office of the President, 1990, p. 2) President William Clinton took a major step forward from the 1990 policy statement in his 1994 Economic Report of the President (Executive Office of the President, 1994) by articulating first principles about why government should be involved in the technological process: “The goal of technology policy is not to substitute the government’s judgment for that of private industry in deciding which potential ‘winners’ to back. Rather, the point is to correct market failure …” (Executive Office of the President, 1994, p. 191). President Clinton’s 2000 Economic Report of the President elaborated on the concept of market failure as part of U.S. technology policy: “Rather than support technologies that have clear and immediate commercial potential (which would likely be developed by the private sector without government support), government should seek out new technologies that will create benefits with large spillovers to society at large.” (Executive Office of the President, 2000, p. 99)

Retrospective Benefit-Cost Evaluation of U.S. DOE Vehicle Combustion Engine R&D Investments
B-2
3. Many R&D projects are characterized by a lengthy time interval until a commercial product reaches the market.
4. It is not uncommon for the scope of potential markets to be broader than the scope of the individual firm’s market strategies, so the firm will not perceive economic benefits from all potential market applications of the technology.
5. The evolving nature of markets requires investment in combinations of technologies that, if they existed, would reside in different industries that are not integrated. Because such conditions often transcend the R&D strategy of individual firms, such investments are not likely to be pursued.
6. A situation can exist when the nature of the technology is such that it is difficult to assign intellectual property rights.
7. Industry structure can raise the cost of market entry for applications of the technology. 8. Situations can exist where the complexity of a technology makes agreement with respect to product
performance between buyers and sellers costly. These eight factors (summarized in Table B-1), individually or in combination, create barriers to innovation, and thus lead to a private underinvestment in R&D because of the technological market failure.
Table B-1. Factors Creating Barriers to Innovation that Lead to Technological Market Failure
High technical risk associated with the underlying R&D
High capital costs to undertake the underlying R&D
Long time to complete the R&D and commercialize the resulting technology
Underlying R&D spills over to multiple markets and is not appropriable
Market success of the technology depends on technologies in different industries
Property rights cannot be assigned to the underlying R&D
Resulting technology must be compatible and interoperable with other technologies
High risk of opportunistic behavior when sharing information about the technology
Sources: Link and Scott (1998, 2005, and In Press).
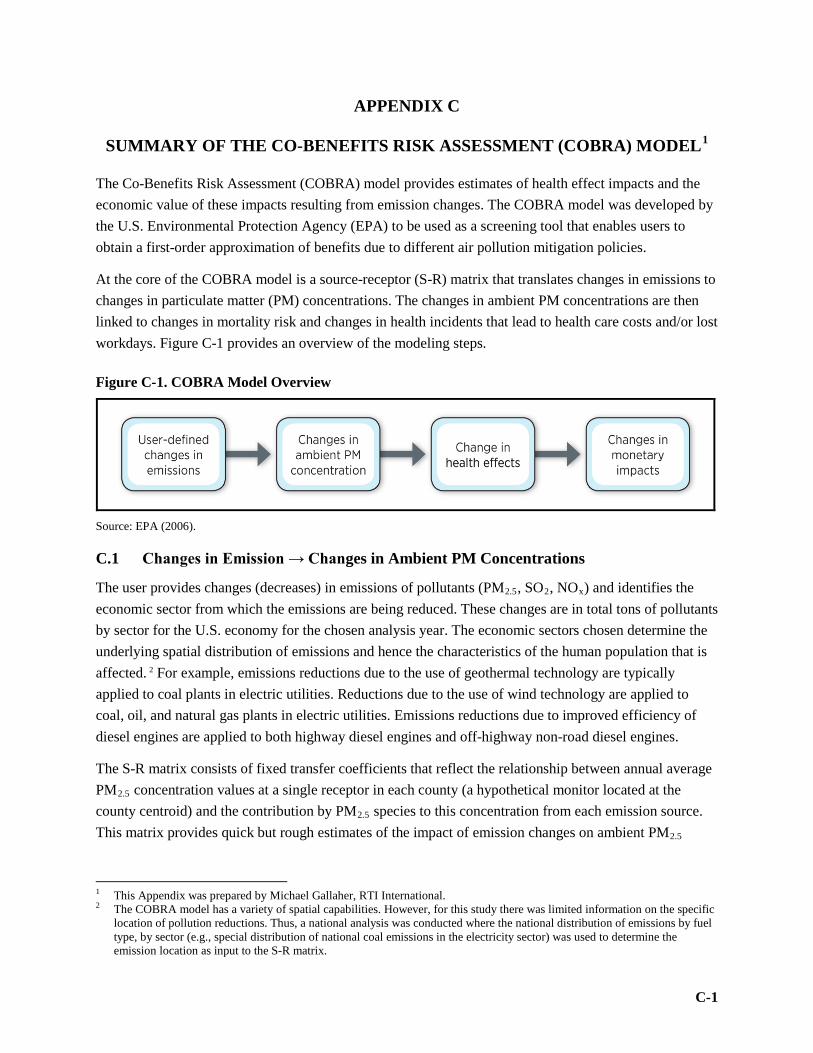
C-1
APPENDIX C
SUMMARY OF THE CO-BENEFITS RISK ASSESSMENT (COBRA) MODEL1
The Co-Benefits Risk Assessment (COBRA) model provides estimates of health effect impacts and the economic value of these impacts resulting from emission changes. The COBRA model was developed by the U.S. Environmental Protection Agency (EPA) to be used as a screening tool that enables users to obtain a first-order approximation of benefits due to different air pollution mitigation policies.
At the core of the COBRA model is a source-receptor (S-R) matrix that translates changes in emissions to changes in particulate matter (PM) concentrations. The changes in ambient PM concentrations are then linked to changes in mortality risk and changes in health incidents that lead to health care costs and/or lost workdays. Figure C-1 provides an overview of the modeling steps.
Figure C-1. COBRA Model Overview
Source: EPA (2006).
C.1 Changes in Emission → Changes in Ambient PM Concentrations
The user provides changes (decreases) in emissions of pollutants (PM2.5, SO2, NOx) and identifies the economic sector from which the emissions are being reduced. These changes are in total tons of pollutants by sector for the U.S. economy for the chosen analysis year. The economic sectors chosen determine the underlying spatial distribution of emissions and hence the characteristics of the human population that is affected. 2 For example, emissions reductions due to the use of geothermal technology are typically applied to coal plants in electric utilities. Reductions due to the use of wind technology are applied to coal, oil, and natural gas plants in electric utilities. Emissions reductions due to improved efficiency of diesel engines are applied to both highway diesel engines and off-highway non-road diesel engines.
The S-R matrix consists of fixed transfer coefficients that reflect the relationship between annual average PM2.5 concentration values at a single receptor in each county (a hypothetical monitor located at the county centroid) and the contribution by PM2.5 species to this concentration from each emission source. This matrix provides quick but rough estimates of the impact of emission changes on ambient PM2.5
1 This Appendix was prepared by Michael Gallaher, RTI International. 2 The COBRA model has a variety of spatial capabilities. However, for this study there was limited information on the specific
location of pollution reductions. Thus, a national analysis was conducted where the national distribution of emissions by fuel type, by sector (e.g., special distribution of national coal emissions in the electricity sector) was used to determine the emission location as input to the S-R matrix.

Retrospective Benefit-Cost Evaluation of U.S. DOE Vehicle Combustion Engine R&D Investments
C-2
levels as compared to the detailed estimates provided by more sophisticated air quality models (EPA, 2006).
C.2 Changes in Ambient PM Concentrations → Changes in Health Effects
The model then translates the changes in ambient PM concentration to changes in incidence of human health effects using a range of health impact functions and estimated baseline incidence rates for each health endpoint. The data used to estimate baseline incidence rates, and the health impact functions used vary across the different health endpoints. To be consistent with prior EPA analyses, the health impact functions and the unit economic value used in COBRA are the same as the ones used for the Regulatory Impact Analysis of the Clean Air Interstate Rule (EPA, 2005).3
The model provides (in the form of a table or map) changes in the number of cases for each health effect between the baseline emissions scenario (included in the model) and the analysis scenario. The different health endpoints are included in Table C-1.
Each health effect is described briefly below. For additional detail on the epidemiological studies, functional forms, and coefficients used in COBRA, see Appendices C of the COBRA user’s manual (EPA, 2006) and Abt (2009).
Mortality researchers have linked both short-term and long-term exposures to ambient levels of air pollution to increased risk of premature mortality. COBRA uses mortality risk estimates from an epidemiological study of the American Cancer Society cohort conducted by Pope et al. (2002). COBRA includes different mortality risk estimates for both adults and infants. Because of the high monetary value associated with prolonging life, mortality risk reduction is consistently the largest health endpoint valued in the study.
Chronic bronchitis is defined as a persistent wet cough and mucus in the lungs for at least 3 months for several consecutive years, and it affects approximate 5% of the population (Abt, 2009). A study by Abbey et al. (1995) found statistically significant relationships between PM2.5 and PM10 and chronic bronchitis.
Nonfatal heart attacks were linked by Peters et al. (2001) to PM exposure. Nonfatal heart attacks are modeled separately from hospital admissions because of their lasting impact on long-term health care costs and earning.
3 For a detailed discussion of studies used for health impact functions and unit values, see EPA (2005).

Appendix C — Summary of the COBRA Model
C-3
Table C-1. Health Endpoints Included in COBRA
Health Effect Description
Mortality Number of deaths
Chronic Bronchitis Cases of chronic bronchitis
Non-fatal Heart Attacks Number of non-fatal heart attacks
Respiratory Hospital Admissions
Number of cardiopulmonary-, asthma-, or pneumonia-related hospitalizations
Cardio-vascular Related Hospital Admissions
Number of cardiovascular-related hospitalizations
Acute Bronchitis Cases of acute bronchitis
Upper Respiratory Symptoms
Episodes of upper respiratory symptoms (runny or stuffy nose; wet cough; and burning, aching, or red eyes)
Lower Respiratory Symptoms
Episodes of lower respiratory symptoms: cough, chest pain, phlegm, or wheeze
Asthma Emergency Room Visits
Number of asthma-related emergency room visits
Minor Restricted Activity Days
Number of minor restricted activity days (days on which activity is reduced but not severely restricted; missing work or being confined to bed is too severe to be MRAD).
Work Loss Days Number of work days lost due to illness
Hospital admissions include two major categories: respiratory (such as pneumonia and asthma) and cardiovascular (such as heart failure, ischemic heart disease). Using detailed hospital admission and discharge records, Sheppard et al. (1999) investigated asthma hospital emissions associated with PM, carbon monoxide (CO), and ozone, and Moolgavkar (2000 and 2003) and Ito (2003) found a relationship between hospital admissions and PM. COBRA includes separate risk factors for hospital admissions for people aged 18 to 64 and aged 65 and older.
Acute bronchitis, defined as coughing, chest discomfort, slight fever, and extreme tiredness lasting for a number of days, was found by Dockery et al. (1996) to be related to sulfates, particulate acidity, and, to a lesser extent, PM. COBRA estimates the episodes of acute bronchitis in children aged 8 to 12 from pollution using the findings from Dockery et al.
Upper respiratory symptoms include episodes of upper respiratory symptoms (runny or stuffy nose; wet cough; and burning, aching or red eyes). Pope et al. (2002) found a relationship between PM and the incidence of a range of minor symptoms, including runny or stuffy nose; wet cough, and burning; aching or red eyes.
Lower respiratory symptoms in COBRA are based on Schwarz and Neas (2000) and focus primarily on children’s exposure to pollution. Children were selected for the study based on indoor exposure to PM

Retrospective Benefit-Cost Evaluation of U.S. DOE Vehicle Combustion Engine R&D Investments
C-4
and other pollutants resulting from parental smoking and gas stoves. Episodes of lower respiratory symptoms are coughing, chest pain, phlegm, or wheezing.
Asthma related emergency room visits are primarily associated with children under the age of 18. Norris et al. (1999) found significant associations between asthma ER visits and PM and CO. To avoid double counting, hospitalization costs (discussed above) do not include the cost of admission to the emergency room.
Minor restricted activity days (MRAD) in COBRA were based on research by Ostro and Rothschild (1989). MRADs include days on which activity is reduced but not severely restricted (e.g., missing work or being confined to bed is too severe to be an MRAD). They estimated the incidence of MRADs for a national sample of the adult working population, aged 18 to 65, in metropolitan areas. Because this study is based on a “convenience “sample of nonelderly individuals, the impacts may be underestimated because the elderly are likely to be more susceptible to PM-related MRADs).
Work loss days were estimated by Ostro (1987) to be related to PM levels. Based on an annual national survey of people aged 18 to 65, Ostro found that 2-week average PM levels were significantly linked to work loss days. However, the findings showed some variability across years.
C.3 Changes in Health Effects → Changes in Monetary Impacts
COBRA translates the health effects into changes in monetary impacts using estimated unit values of each health endpoint. The per-unit monetary values are described Appendix F of the COBRA user’s manual (EPA, 2006). Estimation of the monetary unit values vary by the type of health effect. For example, reductions in the risk of premature mortality are monetized using value of statistical life (VSL) estimates. Other endpoints such as hospital admissions use cost of illness (COI) units that include the hospital costs and lost wages of the individual but do not capture the social (personal) value of pain and suffering.
C.4 Limitations
It should be noted that COBRA does not incorporate effects of many pollutants, such as carbon emissions or mercury. This has two potential implications. First, other pollutants may cause or exacerbate health endpoints that are not included in COBRA. This would imply that reducing incidences of such health points are not captured. Second, pollutants other than those included in COBRA may also cause a higher number of incidences of the health effects that are part of the model. This is also not captured in this analysis. Thus, the economic value of health effects obtained from COBRA may be interpreted as a conservative estimate of the health benefits from reducing emissions.

D-1
APPENDIX D
BIBLIOMETRICS METHODOLOGY USED IN THE KNOWLEDGE BENEFITS ANALYSIS1
This appendix provides a brief treatment of the bibliometric methods of evaluation—particularly patent analysis—used to generate the findings described in Section 3.3.4 of this report. For additional information about these and other methods, please refer to Linkages from DOE’s Vehicle Technologies R&D in Advanced Combustion to Higher-Efficiency, Cleaner-Burning Engines: A Bibliometric Study (Ruegg and Thomas, 2010).
Bibliometric methods of evaluation tend to be useful in historical tracing studies. Then can be used to provide objectively derived, quantitative measures of linkages from publication and patent outputs of the ACE R&D sub-program to other publications and patents outside the program. The related analyses can indicate that knowledge has been created, who created it, the extent to which it is being disseminated and used (or at least referenced) by others, and who is using or referencing it.
D.1 Why Patent Analysis?
When looking for connections between knowledge creation in a research program and commercialized technologies, patents are of particular interest because they are considered close to application. The use of patents as indicators of technology creation and patent citation analysis as indicative of technology diffusion reflects a central role of patents in the innovation system. Patent citation analysis has been used extensively in the study of technological change.
In patent analysis, a reference from a patent to a previous patent is regarded as recognition that some aspect of the earlier patent has had an impact on the development of the later patent. In the patent analysis presented in this report, the idea is that the technologies represented by patents that cite DOE-supported patents have built in some way on the patents attributable to research funded by DOE.
Patent citation analysis also has been employed in other studies, as it is here, to evaluate the impact of particular patents on technological developments. This approach is based on the idea that highly cited patents (i.e., patents cited by many later patents) tend to contain technological information of particular importance. Because they form the basis for many new innovations, they are cited frequently by later patents. Although it is not true to say that every highly cited patent is important, or that every infrequently cited patent is unimportant, research studies have shown a correlation between the rate of citations of a patent and its technological importance.2
1 This appendix was prepared by Rosalie Ruegg, TIA Consulting Inc. and Patrick Thomas, 1790 Analytics LLC. 2 For an account of the usefulness of patents and citations data as a window on the process of technological change and the
“knowledge economy,” and as a research tool for tracing links across inventions, see Jaffe and Trajtenberg (2005). For additional background on the use of patent citation analysis, including a summary of validation studies supporting its use, see, Breitzman and Mogee (1999).
Retrospective Benefit-Cost Evaluation of U.S. DOE Vehicle Combustion Engine R&D Investments
D-2
D.2 “Prior Art”
A patent discloses to society how an invention is practiced, in return for the right during a limited period of time to exclude others from using the patented invention without the patent assignee’s permission. The front page of a patent document contains a list of references to prior art. “Prior art” in patent law refers to all information that previously has been made available publicly such that it might be relevant to a patent’s claim of originality, and hence, its validity. Prior art may be in the form of previous patents, or published items such as scientific papers, technical disclosures, or trade magazines.
Patent citation analysis centers on the links made by these prior art references between generations of patents and between patents and scientific papers. In basic terms, this type of analysis is based on the idea that the prior art referenced by patents has had some influence, however slight, on the development of these patents. The prior art is thus regarded as part of the foundation for the later invention.
In assessing the influence of individual patents and papers, citation analysis centers on the idea that highly cited patents/papers (i.e., patents/papers cited by many later patents) tend to contain scientific or technological information of particular interest or importance. As such, they form the basis for many new innovations and research efforts, and thus, are cited frequently by later patents.
D.3 Forward and Backward Patent Tracing Two approaches to patent analysis were used in this study—forward tracing and backward tracing—paralleling the two perspectives of the broader historical tracing framework.
D.3.1 Forward Patent Tracing
The idea of forward tracing is to take a given body of research and trace the influence of this research on subsequent technological developments. In the context of the current analysis, forward tracing involves identifying all advanced combustion patents and papers resulting from research programs funded by DOE. The impact of these patents and papers on subsequent generations of technology is then evaluated. This tracing is not restricted to later combustion patents, because the influence of a body of research may extend beyond its immediate technology. Hence, the purpose of the forward tracing element of this project is to determine the impact of EERE-funded advanced combustion patents on the development of combustion technology and other technologies.
D.3.2 Backward Patent Tracing
The idea of backward tracing is to take a particular technology, product, or industry, and to trace back to identify the earlier technologies on which it has built. In the context of this project, the idea of backward patent tracing is to trace back to identify the earlier technologies on which the leading innovative vehicle and engine companies have built. To do this required first identifying the set of all combustion patents for those leading companies. By tracing backward from this set of combustion patents to earlier combustion patents attributed to EERE-funded advanced combustion R&D, it was possible to determine the extent to which later innovations built on earlier DOE-funded research. Further, comparing the extent of the

Appendix D — Bibliometric Methodology Used in the Knowledge Benefits Analysis
D-3
linkage of the total set back to earlier DOE-attributed patents versus the linkages back to other organizations indicates the relative importance of DOE in establishing a knowledge base on which other organizations built further innovations in engine combustion.
D.4 Extensions of the Patent Citation Analysis
The simplest form of patent tracing is based on a single generation of citation links between U.S. patents. Such a study identifies U.S. patents that cite, or are cited by, a given set of U.S. patents as prior art. This study extends the patent analysis in three ways, as discussed below.
D.4.1 Extension to Patents Citing Publications
This study extends the analysis to include patent citations of publications authored by DOE-funded researchers. The rationale for this extension is that DOE scientists may produce publications that are considered directly relevant to a technology’s development. Adding prior art references to DOE-supported publications thus takes into account the influence of the research described in these publications on innovations captured in patents. (See Ruegg and Thomas, 2010, for the types of citation links examined in the study.)
D.4.2 Extension to Multiple Generations of Citation Links
This study extends the analysis by adding a second generation of citation links. This means that the study traces forward through two generations of citations, starting from DOE-attributed combustion patents, and backward through two generations starting from the patents of leading innovative vehicle and engine companies.
The idea behind adding this second generation of citations is that federal agencies such as DOE often support scientific research that is more basic than applied. It may take time, and multiple generations of research, for this basic research to be used in an applied technology, such as that described in a patent. The impact of the basic research may not therefore be reflected in a study based on referencing a single generation of prior art. Introducing a second generation of citations provides greater access to these indirect links between basic and applied research and technology development.
One potential problem with adding a second generation of citations should be acknowledged. This is a problem common to many networks, whether these networks consist of people, institutions, or scientific documents, as in this case. The problem is that, if one uses enough generations of links, eventually almost every node in the network will be linked. The most famous example of this is the idea that every person is within six links of any other person in the world. By the same logic, if one takes a starting set of patents and extends the network of prior art references far enough, eventually almost all patents will be linked to this starting set. Based on our previous experience, using two generations of citation links is appropriate for tracing studies such as this. However, adding additional generations may bring in too many patents with little connection to the starting set.

Retrospective Benefit-Cost Evaluation of U.S. DOE Vehicle Combustion Engine R&D Investments
D-4
D.4.3 Extension beyond the U.S. Patent System
The report looked beyond the U.S. patent system to include patents from the European Patent Office (EPO) and patent applications filed with the World Intellectual Property Organization (WIPO). The analysis thus allowed for a wide variety of possible linkages between EERE’s-funded ACE R&D sub-programs research and subsequent technological developments in and outside the United States.
D.5 Patent Data Sets for Analysis
The forward tracing part of the study starts from the set of combustion patents attributed to the DOE's ACE R&D sub-program’s funding, while the backward tracing part starts from the set of combustion patents of the leading innovative vehicle and engine companies. Neither of these data sets existed; both had to be constructed for this study.
D.5.1 Identifying the Set of EERE-Attributable Combustion Patents for Forward Tracing
The set of EERE-attributable combustion patents was constructed through a five-step process:
1. Construct an initial database of DOE-attributable patents. 2. Filter the database to identify EERE-attributed patents related to advanced combustion. 3. Identify additional candidate EERE-attributed combustion patents based on document review. 4. Narrow the candidate patent list through EERE expert review. 5. Add international and U.S. continuation or divisional patents related to patents in the candidate list. These steps are described below.
Step 1: Construct an Initial Database of DOE-Attributable Patents
Identifying patents funded by government agencies is often more difficult than identifying patents funded by companies. When a company funds internal research, any patented inventions emerging from this research are likely to be assigned to the company itself. To construct a patent set for a company, one simply has to identify all patents assigned to the company, along with all of its subsidiaries, acquisitions, etc.
In contrast, a government agency such as DOE may fund research in a variety of organizations. For example, DOE operates a number of laboratories and research centers. Patents emerging from these laboratories and research centers may be assigned to DOE, or they may be assigned to the organization that manages the laboratories or research centers. For example, patents from SNL may be assigned to Lockheed Martin, while patents from LLNL may be assigned to the University of California.
A further complication is that DOE not only funds research in its own laboratories and research centers, it also funds research carried out by private companies and universities. If this research results in patented inventions, these patents are likely to be assigned to the company or university carrying out the research, rather than to DOE.
To identify patents resulting from EERE-funded advanced combustion research, the following data sources were used as a starting point to identify most of the population DOE-funded patents:
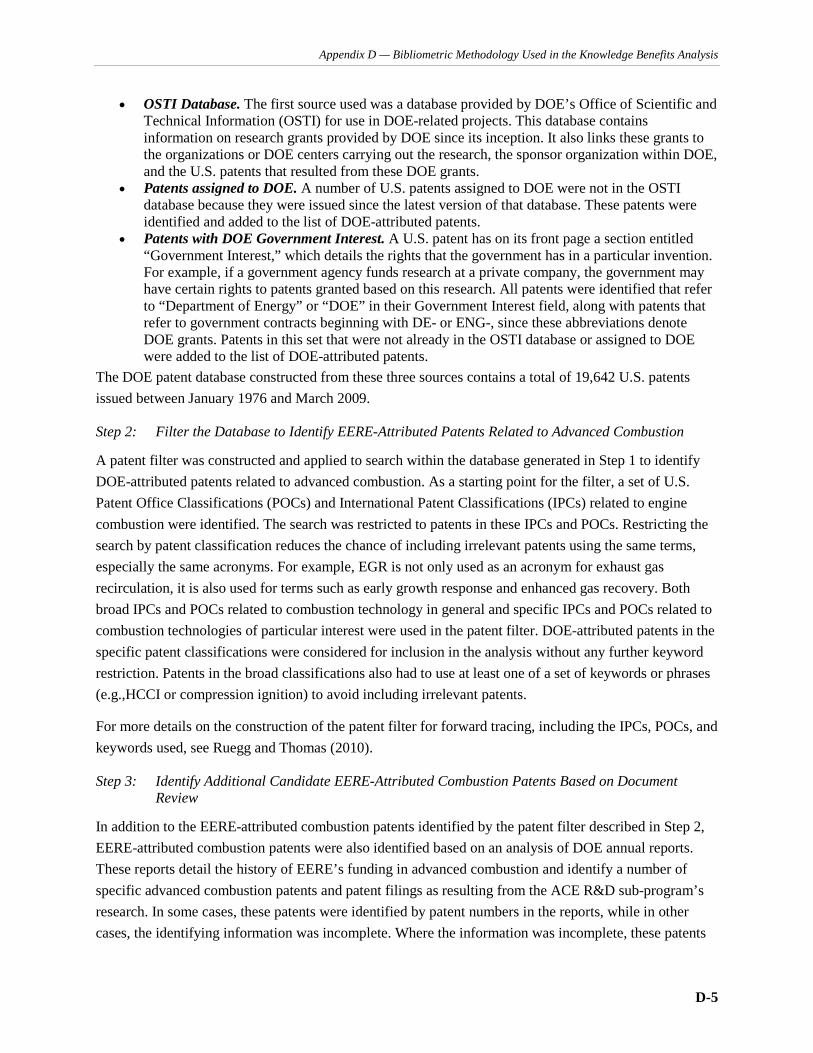
Appendix D — Bibliometric Methodology Used in the Knowledge Benefits Analysis
D-5
• OSTI Database. The first source used was a database provided by DOE’s Office of Scientific and Technical Information (OSTI) for use in DOE-related projects. This database contains information on research grants provided by DOE since its inception. It also links these grants to the organizations or DOE centers carrying out the research, the sponsor organization within DOE, and the U.S. patents that resulted from these DOE grants.
• Patents assigned to DOE. A number of U.S. patents assigned to DOE were not in the OSTI database because they were issued since the latest version of that database. These patents were identified and added to the list of DOE-attributed patents.
• Patents with DOE Government Interest. A U.S. patent has on its front page a section entitled “Government Interest,” which details the rights that the government has in a particular invention. For example, if a government agency funds research at a private company, the government may have certain rights to patents granted based on this research. All patents were identified that refer to “Department of Energy” or “DOE” in their Government Interest field, along with patents that refer to government contracts beginning with DE- or ENG-, since these abbreviations denote DOE grants. Patents in this set that were not already in the OSTI database or assigned to DOE were added to the list of DOE-attributed patents.
The DOE patent database constructed from these three sources contains a total of 19,642 U.S. patents issued between January 1976 and March 2009.
Step 2: Filter the Database to Identify EERE-Attributed Patents Related to Advanced Combustion
A patent filter was constructed and applied to search within the database generated in Step 1 to identify DOE-attributed patents related to advanced combustion. As a starting point for the filter, a set of U.S. Patent Office Classifications (POCs) and International Patent Classifications (IPCs) related to engine combustion were identified. The search was restricted to patents in these IPCs and POCs. Restricting the search by patent classification reduces the chance of including irrelevant patents using the same terms, especially the same acronyms. For example, EGR is not only used as an acronym for exhaust gas recirculation, it is also used for terms such as early growth response and enhanced gas recovery. Both broad IPCs and POCs related to combustion technology in general and specific IPCs and POCs related to combustion technologies of particular interest were used in the patent filter. DOE-attributed patents in the specific patent classifications were considered for inclusion in the analysis without any further keyword restriction. Patents in the broad classifications also had to use at least one of a set of keywords or phrases (e.g.,HCCI or compression ignition) to avoid including irrelevant patents.
For more details on the construction of the patent filter for forward tracing, including the IPCs, POCs, and keywords used, see Ruegg and Thomas (2010).
Step 3: Identify Additional Candidate EERE-Attributed Combustion Patents Based on Document Review
In addition to the EERE-attributed combustion patents identified by the patent filter described in Step 2, EERE-attributed combustion patents were also identified based on an analysis of DOE annual reports. These reports detail the history of EERE’s funding in advanced combustion and identify a number of specific advanced combustion patents and patent filings as resulting from the ACE R&D sub-program’s research. In some cases, these patents were identified by patent numbers in the reports, while in other cases, the identifying information was incomplete. Where the information was incomplete, these patents

Retrospective Benefit-Cost Evaluation of U.S. DOE Vehicle Combustion Engine R&D Investments
D-6
were identified, where possible, by matching inventor names, titles, filing dates, and other data to the partial information provided in the DOE annual reports. Patents identified from the review of DOE documents were added to EERE-attributed combustion patent set created in Step 2. The resulting combined list was considered to be a candidate list, requiring validation by EERE experts in the field.
Step 4: Narrow the Candidate Patent List through EERE Expert Review
The list of candidate combustion patents identified using the patent filter and document review was sent to EERE for validation. EERE scientists and program managers—experts in the field—provided feedback as to which of the candidate patents should be included in the final set of EERE-attributed patents and which should be omitted. Many of the candidate patents omitted were concerned with exhaust gas treatment, because this was considered to be beyond the scope of the analysis, which focuses on in-cylinder combustion technologies. Some of the candidate patents identified on the basis of partial information found in DOE documents were omitted because of uncertainty regarding the degree of DOE attribution.
Based on the process to this point, a total of 119 U.S. combustion patents attributable to EERE’s funding of advanced combustion research were identified.
Step 5: Add International and U.S. Continuation or Divisional Patents Related to Patents in the Candidate List
Finally, to take into account equivalents of each of these patents in the EPO and WIPO patent systems (i.e., patents filed in the EPO and WIPO patent systems that represent essentially the same invention as one covered by one of the 119 identified U.S. patents), those patent systems were also searched. In addition, the U.S. patent system was searched again for U.S. patents that are continuations, continuations-in-part, or divisionals of each of the 119 U.S. patents identified by the end of Step 4, again to take into account patents representing the same invention as one covered by one of those 119 patents. These additional patent searches yielded a total of 127 U.S. patents, 14 EPO patents, and 25 WIPO patents that are related to the initial 119 U.S. patents. (A list of these patents can be found in Appendix A of Ruegg and Thomas, 2010).
D.5.2 Identifying the Leading Innovative Vehicle and Engine Companies and Their Combustion Patents for Backward Tracing
To evaluate the impact of EERE’s ACE R&D sub-program’s research on combustion technologies produced by leading innovative vehicle and engine manufacturers, a list of such companies was constructed. Specifically, the 10 vehicle and engine companies with the largest number of U.S. patents granted since 1992, including patents assigned to all company subsidiaries and acquisitions, were identified.3 These companies are listed in Table D-1.
3 These companies are referred to hereafter as the leading vehicle and engine companies. This is based on patent portfolio size
and is not a reflection of number of vehicles sold, revenues, profits, etc. A fuller description would be the leading patenting vehicle and engine companies, but this is a cumbersome description, so we have shortened it for simplicity throughout this appendix and the knowledge results section of the report.
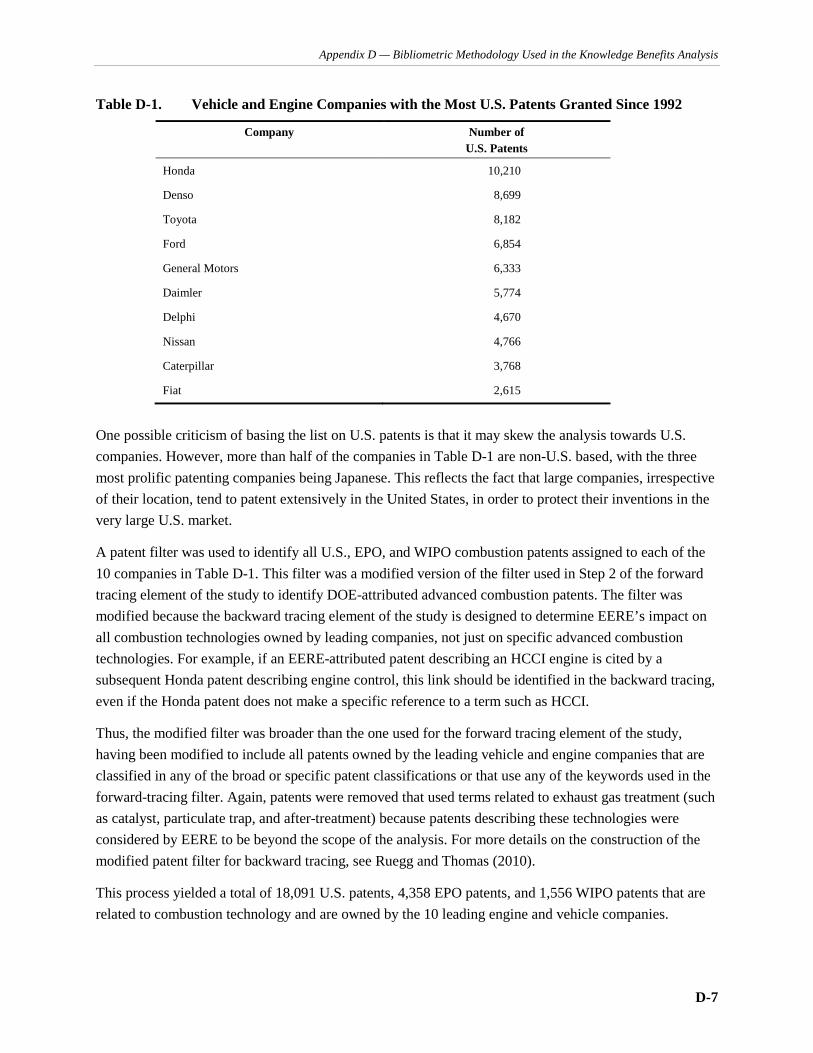
Appendix D — Bibliometric Methodology Used in the Knowledge Benefits Analysis
D-7
Table D-1. Vehicle and Engine Companies with the Most U.S. Patents Granted Since 1992
Company Number of U.S. Patents
Honda 10,210
Denso 8,699
Toyota 8,182
Ford 6,854
General Motors 6,333
Daimler 5,774
Delphi 4,670
Nissan 4,766
Caterpillar 3,768
Fiat 2,615
One possible criticism of basing the list on U.S. patents is that it may skew the analysis towards U.S. companies. However, more than half of the companies in Table D-1 are non-U.S. based, with the three most prolific patenting companies being Japanese. This reflects the fact that large companies, irrespective of their location, tend to patent extensively in the United States, in order to protect their inventions in the very large U.S. market.
A patent filter was used to identify all U.S., EPO, and WIPO combustion patents assigned to each of the 10 companies in Table D-1. This filter was a modified version of the filter used in Step 2 of the forward tracing element of the study to identify DOE-attributed advanced combustion patents. The filter was modified because the backward tracing element of the study is designed to determine EERE’s impact on all combustion technologies owned by leading companies, not just on specific advanced combustion technologies. For example, if an EERE-attributed patent describing an HCCI engine is cited by a subsequent Honda patent describing engine control, this link should be identified in the backward tracing, even if the Honda patent does not make a specific reference to a term such as HCCI.
Thus, the modified filter was broader than the one used for the forward tracing element of the study, having been modified to include all patents owned by the leading vehicle and engine companies that are classified in any of the broad or specific patent classifications or that use any of the keywords used in the forward-tracing filter. Again, patents were removed that used terms related to exhaust gas treatment (such as catalyst, particulate trap, and after-treatment) because patents describing these technologies were considered by EERE to be beyond the scope of the analysis. For more details on the construction of the modified patent filter for backward tracing, see Ruegg and Thomas (2010).
This process yielded a total of 18,091 U.S. patents, 4,358 EPO patents, and 1,556 WIPO patents that are related to combustion technology and are owned by the 10 leading engine and vehicle companies.

Retrospective Benefit-Cost Evaluation of U.S. DOE Vehicle Combustion Engine R&D Investments
D-8
D.6 Constructing Patent Families Based on the "Priority Application"
As explained above, organizations often file for protection of their inventions across multiple patent systems, resulting in equivalent patents on a single invention. In addition, businesses often add supplementary material to a patent within a given patent system, resulting in continuations of a given patent. For example, a U.S. company may file to protect a given invention in the United States and also file for protection of this invention in other countries. Also, inventors may apply for a series of patents in the same country based on the same underlying invention. As a result, there may be multiple patent documents for the same invention, as demonstrated for the set of EERE-attributed combustion patents for the forward tracing part of the study.
To avoid counting the same invention multiple times, "patent families" were constructed based on the two sets of identified patents. A patent family contains all of the patents and patent continuations, continuations-in-part, or divisionals that result from the same original patent application (which is called the "priority document"). A patent family may include patents or patent applications from multiple countries, as well as multiple patents or patent applications from the same country.
To construct these patent families, the priority documents of the U.S., EPO, and WIPO patents and patent applications were matched to group them in the appropriate families. Fuzzy matching algorithms were used to achieve this, along with a small amount of manual matching, because priority documents have different number formats in different patent systems. It should be noted that the priority document does not necessarily need be a U.S., EPO, or WIPO application. For example, a Japanese patent application may result in U.S., EPO, and WIPO patents or patent applications, and these patents would be grouped in the same patent family because they share the same Japanese priority document.
This study entailed the construction of combustion patent families attributed to EERE, combustion patent families for the leading vehicle and engine companies, and also patent families for all of the patents linked through citations to EERE. As a result of this process, the DOE-attributed U.S., EPO, and WIPO advanced combustion patents and patent applications were grouped into 109 patent families. The set of all U.S., EPO, and WIPO combustion patents and patent applications owned by the leading vehicle and engine companies were grouped into 22,103 patent families.
D.7 Publication Coauthoring and Citation Analyses
Past similar studies suggest that analyses of publications may offer additional insights into the creation and dissemination of knowledge from EERE’s ACE R&D sub-program. The volume of publications over time provides an indication of the extent of publications as a knowledge output. Coauthoring of publications in advanced combustion by EERE researchers with researchers from other organizations may indicate collaboration and links between EERE researchers and researchers involved in downstream technology development and commercialization. Citations of publications resulting from EERE advanced combustion research show paths of knowledge flow.
The publication citation search was facilitated by the use of a publication citation database and search engine. For a long time, the U.S.-based firm Thomson Scientific (formerly the Institute for Scientific

Appendix D — Bibliometric Methodology Used in the Knowledge Benefits Analysis
D-9
Information) was the principal entity facilitating publication citation analysis. But today, a growing number of publication citation databases and search tools, such as Scopus, CiteSeer, and Google Scholar, provide comprehensive coverage beyond the major journals, including, for example, conference proceedings, book chapters, dissertations, and research reports (Meho, 2007).4 For this study’s publication-to-publication citation analysis, conference papers and research reports were prominent, and Google Scholar was used because it included these kinds of publication in its search capability. A comparison of alternative publication search tools rated Google Scholar among the best (Meho, 2007).
4 For a similar background on the use of paper citation analysis, see Chapter 3 of Thomas (1999).