RETROFITTING SINGAPORE’S JURONG WATER …membranes.com/docs/papers/New Folder/RETROFITTING...
21
1 RETROFITTING SINGAPORE’S JURONG WATER RECLAMATION PLANT WITH MEMBRANE BIOREACTOR – MINIMIZING ENERGY CONSUMPTION THROUGH SELECTION OF UNIQUE DESIGN PARAMETERS Ben Freeman, Nitto Denko/Hydranautics, 401 Jones Rd., Oceanside, CA, 92058 Email: [email protected] Phone: (760) 901-2675 Shinya SUNANO, Eric Liu, Nitto Denko/Hydranautics Yasuo ODA, Mitsubishi Rayon Corporation Abstract Phase 1 of Singapore Public Utility Board’s (PUB) Jurong Water Reclamation Plant (WRP) currently treats 82,000 m 3 /day of primarily domestic wastewater with a conventional activated sludge (CAS) process. The treated effluent is discharged to the ocean. In order to produce effluent which is suitable for reuse in industrial applications on nearby Jurong Island, Singapore PUB will retrofit the aeration tanks of Phase 1 of the Jurong WRP with a “simple” enhanced biological phosphorus removal (EBPR) membrane bioreactor (MBR). [S. Levasque et al. 2010, Singapore’s Jurong WRP Membrane Bioreactor Facility - Industrial and Retrofit Challenges, WEFTEC Conference Proceedings 2010] MBRs have numerous advantages over CAS processes; including the ability to operate at high mixed liquor suspended solids (MLSS) concentrations. The benefits of operating at high MLSS concentrations (which can result in long solids retention times (SRT)), include decreased footprint, increased nutrient removal efficiency, and decreased sludge production. Decreased footprint translates to a capital cost savings. However, as MLSS concentration increases, the oxygen transfer efficiency decreases because the alpha value decreases. This results in increased energy consumption of the biological process blowers. Additionally, operating at an increased MLSS concentration in the aerobic tank often requires a high return activated sludge (RAS) flow rate to filtrate flow rate ratio, in order to maintain the MLSS concentration in the membrane tank in the acceptable operating range of many submerged hollow fiber MBR membranes. Therefore, careful consideration of the project requirements should be given when selecting the MLSS concentration and RAS flow rate to filtrate flow rate ratio. In the case of retrofits, the capital cost of the tanks is sunk. Therefore, operating cost savings is of primary concern. To minimize energy consumption at the Jurong MBR, the MBR was designed with the minimum MLSS and minimum RAS flow rate to filtrate flow rate ratio. As a result, the Jurong MBR is expected to consume approximately 12% less energy than a MBR designed with a MLSS concentration and RAS flow rate ratio typical of other existing MBRs.
Transcript of RETROFITTING SINGAPORE’S JURONG WATER …membranes.com/docs/papers/New Folder/RETROFITTING...
1
RETROFITTING SINGAPORE’S JURONG WATER RECLAMATION PLANT WITH MEMBRANE BIOREACTOR – MINIMIZING ENERGY CONSUMPTION
THROUGH SELECTION OF UNIQUE DESIGN PARAMETERS
Ben Freeman, Nitto Denko/Hydranautics, 401 Jones Rd., Oceanside, CA, 92058 Email: [email protected] Phone: (760) 901-2675
Shinya SUNANO, Eric Liu, Nitto Denko/Hydranautics Yasuo ODA, Mitsubishi Rayon Corporation
Abstract Phase 1 of Singapore Public Utility Board’s (PUB) Jurong Water Reclamation Plant (WRP) currently treats 82,000 m3/day of primarily domestic wastewater with a conventional activated sludge (CAS) process. The treated effluent is discharged to the ocean. In order to produce effluent which is suitable for reuse in industrial applications on nearby Jurong Island, Singapore PUB will retrofit the aeration tanks of Phase 1 of the Jurong WRP with a “simple” enhanced biological phosphorus removal (EBPR) membrane bioreactor (MBR). [S. Levasque et al. 2010, Singapore’s Jurong WRP Membrane Bioreactor Facility - Industrial and Retrofit Challenges, WEFTEC Conference Proceedings 2010] MBRs have numerous advantages over CAS processes; including the ability to operate at high mixed liquor suspended solids (MLSS) concentrations. The benefits of operating at high MLSS concentrations (which can result in long solids retention times (SRT)), include decreased footprint, increased nutrient removal efficiency, and decreased sludge production. Decreased footprint translates to a capital cost savings. However, as MLSS concentration increases, the oxygen transfer efficiency decreases because the alpha value decreases. This results in increased energy consumption of the biological process blowers. Additionally, operating at an increased MLSS concentration in the aerobic tank often requires a high return activated sludge (RAS) flow rate to filtrate flow rate ratio, in order to maintain the MLSS concentration in the membrane tank in the acceptable operating range of many submerged hollow fiber MBR membranes. Therefore, careful consideration of the project requirements should be given when selecting the MLSS concentration and RAS flow rate to filtrate flow rate ratio. In the case of retrofits, the capital cost of the tanks is sunk. Therefore, operating cost savings is of primary concern. To minimize energy consumption at the Jurong MBR, the MBR was designed with the minimum MLSS and minimum RAS flow rate to filtrate flow rate ratio. As a result, the Jurong MBR is expected to consume approximately 12% less energy than a MBR designed with a MLSS concentration and RAS flow rate ratio typical of other existing MBRs.
2
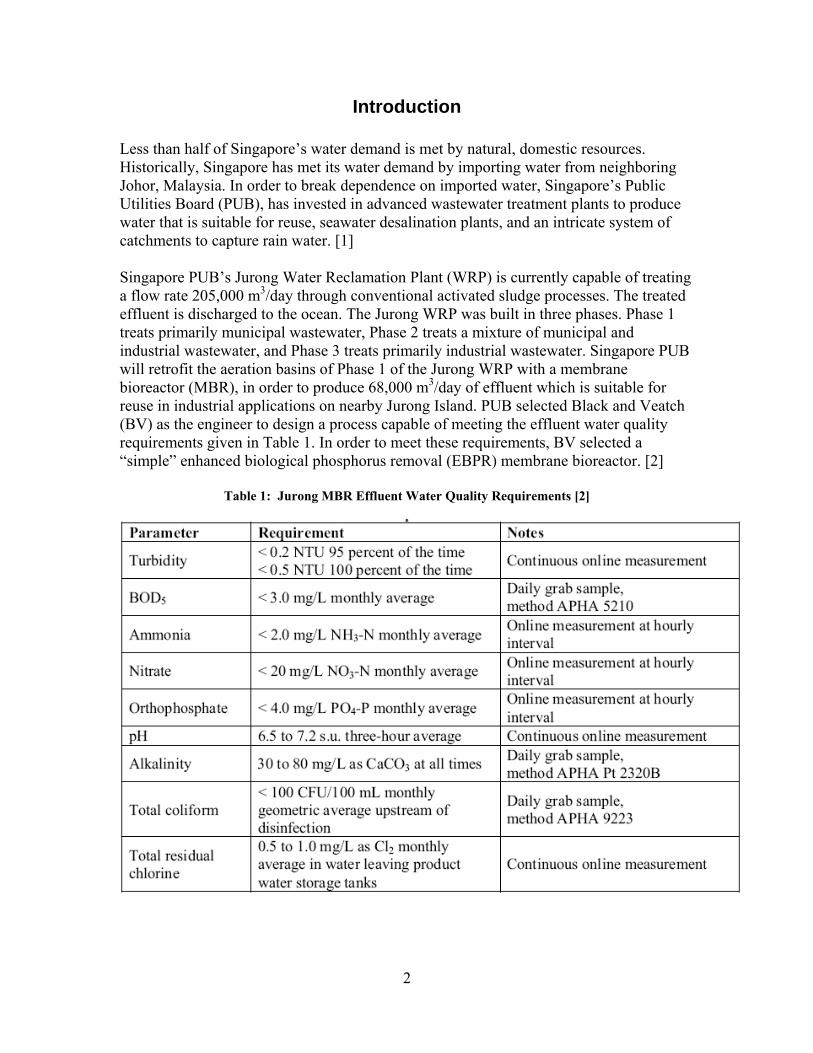
Introduction Less than half of Singapore’s water demand is met by natural, domestic resources. Historically, Singapore has met its water demand by importing water from neighboring Johor, Malaysia. In order to break dependence on imported water, Singapore’s Public Utilities Board (PUB), has invested in advanced wastewater treatment plants to produce water that is suitable for reuse, seawater desalination plants, and an intricate system of catchments to capture rain water. [1] Singapore PUB’s Jurong Water Reclamation Plant (WRP) is currently capable of treating a flow rate 205,000 m3/day through conventional activated sludge processes. The treated effluent is discharged to the ocean. The Jurong WRP was built in three phases. Phase 1 treats primarily municipal wastewater, Phase 2 treats a mixture of municipal and industrial wastewater, and Phase 3 treats primarily industrial wastewater. Singapore PUB will retrofit the aeration basins of Phase 1 of the Jurong WRP with a membrane bioreactor (MBR), in order to produce 68,000 m3/day of effluent which is suitable for reuse in industrial applications on nearby Jurong Island. PUB selected Black and Veatch (BV) as the engineer to design a process capable of meeting the effluent water quality requirements given in Table 1. In order to meet these requirements, BV selected a “simple” enhanced biological phosphorus removal (EBPR) membrane bioreactor. [2]
Table 1: Jurong MBR Effluent Water Quality Requirements [2]
3
MBRs have numerous advantages over CAS processes; including the ability to operate at high mixes liquor suspended solids (MLSS) concentrations. The benefits of operating at high MLSS concentrations (which can result in long solids retention times (SRT), include decreased footprint, increased nutrient removal efficiency, and decreased sludge production. Decreased footprint translates to a capital cost savings. However, as MLSS concentration increases, the oxygen transfer efficiency decreases because the alpha value decreases. This results in increased energy consumption of the biological blowers. Additionally, operating at an increased MLSS concentration in the aerobic tank requires a high return activated sludge (RAS) flow rate to filtrate flow rate ratio, in order to maintain the MLSS concentration in the membrane tank in the acceptable operating range of many submerged MBR membranes. The objective of this paper is to show that careful consideration of the project requirements should be given when selecting the MLSS concentration and RAS flow rate to filtrate flow rate ratio. Such careful consideration can result in significant energy savings.
System Design
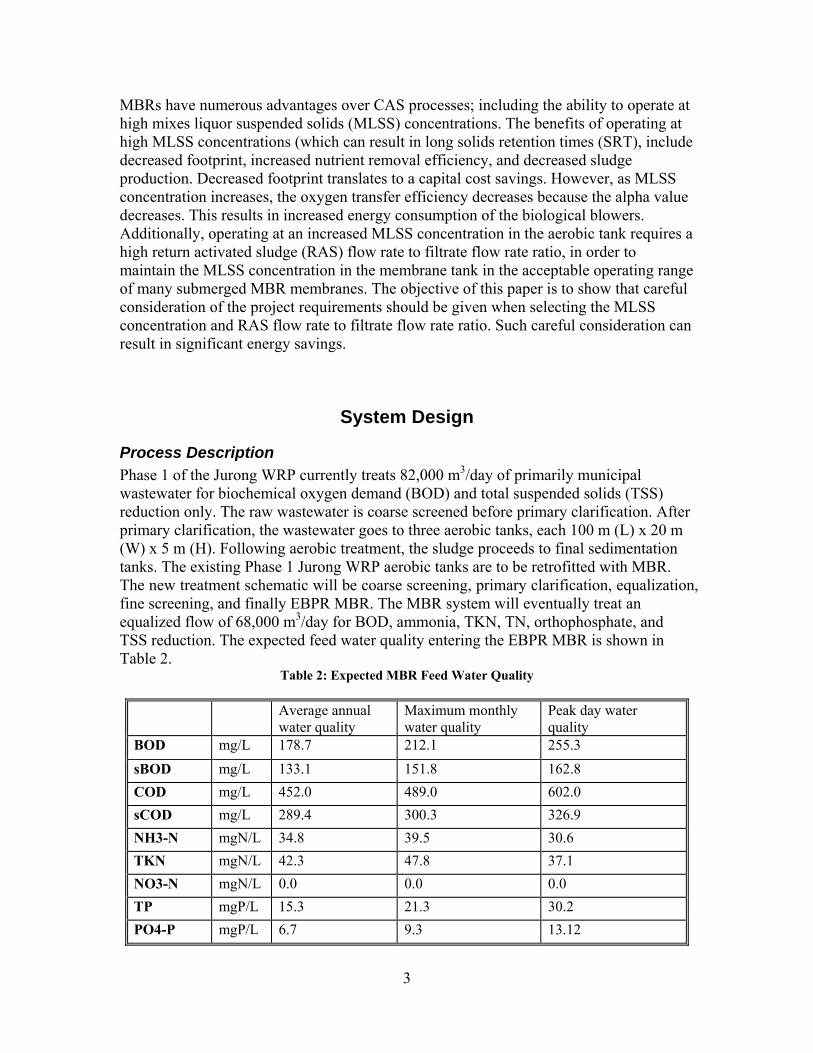
Process Description Phase 1 of the Jurong WRP currently treats 82,000 m3/day of primarily municipal wastewater for biochemical oxygen demand (BOD) and total suspended solids (TSS) reduction only. The raw wastewater is coarse screened before primary clarification. After primary clarification, the wastewater goes to three aerobic tanks, each 100 m (L) x 20 m (W) x 5 m (H). Following aerobic treatment, the sludge proceeds to final sedimentation tanks. The existing Phase 1 Jurong WRP aerobic tanks are to be retrofitted with MBR. The new treatment schematic will be coarse screening, primary clarification, equalization, fine screening, and finally EBPR MBR. The MBR system will eventually treat an equalized flow of 68,000 m3/day for BOD, ammonia, TKN, TN, orthophosphate, and TSS reduction. The expected feed water quality entering the EBPR MBR is shown in Table 2.
Table 2: Expected MBR Feed Water Quality
Average annual water quality
Maximum monthly water quality
Peak day water quality
BOD mg/L 178.7 212.1 255.3
sBOD mg/L 133.1 151.8 162.8 COD mg/L 452.0 489.0 602.0 sCOD mg/L 289.4 300.3 326.9 NH3-N mgN/L 34.8 39.5 30.6 TKN mgN/L 42.3 47.8 37.1 NO3-N mgN/L 0.0 0.0 0.0 TP mgP/L 15.3 21.3 30.2 PO4-P mgP/L 6.7 9.3 13.12
4
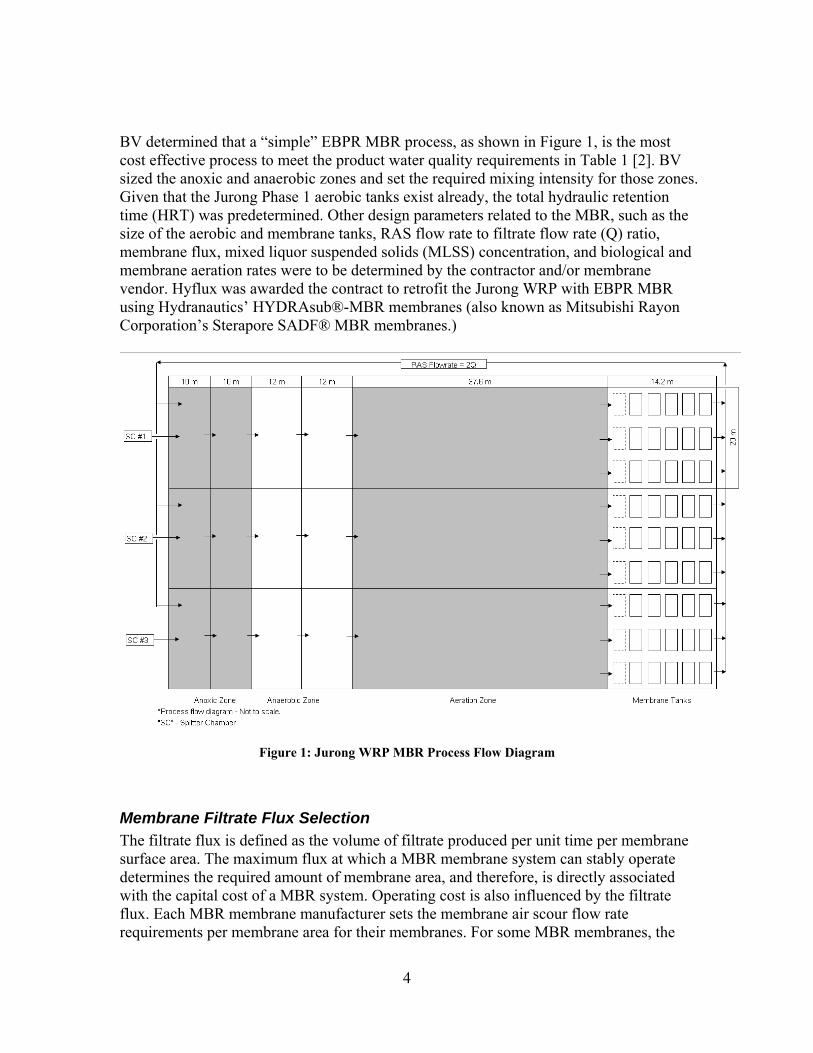
BV determined that a “simple” EBPR MBR process, as shown in Figure 1, is the most cost effective process to meet the product water quality requirements in Table 1 [2]. BV sized the anoxic and anaerobic zones and set the required mixing intensity for those zones. Given that the Jurong Phase 1 aerobic tanks exist already, the total hydraulic retention time (HRT) was predetermined. Other design parameters related to the MBR, such as the size of the aerobic and membrane tanks, RAS flow rate to filtrate flow rate (Q) ratio, membrane flux, mixed liquor suspended solids (MLSS) concentration, and biological and membrane aeration rates were to be determined by the contractor and/or membrane vendor. Hyflux was awarded the contract to retrofit the Jurong WRP with EBPR MBR using Hydranautics’ HYDRAsub®-MBR membranes (also known as Mitsubishi Rayon Corporation’s Sterapore SADF® MBR membranes.)
Figure 1: Jurong WRP MBR Process Flow Diagram
Membrane Filtrate Flux Selection The filtrate flux is defined as the volume of filtrate produced per unit time per membrane surface area. The maximum flux at which a MBR membrane system can stably operate determines the required amount of membrane area, and therefore, is directly associated with the capital cost of a MBR system. Operating cost is also influenced by the filtrate flux. Each MBR membrane manufacturer sets the membrane air scour flow rate requirements per membrane area for their membranes. For some MBR membranes, the
5
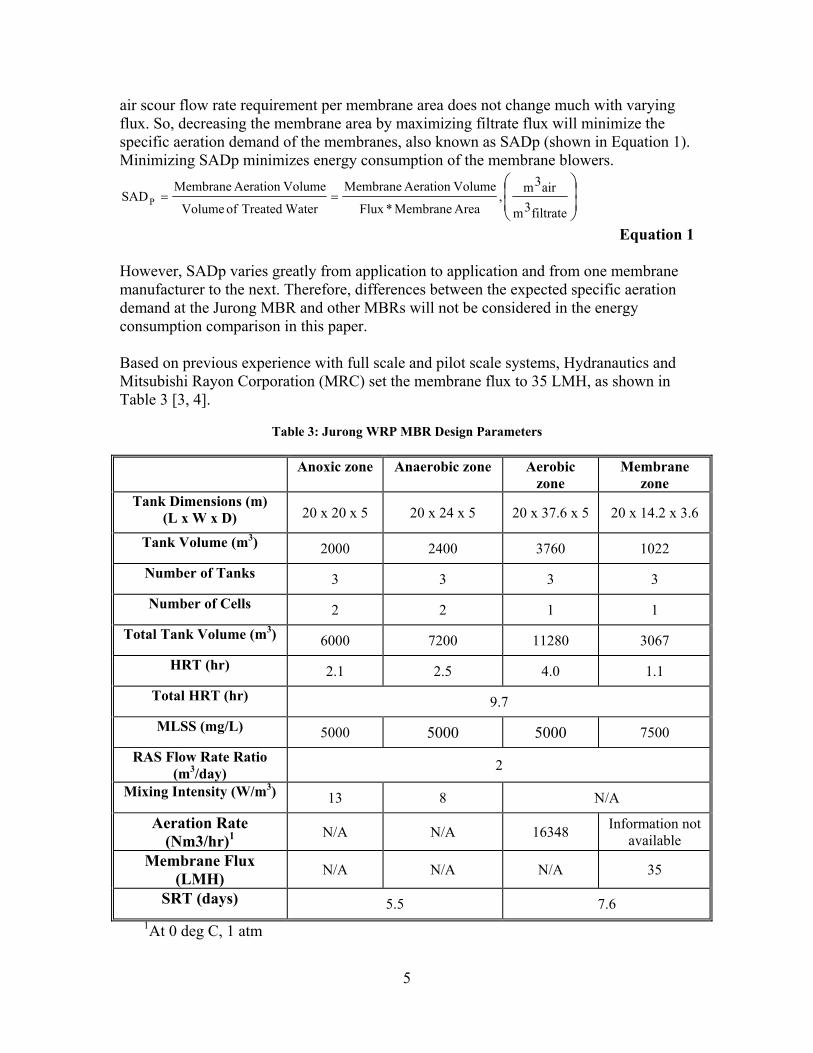
air scour flow rate requirement per membrane area does not change much with varying flux. So, decreasing the membrane area by maximizing filtrate flux will minimize the specific aeration demand of the membranes, also known as SADp (shown in Equation 1). Minimizing SADp minimizes energy consumption of the membrane blowers.
⎟⎟⎠
⎞⎜⎜⎝
⎛==
filtrate3m
air3m,
Area Membrane *Flux
VolumeAeration Membrane
WaterTreated of Volume
VolumeAeration MembraneSADP
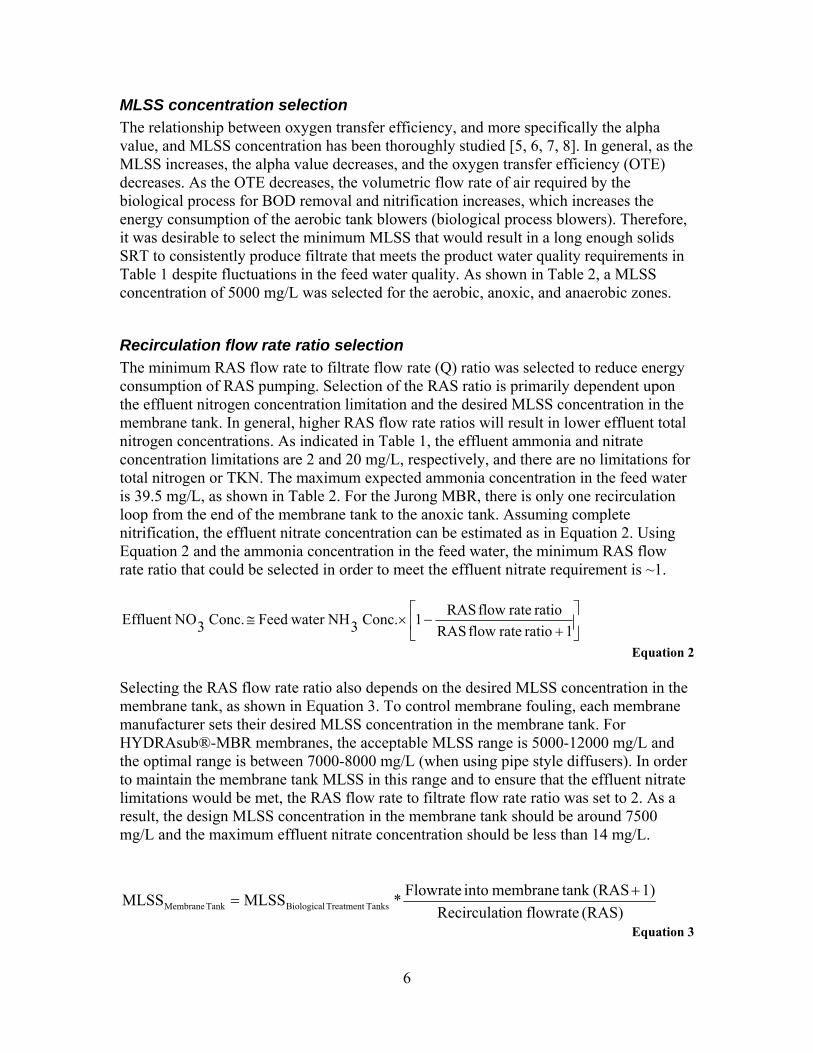
Equation 1 However, SADp varies greatly from application to application and from one membrane manufacturer to the next. Therefore, differences between the expected specific aeration demand at the Jurong MBR and other MBRs will not be considered in the energy consumption comparison in this paper. Based on previous experience with full scale and pilot scale systems, Hydranautics and Mitsubishi Rayon Corporation (MRC) set the membrane flux to 35 LMH, as shown in Table 3 [3, 4].
Table 3: Jurong WRP MBR Design Parameters
Anoxic zone Anaerobic zone Aerobic zone
Membrane zone
Tank Dimensions (m) (L x W x D) 20 x 20 x 5 20 x 24 x 5 20 x 37.6 x 5 20 x 14.2 x 3.6
Tank Volume (m3) 2000 2400 3760 1022 Number of Tanks 3 3 3 3
Number of Cells 2 2 1 1
Total Tank Volume (m3) 6000 7200 11280 3067
HRT (hr) 2.1 2.5 4.0 1.1
Total HRT (hr) 9.7
MLSS (mg/L) 5000 5000 5000 7500
RAS Flow Rate Ratio (m3/day) 2
Mixing Intensity (W/m3) 13 8 N/A
Aeration Rate (Nm3/hr)1
N/A N/A 16348 Information not available
Membrane Flux (LMH) N/A N/A N/A 35
SRT (days) 5.5 7.6 1At 0 deg C, 1 atm
6
MLSS concentration selection The relationship between oxygen transfer efficiency, and more specifically the alpha value, and MLSS concentration has been thoroughly studied [5, 6, 7, 8]. In general, as the MLSS increases, the alpha value decreases, and the oxygen transfer efficiency (OTE) decreases. As the OTE decreases, the volumetric flow rate of air required by the biological process for BOD removal and nitrification increases, which increases the energy consumption of the aerobic tank blowers (biological process blowers). Therefore, it was desirable to select the minimum MLSS that would result in a long enough solids SRT to consistently produce filtrate that meets the product water quality requirements in Table 1 despite fluctuations in the feed water quality. As shown in Table 2, a MLSS concentration of 5000 mg/L was selected for the aerobic, anoxic, and anaerobic zones.
Recirculation flow rate ratio selection The minimum RAS flow rate to filtrate flow rate (Q) ratio was selected to reduce energy consumption of RAS pumping. Selection of the RAS ratio is primarily dependent upon the effluent nitrogen concentration limitation and the desired MLSS concentration in the membrane tank. In general, higher RAS flow rate ratios will result in lower effluent total nitrogen concentrations. As indicated in Table 1, the effluent ammonia and nitrate concentration limitations are 2 and 20 mg/L, respectively, and there are no limitations for total nitrogen or TKN. The maximum expected ammonia concentration in the feed water is 39.5 mg/L, as shown in Table 2. For the Jurong MBR, there is only one recirculation loop from the end of the membrane tank to the anoxic tank. Assuming complete nitrification, the effluent nitrate concentration can be estimated as in Equation 2. Using Equation 2 and the ammonia concentration in the feed water, the minimum RAS flow rate ratio that could be selected in order to meet the effluent nitrate requirement is ~1.
⎥⎦
⎤⎢⎣
⎡+
−×≅1ratio rate flow RAS
ratio rate flow RAS1 Conc. 3NH water FeedConc. 3NOEffluent
Equation 2 Selecting the RAS flow rate ratio also depends on the desired MLSS concentration in the membrane tank, as shown in Equation 3. To control membrane fouling, each membrane manufacturer sets their desired MLSS concentration in the membrane tank. For HYDRAsub®-MBR membranes, the acceptable MLSS range is 5000-12000 mg/L and the optimal range is between 7000-8000 mg/L (when using pipe style diffusers). In order to maintain the membrane tank MLSS in this range and to ensure that the effluent nitrate limitations would be met, the RAS flow rate to filtrate flow rate ratio was set to 2. As a result, the design MLSS concentration in the membrane tank should be around 7500 mg/L and the maximum effluent nitrate concentration should be less than 14 mg/L.
(RAS) flowrateion Recirculat1) (RAS tank membrane into Flowrate*MLSS MLSS TanksTreatment BiologicalTank Membrane
+=
Equation 3
7
Proof pilot test Hydranautics and MRC, under a joint venture called Kathyd, in conjunction with Singapore PUB conducted a MBR-RO pilot study from June 2008 to May 2010. The main objective of the MBR portion of the pilot study was to establish sustainable operating parameters that would minimize energy consumption. The MBR pilot plant had a treatment capacity of 320 m3/d. Testing was divided into two main phases. During the second phase, from Aug 2009 to May 2010, the pilot plant was operated at Singapore PUB’s Ulu Pandan Water Reclamation Plant (UPWRP). This period of the test also worked to validate the proposed design parameters for Jurong WRP MBR project, such as high flux, lower MLSS concentration, and lower RAS flow rate ratio.
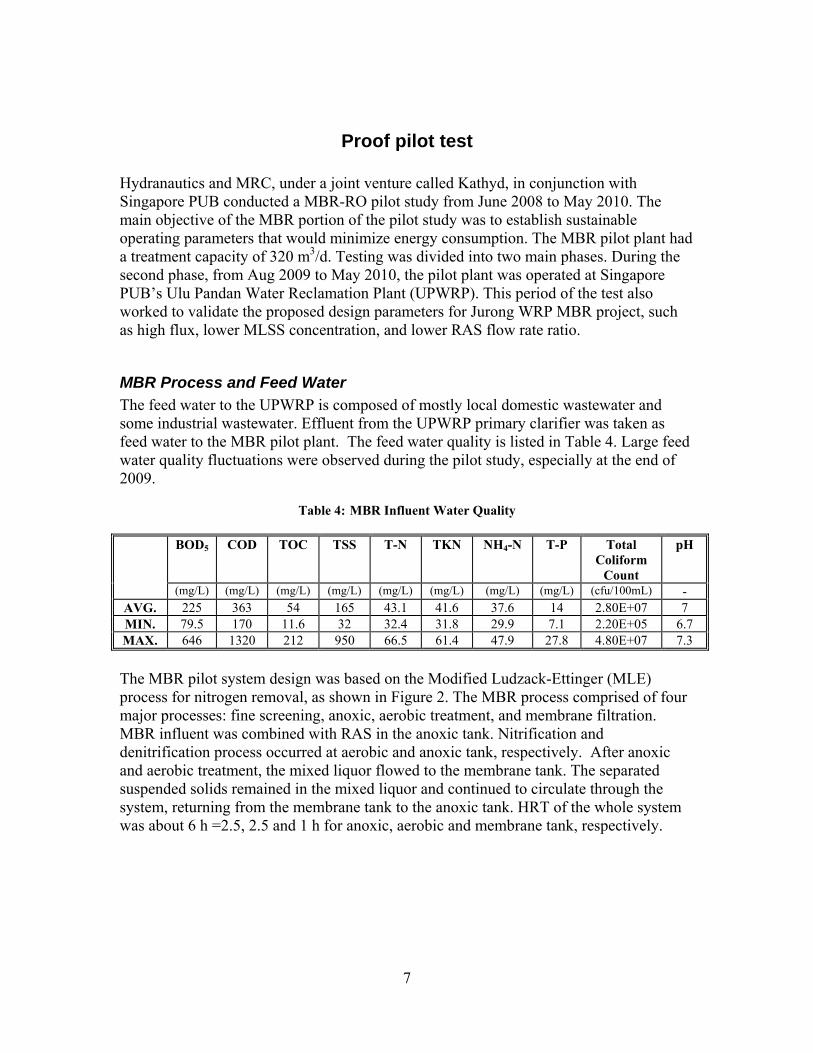
MBR Process and Feed Water The feed water to the UPWRP is composed of mostly local domestic wastewater and some industrial wastewater. Effluent from the UPWRP primary clarifier was taken as feed water to the MBR pilot plant. The feed water quality is listed in Table 4. Large feed water quality fluctuations were observed during the pilot study, especially at the end of 2009.
Table 4: MBR Influent Water Quality
BOD5 COD TOC TSS T-N TKN NH4-N T-P Total Coliform
Count
pH
(mg/L) (mg/L) (mg/L) (mg/L) (mg/L) (mg/L) (mg/L) (mg/L) (cfu/100mL) - AVG. 225 363 54 165 43.1 41.6 37.6 14 2.80E+07 7 MIN. 79.5 170 11.6 32 32.4 31.8 29.9 7.1 2.20E+05 6.7 MAX. 646 1320 212 950 66.5 61.4 47.9 27.8 4.80E+07 7.3
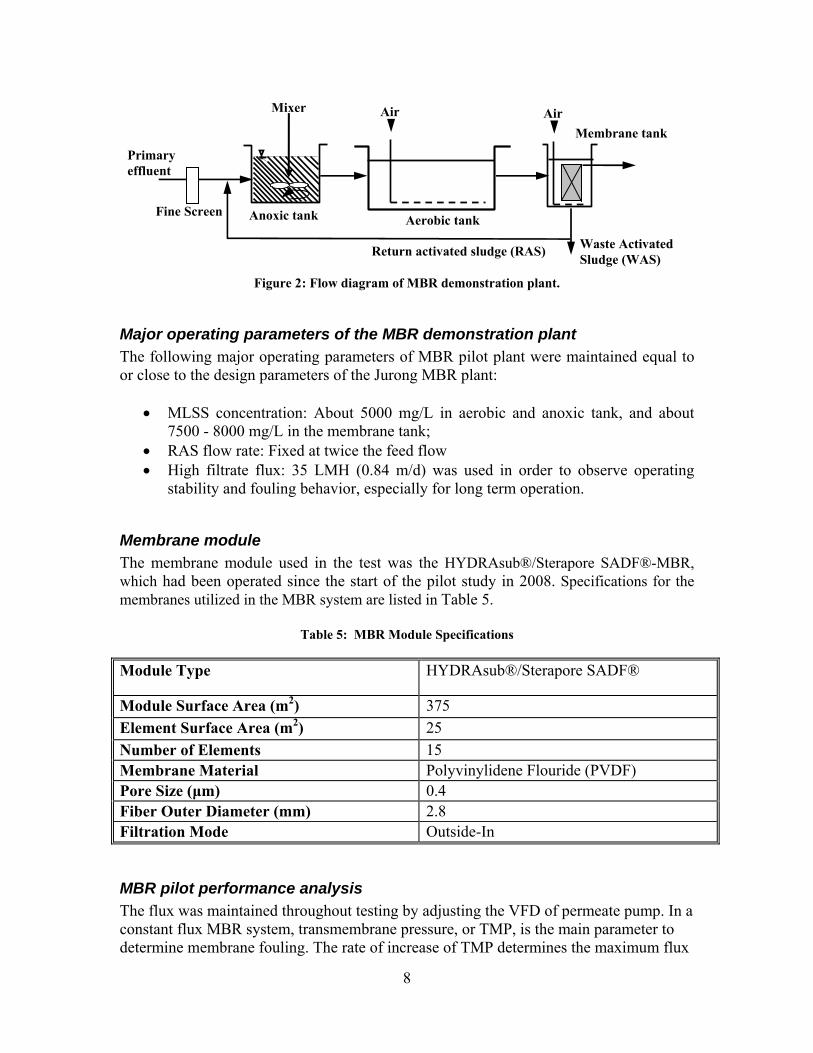
The MBR pilot system design was based on the Modified Ludzack-Ettinger (MLE) process for nitrogen removal, as shown in Figure 2. The MBR process comprised of four major processes: fine screening, anoxic, aerobic treatment, and membrane filtration. MBR influent was combined with RAS in the anoxic tank. Nitrification and denitrification process occurred at aerobic and anoxic tank, respectively. After anoxic and aerobic treatment, the mixed liquor flowed to the membrane tank. The separated suspended solids remained in the mixed liquor and continued to circulate through the system, returning from the membrane tank to the anoxic tank. HRT of the whole system was about 6 h =2.5, 2.5 and 1 h for anoxic, aerobic and membrane tank, respectively.
8
Figure 2 : Flow diagram of MBR demonstration plant.
Major operating parameters of the MBR demonstration plant The following major operating parameters of MBR pilot plant were maintained equal to or close to the design parameters of the Jurong MBR plant:
• MLSS concentration: About 5000 mg/L in aerobic and anoxic tank, and about 7500 - 8000 mg/L in the membrane tank;
• RAS flow rate: Fixed at twice the feed flow • High filtrate flux: 35 LMH (0.84 m/d) was used in order to observe operating
stability and fouling behavior, especially for long term operation.
Membrane module The membrane module used in the test was the HYDRAsub®/Sterapore SADF®-MBR, which had been operated since the start of the pilot study in 2008. Specifications for the membranes utilized in the MBR system are listed in Table 5.
Table 5: MBR Module Specifications
Module Type HYDRAsub®/Sterapore SADF®
Module Surface Area (m2) 375 Element Surface Area (m2) 25 Number of Elements 15 Membrane Material Polyvinylidene Flouride (PVDF) Pore Size (μm) 0.4 Fiber Outer Diameter (mm) 2.8 Filtration Mode Outside-In
MBR pilot performance analysis The flux was maintained throughout testing by adjusting the VFD of permeate pump. In a constant flux MBR system, transmembrane pressure, or TMP, is the main parameter to determine membrane fouling. The rate of increase of TMP determines the maximum flux
Air
Primary effluent
Anoxic tank Aerobic tank
Mixer
Return activated sludge (RAS) Waste Activated Sludge (WAS)
Air Membrane tank
Fine Screen
9
that the membranes can sustain. For most municipal MBRs, the flux should be set such that the membranes can be operated within the manufacturer’s acceptable TMP range for at least one month before requiring chemical clean in place (CIP). TMP can be calculated by subtracting the pressure on the filtrate side of the membrane from the pressure on the feed side of the membrane (with a correction for the elevation difference between the pressure gauge and the average membrane tank water level). Membrane performance can also be characterized by the turbidity and total suspended solids (TSS) of filtrate. Filtrate turbidity and TSS are also used to verify that membrane integrity is maintained. Filtrate turbidity was measured by using Hach FilterTrak660 Laser Turbidimeter.
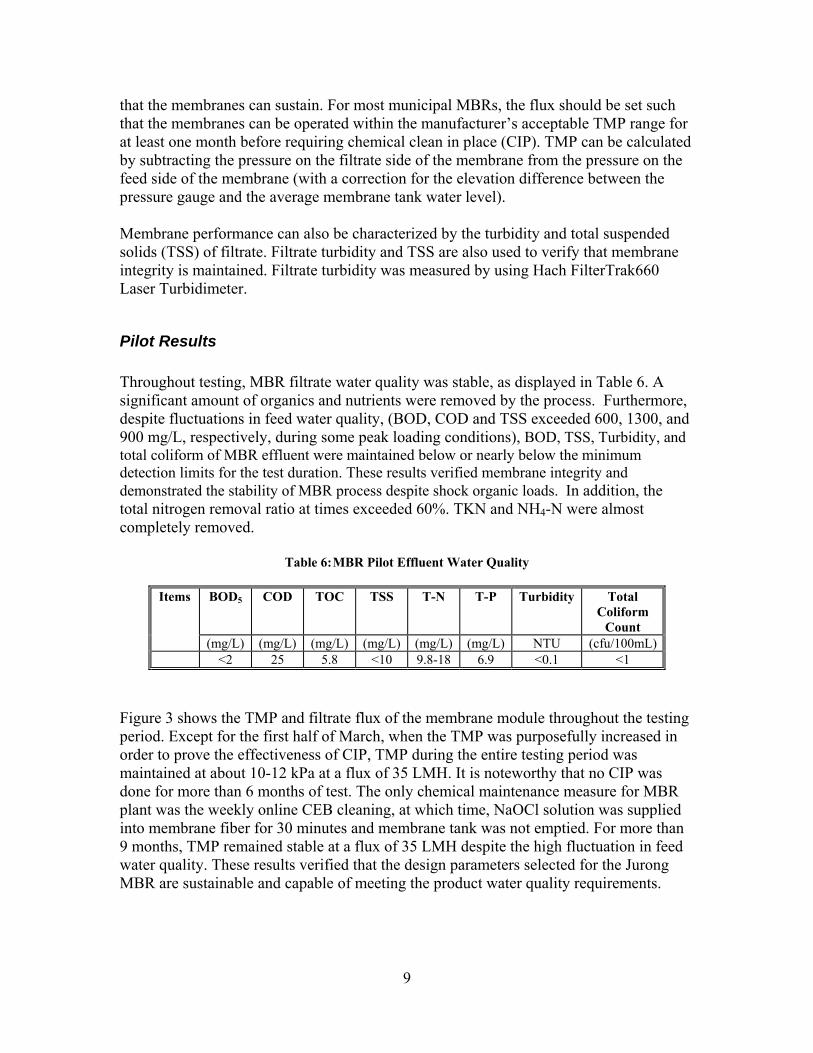
Pilot Results Throughout testing, MBR filtrate water quality was stable, as displayed in Table 6. A significant amount of organics and nutrients were removed by the process. Furthermore, despite fluctuations in feed water quality, (BOD, COD and TSS exceeded 600, 1300, and 900 mg/L, respectively, during some peak loading conditions), BOD, TSS, Turbidity, and total coliform of MBR effluent were maintained below or nearly below the minimum detection limits for the test duration. These results verified membrane integrity and demonstrated the stability of MBR process despite shock organic loads. In addition, the total nitrogen removal ratio at times exceeded 60%. TKN and NH4-N were almost completely removed.
Table 6: MBR Pilot Effluent Water Quality
Items BOD5 COD TOC TSS T-N T-P Turbidity Total Coliform
Count (mg/L) (mg/L) (mg/L) (mg/L) (mg/L) (mg/L) NTU (cfu/100mL)
<2 25 5.8 <10 9.8-18 6.9 <0.1 <1
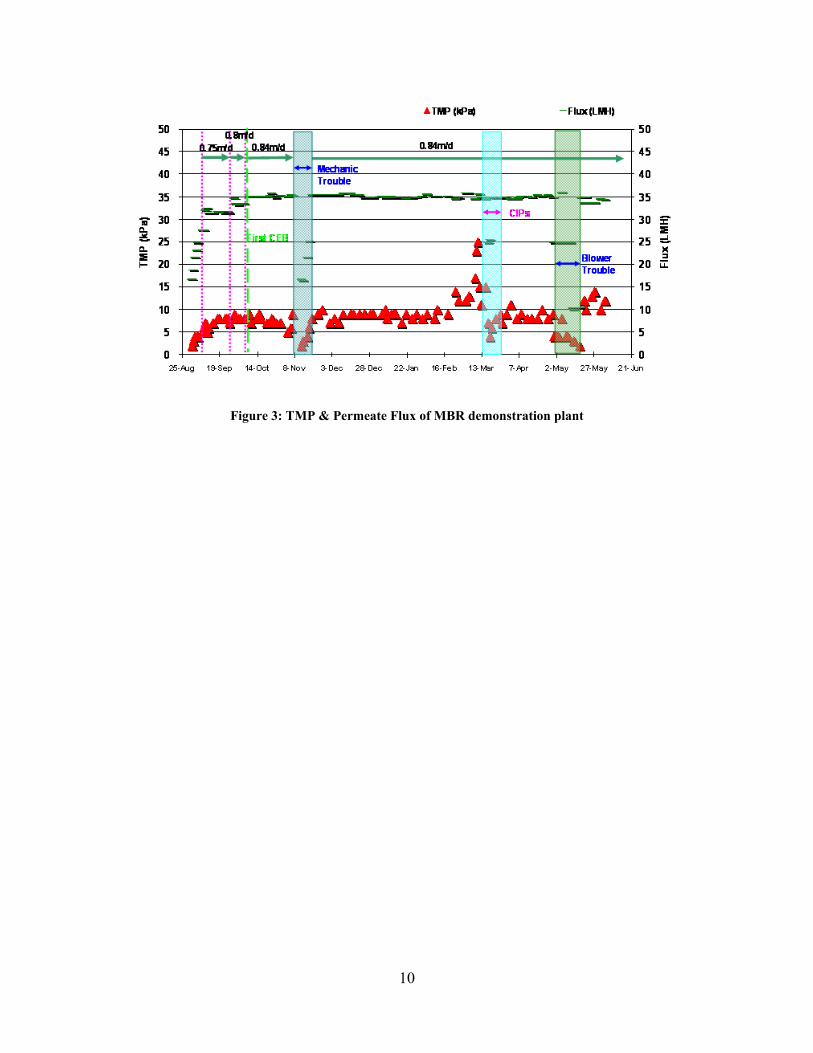
Figure 3 shows the TMP and filtrate flux of the membrane module throughout the testing period. Except for the first half of March, when the TMP was purposefully increased in order to prove the effectiveness of CIP, TMP during the entire testing period was maintained at about 10-12 kPa at a flux of 35 LMH. It is noteworthy that no CIP was done for more than 6 months of test. The only chemical maintenance measure for MBR plant was the weekly online CEB cleaning, at which time, NaOCl solution was supplied into membrane fiber for 30 minutes and membrane tank was not emptied. For more than 9 months, TMP remained stable at a flux of 35 LMH despite the high fluctuation in feed water quality. These results verified that the design parameters selected for the Jurong MBR are sustainable and capable of meeting the product water quality requirements.
10
Figure 3: TMP & Permeate Flux of MBR demonstration plant
11
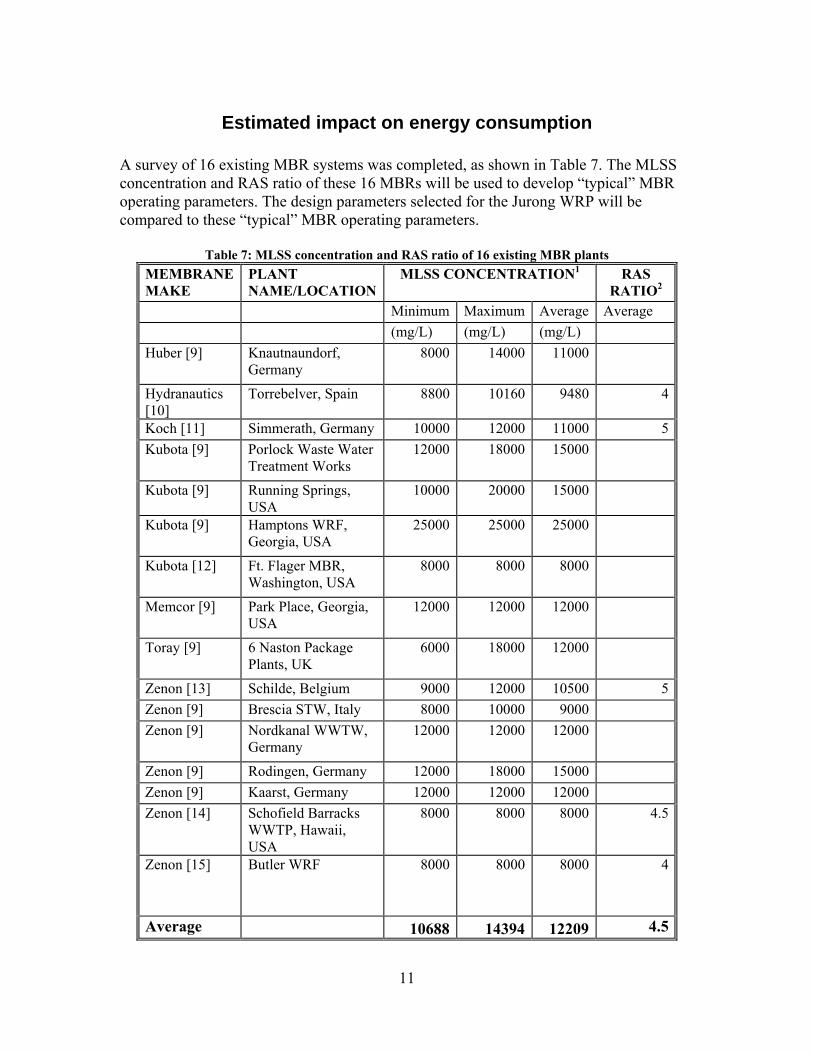
Estimated impact on energy consumption A survey of 16 existing MBR systems was completed, as shown in Table 7. The MLSS concentration and RAS ratio of these 16 MBRs will be used to develop “typical” MBR operating parameters. The design parameters selected for the Jurong WRP will be compared to these “typical” MBR operating parameters.
Table 7: MLSS concentration and RAS ratio of 16 existing MBR plants MEMBRANE MAKE
PLANT NAME/LOCATION
MLSS CONCENTRATION1 RAS RATIO2
Minimum Maximum Average Average (mg/L) (mg/L) (mg/L) Huber [9] Knautnaundorf,
Germany 8000 14000 11000
Hydranautics [10]
Torrebelver, Spain 8800 10160 9480 4
Koch [11] Simmerath, Germany 10000 12000 11000 5Kubota [9] Porlock Waste Water
Treatment Works 12000 18000 15000
Kubota [9] Running Springs, USA
10000 20000 15000
Kubota [9] Hamptons WRF, Georgia, USA
25000 25000 25000
Kubota [12] Ft. Flager MBR, Washington, USA
8000 8000 8000
Memcor [9] Park Place, Georgia, USA
12000 12000 12000
Toray [9] 6 Naston Package Plants, UK
6000 18000 12000
Zenon [13] Schilde, Belgium 9000 12000 10500 5Zenon [9] Brescia STW, Italy 8000 10000 9000 Zenon [9] Nordkanal WWTW,
Germany 12000 12000 12000
Zenon [9] Rodingen, Germany 12000 18000 15000 Zenon [9] Kaarst, Germany 12000 12000 12000 Zenon [14] Schofield Barracks
WWTP, Hawaii, USA
8000 8000 8000 4.5
Zenon [15] Butler WRF 8000 8000 8000 4
Average 10688 14394 12209 4.5
12
1In most case studies surveyed, location of the MLSS concentration given was not specified. 2Return activated sludge flow rate from membrane tank to feed flow rate ratio given. Other internal recirculation loops not considered.
Impact of MLSS concentration selection on energy consumption
Establishing the “Typical” MLSS concentration for existing MBRs In most case studies surveyed, the location of the MLSS concentration given was not specified. Therefore, I have assumed that the minimum MLSS concentration given is close to the MLSS concentration in the aerobic tank. With this assumption, the average “aerobic tank” MLSS concentration of the plants surveyed was ~10700 mg/L. The minimum “aerobic tank” MLSS was 6000 mg/L for the six Naston package plants in the United Kingdom. In an effort to not overestimate the expected energy savings for the Jurong MBR, a conservative aerobic tank MLSS concentration of 8000 mg/L will be considered for comparison to the Jurong MBR aerobic tank MLSS concentration of 5000 mg/L.
Alpha Value As previously stated, numerous studies have been performed to determine the relationship between alpha and MLSS concentration in MBRs [5, 6, 7, and 8]. The purpose of this paper is not to determine which of these relationships is most accurate. For this comparison, α will be calculated by relationship put forth by Verrect et al. (2008); 0.66 at MLSS = 5000 mg/L and 0.51 at MLSS = 8000 mg/L, which correlates well the value put forth in the study by Recault et al. (2010). Variations in alpha value along the length of the aerobic tank have not been considered in this comparison.
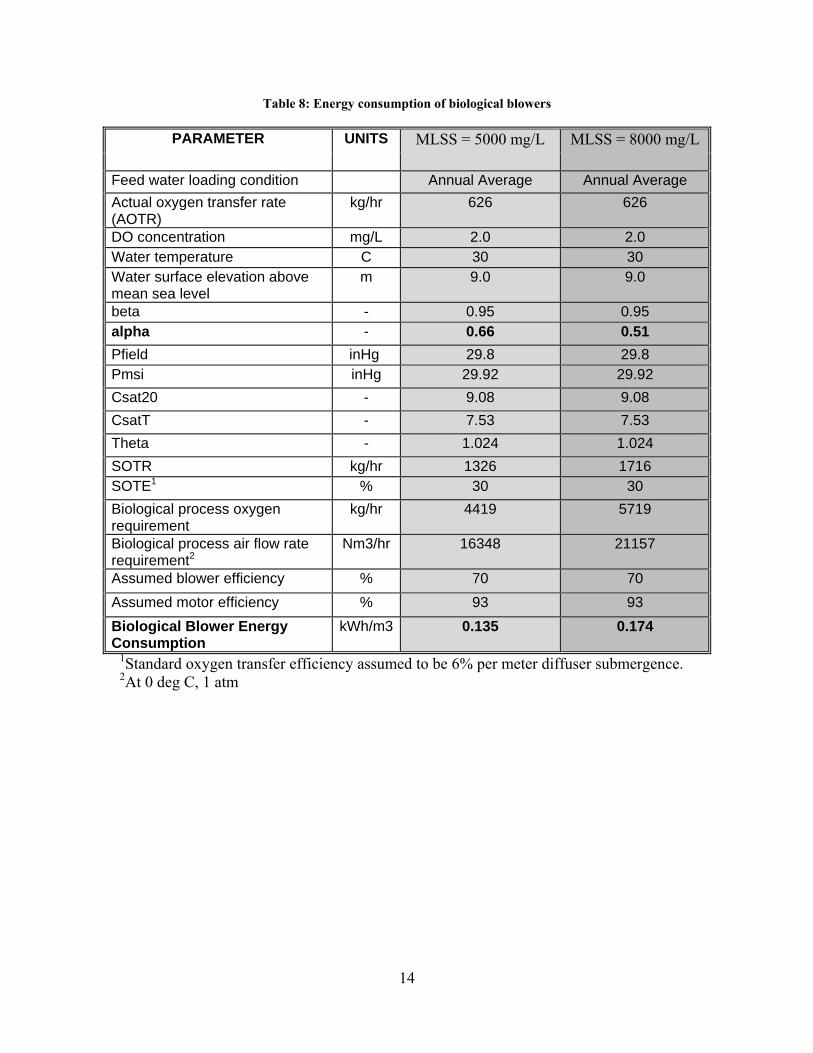
Energy consumption of biological blowers Only the energy consumed by the biological blowers at the average annual loading rate will be considered for this analysis. As shown in
13
Table 8, the expected energy requirement of the biological process blowers is 0.135 kWh/m3 filtrate if the aerobic tank MLSS concentration is 5000 mg/L and 0.174 kWh/m3 filtrate if the aerobic tank MLSS concentration is 8000 mg/L. The calculation used to convert from actual oxygen requirement to standard oxygen requirement is shown Equation 4. Blower energy consumption was calculated according to Equation 5.
14
Table 8: Energy consumption of biological blowers
PARAMETER UNITS MLSS = 5000 mg/L MLSS = 8000 mg/L
Feed water loading condition Annual Average Annual Average Actual oxygen transfer rate (AOTR)
kg/hr 626 626
DO concentration mg/L 2.0 2.0 Water temperature C 30 30 Water surface elevation above mean sea level
m 9.0 9.0
beta - 0.95 0.95 alpha - 0.66 0.51 Pfield inHg 29.8 29.8 Pmsi inHg 29.92 29.92 Csat20 - 9.08 9.08 CsatT - 7.53 7.53 Theta - 1.024 1.024 SOTR kg/hr 1326 1716 SOTE1 % 30 30 Biological process oxygen requirement
kg/hr 4419 5719
Biological process air flow rate requirement2
Nm3/hr 16348 21157
Assumed blower efficiency % 70 70 Assumed motor efficiency % 93 93 Biological Blower Energy Consumption
kWh/m3 0.135 0.174
1Standard oxygen transfer efficiency assumed to be 6% per meter diffuser submergence. 2At 0 deg C, 1 atm
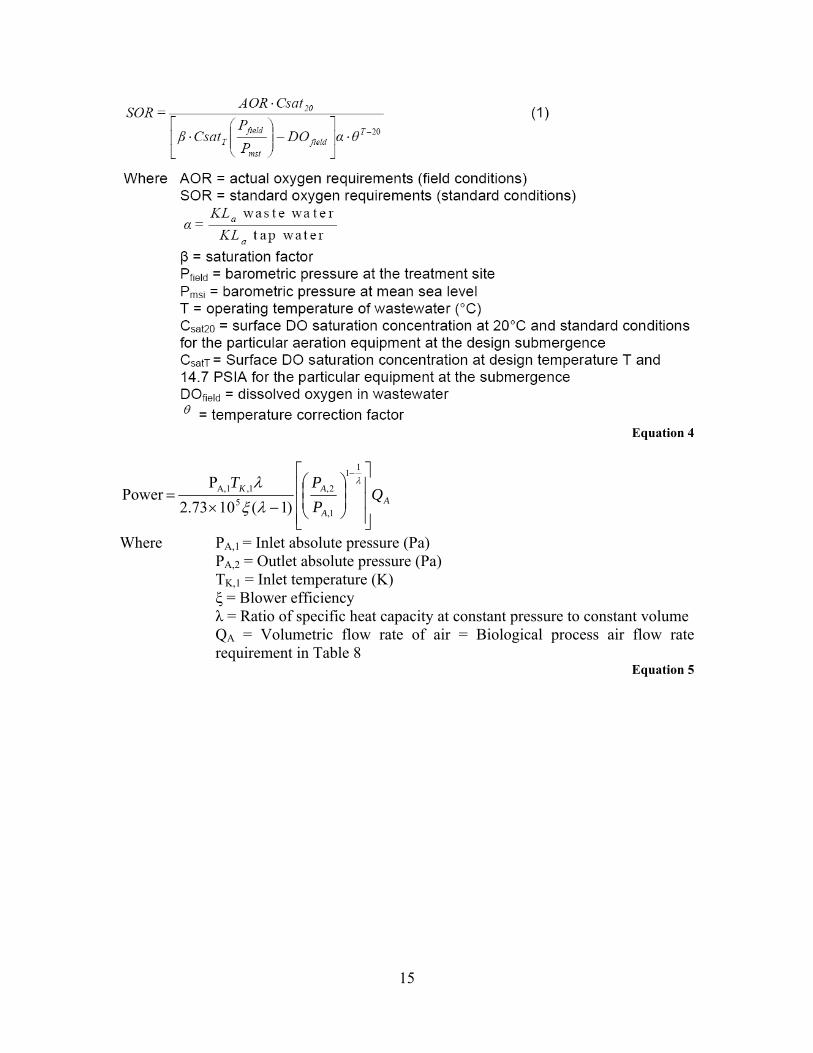
15
Equation 4
AA
AK QPPT
⎥⎥⎥
⎦
⎤
⎢⎢⎢
⎣
⎡
⎟⎟⎠
⎞⎜⎜⎝
⎛
−×=
−λ
λξλ
11
1,
2,5
1,A,1
)1(1073.2P
Power
Where PA,1 = Inlet absolute pressure (Pa) PA,2 = Outlet absolute pressure (Pa) TK,1 = Inlet temperature (K) ξ = Blower efficiency
λ = Ratio of specific heat capacity at constant pressure to constant volume QA = Volumetric flow rate of air = Biological process air flow rate requirement in Table 8
Equation 5
16
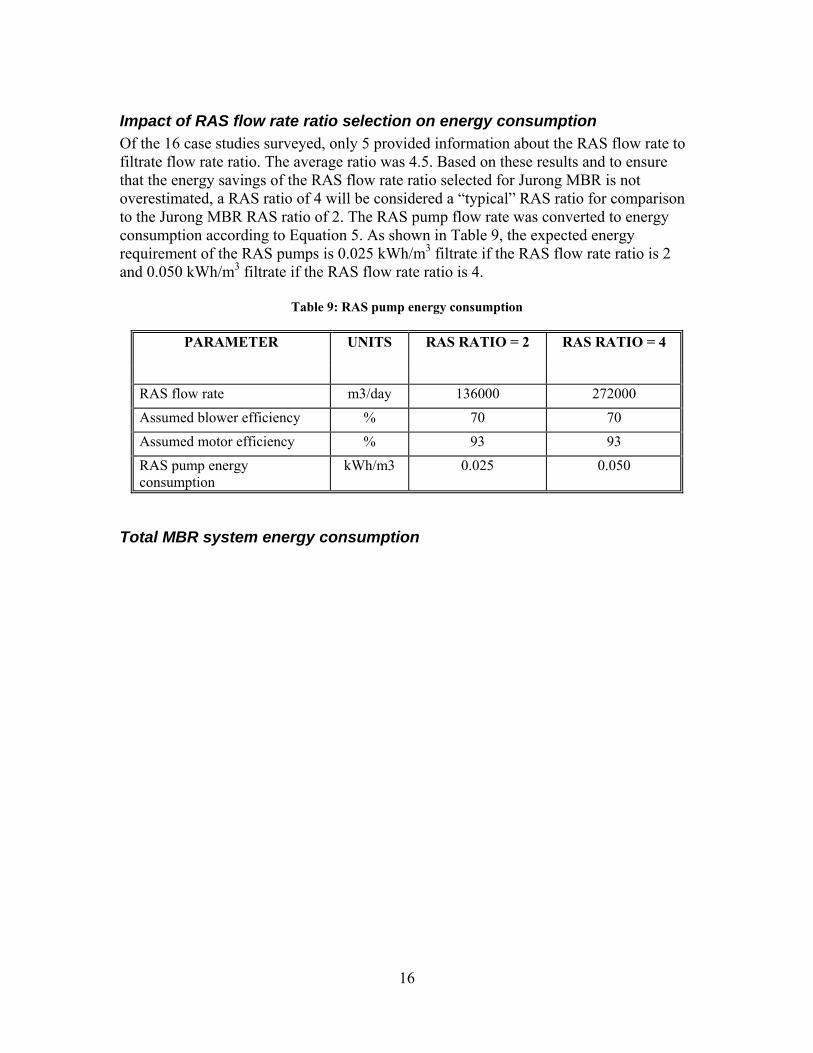
Impact of RAS flow rate ratio selection on energy consumption Of the 16 case studies surveyed, only 5 provided information about the RAS flow rate to filtrate flow rate ratio. The average ratio was 4.5. Based on these results and to ensure that the energy savings of the RAS flow rate ratio selected for Jurong MBR is not overestimated, a RAS ratio of 4 will be considered a “typical” RAS ratio for comparison to the Jurong MBR RAS ratio of 2. The RAS pump flow rate was converted to energy consumption according to Equation 5. As shown in Table 9, the expected energy requirement of the RAS pumps is 0.025 kWh/m3 filtrate if the RAS flow rate ratio is 2 and 0.050 kWh/m3 filtrate if the RAS flow rate ratio is 4.
Table 9: RAS pump energy consumption
PARAMETER UNITS RAS RATIO = 2 RAS RATIO = 4
RAS flow rate m3/day 136000 272000 Assumed blower efficiency % 70 70 Assumed motor efficiency % 93 93 RAS pump energy consumption
kWh/m3 0.025 0.050
Total MBR system energy consumption
17
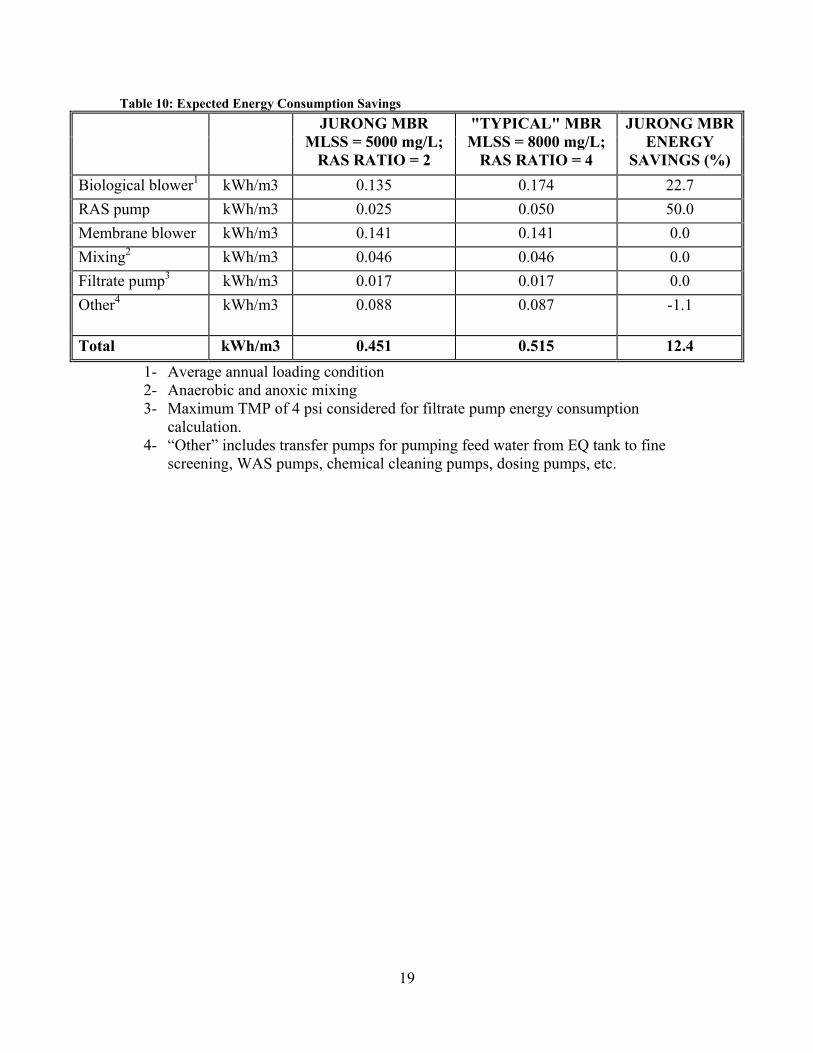
Table 10 shows the expected energy consumption of the major equipment related to the MBR, as well as the expected impact of the selected Jurong MBR design parameters on total system energy consumption. Energy consumption of equipment, such as filtrate pumps, mixers, chemical cleaning pumps, etc., was assumed to be the same for both MLSS concentrations and RAS ratios. Energy consumption of the waste activated sludge (WAS) pumps will be higher for the Jurong MBR as compared to “typical” MBRs due to increased sludge waste volume. However, the difference is almost negligible when compared to the total energy consumption. Regular backwashing is not a part of the HYDRAsub®/SteraporeSADF®-MBR operating process. So, backwash pumps were not considered in this analysis. Membrane tank drain down is not a part of the HYDRAsub®/SteraporeSADF®-MBR chemical cleaning process. So, drain pumps were not considered in this analysis. As indicated in
18
Table 10, the expected average annual total system energy consumption at the Jurong MBR is 0.451 kWh/ m3 filtrate produced. If the Jurong MBR was design with “typical” MBR design parameters, then the total energy consumption is estimated to be 0.515 kWh/ m3 filtrate produced. This amounts to an energy savings of 0.064 kWh/ m3 filtrate produced or ~12.4%.
19
Table 10: Expected Energy Consumption Savings JURONG MBR
MLSS = 5000 mg/L; RAS RATIO = 2
"TYPICAL" MBR MLSS = 8000 mg/L;
RAS RATIO = 4
JURONG MBR ENERGY
SAVINGS (%) Biological blower1 kWh/m3 0.135 0.174 22.7 RAS pump kWh/m3 0.025 0.050 50.0 Membrane blower kWh/m3 0.141 0.141 0.0 Mixing2 kWh/m3 0.046 0.046 0.0 Filtrate pump3 kWh/m3 0.017 0.017 0.0 Other4 kWh/m3 0.088 0.087 -1.1
Total kWh/m3 0.451 0.515 12.4 1- Average annual loading condition 2- Anaerobic and anoxic mixing 3- Maximum TMP of 4 psi considered for filtrate pump energy consumption
calculation. 4- “Other” includes transfer pumps for pumping feed water from EQ tank to fine
screening, WAS pumps, chemical cleaning pumps, dosing pumps, etc.
20
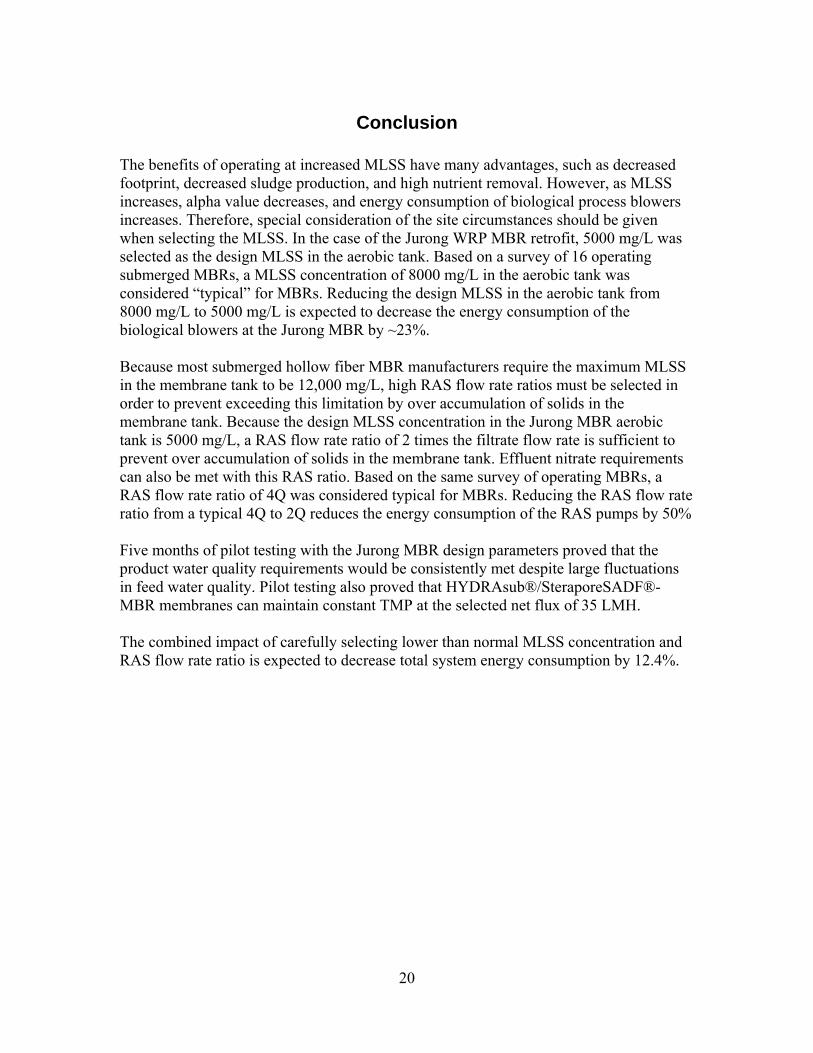
Conclusion The benefits of operating at increased MLSS have many advantages, such as decreased footprint, decreased sludge production, and high nutrient removal. However, as MLSS increases, alpha value decreases, and energy consumption of biological process blowers increases. Therefore, special consideration of the site circumstances should be given when selecting the MLSS. In the case of the Jurong WRP MBR retrofit, 5000 mg/L was selected as the design MLSS in the aerobic tank. Based on a survey of 16 operating submerged MBRs, a MLSS concentration of 8000 mg/L in the aerobic tank was considered “typical” for MBRs. Reducing the design MLSS in the aerobic tank from 8000 mg/L to 5000 mg/L is expected to decrease the energy consumption of the biological blowers at the Jurong MBR by ~23%. Because most submerged hollow fiber MBR manufacturers require the maximum MLSS in the membrane tank to be 12,000 mg/L, high RAS flow rate ratios must be selected in order to prevent exceeding this limitation by over accumulation of solids in the membrane tank. Because the design MLSS concentration in the Jurong MBR aerobic tank is 5000 mg/L, a RAS flow rate ratio of 2 times the filtrate flow rate is sufficient to prevent over accumulation of solids in the membrane tank. Effluent nitrate requirements can also be met with this RAS ratio. Based on the same survey of operating MBRs, a RAS flow rate ratio of 4Q was considered typical for MBRs. Reducing the RAS flow rate ratio from a typical 4Q to 2Q reduces the energy consumption of the RAS pumps by 50% Five months of pilot testing with the Jurong MBR design parameters proved that the product water quality requirements would be consistently met despite large fluctuations in feed water quality. Pilot testing also proved that HYDRAsub®/SteraporeSADF®-MBR membranes can maintain constant TMP at the selected net flux of 35 LMH. The combined impact of carefully selecting lower than normal MLSS concentration and RAS flow rate ratio is expected to decrease total system energy consumption by 12.4%.
21
References [1] Public Utilities Board of Singapore 2008, Internet: www.pub.gov.sg/newater. [2] Scott Levasque et. al 2010, Singapore’s Jurong WRP Membrane Bioreactor Facility
Industrial and Retrofit Challenges, WEFTEC Conference Proceedings 2010. [3] Itonaga et al. 2009, Demonstration Studies in Singapore of Membrane Bioreactor (MBR) For Wastewater Reclamation, IDA Conference Proceedings 2009. [4] Freeman et al. 2010, Operation of a Submerged Hollow Fiber Membrane Bioreactor for Wastewater Treatment on Meeting Reclamation Criteria, MBR Asia Conference Proceedings 2010. [5] Y. Racault et al. 2010, Effect of mixed liquor suspended solids on the oxygen transfer rate in full scale membrane bioreactors, WEFTEC Conference Proceedings 2010. [6] J. Kaumpe and K. Krauth 2003, Oxygen transfer into activated sludge with high MLSS concentrations, Water Science Technology 47, 297-303. [7] Cornel et al. 2003, Investigation of oxygen transfer rates in full scale membrane bioreactors. [8] Verrect et al. 2008, An energy model for immersed membrane bioreactors, Water Research, Volume 42, Issue 19, December 2008, 4761-4770. [9] Judd et al 2006, The MBR Book. [10] Vartolomei et al. 2009, Upgrade of a WWTP from conventional to MBR treatment Torrebellver WWTP extension, IDA Conference Proceedings 2009. [11] Koch Puron® MBR demonstration plant at Simmerath, Internet: http://www.kochmembrane.com/pdf/kms_puron_simmerath_en.pdf. [12] Ward et al. 2010, Successful Procurement, Design, Construction, and Operation of Five Washington State Parks MBR Facilities, WEFTEC Conference Proceedings 2010. [13] A. Fenu et al., 2010, Energy audit of a full scale MBR system, Desalination Vol. 262 (2010) 121-128. [14] J. Diamond 2007, MBR Startup: Schofield Barracks WWTP, Hawaii Water Environment Association Conference Proceedings 2007. [15] S. Kreuzwiesner et al. 2010, Large MBR Produces Low TN Reuse Water, WEFTEC Conference Proceedings 2010.