Retrofit for Blast-Resistant RC Slabs with Composite … papers/RetrofitforBlast...1345 SP-230—76...
16
1345 SP-230—76 Retrofit for Blast-Resistant RC Slabs with Composite Materials by B. Lu, P. Silva, A. Nanni, and J. Baird Synopsis: Synopsis: Synopsis: Synopsis: Synopsis: This research program was initiated to examine the feasibility of assessing the blast-resistant capacity of reinforced concrete (RC) slabs using the displacement based design (DBD) method. In order to achieve this objective, five RC slabs were tested under real blast loads in the out-of-plane direction. One of the slabs was used as the control unit to establish a baseline for comparison in terms of performance for the other four slabs, which were strengthened with fiber reinforced polymer (FRP) and steel fiber reinforced polymer (SRP). The explosive charge weight and stand-off distance required to impose a given damage level were predicted by the DBD method. Test results showed that the blast loads were effectively estimated and the damage levels observed from the field tests correlated well with the predicted levels. In addition, test results corroborated that the blast-resistant capacity of RC slabs can be effectively increased by strengthening using FRP composites. The main conclusion that can be drawn from these tests using improvised explosive devices (IDE) is that RC slabs retrofitted on both sides have a higher blast resistance capacity than those slabs retrofitted only on one side. This paper discusses these experimental results along with the analysis steps used to predict the blast charge and standoff distance to impose a given damage level. Keywords: blast-resistant; displacement-based method; ductility; fiber reinforced polymers; steel-reinforced polymers
-
Upload
phungquynh -
Category
Documents
-
view
219 -
download
2
Transcript of Retrofit for Blast-Resistant RC Slabs with Composite … papers/RetrofitforBlast...1345 SP-230—76...

1345
SP-230—76
Retrofit for Blast-Resistant RC Slabswith Composite Materials
by B. Lu, P. Silva, A. Nanni, and J. Baird
Synopsis:Synopsis:Synopsis:Synopsis:Synopsis: This research program was initiated to examine the feasibility of assessingthe blast-resistant capacity of reinforced concrete (RC) slabs using the displacementbased design (DBD) method. In order to achieve this objective, five RC slabs weretested under real blast loads in the out-of-plane direction. One of the slabs was usedas the control unit to establish a baseline for comparison in terms of performance forthe other four slabs, which were strengthened with fiber reinforced polymer (FRP) andsteel fiber reinforced polymer (SRP). The explosive charge weight and stand-offdistance required to impose a given damage level were predicted by the DBD method.Test results showed that the blast loads were effectively estimated and the damagelevels observed from the field tests correlated well with the predicted levels. Inaddition, test results corroborated that the blast-resistant capacity of RC slabs can beeffectively increased by strengthening using FRP composites. The main conclusion thatcan be drawn from these tests using improvised explosive devices (IDE) is that RC slabsretrofitted on both sides have a higher blast resistance capacity than those slabsretrofitted only on one side. This paper discusses these experimental results alongwith the analysis steps used to predict the blast charge and standoff distance toimpose a given damage level.
Keywords: blast-resistant; displacement-based method; ductility;fiber reinforced polymers; steel-reinforced polymers

1346 Lu et al.Binggeng Lu is a graduate student at the Center for Infrastructure Engineering Studies
(CIES) at the University of Missouri–Rolla (UMR). His research interests include the
performance and evaluation of structures subjected to seismic and blast loads.
Pedro Franco Silva is an assistant professor of Civil Engineering in CIES at UMR. He
received his PhD from the University of California-San Diego, Calif. His research
interests include earthquake engineering and the seismic performance evaluation of
bridge structures.
Antonio Nanni, FACI, is the V&M Jones Professor of Civil Engineering and Director of
CIES at UMR. He is chair and member of ACI437, Strength Evaluation of Existing
Concrete Structures; 440, Fiber Reinforced Polymer; Reinforcement; 544, Fiber
Reinforced Concrete; 549, and Joint ACI-ASCE-TMS Committee. His research interests
include performance of concrete-based structures.
Jason Baird, is a research assistant professor in the Department of Mining Engineering
at UMR and the president of Loki, Inc. His research interests include blast optimization
and design of blast-resistant structures.
INTRODUCTION
Recent events have drawn considerable attention to the vulnerability and
sustainability of structural members subjected to improvised explosive devices (IED).
Since protection is never an absolute concept and there is a level of high costs associated
with a given damage level of protection, proper assessment tools must be employed to
determine within a reasonable degree of accuracy the level of vulnerability of existing
and new structures. Furthermore, in blast design, one must also determine an acceptable
level of damage that a structure can tolerate. Explosive effects can impact a level of
damage that can range from minor damage to completely structural failure and
considerable loss of life (FEMA, 2003). This research program has shown promising
results in using the DBD method to predict blast loads in terms of standoff distance and
charge weight.
In this program, the performance of concrete slabs strengthened with carbon fiber
reinforced polymers (CFRP) and a new class of composites composed of knitted high
strength steel cords designated as steel reinforced polymers (SRP) (Wobbe et al., 2004)
were investigated under real blast loads. Different retrofit schemes consisting of these
CFRP and SRP strengthening schemes applied on one side and both sides of the tested
slabs were investigated and results are discussed in this paper. In total five slabs with
different strengthening schemes and materials were tested under real blast loads.

FRPRCS-7 1347EXPERIMENTAL PROGRAM
Test Specimens
As shown in Figure 1, a series of square RC slabs with nominal dimensions of 1200
x 1200 x 90mm were chosen for the experimental and analytical investigation. Different
materials and upgrade schemes were investigated against out-of-plane blast loads. Five
RC slabs were built and strengthened with different schemes and different materials such
as CFRP or SRP. With the exception of the control slab (1), two slabs (2A and 2B) were
strengthened with CFRP laminates, and the other two (3A and 3B), were strengthened
with SRP laminates. The strengthening schemes are also shown in Figure 1and Table 1.
Slabs 2A and 3A were strengthened on the bottom side only, whereas, slabs 2B and 3B
were strengthened on both sides to evaluate the influence of negative moments developed
under the dynamic response or negative overpressure.
The experimental specimens were tested at the experimental mine at the University
of Missouri-Rolla. As shown in Figure 2a, it can be seen that the distance from the test
specimen to the mine walls and ceiling are far enough apart that open air design methods
are applicable within a reasonable degree of accuracy. As shown in Figure 2b, the test
specimens were simply supported on steel box beams. The charge was suspended above
the test specimens to the specific standoff distance by a wire, which was also used as the
circuit to detonate the charge. Each charge was composed of desensitized RDX high
explosive.
Material Properties and Moment-Curvature Relationships
The material properties are as follows. All the five specimens were poured with
28MPa concrete and reinforced with steel bars with a 0.18% reinforcement ratio in each
direction. The steel grade was 410MPa with an elastic modulus of 200GPa. The CFRP
and SRP laminates demonstrated an elastic behavior up to their ultimate tensile strengths,
which were 3794MPa and 3199MPa, and the elastic moduli were 228GPa and 206GPa,
respectively. The summary of all material properties are shown in Table 2.
The strengthening area of the CFRP laminates and the SRP laminates were 200mm2
and 220mm2
, respectively. In all cases the width of laminates was 1200mm. Since the
experimental mine at UMR is limited to charge weights not to exceed 2-3 kg, the
reinforcement ratio was limited to levels that would permit testing under these charge
limitations. As such, the reinforcement ratio provided was limited to 0.18%, which
corresponds to the secondary reinforcement considerations.
Under the action of blast loads the effect of high strain rates was considered by
applying a dynamic increase factor of 1.20 for the reinforcement bars and 1.25 for the
concrete material properties (Mays and Smith, 1995). Based on the material properties,
the equivalent moment-curvature relationships for the five slabs were calculated and are
presented in Figure 3. Under the given reinforcement ratio, the yielding moment of the
control slab was computed at 7.2kN-m and the cracking moment was 6.5kN-m. The
moment-curvature relationships of slabs 2A and 2B are identical to each other because
the CFRP laminates placed on the compressive face were ignored in the analysis. For the
1348 Lu et al.same reason, the moment-curvature relationships for slabs 3A and 3B are also identical to
each other.
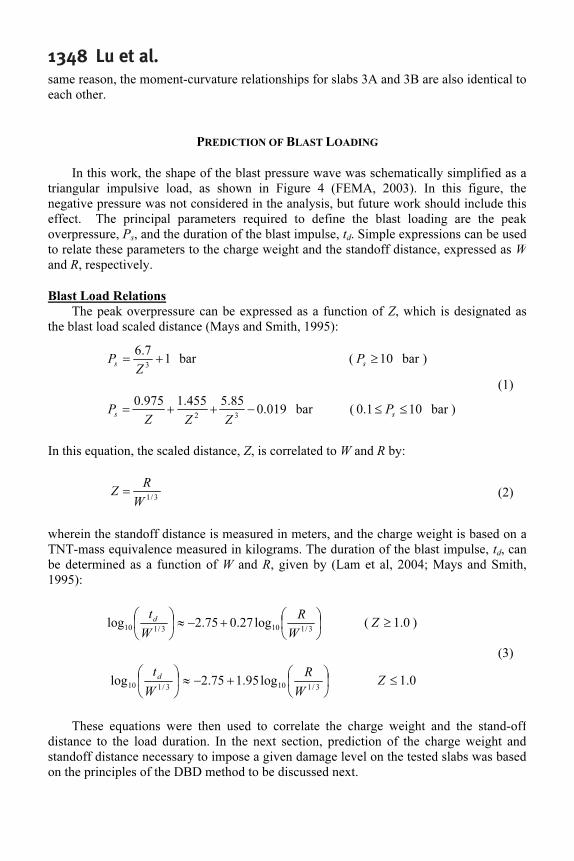
PREDICTION OF BLAST LOADING
In this work, the shape of the blast pressure wave was schematically simplified as a
triangular impulsive load, as shown in Figure 4 (FEMA, 2003). In this figure, the
negative pressure was not considered in the analysis, but future work should include this
effect. The principal parameters required to define the blast loading are the peak
overpressure, Ps, and the duration of the blast impulse, t
d. Simple expressions can be used
to relate these parameters to the charge weight and the standoff distance, expressed as W
and R, respectively.
Blast Load Relations
The peak overpressure can be expressed as a function of Z, which is designated as
the blast load scaled distance (Mays and Smith, 1995):
bar 1
7.6
3
+=
Z
Ps
( bar 10≥s
P )
bar 019.0
85.5455.1975.0
32
−++=
ZZZ
Ps
( bar 101.0 ≤≤s
P )
(1)
In this equation, the scaled distance, Z, is correlated to W and R by:
3/1
W
R
Z = (2)
wherein the standoff distance is measured in meters, and the charge weight is based on a
TNT-mass equivalence measured in kilograms. The duration of the blast impulse, td, can
be determined as a function of W and R, given by (Lam et al, 2004; Mays and Smith,
1995):
+−≈
3/1103/110log27.075.2log
W
R
W
td
( 0.1≥Z )
+−≈
3/110
3/110
log95.175.2log
W
R
W
td
0.1≤Z
(3)
These equations were then used to correlate the charge weight and the stand-off
distance to the load duration. In the next section, prediction of the charge weight and
standoff distance necessary to impose a given damage level on the tested slabs was based
on the principles of the DBD method to be discussed next.

FRPRCS-7 1349Displacement Based Method Applied for Prediction of Blast Loads
An attractive feature of the DBD method is that the structural performance criteria
selected for design or assessment can be correlated to a measurable quantity such as the
displacement ductility. For RC members, displacement ductility levels in the range of 1
to 6 can be correlated to performance damage levels that either lead to “small cracks
only” or to “major damage requiring repair”, respectively. These performance goals have
been obtained based on test results, which confirm that these performance levels can be
directly related to specific displacement ductility levels (Hose et al., 2000).
In applying the DBD method it is practical to convert the bilinear inelastic response
of a given member to an idealized linear elastic response, as shown in Figure 5 (Priestley
et al., 1995). According to this procedure the entire inelastic force-displacement response
is described by an idealized linear elastic system with an equivalent stiffness, Keff
, such
that the following holds true:
a
a
eff
F
K
∆
= (4)
In assessment conditions the yield deflection, Dy , is easily computed and the selected
displacement, ∆a, can be obtained based on the selected performance level or ductility, µ,
with:
Ya
∆=∆ µ (5)
Based on the substitute structure shown in Figure 5, the capacity, Fa, at a given µ and
for a given post-yield stiffness, r, can be derived based on the relation:
[ ]ya
FrF 1)1( +−= µ (6)
These three equations were used to completely describe the load-deformation
response for the substitute structure. This method of converting the structural
performance into a simplified response is often designated as the substitute structure
approach (Priestley et al., 2000). Meanwhile, the corresponding equivalent elastic period,
Teff
, is given by:
eff
eff
K
M
T π2=
(7)
where M is the effective mass of the system.
Another parameter that must be used in dynamic analysis using the substitute
structure approach is the equivalent viscous damping (EVD) ratio. Previous work (Lu and
Silva, 2004) have correlated the EVD ratio,eff
ξ , as a function of the displacement
ductility level for members under blast loads by the relation:

1350 Lu et al.
( )( )
[ ])1(1
111
05.0
−+
−−
+=
µµ
µ
π
ξ
r
r
eq (8)
Dynamic load effects can be correlated to an equivalent static load by a relation
designated as the dynamic response factor (DRF) (Clough and Penzien, 1993):
st
a
DRF
∆
∆
= (9)
where Da is the same as the displacement selected for assessment under the imposed
dynamic loads, and Dst is the static displacement, which is given by:
eff
s
st
K
P
=∆ (10)
The expression to compute DRF developed for blast loads was given by (Lu and
Silva, 2005):
−
+
+=−
−
*sin
1
*cos
2
21
1
*
1
2
θ
ξ
ξ
θ
θ
ξ
ξ
eff
effff
feDRFeff
eff
(11)
where *
θ is the phase angle for the maximum displacement given by:
+
−
=−
21
2
21
1
tan*
ff
f
eff
eff
ξ
ξ
θ (12)
In the expressions above, f1 and f
2 are functions of the EVD,
effξ , and the non-
dimensional time duration, effd
Tt / , ratios given by:
eff
d
eff
eff
eff
d
eff
d
eff
eff
eff
eff
eff
d
eff
d
eff
T
t
eff
d
eff
T
t
T
t
T
t
T
t
T
t
e
T
t
feff
d
eff
π
ξ
ξπ
π
ξ
ξ
ξ
ξπ
π
ξ
ξ
πξ
+
−
−
+
−
+
−
+
−=
−
2
2
2
2
2
1
12sin
2
12
1
1
12cos1
,
(13)

FRPRCS-7 1351
eff
d
eff
eff
d
eff
d
eff
eff
eff
eff
d
eff
d
eff
eff
T
t
eff
d
eff
T
t
T
t
T
t
T
t
T
t
e
T
t
feff
d
eff
π
ξπ
π
ξ
ξ
ξπ
π
ξ
ξ
ξ
πξ
2
1
12sin
2
1
1
1
12cos
2
14
2
,
2
2
2
2
2
2
+
−
+
−
−
−
−
+
−=
−
(14)
Using the substitute structure approach for a single degree of freedom system with a
given effective stiffness, Keff
, and an EVD ratio, eff
ξ , which can be correlated to a
specified damage level, Figure 6 presents the numerical results for DRF as a function of
the non-dimensional time ratio and under two different displacement ductility levels (1
and 4). The correlation between these displacement ductility levels and the EVD ratio
were obtained in term of Eq. (8). Finally, using the blast load duration ratio, ffd
Tet ,
and the DRF obtained from Figure 6 the peak overpressure, Ps, can be determined as:
DRF
K
P
effa
s
∆
= (15)
Steps Used to Predict the Blast Charge and Standoff Distance
A general flow-chart for predicting the charge weight and the standoff distance is
given in Figure 7.
The first step in this procedure consists of selecting the displacement ductility level
that will be used for the assessment of the slabs. In this work, the two displacement
ductility levels selected for predicting the blast loads were 1 and 4, corresponding to
damage levels that can be identified by ”minor cracks or no damage” to “visible cracks
and crushing of the cover concrete”. The ductility level selected for assessment of all the
corresponding slabs are shown in Table 3. Since the strengthened slabs (2A-3B) respond
within the elastic range up to failure, the ductility level for these slabs must be 1.
Steps 2 through 4 are self explanatory and can be related to the expressions
previously described, as shown in Figure 7.
A primary strategy for protecting buildings is to ensure that a certain standoff
distance is met such that the shock front generated by explosions decreases significantly
with distance. In step 5 the standoff distance, R, is selected as shown in the flow-chart,
and steps 6 through 9 are once again self explanatory and can be related to the
expressions shown in Figure 7.

1352 Lu et al.In step 10, when the difference between the value of t
d from step 6 and the value of
td1
computed in step 10 is within an acceptable degree of accuracy, the procedure is
terminated. Otherwise, a new iteration cycle is performed by setting the value of td for
step 6 as the value of td1
obtained from step 10. Table 3 presents the final iteration and the
corresponding steps. The test charge weights and the corresponding standoff distances
used during blast testing of the five slabs are summarized in Table 4. Detailed research
results are presented and discussed next.
RESULTS AND DISCUSSION
Slab 1 under First Event
The first event was generated by a charge weight of 0.45kg that was suspended
above the center of the slab and placed at a standoff distance of 910mm, which
corresponds to the m=1 damage level. From Figure 8a, as expected after this event no
damage was observed on the control slab.
Slab 1 under Second Event
The second event was generated by a charge weight of 0.90kg, which was also
suspended above the center of the slab and placed at a standoff distance of 300mm, which
corresponds to the m=4 damage level. From Figure 8b, a major flexural crack was
observed at the mid-span. The maximum crack width was 3mm. The residual
displacement at the center of the slab was measured at 21mm, and the residual
displacement at the mid-point along the edge was measured at 11mm. By assuming the
residual displacement varies linearly from the center to the edges of the slab, the average
residual displacement was calculated at nearly 14mm. Recognizing the yield
displacement equals 4.1mm, the achieved displacement ductility level during test was 4.4
which is close to the predicted displacement ductility level. These results indicate that
the charge weight and standoff distance were effectively estimated by using the DBD
method.
Slab 2A
An explosive charge weight of 1.35kg was applied on this slab at a standoff distance
of 300mm. As shown in Figure 9a, this slab was severely damaged under this explosive
charge, and no residual deformation could be realistically measured. This result indicates
that slabs retrofitted by CFRP laminates on the bottom side only are not adequate in
increasing the blast-resistant capacity of slabs for the given threat level as a results of the
dynamic response or negative overpressure.
Slab 2B
Slab 2B, was subjected to the same charge weight and standoff distance as slab 2A.
Two major shear cracks were observed near the supports and no significant flexural
cracks were observed, as shown in Figure 9b. The measured residual displacement was
44mm and 28mm at the center and at the mid span along the edges, respectively. By
comparing the experimental results of slab 2B with 2A, it can be concluded that the
flexural capacity under blast loads was increased by strengthening both sides. Future

FRPRCS-7 1353testing should also consider the shear failure of the retrofitted slabs. This can be easily
achieved by expanding the retrofit laminates to the edge of the slabs.
Slab 3A
Slab 3A, was also subjected to a blast load generated by a charge weight of 1.35kg
and a standoff distance of 300mm. Figure 10a shows that this slab suffered significant
damage under an explosive charge identical to slab 2A. This result indicates that slabs
retrofitted by SRP laminates on the bottom side only are also not adequate in increasing
the blast-resistant capacity of slabs.
Slab 3B
Slab 3B was also subjected to a blast load generated by a charge weight of 1.35kg
and a standoff distance of 300mm. Two major shear cracks were observed near the
supports and no significant flexural cracks were observed. As in slab 2B, future research
should address this issue by extending the sheets to the edges of the slab. The measured
residual displacement was 44mm and 28mm at the center and the mid span along the
edges, respectively.
CONCLUSIONS
In this work, the blast charge weights and the standoff distances to impose a desired
displacement ductility level were estimated based on the modified DBD method to
account for blast effects. The results of field test for the control slab showed that the
achieved displacement ductility levels matched closely with the predicted values.
Therefore, a primary conclusion drawn from the experimental results is that the charge
weight and standoff distance to generate blast loads can be effectively estimated by the
DBD method according to the procedure presented in this paper.
Furthermore, slabs retrofitted on the bottom side only were severely damaged
irrespective of the strengthening material. However, slabs retrofitted on both sides were
adequate in resisting the given threat level; but, failure due to the insufficient shear
capacity was observed. By comparing the test results of slabs strengthened on the bottom
side and on both sides, the main conclusion was that slabs may require retrofitting on
both sides in order to make these slabs resistant to blast loads.
ACKNOWLEDGMENTS
The analytical development of the DBD method presented in this paper was funded
by the National Science Foundation under a small Grant for Exploratory Research Grant
No. CMS-0335393. On the other hand, the field tests were funded by Structural
Preservation Systems, through the NSF Industry/University Cooperative Research Center
at the University of Missouri - Rolla. In addition the authors would also like to thank
Hardwire, LLC for their donation of the steel tapes.

1354 Lu et al.REFERENCES
Clough, R.W., and Penzien. J. (1993), Dynamics of Structures, 2nd Edition, McGraw Hill
Inc., New York, NY, 1993, 635 pp.
Federal Emergency Management Agency, (FEMA) (2003) “FEMA 426- Reference
Manual to Mitigate Potential Terrorist Attacks Against Buildings” FEMA-426,
December 2003.
Hose, Y. D., Silva, P. F., Seible, F. (2000), "Performance Evaluation of Concrete Bridge
Components and Systems under Simulated Seismic Loads," EERI Earthquake
Spectra, Vol. 16, No. 2, May 2000, pp. 413-442.
Lam, N.; Mendis, P., Ngo, T. (2004) “Response Spectrum Solution for Blast Loading.”
Electronic Journal of Structural Engineering, 4(2004) pp.28-44
Lu, B.; and Silva, P. (2004) “Estimating Equivalent Viscous Damping Ratio For
RC Members under different loading Types”, Mechanics Research Communications;
Submitted.
Lu, B.; and Silva, P. (2005) “Inelastic Shock Spectra for Blast Loads”, Mechanics
Research Communications; Submitted.
Mays, G. C. and Smith, P. D. (1995) Blast Effects on Buildings, Thomas Telford Service
Ltd, London, E14 4JD. 121pp.
Priestley, M.J.N. (2000), .Performance Based Seismic Design,. Proceedings of the 12th
World Conference on Earthquake Engineering, Auckland, New Zealand, 2000, State
of the Art Paper No. 2831, pp. 325-346.
Priestley, M. J. N., Seible, F., and Calvi, M.,(1995) Seismic Design and Retrofit of
Bridges, John Wiley & Sons, Inc., New York, NY, Sep 1995, 672 pp.
Wobbe, E., Silva, P, and Barton, B. et al (2004), “Flexural Capacity of RC Beams
Externally Bonded with SRP and SRG” ACI Conference, San Francisco, CA,
November, 2004

FRPRCS-7 1355

1356 Lu et al.
Figure 1 RC Slab and Reinforcement Detail
Figure 2 Test Site and Test Setup

FRPRCS-7 1357
Figure 3 Moment- Curvature Relationship
Figure 4 Simplified Pressure-Time Profile for Blast
Figure 5 Substitute Structure Model

1358 Lu et al.
Figure 6 Displacement Response Factor for Simplified Blast Load
Figure 7 Flow Chart for Predicting Blast Loads

FRPRCS-7 1359
Figure 8 Experimental Results for Control Slab
Figure 9 Experimental Results for CFRP Retrofitted Slabs
Figure 10 Experimental Results for SRP Retrofitted Slabs

1360 Lu et al.