Retrieval of coastal sea water parameters from high ...Landsat 7 ETM + true colour image Acquired:...
27
Retrieval of coastal sea water parameters from high resolution satellite images Alice Heng, Liew Soo Chin, Chang Chew Wai, Narvada Dewkurun and He Jiangcheng Supported by Agency for Science, Technology and Research (A*STAR), Singapore
Transcript of Retrieval of coastal sea water parameters from high ...Landsat 7 ETM + true colour image Acquired:...
Retrieval of coastal sea water parameters from high resolution
satellite images
Alice Heng, Liew Soo Chin, Chang Chew Wai, Narvada Dewkurun
and He Jiangcheng
Supported by Agency for Science, Technology and Research (A*STAR), Singapore
22nd APAN Meeting in Singapore 17 Jul 2006
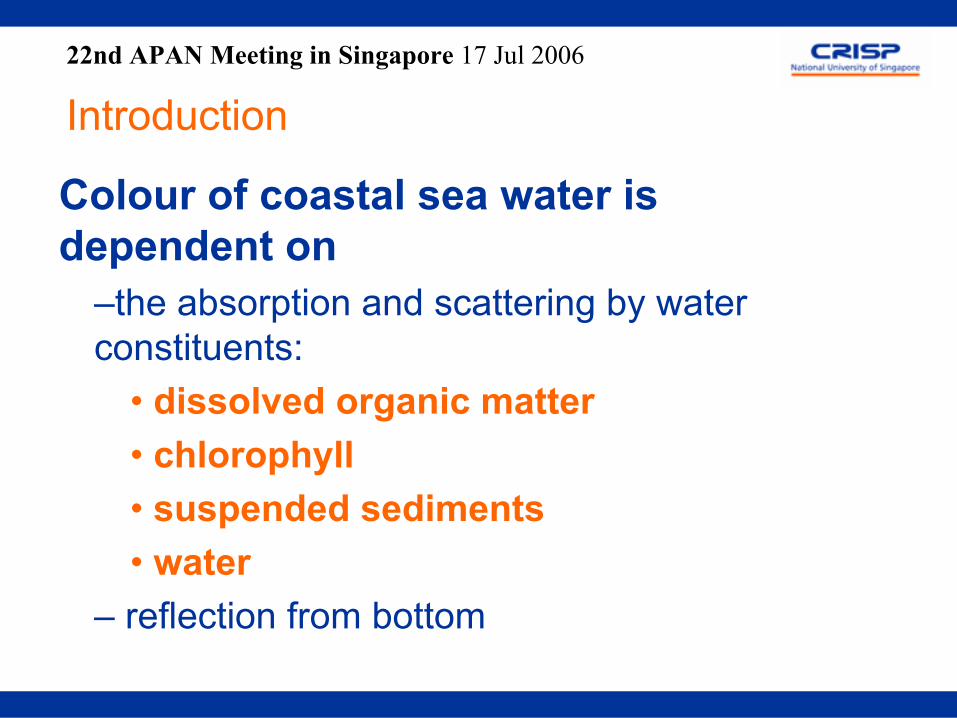
Introduction
Colour of coastal sea water is dependent on
–the absorption and scattering by water constituents:
• dissolved organic matter• chlorophyll• suspended sediments• water
– reflection from bottom
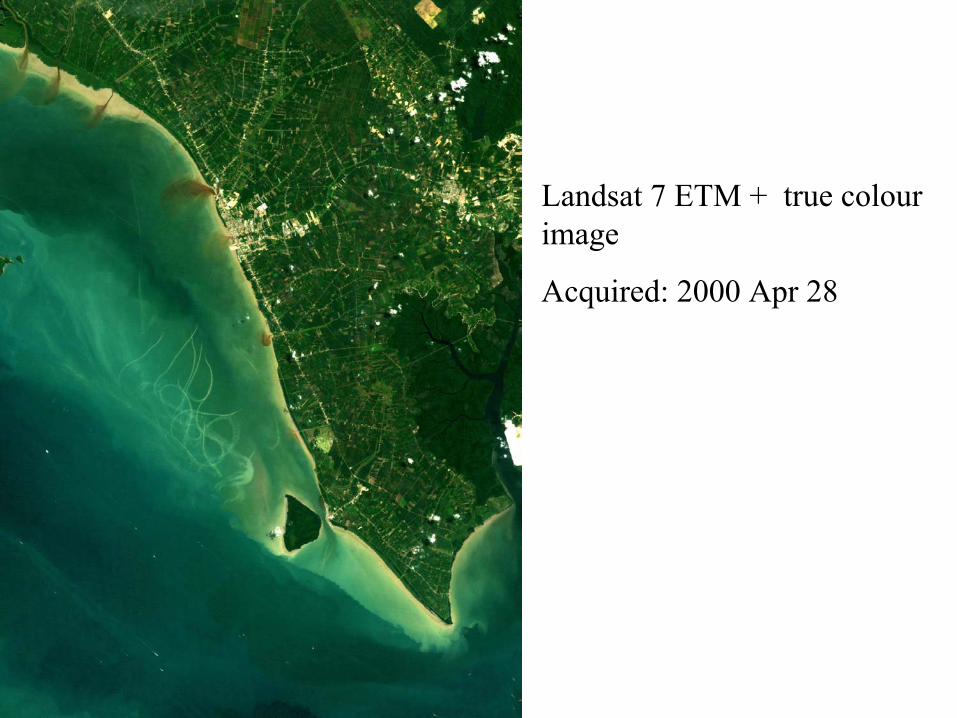
Landsat 7 ETM + true colour image
Acquired: 2000 Apr 28
22nd APAN Meeting in Singapore 17 Jul 2006
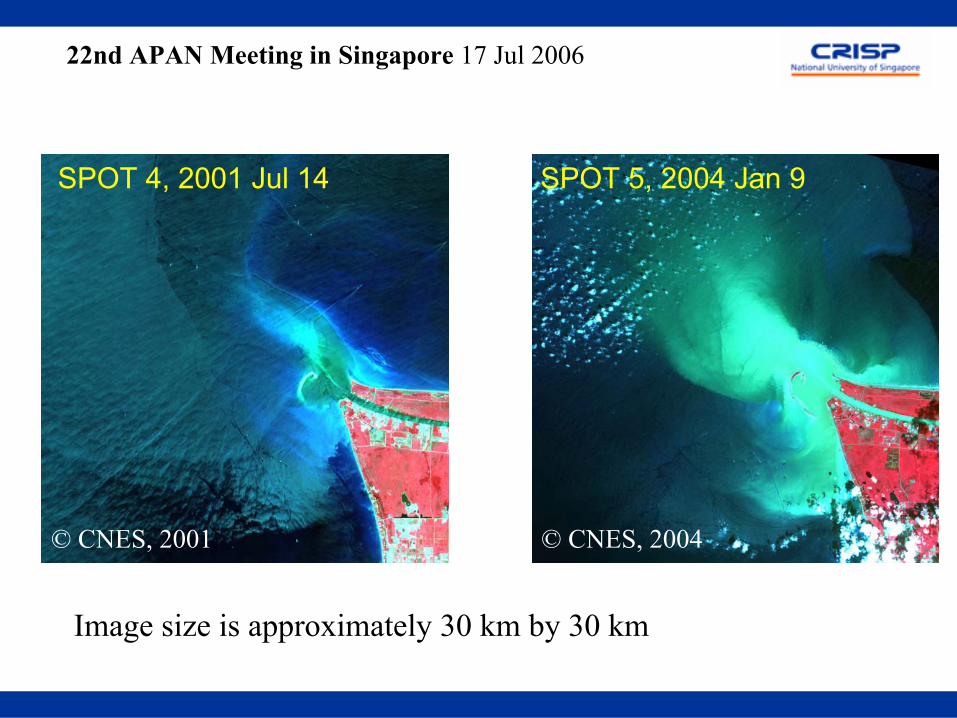
SPOT 5, 2004 Jan 9SPOT 4, 2001 Jul 14
© CNES, 2001 © CNES, 2004
Image size is approximately 30 km by 30 km
22nd APAN Meeting in Singapore 17 Jul 2006
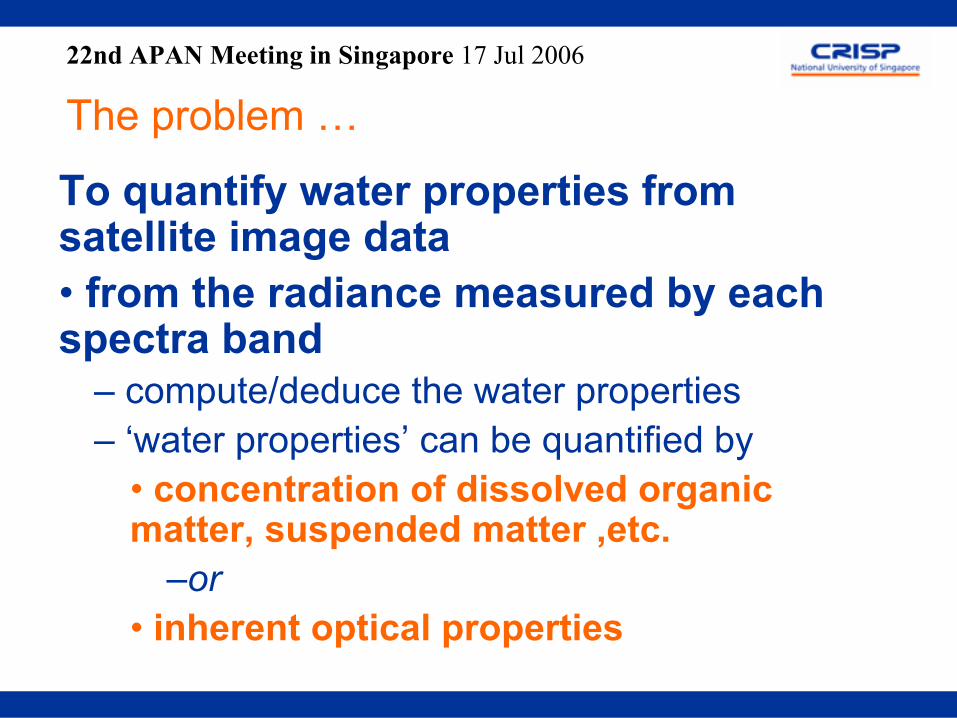
The problem …
To quantify water properties from satellite image data• from the radiance measured by each spectra band
– compute/deduce the water properties– ‘water properties’ can be quantified by
• concentration of dissolved organic matter, suspended matter ,etc.
–or• inherent optical properties
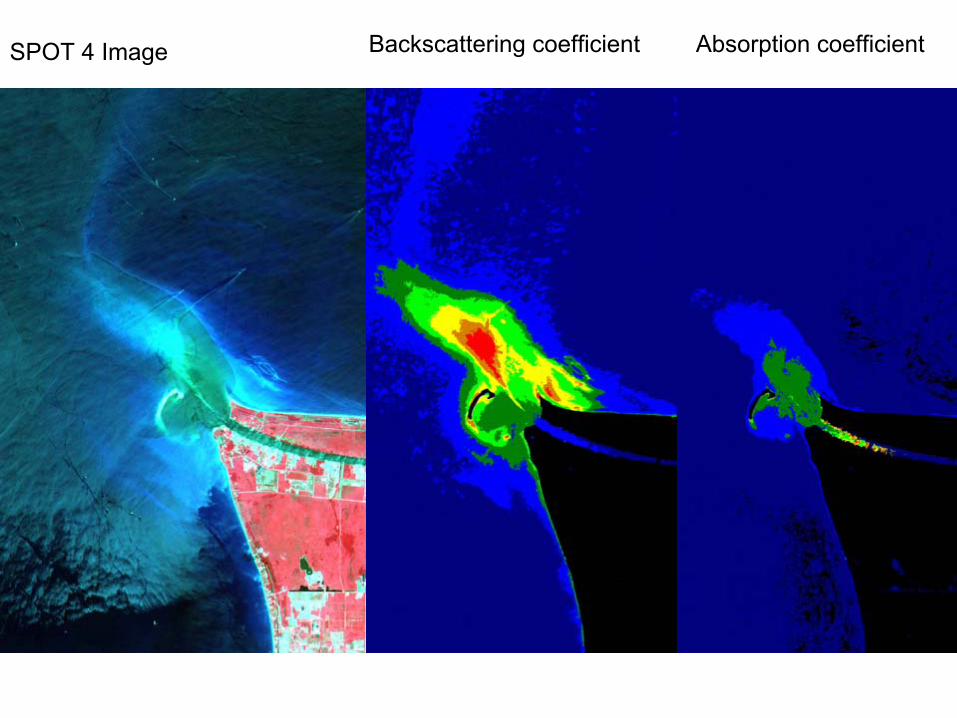
SPOT 4 Image Backscattering coefficient Absorption coefficient
22nd APAN Meeting in Singapore 17 Jul 2006
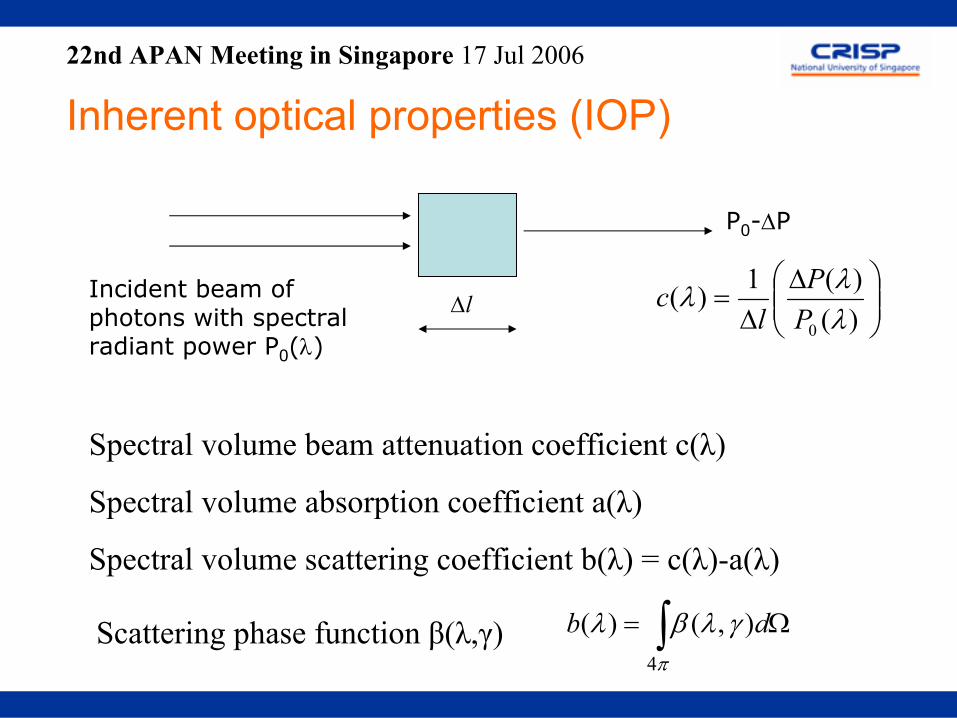
Inherent optical properties (IOP)
Incident beam of photons with spectral radiant power P0(λ)
P0-∆P
∆l
∆∆
=)()(1)(
0 λλλ
PP
lc
Spectral volume beam attenuation coefficient c(λ)
Spectral volume absorption coefficient a(λ)
Spectral volume scattering coefficient b(λ) = c(λ)-a(λ)
Scattering phase function β(λ,γ) ∫ Ω=π
γλβλ4
),()( db
22nd APAN Meeting in Singapore 17 Jul 2006
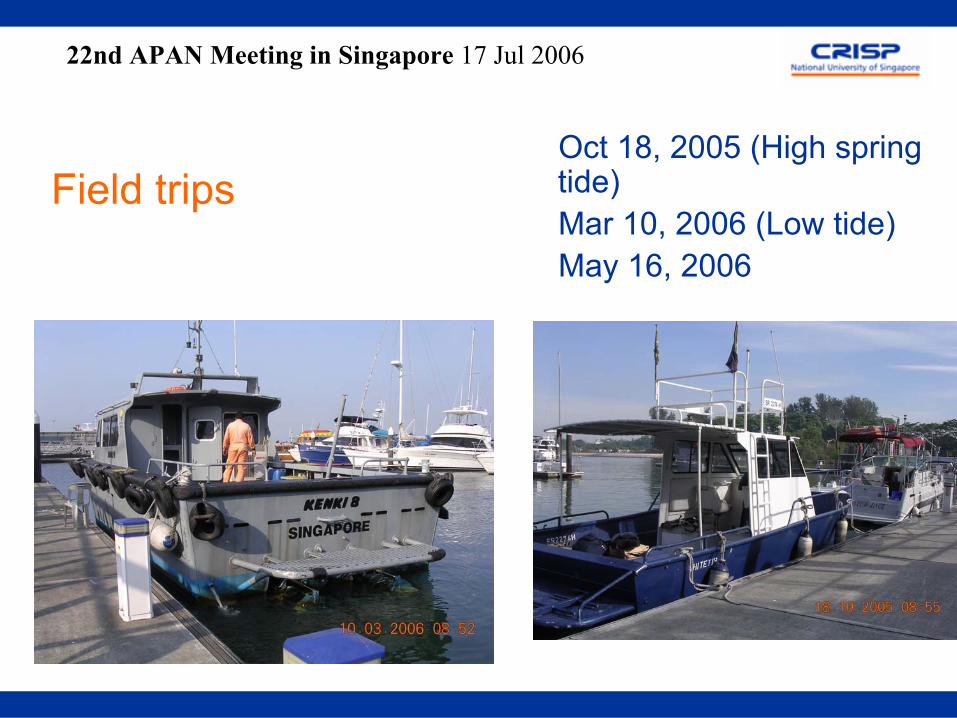
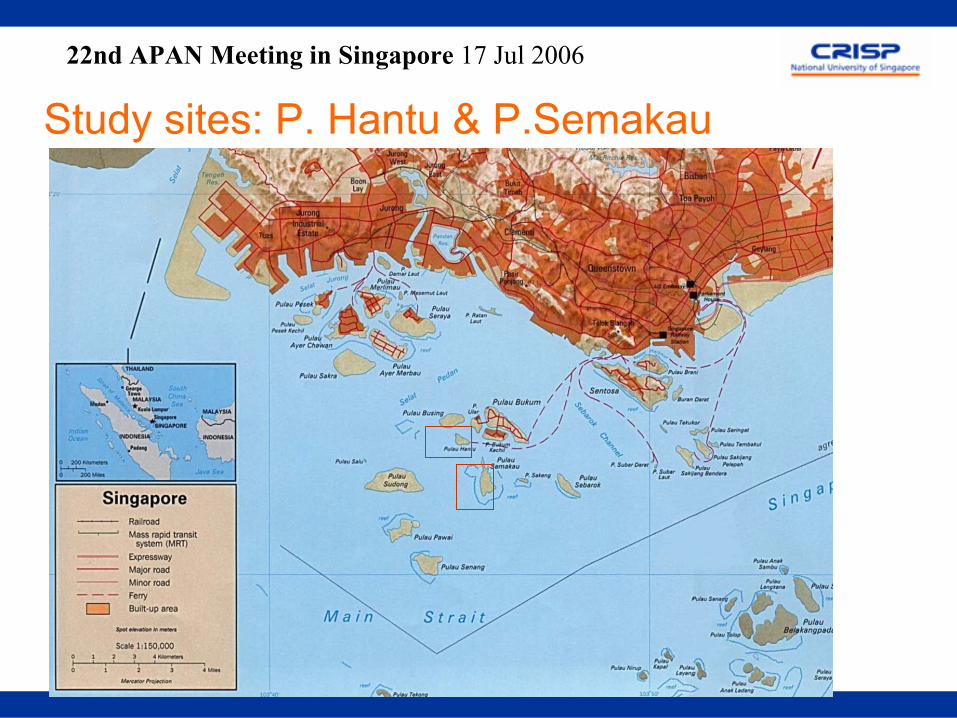
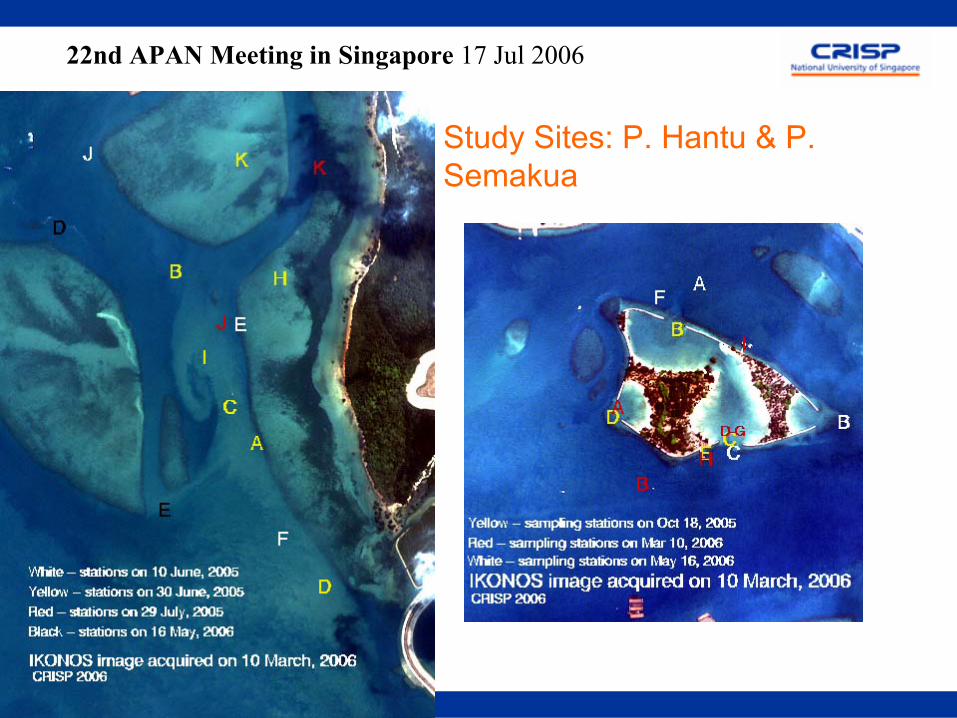
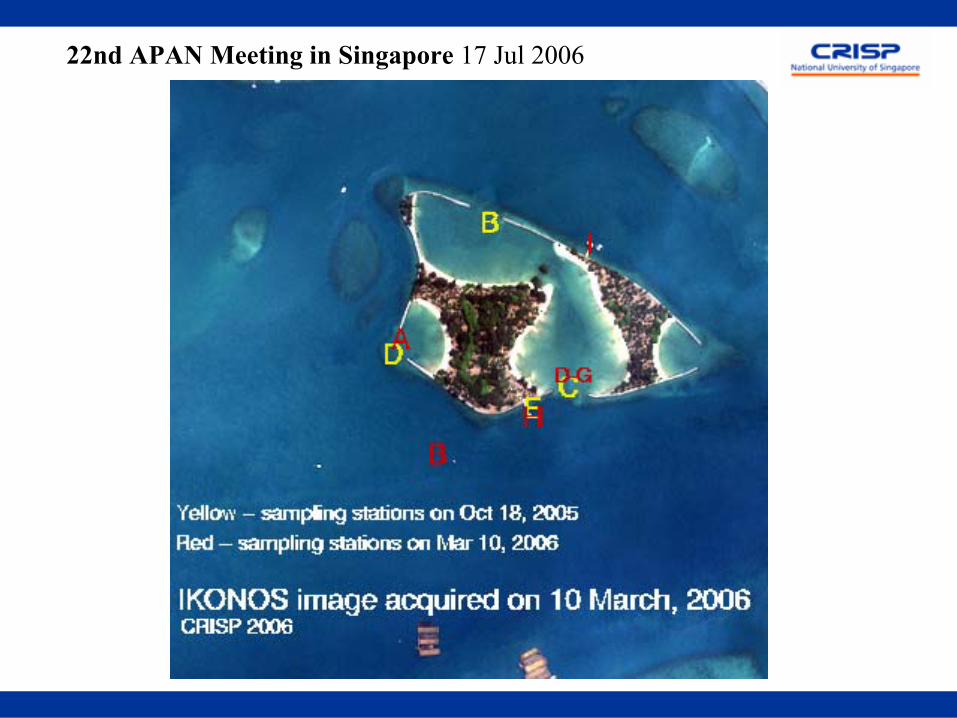
Field tripsOct 18, 2005 (High spring tide)Mar 10, 2006 (Low tide)May 16, 2006
22nd APAN Meeting in Singapore 17 Jul 2006
Study sites: P. Hantu & P.Semakau
22nd APAN Meeting in Singapore 17 Jul 2006
Study Sites: P. Hantu & P. Semakua
22nd APAN Meeting in Singapore 17 Jul 2006
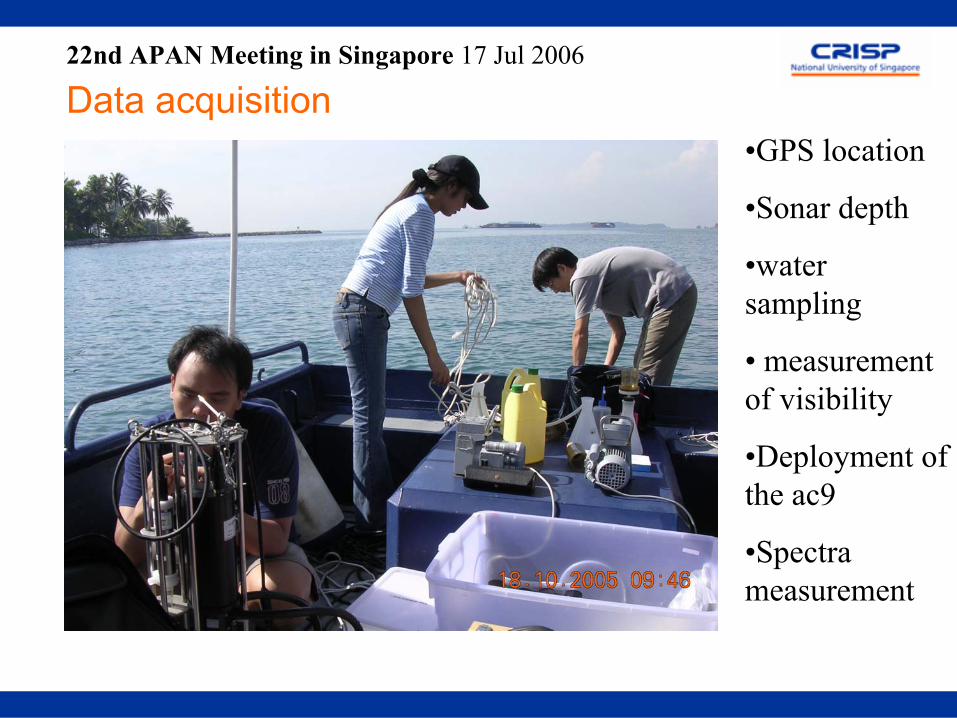
Data acquisition•GPS location
•Sonar depth
•water sampling
• measurement of visibility
•Deployment of the ac9
•Spectra measurement
22nd APAN Meeting in Singapore 17 Jul 2006
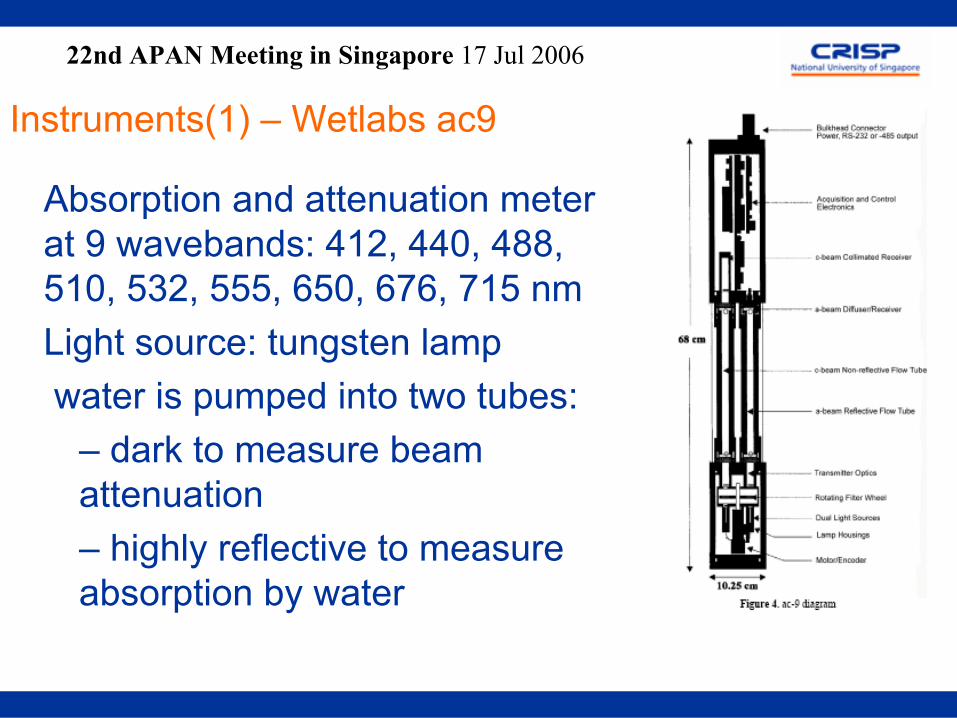
Instruments(1) – Wetlabs ac9
Absorption and attenuation meter at 9 wavebands: 412, 440, 488, 510, 532, 555, 650, 676, 715 nmLight source: tungsten lampwater is pumped into two tubes:
– dark to measure beam attenuation– highly reflective to measure absorption by water
22nd APAN Meeting in Singapore 17 Jul 2006
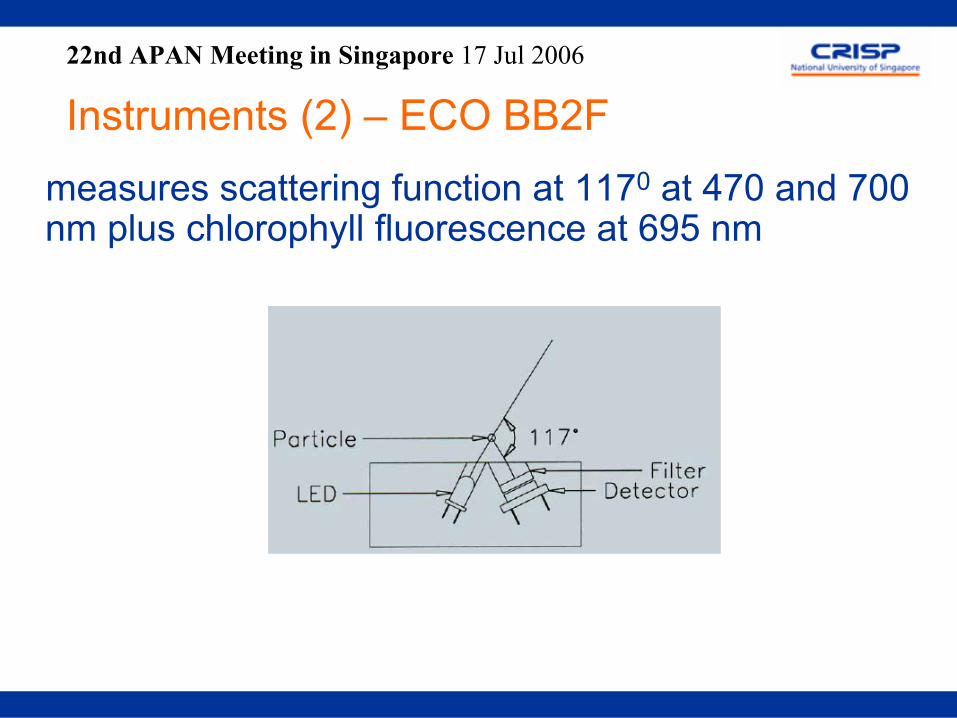
Instruments (2) – ECO BB2Fmeasures scattering function at 1170 at 470 and 700 nm plus chlorophyll fluorescence at 695 nm
22nd APAN Meeting in Singapore 17 Jul 2006
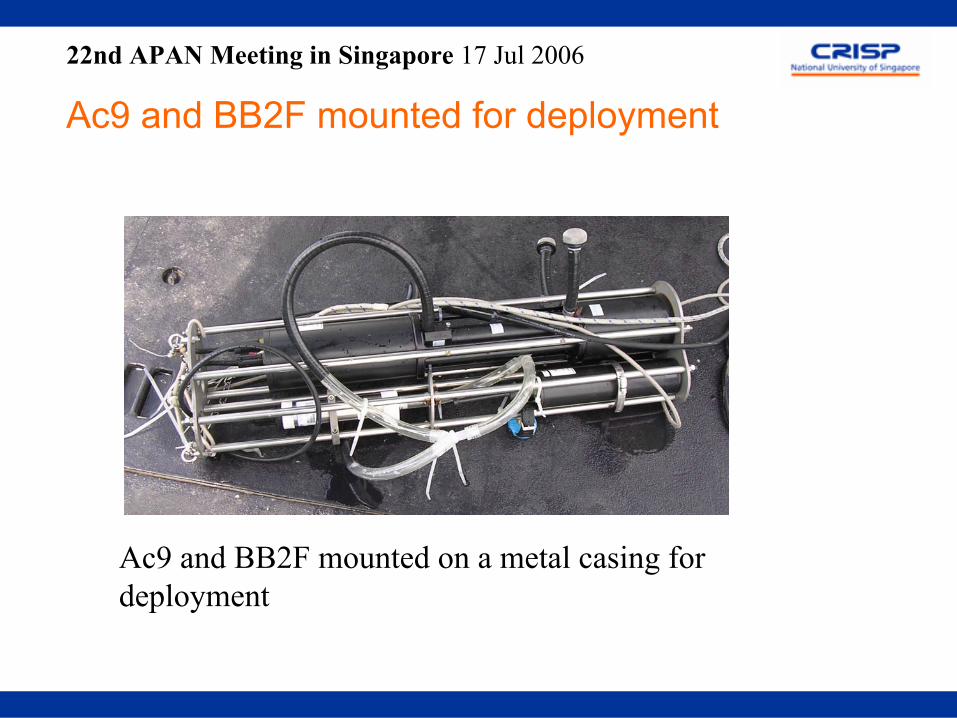
Ac9 and BB2F mounted for deployment
Ac9 and BB2F mounted on a metal casing for deployment
22nd APAN Meeting in Singapore 17 Jul 2006
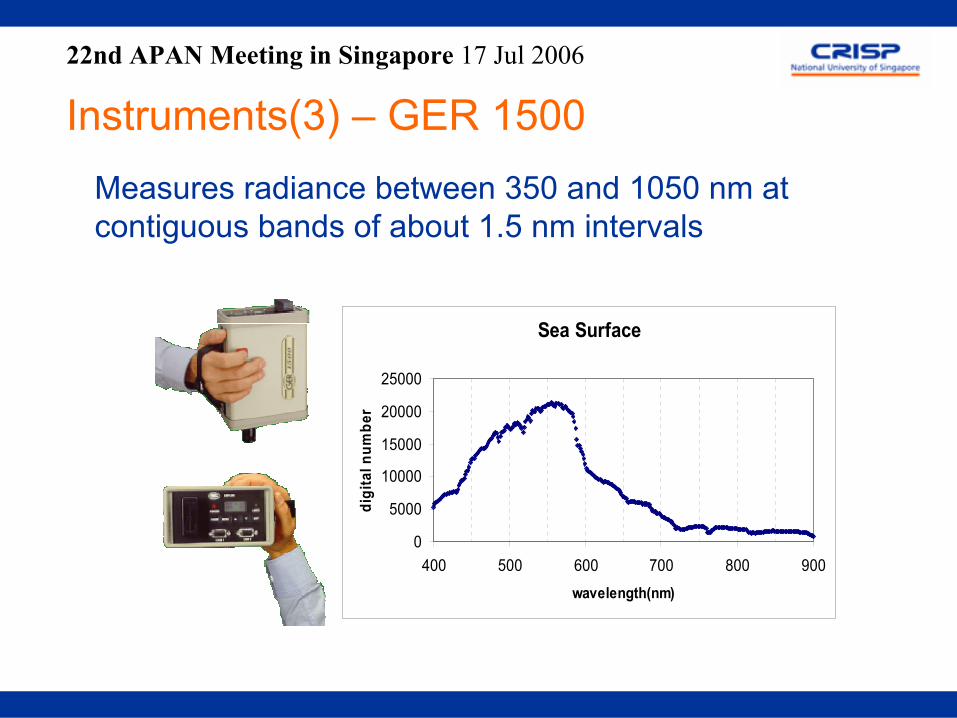
Instruments(3) – GER 1500Measures radiance between 350 and 1050 nm at contiguous bands of about 1.5 nm intervals
Sea Surface
0
5000
10000
15000
20000
25000
400 500 600 700 800 900
wavelength(nm)
digi
tal n
umbe
r
22nd APAN Meeting in Singapore 17 Jul 2006
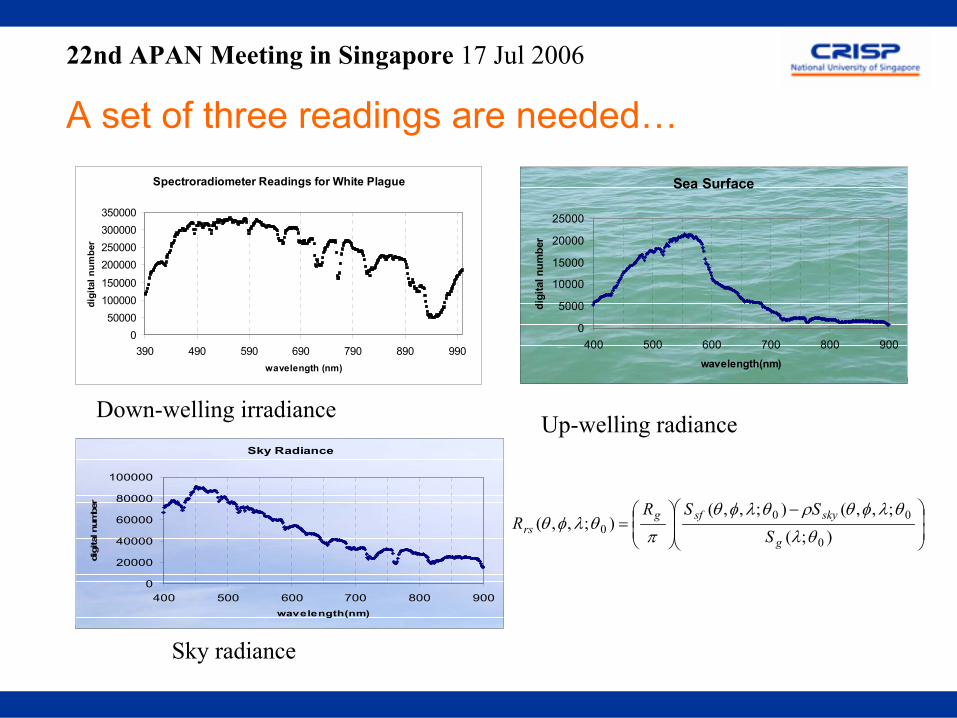
A set of three readings are needed…Spectroradiometer Readings for White Plague
050000
100000150000
200000250000300000350000
390 490 590 690 790 890 990wavelength (nm)
digi
tal n
umbe
r
Sea Surface
0
5000
10000
15000
20000
25000
400 500 600 700 800 900wavelength(nm)
digi
tal n
umbe
r
Sky Radiance
0
20000
40000
60000
80000
100000
400 500 600 700 800 900wavelength(nm)
digi
tal n
umbe
r
−
=
);(;,,();,,(
);,,(0
000 θλ
θλφθρθλφθ
πθλφθ
g
skysfgrs S
SSRR
Down-welling irradiance Up-welling radiance
Sky radiance
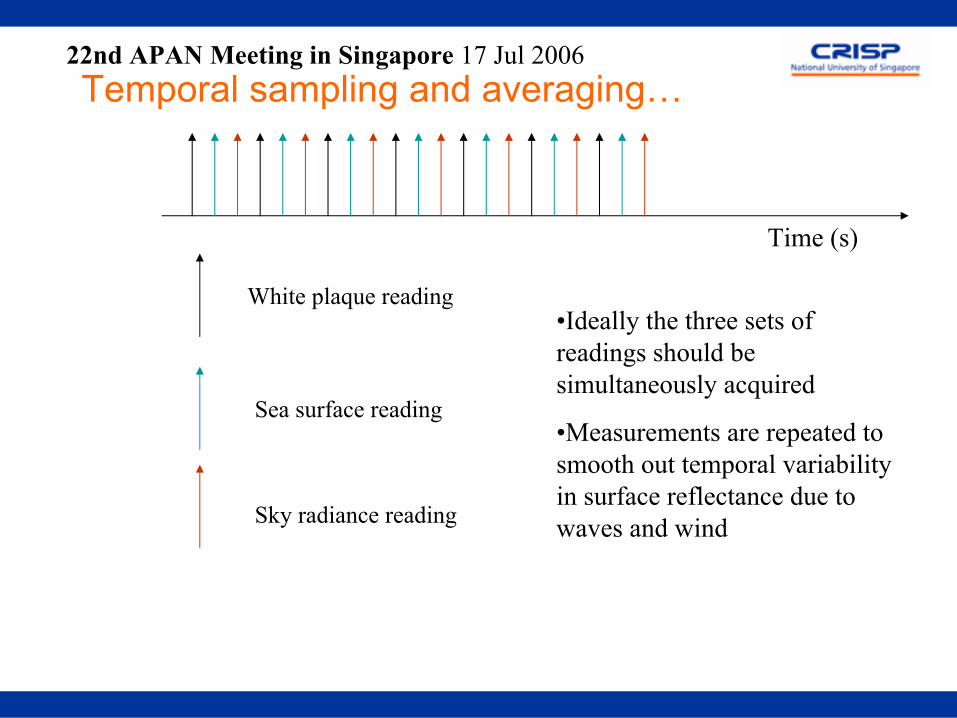
22nd APAN Meeting in Singapore 17 Jul 2006Temporal sampling and averaging…
Time (s)
White plaque reading
Sea surface reading
Sky radiance reading
•Ideally the three sets of readings should be simultaneously acquired
•Measurements are repeated to smooth out temporal variability in surface reflectance due to waves and wind
22nd APAN Meeting in Singapore 17 Jul 2006
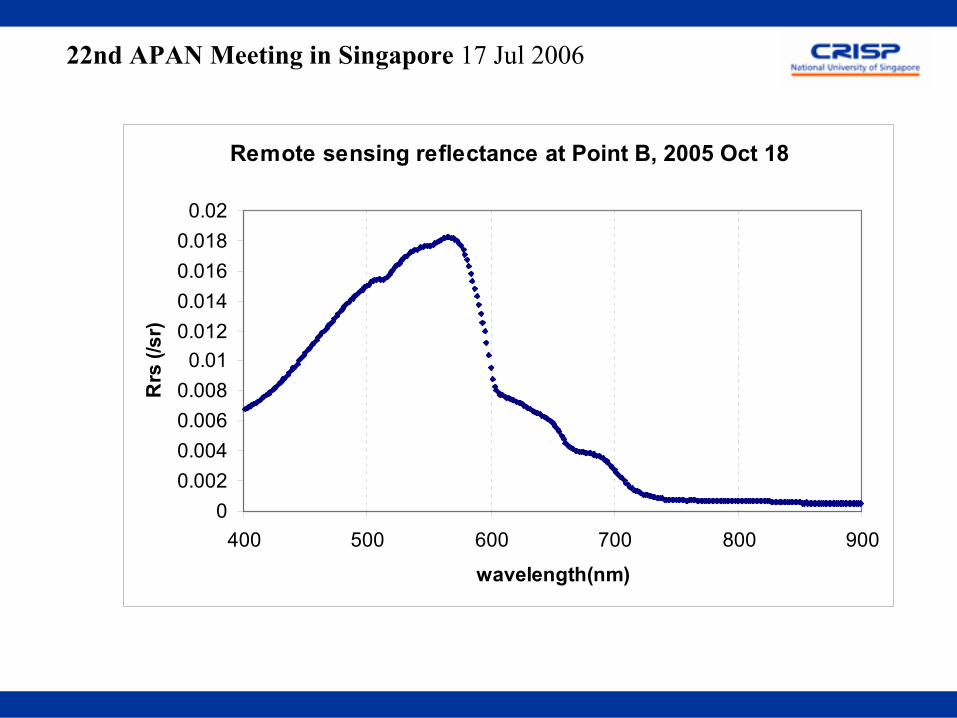
Remote sensing reflectance at Point B, 2005 Oct 18
00.0020.0040.0060.008
0.010.0120.0140.0160.018
0.02
400 500 600 700 800 900
wavelength(nm)
Rrs
(/sr
)
22nd APAN Meeting in Singapore 17 Jul 2006
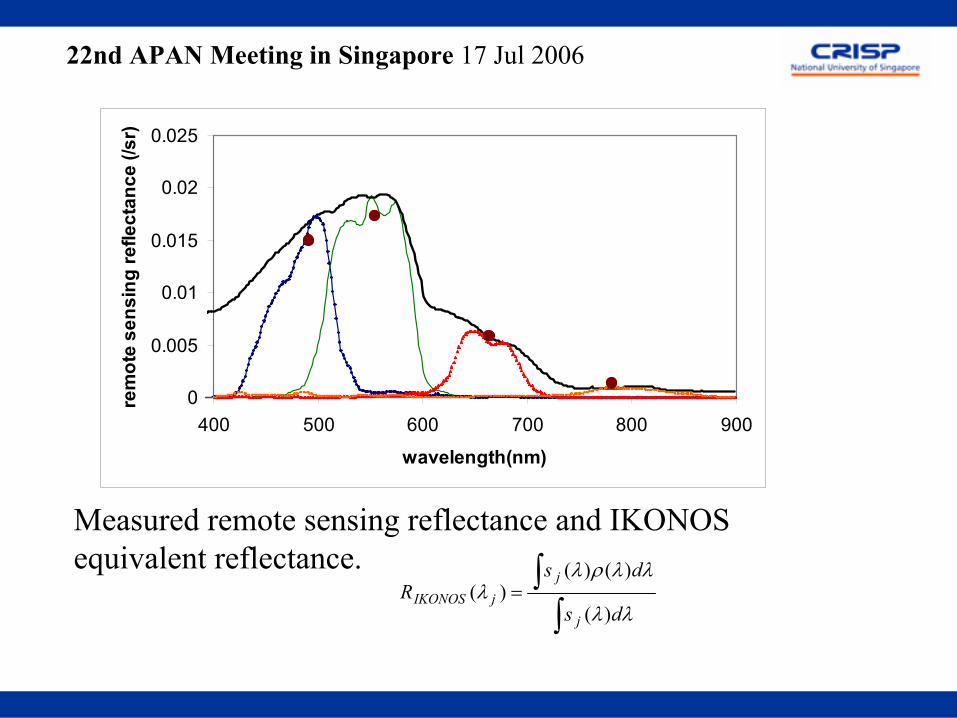
Measured remote sensing reflectance and IKONOS equivalent reflectance.
∫∫=
λλ
λλρλλ
ds
dsR
j
jjIKONOS
)(
)()()(
0
0.005
0.01
0.015
0.02
0.025
400 500 600 700 800 900
wavelength(nm)
rem
ote
sens
ing
refle
ctan
ce (/
sr)
22nd APAN Meeting in Singapore 17 Jul 2006
22nd APAN Meeting in Singapore 17 Jul 2006
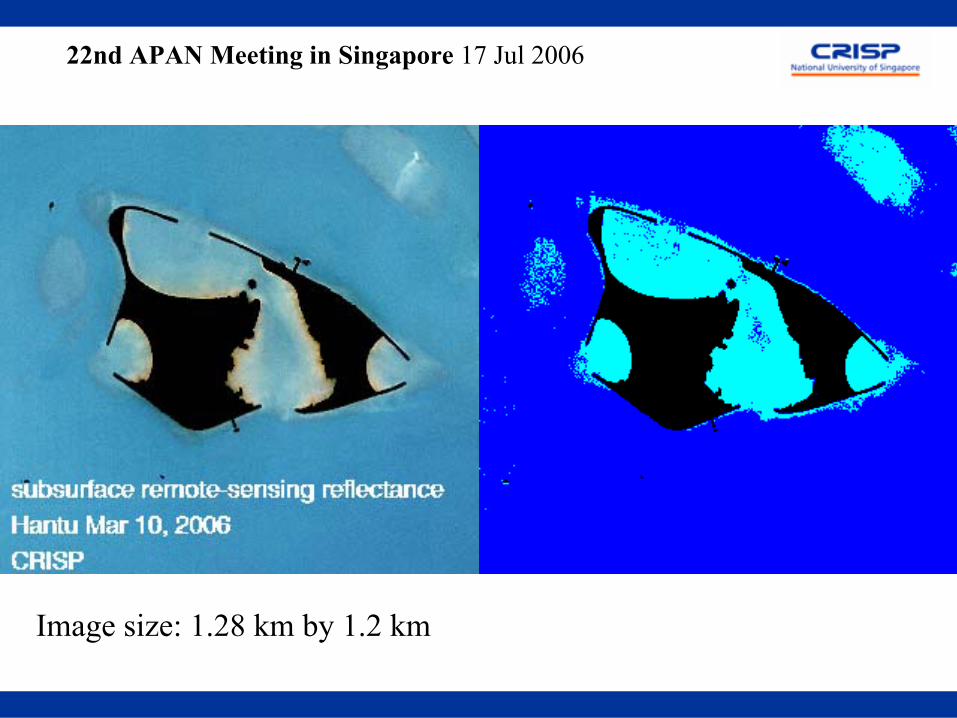
Subsurface remote sensing image Image classified into land, optically deep and optically shallow regions
Image size: 1.28 km by 1.2 km
22nd APAN Meeting in Singapore 17 Jul 2006
0.000
0.005
0.010
0.015
0.020
0.025
400 500 600 700 800wavelength(nm)
rem
ote
sens
ing
refle
ctan
ce
(/sr)
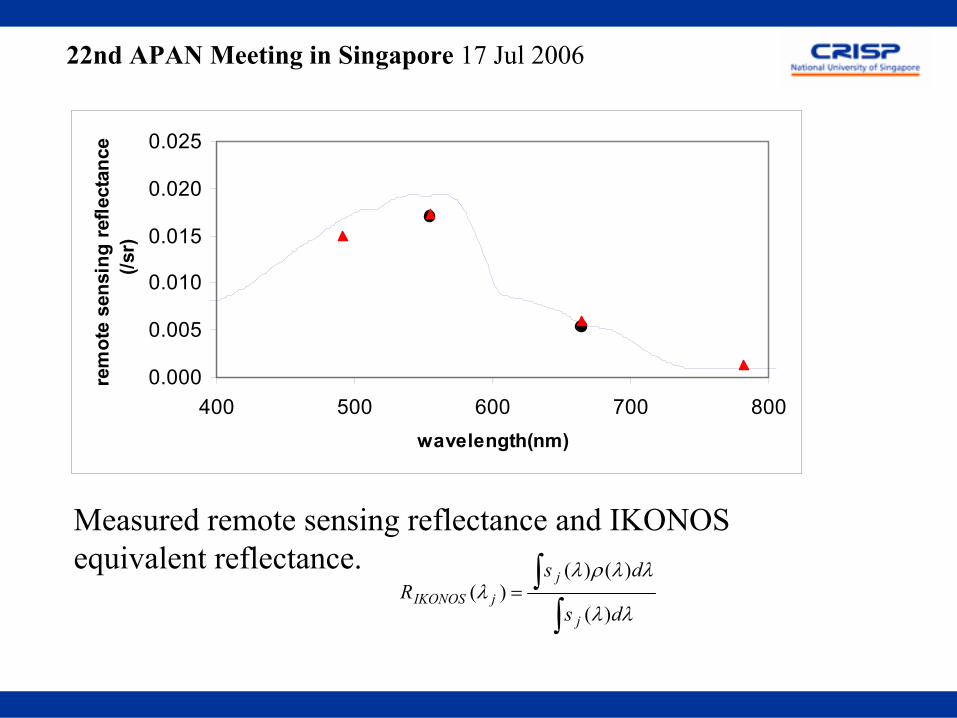
Measured remote sensing reflectance and IKONOS equivalent reflectance.
∫∫=
λλ
λλρλλ
ds
dsR
j
jjIKONOS
)(
)()()(
22nd APAN Meeting in Singapore 17 Jul 2006
0.00
0.10
0.20
0.300.40
0.50
0.60
0.70
0.80
400 450 500 550 600 650 700 750
wavelength(nm)
abso
rptio
n co
effic
ient
(/m
)
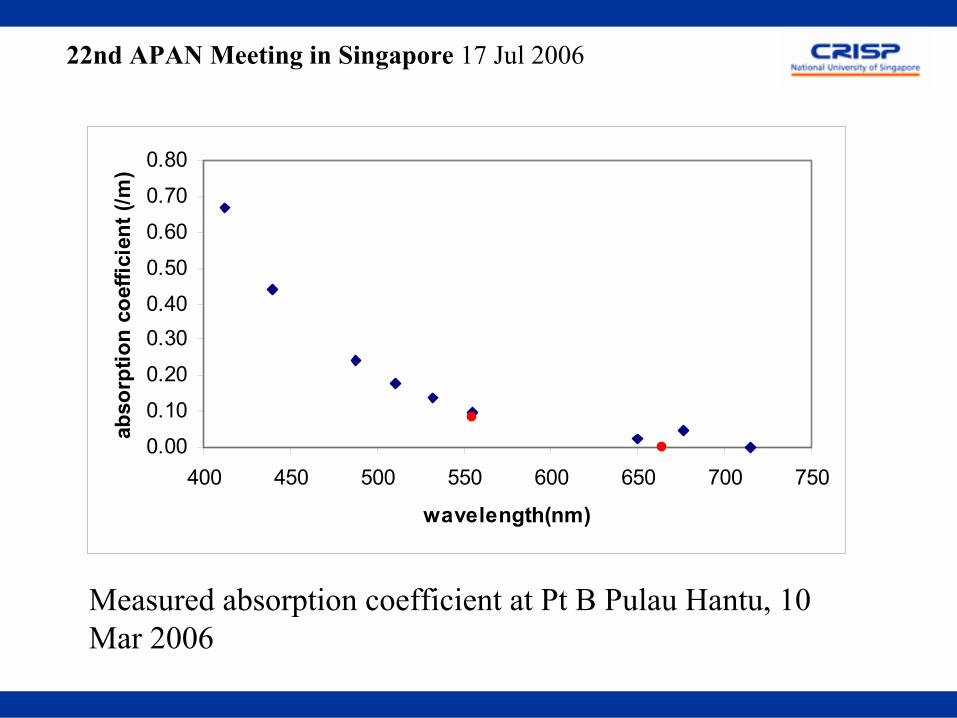
Measured absorption coefficient at Pt B Pulau Hantu, 10 Mar 2006
22nd APAN Meeting in Singapore 17 Jul 2006
0.000
0.010
0.020
0.030
0.040
0.050
0.060
400 450 500 550 600 650 700 750
wavelength(nm)
back
scat
terin
g co
effic
ient
(/m
)
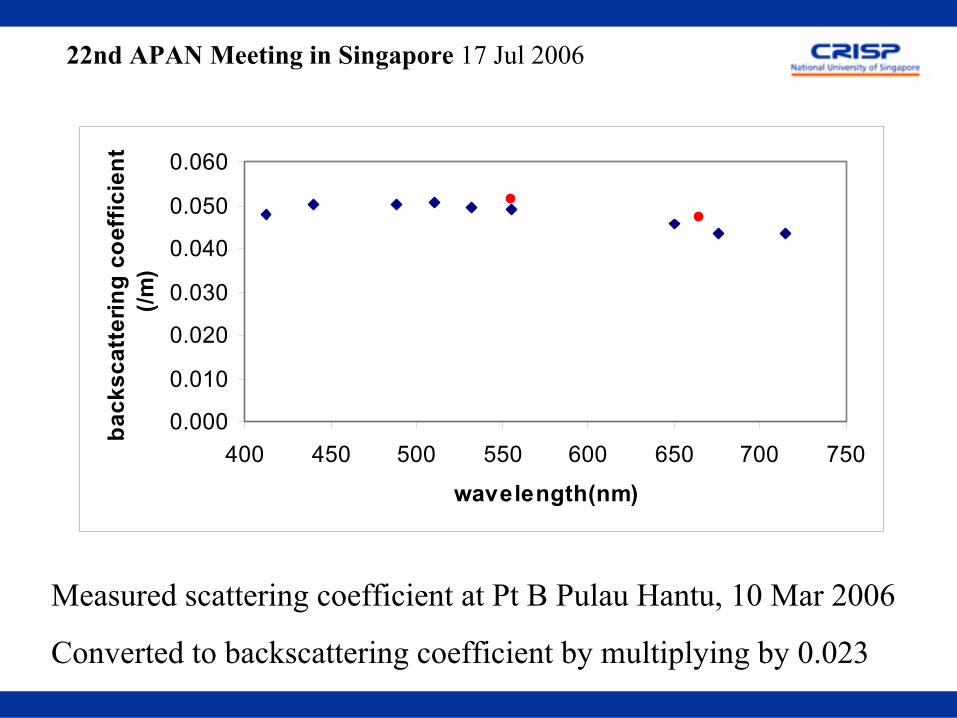
Measured scattering coefficient at Pt B Pulau Hantu, 10 Mar 2006
Converted to backscattering coefficient by multiplying by 0.023
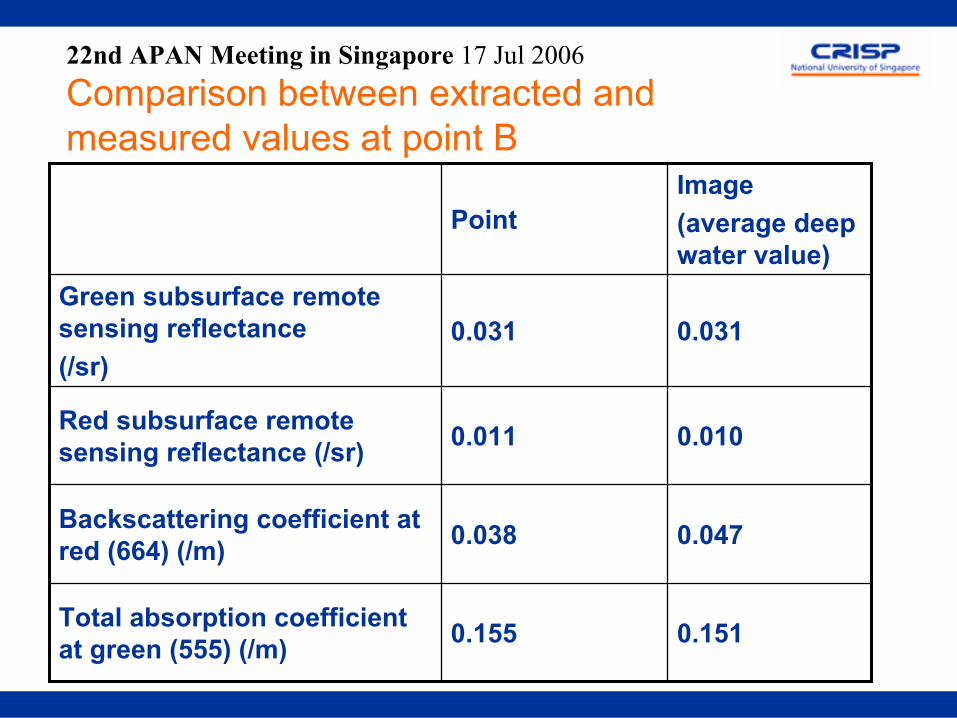
22nd APAN Meeting in Singapore 17 Jul 2006Comparison between extracted and measured values at point B
0.1510.155Total absorption coefficient at green (555) (/m)
0.0470.038 Backscattering coefficient at red (664) (/m)
0.0100.011Red subsurface remote sensing reflectance (/sr)
0.0310.031Green subsurface remote sensing reflectance(/sr)
Image(average deep water value)
Point
22nd APAN Meeting in Singapore 17 Jul 2006
Conclusion
• Algorithm looks promising•More data needed for validation• Extend to extraction of bottom reflectance spectra• Main issue – atmospheric correction method

Thank you!