Retraining Investment for U.S. Transition from Coal to … in 2016 (Solar Foundation, 2016). The...
31
Preprint to be published: Edward P. Louie and Joshua M. Pearce. Retraining Investment for U.S. Transition from Coal to Solar Photovoltaic Employment. Energy Economics. (2016). doi:10.1016/j.eneco.2016.05.016 1 Retraining Investment for U.S. Transition from Coal to Solar Photovoltaic Employment Edward P. Louie 1 and Joshua M. Pearce 2,3* 1. School of Public Policy, Oregon State University 2. Department of Materials Science & Engineering, Michigan Technological University 3. Department of Electrical & Computer Engineering, Michigan Technological University * Contact author: Michigan Technological University 601 M&M Building 1400 Townsend Drive Houghton, MI 49931-1295 906-487-1466 [email protected] Abstract Although coal remains the largest source of electricity in the U.S., a combination of factors is driving a decrease in profitability and employment in the coal-sector. Meanwhile, the solar photovoltaic (PV) industry is growing rapidly in the U.S. and generating many jobs that represent employment opportunities for laid off coal workers. In order to determine the viability of a smooth transition from coal to PV-related employment, this paper provides an analysis of the cost to retrain current coal workers for solar photovoltaic industry employment in the U.S. The current coal industry positions are determined, the skill set evaluated and the salaries tabulated. For each type of coal position, the closest equivalent PV position is determined and then the re-training time and investment are quantified. These values are applied on a state-by-state basis for coal producing states employing the bulk of coal workers as a function of time using a reverse seniority retirement program for the current American fleet of coal-powered plants. The results show that a relatively minor investment in retraining would allow the vast majority of coal workers to switch to PV-related positions even in the event of the elimination of the coal industry. Keywords: employment; energy industry; solar photovoltaic; coal; jobs; green jobs Introduction Coal remains the largest source of electricity in the U.S. accounting for 39% of the electricity mix (U.S. EIA, 2014a). In addition, coal power and coal mining are tightly linked, with 93 % of coal consumed used for electricity generation (U.S. EIA, 2014a). Despite the decline in coal jobs due to technological advancements, coal still provides many jobs with the U.S. Energy Information Administration (EIA) and the U.S. Bureau of Labor Statistics (BLS) finding 89,838 and 78,970 employees in coal mining in 2012 and 2013, respectively (U.S. EIA, 2013a; BLS, 2013). While there are no official published numbers on the employees working in coal power plants, studies found that coal-fired power plants employ around 0.18 people in operations and maintenance on a permanent basis per MW (Beamon & Leckey, 1999; Singh & Fehrs, 2001). Given there is 336,341 MW of coal generator capacity in the U.S. (U.S. EIA, 2013b), the number of people employed by coal-fired power plants is therefore around 60,541. Thus, coal mining and coal-fired power plants currently employ
Transcript of Retraining Investment for U.S. Transition from Coal to … in 2016 (Solar Foundation, 2016). The...

Preprint to be published: Edward P. Louie and Joshua M. Pearce. Retraining Investment for U.S. Transition from Coal to Solar Photovoltaic Employment. Energy Economics. (2016). doi:10.1016/j.eneco.2016.05.016
1
Retraining Investment for U.S. Transition from Coal to Solar Photovoltaic Employment
Edward P. Louie1 and Joshua M. Pearce2,3*
1. School of Public Policy, Oregon State University 2. Department of Materials Science & Engineering, Michigan Technological University 3. Department of Electrical & Computer Engineering, Michigan Technological University
* Contact author: Michigan Technological University 601 M&M Building 1400 Townsend Drive Houghton, MI 49931-1295 906-487-1466 [email protected] Abstract Although coal remains the largest source of electricity in the U.S., a combination of factors is driving a decrease in profitability and employment in the coal-sector. Meanwhile, the solar photovoltaic (PV) industry is growing rapidly in the U.S. and generating many jobs that represent employment opportunities for laid off coal workers. In order to determine the viability of a smooth transition from coal to PV-related employment, this paper provides an analysis of the cost to retrain current coal workers for solar photovoltaic industry employment in the U.S. The current coal industry positions are determined, the skill set evaluated and the salaries tabulated. For each type of coal position, the closest equivalent PV position is determined and then the re-training time and investment are quantified. These values are applied on a state-by-state basis for coal producing states employing the bulk of coal workers as a function of time using a reverse seniority retirement program for the current American fleet of coal-powered plants. The results show that a relatively minor investment in retraining would allow the vast majority of coal workers to switch to PV-related positions even in the event of the elimination of the coal industry.
Keywords: employment; energy industry; solar photovoltaic; coal; jobs; green jobs Introduction
Coal remains the largest source of electricity in the U.S. accounting for 39% of the electricity mix (U.S. EIA, 2014a). In addition, coal power and coal mining are tightly linked, with 93 % of coal consumed used for electricity generation (U.S. EIA, 2014a). Despite the decline in coal jobs due to technological advancements, coal still provides many jobs with the U.S. Energy Information Administration (EIA) and the U.S. Bureau of Labor Statistics (BLS) finding 89,838 and 78,970 employees in coal mining in 2012 and 2013, respectively (U.S. EIA, 2013a; BLS, 2013). While there are no official published numbers on the employees working in coal power plants, studies found that coal-fired power plants employ around 0.18 people in operations and maintenance on a permanent basis per MW (Beamon & Leckey, 1999; Singh & Fehrs, 2001). Given there is 336,341 MW of coal generator capacity in the U.S. (U.S. EIA, 2013b), the number of people employed by coal-fired power plants is therefore around 60,541. Thus, coal mining and coal-fired power plants currently employ

Preprint to be published: Edward P. Louie and Joshua M. Pearce. Retraining Investment for U.S. Transition from Coal to Solar Photovoltaic Employment. Energy Economics. (2016). doi:10.1016/j.eneco.2016.05.016
2
approximately 150,000 people in the U.S., although this is declining. A combination of factors have and will continue to result in a decline in coal usage and
production and the concomitant coal-related employment, which include: 1) price pressure from natural gas (U.S. EIA, 2014b) and renewable energy technologies such as wind (Wiser and Bolinger, 2013) and solar photovoltaic (PV) technology (Branker et al., 2011), 2) increasingly stringent environmental regulations such as the Mercury and Air Toxic Standards (MATS) (U.S. EIA, 2014b), Cross-State Air Pollution Rule (CSAPR) (U.S. EIA, 2014a; EPA, 2014) and the Clean Power Plan Proposed Rule (U.S. EIA, 2014a; Federal Register, 2014), 3) aging coal-fired power plants (U.S. EIA, 2013c; Mufson, 2014), 4) slow growth in electricity demand (U.S. EIA, 2014a), 5) rising mine-mouth prices due to decreasing productivity (U.S. EIA, 2014b), and 6) poor public perception of the coal industry (Jacobe, 2013). Finally, and perhaps most importantly, there is a growing threat of liability due to inherent greenhouse gas emissions that come from coal combustion (Allen, 2003; Allen & Lord, 2004; Kunreuther & Michel-Kerjan, 2007; Stott et al., 2013). The potential liability is so large, this alone could threaten the existence of the coal industry in the U.S. as a whole (Heidari and Pearce, 2016).
These factors all contribute to a decline in profitability for continuing to operate coal-fired power plants in both the near and long term. This reduced profitably is driving a decline in coal plants in the U.S. For example, between 2010 and 2012, 14 GW of coal-fired capacity was retired and the EIA’s 2014 Annual Energy Outlook projects that a total of 60 GW will be retired by 2020 (U.S. EIA, 2014c). The coal mining industry has been weathering the decline in domestic demand by increasing export (with China and India being the primary importers). This method has been bottlenecked by the lack of export terminals resulting in a push to construct rail lines and export terminals on the coast of the Pacific Northwest. However, these plans have met resistance from the public, Native American tribes, environmental organizations, and now they are also threatened by falling coal prices in Asia and anti-pollution efforts in China (Davis, 2013; Roberts, 2013; Lynch, 2014). In short, the future of the U.S. domestic coal industry is not bright. Both from an economic and an environmental viewpoint, a reverse seniority phase-out model is recommended for coal-fired power plant retirement where the oldest plants (and often the least efficient and most polluting) are retired first.
There is a concern in the public and in particular in regions heavily dependent on coal employment that policy should be developed to ensure a smooth transition to other employment for coal workers whose jobs will be eliminated. The decline in employment in the coal industry is not a new problem and thus the industry has not been attracting many young workers. This is somewhat fortunate, as now the average age of the coal-fired power plants workforce is 48 years, the reduction in number of coal-fired power plants is timely with personnel approaching retirement age (Krishnan & Associates, 2007). In the short term, the remaining workforce can then be shifted to younger generating units minimizing the retraining and layoffs needed for coal power plant workers. This would incur moving and relocation costs for workers. However, in the medium and long term the eventual phase-out of coal-fired power plants means there will be a need to find employment for coal workers outside of the coal industry (Elliot, 2015). Fortunately, there is one energy industry sector growing at an incredible rate - solar photovoltaic technology that converts sunlight directly into electricity. As solar can be implemented everywhere in the U.S. the need for relocation would be minimized. PV technology has both the scalability, high employment potential and long-term environmental impact to provide a sustainable source of electricity to meet humanity’s present and future needs (Pearce, 2002). Since the rapid decrease in the costs of solar PV (Branker et al., 2011) deployment is rising rapidly and generating a large number of jobs (Gordon, et al., 2007; Wei et al., 2010). The U.S. solar industry already employs 209,000 and is creating jobs 12 times higher than employment growth in the overall economy (Solar Foundation, 2016). In addition, solar employment is projected to grow to over 239,000
Preprint to be published: Edward P. Louie and Joshua M. Pearce. Retraining Investment for U.S. Transition from Coal to Solar Photovoltaic Employment. Energy Economics. (2016). doi:10.1016/j.eneco.2016.05.016
3
jobs in 2016 (Solar Foundation, 2016). The BLS’s more conservative projection for solar photovoltaic installers forecast employment to grow by 24% from 2012 to 2022 which is still much faster growth than the projected occupational average of 11 percent (BLS, 2014). It thus appears possible for the growth of solar PV-related employment to absorb the layoffs in the coal industry in the next 15 years. It should be pointed out that the solar PV was chosen over the other top renewable energy technologies for the following reasons: wind energy has already expanded to a large fraction of its potential in the U.S. and it is geographically limited (De Vries, et al., 2007), hydro electricity has also been largely developed in the U.S. and further hydro-development continues to be restricted by extensive and complex regulatory procedures, and environmental opposition (Bartle, 2002) and biomass on the large scale needed to replace coal would compete with food production further expanding world hunger and any bioenergy related crops would be cultivated by existing agricultural workers thus restricting the influx of coal workers (Azar et al., 2005; Senauer, 2008). PV is the only technology growing rapidly enough in the U.S. with appropriate employment modalities to absorb the potential coal employment declines.
In order to determine the viability of smooth transition from coal to PV-related employment, this paper provides an analysis of the cost to retrain current coal workers for solar photovoltaic industry employment in the U.S. The current coal industry positions are determined, the skill set evaluated and the salaries tabulated. For each type of coal position, the closest equivalent PV position will be determined and then the re-training time and investment will be quantified. These values will then be applied on a state-by-state basis for coal producing states employing the bulk of coal workers as a function of time using a reverse seniority retirement program for the current American fleet of coal-powered plants. The results will be discussed and policies outlined to provide a smooth transition from coal to solar energy employment in the U.S. 2. Methods
The BLS releases an annual national industry specific occupational employment and wage estimates every year (BLS, 2014). This estimate provides a detailed view of the current coal industry positions and information on the skills, education, and salaries of each position. The U.S. Department of Energy’s SunShot Initiative (U.S. DOE, 2014) has assembled a solar career map which details jobs across the PV industry, the education, training, and skill requirements of each position, as well as possible pathways to advancement in the PV industry. This information was used to assign an equivalent PV position for each coal position, by matching existing skills, salary and educational attainment (e.g. an engineer in the coal industry matched with an engineering position in the PV industry and an office administrative position in the coal industry would be assigned a similar job in marketing, sales, and permitting in the PV industry). The amount of training needed to equip each coal worker for success in the closest matching PV job was determined based on the educational requirements detailed by the career map versus preexisting skills and knowledge. The time and cost of the required training was determined from trade schools, community colleges, license and certification requirements, and universities as detailed in the sources in the results.
The investment necessary to retrain coal workers for the PV industry is quantified for two scenarios. In the best case scenario (least expensive to retrain) all employees who work non-coal specific positions such as secretary and electrician are able to find a job outside of the PV industry, thus only those working coal specific positions such as roof bolter needs to be retrained for a position in the PV industry. In the worst case scenario (most expensive to retrain), all employees in coal mining will be absorbed into the PV industry. The number of employees by state working in coal mining (U.S. EIA,

Preprint to be published: Edward P. Louie and Joshua M. Pearce. Retraining Investment for U.S. Transition from Coal to Solar Photovoltaic Employment. Energy Economics. (2016). doi:10.1016/j.eneco.2016.05.016
4
2013a) is used with the assumption that the occupational mix and wage are the same in coal mines across states, the weighted average cost of retraining was multiplied by the number of coal employees in each state and multiplied by the fraction of the jobs that need retraining based on the scenario, the result is the investment each state would need to make in order to retrain its coal workers for jobs in the PV industry. To determine, the weighted average retraining cost per coal worker (Cav) the following terms are defined. First, Ec is the total number of coal jobs and can be given by:
Ec = Er + Enr (1) where Er is the total number of employees that need retraining and Enr is the total number of employees that need no additional training. Equation 1 can be applied for all coal workers in any given region of study (e.g. a state). As Enr will have no costs for retraining they will not be considered further. The total number of employees that need retraining can be defined as:
∑n
=iir J=E
0
(2)
where n is all the applicable jobs and Ji is the number of employee in job i. Thus Er sums up all of the employees for each coal job, which needs retraining. The average retraining cost per coal worker, which needs retrained is given by:
( )
r
n
=iiri
av E
JC=C∑ ×
0 (3)
where n is all the applicable jobs, Cri is the retraining cost for job i, and Ji is the number of employees in job i. Thus, the investment (I) needed to fund the retraining was calculated using Equation 2:
avcs CE=I × (4) where Ecs is the number of coal workers in a state, s.
These calculations were repeated for workers in coal-fired power plants in the U.S. A best and worst case scenario model was conducted for coal-fired power plant workers with the best case scenario being that the number of workers that needed to be retrained is reduced due to the timelines of plant retirement with staff retirement. The worst case scenario would be that all 60,541 employees of coal-fired power plants would have to be absorbed into the PV industry. The National Industry-Specific Occupational Employment and Wage Estimates data from the BLS on power generation covers all electric power generation, transmission, and distribution (BLS, 2014c). Thus data on occupation and employment specific to coal-fired power plants is not available. To work around this problem, power plant specific jobs were selected from the BLS data. Unlike the coal mining industry, the power plant specific jobs require skills that can be translated to jobs in the PV industry without needing retraining. For these power plant specific jobs, the number employed by specifically coal-fired power plants was calculated by multiplying the BLS value by 39%, the fraction of the electricity mix that is generated from coal. The number employed in coal-fired power plants, but hold a non-power plant specific job was determined by subtracting the total number of employees estimated to be working in coal-fired power plants, 60,541, from those working specialized jobs. All non-power plant specific jobs were assigned Solar PV Installer (residential/small commercial) because this career path can be entered by a wide variety of backgrounds, the training is solar specific, and opens the door to many different avenues for advancements.
The funds for retraining investments by each coal producing state need not to be made immediately rather the decline in coal demand and coal mining is expected to decline as coal-fired power plants reach retirement age. More than half of the coal-fired power in the U.S. comes from
Preprint to be published: Edward P. Louie and Joshua M. Pearce. Retraining Investment for U.S. Transition from Coal to Solar Photovoltaic Employment. Energy Economics. (2016). doi:10.1016/j.eneco.2016.05.016
5
plants built before 1975 thus, with the average age at which power plants retire being 57 years, half of the power plants will reach retirement age by 2030 (U.S. EIA, 2013c; U.S. EIA, 2014c). This is a conservative estimate since the design life of a coal-fired power plant is 25 years; traditionally power plants undergo refurbishment to extend the life to 40 to 50 years (IEA, 2005). Using the EIA’s data on coal-fired power plants and adding 57 years to their initial year of operation yields the expected retirement year for coal-power plants (U.S. EIA, 2013c).
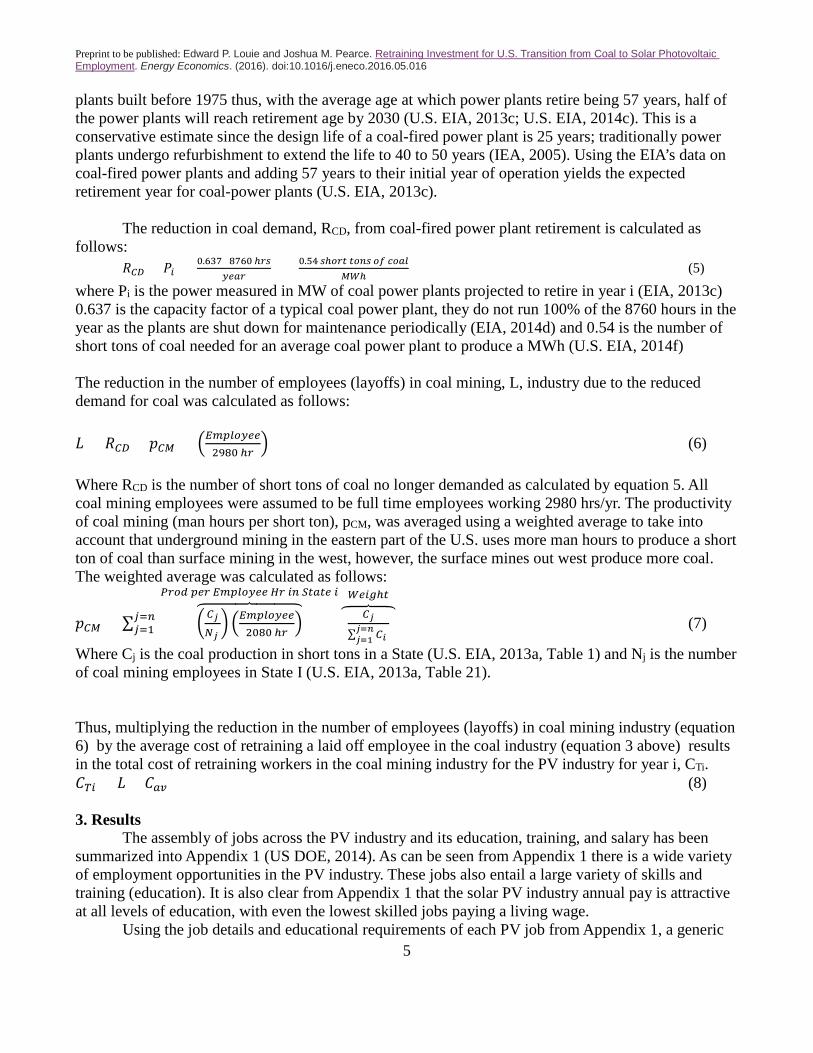
The reduction in coal demand, RCD, from coal-fired power plant retirement is calculated as follows:
𝑅𝑅𝐶𝐶𝐶𝐶 = 𝑃𝑃𝑖𝑖 × (0.637×8760 ℎ𝑟𝑟𝑟𝑟𝑦𝑦𝑦𝑦𝑦𝑦𝑟𝑟
) × (0.54 𝑟𝑟ℎ𝑜𝑜𝑟𝑟𝑜𝑜 𝑜𝑜𝑜𝑜𝑡𝑡𝑟𝑟 𝑜𝑜𝑜𝑜 𝑐𝑐𝑜𝑜𝑦𝑦𝑐𝑐𝑀𝑀𝑀𝑀ℎ
) (5)
where Pi is the power measured in MW of coal power plants projected to retire in year i (EIA, 2013c) 0.637 is the capacity factor of a typical coal power plant, they do not run 100% of the 8760 hours in the year as the plants are shut down for maintenance periodically (EIA, 2014d) and 0.54 is the number of short tons of coal needed for an average coal power plant to produce a MWh (U.S. EIA, 2014f)
The reduction in the number of employees (layoffs) in coal mining, L, industry due to the reduced demand for coal was calculated as follows: 𝐿𝐿 = 𝑅𝑅𝐶𝐶𝐶𝐶 × 𝑝𝑝𝐶𝐶𝑀𝑀 × �𝐸𝐸𝐸𝐸𝐸𝐸𝑐𝑐𝑜𝑜𝑦𝑦𝑦𝑦𝑦𝑦
2980 ℎ𝑟𝑟� (6)
Where RCD is the number of short tons of coal no longer demanded as calculated by equation 5. All coal mining employees were assumed to be full time employees working 2980 hrs/yr. The productivity of coal mining (man hours per short ton), pCM, was averaged using a weighted average to take into account that underground mining in the eastern part of the U.S. uses more man hours to produce a short ton of coal than surface mining in the west, however, the surface mines out west produce more coal. The weighted average was calculated as follows:
𝑝𝑝𝐶𝐶𝑀𝑀 = ∑ [ �𝐶𝐶𝑗𝑗𝑁𝑁𝑗𝑗 � �𝐸𝐸𝐸𝐸𝐸𝐸𝑐𝑐𝑜𝑜𝑦𝑦𝑦𝑦𝑦𝑦
2080 ℎ𝑟𝑟�
�����������𝑃𝑃𝑟𝑟𝑜𝑜𝑃𝑃 𝐸𝐸𝑦𝑦𝑟𝑟 𝐸𝐸𝐸𝐸𝐸𝐸𝑐𝑐𝑜𝑜𝑦𝑦𝑦𝑦𝑦𝑦 𝐻𝐻𝑟𝑟 𝑖𝑖𝑡𝑡 𝑆𝑆𝑜𝑜𝑦𝑦𝑜𝑜𝑦𝑦 𝑖𝑖
( 𝐶𝐶𝑗𝑗∑ 𝐶𝐶𝑖𝑖 𝑗𝑗=𝑛𝑛𝑗𝑗=1
)�����𝑀𝑀𝑦𝑦𝑖𝑖𝑊𝑊ℎ𝑜𝑜
𝑗𝑗=𝑡𝑡𝑗𝑗=1 ] (7)
Where Cj is the coal production in short tons in a State (U.S. EIA, 2013a, Table 1) and Nj is the number of coal mining employees in State I (U.S. EIA, 2013a, Table 21). Thus, multiplying the reduction in the number of employees (layoffs) in coal mining industry (equation 6) by the average cost of retraining a laid off employee in the coal industry (equation 3 above) results in the total cost of retraining workers in the coal mining industry for the PV industry for year i, CTi. 𝐶𝐶𝑇𝑇𝑖𝑖 = 𝐿𝐿 × 𝐶𝐶𝑦𝑦𝑎𝑎 (8) 3. Results
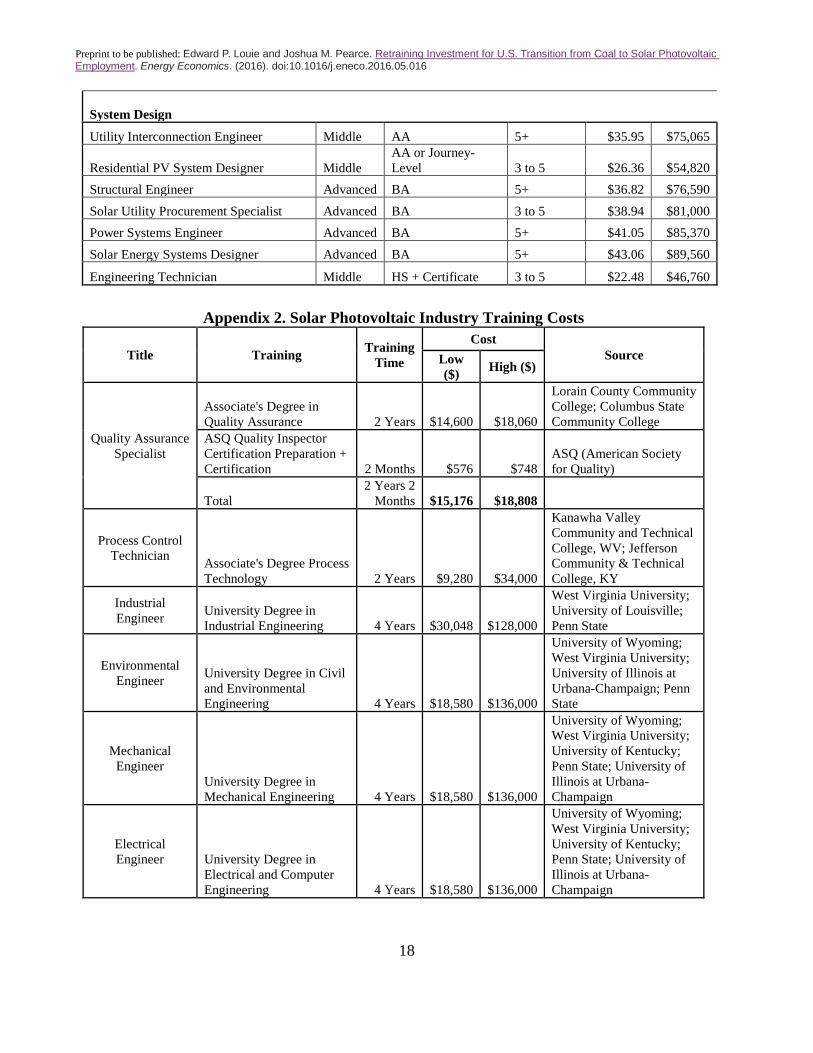
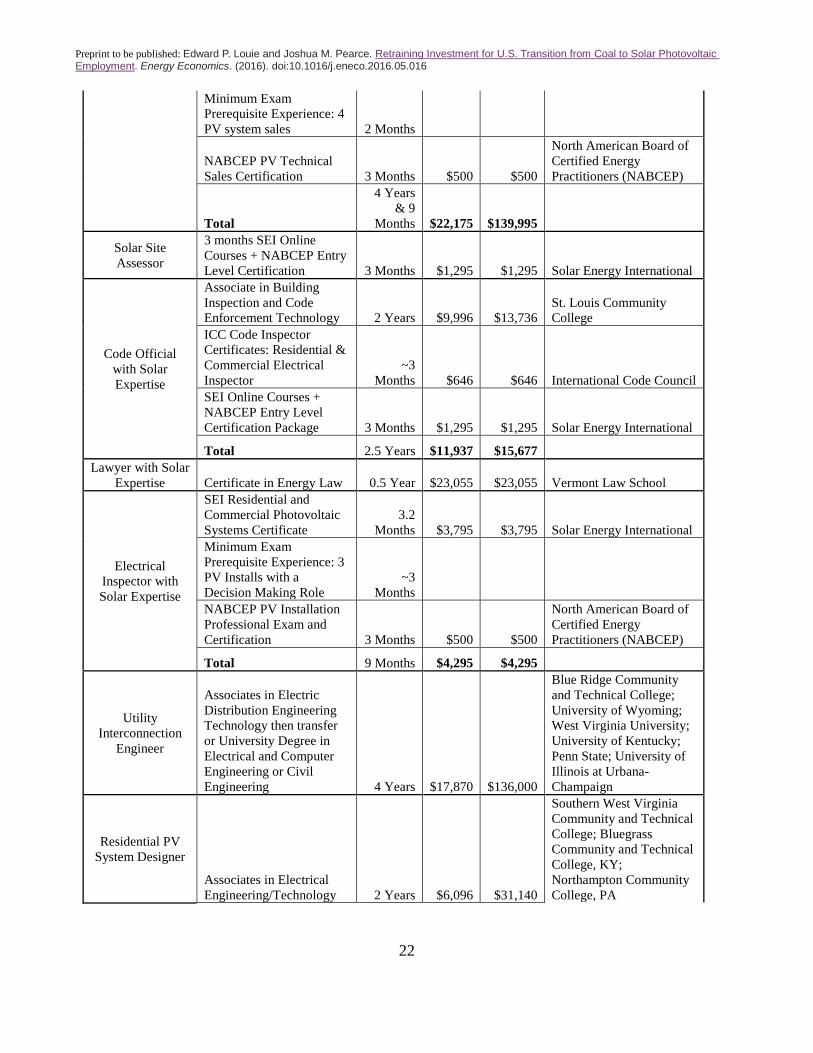
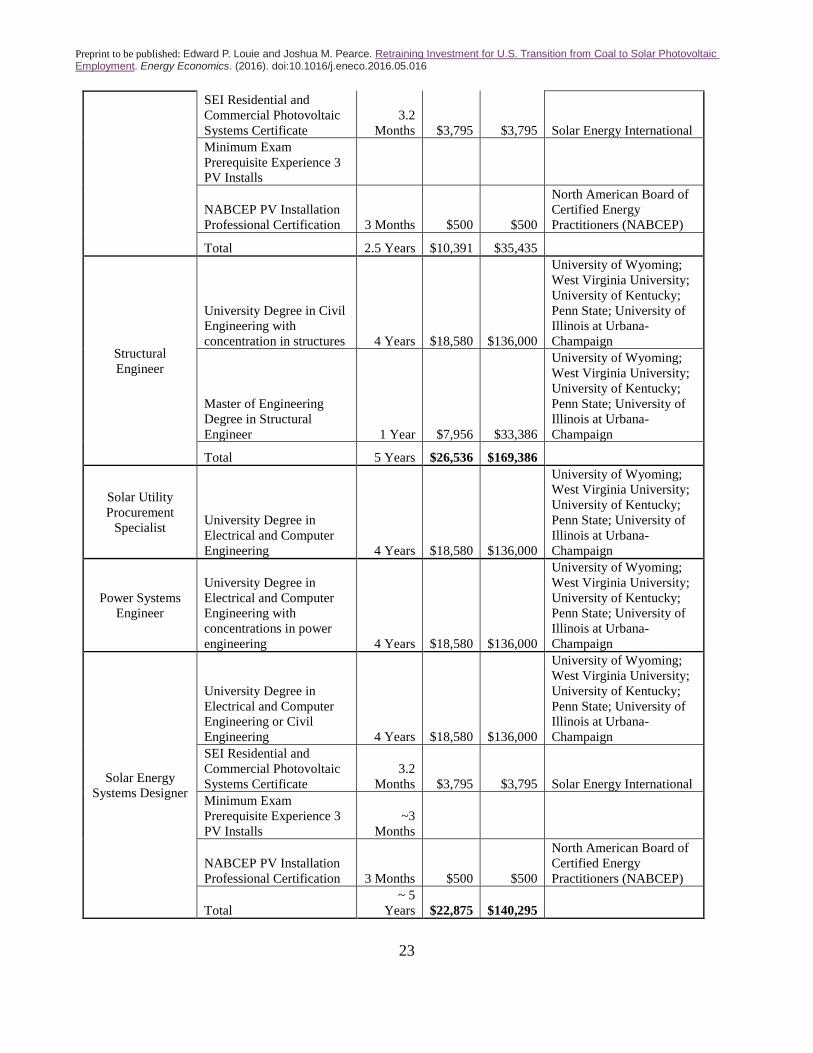
The assembly of jobs across the PV industry and its education, training, and salary has been summarized into Appendix 1 (US DOE, 2014). As can be seen from Appendix 1 there is a wide variety of employment opportunities in the PV industry. These jobs also entail a large variety of skills and training (education). It is also clear from Appendix 1 that the solar PV industry annual pay is attractive at all levels of education, with even the lowest skilled jobs paying a living wage.
Using the job details and educational requirements of each PV job from Appendix 1, a generic

Preprint to be published: Edward P. Louie and Joshua M. Pearce. Retraining Investment for U.S. Transition from Coal to Solar Photovoltaic Employment. Energy Economics. (2016). doi:10.1016/j.eneco.2016.05.016
6
time and cost to train the typical coal industry positions assigned for success in each PV industry position was assembled as shown in Appendix 2. As can be seen in Appendix 2 high and low cost estimates were made for each training requirement, whenever possible using training available in coal states. Adjustments were occasionally made when assigning retraining costs from Appendix 2 to each coal job in Appendix 3 to take into account the preexisting level of education and training required by each coal industry position. A structural engineer in the coal industry, for example, would not need further training to work as a structural engineer in the PV industry. As can be seen in Appendix 2, the cost of retraining ranged from a few thousands to over a hundred thousand dollars. Thus, the cost of retraining are not trivial for some of the individual coal employees and could be financially burdensome for an individual to pursue themselves. Additionally, as can be seen in Appendix 2, the time necessary for retraining ranges from several months up to 9 years and this assumes one is dedicated to such training. It is clear that transition from work in the coal industry to the PV industry would be much more seamless if coal workers begin retraining years before the need to switch careers because of layoffs.
The BLS survey of the coal mining industry revealed that only 30-35% of the coal mining job positions are industry specific. Appendix 3, which shows the employment transition between coal mining and PV employment, is sorted such that the jobs identified as needing retraining in even the best case scenario appear first and are identified with a Y in the Training column. Thus, in the best case scenario (lowest cost), only 35% of the coal mine employees will need to be retrained. It is also clear from Appendix 3, that many jobs in the coal industry that have low educational requirements pay relatively well for unskilled (or low-skilled) work. Thus, many of the coal-specific employees will need to go back to school for additional education in order to qualify for jobs with equivalent salaries in the PV industry.
Three titles in the DOE’s PV jobs list (Appendix 1) were not assigned to any positions in the BLS list of jobs (Appendix 3), these included building inspector, lawyer, and electrical inspector with solar expertise. These positions are excluded because the BLS’s survey of coal mining jobs did not find a building inspector, lawyer, or an electrical inspector employed by the coal mining industry. This is not to say none exist. As a result, Appendix 2 still details the additional training a building inspector, lawyer, and electrical inspector would need in order to become one with solar expertise also. Additionally, the material scientist job in the PV industry was also not assigned to any employees in the coal industry due to a lack of qualified personnel.
For coal-fired power plants, 43% (or 26,060 of 60,541 jobs) are power plant specific with skills which allow them to transition to the PV industry without needing further training, as shown in Appendix 4. Under the worst case scenario, the 34,481 non-power plant specific jobs that remain will require retraining to be residential/small commercial solar PV installers that will cost $4,295 per person (Appendix 2) resulting in a total retraining cost of about $148 million. It is assumed this cost would be shared by all states, and this cost was not factored into Table 1 or Figure 1 as power generated from coal-fired power plants (coal producing states also possess about 2/3 of the coal-fired power plant generating capacity in the U.S.) are not limited to just coal producing states.
Applying Equation 3, the low and high range of the retraining cost was calculated to be $5,756 and $20,660 under the best case scenario and $6,009 and $20,863 under the worst case scenario. Using Equation 8 and the EIA’s state-level coal mining employment data it was found that the cost to retrain ranged from $181 to $649 million under the best case scenario and $539 million to $1.872 billion for the entire U.S. as shown in the Table. Of all the coal producing states West Virginia will need to invest the most ($475 million) in retraining as it has the most coal miners.

Preprint to be published: Edward P. Louie and Joshua M. Pearce. Retraining Investment for U.S. Transition from Coal to Solar Photovoltaic Employment. Energy Economics. (2016). doi:10.1016/j.eneco.2016.05.016
7
Table 1. Retaining Investments Required for Transition to Solar Economy in Coal Producing States
Coal-Producing
State
2012 Average Number of Employees by State & Mine Type
Best Case Scenario Worst Case Scenario
Underground Surface Total Low High Low High Alabama 3,190 1,851 5,041 $10,155,599 $36,451,471 $30,291,369 $105,171,290
Alaska - 143 143 $288,088 $1,034,033 $859,287 $2,983,435
Arizona - 432 432 $870,307 $3,123,792 $2,595,888 $9,012,894
Arkansas 70 3 73 $147,066 $527,863 $438,657 $1,523,012
Colorado 2,032 473 2,505 $5,046,573 $18,113,655 $15,052,545 $52,262,266
Illinois 3,938 574 4,512 $9,089,875 $32,626,272 $27,112,608 $94,134,668
Indiana 2,054 1,881 3,935 $7,927,451 $28,453,985 $23,645,415 $82,096,613
Kansas - 6 6 $12,088 $43,386 $36,054 $125,179
Kentucky 11,181 5,170 16,351 $32,940,725 $118,234,081 $98,253,159 $341,133,856
Louisiana - 270 270 $543,942 $1,952,370 $1,622,430 $5,633,059
Maryland 213 263 476 $958,950 $3,441,956 $2,860,284 $9,930,874
Mississippi - 211 211 $425,081 $1,525,741 $1,267,899 $4,402,131
Missouri - 32 32 $64,467 $231,392 $192,288 $667,622
Montana 320 913 1,233 $2,484,002 $8,915,823 $7,409,097 $25,724,301
New Mexico 435 856 1,291 $2,600,849 $9,335,221 $7,757,619 $26,934,365
North Dakota
- 1,228 1,228 $2,473,929 $8,879,668 $7,379,052 $25,619,985
Ohio 1,969 1,222 3,191 $6,428,589 $23,074,121 $19,174,719 $66,574,407
Oklahoma 55 144 199 $400,905 $1,438,969 $1,195,791 $4,151,773
Pennsylvania 6,120 2,807 8,927 $17,984,334 $64,551,137 $53,642,343 $186,245,608
Tennessee 175 188 363 $731,300 $2,624,853 $2,181,267 $7,573,334
Texas - 2,918 2,918 $5,878,603 $21,100,058 $17,534,262 $60,878,759
Utah 1,576 35 1,611 $3,245,521 $11,649,141 $9,680,499 $33,610,583
Virginia 3,763 1,235 4,998 $10,068,971 $36,140,538 $30,032,982 $104,274,174
West Virginia
17,085 5,701 22,786 $45,904,676 $164,765,566 $136,921,074 $475,388,419
Wyoming 250 6,754 7,004 $14,110,258 $50,645,924 $42,087,036 $146,125,713
Total 54,426 35,310 89,736 $180,782,146 $648,881,016 $539,223,624 $1,872,178,320
Coal producing States should invest in funding the cost of retraining ideally years before the
retirement of power plants so workers can go directly from one job to the next with no delay, but if the investments are made in parallel with the retirement of coal-fired power plants then the year at which funds need to be available is shown in Figure 1. As shown in Figure 1, most of the retraining investments will have to be made between now and 2040, if the age of coal plant retirement plan is used. It should be noted here that this is an optimistic approximation for coal industry longevity and assumes none of the coal-related externalities are incorporated into the market. While the shape of the

Preprint to be published: Edward P. Louie and Joshua M. Pearce. Retraining Investment for U.S. Transition from Coal to Solar Photovoltaic Employment. Energy Economics. (2016). doi:10.1016/j.eneco.2016.05.016
8
curves in Figure 1 is a good estimate, resolution was lost due to the averaging of coal production (short tons) per employee-hr, thus for actual dollar amounts the values in Table 1 are more representative and should be used for policy formation.
Figure 1. MW of power plants retired and retraining costs, and coal-fired power plants retirements per year.
4. Discussion As can be seen in Table 1 for the low best case scenario, if it is assumed that only coal-specific jobs require retraining only $180 million is needed in the event of the complete elimination of the coal industry. In the worst case high estimate this retraining cost is expanded by a factor of ten. To cover these costs four policy scenarios are considered and their impacts discussed: i) employees pay for their own retraining, ii) the coal industry pays for their employee retraining, iii) programs are established in individual states to provide this training, and iv) the U.S. federal government funds the coal to solar transition. 4.1 Coal Employees Self-fund Retraining In this status-quo scenario coal employees must shoulder the entire burden of retaining themselves when their employer closes the mine or power plant and no policy intervention is necessary. As stated above many coal employees are old and will simply retire early with less retirement income as the prospect of going to school for several years to match their current income so near retirement will not be appealing. Young unskilled coal workers with jobs specific to the coal industry will be the most severely financially penalized by this scenario. For example, even in their best case scenario, mine shuttle car operators would lose nearly half of their income even after being unemployed for 3 months to train as mechanical assemblers. Coal workers that prepare for the loss of their coal jobs by,

Preprint to be published: Edward P. Louie and Joshua M. Pearce. Retraining Investment for U.S. Transition from Coal to Solar Photovoltaic Employment. Energy Economics. (2016). doi:10.1016/j.eneco.2016.05.016
9
for example, training in the evenings, use vacation time and the weekends will be in a much better position than their colleagues that wait to retrain until after becoming unemployed. As some of the costs of retraining can be substantial for individuals, considering their future employment and investing in retaining for green jobs in the solar industry while they still have an income is important. It should be noted that the transition from coal to PV jobs would not be occurring in a vacuum and it is likely that the coal workers will have competition for increasingly prized ‘green jobs’ (Greenhouse, 2008; Engel & Kammen, 2009; Wei et al. 2010; Bowen, 2012; Lehr et al., 2012; Yi, 2013).
This scenario has the advantage that it will not cost the coal industry, state and federal government anything, but has the disadvantage (from a coal employer perspective) that attracting young coal workers (e.g. generation Z) will be even more difficult than it is already. Generation Z are loosely defined as those born after 1995 and who are now 18 and under. Generation Z represents the future of the energy industry, who are currently making the decision on the type of training for their future careers. A recent marketing study found a distinct break in the attitudes of the more materialistic and narcissistic Generation Y, with 60% of Gen Zers wanting jobs that had a social impact, about double those of Generation Y (Sparks and Honey, 2014). As the coal industry is already suffering public perception challenges (e.g. a 2008 MIT Energy Survey found substantial majorities of Americans oppose the location of coal power plants in their area (Ansolabehere & Konisky, 2009)), the coal industry already suffers from a reduced pool of potential workers and thus lower quality potential employees from which to hire. As this trend continues in the future, inferior workers would be expected to further depress productivity thereby hastening mine and plant closings because they would no longer be economically competitive.
4.2 Policies Promoting Coal Industry Paying for Employee Retraining In the second scenario, the coal industry is either mandated to pay for their employee retraining or chooses to do so on their own. In this scenario the coal industry would be financially burdened to set aside a fraction of their income over a number of years to ensure that all of their employees could find employment when the mine or power plant closed. The industry could either arrange for this financial burden to be shared as a whole through an insurance-like program or each individual company could be responsible for retraining their own employees. There is some precedence for such a program in the industry. For example, the Surface Mining Control and Reclamation Act of 1977, mandates that active mining operations pay fees into the Abandoned Mine Reclamation Fund that are then used to finance reclamation of abandoned mine lands (US. DOI OSMRE, 2014). Financing a “Coal Employee Retraining Fund” could operate in much the same way.
Although the overall training costs are substantial as seen in Figure 1 and Table 1, these burdens need to be put into perspective. According to the National Mining Association, coal mining activity generated $37.4 billion in direct GDP in the U.S. 2011 (2013). Thus, even in the high estimate worst case scenario where all coal-workers need to be retrained specifically for the solar industry using the most expensive training available the $1.8 billion total retraining investment is only 5% of coal mining’s economic impact for a single year. Summarizing many studies that investigated coal industry subsidies Badcock and Lenzen (2010) found coal-fired power has benefited from over $38 billion in U.S. financial subsidies between 1994 and 2008. Again, this puts the training requirement in context as the coal industry would need to invest what amounts to less than 5% of what it has received in government aid over that period. Although the political viability of such mandates occurring at either the State and/or Federal levels are outside the scope of this paper, governments may consider such mandates on the coal industry either as a way to maintain employment without spending taxpayer money or as a way to
Preprint to be published: Edward P. Louie and Joshua M. Pearce. Retraining Investment for U.S. Transition from Coal to Solar Photovoltaic Employment. Energy Economics. (2016). doi:10.1016/j.eneco.2016.05.016
10
recoup subsidies of environmental externalities. Similar to what has been found with financial subsidies, the absolute external costs of coal-fired power are much larger than those of competing electricity-generation technologies (Koplow & Dernbach, 2001; Badcock & Lenzen, 2010). There are several externalities associated with coal including reduction in life expectancy, increased hospital admissions, degradation and soiling of buildings, reduction in crop yields, ecosystem loss and degradation, and global warming, which makes up 80% by an estimate of the controversial costs of future climate change (European Commission, 1995;1999). The externalities associated with the coal industry completely dwarf and training costs. For example, the Koplow and Dernbach (2001) analysis found annual externalities of around $420 billion for the U.S. alone. A more recent comprehensive review of the externalities associated with the coal industry (Epstein, et al., 2011) finds that the best estimate for the total economically quantifiable costs, based on a conservative weighting, amount to some $345.3 billion, adding close to 17.8¢/kWh of electricity generated from coal. The Epstein et al. (2011) low estimate is $175 billion, or over 9¢/kWh, which is nearly at the current U.S. electrical retail cost. The study points out that the true monetizable costs of coal-fired electricity could be as much as the upper bounds of $523.3 billion, adding close to 26.89¢/kWh, which is more expensive than any residential electric rate in the nation. As these quantifiable externalities are borne by the general public, the relatively modest investment to retrain all of the coal industry’s employees for positions in the PV industry may in the future become politically feasible. However, no legal mandate may be necessary for the coal industry to provide funding for the retraining of their workers. First, it should be pointed out that the coal industry is not a monolithic entity. Coal companies are competing against one another for market share and profit. As pointed out in Section 4.1 the pool of high-quality coal employees is already artificially small because of the poor public perception and the increasing public awareness of the cost of coal-related externalities. Public perception of the coal industry acting in good faith towards their workers can be extremely important as employment is the remaining primary benefit of the industry. Thus, it may not be a wise strategy to garner additional public support to have large executive compensation while thousands of low-skilled coal employee positions are being terminated. For example, using SEC filings Forbes reports that Brett Harvey, the CEO of Consol Energy was compensated over $15.5 million (Forbes, 2012), which would be more than enough to retrain all of Consol's coal employees for jobs in the PV industry. Thus, to improve public support a coal company could voluntarily slightly decrease CEO salaries to ensure their entire workforce had a socio-economically stable future. This would work best if the CEO himself made the gesture. For example, Mr. Harvey could join the club of “Dollar-a-year men”, which historically were business and government executives who helped the U.S. government mobilize and manage American industry during periods of war, especially World War I and II. More recently, many very successful executives who take a one-dollar salary also choose not to take any other forms of compensation. In addition to Harvey, the CEOs of other companies like Peabody Energy Corporation, Alliance Resource Partners, Arch Coal, Inc. and Cloud Peak Energy receive substantial compensation packages and may want to take advantage of the good will generated by such a gesture. While the companies are in business, providing the retraining of the workers could not only help partially protect coal entities from unfavorable legislation by increasing good will, but it could also directly help their competitiveness by improving company morale and enlarging the possible pool of employees to hire. This would improve the quality of potential employees and improve productivity and thus profits. There is some evidence that companies are willing to make these types of investments in other industries. Cappelli (2004) found that employers were willing to retrain workers who are at risk of layoff for new jobs was associated with preserving the social capital among current employees. Thus, employers who make greater use of work systems that rely on social capital are more likely to retrain

Preprint to be published: Edward P. Louie and Joshua M. Pearce. Retraining Investment for U.S. Transition from Coal to Solar Photovoltaic Employment. Energy Economics. (2016). doi:10.1016/j.eneco.2016.05.016
11
their workers (Cappelli, 2004). The degree of social capital necessary in the coal industry is uncertain, however, such employee-friendly policies would be expected to lift morale within the company and ensure higher productivity until the end. The policy implementation could use means such as: scholarships, education vouchers and grants for employees to universities, colleges, community colleges, and PV certification programs outlined in Appendix 2. 4.3 Individual States Policies to Provide “Coal to Solar” Transition Programs As it is becoming more clear that energy policy needs to be informed by dynamic life cycle carbon emissions (Kenny et al., 2010), and federal governments appear limited in their capacity to enact meaningful policies, many of the world's governments at the State or Provincial and even municipal-level have produced policies intended to reduce coal use and improve the cost-effectiveness of renewable energy to mitigate the risks of climate change (Engel, 2006; Lutsey & Sperling, 2008; Wheeler, 2008; Rabe, 2009; Branker & Pearce, 2010; Bierbaum et al., 2013). Considering the far more aggressive and expensive policy changes to enable a transition to renewable energy a policy of funding coal employee retraining to keep these workers relevant in the next twenty years appears possible. The investments necessary for the individual coal-producing States are summarized in Table 1, and are well within any of the State discretionary budgets. Implementation of a State-level policy for coal worker retraining would benefit similarly to case 1, where pre-emptive action would cost less in the long term so the state could avoid unemployment benefits for coal workers that could directly transition to PV jobs. Implementation of the retraining could take several forms: i) scholarships, education vouchers and grants for coal employees to State universities, colleges and community colleges, ii) subsidized expansion of solar industry training such as the workshops and classes provided by entities like SEI, iii) State sponsored free courses and certificates for PV positions, and iv) no, low-interest or subsidized loans for education and retraining. 4.4 U.S. Federal Government Policy to Fund the Coal to Solar Transition In this scenario the U.S. federal government funds the coal to solar transition alone. The motive for the Federal government to make such an expenditure is the same as the aggregate of the State benefits outlined in Section 4.3. The costs, however, are also the aggregate and summarized in the bottom row of Table 1. Even if completely subsidized by the federal government these figures (ranging from $180 million to $1.87 billion) are trivial compared to the United States government budget of $3.445 trillion in fiscal year 2013 with 2.775 trillion in receipts (United States Office of Management and Budget, 2014). This expenditure needed to maintain full employment of all present coal workers in the solar industry would be only 0.0052% and 0.0543% of the federal budget, respectfully. These values actually represent an over-estimate as the Federal government would have economies of scale to help drive down the cost of retraining. For example, the government could fund the development of open access solar PV industry curricula, which then could be used by community colleges throughout the nation to drive down the cost estimates in Appendix 2. If some (or all) of this curricula could be delivered in an online environment it would allow coal employees to complete the training at night or during the weekends while they maintained their current positions. The Federal Government would also be in a position to negotiate reduced rates for coal-employee cohorts to obtain university degrees from both state and private universities. The implementation of the retraining could follow the same policy mechanisms used by the states individually, however, they would be scalable to the entire
Preprint to be published: Edward P. Louie and Joshua M. Pearce. Retraining Investment for U.S. Transition from Coal to Solar Photovoltaic Employment. Energy Economics. (2016). doi:10.1016/j.eneco.2016.05.016
12
nation, which would allow the lowest cost retraining option to be utilized. 5. Limitations and Future Work This study had several limitations. First, the selection of closest positions between the coal and solar industry used was open to error and will in many cases be dependent on particular individual’s interests along with specific job and training opportunities. This mobility of workers from one industry to another varies widely (Judy & D’Amico, 1997) although the ability for remote education is enabling more mobility in some sectors (Denkenberger, et al., 2015). As noted earlier there is substantial online training possible in the solar industry. Although individual workers transition may be different than those outlined here, the aggregate values generated, however, are reasonable and adequate for policy making.
In addition, this study assumed that the occupational mix was approximately the same from state to state, however, depending on the type of coal-related work in a given state this could vary and should be quantified in future work. The largest limitation for this study is the assumption that coal fired power plants will only be closed following the retirement strategy based on age shown in Figure 1. This assumption is likely extremely optimistic as the forces driving coal’s lack of economic competitiveness are likely to accelerate plant closings beyond simple age. For example, in the last year Patriot Coal Corp., Walter Energy Inc. and Alpha Natural Resources Inc. along with Arch Coal Inc., the second largest coal miner in the U.S., have filed for bankruptcy (Klein and Loh, 2016). In addition, the market cap for publicly trade U.S. coal miners has decreased by more than a factor of ten in the last 5 years (Klein and Loh, 2016). In addition, Forbes has pointed out that the COP21 climate change conference could further weaken coal companies financially (Trefis, 2015) and this could be further exacerbated if they begin to held liable for the costs of climate change (Allen, 2003; Heidari and Pearce, 2016) the entire industry would be shut down in a short time period and Figure 1 would look more like a step function. If this is the case, the full costs of the retraining summarized in Table 1 would need invested on a shorter timeline, however, as shown in Section 4, in all but the first scenario (worker funded) the cost is small compared to the revenue of the funders. 6. Conclusions As the coal industry in the U.S. declines and the PV industry expands, this study quantified the costs of retraining all coal-industry employees for jobs in the solar photovoltaic industry. To cover these costs four policy scenarios are considered and their impacts discussed: i) employees pay for their own retraining, ii) the coal industry pays for their employee retraining, iii) programs are established in individual states to provide this training, and iv) the U.S. federal government funds the coal to solar transition. The benefits and drawbacks of each scenario are outlined. Even if completely subsidized by the federal government these figures (ranging from $180 million to $1.87 billion) would be only amount to 0.0052% and 0.0543% of the U.S. federal budget, respectfully. Coal to PV transition retraining could be implemented as: i) scholarships, education vouchers and grants for coal employees to universities, colleges, community colleges and certification programs, ii) subsidized expansion of solar industry training such as the workshops and on-line classes, iii) government-sponsored free courses and certificates for PV positions, and iv) no, low-interest or subsidized loans for education and retraining. 7. References Allen, M. (2003). Liability for climate change. Nature, 421(6926), 891-892.

Preprint to be published: Edward P. Louie and Joshua M. Pearce. Retraining Investment for U.S. Transition from Coal to Solar Photovoltaic Employment. Energy Economics. (2016). doi:10.1016/j.eneco.2016.05.016
13
Allen, M. R., & Lord, R. (2004). The blame game. Nature, 432(7017), 551-552. Ansolabehere, S., & Konisky, D. M. (2009). Public attitudes toward construction of new power plants.
Public Opinion Quarterly, 73(3), 566-577. Azar, C., Simpson, R. D., Toman, M. A., & Ayres, R. U. (2005). Emerging scarcities-bioenergy-food
competition in a carbon constrained world. Scarcity and growth revisited: Natural resources and the environment in the new millennium, 98-120.
Badcock, J., & Lenzen, M. (2010). Subsidies for electricity-generating technologies: A review. Energy Policy, 38(9), 5038-5047.
Bartle, A. (2002). Hydropower potential and development activities. Energy Policy, 30(14), 1231-1239. Beamon, A. J., & Leckey, T. J. (1999, September 9). Trends in Power Plant Operating Costs. Issues in
Midterm Analysis and Forecasting 1999. Retrieved August 6, 2014, from http://www.eia.gov/oiaf/issues/power_plant.html
Bierbaum, R., Smith, J. B., Lee, A., Blair, M., Carter, L., Chapin III, F. S., Fleming, P., Ruffo, S., Stults, M., McNeeley, S., Wasley, E., & Verduzco, L. (2013). A comprehensive review of climate adaptation in the United States: more than before, but less than needed. Mitigation and Adaptation Strategies for Global Change, 18(3), 361-406.
Bowen, A. (2012). 'Green'growth,'green'jobs and labor markets. World bank policy research working paper, (5990).
Branker, K., & Pearce, J. M. (2010). Financial return for government support of large-scale thin-film solar photovoltaic manufacturing in Canada. Energy Policy, 38(8), 4291-4303.
Branker, K., Pathak, M. J. M., & Pearce, J. M. (2011). A review of solar photovoltaic levelized cost of electricity. Renewable and Sustainable Energy Reviews, 15(9), 4470-4482.
Bureau of Labor Statistics. (2014a). NAICS 212100 - Coal Mining. In May 2013 National Industry-Specific Occupational Employment and Wage Estimates. Retrieved July 27, 2014 from http://www.bls.gov/oes/current/naics4_212100.htm
Bureau of Labor Statistics. (2014b). Solar Photovoltaic Installers. In Occupational Outlook Handbook. Retrieved August 1, 2014 from http://www.bls.gov/ooh/construction-and-extraction/solar-photovoltaic-installers.htm#tab-6
Bureau of Labor Statistics. (2014c). NAICS 221100 - Electric Power Generation, Transmission and Distribution. In May 2013 National Industry-Specific Occupational Employment and Wage Estimates. Retrieved August 8, 2014 from http://www.bls.gov/oes/current/naics4_221100.htm
Cappelli, P. (2004). Why Do Employers Retrain At‐Risk Workers? The Role of Social Capital. Industrial Relations: A Journal of Economy and Society, 43(2), 421-447.
Davis, R. (2013, December 13). Viability of Oregon, Washington coal export terminals threatened by falling Asian prices. The Oregonian. Retrieved August 4, 2014 from http://blog.oregonlive.com/environment_impact/print.html?entry=/2013/12/viability_of_oregon_washington.html
Denkenberger, D., Way, J., & Pearce, J. M. (2015). Educational Pathways to Remote Employment in Isolated Communities. Journal of Human Security, 11(1), 34-44.
Elliott, D. (2015). Green Jobs and the Ethics of Energy. In Ethical Engineering for International Development and Environmental Sustainability (pp. 141-164). Springer London.
Engel, K. (2006). State and local climate change initiatives: what is motivating state and local governments to address a global problem and what does this say about federalism and environmental law. Urb. Law., 38, 1015.
European Commission. (1995). ExternE—Externalities of energy, vol. 3 Coal & Lignite. European Commission, Directorate-General XII, Science, Research and Development, Luxembourg.

Preprint to be published: Edward P. Louie and Joshua M. Pearce. Retraining Investment for U.S. Transition from Coal to Solar Photovoltaic Employment. Energy Economics. (2016). doi:10.1016/j.eneco.2016.05.016
14
European Commission. (1999). ExternE—Externalities of energy, vols. 1–10. European Commission, Directorate-General XII, Science, Research and Development, Luxembourg. Engel, D., & Kammen, D. M. (2009). Green jobs and the clean energy economy. Copenhagen Climate Council. Epstein, P. R., Buonocore, J. J., Eckerle, K., Hendryx, M., Stout III, B. M., Heinberg, R., Clapp, R.., May, B., R. N.L., Ahern, M.M., Doshi, S.K. & Glustrom, L. (2011). Full cost accounting for the life cycle of coal. Annals of the New York Academy of Sciences, 1219(1), 73-98. Federal Register. (2014). Carbon Pollution Emission Guidelines for Existing Stationary Sources:
Electric Utility Generating Units A Proposed Rule by the Environmental Protection Agency. Retrieved August 6, 2014 from: https://www.federalregister.gov/articles/2014/06/18/2014-13726/carbon-pollution-emission-guidelines-for-existing-stationary-sources-electric-utility-generating#h-9
Forbes. (2012). CEO Compensation. #97 Brett Harvey. Retrieved August 16, 2014 from http://www.forbes.com/lists/2012/12/ceo-compensation-12_J-Brett-Harvey_33BV.html
Gordon, K., Hays, J., Sompolinsky, L., Tan, E., & Tsou, J. (2007). Community Jobs in The Green Economy. Apollo Alliance: Urban Habitat
Greenhouse, S. (2008, March 26). Millions of jobs of a different collar. New York Times. Retrieved August 16, 2014 from http://www.nytimes.com/2008/03/26/business/businessspecial2/26collar.html?pagewanted=all
Heidari, N. and Pearce, J.M. (2016) A review of greenhouse gas emission liabilities as the value of renewable energy for mitigating lawsuits for climate change related damages. Renewable and Sustainable Energy Reviews, 55, 899-908.
Jacobe, D. (2013). Americans Want More Emphasis on Solar, Wind, Natural Gas Oil, nuclear, and coal are more popular with Republicans and in the South. Gallup. Retrieved August 5, 2014 from http://www.gallup.com/poll/161519/americans-emphasis-solar-wind-natural-gas.aspx
Judy, R. W., & D'Amico, C. (1997). Workforce 2020: Work and Workers in the 21st Century. Hudson Institute, Indianapolis.
Kenny, R., Law, C., & Pearce, J. M. (2010). Towards real energy economics: energy policy driven by life-cycle carbon emission. Energy Policy, 38(4), 1969-1978.
Klien, J.X. and Loh, T. The Coal Miner ‘On Everybody;s List’ as Next Bankruptcy Victim. Bloomberg Business. 1.20.2016. Retrieved March 21, 2016 from: http://www.bloomberg.com/news/articles/2016-01-21/the-coal-miner-on-everybody-s-list-as-next-bankruptcy-victim
Koplow, D. & Dernbach. J. (2011). Federal fossil fuel subsidies and greenhouse gas emissions: a case study. Annual Review of Energy and Environment, 21, 361–389
Krishnan, R. & Associates. (2007). Easing the Exodus: Innovative Personnel Strategies Can Combat The Loss Of Technical Skills. Penn Energy Jobs, 2, 2-7. Retrieved August 5, 2014 from http://www.krishnaninc.com/Tech_Paper_KA_Recruiting_Article.pdf
Kunreuther, H. C., & Michel-Kerjan, E. O. (2007). Climate change, insurability of large-scale disasters and the emerging liability challenge (No. w12821). National Bureau of Economic Research.
Lehr, U., Lutz, C., & Edler, D. (2012). Green jobs? Economic impacts of renewable energy in Germany. Energy Policy, 47, 358-364.
Lutsey, N., & Sperling, D. (2008). America's bottom-up climate change mitigation policy. Energy Policy, 36(2), 673-685.
Lynch, D. J. (2014). China’s Clean-Fuel Focus Tests U.S. Coal-Export Lifeline: Energy. Retrieved August 6, 2014 from http://www.bloomberg.com/news/2014-06-10/china-s-clean-fuel-focus-
Preprint to be published: Edward P. Louie and Joshua M. Pearce. Retraining Investment for U.S. Transition from Coal to Solar Photovoltaic Employment. Energy Economics. (2016). doi:10.1016/j.eneco.2016.05.016
15
tests-u-s-coal-export-lifeline.html Mufson, S. (2014). Vintage U.S. coal-fired power plants now an ‘aging fleet of clunkers’. The
Washington Post. Retrieved August 4, 2014 from http://www.washingtonpost.com/business/economy/a-dilemma-with-aging-coal-plants-retire-them-or-restore-them/2014/06/13/8914780a-f00a-11e3-914c-1fbd0614e2d4_story.html
National Mining Association. (2013). The Economic Contributions of U.S. Mining (2011), September 2013. Retrieved August 18, 2014 from http://www.nma.org/pdf/economic_contributions.pdf
Pearce, J. M. (2002). Photovoltaics—a path to sustainable futures. Futures, 34(7), 663-674. Rabe, B. G. (2009). Second-generation climate policies in the states: proliferation, diffusion, and
regionalization. Changing climates in North American Politics: institutions, policymaking, and multilevel governance. MIT Press, Cambridge, 67-86.
Roberts, D. (2013). Goldman Sachs says coal-export terminals are a bad investment. Grist. Retrieved August 4, 2014 from http://grist.org/climate-energy/goldman-sachs-says-coal-export-terminals-are-a-bad-investment/
Senauer, B. (2008). Food market effects of a global resource shift toward bioenergy. American Journal
of Agricultural Economics, 90(5), 1226-1232. Singh V. & Fehrs J. (2001). The Work That Goes Into Renewable Energy. Renewable Energy Policy
Project, 13. Retrieved August 4, 2014 from http://www.globalurban.org/The_Work_that_Goes_into_Renewable_Energy.pdf
The Solar Foundation. (2016). 2015 National Solar Jobs Census . Retrieved 3.24.2016 from Solar Foundation, 2016 http://www.thesolarfoundation.org/wp-content/uploads/2016/01/2015Census-Factsheet-FINAL1-12-16.pdf
Sparks & Honey Agency. (2014). Meet Generation Z: Forget everything you learned about Millennials. Spark and Honey. Retrieved August 15, 2014 from http://www.slideshare.net/sparksandhoney/generation-z-final-june-17
Stott, P. A., Allen, M., Christidis, N., Dole, R. M., Hoerling, M., Huntingford, C, Pall, P. Perlwitz, J. & Stone, D. (2013). Attribution of weather and climate-related events. In Climate Science for Serving Society (pp. 307-337). Springer Netherlands.
Trefis, I. (2015) Paris Climate Agreement Spells Trouble For Coal. Forbes Investing. Dec. 17, 2015.
Retrieved March 21, 2016 from: http://www.forbes.com/sites/greatspeculations/2015/12/17/paris-climate-agreement-spells-trouble-for-coal/#10a7dd42ea43
U.S. Department of Energy, Office of Energy Efficiency & Renewable Energy. (2014). Solar Career
Map. Retrieved July 30, 2014 from http://energy.gov/eere/sunshot/solar-career-map U.S. Department of Interior, Office of Surface Mining Reclamation and Enforcement. (2014). Surface
Mining Control and Reclamation Act (SMCRA) 1977. In Laws, Regulations, and Guidance. Retrieved August 5, 2014 from http://www.osmre.gov/LRG.shtm
U.S. Energy Information Administration. (2014a). What is the role of coal in the United States? In Energy In Brief. Retrieved August 6, 2014 from http://www.eia.gov/energy_in_brief/article/role_coal_us.cfm
U.S. Energy Information Administration. (2014b). Market Trends: Coal. In Annual Energy Outlook 2014. Retrieved August 6, 2014 from http://www.eia.gov/forecasts/aeo/MT_coal.cfm
Preprint to be published: Edward P. Louie and Joshua M. Pearce. Retraining Investment for U.S. Transition from Coal to Solar Photovoltaic Employment. Energy Economics. (2016). doi:10.1016/j.eneco.2016.05.016
16
U.S. Energy Information Administration. (2014c). AEO2014 projects more coal-fired power plant retirements by 2016 than have been scheduled. In Today In Energy. Retrieved August 5, 2014 from http://www.eia.gov/todayinenergy/detail.cfm?id=15031
U.S. Energy Information Administration. (2014d). What is a capacity factor? In Frequently Asked Questions. Retrieved August 7, 2014 from http://www.eia.gov/tools/faqs/faq.cfm?id=187&t=3
U.S. Energy Information Administration. (2014e). Electric Power Monthly. Table 6.7.A. Capacity Factors for Utility Scale Generators Primarily Using Fossil Fuels, January 2008-May 2014. In Electric Power Monthly. Retrieved August 7, 2014 from http://www.eia.gov/electricity/monthly/epm_table_grapher.cfm?t=epmt_6_07_a
U.S. Energy Information Administration. (2014f). How much coal, natural gas, or petroleum is used to generate a kilowatt hour of electricity? In Frequently Asked Questions. Retrieved August 7, 2014 from http://www.eia.gov/tools/faqs/faq.cfm?id=667&t=2
U.S. Energy Information Administration. (2013a). Annual Coal Report 2012. Retrieved August 1, 2014 from http://www.eia.gov/coal/annual/pdf/acr.pdf
U.S. Energy Information Administration. (2013b). Table 4.3. Existing Capacity by Energy Source, 2012 (Megawatts). In Electric Power Annual. Retrieved August 4, 2014 from http://www.eia.gov/electricity/annual/html/epa_04_03.html
U.S. Energy Information Administration. (2013c). Electricity Generating Capacity. Retrieved August 4, 2014 from http://www.eia.gov/electricity/capacity/
U.S. Environmental Protection Agency. (2014). Cross-State Air Pollution Rule (CSAPR) Retrieved August 5, 2014 from http://www.epa.gov/airtransport/CSAPR/
U.S. Office of Management and Budget. (2014). Summary Tables. Retrieved August 16, 2014 from http://www.whitehouse.gov/sites/default/files/omb/budget/fy2015/assets/tables.pdf
De Vries, B. J., Van Vuuren, D. P., & Hoogwijk, M. M. (2007). Renewable energy sources: Their global potential for the first-half of the 21st century at a global level: An integrated approach. Energy policy, 35(4), 2590-2610.
Wei, M., Patadia, S., & Kammen, D. (2010). Putting renewables and energy efficiency to work: how many jobs can the clean energy industry generate in the US? Energy Policy, 38 (2), 919-931.
Wheeler, S. M. (2008). State and municipal climate change plans: The first generation. Journal of the American Planning Association, 74(4), 481-496.
Wiser, Ryan H., Bolinger, Mark. (2013). 2012 Wind Technologies Market Report, Edited by Galen L. Barbose, Naïm Darghouth, Ben Hoen, Andrew D. Mills, Samantha Weaver, Kevin Porter, Michael Buckley, Sari Fink, Frank Oteri and Suzanne Tegen.
Yi, H. (2013). Clean energy policies and green jobs: An evaluation of green jobs in US metropolitan areas. Energy Policy, 56, 644-652.

Preprint to be published: Edward P. Louie and Joshua M. Pearce. Retraining Investment for U.S. Transition from Coal to Solar Photovoltaic Employment. Energy Economics. (2016). doi:10.1016/j.eneco.2016.05.016
17
Appendix 1. Solar Photovoltaic Industry Employment in the U.S
Title Skill Level Education
Work Experience
Hourly Pay
Annual Pay
Component Production Quality Assurance Specialist Middle AA 3 to 5 $27.89 $58,020
Process Control Technician Middle AA 3 to 5 $27.89 $58,020
Industrial Engineer Advanced BA 5+ $36.11 $75,110
Environmental Engineer Advanced BA 5+ $37.04 $77,040
Mechanical Engineer Advanced BA 5+ $78,910
Electrical Engineer Advanced BA 5+ $32.58 $83,110 Computer Numerical Control (CNC) Operator Basic HS 1 to 3 $17.26 $35,890
Advanced Manufacturing Technician Basic HS + Certificate 1 to 3 $23.82 $49,550 Instrumentation and Electronics Technician Middle HS + Certificate 3 to 5 $26.36 $54,820
Materials Scientist Advanced MS/PhD 5+ $36.61 $80,300
Installation & Operations
Plumber with Solar Expertise Middle Apprentice-Level 3 to 5 $22.27 $46,320
Electrician with Solar Expertise Middle Apprentice-Level or HS + Certificate 5+ $21.98 $47,180
Solar PV Installer (residential/small commercial) Middle
HS or Apprentice-Level 3 to 5 $16.34 $33,980
Solar Installation Contractor Advanced Journey-Level 5+ $39.58 $82,330 Solar PV Technician (commercial/utility) Middle Journey-Level 3 to 5 $29.94 $62,270
Solar Installation Helper Basic None 1 to 3 $12.86 $26,760
Mechanical Assembler Basic None 1 to 3 $13.77 $28,640
Marketing Sales & Permitting
Solar Sales Representative (Retail) Middle AA 3 to 5 $23.76 $49,410
Solar Marketing Specialist Middle AA 1 to 3 $24.98 $51,960
Building Inspector with Solar Expertise Middle AA or Journey-Level 3 to 5 $24.77 $51,530
Solar Project Developer/Sales Representative (Wholesale) Advanced BA 5+ $34.30 $71,340
Solar Site Assessor Basic HS 1 to 3 $16.00 $33,280
Code Official with Solar Expertise Middle HS + Certificate 3 to 5 $26.11 $54,320
Lawyer with Solar Expertise Advanced J.D. 5+ $54.44 $113,240
Electrical Inspector with Solar Expertise Middle Journey-Level 3 to 5 $25.66 $53,372
Preprint to be published: Edward P. Louie and Joshua M. Pearce. Retraining Investment for U.S. Transition from Coal to Solar Photovoltaic Employment. Energy Economics. (2016). doi:10.1016/j.eneco.2016.05.016
18
System Design
Utility Interconnection Engineer Middle AA 5+ $35.95 $75,065
Residential PV System Designer Middle AA or Journey-Level 3 to 5 $26.36 $54,820
Structural Engineer Advanced BA 5+ $36.82 $76,590
Solar Utility Procurement Specialist Advanced BA 3 to 5 $38.94 $81,000
Power Systems Engineer Advanced BA 5+ $41.05 $85,370
Solar Energy Systems Designer Advanced BA 5+ $43.06 $89,560
Engineering Technician Middle HS + Certificate 3 to 5 $22.48 $46,760
Appendix 2. Solar Photovoltaic Industry Training Costs
Title Training Training Time
Cost Source Low
($) High ($)
Quality Assurance Specialist
Associate's Degree in Quality Assurance 2 Years $14,600 $18,060
Lorain County Community College; Columbus State Community College
ASQ Quality Inspector Certification Preparation + Certification 2 Months $576 $748
ASQ (American Society for Quality)
Total 2 Years 2
Months $15,176 $18,808
Process Control Technician Associate's Degree Process
Technology 2 Years $9,280 $34,000
Kanawha Valley Community and Technical College, WV; Jefferson Community & Technical College, KY
Industrial Engineer University Degree in
Industrial Engineering 4 Years $30,048 $128,000
West Virginia University; University of Louisville; Penn State
Environmental Engineer University Degree in Civil
and Environmental Engineering 4 Years $18,580 $136,000
University of Wyoming; West Virginia University; University of Illinois at Urbana-Champaign; Penn State
Mechanical Engineer
University Degree in Mechanical Engineering 4 Years $18,580 $136,000
University of Wyoming; West Virginia University; University of Kentucky; Penn State; University of Illinois at Urbana-Champaign
Electrical Engineer University Degree in
Electrical and Computer Engineering 4 Years $18,580 $136,000
University of Wyoming; West Virginia University; University of Kentucky; Penn State; University of Illinois at Urbana-Champaign

Preprint to be published: Edward P. Louie and Joshua M. Pearce. Retraining Investment for U.S. Transition from Coal to Solar Photovoltaic Employment. Energy Economics. (2016). doi:10.1016/j.eneco.2016.05.016
19
Computer Numerical
Control (CNC) Operator
Certificate in Machine Technology 1 Year $3,012 $6,996
Sheridan College Northern Wyoming; New River Community and Technical College West Virginia
Advanced Manufacturing
Technician
Associates or Certificate in Manufacturing Technology or Mechatronics
1 to 2 Years $2,448 $17,520
Casper College WY; West Virginia Northern Community College
Instrumentation and Electronics
Technician
Associates or Certificate in Manufacturing Technology or Mechatronics
1 to 2 Years $2,448 $17,520
Casper College WY; West Virginia Northern Community College
Materials Scientist
Undergraduate degree in material science engineering 4 Years $42,400 $136,000
University of Kentucky; Penn State; University of Illinois at Urbana-Champaign
MS or MEng in energy or semiconductor material science. 1 to 2
Years $7,956 $52,432
University of Wyoming; University of Virginia; University of Kentucky; Penn State; University of Illinois
Total 5 to 6 Years $50,356 $188,432
Plumber with Solar Expertise
SEI Residential and Commercial Photovoltaic Systems Certificate
3.2 Months $3,795 $3,795 Solar Energy International
Minimum Exam Prerequisite Experience: 3 PV Installs with a Decision Making Role
~3 Months
NABCEP PV Installation Professional Exam and Certification 3 Months $500 $500
North American Board of Certified Energy Practitioners (NABCEP)
Total 9 Months $4,295 $4,295
Electrician with Solar Expertise
SEI Residential and Commercial Photovoltaic Systems Certificate
3.2 Months $3,795 $3,795 Solar Energy International
Minimum Exam Prerequisite Experience: 3 PV Installs with a Decision Making Role
~3 Months
NABCEP PV Installation Professional Exam and Certification 3 Months $500 $500
North American Board of Certified Energy Practitioners (NABCEP)
Total 9 Months $4,295 $4,295
Solar PV Installer (residential/small
commercial)
SEI Residential and Commercial Photovoltaic Systems Certificate
3.2 Months $3,795 $3,795 Solar Energy International
Minimum Exam Prerequisite Experience: 3 PV Installs with a Decision Making Role
~3 Months

Preprint to be published: Edward P. Louie and Joshua M. Pearce. Retraining Investment for U.S. Transition from Coal to Solar Photovoltaic Employment. Energy Economics. (2016). doi:10.1016/j.eneco.2016.05.016
20
NABCEP PV Installation Professional Certification 3 Months $500 $500
North American Board of Certified Energy Practitioners (NABCEP)
Total 9 Months $4,295 $4,295
Solar Installation Contractor
IECRM Evening Trade School Classes while working as an Apprentice Electrician (8,000 hrs) 4 Years $4,688 $6,688
Independent Electrical Contractors Rocky Mountain (IECRM)
Apprentice + Journeyman Electrician License Registration & Exam Fees $230 $435
Wyoming State Fire Marshal; West Virginia Fire Commission
4 Years as a Journey Level Electrician (8,000 hrs) 4 Years
Master Electrician License Exam $75 $200
Wyoming State Fire Marshal; West Virginia Fire Commission
SEI Residential and Commercial Photovoltaic Systems Certificate
3.2 Months $3,795 $3,795 Solar Energy International
NABCEP PV Installation Professional Exam and Certification 3 Months $500 $500
North American Board of Certified Energy Practitioners (NABCEP)
Total 8 to 9 Years $9,288 $11,618
Solar PV Technician
(commercial/utility)
IECRM Evening Trade School Classes while working as an Apprentice Electrician (8,000 hrs) 4 Years $4,688 $6,688
Independent Electrical Contractors Rocky Mountain (IECRM)
Apprentice + Journeyman Electrician License Registration & Exam Fees $230 $435
Wyoming State Fire Marshal; West Virginia Fire Commission
SEI Residential and Commercial Photovoltaic Systems Certificate
3.2 Months $3,795 $3,795 Solar Energy International
NABCEP PV Installation Professional Exam and Certification 3 Months $500 $500
North American Board of Certified Energy Practitioners (NABCEP)
Total 4 to 5 years $9,213 $11,418
Solar Installation Helper
SEI Online Courses + NABCEP Entry Level Certification Package 3 months $1,295 $1,295 Solar Energy International
Mechanical Assembler
SEI Online Courses + NABCEP Entry Level Certification Package 3 months $1,295 $1,295 Solar Energy International
Solar Sales Representative
(Retail) Associates in Marketing 2 Years $4,800 $34,254
Western Wyoming Community College; Bluegrass Community and Technical College, KY; Bucks County Community College, PA
SEI Solar Business and Technical Sales Certificate
3.2 Months $3,095 $3,495 Solar Energy International

Preprint to be published: Edward P. Louie and Joshua M. Pearce. Retraining Investment for U.S. Transition from Coal to Solar Photovoltaic Employment. Energy Economics. (2016). doi:10.1016/j.eneco.2016.05.016
21
NABCEP Entry Level Certification 1 Week $120 $120
Solar Energy International; North American Board of Certified Energy Practitioners (NABCEP)
Minimum Exam Prerequisite Experience: 4/8 PV system sales 4 Months NABCEP NABCEP PV Technical Sales Certification 3 Months $500 $500
North American Board of Certified Energy Practitioners (NABCEP)
Total ~ 3
Years $8,515 $38,369
Solar Marketing Specialist
Associates in Marketing 2 Years $4,800 $34,254
Western Wyoming Community College; Bluegrass Community and Technical College, KY; Bucks County Community College, PA
SEI Solar Business and Technical Sales Certificate
3.2 Months $3,095 $3,495 Solar Energy International
NABCEP Entry Level Certification 1 Week $120 $120
Solar Energy International; North American Board of Certified Energy Practitioners (NABCEP)
Minimum Exam Prerequisite Experience: 4/8 PV system sales 4 Months NABCEP NABCEP PV Technical Sales Certification 3 Months $500 $500
North American Board of Certified Energy Practitioners (NABCEP)
Total ~ 3
Years $8,515 $38,369
Building Inspector with Solar Expertise
SEI Residential and Commercial Photovoltaic Systems Certificate
3.2 Months $3,795 $3,795 Solar Energy International
Minimum Exam Prerequisite Experience: 3 PV Installs with a Decision Making Role
~3 Months
NABCEP PV Installation Professional Exam and Certification 3 Months $500 $500
North American Board of Certified Energy Practitioners (NABCEP)
Total 9 Months $4,295 $4,295
Solar Project Developer/Sales Representative
(Wholesale)
University Degree in Electrical and Computer Engineering or Civil Engineering 4 Years $18,580 $136,000
University of Wyoming; West Virginia University; University of Kentucky; Penn State; University of Illinois at Urbana-Champaign
SEI Solar Business and Technical Sales Certificate
3.2 Months $3,095 $3,495 Solar Energy International
Preprint to be published: Edward P. Louie and Joshua M. Pearce. Retraining Investment for U.S. Transition from Coal to Solar Photovoltaic Employment. Energy Economics. (2016). doi:10.1016/j.eneco.2016.05.016
22
Minimum Exam Prerequisite Experience: 4 PV system sales 2 Months
NABCEP PV Technical Sales Certification 3 Months $500 $500
North American Board of Certified Energy Practitioners (NABCEP)
Total
4 Years & 9
Months $22,175 $139,995
Solar Site Assessor
3 months SEI Online Courses + NABCEP Entry Level Certification 3 Months $1,295 $1,295 Solar Energy International
Code Official with Solar Expertise
Associate in Building Inspection and Code Enforcement Technology 2 Years $9,996 $13,736
St. Louis Community College
ICC Code Inspector Certificates: Residential & Commercial Electrical Inspector
~3 Months $646 $646 International Code Council
SEI Online Courses + NABCEP Entry Level Certification Package 3 Months $1,295 $1,295 Solar Energy International
Total 2.5 Years $11,937 $15,677 Lawyer with Solar
Expertise Certificate in Energy Law 0.5 Year $23,055 $23,055 Vermont Law School
Electrical Inspector with Solar Expertise
SEI Residential and Commercial Photovoltaic Systems Certificate
3.2 Months $3,795 $3,795 Solar Energy International
Minimum Exam Prerequisite Experience: 3 PV Installs with a Decision Making Role
~3 Months
NABCEP PV Installation Professional Exam and Certification 3 Months $500 $500
North American Board of Certified Energy Practitioners (NABCEP)
Total 9 Months $4,295 $4,295
Utility Interconnection
Engineer
Associates in Electric Distribution Engineering Technology then transfer or University Degree in Electrical and Computer Engineering or Civil Engineering 4 Years $17,870 $136,000
Blue Ridge Community and Technical College; University of Wyoming; West Virginia University; University of Kentucky; Penn State; University of Illinois at Urbana-Champaign
Residential PV System Designer
Associates in Electrical Engineering/Technology 2 Years $6,096 $31,140
Southern West Virginia Community and Technical College; Bluegrass Community and Technical College, KY; Northampton Community College, PA
Preprint to be published: Edward P. Louie and Joshua M. Pearce. Retraining Investment for U.S. Transition from Coal to Solar Photovoltaic Employment. Energy Economics. (2016). doi:10.1016/j.eneco.2016.05.016
23
SEI Residential and Commercial Photovoltaic Systems Certificate
3.2 Months $3,795 $3,795 Solar Energy International
Minimum Exam Prerequisite Experience 3 PV Installs
NABCEP PV Installation Professional Certification 3 Months $500 $500
North American Board of Certified Energy Practitioners (NABCEP)
Total 2.5 Years $10,391 $35,435
Structural Engineer
University Degree in Civil Engineering with concentration in structures 4 Years $18,580 $136,000
University of Wyoming; West Virginia University; University of Kentucky; Penn State; University of Illinois at Urbana-Champaign
Master of Engineering Degree in Structural Engineer 1 Year $7,956 $33,386
University of Wyoming; West Virginia University; University of Kentucky; Penn State; University of Illinois at Urbana-Champaign
Total 5 Years $26,536 $169,386
Solar Utility Procurement
Specialist University Degree in Electrical and Computer Engineering 4 Years $18,580 $136,000
University of Wyoming; West Virginia University; University of Kentucky; Penn State; University of Illinois at Urbana-Champaign
Power Systems Engineer
University Degree in Electrical and Computer Engineering with concentrations in power engineering 4 Years $18,580 $136,000
University of Wyoming; West Virginia University; University of Kentucky; Penn State; University of Illinois at Urbana-Champaign
Solar Energy Systems Designer
University Degree in Electrical and Computer Engineering or Civil Engineering 4 Years $18,580 $136,000
University of Wyoming; West Virginia University; University of Kentucky; Penn State; University of Illinois at Urbana-Champaign
SEI Residential and Commercial Photovoltaic Systems Certificate
3.2 Months $3,795 $3,795 Solar Energy International
Minimum Exam Prerequisite Experience 3 PV Installs
~3 Months
NABCEP PV Installation Professional Certification 3 Months $500 $500
North American Board of Certified Energy Practitioners (NABCEP)
Total ~ 5
Years $22,875 $140,295

Preprint to be published: Edward P. Louie and Joshua M. Pearce. Retraining Investment for U.S. Transition from Coal to Solar Photovoltaic Employment. Energy Economics. (2016). doi:10.1016/j.eneco.2016.05.016
24
Engineering Technician
Certificate or Associate in Engineering Technology 1-2 Year $7,868 $32,697
Laramie County Community College; West Kentucky Community and Technical College; Butler County Community College
Appendix 3. Employment Transitions Between Coal Mining and Solar Photovoltaic Industries
Training
Occupation Title
Employees
Median hourly wage
Annual median wage
Closest PV Job Median hourly wage
Annual median wage
∆ Wage
%
Y
Mining and Geological Engineers, Including Mining Safety Engineers
810 $40.45 $84,136
Structural Engineer $36.82 $76,590 -9%
Y
Explosives Workers, Ordnance Handling Experts, and Blasters
360 $26.91 $55,973
Solar PV Technician (commercial/utility) $29.94 $62,270 11%
Y
Continuous Mining Machine Operators
4,880 $24.86 $51,709 Instrumentation and Electronics Technician $26.36 $54,820 6%
Y
Mine Cutting and Channeling Machine Operators
2,630 $26.07 $54,226 Advanced Manufacturing Technician $23.82 $49,550 -9%
Y
Mining Machine Operators, All Other
640 $25.90 $53,872 Advanced Manufacturing Technician $23.82 $49,550 -8%
Y Roof Bolters, Mining 5,620 $26.35 $54,808 Quality Assurance
Specialist $27.89 $58,020 6%
Y
Extraction Workers, All Other
1,300 $21.75 $45,240 Advanced Manufacturing Technician $23.82 $49,550 10%
Y
Conveyor Operators and Tenders
1,390 $25.75 $53,560 Instrumentation and Electronics Technician $26.36 $54,820 2%
Y
Excavating and Loading Machine and Dragline Operators
4,720 $22.22 $46,218 Advanced Manufacturing Technician $23.82 $49,550 7%
Y
Loading Machine Operators,
2,320 $24.85 $51,688 Advanced Manufacturing Technician $23.82 $49,550 -4%

Preprint to be published: Edward P. Louie and Joshua M. Pearce. Retraining Investment for U.S. Transition from Coal to Solar Photovoltaic Employment. Energy Economics. (2016). doi:10.1016/j.eneco.2016.05.016
25
Underground Mining
Y
Hoist and Winch Operators 80 $20.79 $43,243
Advanced Manufacturing Technician $23.82 $49,550 15%
Y Mine Shuttle Car Operators 2,600 $25.47 $52,978 Mechanical
Assembler $13.77 $28,640 -46%
N
Administrative Services Managers
100 $49.58 $103,126 Solar Marketing Specialist $24.98 $51,960 -50%
N
Financial Managers 70 $55.13 $114,670
Solar Project Developer/Sales Representative (Wholesale) $34.30 $71,340 -38%
N
Industrial Production Managers
290 $50.74 $105,539 Industrial Engineer $36.11 $75,110 -29%
N
Purchasing Managers 50 $43.21 $89,877
Solar Utility Procurement Specialist $38.94 $81,000 -10%
N Construction Managers 170 $48.33 $100,526 Solar Installation
Contractor $39.58 $82,330 -18%
N
Architectural and Engineering Managers
120 $57.77 $120,162 Solar Energy Systems Designer $43.06 $89,560 -25%
N
Managers, All Other 180 $49.79 $103,563
Solar Project Developer/Sales Representative (Wholesale) $34.30 $71,340 -31%
N
Chief Executives 50 $88.82 $184,746
Solar Project Developer/Sales Representative (Wholesale) $34.30 $71,340 -61%
N
General and Operations Managers
1,090 $52.97 $110,178
Solar Project Developer/Sales Representative (Wholesale) $34.30 $71,340 -35%
N
Purchasing Agents, Except Wholesale, Retail, and Farm Products
210 $28.15 $58,552 Solar Marketing Specialist $24.98 $51,960 -11%
N Compliance Officers 110 $29.73 $61,838 Code Official with
Solar Expertise $26.11 $54,320 -12%
N
Human Resources Specialists
140 $30.63 $63,710 Code Official with Solar Expertise $26.11 $54,320 -15%
N
Training and Development Specialists
70 $36.46 $75,837
Solar Project Developer/Sales Representative (Wholesale) $34.30 $71,340 -6%
N
Business Operations 40 $38.42 $79,914
Solar Utility Procurement Specialist $38.94 $81,000 1%
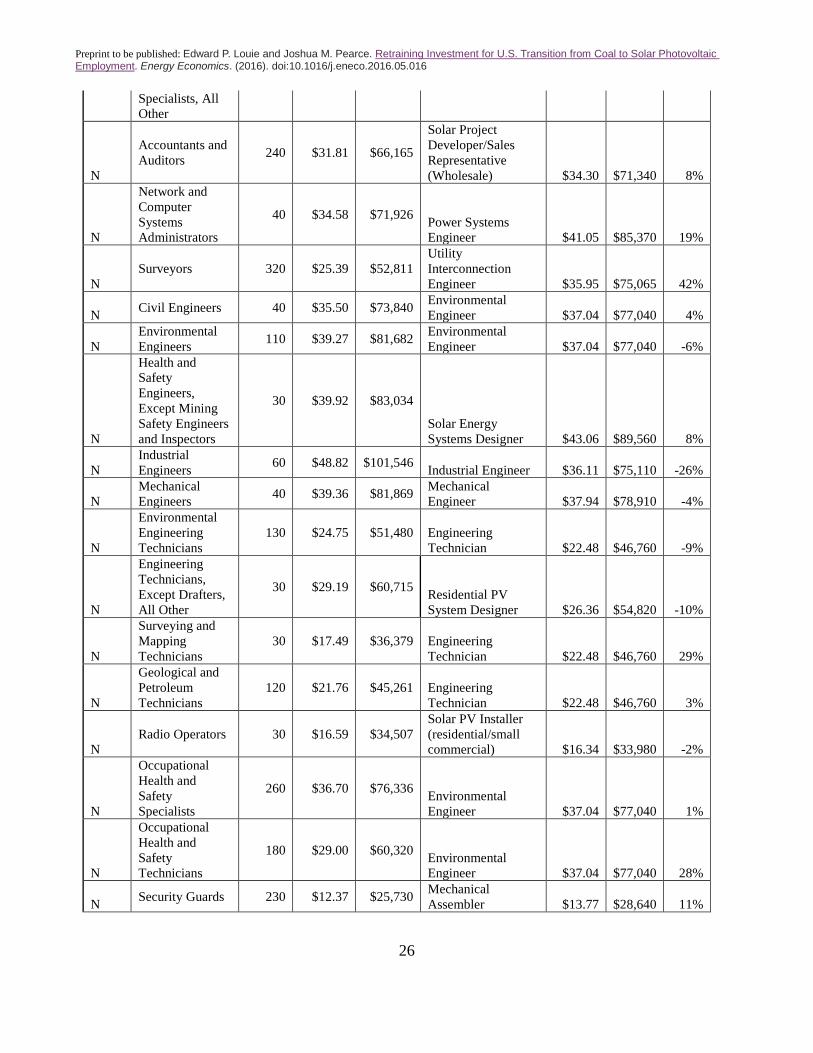
Preprint to be published: Edward P. Louie and Joshua M. Pearce. Retraining Investment for U.S. Transition from Coal to Solar Photovoltaic Employment. Energy Economics. (2016). doi:10.1016/j.eneco.2016.05.016
26
Specialists, All Other
N
Accountants and Auditors 240 $31.81 $66,165
Solar Project Developer/Sales Representative (Wholesale) $34.30 $71,340 8%
N
Network and Computer Systems Administrators
40 $34.58 $71,926 Power Systems Engineer $41.05 $85,370 19%
N Surveyors 320 $25.39 $52,811
Utility Interconnection Engineer $35.95 $75,065 42%
N Civil Engineers 40 $35.50 $73,840 Environmental Engineer $37.04 $77,040 4%
N Environmental Engineers 110 $39.27 $81,682 Environmental
Engineer $37.04 $77,040 -6%
N
Health and Safety Engineers, Except Mining Safety Engineers and Inspectors
30 $39.92 $83,034
Solar Energy Systems Designer $43.06 $89,560 8%
N Industrial Engineers 60 $48.82 $101,546 Industrial Engineer $36.11 $75,110 -26%
N Mechanical Engineers 40 $39.36 $81,869 Mechanical
Engineer $37.94 $78,910 -4%
N
Environmental Engineering Technicians
130 $24.75 $51,480 Engineering Technician $22.48 $46,760 -9%
N
Engineering Technicians, Except Drafters, All Other
30 $29.19 $60,715 Residential PV System Designer $26.36 $54,820 -10%
N
Surveying and Mapping Technicians
30 $17.49 $36,379 Engineering Technician $22.48 $46,760 29%
N
Geological and Petroleum Technicians
120 $21.76 $45,261 Engineering Technician $22.48 $46,760 3%
N Radio Operators 30 $16.59 $34,507
Solar PV Installer (residential/small commercial) $16.34 $33,980 -2%
N
Occupational Health and Safety Specialists
260 $36.70 $76,336 Environmental Engineer $37.04 $77,040 1%
N
Occupational Health and Safety Technicians
180 $29.00 $60,320 Environmental Engineer $37.04 $77,040 28%
N Security Guards 230 $12.37 $25,730 Mechanical Assembler $13.77 $28,640 11%
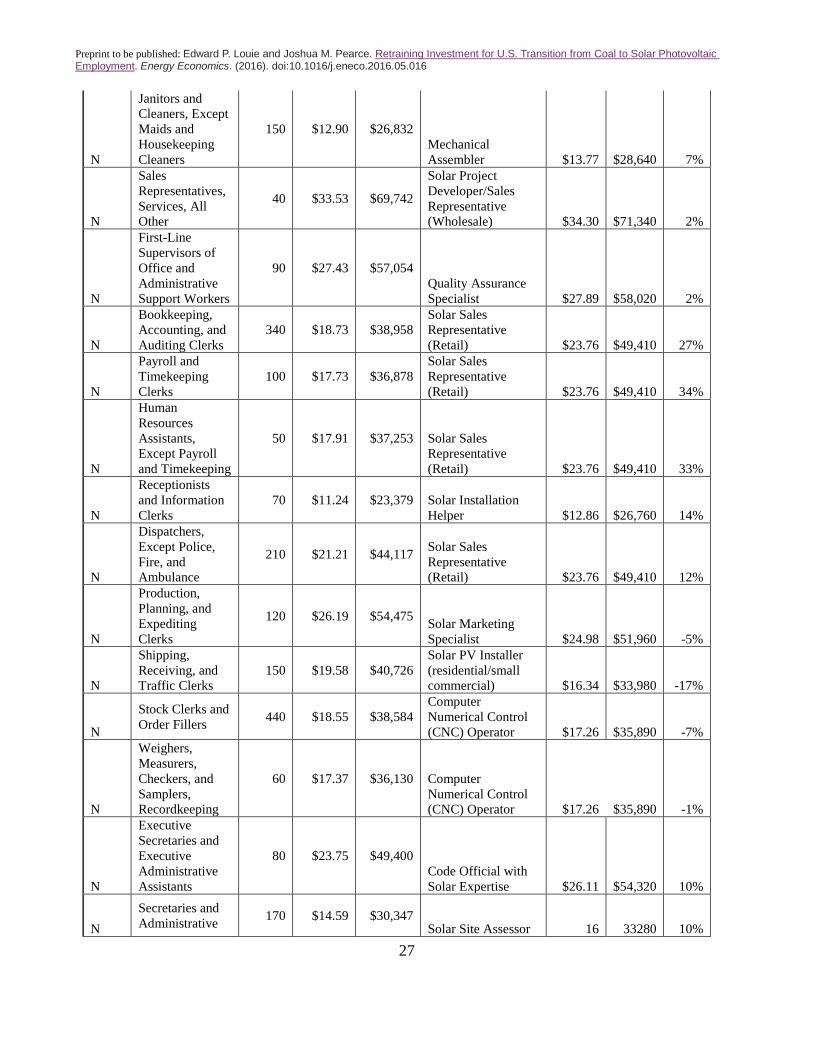
Preprint to be published: Edward P. Louie and Joshua M. Pearce. Retraining Investment for U.S. Transition from Coal to Solar Photovoltaic Employment. Energy Economics. (2016). doi:10.1016/j.eneco.2016.05.016
27
N
Janitors and Cleaners, Except Maids and Housekeeping Cleaners
150 $12.90 $26,832 Mechanical Assembler $13.77 $28,640 7%
N
Sales Representatives, Services, All Other
40 $33.53 $69,742
Solar Project Developer/Sales Representative (Wholesale) $34.30 $71,340 2%
N
First-Line Supervisors of Office and Administrative Support Workers
90 $27.43 $57,054 Quality Assurance Specialist $27.89 $58,020 2%
N
Bookkeeping, Accounting, and Auditing Clerks
340 $18.73 $38,958 Solar Sales Representative (Retail) $23.76 $49,410 27%
N
Payroll and Timekeeping Clerks
100 $17.73 $36,878 Solar Sales Representative (Retail) $23.76 $49,410 34%
N
Human Resources Assistants, Except Payroll and Timekeeping
50 $17.91 $37,253 Solar Sales Representative (Retail) $23.76 $49,410 33%
N
Receptionists and Information Clerks
70 $11.24 $23,379 Solar Installation Helper $12.86 $26,760 14%
N
Dispatchers, Except Police, Fire, and Ambulance
210 $21.21 $44,117 Solar Sales Representative (Retail) $23.76 $49,410 12%
N
Production, Planning, and Expediting Clerks
120 $26.19 $54,475 Solar Marketing Specialist $24.98 $51,960 -5%
N
Shipping, Receiving, and Traffic Clerks
150 $19.58 $40,726 Solar PV Installer (residential/small commercial) $16.34 $33,980 -17%
N
Stock Clerks and Order Fillers 440 $18.55 $38,584
Computer Numerical Control (CNC) Operator $17.26 $35,890 -7%
N
Weighers, Measurers, Checkers, and Samplers, Recordkeeping
60 $17.37 $36,130 Computer Numerical Control (CNC) Operator $17.26 $35,890 -1%
N
Executive Secretaries and Executive Administrative Assistants
80 $23.75 $49,400 Code Official with Solar Expertise $26.11 $54,320 10%
N Secretaries and Administrative 170 $14.59 $30,347
Solar Site Assessor 16 33280 10%
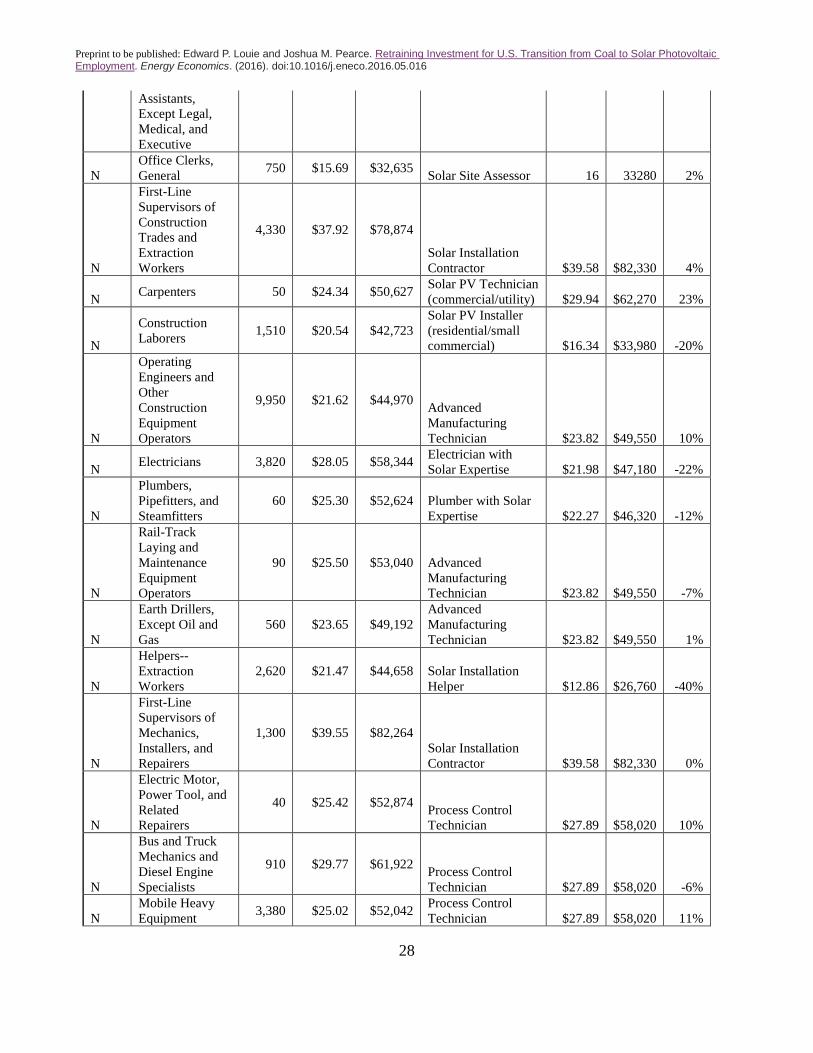
Preprint to be published: Edward P. Louie and Joshua M. Pearce. Retraining Investment for U.S. Transition from Coal to Solar Photovoltaic Employment. Energy Economics. (2016). doi:10.1016/j.eneco.2016.05.016
28
Assistants, Except Legal, Medical, and Executive
N Office Clerks, General 750 $15.69 $32,635 Solar Site Assessor 16 33280 2%
N
First-Line Supervisors of Construction Trades and Extraction Workers
4,330 $37.92 $78,874
Solar Installation Contractor $39.58 $82,330 4%
N Carpenters 50 $24.34 $50,627 Solar PV Technician (commercial/utility) $29.94 $62,270 23%
N
Construction Laborers 1,510 $20.54 $42,723
Solar PV Installer (residential/small commercial) $16.34 $33,980 -20%
N
Operating Engineers and Other Construction Equipment Operators
9,950 $21.62 $44,970 Advanced Manufacturing Technician $23.82 $49,550 10%
N Electricians 3,820 $28.05 $58,344 Electrician with Solar Expertise $21.98 $47,180 -22%
N
Plumbers, Pipefitters, and Steamfitters
60 $25.30 $52,624 Plumber with Solar Expertise $22.27 $46,320 -12%
N
Rail-Track Laying and Maintenance Equipment Operators
90 $25.50 $53,040 Advanced Manufacturing Technician $23.82 $49,550 -7%
N
Earth Drillers, Except Oil and Gas
560 $23.65 $49,192 Advanced Manufacturing Technician $23.82 $49,550 1%
N
Helpers--Extraction Workers
2,620 $21.47 $44,658 Solar Installation Helper $12.86 $26,760 -40%
N
First-Line Supervisors of Mechanics, Installers, and Repairers
1,300 $39.55 $82,264 Solar Installation Contractor $39.58 $82,330 0%
N
Electric Motor, Power Tool, and Related Repairers
40 $25.42 $52,874 Process Control Technician $27.89 $58,020 10%
N
Bus and Truck Mechanics and Diesel Engine Specialists
910 $29.77 $61,922 Process Control Technician $27.89 $58,020 -6%
N Mobile Heavy Equipment 3,380 $25.02 $52,042 Process Control
Technician $27.89 $58,020 11%

Preprint to be published: Edward P. Louie and Joshua M. Pearce. Retraining Investment for U.S. Transition from Coal to Solar Photovoltaic Employment. Energy Economics. (2016). doi:10.1016/j.eneco.2016.05.016
29
Mechanics, Except Engines
N Tire Repairers and Changers 70 $13.85 $28,808 Mechanical
Assembler $13.77 $28,640 -1%
N
Industrial Machinery Mechanics
1,580 $25.32 $52,666 Process Control Technician $27.89 $58,020 10%
N
Maintenance Workers, Machinery
1,180 $23.20 $48,256 Advanced Manufacturing Technician $23.82 $49,550 3%
N Millwrights 140 $31.70 $65,936 Solar PV Technician (commercial/utility) $29.94 $62,270 -6%
N
Maintenance and Repair Workers, General
2,110 $20.28 $42,182 Solar PV Installer (residential/small commercial) $16.34 $33,980 -19%
N
Helpers--Installation, Maintenance, and Repair Workers
230 $18.52 $38,522 Computer Numerical Control (CNC) Operator $17.26 $35,890 -7%
N
First-Line Supervisors of Production and Operating Workers
770 $36.27 $75,442 Solar Installation Contractor $39.58 $82,330 9%
N Machinists 40 $26.79 $55,723 Process Control Technician $27.89 $58,020 4%
N
Welders, Cutters, Solderers, and Brazers
970 $25.29 $52,603 Instrumentation and Electronics Technician $26.36 $54,820 4%
N
Plant and System Operators, All Other
150 $21.46 $44,637 Solar PV Technician (commercial/utility) $29.94 $62,270 40%
N
Separating, Filtering, Clarifying, Precipitating, and Still Machine Setters, Operators, and Tenders
190 $22.48 $46,758
Solar PV Installer (residential/small commercial) $16.34 $33,980 -27%
N
Crushing, Grinding, and Polishing Machine Setters, Operators, and Tenders
380 $21.48 $44,678 Solar PV Installer (residential/small commercial) $16.34 $33,980 -24%
N
Inspectors, Testers, Sorters, Samplers, and Weighers
280 $21.89 $45,531 Quality Assurance Specialist $27.89 $58,020 27%
N
Cleaning, Washing, and Metal Pickling
40 $19.78 $41,142 Solar PV Installer (residential/small commercial) $16.34 $33,980 -17%

Preprint to be published: Edward P. Louie and Joshua M. Pearce. Retraining Investment for U.S. Transition from Coal to Solar Photovoltaic Employment. Energy Economics. (2016). doi:10.1016/j.eneco.2016.05.016
30
Equipment Operators and Tenders
N
Helpers--Production Workers
730 $24.74 $51,459 Solar PV Installer (residential/small commercial) $16.34 $33,980 -34%
N
Production Workers, All Other
70 $25.32 $52,666 Solar PV Installer (residential/small commercial) $16.34 $33,980 -35%
N
First-Line Supervisors of Helpers, Laborers, and Material Movers, Hand
350 $27.02 $56,202
Solar PV Technician (commercial/utility) $29.94 $62,270 11%
N
First-Line Supervisors of Transportation and Material-Moving Machine and Vehicle Operators
560 $34.57 $71,906
Solar PV Technician (commercial/utility) $29.94 $62,270 -13%
N
Bus Drivers, Transit and Intercity
100 $16.92 $35,194 Computer Numerical Control (CNC) Operator $17.26 $35,890 2%
N
Heavy and Tractor-Trailer Truck Drivers
3,180 $20.73 $43,118 Solar PV Installer (residential/small commercial) $16.34 $33,980 -21%
N
Light Truck or Delivery Services Drivers
90 $9.24 $19,219 Mechanical Assembler $13.77 $28,640 49%
N
Rail Yard Engineers, Dinkey Operators, and Hostlers
150 $24.97 $51,938 Solar PV Installer (residential/small commercial) $16.34 $33,980 -35%
N
Industrial Truck and Tractor Operators
800 $19.75 $41,080 Computer Numerical Control (CNC) Operator $17.26 $35,890 -13%
N
Cleaners of Vehicles and Equipment
90 $14.52 $30,202 Computer Numerical Control (CNC) Operator $17.26 $35,890 19%
N
Laborers and Freight, Stock, and Material Movers, Hand
1,130 $18.70 $38,896 Solar PV Installer (residential/small commercial) $16.34 $33,980 -13%
N
Pump Operators, Except Wellhead Pumpers
120 $22.59 $46,987 Solar PV Installer (residential/small commercial) $16.34 $33,980 -28%
N
Tank Car, Truck, and Ship Loaders 100 $22.60 $47,008
Solar PV Installer (residential/small commercial) $16.34 $33,980 -28%

Preprint to be published: Edward P. Louie and Joshua M. Pearce. Retraining Investment for U.S. Transition from Coal to Solar Photovoltaic Employment. Energy Economics. (2016). doi:10.1016/j.eneco.2016.05.016
31
Appendix 4. Employment Transitions Between Coal-Fired Power Plant and Solar
Photovoltaic Industries
Training Occupation Title Empl
oyees
Median hourly wage
Annual median wage
Closest PV Job Median hourly wage
Annual median wage
∆ Wage
%
N
Power Distributors, Dispatchers, Systems/Network Operators
2410 $37.01 $76,981 Utility Interconnection Engineer $35.95 $75,065 -3%
N Power Plant Operator 11181 $32.74 $68,099 Power Systems
Engineer $41.05 $85,370 25%
N
Electrical and Electronics Repairers, Powerhouse, Substation, and Relay 5936
$33.33 $69,326
Power Systems Engineer $41.05 $85,370 23%
N Electrical Engineers 6533 $42.26 $87,901 Electrical Engineer $32.58 $83,110 -23%
Y Coal-Fired Power Plant Others 34481 $28.85 $60,000 Solar PV Technician
(commercial/utility) $29.94 $62,270 4%